Article

Finding Oasis Cold Island Footprints Based on a Logistic Model—A Case Study in the Ejina Oasis

1
Key Laboratory of Ecological Safety and Sustainable Development in Arid Lands, Northwest Institute of Eco-Environment and Resources, Chinese Academy of Sciences, Lanzhou 730000, China
2
University of Chinese Academy of Sciences, Beijing 100049, China
*
Author to whom correspondence should be addressed.
Remote Sens. 2024, 16(16), 2895; https://doi.org/10.3390/rs16162895
Submission received: 29 June 2024 / Revised: 5 August 2024 / Accepted: 6 August 2024 / Published: 8 August 2024

Abstract

:
Oases play a crucial role in arid regions within the human–environmental system, holding significant ecological and biological importance. The Oasis Cold Island Effect (OCIE) represents a distinct climatic feature of oases and serves as a vital metric for assessing oasis ecosystems. Previous studies have overlooked the spatial extent of the Oasis Cold Island Effect (OCIE), specifically the boundary delineating areas influenced and unaffected by oases. This boundary is defined as the Oasis Cold Island Footprint (OCI FP). Utilizing Logistic modeling and MODIS data products, OCI FPs were calculated for the Ejina Oasis from 2000 to 2019. The assessment results underscore the accuracy and feasibility of the methodology, indicating its potential applicability to other oases. Spatial and temporal distributions of OCI FPs and the intensity of the Oasis Cold Island Effect Intensity (OCIEI) in the Ejina Oasis were analyzed, yielding the following findings: (1) OCI FP area and complexity were smallest in summer and largest in autumn. (2) Over the period 2000–2019, OCI FPs exhibited a pattern of increase, decrease, and subsequent increase. (3) OCIEI peaks in summer and reaches its lowest point in winter. Lastly, the study addresses current limitations and outlines future research objectives.

1. Introduction

Arid and semi-arid regions currently cover approximately 41% of the global land area and are projected to increase to 50% by the end of the century [1]. Oases are unique geographical features within arid regions and play crucial roles as centers for human economic and social activities in these areas [2]. For instance, in China, although oases constitute less than 5% of the total area of arid regions, they accommodate over 95% of the population within these zones [3,4,5]. Oases act as localized cool spots within arid zones, and their microclimatic characteristics exert long-lasting effects on the inhabitants of these areas [6,7].
The unique microclimate characteristics exhibited by oasis ecosystems in response to the harsh conditions of arid climates are collectively referred to as the Oasis Effect (OE) [8]. The exchange of materials and energy between oases and deserts enables humid and relatively cooler air from oases to penetrate deserts, bringing water vapor that supports vegetation growth in these otherwise barren areas. Simultaneously, warm and dry air from the desert rises and enters the airspace above oases, creating a locally stable climate [5]. The Cold Island Effect (OCI) is a significant component of OE, characterized by the phenomenon where the land surface temperature (LST) of the oasis is lower than that of the surrounding desert environment, due to differences in subsurface properties [9,10,11]. The Oasis Cold Island Effect (OCIE) serves as a critical indicator for assessing the ecological environment of oases, playing a pivotal role in the protection of oasis ecology and the advancement of economic and social development [12,13,14]. This significance led to widespread global interest by the late 1980s.
Currently, three main methods are employed to study OCIE of oases in arid zones. The first method is the mathematical approach based on station observations. For instance, Su et al. conducted comparative observations of temperature, humidity, and wind speed in the farmland and Gobi Desert at the southwestern edge of Zhangye City, concluding that the oasis exhibits OCI [11]. Similarly, Du et al. quantitatively analyzed the cold and wet island effects of the oasis in Xinjiang using data from automatic weather stations [15]. Scholars have also studied oases in Egypt, Israel, Syria, and Oman using station observations [16,17,18,19,20].
The second method involves inverting surface temperature using thermal infrared data acquired by Landsat or MODIS satellites to determine the thermal environment of oasis regions. This approach allows researchers to explore the spatial and temporal patterns, influencing factors, and effects of OCIE. For example, Hao et al. analyzed the temporal and spatial variations and influencing factors of the oasis cold island effect intensity (OCIEI) at the edge of the Tarim Basin using MODIS thermal infrared data [14]. Similarly, Pan et al. quantitatively analyzed the temporal variations of the cold island effect in the Zhangye oasis utilizing the oasis cold-island ratio index (OCRI) [21]. Compared to the first method, this approach overcomes the limitations of insufficient spatial representativeness and coverage of observation stations, making it widely used in the study of the oasis cold island effect [12,13,22,23,24].
The third method is numerical simulation, which uses global or regional numerical models to analyze the boundary layer characteristics and influencing factors of the oasis cold island effect. For example, Lv et al. employed a two-dimensional, high-resolution boundary layer numerical model to study the impact of the oasis and subsurface on the atmosphere. Their results confirmed the existence of the OCIE and analyzed the vertical characteristics of air temperature over the oasis [25]. Similarly, Wen et al. utilized a mesoscale numerical model, MM5, to examine the influence of the ambient wind field on the OCIE, concluding that lower wind speeds enhance the cold island effect [26]. Numerical models apply the laws of physics to meteorological simulations, providing new methods and insights for studying OCIE.
However, the aforementioned studies overlook the spatial extent of OCIE, specifically the boundary between the area influenced by the OCIE and the area not affected by it. This boundary is defined as the Oasis Cold Island Footprint (OCI FP). Neglecting this aspect can lead to misinterpretation of the background temperature, thereby affecting the comprehensive understanding of OCIE.
OCI FP, similar to the Surface Urban Heat Island Footprint (SUHI FP) [27,28,29], serves as a metric to quantitatively analyze and visualize the spatial extent of OCIE. This concept allows researchers to study the area that is influenced by the OCI in a more systematic and measurable way [30]. Much like the SUHI FP, which delineates the spatial boundaries affected by urban heat islands, the OCI FP provides a means to understand the geographic reach and intensity of the OCI. It enables researchers to quantify how far the cooling effect of oases extends into the surrounding desert environment, offering insights into the OCI’s impact on local climate dynamics and ecological systems. By utilizing metrics such as the OCI FP, scientists can more effectively study and compare different oases, assess changes over time, and explore the factors contributing to variations in OCI intensity and extent. This approach enhances our ability to comprehensively analyze the role of oases in regional climate regulation and their broader environmental implications.
The surface temperature change from the interior of an oasis to the surrounding desert can indeed be characterized by a distinct pattern. This pattern typically involves several stages: (1) Slow rise: Near the oasis, where the influence of oasis cooling is most pronounced, the surface temperature starts to increase gradually as one moves away from the cooler oasis interior. (2) Rapid rise: As one moves further away from the oasis, the surface temperature increase accelerates due to reduced influence from oasis cooling effects. (3) Rise with decreasing rate: Beyond a certain distance, the rate of temperature increase begins to slow down as the oasis’s influence diminishes. (4) Relative stabilization: Eventually, the surface temperature stabilizes at a level influenced predominantly by the surrounding desert environment, with minimal impact from the oasis. This pattern of temperature change can be effectively modeled using logistic regression, a type of growth curve model. Logistic models are well-suited for describing changes over a bounded domain, making them suitable for studying how the Oasis Cold Island Effect (OCIE) influences surface temperatures across its spatial extent. Similar methodologies have been successfully applied in studies of the Surface Urban Heat Island Footprint (SUHI FP), where logistic models have been used to fit temperature changes in urban and rural areas [28,29]. By applying this approach to OCIE research, scientists can quantitatively describe and understand the spatial extent and intensity of oasis cold islands, providing valuable insights into their thermal dynamics and environmental impact.
Here, the Ejina Oasis is used as an example to calculate its OCI FPs based on a logistic model and to assess the applicability of this method. Additionally, this paper analyzes the spatial and temporal distribution patterns and evolution of OCI FPs and OCIEI. It preliminarily explores the influence of subsurface types on OCI FPs and proposes future research directions.

2. Methods and Case Study
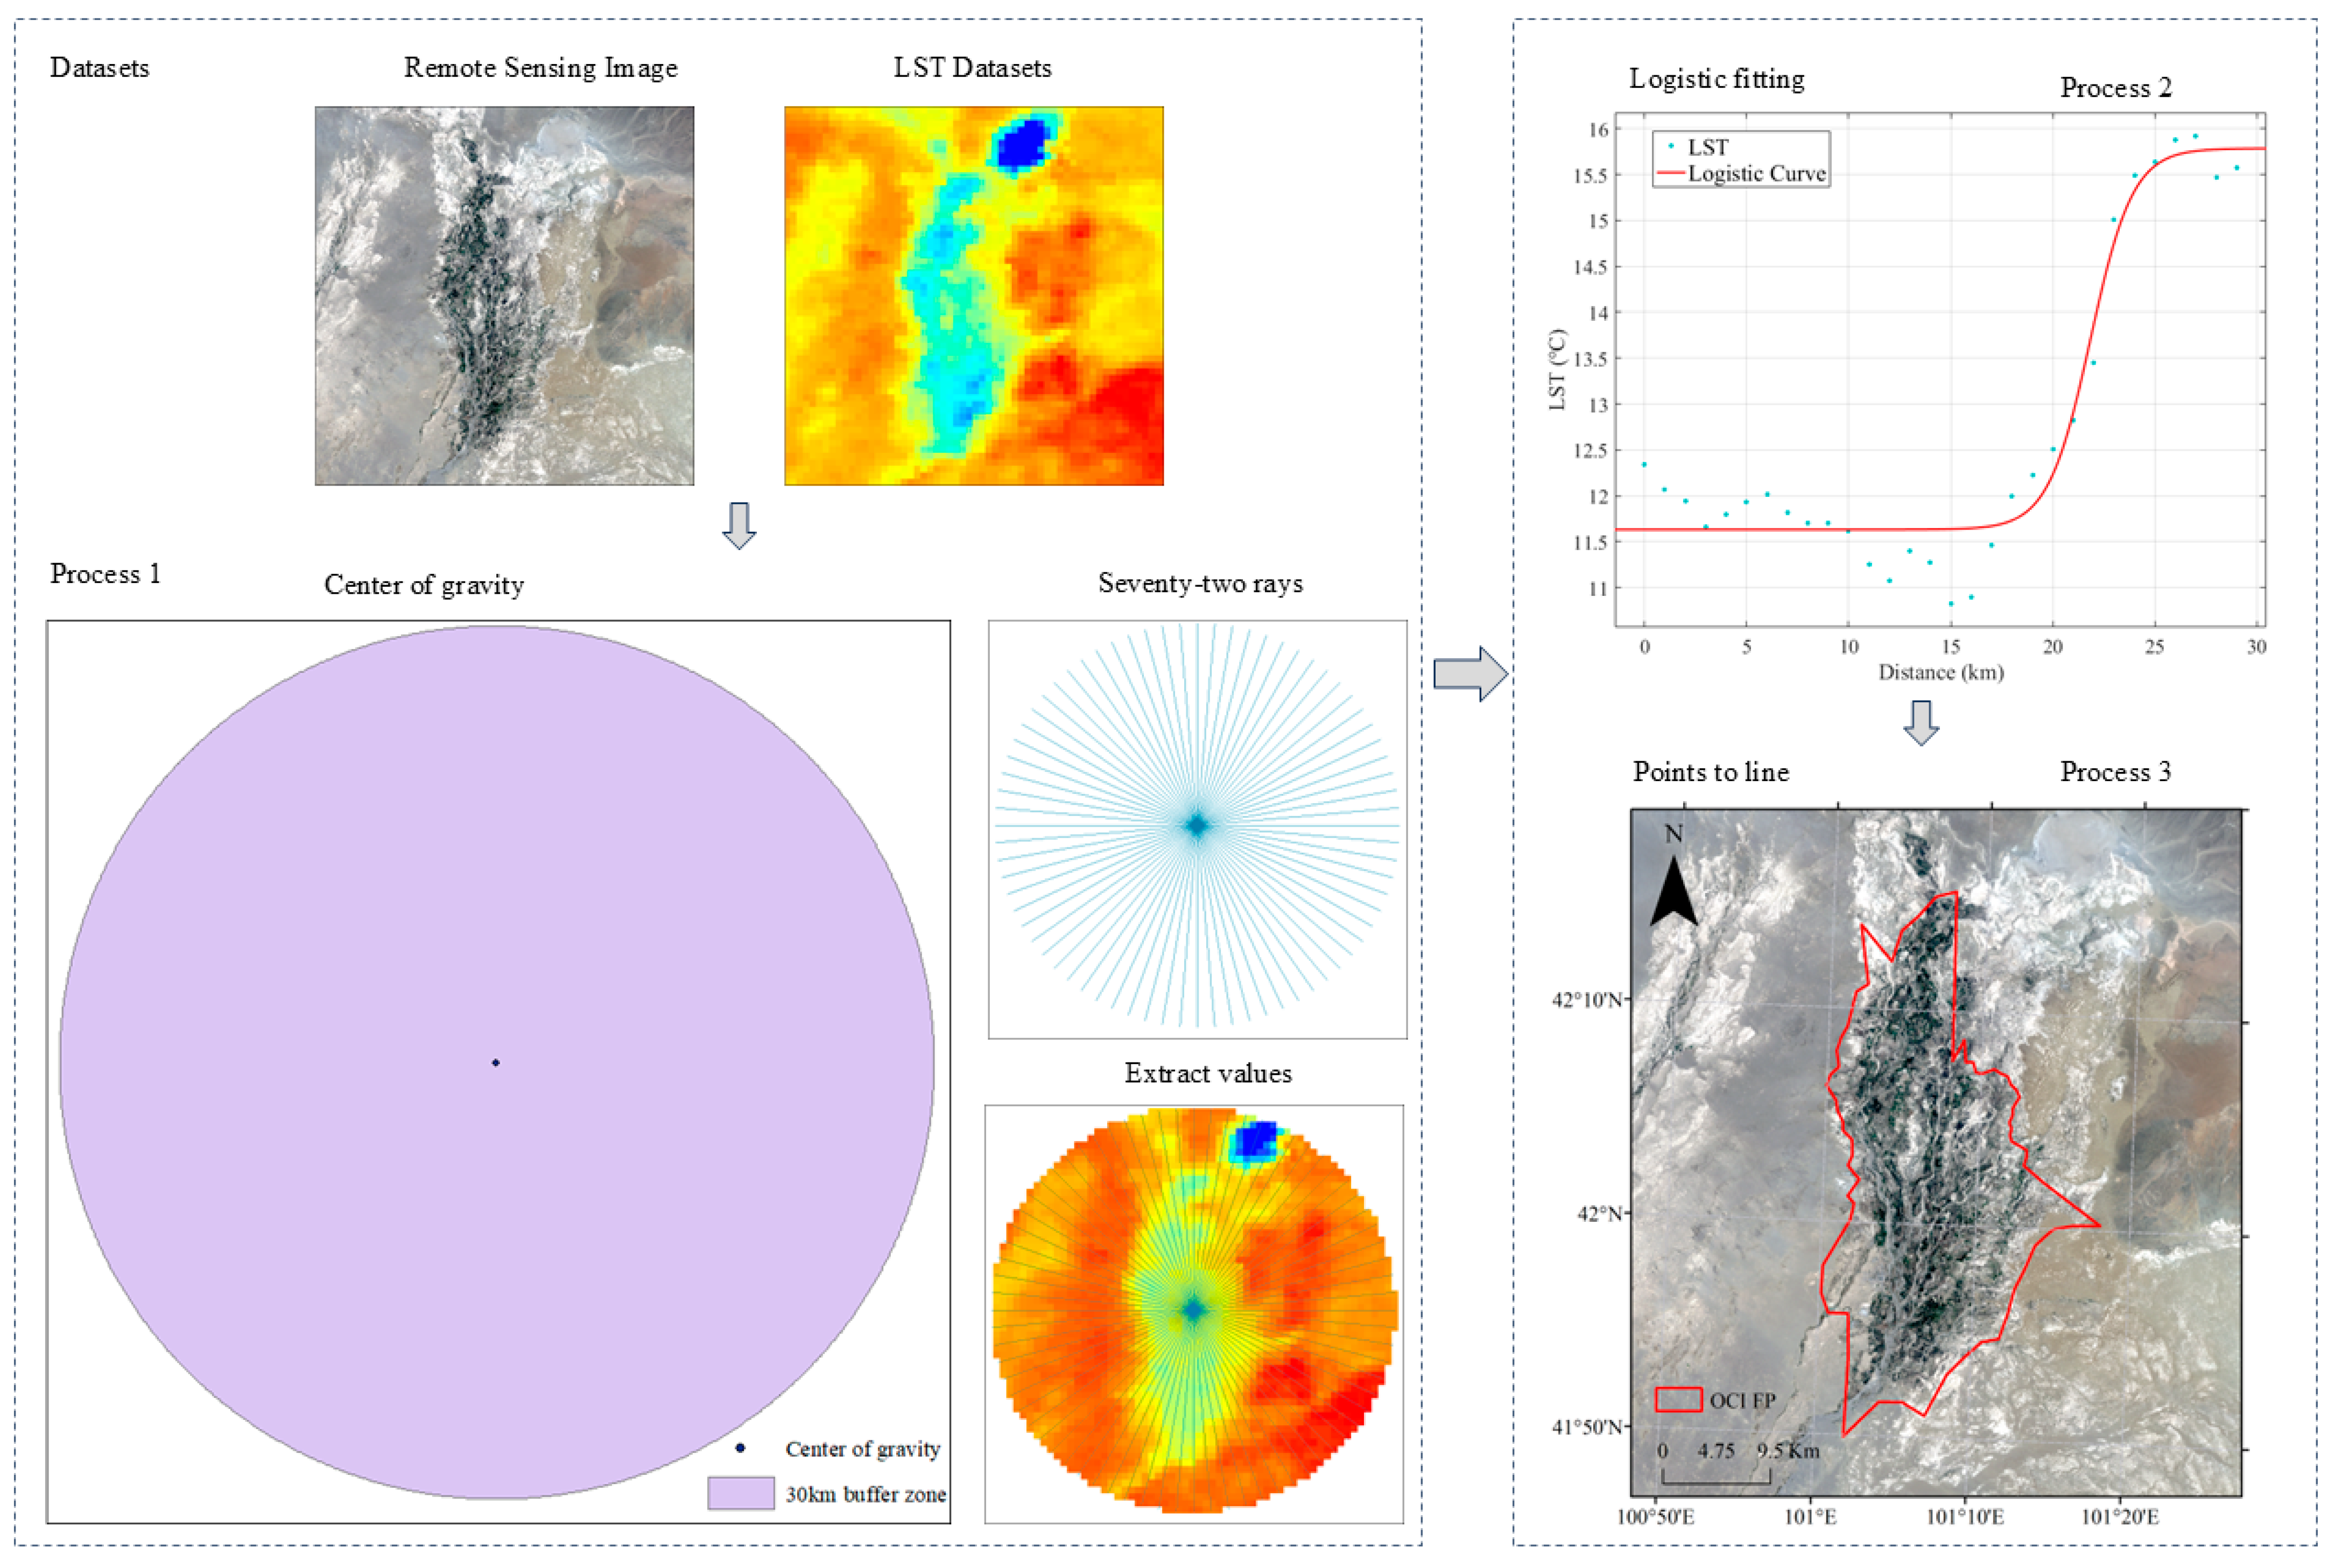
2.1. Methods

The specific steps for identifying OCI FP using the logistic model are as follows (See Figure 1):

2.1.1. Logistic Model

Logistic curves, also known as pearl curves, are the most common and widely used of the nonlinear growth curve models. This curve model can describe the growth and change process of things in four stages, such as occurrence, development, maturity, and limit. It was first applied to biological reproduction, population development statistics, and product life cycle analysis [31], and then gradually and widely used in many disciplines such as artificial neural networks, chemistry, ecology, and Earth sciences [32].
The differential form of the logistic curve equation [31] is:
d y d t = k y ( L y )
Integrating Equation (1) after separating the variables yields:
ln y L y = k L t + c L
Let k L = b and c L = a , then the Equation (2) reduce to:
ln y L y = a + b t
Let e a = a , Equation (3) leads to Equation (4), which is the integral form of the logistic curve equation:
y = L 1 + a e b t
where e is the natural logarithmic base, L , a and b are parameters to be determined with a > 0 and b > 0 , a is a regulation parameter, b represents the curve logistic growth rate, and L represents the limit state value.

2.1.2. Oasis Cold Island Footprint

From the center of the oasis to the surrounding desert, the change in LST shows two distinct inflection points corresponding to those of the fitted curve. Near the first inflection point, LST transitions from a relatively stable state to an ascending state. Near the second inflection point, LST transitions from an ascending state to a relatively stable state. Multiple rays are emitted from the center of the oasis in all directions, and a logistic model is used to fit the change in LST along each ray. The second inflection point of each ray is connected to form a closed polygonal region, representing OCI FP (Figure 2). OCI FP includes not only the oases but also the surrounding desert areas.
With reference to SHUI FP calculation [28,29], the actual logistic curve equation used in OCI FP is:
f ( r ) = c 1 + e a + b r + d
where f ( r ) is the fitted surface temperature (°C), r is the distance, and a , b , c , d are the parameters.
The inflection point of the curve is determined by finding the extreme value of the second derivative of the fitted function (Figure 1). The second derivative of the logistic curve is:
K = 2 b 2 c e 2 a + 2 b r 1 + e a + b r 3 b 2 e a + b r 1 + e a + b r 2
where a , b , c , and r are as Equation (5).
The inflection point of each curve can be found by substituting the parameters of the fitted curve.
To ensure that the fitting results are confident, we use the Coefficient of Determination (R2) and the Root Mean Square Error (RMSE) to evaluate the fitting effect. Closer the R2 is to 1 and closer the RMSE is to 0, the better the fit is.
The formula for R2 is:
R 2 = 1 i = 1 n ( y i y i ^ ) 2 i = 1 n ( y i y i ¯ ) 2
The formula for RMSE is:
R M S E = i = 1 n ( y i y i ^ ) 2 n
where n is sample size, y i is real value, y i ^ is predicted value, and y i ¯ is the mean value of real value.

2.1.3. Spatiotemporal Evolution Analysis of SUHI FPs

The Fractal Dimensionality Index (FRAC) is utilized to investigate the shape complexity of the OCI FP.
F R A C = 2 ln ( 0.25 p i j ) ln a i j
where p i j represents the perimeter (km) of patch ij and a ij is the area (km2) of patch ij . FRAC varies between 1 and 2. FRAC tends towards 1 for shapes with straightforward perimeters like squares, and towards 2 for shapes that are intricately convoluted.
In addition, the OCI FP expansion intensity index (FEII) is calculated to describe the rate and intensity of OCI FP expansion.
F E I I = ( F t + 1 F t ) F t × 1 i × 100
where FEII is the intensity of OCI FP expansion for time span t and t + i years. Ft+i and Ft represent the OCI FP area (km2) at moments t + i and t, respectively, and i is the length of the study period. The larger the FEII value is, the faster the OCI FP expansion rate.

2.1.4. Oasis Cold Island Effect Intensity

OCIEI is typically expressed as the difference in surface temperature between an oasis and the surrounding desert areas [14,30,33]:
O C I E I = L S T oasis L S T u n u s e d _ l a n d
where L S T oasis is the mean LST of the oasis, while L S T unused _ l a n d is the mean LST of the surrounding desert.
Equation (11) was enhanced by incorporating the OCI FP. The study area was divided into oasis-influenced and non-oasis-influenced regions based on the OCI FP. The difference in mean LST between these regions was defined as OCIEI.
O C I E I = L S T F P E L S T F P I
where L S T F P E is the mean LST of the external sections of OCI FP, while L S T F P I is the mean LST of the internal sections.

2.2. Case Study

The Ejina Oasis in northwestern China was selected as the study area (Figure 3). The reasons for choosing this oasis are: (1) this oasis is an independent oasis, which is far away from other oases and will not affect each other. (2) The oasis has little topographic relief (from 910 m to 940 m), which excludes the influence of elevation on surface temperature. (3) There is no desert or large water body in the oasis, so the LST in a certain direction can be extracted without being affected by the desert or the water body.

2.2.1. Data Source

Both Landsat TIR data and MODIS TIR data can be used to retrieve surface temperature, but each has its own strengths and weaknesses. Landsat data offer high spatial resolution but low temporal resolution, whereas MODIS provides lower spatial resolution but higher temporal resolution. Considering the experimental requirements, MODIS series data were selected as the focus of the experiment.
The surface temperature data used by the study is the Daily 1-km all-weather land surface temperature dataset for Western China (TRIMS LST-TP; 2000–2022) V2 (https://data.tpdc.ac.cn/, accessed on 22 May 2024) produced by Zhou et al. [34]. The dataset was prepared using a new preparation method, the satellite thermal infrared remote sensing-reanalysis data integration method based on a novel surface temperature time-decomposition model. The main input data of the method are data such as Aqua MODIS LST products and GLDAS, and the auxiliary data include vegetation index and surface albedo provided by satellite remote sensing. The method fully utilizes the high-frequency component of surface temperature, the low-frequency component, and the spatial correlation of surface temperature provided by satellite thermal infrared remote sensing and reanalysis data [35,36,37,38]. The new method avoids errors caused by gaps in PMW data strips, thereby achieving higher accuracy and applicability compared to the previous approach of integrating satellite thermal infrared (TIR) and passive microwave (PMW) for all-weather surface temperature datasets. The evaluation results show that this dataset has good image quality and accuracy and can be used in the study of finding OCI FP based on logistic modeling.
The land use data used in this study are the China Multi-Period Land Use Remote Sensing Monitoring Dataset (CNLUCC) (https://www.resdc.cn/, accessed on 22 May 2024) produced by Xu et al. with a spatial resolution of 30 m. These data are widely used in various studies related to land use types.
Before using the above data, the data need to be transformed to the same projected coordinate system. The projected coordinate system used in this study is WGS 1984 UTM Zone 47N.

2.2.2. Experimental Designs

The data selected for the experiment spanned the period from 2000 to 2019, with a temporal resolution of days and a spatial resolution of 1 km. The satellite transit time was approximately 01:30 and 13:30 BST.
The data needs to be collated before use. The daily data for each five-year period were compiled into annual and quarterly averages to better reflect their spatial and temporal characteristics. The sample size per season is 900 around, while per year is 3700 around.
Referring to the satellite image (2000.08.02, Landsat 5) of the Ejina Oasis (Figure 1), its boundary is delineated, and its geometric center is determined. It is important to note that this boundary solely represents the geometric center of the oasis and does not reflect its actual perimeter.
Rays are projected from the center in all directions with a spacing of 5°. The lengths of these rays were 30 km, which are determined through extensive experimentation, based on two main principles: (1) ensuring coverage of the entire oasis, and (2) avoiding interference from other heat or cold sources. LST was sampled at 1 km intervals along each ray, and any anomalous data were excluded as necessary.
Logistic models were used to analyze the LST change curves in each direction and determine their inflection points. The second inflection point in each direction was then connected to form the OCI FP.

3. Results

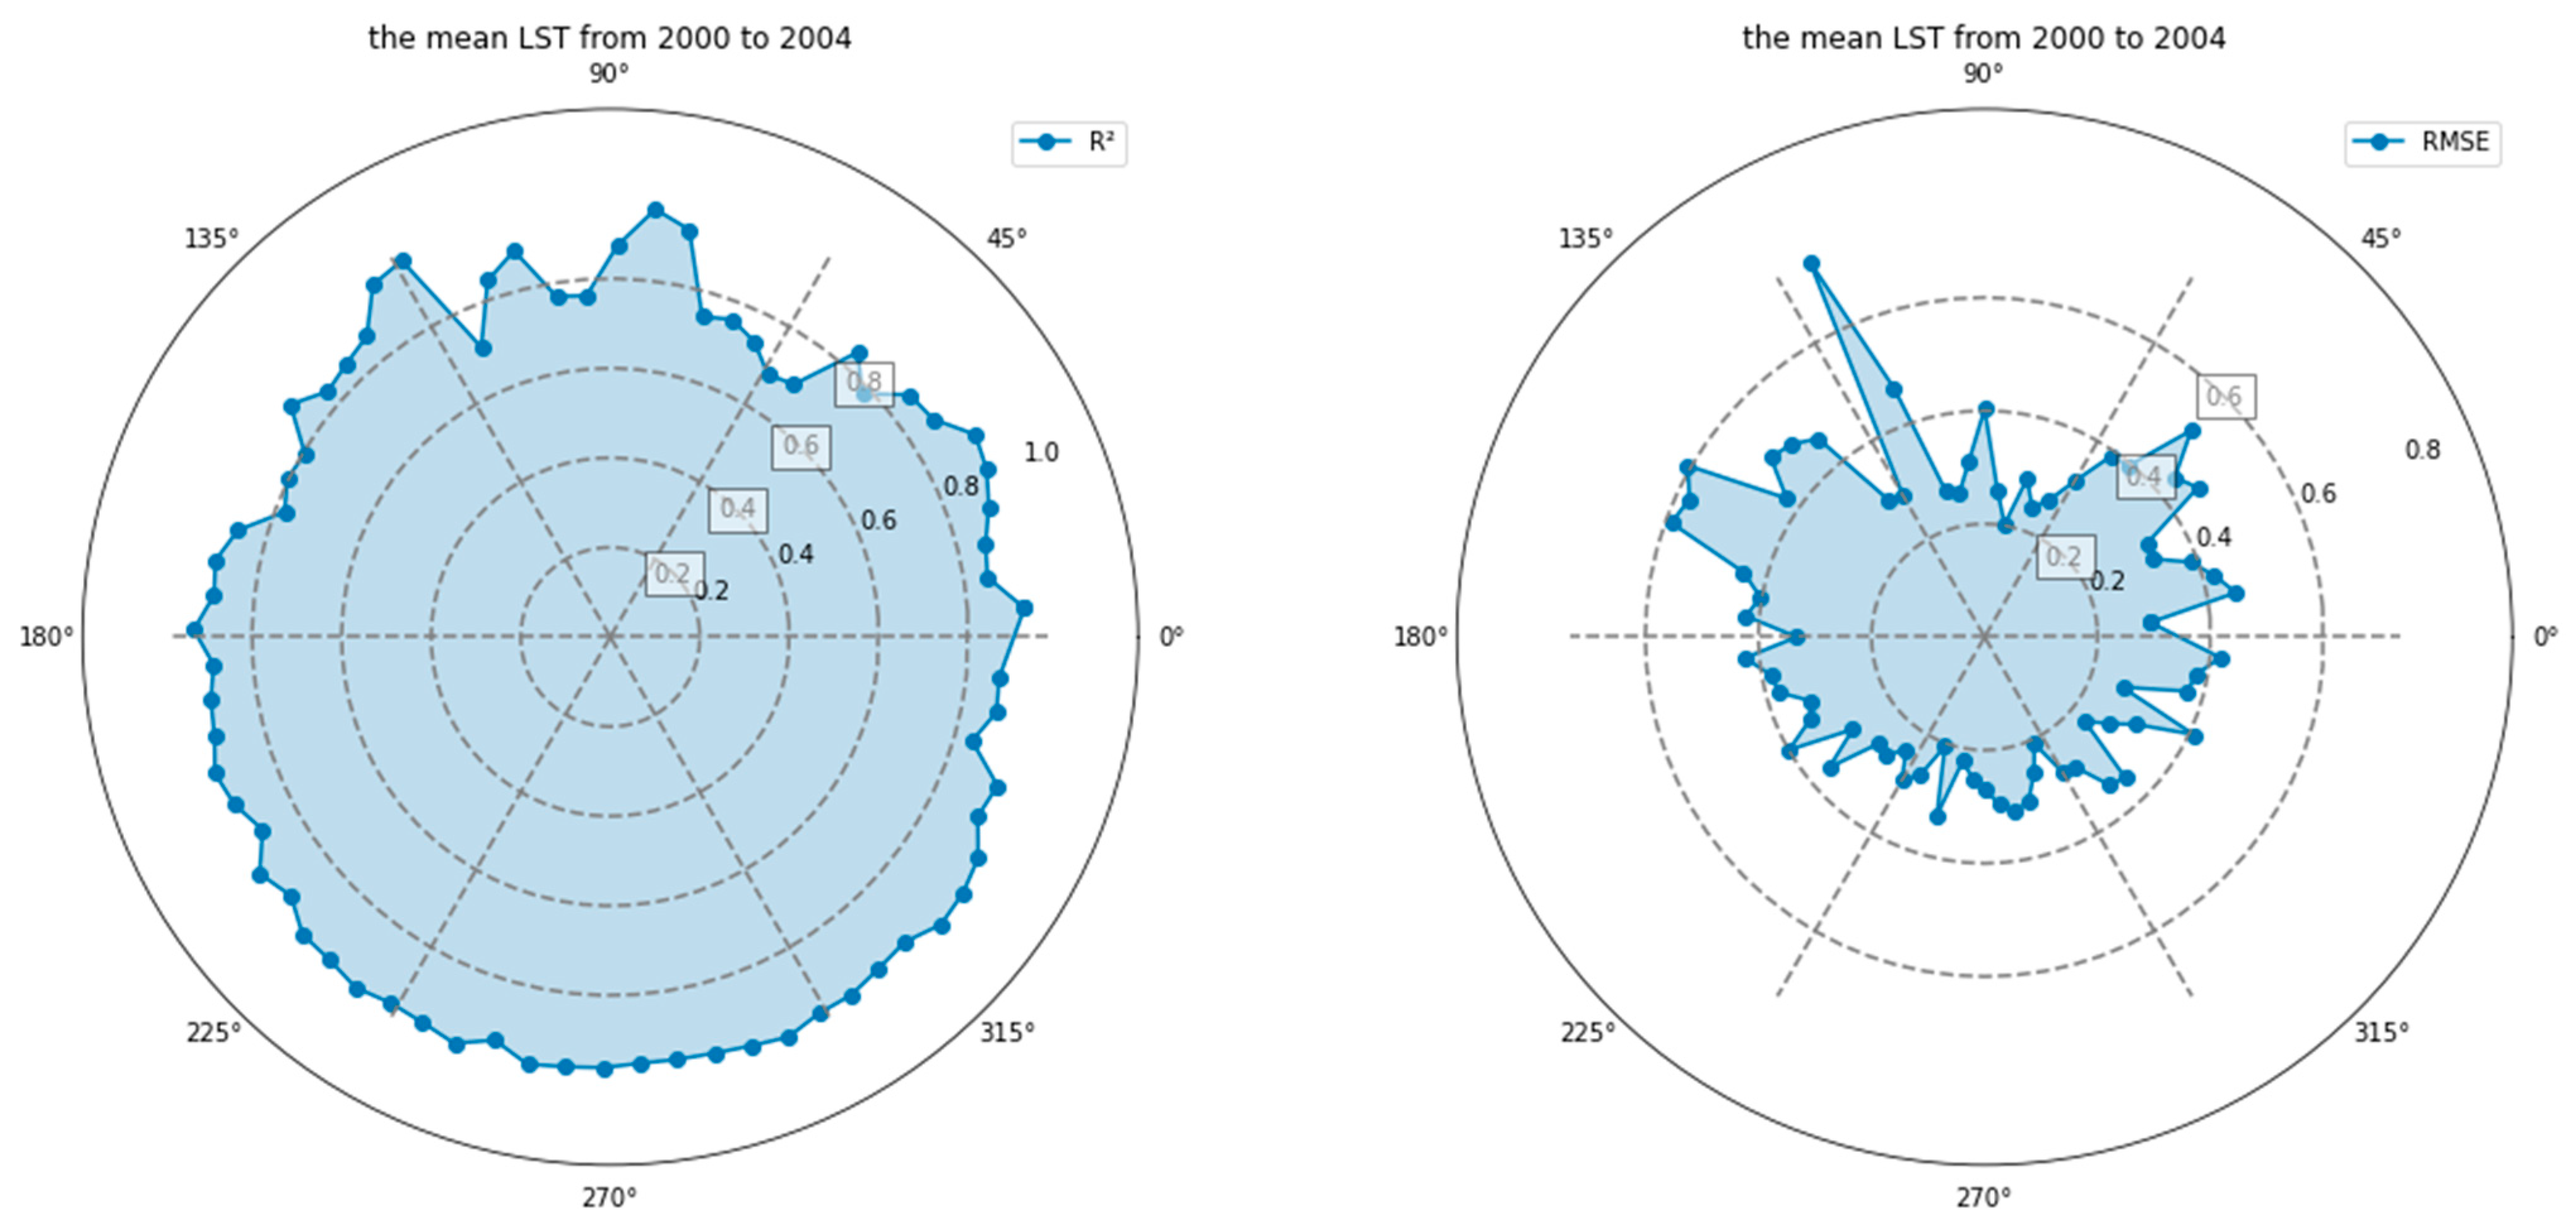
3.1. Assessment of Results

The results were assessed using two methods: a statistical assessment involving R2 and RMSE, and an overlay of the footprint map with the isotherm map. Theoretically, the OCI FP should occur in areas of dense isotherms.
As an illustration, the mean LST from 2000 to 2004 is examined. A total of 72 curves are fitted to the dataset during this timeframe, yielding an average R2 value of 0.89 and an average RMSE value of 0.35, indicating a good fit. The curve fitting in each direction is depicted in Figure 4.
In Figure 5, the OCI FP is superimposed on the isotherm map, revealing that the OCI FP consistently passes through areas with dense isotherms.
In conclusion, by integrating the aforementioned components, the logistic model demonstrates the ability to accurately determine the OCI FP.
Table 1 and Figure 6 present the curve fits for LST averages, as well as the seasonal averages for spring, summer, autumn, and winter, in each direction for the periods 2000–2004, 2005–2009, 2010–2014, and 2015–2019.

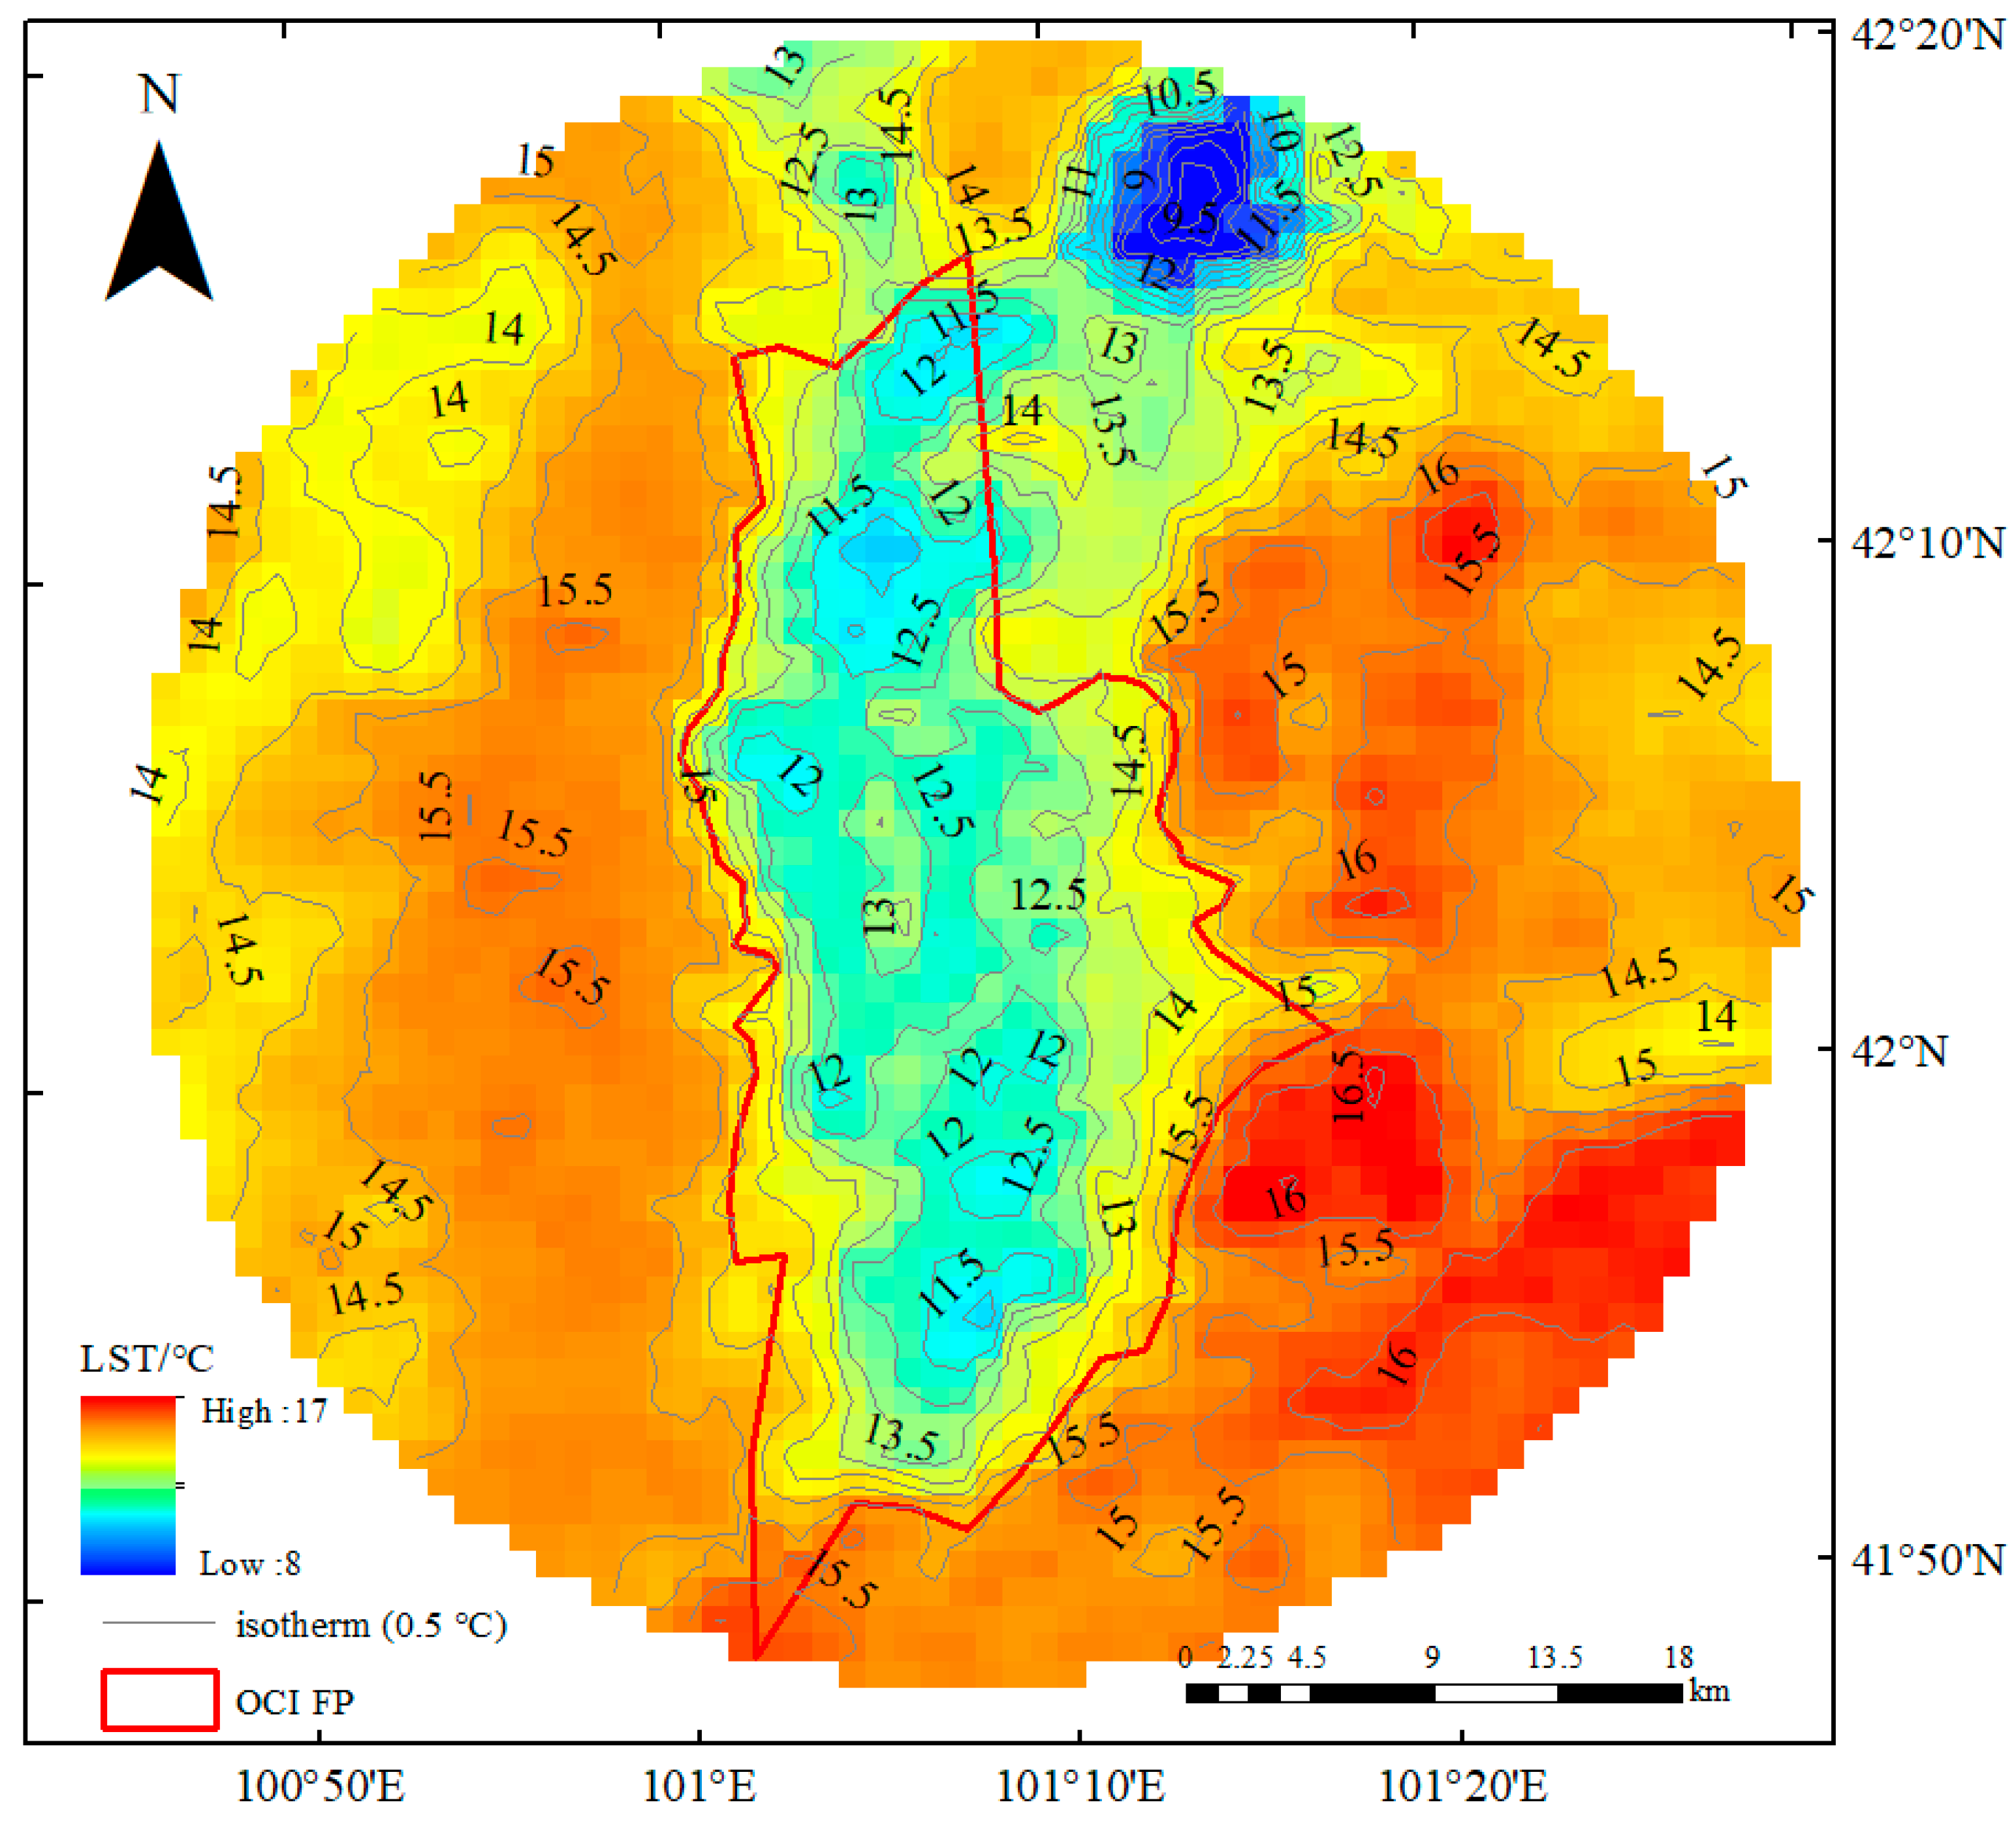
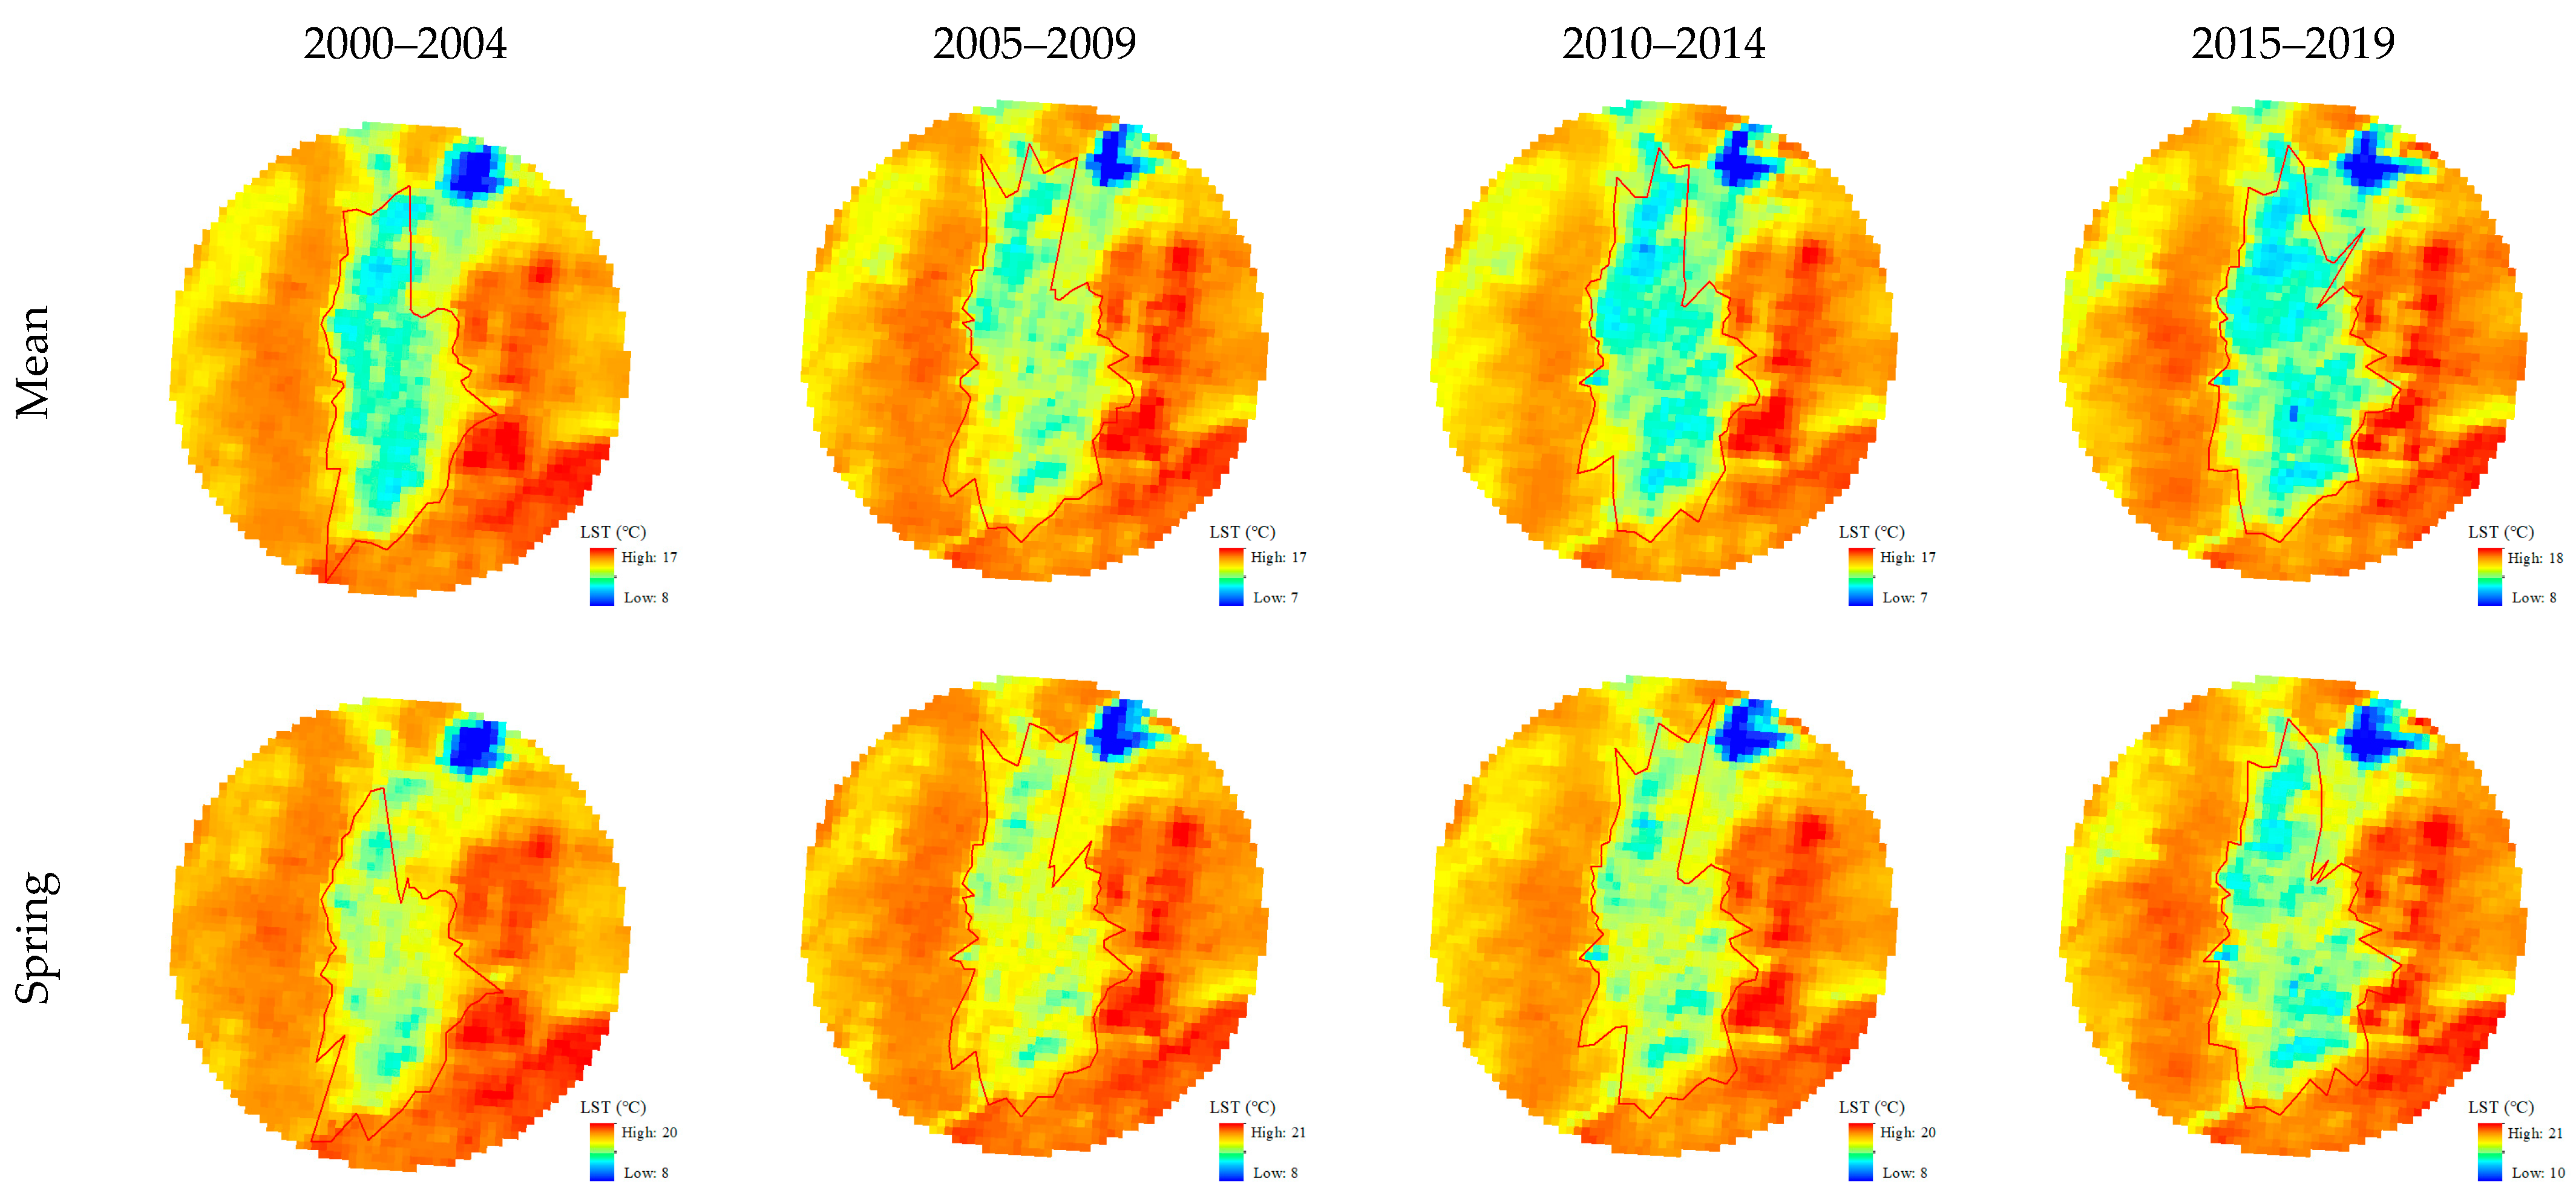
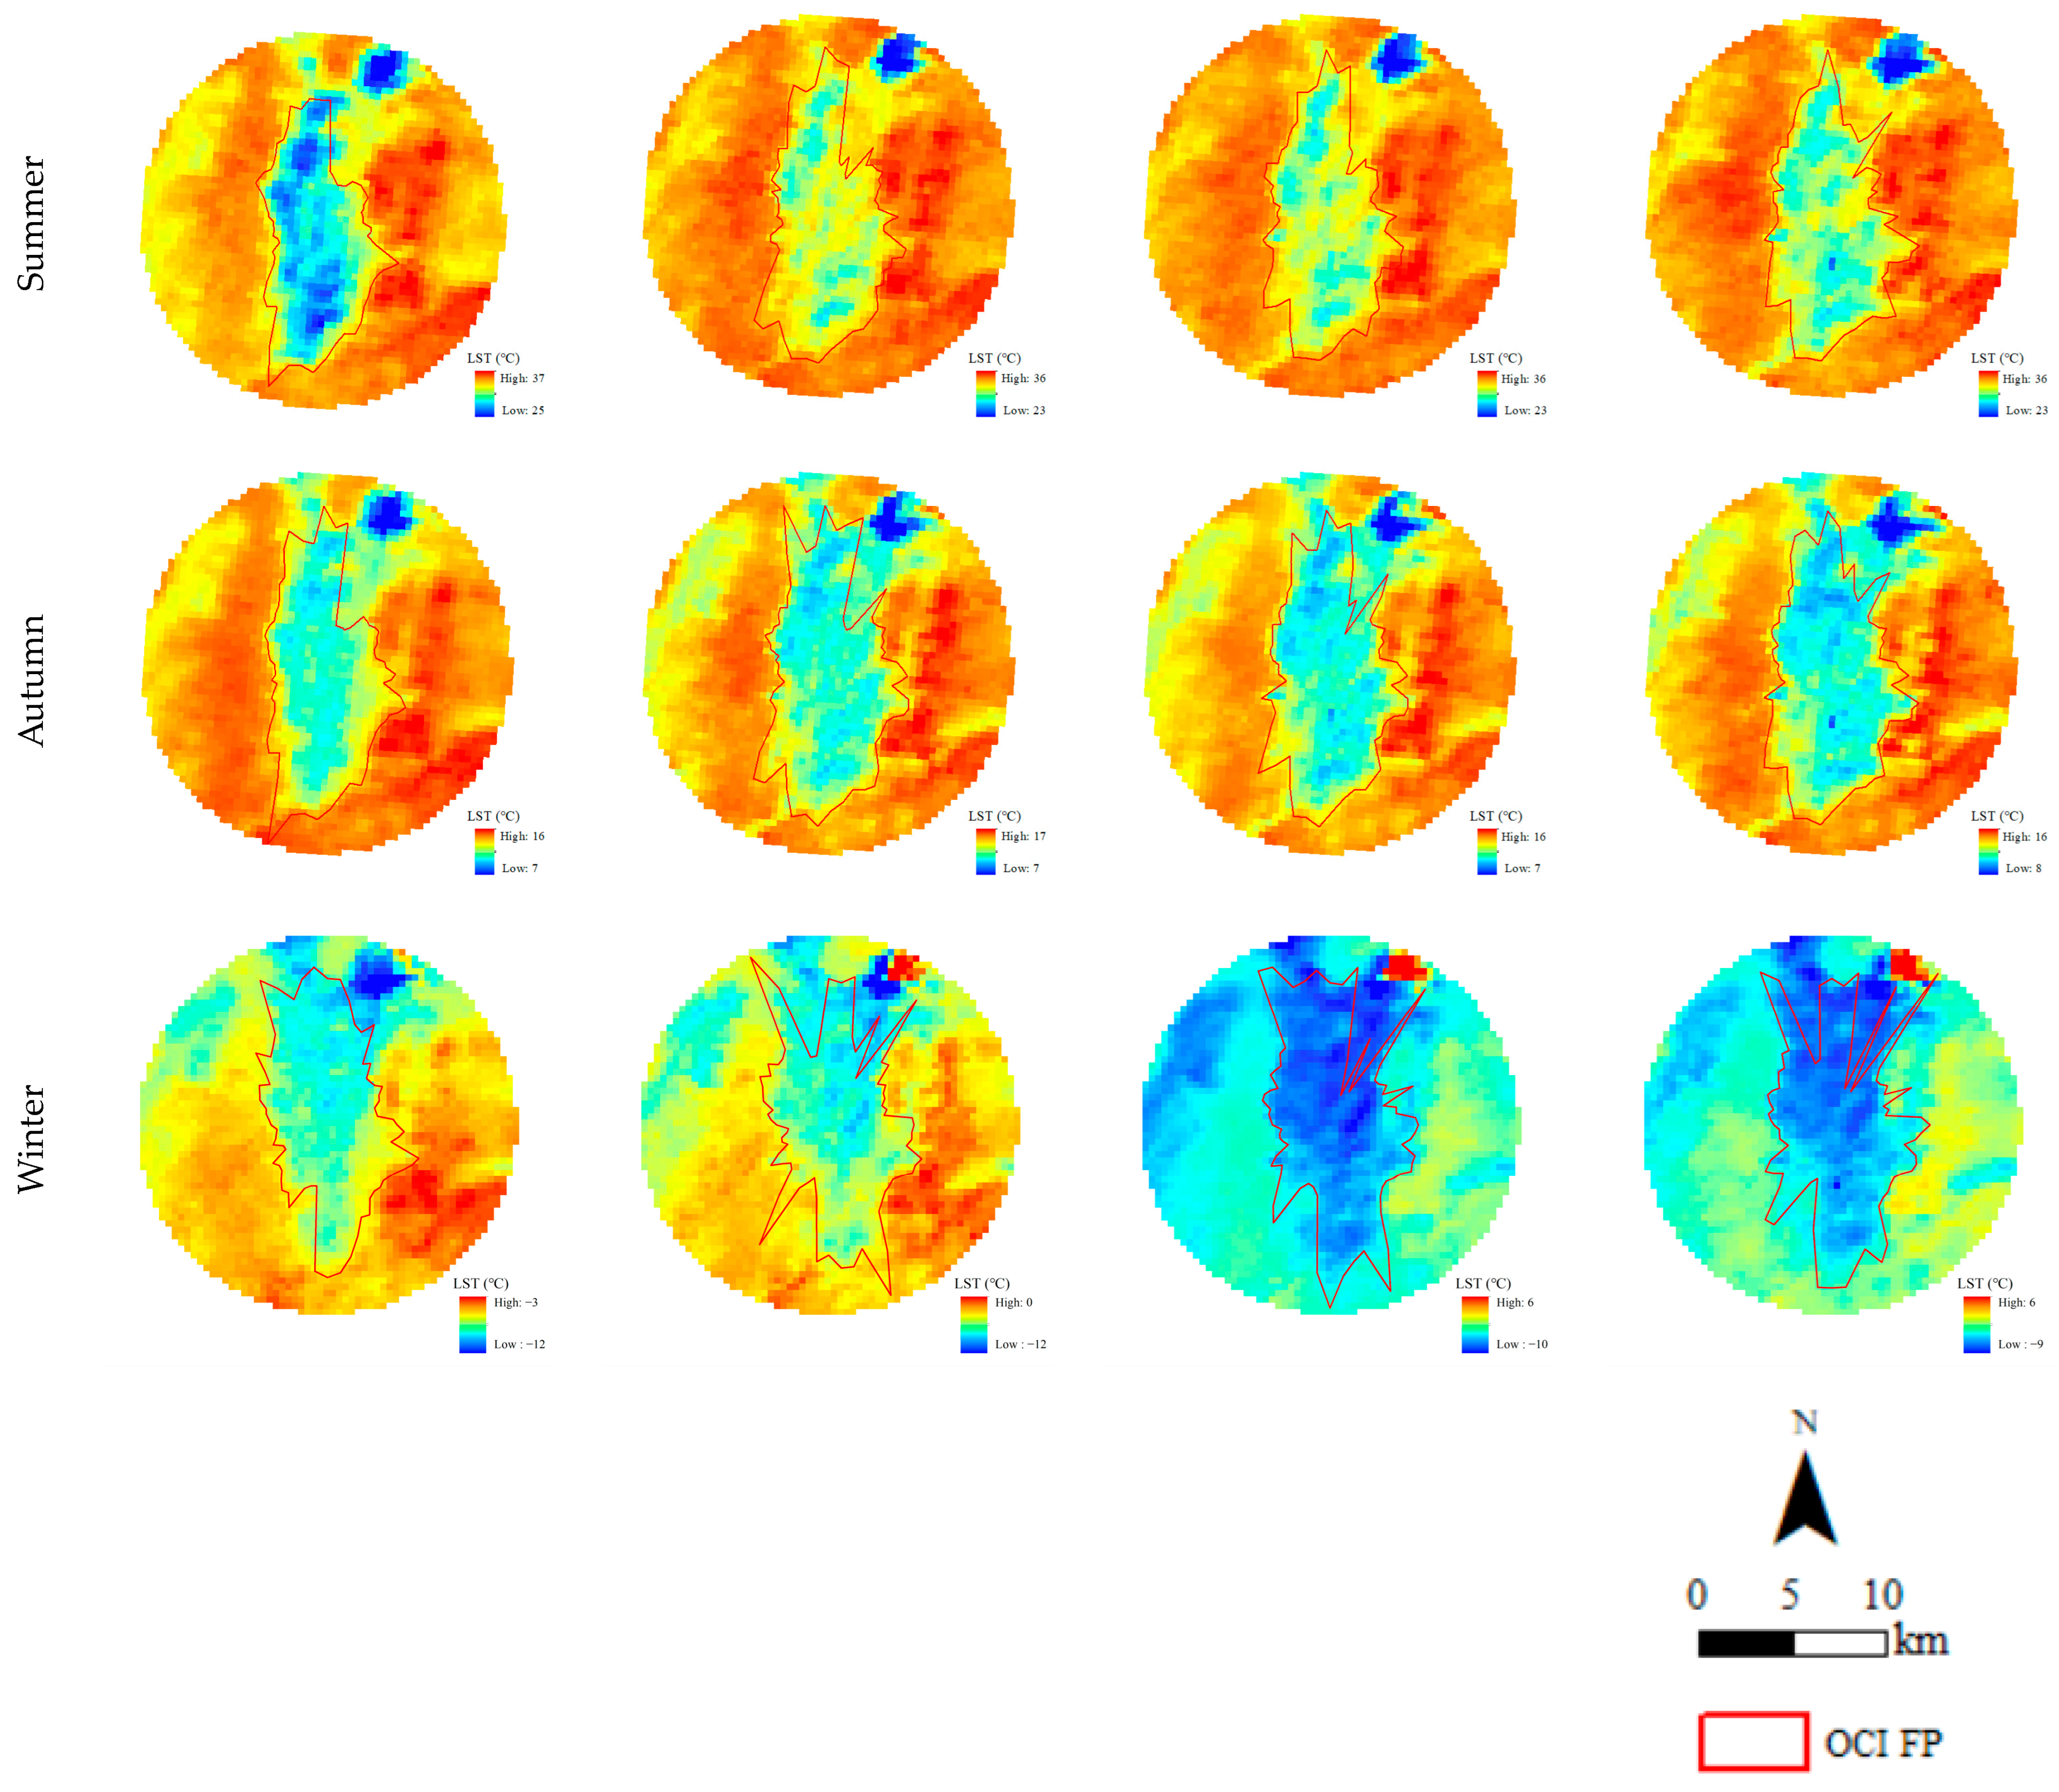
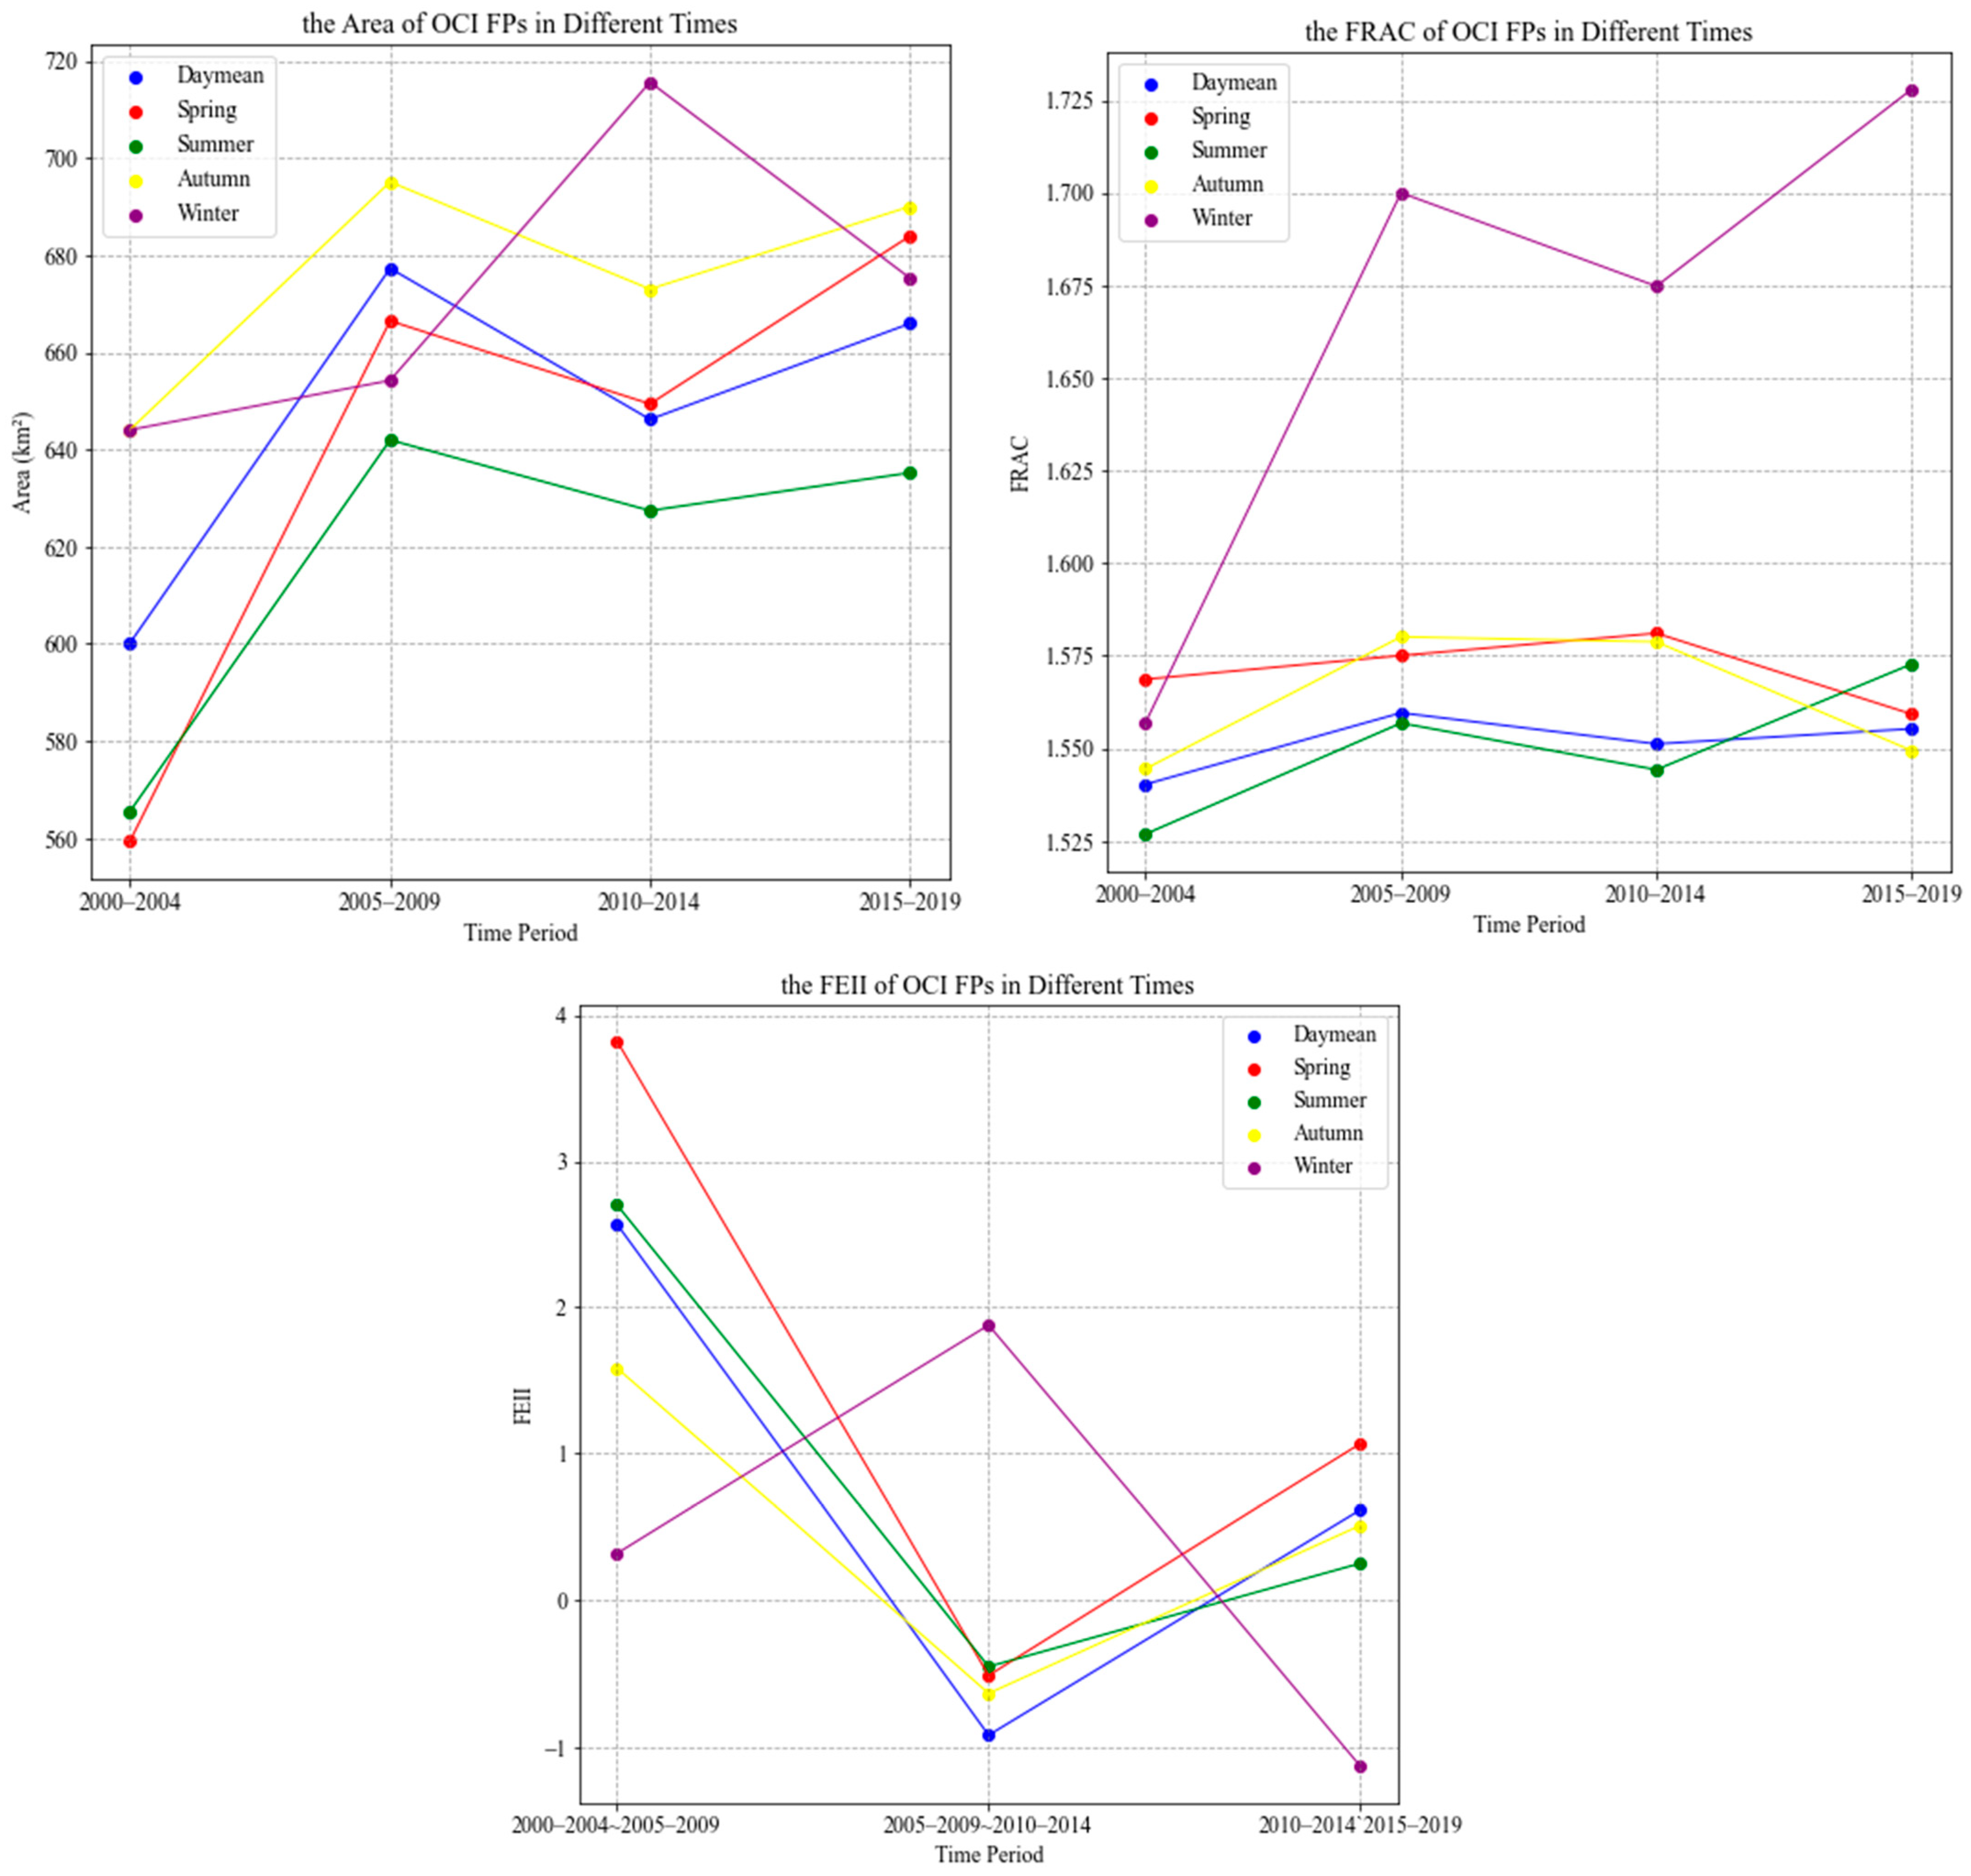
3.2. The Spatial and Temporal Characteristics of OCI FPs in the Ejina Oasis

Figure 7 illustrates the spatial and temporal distribution pattern of the OCI FP from 2000 to 2019 by overlaying the OCI FPs with the LST data. Generally, the OCI FPs resemble the shape of the oases but expand or contract in different directions across seasons. Except for winter, OCI FPs contract in the northeast and expand in the south and southeast. In winter, contraction also occurs in the northwest. This variation may be influenced by the subsurface characteristics. In the northeastern part of the oasis, there is a lake with a higher specific heat capacity, resulting in lower temperature increases compared to the surrounding areas under the same radiation, thus contributing to CIE [39]. Consequently, the northeast is affected by two sources of cold, leading to contraction. In the southern part of the oasis, poplar forests grow densely, and their lush foliage provides shade from direct sunlight while transpiration causes cooling. As a result, the OCI FPs tend to expand in the south [13].
In winter, significant changes in the northern OCI FPs may result from the snow cover, altering thermal properties between oases and deserts. Soil moisture content also likely contributes to these drastic changes. Lakes in the northern part of the oasis are undergoing dynamic changes, with past areas being larger than current ones. After lakes recede, original soil moisture content remains high. For the rest of the season, the effect on OCI FPs is minimal due to high evapotranspiration, but this effect becomes more noticeable during winter months.
The spatial characteristics of OCI FPs over time are assessed using Area and FRAC, while FEII demonstrates the temporal changes in OCI FPs. The maximum area of OCI FPs occurs during autumn and the minimum during summer. In terms of complexity, it remains around 1.55 for all seasons except winter. Annual trends mirror this pattern, with complexity peaking at 1.73 in winter and exhibiting greater variability (Figure 8). Analysis of FEII changes (Figure 8) indicates that the OCI FP area increased, then decreased, and subsequently increased again from 2000 to 2019. The seasonal variations in OCI FP area for spring, summer, and fall mirror those observed annually, whereas in winter, the OCI FP area shows a opposite trend.

3.3. Intensity of Oasis Cold Island Effect

The OCIEI reflects the cooling capacity of the oasis. Oases and non-oases were initially identified based on subsurface type before considering the OCIEI FP. However, two issues arise with this approach. First, deserts are not composed entirely of unused land; they can include bodies of water, grasslands, and other subsurface types. Second, the area cooled by oases includes not only the oases themselves but also parts of the surrounding desert. These issues can introduce bias into the OCIEI. Therefore, the OCI FP is introduced as the boundary to determine the region affected by the oasis, and the difference between the mean LST values of the oasis-influenced and non-oasis-influenced regions is used as the OCIEI, which better reflects the true cooling capacity of the oasis.
Figure 9 shows the OCIEI for each season over the past two decades. The annual mean OCIEI of the Ejina Oasis is 1.8 °C. The OCIEI is strongest in summer, with a maximum of 2.85 °C, and lowest in winter, with a minimum of 1.01 °C. Thus, the OCIEI of the oasis is highest in summer and lowest in winter.

4. Discussion

4.1. Elimination of Artificial Bias in Background Temperatures

In recent years, the global oasis area has increased dramatically, but approximately 13.43 million hectares of oases are still desertified or at high risk of desertification [40]. Population growth has exacerbated environmental pressure in these regions, making the safety and sustainable development of oases a focus of attention for all sectors of society. Understanding the impacts of oases on the surrounding environment first requires determining the scope of these impacts, referred to as the OCI FPs.
Previous studies have neglected the OCI FPs and have manually selected study areas. Such areas are often inconsistent with the actual regions affected by oases, leading to bias in the background values of various types of data. In this study, remote sensing data and a logistic model were used to calculate the OCI FPs, accurately determining the boundaries of the affected and unaffected areas. This approach overcomes the bias introduced by manual selection in related studies, thereby improving our understanding of oases.

4.2. Factors Influencing OCI FPs

The main factors affecting surface temperature are total radiation, initial ground temperature, and the thermal inertia of ground objects [41]. The initial ground temperature indicates the background temperature of ground features in the entire region, while differences in thermal inertia are the primary cause of variations in surface temperature [42]. Deserts have relatively stable thermal inertia, and the OCIE occurs when a significant negative oasis surface temperature increment is superimposed on the desert surface temperature field. Larger OCI FPs indicate a greater oasis influence on the surrounding environment.
Figure 10 overlays the land use types with the OCI FPs, reflecting the impact of land use types on OCI FPs. In the north, particularly the northeastern region, the presence of large areas of unutilized land results in a contraction of OCI FPs towards the oases. In the southwest, OCI FPs generally expand outward due to the presence of extensive grasslands. However, in the southwest, there is a certain degree of contraction towards the oasis center-town direction because of the presence of towns, indicating that human activities negatively impact OCI FPs. In the south, OCI FPs expand outward due to the substantial growth of woodlands. In the east, the conversion of grassland to unutilized land since 2010 has led to a contraction of OCI FPs in that direction, explaining the negative value of FEII between 2005–2009 and 2010–2014. From 2015–2019, there has been an expansion of grassland in the east compared to the previous five years, leading to an expansion of OCI FPs during this period.
In addition to land use type, factors affecting OCI FPs may include human socio-economic activities, oasis size, regional climate, watershed energy balance, irrigated agriculture, and the relative homogeneity within the oasis. Further research is needed to understand the influencing factors and mechanisms of OCI FPs.

4.3. Limitations and Outlook

In this paper, we calculated the OCI FPs in the Ejinjina Oasis for different periods from 2000 to 2019 using a logistic model. We analyzed the temporal and spatial variations as well as the influencing factors. However, the study has the following shortcomings.

4.3.1. Poor Fitting in Some Directions

Due to inhomogeneity within the oasis, the LST can rise and fall sharply in certain directions, affecting the accuracy of the fitted curves. This necessitates finding methods to exclude the effect of outliers on the fit.
The next steps in the process will focus on the following areas.

4.3.2. Comparative Analysis between Multiple Oases

Gao et al. found that oasis size is important for oasis expansion and OCIE [43]. When the oasis extends to approximately 4 km, it enhances the thermal exchange between the oasis and the surrounding desert. This process retains more water vapor, fostering vegetation growth along the oasis periphery, and facilitates the expansion of OCI FPs. Hou et al. discovered that different oases in the Hexi Corridor exhibit varying cooling ranges [30].
Future studies should focus on the similarities and differences in OCI FPs of oases of different sizes in various regions to determine the quantitative relationship between oasis size and OCI FPs.

4.3.3. OCI FPs Influencing Factors

In the preceding discussion, we initially explored the impact of subsurface type on OCI FPs and proposed several factors that may influence OCI FPs. Future research should focus not only on identifying these influencing factors but also on elucidating their mechanisms and contributions. This will provide valuable decision support for the sustainable development of oases.

4.3.4. The Effect of Internal Heterogeneity in Oases on OCI FPs

Meng et al. demonstrated that relative homogeneity within oases positively impacts their self-sustainability and development [44]. Oases exhibit internal differentiation, exemplified by the Ejina Oasis, which includes farmland, woodlands, grasslands, water bodies, and towns (Figure 3). These diverse elements reflect and absorb solar radiation differently, leading to variations in surface temperature.
Studies by Kueppers et al., Sacks et al., Zhu et al., and Han et al. have shown that irrigated agriculture creates a distinct cold island effect, significantly lowering temperatures [45,46,47,48]. Urban areas, hubs of human activity, generate considerable heat. Oasis cities, situated amidst deserts, exhibit cold island effects but remain localized hotspots compared to other oasis regions [49,50,51]. Water bodies, with their high specific heat capacity, absorb solar radiation efficiently but raise temperatures minimally. Woodlands and grasslands mitigate direct sunlight exposure, with transpiration effectively dissipating heat.
In summary, oases contain numerous localized hot and cold spots, influenced by varied surface compositions and human activities. In future studies, logistic models could be used to explore the effects of intra-oasis fractional heterogeneity on OCI FPs.

5. Conclusions

This study utilized logistic modeling to analyze variations in land surface temperature (LST) around the Ejina Oasis, identifying areas affected by the Oasis’s Cold Island Effect, referred to as the Oasis Cold Island Footprint (OCI FP). Key findings from 2000 to 2019 include: (1) OCI FP values peaked in autumn and reached their lowest levels in summer; (2) winter demonstrated greater complexity in OCI FP compared to other seasons; (3) the area covered by OCI FPs exhibited fluctuations over the two decades; and (4) the Oasis Cold Island Effect intensity (OCIEI) was highest in summer and lowest in winter, showing an initial decline followed by a subsequent increase. These findings highlight the significance of accurately determining OCI FPs to enhance oasis-related indices and deepen our understanding of their environmental impacts.

Author Contributions

Conceptualization, W.W. and R.C.; methodology, W.W. and R.C.; software, W.W.; validation, W.W.; formal analysis, W.W.; investigation, W.W.; resources, W.W.; data curation, W.W.; writing—original draft preparation, W.W.; writing—review and editing, W.W. All authors have read and agreed to the published version of the manuscript.

Funding

This study was funded by the National Natural Sciences Foundation of China (42171145, 42171147), Gansu Provincial Science and Technology Program (22ZD6FA005) and the Key Talent Program of Gansu Province.

Data Availability Statement

No new data were created or analyzed in this study. Data sharing is not applicable to this article.

Acknowledgments

Thanks to Zhangwen Liu for adding to the literature, Chuntan Han for suggesting ideas for the thesis, Yanni Zhao for suggesting the structure of the thesis, and Yi-Wen Liu and Zhi-Wei Yang for their help in writing the thesis.

Conflicts of Interest

The authors declare no conflicts of interest.

References

  1. Huang, J.P.; Yu, H.P.; Guan, X.D.; Wang, G.Y.; Guo, R.X. Accelerated dryland expansion under climate change. Nat. Clim. Chang. 2016, 6, 166–171. [Google Scholar] [CrossRef]
  2. Hu, R.J.; Jiang, F.Q.; Wang, Y.J. Correct understanding of the stability of oases in China’s arid zones. Arid Zone Res. 2010, 3, 319–323. [Google Scholar]
  3. Han, D.L. The progress of research on oasis in China. Sci. Geogr. Sin. 1999, 19, 313–319. [Google Scholar]
  4. Wang, T. Review and Prospect of research on oasification and desertification in Arid Regions. J. Desert Res. 2009, 29, 1–9. [Google Scholar]
  5. Li, X.; Yang, K.; Zhou, Y. Progress in the study of oasis-desert interactions. Agric. For. Meteorol. 2016, 130, 1–7. [Google Scholar] [CrossRef]
  6. Vivoni, E.R.; Kindler, M.; Wang, Z.C.; Pérez-Ruiz, E.R. Abiotic mechanisms drive enhanced evaporative losses under urban oasis conditions. Geophys. Res. Lett. 2020, 47, e2020GL090123. [Google Scholar] [CrossRef]
  7. Warner, T.T. Desert Meteorology; Cambridge University Press: Cambridge, UK, 2009. [Google Scholar]
  8. Zhang, Q.; Hu, Y.Q. Oasis effect in arid zones. Chin. J. Nat. 2001, 4, 234–236. [Google Scholar]
  9. Kai, k.; Matsuda, M.; Sato, R. Oasis effect observed at Zhangye Oasis in the Hexi Corridor, China. J. Meteorol. Soc. Jpn. 1997, 75, 1171–1178. [Google Scholar] [CrossRef]
  10. Gao, Y.X. About the history of arid climate research at our institute. Plateau Meteorol. 1989, 2, 103–106. [Google Scholar]
  11. Su, C.X.; Hu, Y.Q.; Zhang, Y.F.; Wei, G.A. Microclimate characterization and cold island effect in oases of the Hexi region. Chin. J. Atmos. Sci. 1987, 4, 390–396. [Google Scholar]
  12. Li, R.L.; Shi, Y.J.; Yao, Y.M.; Tian, F.P.; Hu, Y. Spatial and temporal variation of oasis cold island effect in Ganzhou District, Zhangye City, China, based on Landsat TM/ETM+. J. Arid Land Resour. Environ. 2014, 9, 139–144. [Google Scholar]
  13. Yang, L.P.; Pan, X.P.; Liu, J.; Xie, W.; Ma, M. Temporal and spatial patterns of surface temperature and cold island effect in Ejina Oasis based on Landsat images. J. Arid Land Resour. Environ. 2019, 2, 116–121. [Google Scholar]
  14. Hao, X.; Li, W. Oasis cold island effect and its influence on air temperature: A case study of Tarim Basin, Northwest China. J. Arid Land 2016, 8, 172–183. [Google Scholar] [CrossRef]
  15. Du, M.X.; Zhang, M.J.; Wang, S.J. Intensity of cold and wet island effects in typical oases in Xinjiang. Chin. J. Ecol. 2015, 6, 1523–1531. [Google Scholar]
  16. Potchter, O.; Goldman, D.; Kadish, D.; Iluz, D. The oasis effect in an extremely hot and arid climate: The case of southern Israel. J. Arid Environ. 2008, 72, 1721–1733. [Google Scholar] [CrossRef]
  17. Potchter, O.; Goldman, D.; Iluz, D.; Kadish, D. The climatic effect of a manmade oasis during winter season in a hyper arid zone: The case of Southern Israel. J. Arid Environ. 2012, 87, 231–242. [Google Scholar] [CrossRef]
  18. Domroes, M.; El-Tantawi, A. Recent temporal and spatial temperature changes in Egypt. Int. J. Climatol. 2005, 25, 51–63. [Google Scholar] [CrossRef]
  19. Brunel, J.-P.; Ihab, J.; Droubi, A.M.; Samaan, S. Energy budget and actual evapotranspiration of an arid oasis ecosystem: Palmyra (Syria). Agric. Water Manag. 2006, 84, 213–220. [Google Scholar] [CrossRef]
  20. Siebert, S.; Nagieb, M.; Buerkert, A. Climate and irrigation water use of a mountain oasis in northern Oman. Agric. Water Manag. 2007, 89, 1–14. [Google Scholar] [CrossRef]
  21. Pan, J.H.; Zhang, W.Q. Remote sensing analysis of spatial and temporal pattern of cold island effect in Zhangye oasis. Arid Zone Res. 2010, 4, 481–486. [Google Scholar]
  22. Ma, Y.G.; Teibai, T.; Ding, J.L.; Xu, C.B. Analysis of the “cold island” effect and its correlation with vegetation cover in the oasis at the southern edge of the Tarim- A case study in Yutian Oasis. Arid Land Geogr. 2007, 6, 865–870. [Google Scholar]
  23. Gao, Y.; Liu, P.X.; Yao, Y.L.; Yong, G.Z.; Wang, Y. Spatial-temporal characteristics and factor analysis of the cold island effect in the Shihezi oasis based on remote sensing images. J. Nat. Resour. 2015, 8, 1319–1331. [Google Scholar]
  24. Georgescu, M.; Moustaoui, M.; Mahalov, A.; Dudhia, J. An alternative explanation of the semiarid urban area “oasis effect”. J. Geophys. Res. Atmos. 2011, 116, D24. [Google Scholar] [CrossRef]
  25. Lv, S.H.; Chen, Y.C. Numerical simulation of the effect of oasis and desert subsurface states on atmospheric boundary layer characteristics. J. Desert Res. 1995, 2, 116–123. [Google Scholar]
  26. Wen, L.J.; Lv, S.H.; Meng, X.H.; Bao, Y. Numerical simulation study on the influence of ambient wind field on oasis cold island effect. J. Desert Res. 2006, 5, 754–758. [Google Scholar]
  27. Zhou, D.; Zhao, S.; Zhang, L.; Sun, G.; Liu, Y. The footprint of urban heat island effect in China. Sci. Rep. 2015, 5, 11160. [Google Scholar] [CrossRef] [PubMed]
  28. Xu, H.C.; Li, C.L.; Hu, Y.M.; Wang, C.; Wen, D.; Li, Z.X.; Ping, X.Y.; Wang, Q.Y.; Li, Q. Spatiotemporal evolution and influencing factors of surface urban heat island footprint across different-sized cities. Urban Clim. 2024, 54, 101852. [Google Scholar] [CrossRef]
  29. Qiao, Z.; Wu, C.; Zhao, D.Q.; Xu, X.L.; Yang, J.L.; Feng, L.; Sun, Z.L.; Liu, L. Determining the boundary and probability of surface urban heat island footprint based on a logistic model. Remote Sens. 2019, 11, 1368. [Google Scholar] [CrossRef]
  30. Hou, W.B.; Li, K.M.; Huang, Z. Characteristics of spatial and temporal changes of oasis effect in Hexi region in the last 20 a and attribution analysis. Arid Zone Res. 2023, 12, 2031–2042. [Google Scholar]
  31. Pearl, R.; Reed, L.J. On the rate of growth of the population of the United States since 1790 and its mathematical representation. Proc. Natl. Acad. Sci. 1920, 6, 275–288. [Google Scholar] [CrossRef]
  32. Yin, X.; Zelenay, P. Kinetic models for the degradation mechanisms of PGM-free ORR catalysts. ECS Trans. 2018, 85, 1239. [Google Scholar] [CrossRef]
  33. Bie, Q.; Xie, Y.W.; Wang, X.Y.; Wei, B.C.; He, L.; Duan, H.M.; Wang, J. Understanding the attributes of the dual oasis effect in an arid region using remote sensing and observational data. Ecosyst. Health Sustain. 2020, 6, 681–694. [Google Scholar] [CrossRef]
  34. Zhou, J.; Zhang, X.; Tang, W.; Ding, L.; Ma, J.; Zhang, X. Daily 1-km All-Weather Land Surface Temperature Dataset for Western China (TRIMS LST-TP; 2000–2022) V2; National Tibetan Plateau Data Center: Beijing, China, 2019. [Google Scholar]
  35. Zhang, X.; Zhou, J.; Liang, S.; Wang, D. A practical reanalysis data and thermal infrared remote sensing data merging (RTM) method for reconstruction of a 1-km all-weather land surface temperature. Remote Sens. Environ. 2021, 260, 112437. [Google Scholar] [CrossRef]
  36. Zhang, X.; Zhou, J.; Göttsche, F.; Zhan, W.; Liu, S.; Cao, R. A Method Based on Temporal Component Decomposition for Estimating 1-km All-Weather Land Surface Temperature by Merging Satellite Thermal Infrared and Passive Microwave Observations. IEEE Trans. Geosci. Remote Sens. 2019, 57, 4670–4691. [Google Scholar] [CrossRef]
  37. Zhou, J.; Zhang, X.; Zhan, W.; Göttsche, F.-M.; Liu, S.; Olesen, F.-S.; Hu, W.; Dai, F. A thermal sampling depth correction method for land surface temperature estimation from satellite passive microwave observation over barren land. IEEE Trans. Geosci. Remote Sens. 2017, 55, 4743–4756. [Google Scholar] [CrossRef]
  38. Tang, W.; Zhou, J.; Ma, J.; Wang, Z.; Ding, L.; Zhang, X.; Zhang, X. TRIMS LST: A daily 1 km all-weather land surface temperature dataset for China’s landmass and surrounding areas (2000–2022). Earth Syst. Sci. Data 2024, 16, 387–419. [Google Scholar] [CrossRef]
  39. Su, C.X.; Hu, Y.Q. Cold Island Effect in oases and lakes. Chin. Sci. Bull. 1987, 10, 756–758. [Google Scholar]
  40. Cui, B.C.; Gui, D.W.; Liu, Q.; Abd-Elmabod, S.K.; Liu, Y.F.; Lu, B.B. Distribution and growth drivers of oases at a global scale. Earth’s Future 2024, 12, e2023EF004086. [Google Scholar] [CrossRef]
  41. Zhou, J.; Chen, Y.H.; Li, J.; Weng, Q.H.; Yi, W.B. A volume model for urban heat island based on remote sensing imagery and its application: A case study in Beijing. J. Remote Sens. 2008, 5, 734–742. [Google Scholar]
  42. Qiao, Z.; Tian, G.J. Dynamic monitoring of the footprint and capacity for urban heat island in Beijing between 2001 and 2012 based on MODIS. J. Remote Sens. 2015, 3, 476–484. [Google Scholar]
  43. Gao, Y.H.; Chen, Y.C.; Lv, S.H. Numerical simulation of the critical scale of oasis maintenance and development in the arid regions of Northwest China. Adv. Atmos. Sci. 2004, 21, 113–124. [Google Scholar] [CrossRef]
  44. Meng, X.H.; Lv, S.H.; Zhang, T.T.; Ao, Y.H.; Li, S.; Bao, Y.; Wen, L.J.; Luo, S. Impacts of inhomogeneous landscapes in oasis interior on the oasis self-maintenance mechanism by integrating numerical model with satellite data. Hydrol. Earth Syst. Sci. 2012, 16, 3729–3738. [Google Scholar] [CrossRef]
  45. Kueppers, L.M.; Snyder, M.A.; Sloan, L.C. Irrigation cooling effect: Regional climate forcing by land-use change. Geophys. Res. Lett. 2007, 34, L03703. [Google Scholar] [CrossRef]
  46. Sacks, W.J.; Cook, B.I.; Buenning, N.; Levis, S.; Helkowski, J.H. Effects of global irrigation on the near-surface climate. Clim. Dyn. 2009, 33, 159–175. [Google Scholar] [CrossRef]
  47. Zhu, X.F.; Liang, S.L.; Pan, Y.Z. Observational evidence of the cooling effect of agricultural irrigation in Jilin, China. Clim. Chang. 2012, 114, 799–811. [Google Scholar] [CrossRef]
  48. Han, S.J.; Yang, Z.Y. Cooling effect of agricultural irrigation over Xinjiang, Northwest China from 1959 to 2006. Environ. Res. Lett. 2013, 8, 24–39. [Google Scholar] [CrossRef]
  49. Wu, X.J.; Wang, G.X.; Yao, R.; Wang, L.C.; Yu, D.Q.; Gui, X. Investigating Surface Urban Heat Islands in South America Based on MODIS Data from 2003–2016. Remote Sens. 2019, 11, 1212. [Google Scholar] [CrossRef]
  50. Haashemi, S.; Weng, Q.H.; Darvishi, A.; Alavipanah, S.K. Seasonal Variations of the Surface Urban Heat Island in a Semi-Arid City. Remote Sens. 2016, 8, 352. [Google Scholar] [CrossRef]
  51. Lazzarini, M.; Marpu, P.R.; Ghedira, H. Temperature-land cover interactions: The inversion of urban heat island phenomenon in desert city areas. Remote Sens. Environ. 2013, 130, 136–152. [Google Scholar] [CrossRef]
Figure 1. Flow chart of the logistic model.
Remotesensing 16 02895 g001
Figure 2. Schematic diagram of finding OCI FP using logistic modeling (Second Derivative has been enlarged to show it more clearly).
Remotesensing 16 02895 g002
Figure 3. Overview of the study area.
Remotesensing 16 02895 g003
Figure 4. R2 and RMSE, the mean LST from 2000 to 2004.
Remotesensing 16 02895 g004
Figure 5. OCI FP and isotherms, the mean LST of daytime from 2000 to 2004.
Remotesensing 16 02895 g005
Figure 6. R2 and RMSE, the mean LST of daytimes and seasons for 2000–2004, 2005–2009, 2010–2014, and 2015–2019.
Remotesensing 16 02895 g006aRemotesensing 16 02895 g006b
Figure 7. OCI FPs for 2000–2004, 2005–2009, 2010–2014, and 2015–2019.
Remotesensing 16 02895 g007aRemotesensing 16 02895 g007b
Figure 8. The Area, FRAC, and FEII of OCI FPS for different times from 2000 to 2019.
Remotesensing 16 02895 g008
Figure 9. OCIEI in different periods, 2000–2019.
Remotesensing 16 02895 g009
Figure 10. OCI FPs and land use types at different times.
Remotesensing 16 02895 g010
Table 1. Assessments of curve fit (2000–2004, 2005–2009, 2010–2014, and 2015–2019).
Times MeanSpringSummerAutumnWinter
2000–2004the mean of R20.890.830.880.900.85
the mean of RMSE0.350.390.560.360.25
2005–2009the mean of R20.820.810.820.850.82
the mean of RMSE0.440.470.600.450.31
2010–2014the mean of R20.840.810.830.860.82
the mean of RMSE0.420.480.600.410.35
2014–2019the mean of R20.860.820.840.860.82
the mean of RMSE0.440.560.640.450.35
Disclaimer/Publisher’s Note: The statements, opinions and data contained in all publications are solely those of the individual author(s) and contributor(s) and not of MDPI and/or the editor(s). MDPI and/or the editor(s) disclaim responsibility for any injury to people or property resulting from any ideas, methods, instructions or products referred to in the content.

