Article

Research on Infrared Dim Target Detection Based on Improved YOLOv8

1
Changchun Institute of Optics, Fine Mechanics and Physics, Chinese Academy of Sciences, Changchun 130033, China
2
The 63615 Unit of the Chinese People’s Liberation Army, Xinjiang 841000, China
*
Author to whom correspondence should be addressed.
Remote Sens. 2024, 16(16), 2878; https://doi.org/10.3390/rs16162878
Submission received: 20 June 2024 / Revised: 23 July 2024 / Accepted: 26 July 2024 / Published: 7 August 2024

Abstract

:
Addressing the formidable challenges in spatial infrared dim target detection, this paper introduces an advanced detection approach based on the refinement of the YOLOv8 algorithm. In contrast to the conventional YOLOv8, our method achieves remarkable improvements in detection accuracy through several novel strategies. Notably, by incorporating a deformable convolutional module into the YOLOv8 backbone network, our method effectively captures more intricate image features, laying a solid foundation for subsequent feature fusion and detection head predictions. Furthermore, a dedicated small target detection layer, built upon the original model, significantly enhances the model’s capability in recognizing infrared small targets, thereby boosting overall detection performance. Additionally, we utilize the WIoU-v3 as the localization regression loss function, effectively reducing sensitivity to positional errors and leveraging the advantages of multi-attention mechanisms. To enrich the quantity and quality of the spatial infrared dim target dataset, we employ image enhancement techniques to augment the original dataset. Extensive experiments demonstrate the exceptional performance of our method. Specifically, our approach achieves a precision of 95.6%, a recall rate of 94.7%, and a mean average precision (mAP) exceeding 97.4%, representing substantial improvements over the traditional YOLOv8 algorithm. Moreover, our detection speed reaches 59 frames/s, satisfying the requirements for real-time detection. This achievement not only validates the efficacy and superiority of our algorithm in spatial infrared dim target detection, but also offers novel insights and methodologies for research and applications in related fields, holding immense potential for future applications.

Graphical Abstract

1. Introduction

Spatial infrared weak target detection technology occupies a pivotal position in modern defense technology, serving as a crucial component of space target detection systems. In military applications, the rapid and accurate identification of enemy maneuvering targets is of unparalleled importance for seizing the initiative on the battlefield. However, due to the extremely low signal-to-noise ratio of weak targets, their texture characteristics and structural shapes appear particularly blurred in infrared images, significantly increasing the difficulty of detection. Particularly, under complex atmospheric conditions, such as cloud cover, the infrared images of targets may lose multiple frames due to cloud interference [1,2], posing a greater challenge for spatial infrared weak target detection.
Traditional infrared target detection algorithms often fail to effectively distinguish targets from the background when facing targets with low signal-to-noise ratios. Additionally, cloud occlusion and the discontinuity of multi-frame images further exacerbate the detection difficulty [3]. Therefore, researching efficient and reliable spatial infrared weak target detection technology is of significant importance for enhancing national security and protection capabilities across various domains, including those related to defense, airspace safety, and other critical sectors [4].
In recent years, with the rapid development of deep learning technology, overseas research institutions such as the National Aeronautics and Space Administration (NASA), the University of California, and Air Force Laboratories have made significant progress in infrared detection technology and infrared weak target detection algorithms [5]. They have not only explored novel high-performance detectors, but also actively promoted the development of large-area array and single-chip multi-band detection technology. At the algorithmic level, deep learning techniques, particularly convolutional neural networks (CNNs) [6] and the You Only Look Once (YOLO) [7,8,9,10] real-time object detection system, have been widely applied in infrared weak target detection. These techniques significantly improve detection accuracy and efficiency by automatically learning image features.
Although China’s research in this field started later, through significant investment and in-depth research in recent years, China has made considerable progress in the innovation and application of infrared weak target detection algorithms. Traditional infrared target detection and tracking methods mainly include single-frame detection and multi-frame detection [11,12], each with its advantages and disadvantages. Single-frame detection methods are simple and intuitive, but they often have a high false alarm rate [13]. While multi-frame detection methods can reduce the false alarm rate to a certain extent, they have high computational complexity and limited generalization ability [14,15]. Moreover, these methods typically rely on manually designed features and classifiers, making them less adaptive to complex and variable environments and image characteristics.
Addressing the issues of low detection rate, high missed detection rate, and poor real-time performance of existing algorithms in spatial infrared weak target detection, this paper proposes a spatial infrared weak target detection algorithm based on improved YOLOv8.
The main contributions of this paper are as follows:
  • Introduction of deformable convolutional modules: By introducing deformable convolutional modules into the backbone network of YOLOv8, the model’s ability to capture local details in images is effectively enhanced, enabling more accurate extraction of target feature information.
  • Construction of a small target detection layer: To further enhance the model’s detection capability for small targets, this paper adds a small target detection layer to the original model, enabling the model to better adapt to targets of different sizes.
  • Adoption of the WIoU-v3 loss function: To further improve the algorithm’s detection capability for small targets and the positional accuracy of predicted bounding boxes, we introduce WIoU-v3 as the localization regression loss function, effectively reducing the sensitivity to positional deviations.
  • This paper also employs image enhancement techniques to expand the original dataset, increasing the diversity and richness of the training dataset.
Through detailed experimental validation, the proposed method exhibits excellent performance. Specifically, the accuracy of this method reaches 95.6%, the recall rate reaches 94.7%, and the mean average precision (mAP) is improved to over 97.4%. Additionally, the detection speed achieves 59 frames per second, fully meeting the requirements of real-time detection.
In summary, the spatial infrared weak target detection algorithm based on improved YOLOv8 proposed in this paper has achieved remarkable results in addressing existing issues. It not only improves detection accuracy and real-time performance but also provides new ideas and methods for technological progress and practical applications in this field.

2. Related Work

2.1. Analysis of Infrared Image Features

Spatial infrared dim targets refer to those targets that are difficult to identify due to the subtle differences in infrared radiation between the target and the background during infrared imaging [16]. Such targets often exhibit a low signal-to-noise ratio (SNR), low contrast, and low brightness in infrared images, posing numerous challenges for their detection process. While infrared imaging possesses significant advantages over visible light imaging in certain specific scenarios, its inherent limitations cannot be overlooked [17,18].
Visible light imaging can exhibit rich color and texture information under favorable lighting conditions, making target identification intuitive [19]. However, in nighttime or adverse environments such as haze and smoke, its effectiveness significantly decreases, making it difficult to capture effective target information. Additionally, some objects exhibit inconspicuous reflection characteristics under visible light, further hindering their identification [20,21]. In contrast, infrared imaging has unique advantages in capturing the infrared radiation of objects, enabling stable operation at night or in poor weather conditions and revealing certain object features that are difficult to discern under visible light, playing an irreplaceable role.
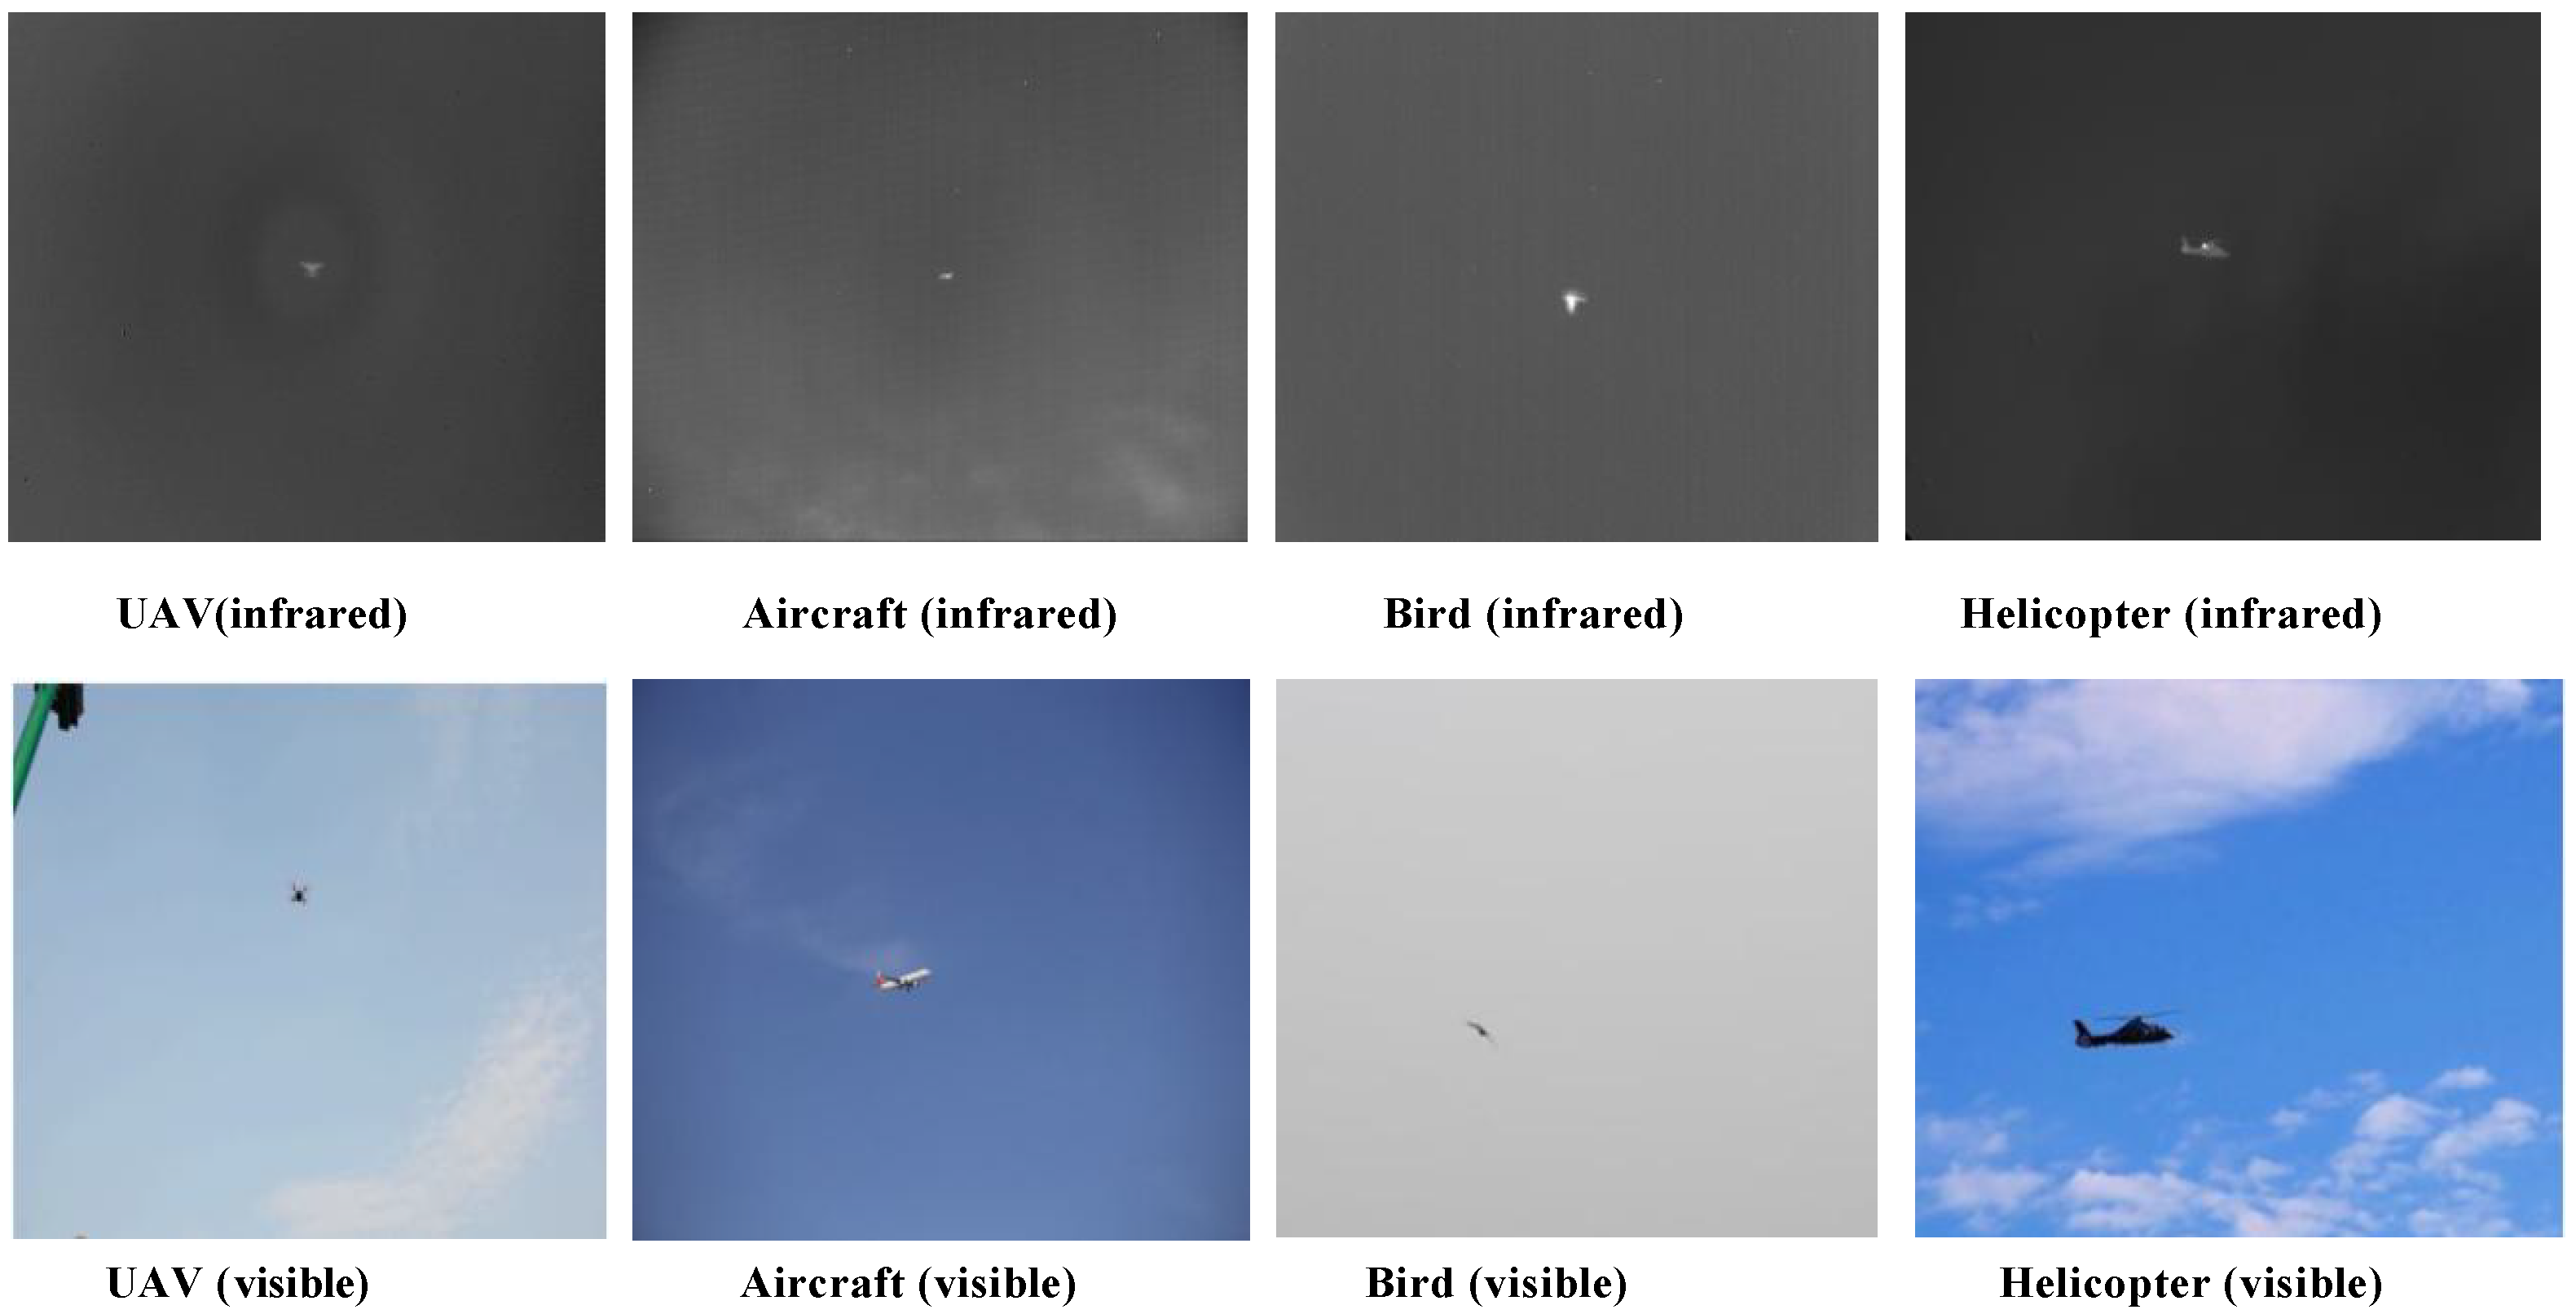
To more intuitively highlight the difficulties of spatial infrared dim target detection, this paper specifically presents a comparison of visible and infrared images of UAVs, civil aviation aircraft, birds, and helicopters. Through the comparison of these images, it is evident that while infrared imaging can reveal hidden features of objects in some cases, issues such as low SNR, low contrast, and noise interference still severely constrain the accurate detection of infrared dim targets.The comparison of infrared and visible images is shown in Figure 1.
In the detection process of spatial infrared dim targets, we encounter numerous difficulties. Firstly, due to the subtle differences in infrared radiation between the target and the background, infrared images often have low SNR and contrast. This makes it extremely challenging to accurately identify and locate dim targets in complex backgrounds [22,23]. Secondly, infrared images are prone to various issues such as thermal noise and scattering noise. These noises and interferences not only degrade the image quality but may also mask the signal of dim targets, further increasing the difficulty of detection. Finally, due to the limited resolution of infrared images, key features such as contours and textures of dim targets may not be clearly presented in the images. This results in the poor performance of traditional feature-based target detection algorithms in infrared dim target detection.
Given the aforementioned difficulties, existing research methods still have certain deficiencies in addressing the problem of spatial infrared dim target detection. For instance, although some methods attempt to improve the quality of infrared images through image enhancement or filtering techniques, they often fail to simultaneously address issues such as low SNR, poor contrast, and noise interference. Additionally, while some deep learning-based target detection methods have achieved remarkable results on visible light images, their performance is often compromised when processing infrared images due to data scarcity and feature differences.
To overcome these difficulties and deficiencies, this paper proposes a spatial infrared dim target detection method based on an improved YOLOv8. This method optimizes the network structure and improves feature extraction and fusion techniques specifically for the characteristics of infrared images, aiming to better adapt to challenges such as low SNR, poor contrast, and noise interference. By employing this novel method, we aim to achieve accurate and rapid detection of spatial infrared dim targets, providing more reliable technical support for practical applications.

2.2. Introduction to YOLOV8

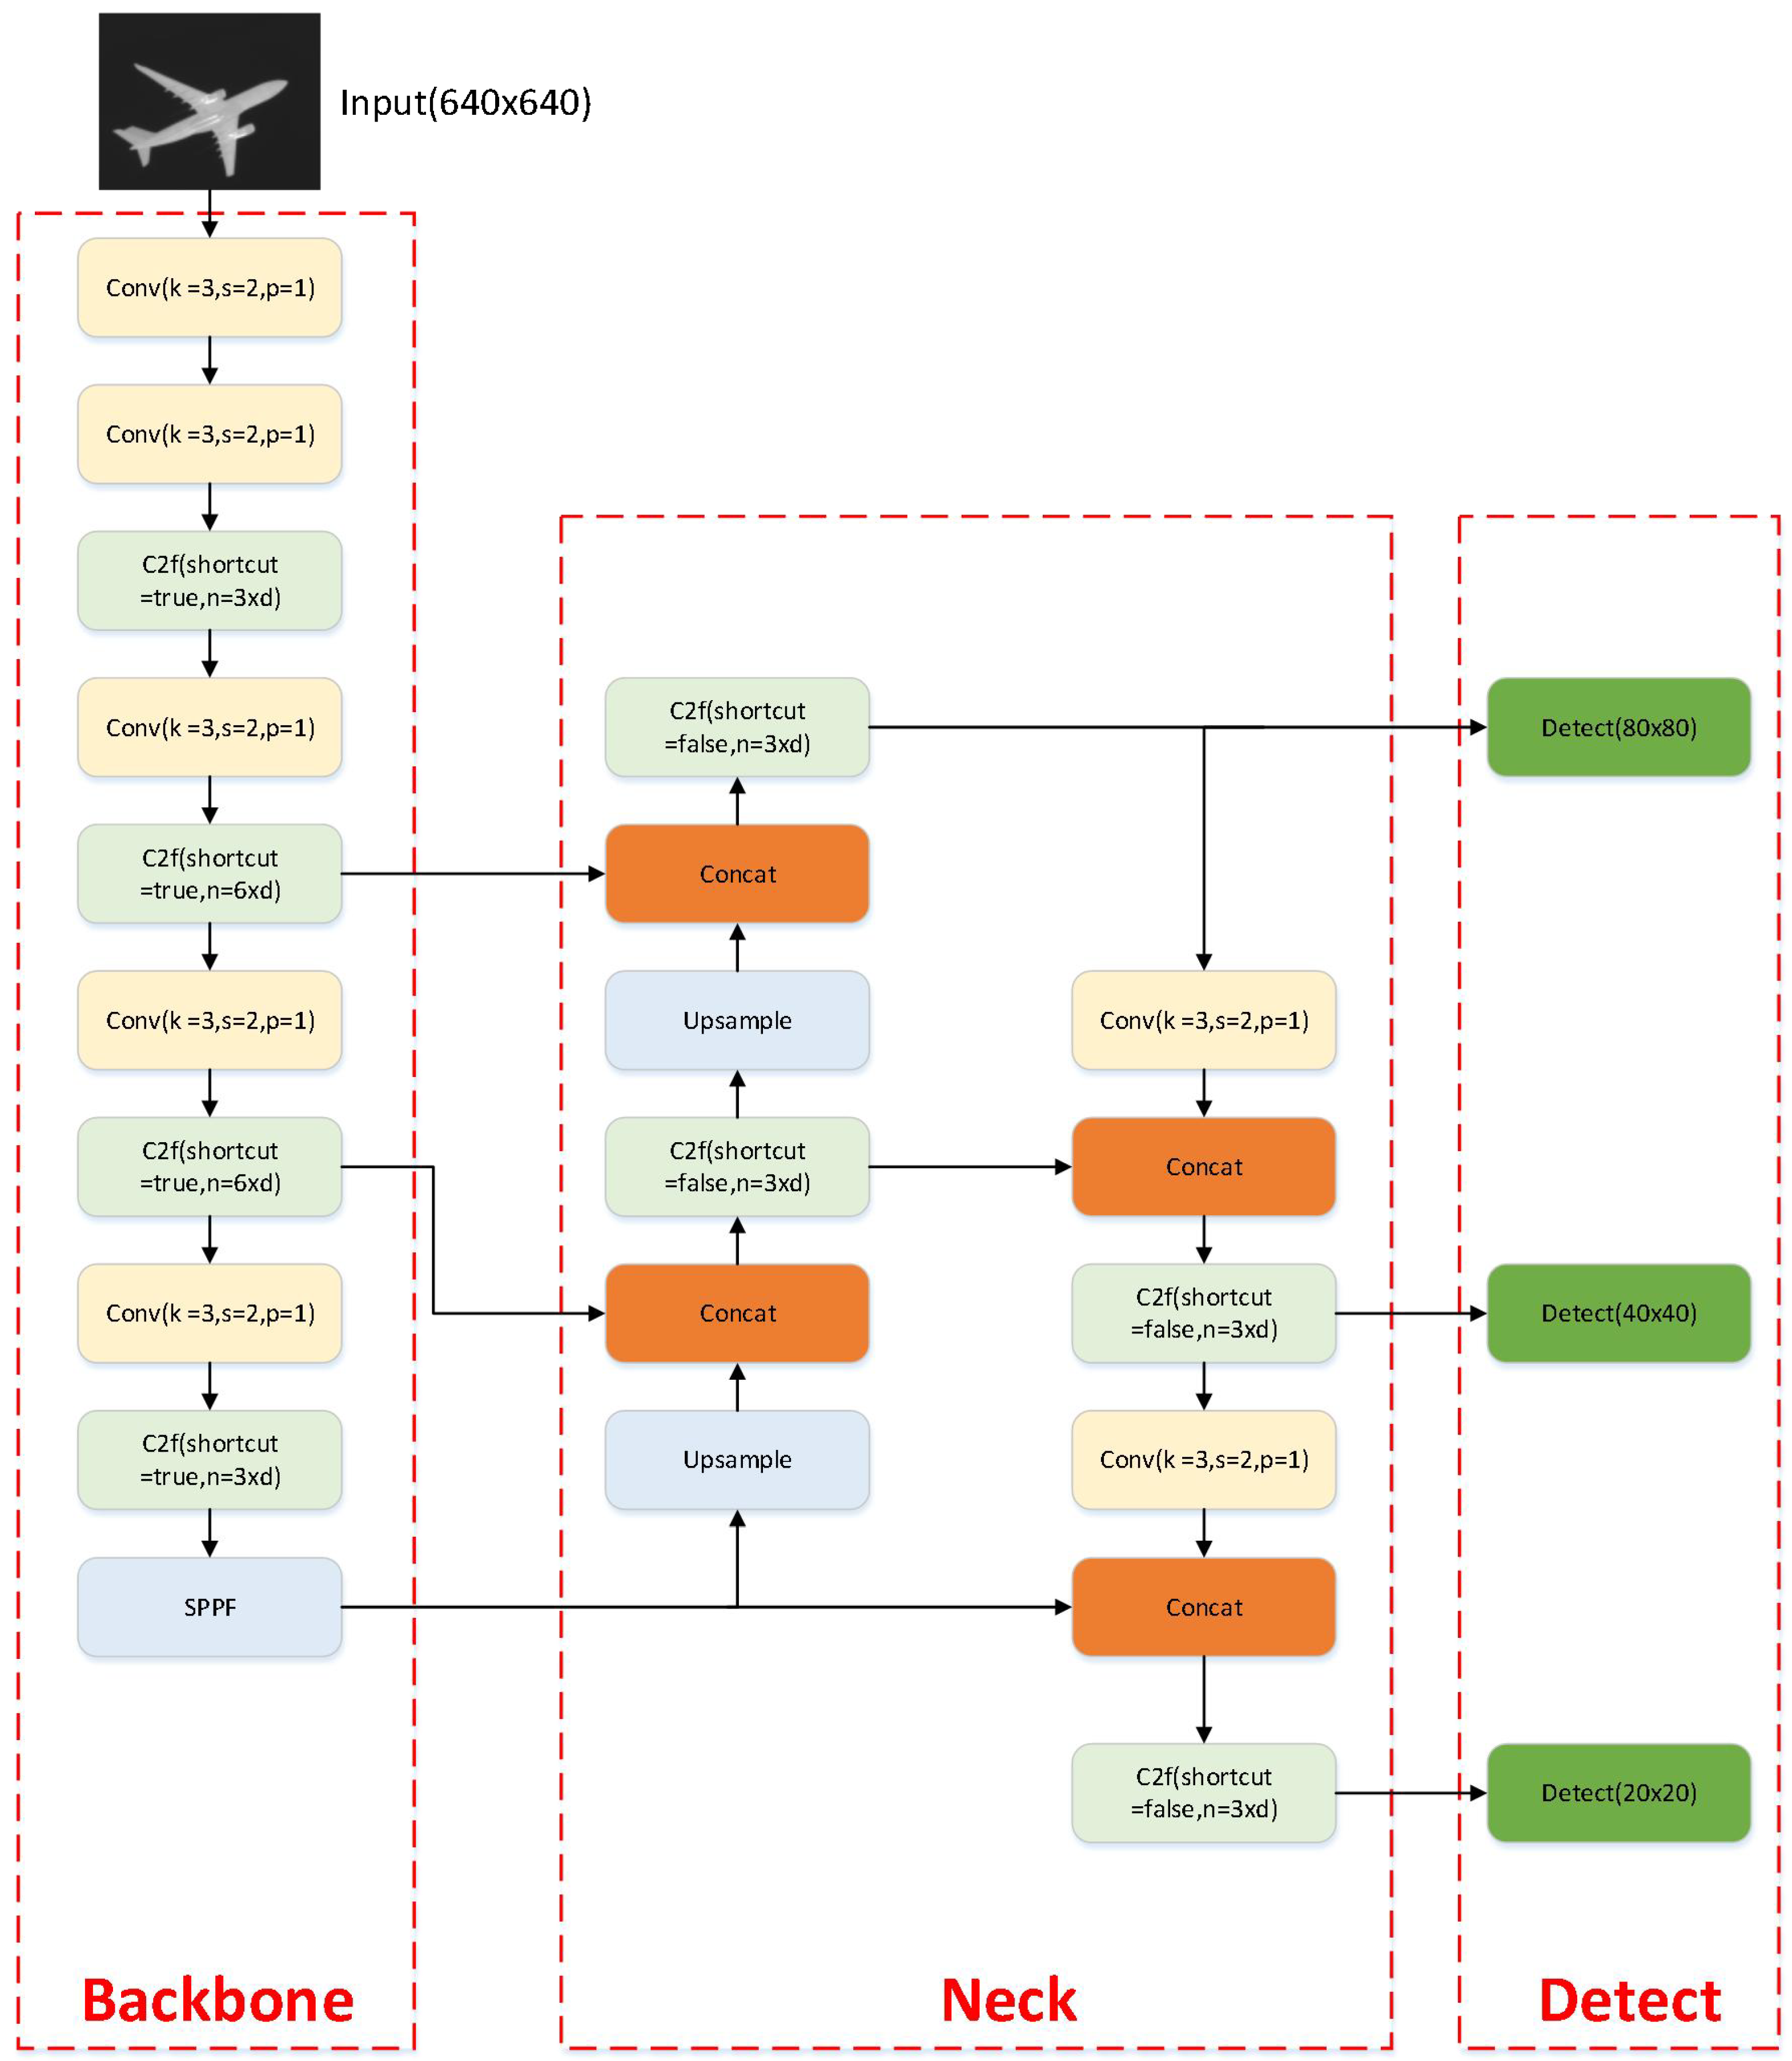
As the latest addition to the YOLO family, YOLOv8 inherits the consistent real-time performance advantages of the series while significantly enhancing detection accuracy and versatility through a series of innovations and improvements. Its network structure comprises an input layer, a backbone network, a neck network, and an output layer, achieving precise target localization and classification through precise feature extraction and fusion.
Compared to previous models, YOLOv8’s advantages are primarily reflected in the following aspects:
Firstly, YOLOv8 has made significant improvements in gradient information utilization. By focusing on “programmable gradient information to learn anything,” the model pays more attention to the quality and flow of gradient information during the training process, enabling more effective parameter updates. This improvement helps the model converge faster and improve its generalization ability for different tasks.
Secondly, YOLOv8 adopts a new backbone network, detection head, and loss function. These innovative designs make the model more efficient and accurate in feature extraction, target localization, and loss computation. Compared to YOLOv5, YOLOv8 further optimizes feature extraction and fusion [24,25], enabling it to better capture subtle features in images, especially when dealing with infrared small and dim targets.
Moreover, YOLOv8 possesses stronger versatility. The adoption of anchor-free detection and new convolutional layers ensures more accurate predictions. Compared to YOLOv1 and YOLOv5, YOLOv8 maintains real-time performance while further improving detection accuracy, demonstrating excellent performance in various scenarios and datasets.
Reviewing the development of the YOLO series, from YOLOv1 to YOLOv5 [26,27,28], each version has achieved improvements in speed and accuracy. YOLOv1 first treated the object detection task as a regression problem, enabling real-time detection but with insufficient accuracy for small targets. YOLOv2 (YOLO9000) improved both speed and accuracy, while YOLOv3 further enhanced detection accuracy, especially for small targets. YOLOv5 optimized detection performance through adaptive anchor box calculation and other methods.
However, despite the significant progress made by YOLO series models in the field of object detection, they still face challenges in detecting small and dim infrared targets in space. The characteristics of infrared imaging make small and dim targets appear with a low signal-to-noise ratio, low contrast, and low brightness in images, increasing the difficulty of target detection. Additionally, as small targets occupy fewer pixels in images, their feature information is relatively weak, potentially leading to decreased detection accuracy.
To address these challenges, this paper leverages the advantages of YOLOv8 to further optimize the model structure and training strategies. Firstly, we processed the sample data through image enhancement techniques, constructing an image dataset suitable for training the improved YOLOv8 model. Secondly, we built a neural network framework specifically for spatial infrared small target detection based on the YOLOv8 model. Additionally, we introduced a deformable convolution module into the backbone network of YOLOv8 to flexibly address the insufficient receptive field of detection points corresponding to small targets, enhancing attention to small targets and effectively improving missed and false detections, thereby increasing detection accuracy. Furthermore, we incorporated a small target detection layer, a multi-head self-attention (MHSA) mechanism [29,30], an SA attention mechanism [31,32], and a WIoU-v3 loss function [33,34,35], enabling the algorithm to fuse deeper features, obtain a broader receptive field, reduce the impact of imbalanced training sample annotation quality, improve the positional accuracy of prediction boxes, and enhance the detection capability for small targets. The structure of the YOLOv8 model is shown in Figure 2.

2.3. Algorithm Improvement

2.3.1. Shuffle-Attention (SA) Mechanism

In the task of spatial infrared dim target detection, traditional target detection algorithms often face significant challenges in extracting and identifying these targets due to their weak feature representations and susceptibility to background noise in infrared images. To address this bottleneck, this paper innovatively introduces an efficient channel attention mechanism, the Shuffle-Attention (SA) module, and embeds it into the feature extraction layers of the YOLOv8 target detection model. By embedding the SA attention module, we achieve differentiated weight allocation across different convolutional channels, effectively highlighting the features of spatial infrared dim targets. This design not only avoids the potential negative impact of dimensionality reduction on learning channels, but also significantly reduces the complexity of the model, achieving a substantial improvement in detection performance with only a small increase in parameters.
The design of the SA module skillfully integrates the advantages of group convolution, spatial attention mechanisms, and channel attention mechanisms. Specifically, it first divides the channel dimension into finer sub-features. Subsequently, utilizing a carefully designed Shuffle Unit, it deeply captures the intrinsic dependencies of features in both spatial and channel dimensions. This cross-dimensional information interaction mechanism enables the model to comprehend and utilize feature information more comprehensively and thoroughly. By aggregating all sub-features and employing an innovative “channel-shuffle” operator, the SA module achieves efficient information flow between different sub-features, significantly enhancing the model’s ability to detect spatial infrared dim targets.
It is worth mentioning that the spatial and channel attention mechanisms in the SA attention mechanism do not operate independently, but rather achieve efficient fusion. This unique structural design enables the model to precisely enhance key details containing targets while effectively suppressing irrelevant or weaker features, further improving the detection accuracy of spatial infrared dim targets.
As shown in Figure 3, the specific workflow of the SA module clearly demonstrates its efficient working mechanism. Firstly, the input feature map is grouped into multiple SA units, and each SA unit is further divided into channel attention and spatial attention components. Subsequently, these two components are stacked according to the number of channels, achieving deep integration of information. Finally, a random shuffling operation is performed to rearrange all SA units, obtaining an optimized output feature map.

2.3.2. Construction of Small Object Detection Layer in YOLOv8

To address the need for spatial infrared weak target detection, we have made adjustments to the YOLOv8 model by introducing a layer specifically designed for the detection of small objects. This improvement aims to enhance the detection accuracy of the model for small targets, particularly those with small sizes and limited feature information. The detailed steps for adding the small object detection layer are as follows:
(1)
Selection and Optimization of Feature Extraction Stages
In the YOLOv8 model, feature extraction is achieved through a series of convolutional layers, pooling layers, and residual blocks. To better capture the feature information of small targets, we focus particularly on the shallower feature maps. These feature maps often contain richer detailed information and edge features, which are crucial for detecting small objects. Therefore, before adding the small object detection layer, we first retain these shallower feature maps.
Meanwhile, we also consider the role of deeper feature maps. Although they have lower resolutions, they contain higher-level semantic information that helps the model understand the overall structure of objects. Therefore, we also take these deeper feature maps into account when adding the small object detection layer.
(2)
Feature Fusion
To fully utilize global context information, we fuse the shallower feature maps with the deeper ones. This fusion operation can be achieved through various methods, such as concatenation and addition. In this study, we adopt concatenation because it can preserve more feature information, which is beneficial for subsequent detection tasks.
By concatenating different levels of feature maps, we obtain a new fused feature map that contains both shallow detailed information and deep semantic information. This fused feature map exhibits improved performance for small object detection.
(3)
Addition of Small Object Detection Head
On the fused feature map, we add a prediction head specifically designed for small object detection. This prediction head comprises a series of convolutional layers that extract feature information from the fused feature map and generate corresponding bounding boxes and class probabilities for small objects.
Compared with other prediction heads in the YOLOv8 model, the design of the small object detection head focuses more on capturing small objects. We adopt a shallower network structure to maintain a higher feature map resolution, thus better capturing the detailed information of small objects. Additionally, we utilize smaller anchor box sizes to better match the size distribution of small objects.
(4)
Formation of Multi-Scale Prediction Structure
Finally, we form a structure with four prediction heads: three original prediction heads for detecting objects of different sizes, and the newly added small object detection layer specifically for detecting small objects. These four prediction heads work together, achieving comprehensive detection of objects of varying sizes through multi-scale prediction.
During training, we assign corresponding loss functions to each prediction head and optimize the model parameters through backpropagation. By continuously adjusting the model’s weights and biases, we enable the model to better adapt to the detection task of small objects.
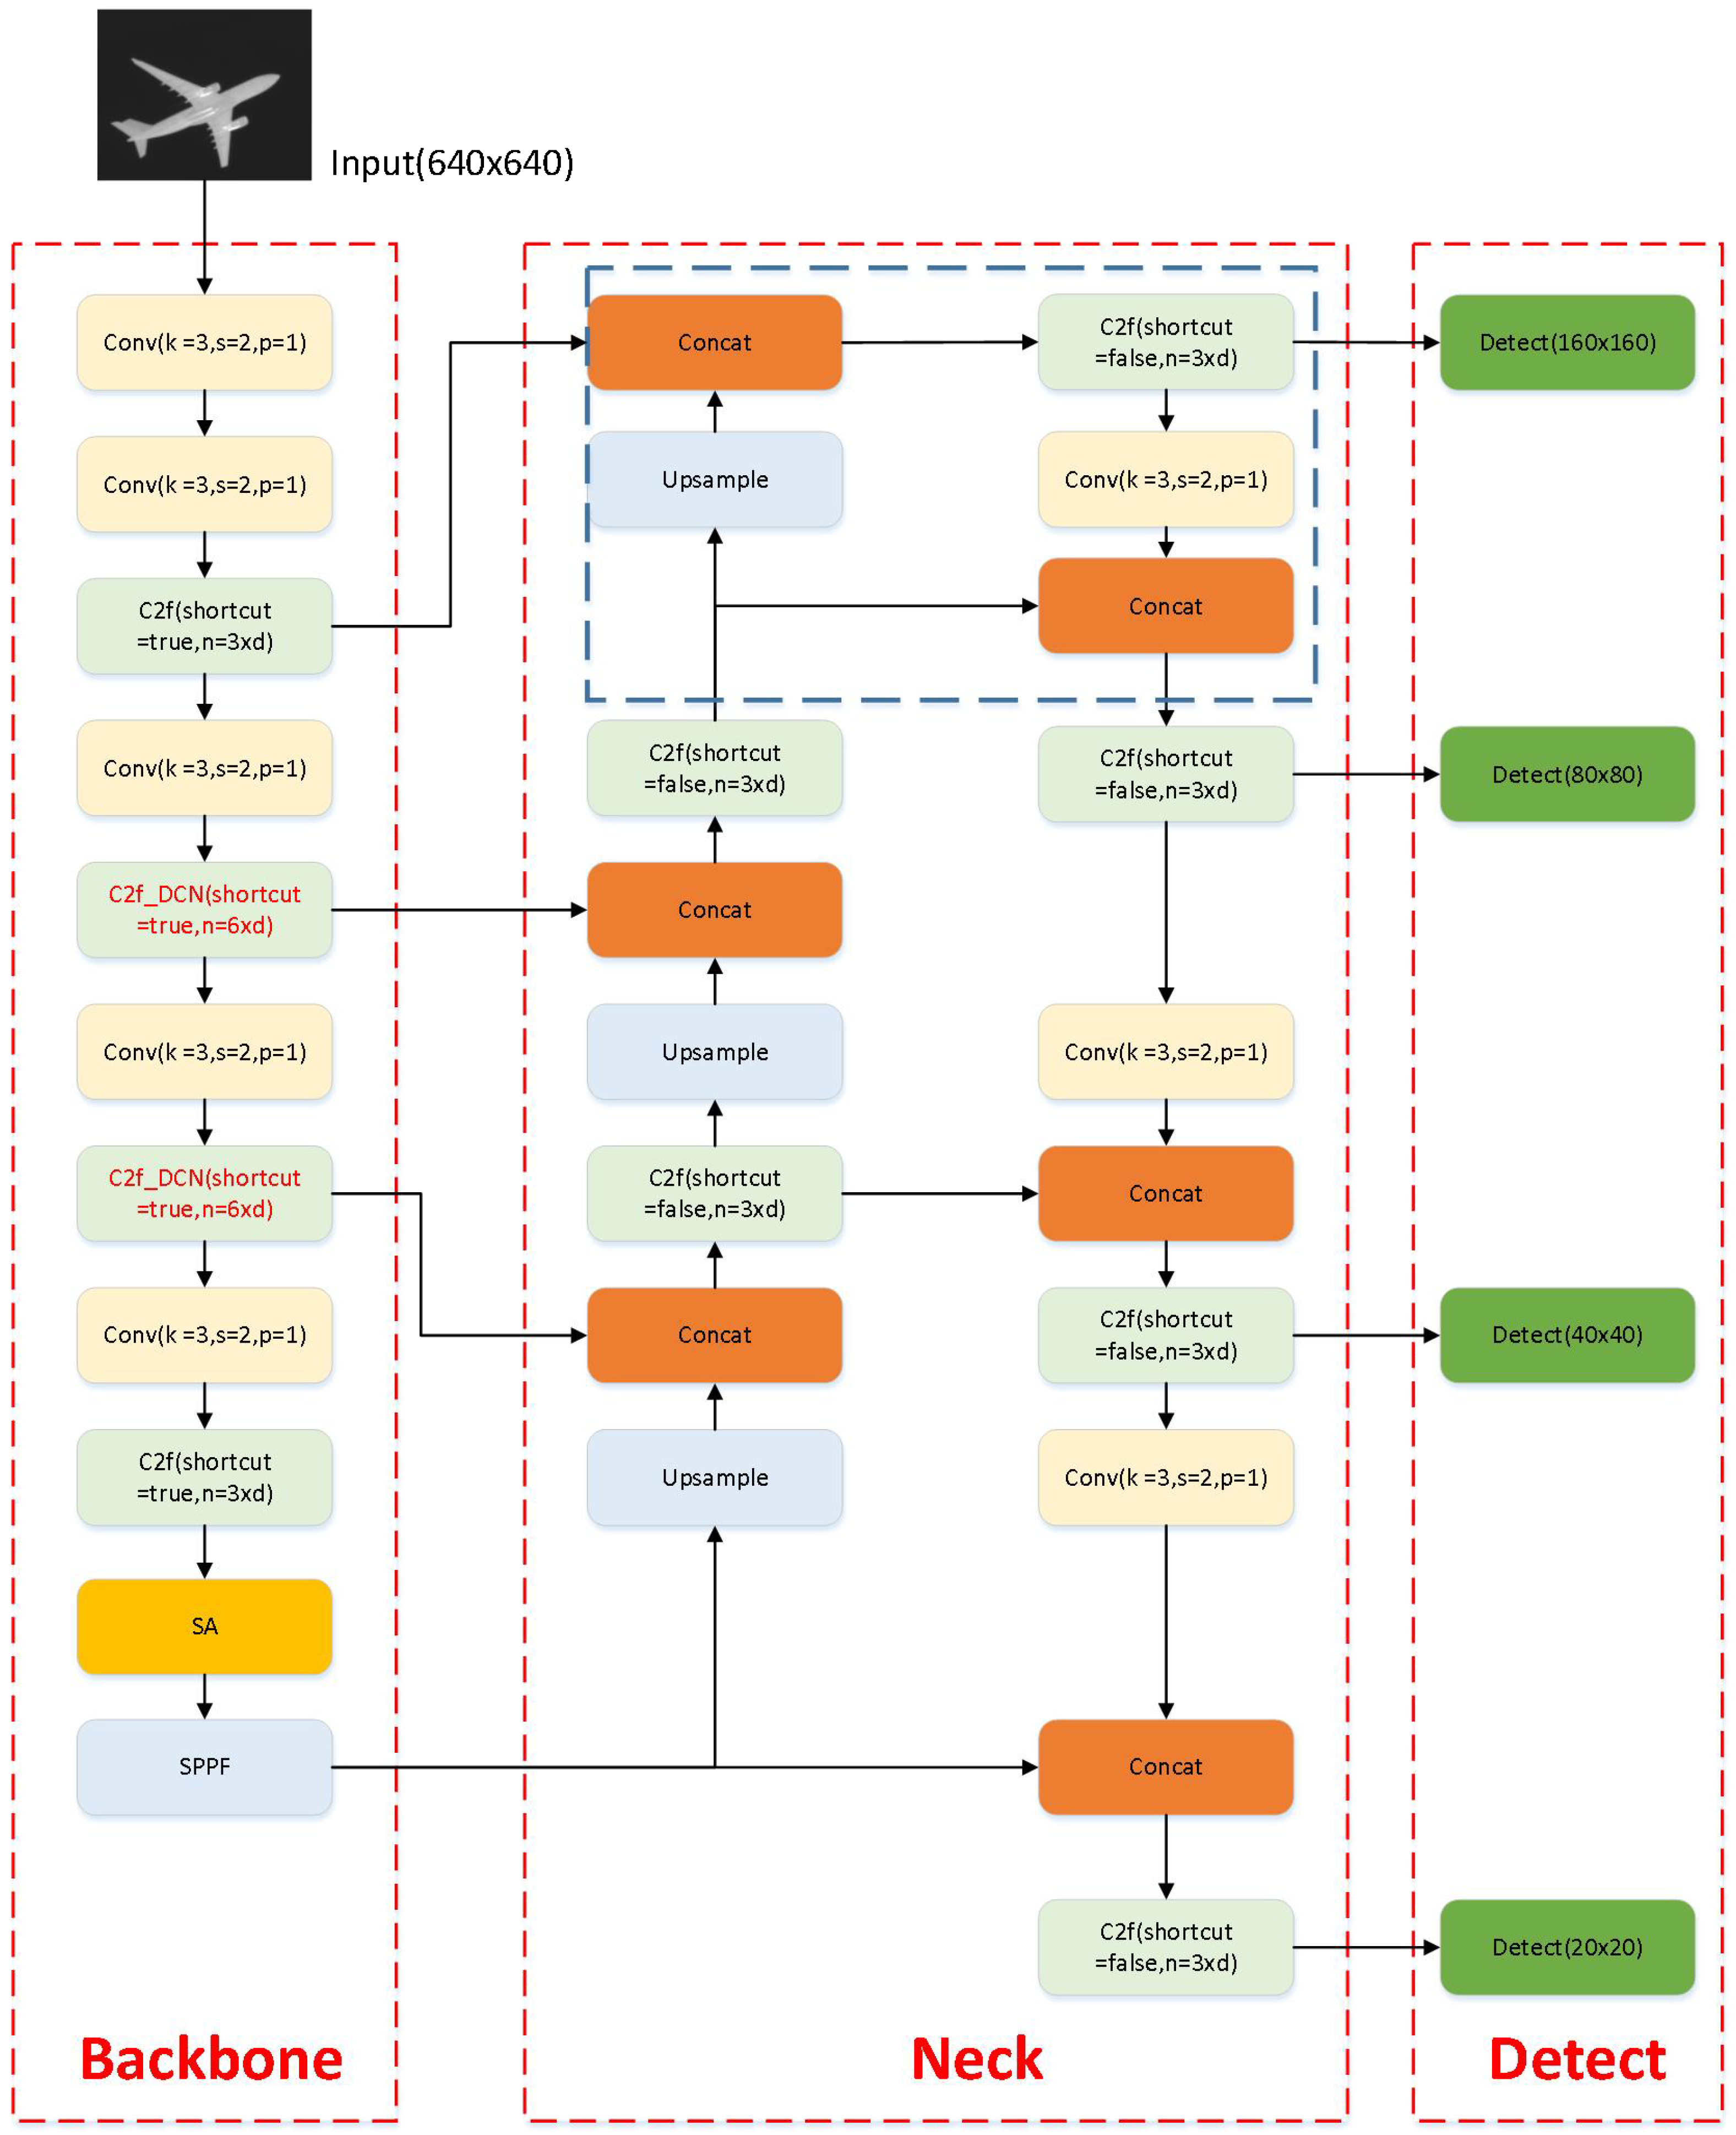
Through the above steps, we successfully add a small object detection layer to the YOLOv8 model and improve its performance in detecting small objects. However, the complexification of the network structure leads to increased computational costs and reduced real-time performance. The modified network model is illustrated in Figure 4, with the blue dashed lines indicating the modified modules.

2.3.3. Introduction of Deformable Convolutional Networks (DCNV4) into the Backbone Network

In object detection tasks, bounding boxes delineate the location of objects throughout the various stages of the detection pipeline. While bounding boxes are computationally convenient, they often provide a coarse approximation of an object’s shape and pose, failing to accurately capture the intricacies of irregularly shaped targets. Consequently, features extracted from the regular grid of bounding boxes can be significantly influenced by irrelevant information from background content or foreground regions, potentially degrading the quality of extracted features and subsequently affecting the classification performance of the detector. The introduction of deformable convolutions aims to enhance the adaptability of convolutional neural networks (CNNs) to irregularly shaped objects, broadening their receptive fields. Unlike traditional convolutions that operate on fixed rectangular receptive fields, deformable convolutions can adaptively adjust the shape and size of the receptive field according to the irregular shape of an object, thus improving the robustness of the model.
In this study, we integrate deformable convolution modules (DCN blocks) [36,37,38] into the backbone network of YOLOv8, driven by the following considerations: (1) The fixed weights of convolutional kernels result in identical receptive field sizes across different regions of an image, despite the fact that objects of varying scales or deformations may correspond to different locations in the feature map. Hence, the network requires the ability to adaptively adjust the receptive field for different objects. (2) During sampling, deformable convolutions are better aligned with the size and shape of objects, demonstrating greater robustness compared to conventional convolutions. (3) Small objects, due to their diminutive size and variable shapes, may be overlooked by traditional convolutions, potentially compromising the overall performance of the model.
In the YOLOv8 architecture, the backbone network serves as the fundamental component for extracting features from input images, enabling a deeper understanding and description of image content. The backbone network typically consists of multiple convolutional layers, employing diverse convolutional layer structures to extract hierarchical features. By fusing and integrating features from different levels, a more comprehensive and accurate representation of the image is achieved, ultimately leading to improved model performance.
Based on the aforementioned reasons, we opt to incorporate deformable convolution modules into the backbone network of YOLOv8. By adding deformable convolution modules, we aim to extract more detailed and nuanced image features, laying a solid foundation for subsequent feature fusion and predictions made by the detection head. As depicted in Figure 4, we replace the second-to-last and third C2f modules in the backbone network with deformable convolution modules, targeting the P3 and P4 detection layers. This approach enhances the model’s focus on medium and small objects. With the integration of deformable convolution modules, the receptive fields of small objects undergo adaptive changes, enabling the model to better adjust the regression parameters of prediction boxes, thereby increasing its attention to small objects and ultimately improving the overall performance of the model.

2.3.4. Image Enhancement Techniques

To address the issue of limited sample data in infrared image datasets for training the YOLOv8 model, this study implemented sample augmentation on the collected infrared image datasets primarily through data enhancement techniques. Data enhancement is a commonly used approach that generates new training data by applying a series of transformations and operations to the original dataset, thereby enhancing the model’s generalization capability and robustness.
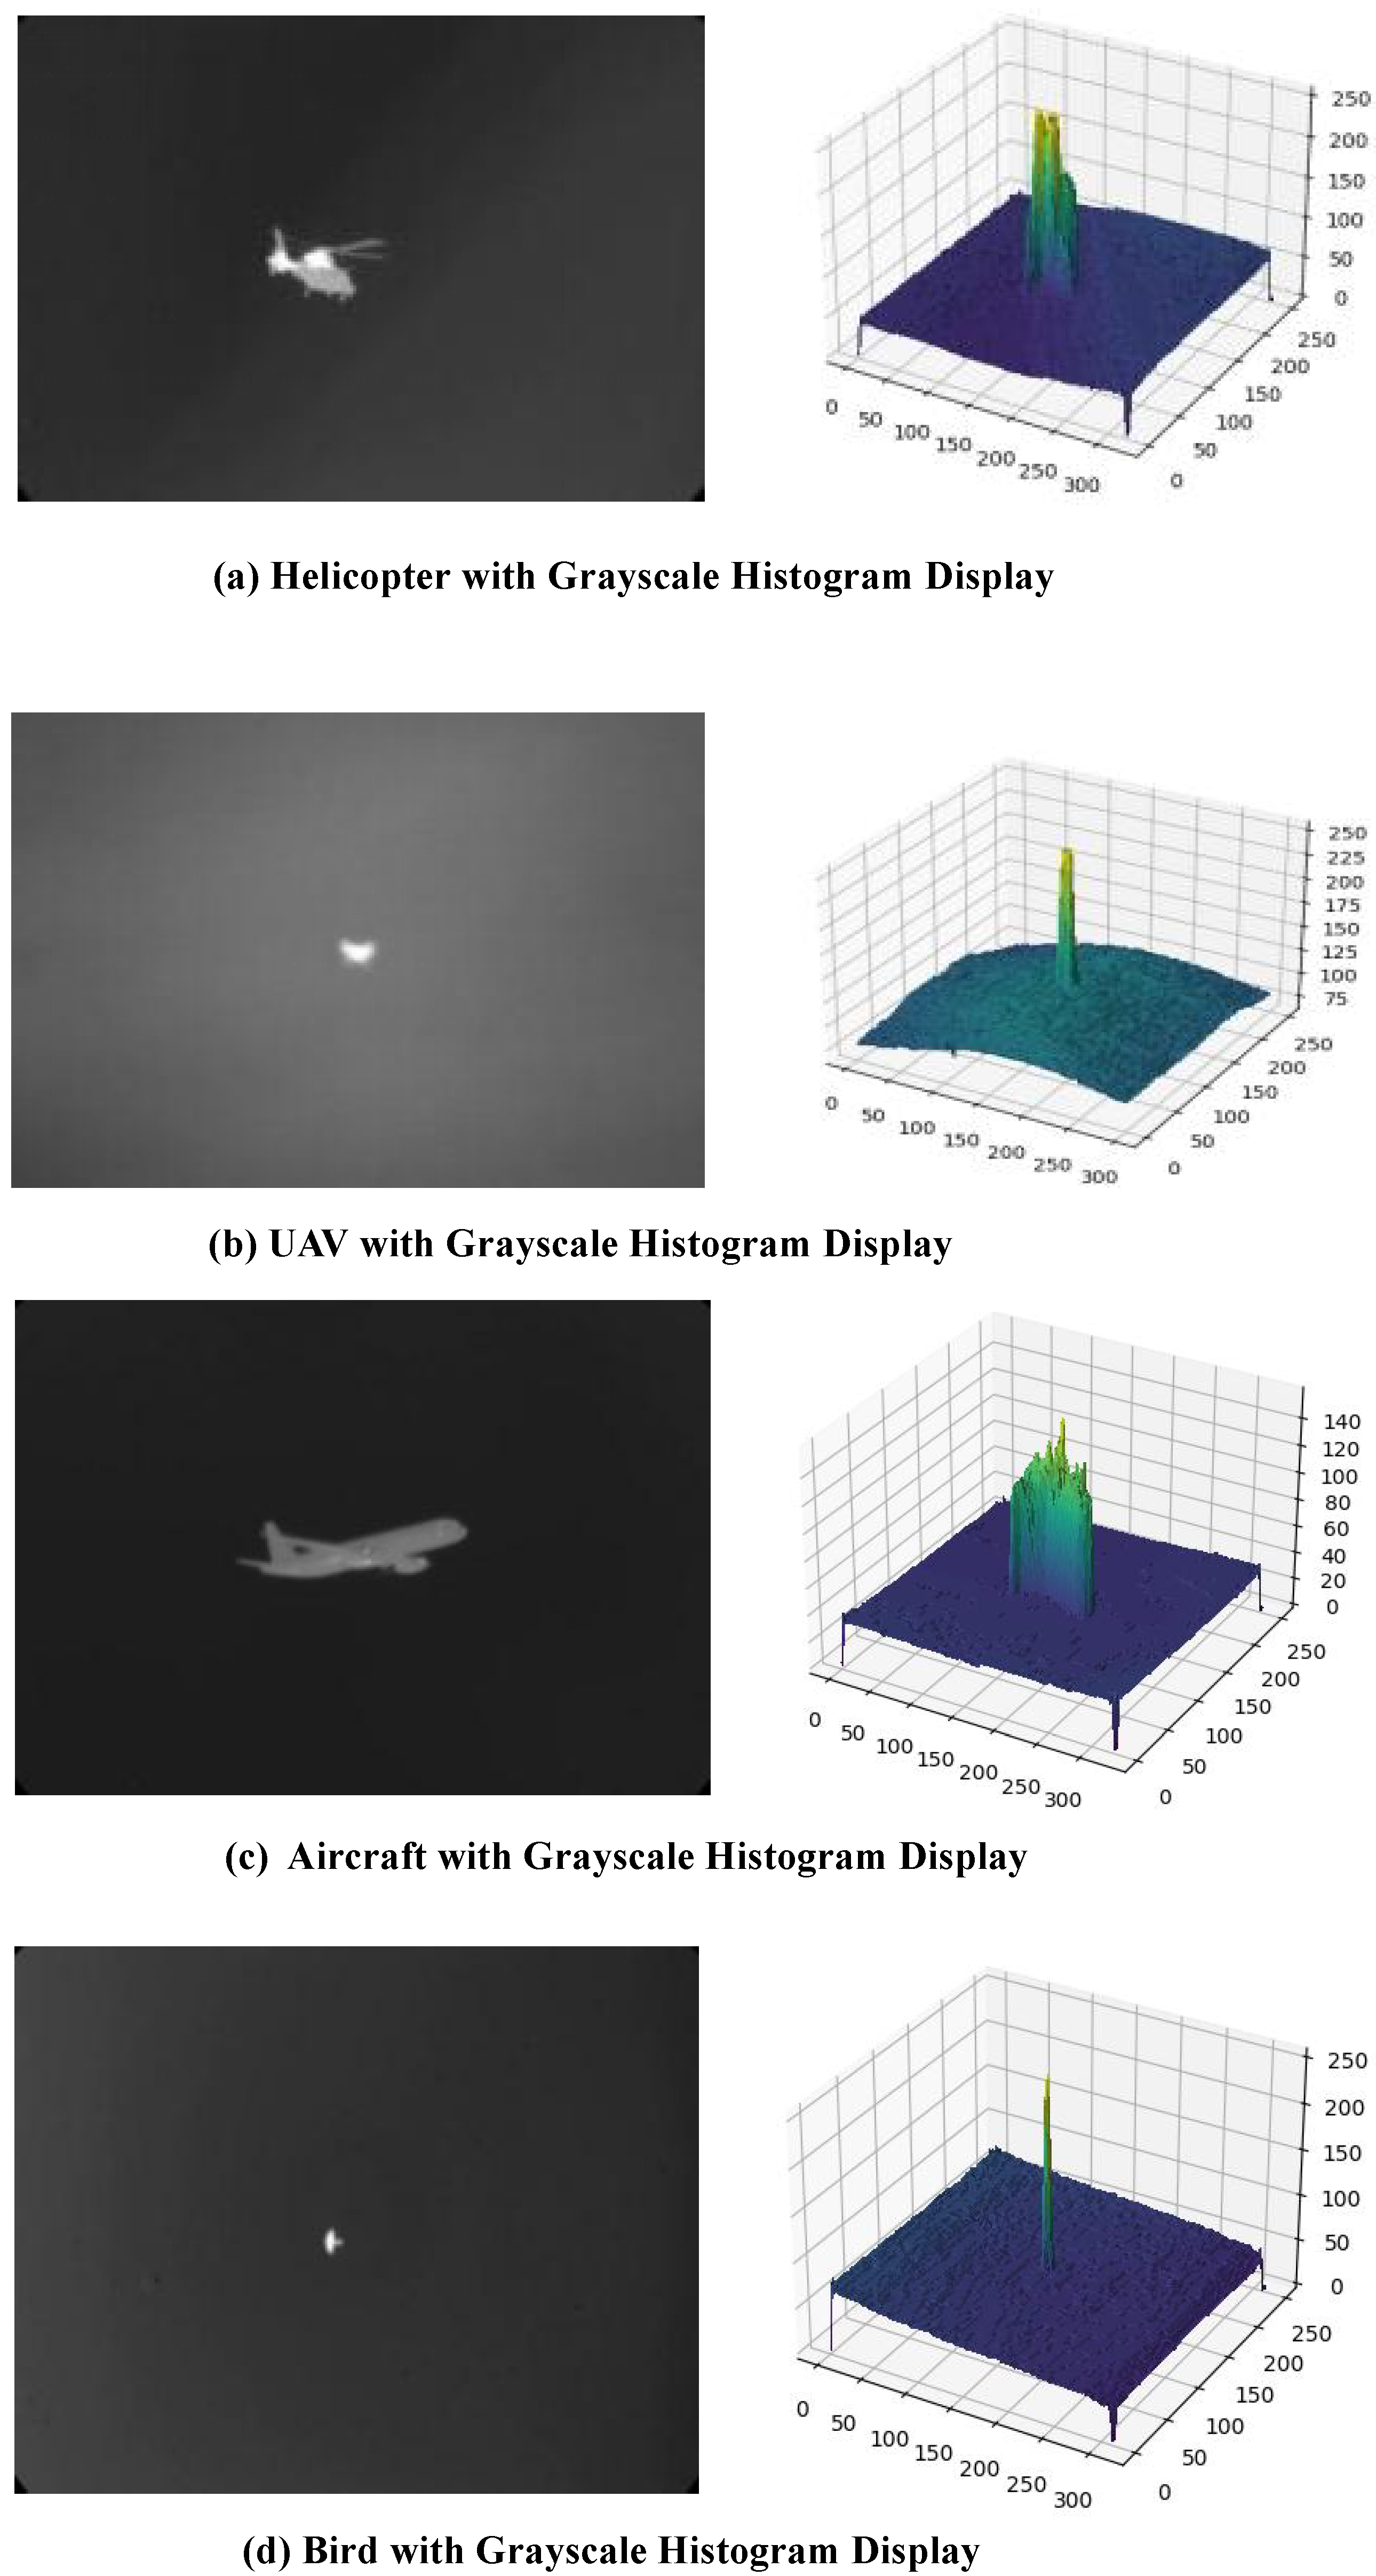
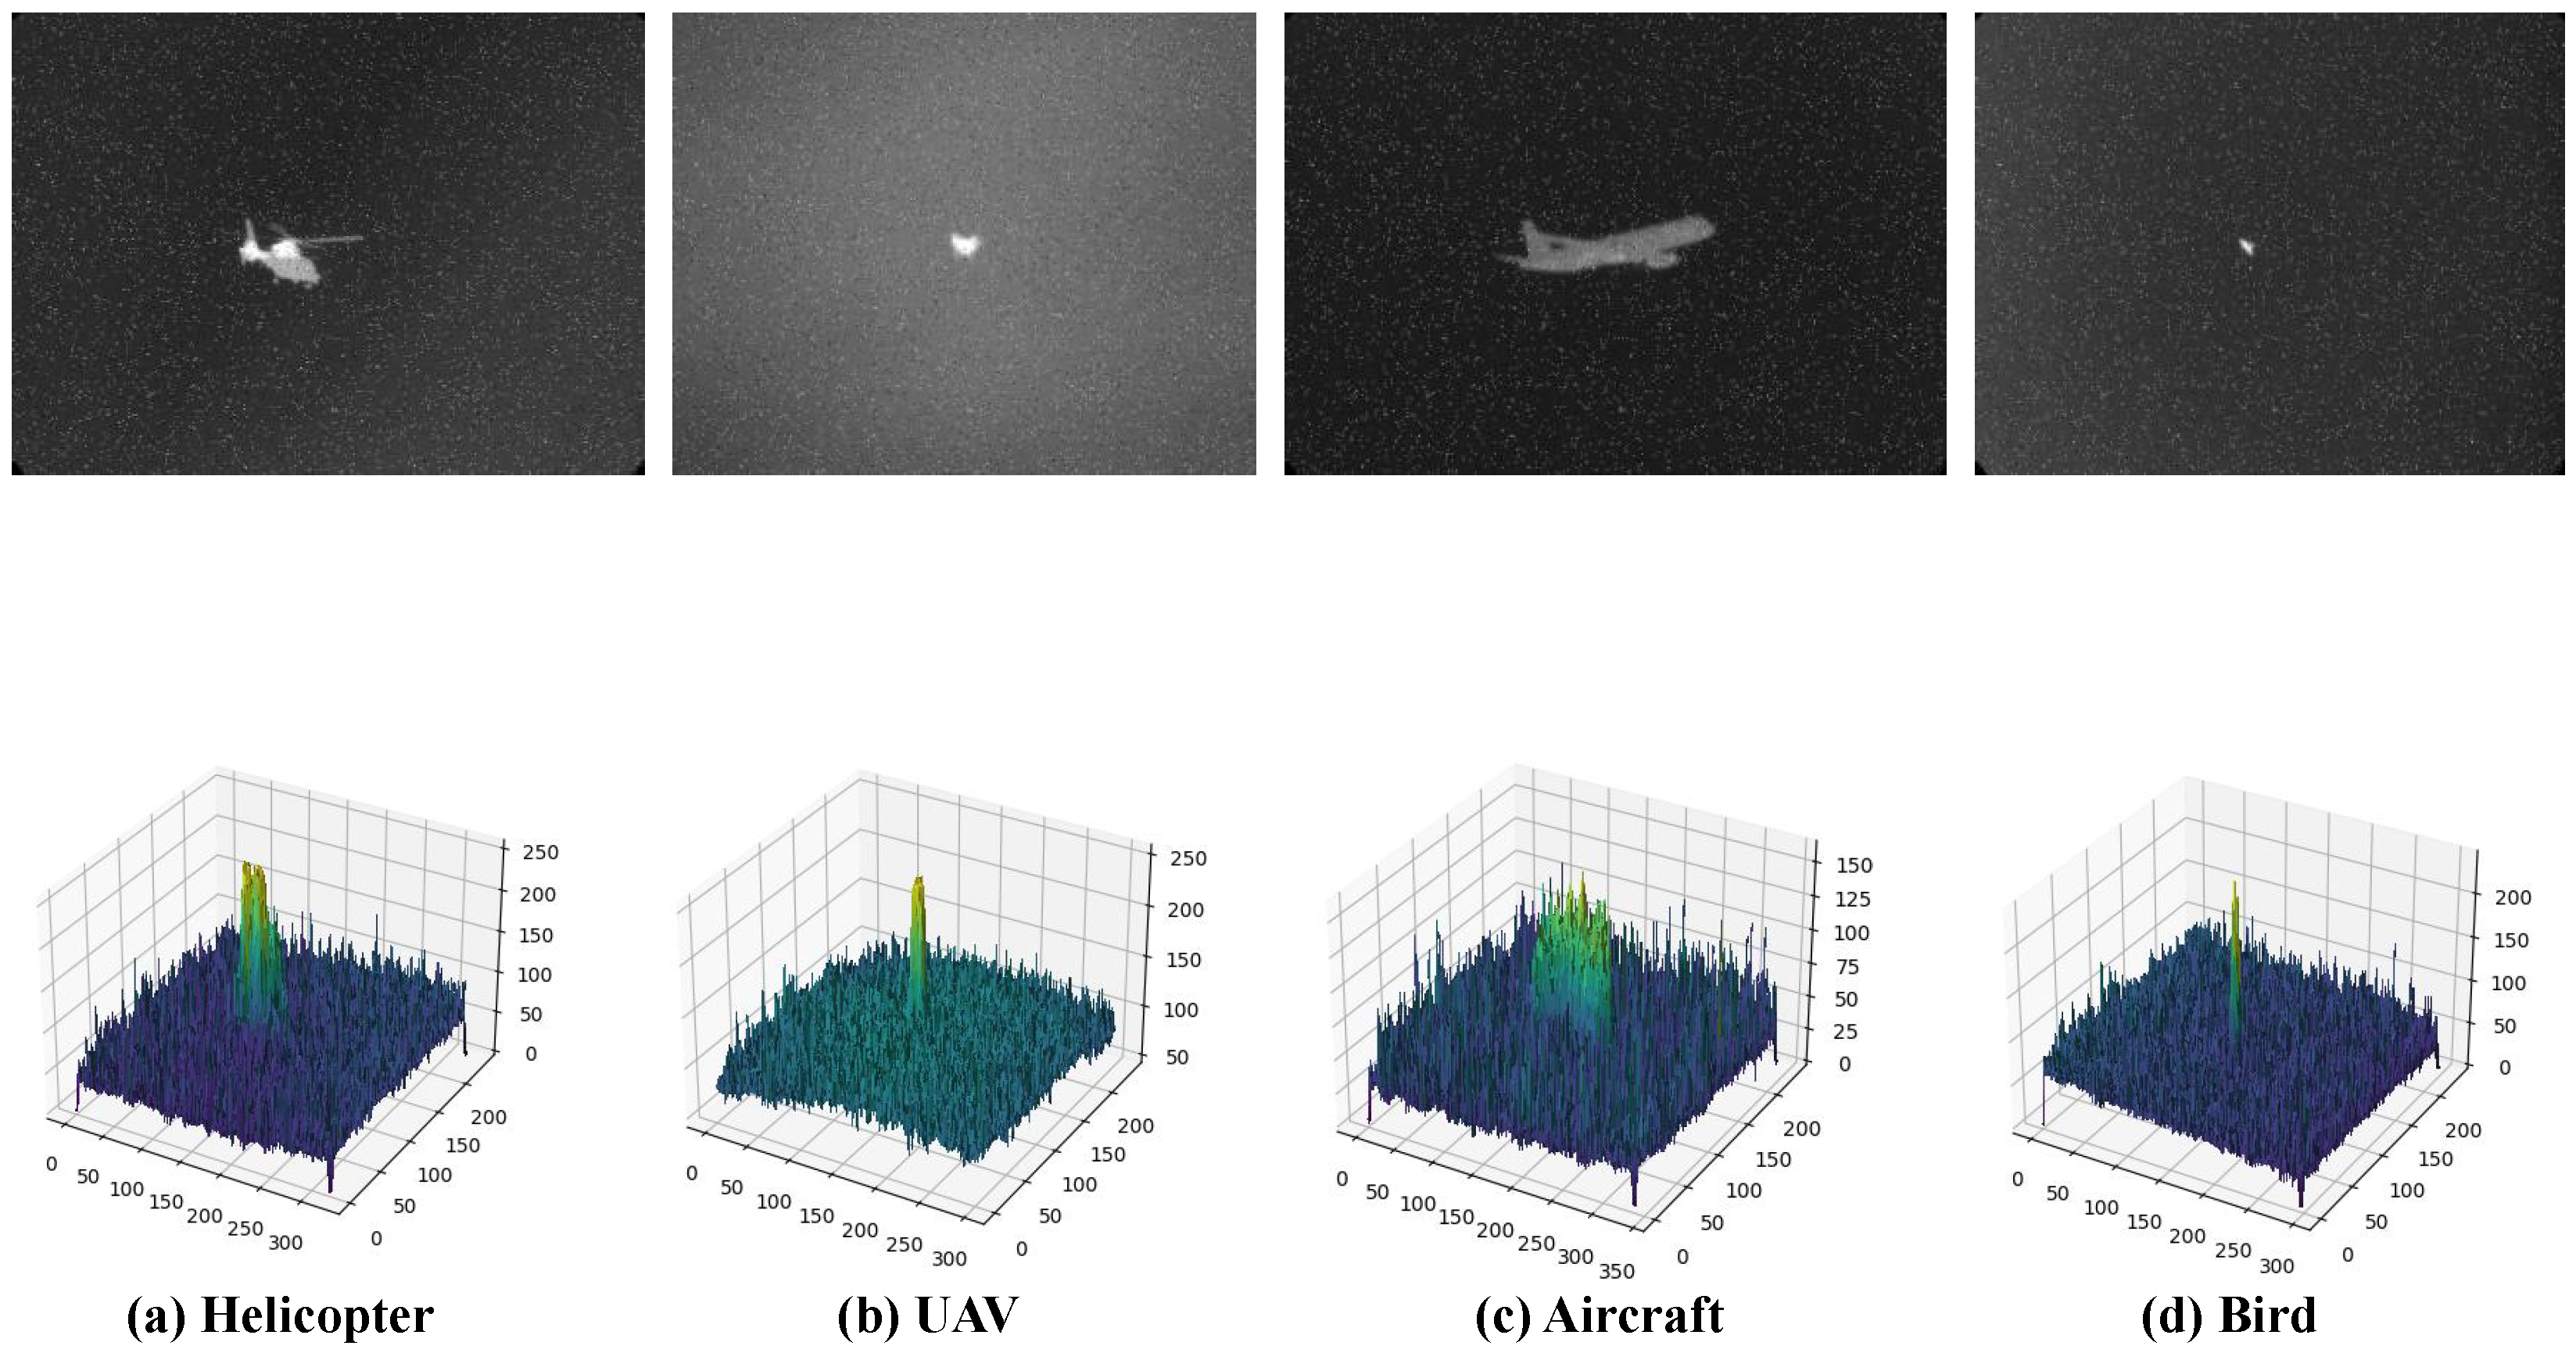
The limited number of samples in infrared image datasets often leads to overfitting or underfitting of the model. To mitigate this issue, we employed data enhancement techniques to expand the dataset. Specifically, we implemented three data enhancement methods: noise addition, image flipping, and image fusion. Figure 5 depicts the illustrative examples of helicopters, UAVs, civilian UAV aircraft, and birds along with their corresponding grayscale histograms.
Firstly, we introduced the method of noise addition. Noise refers to randomly distributed pixel values in an image, simulating real-world noise conditions and enhancing the model’s robustness. We added two types of noise to the original images: Gaussian noise and salt-and-pepper noise, with specific parameters adjusted according to the actual situation. Gaussian noise follows a normal distribution, while salt-and-pepper noise randomly replaces pixel values with 0 or 255.
Secondly, we introduced the method of image flipping. Image flipping increases the diversity of data and prevents overfitting of the model. We randomly selected horizontal or vertical flipping for this operation.
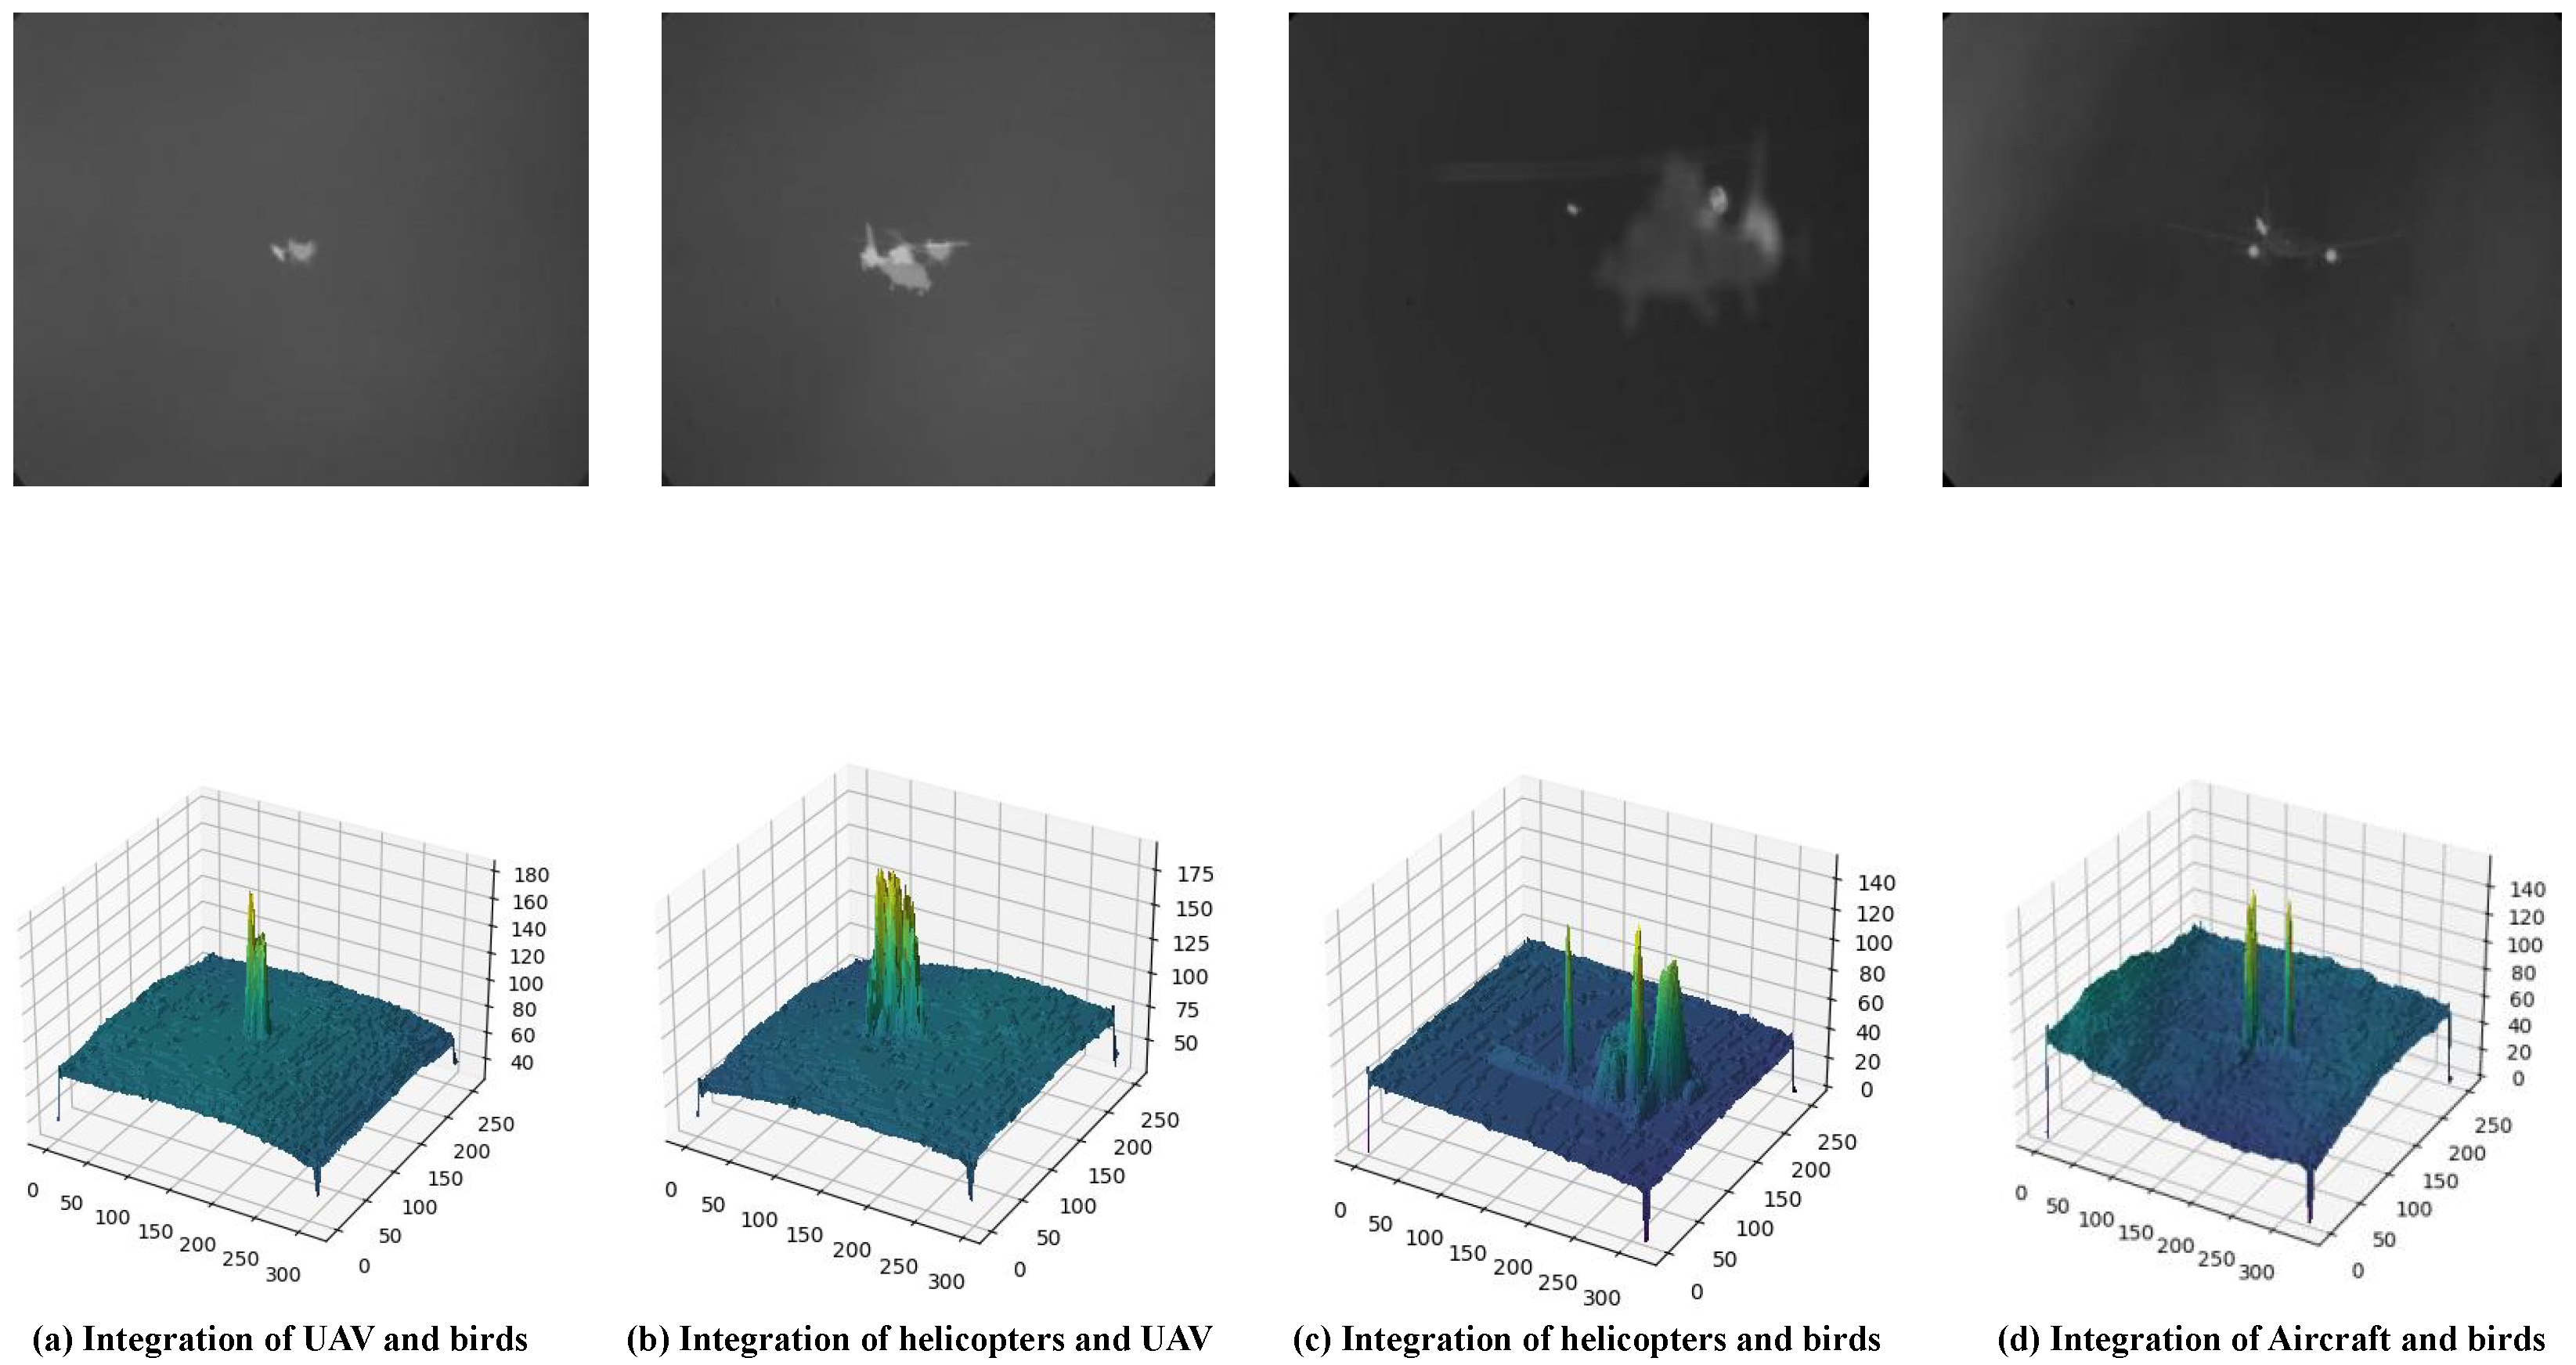
Lastly, we introduced the method of image fusion. Image fusion combines multiple images from different angles and distances into a single image, expanding the coverage of the dataset. We randomly selected two images for overlaying.
By applying these three data enhancement methods, we obtained a more diverse and enriched infrared image dataset. Subsequently, we utilized the YOLOv8 algorithm to train the expanded dataset for object detection tasks. YOLOv8, a deep learning-based object detection algorithm, can quickly and accurately detect target objects in images, outputting information such as their positions, categories, and confidence levels.
In this paper, we have adopted the following steps to perform sample augmentation on infrared image datasets:
1. Image Rotation: Randomly rotating the original images by a certain angle to enhance the diversity of the dataset. Figure 6 illustrates examples of 180° rotations.
2. Noise Superimposition:Applying Gaussian noise and salt-and-pepper noise to the original images to simulate real-world noise conditions. Figure 7 shows examples of images with salt-and-pepper noise.
3. Image Fusion: Selecting infrared images from different angles and distances to fuse into new composite images, thereby expanding the coverage of the dataset. Figure 8 demonstrates the fusion of different targets.
Through these sample augmentation methods, we have obtained a more diverse and enriched infrared image dataset. During the data enhancement process, we must maintain the authenticity and feasibility of the data. For instance, when adding noise, we should consider the noise types and intensities in real-world scenarios; when flipping images, we should avoid unreasonable object positions.
In summary, this paper utilizes data enhancement techniques to perform sample augmentation on infrared image datasets and employs the YOLOv8 algorithm for object detection. These methods can enhance the generalization capability and robustness of the model in practical applications, providing valuable insights for research and applications in the field of infrared image recognition.

2.3.5. Introduction of the WIoU_v3 Loss Function

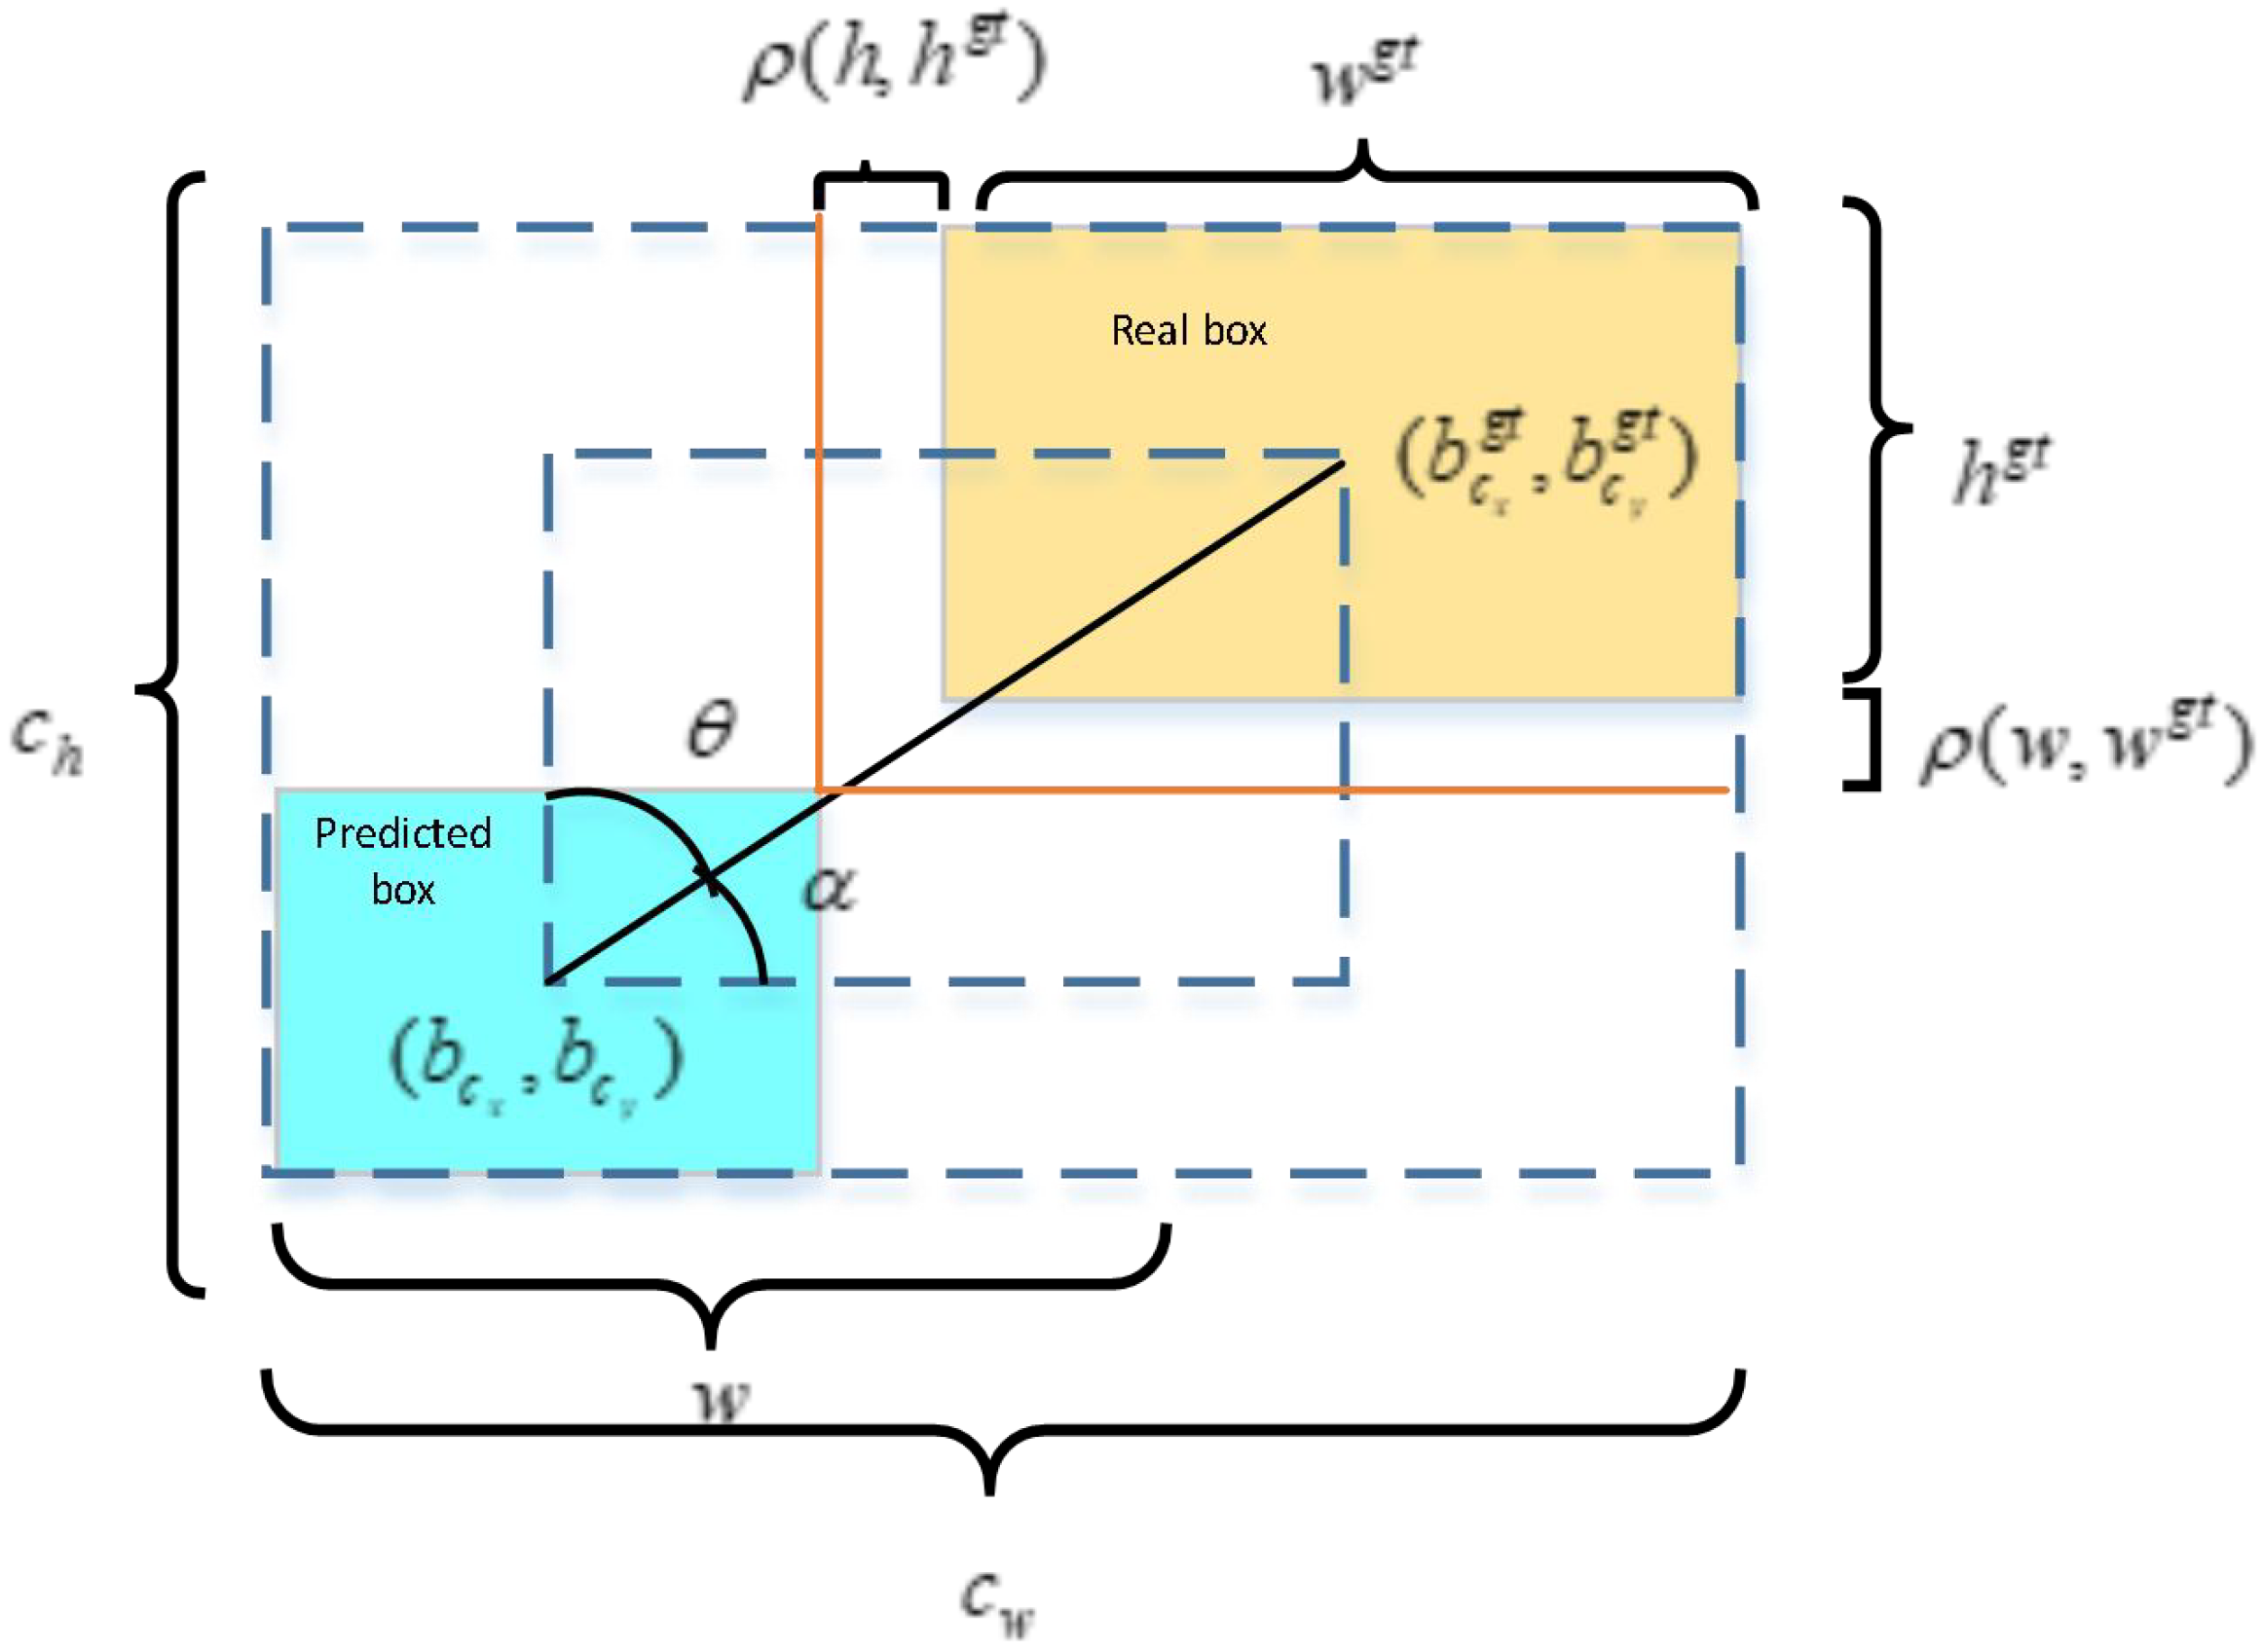
In the task of spatial infrared weak target detection, the detection difficulty is relatively high due to the feeble target signals and susceptibility to noise interference. Therefore, a reasonably designed loss function is crucial for improving the detection performance of the model. While DFL and CIoU are utilized in YOLOv8 to calculate the bounding box regression loss [39,40], CIoU exhibits significant shortcomings in dealing with spatial infrared weak targets. Firstly, CIoU does not fully consider the loss balance among different samples, which may lead the model to over-focus on certain samples while ignoring others during training. Secondly, the aspect ratio penalty term of CIoU fails to accurately reflect the difference between the predicted and ground-truth boxes, especially when the target shapes are complex and varied in spatial infrared images. Additionally, the computation of CIoU involves inverse trigonometric functions, increasing the computational complexity of the model. The formula of CIoU [41] is shown in Equation (1):
L C I o U = 1 I o U + ρ 2 b , b g t c w 2 + c h 2 + 4 π 2 tan 1 w g t h g t tan 1 w h
In Equation (1), we introduce the concept of IoU (Intersection over Union), which represents the ratio of the intersection to the union between the predicted and ground-truth boxes. This metric is a crucial parameter for measuring the degree of overlap between the predicted and ground-truth boxes. The equation involves several essential parameters, whose specific meanings are detailed in Figure 9. Specifically, p(b, bgt) denotes the Euclidean distance between the centers of the predicted and ground-truth boxes, reflecting their spatial proximity. Additionally, h and w represent the height and width of the predicted box, while hgt and wgt represent those of the ground-truth box. These parameters collectively describe the size information of the predicted and ground-truth boxes. Finally, ch and cw represent the height and width of the smallest enclosing box formed by the predicted and ground-truth boxes, providing necessary boundary information for calculating IoU. The precise definitions and calculations of these parameters are crucial for subsequent target detection tasks, enabling us to more accurately evaluate the performance of the model.
EIoU, an improvement based on CIoU, incorporates length and width as separate penalty terms, reflecting the differences in width and height between the ground-truth and predicted boxes, making its penalty term more reasonable compared to CIoU. The formula for EIoU [42] is presented in Equation (2):
L E I o U = 1 I o U + ρ 2 b , b g t c w 2 + c h 2 + ρ 2 w , w g t c w 2 + ρ 2 h , h g t c h 2
Equation (2),where some parameters involved in the equation are illustrated in Figure 9. Specifically, p(w, wgt) and p(h, hgt) represent the Euclidean distances in terms of width and height between the ground-truth and predicted boxes, respectively; while (cbx, cby), (gbty), and (c c) denote the coordinates of the center points of the ground-truth and predicted boxes, respectively.
SIoU pioneered the introduction of the angle between the predicted and ground-truth boxes as a penalty factor. Initially, the predicted box is quickly shifted towards the nearest axis based on the angle between it and the ground-truth box (as shown in Figure 9), and then retreats towards the ground-truth box. This approach reduces the freedom of regression and accelerates the convergence speed of the model.
The mainstream loss functions introduced above employ a static focusing mechanism, whereas WIoU not only considers the aspect ratio, centroid distance, and overlap area, but also introduces a dynamic non-monotonic focusing mechanism. WIoU utilizes a reasonable gradient gain allocation strategy to assess the quality of anchor boxes. Tong et al. [43] proposed three versions of WIoU: WIoU-v1, which adopts an attention-based design for the predicted box loss, and WIoU-v2 and WIoU-v3, which incorporate focusing coefficients.
WIoU-v1 introduces distance as a metric for attention. When the target box overlaps with the predicted box within a certain range, reducing the penalty for geometric measures enables the model to achieve better generalization ability. The calculation formulas for WIoU-v1 are shown in Equations (3)–(5).
L W I o U v 1 = R W I o U × L I o u
R W I o U = exp b c x g t b c x 2 + b c y g t b c y 2 c w 2 + c h 2
L I o U = 1 I o U
By constructing a monotonic focusing coefficient L, WIoU-v2 is applied to WIoU v1IoU, effectively reducing the weight of simple examples in the loss value. However, considering that LIoU decreases during model training, leading to slower convergence, an average LIoU is introduced to normalize L I o U * . The formula for WIoU-v2 is presented in Equation (6).
L W I o U v 2 = ( L I o U * L I o U ¯ ) γ L W I o U v 1 , γ > 0
WIoU-v3 defines an outlier value β to measure the quality of anchor boxes. Based on β, a non-monotonic focusing factor r is constructed and applied to WIoU-v1. A smaller β value indicates a higher quality of anchor boxes, resulting in a smaller r and thus a higher weight for high-quality anchor boxes in the loss function. Conversely, a larger β value signifies lower anchor box quality, leading to reduced gradient gain and mitigating the harmful gradients generated by low-quality anchor boxes. WIoU-v3 employs a rational gradient gain allocation strategy that dynamically optimizes the weights of high- and low-quality anchor boxes in the loss, enabling the model to focus on average-quality samples and enhancing its overall performance. The equations for WIoU v3 are presented in Equations (7)–(9). The hyperparameter a in Equations (6) and (8) can be adjusted to suit different models.
R W I o U = exp b c x g t b c x 2 + b c y g t b c y 2 c w 2 + c h 2
γ = β δ α β δ
β = L I o U * L I o U ¯ [ 0 , )
After a thorough comparison of various mainstream loss functions, we ultimately decided to introduce WIoU-v3 into the object bounding box regression loss of the YOLOv8 model. This choice is primarily based on two considerations. Firstly, WIoU-v3 seamlessly integrates the strengths of previous loss functions like EIoU and SIoU. It not only comprehensively considers crucial factors such as aspect ratio, centroid distance, and overlap area, but also introduces a dynamic non-monotonic focusing mechanism, rendering the loss function design more robust and innovative.
Secondly, WIoU-v3 exhibits significant advantages for the specific requirements of spatial infrared weak target detection tasks. In infrared imaging, weak targets often have feeble signals and are prone to noise interference, making accurate detection exceptionally challenging. The dynamic non-monotonic mechanism of WIoU-v3 dynamically adjusts the loss weights based on the quality of anchor boxes, enabling the model to pay more attention to those average-quality yet crucial anchor boxes during training. This, in turn, enhances the model’s ability to locate weak targets.
Therefore, we chose to incorporate WIoU-v3 into the loss function of the YOLOv8 model, aiming to improve the detection accuracy and stability when dealing with spatial infrared weak target detection tasks, thereby better satisfying the demands of practical applications.

3. Experimental Results and Analysis

3.1. Experimental Introduction

This section first introduces the dataset used in this paper, then gives a description of the experimental foundation and settings, and finally, describes the evaluation metrics related to the experimental results.

3.1.1. Dataset

We constructed an infrared image dataset using real infrared data, which comprises a total of 25,000 images covering four categories: civil aviation, unmanned aerial vehicles (UAVs), birds, and helicopters. During the experimental process, we divided the dataset into a training set, a validation set, and a test set in a 7:2:1 ratio.
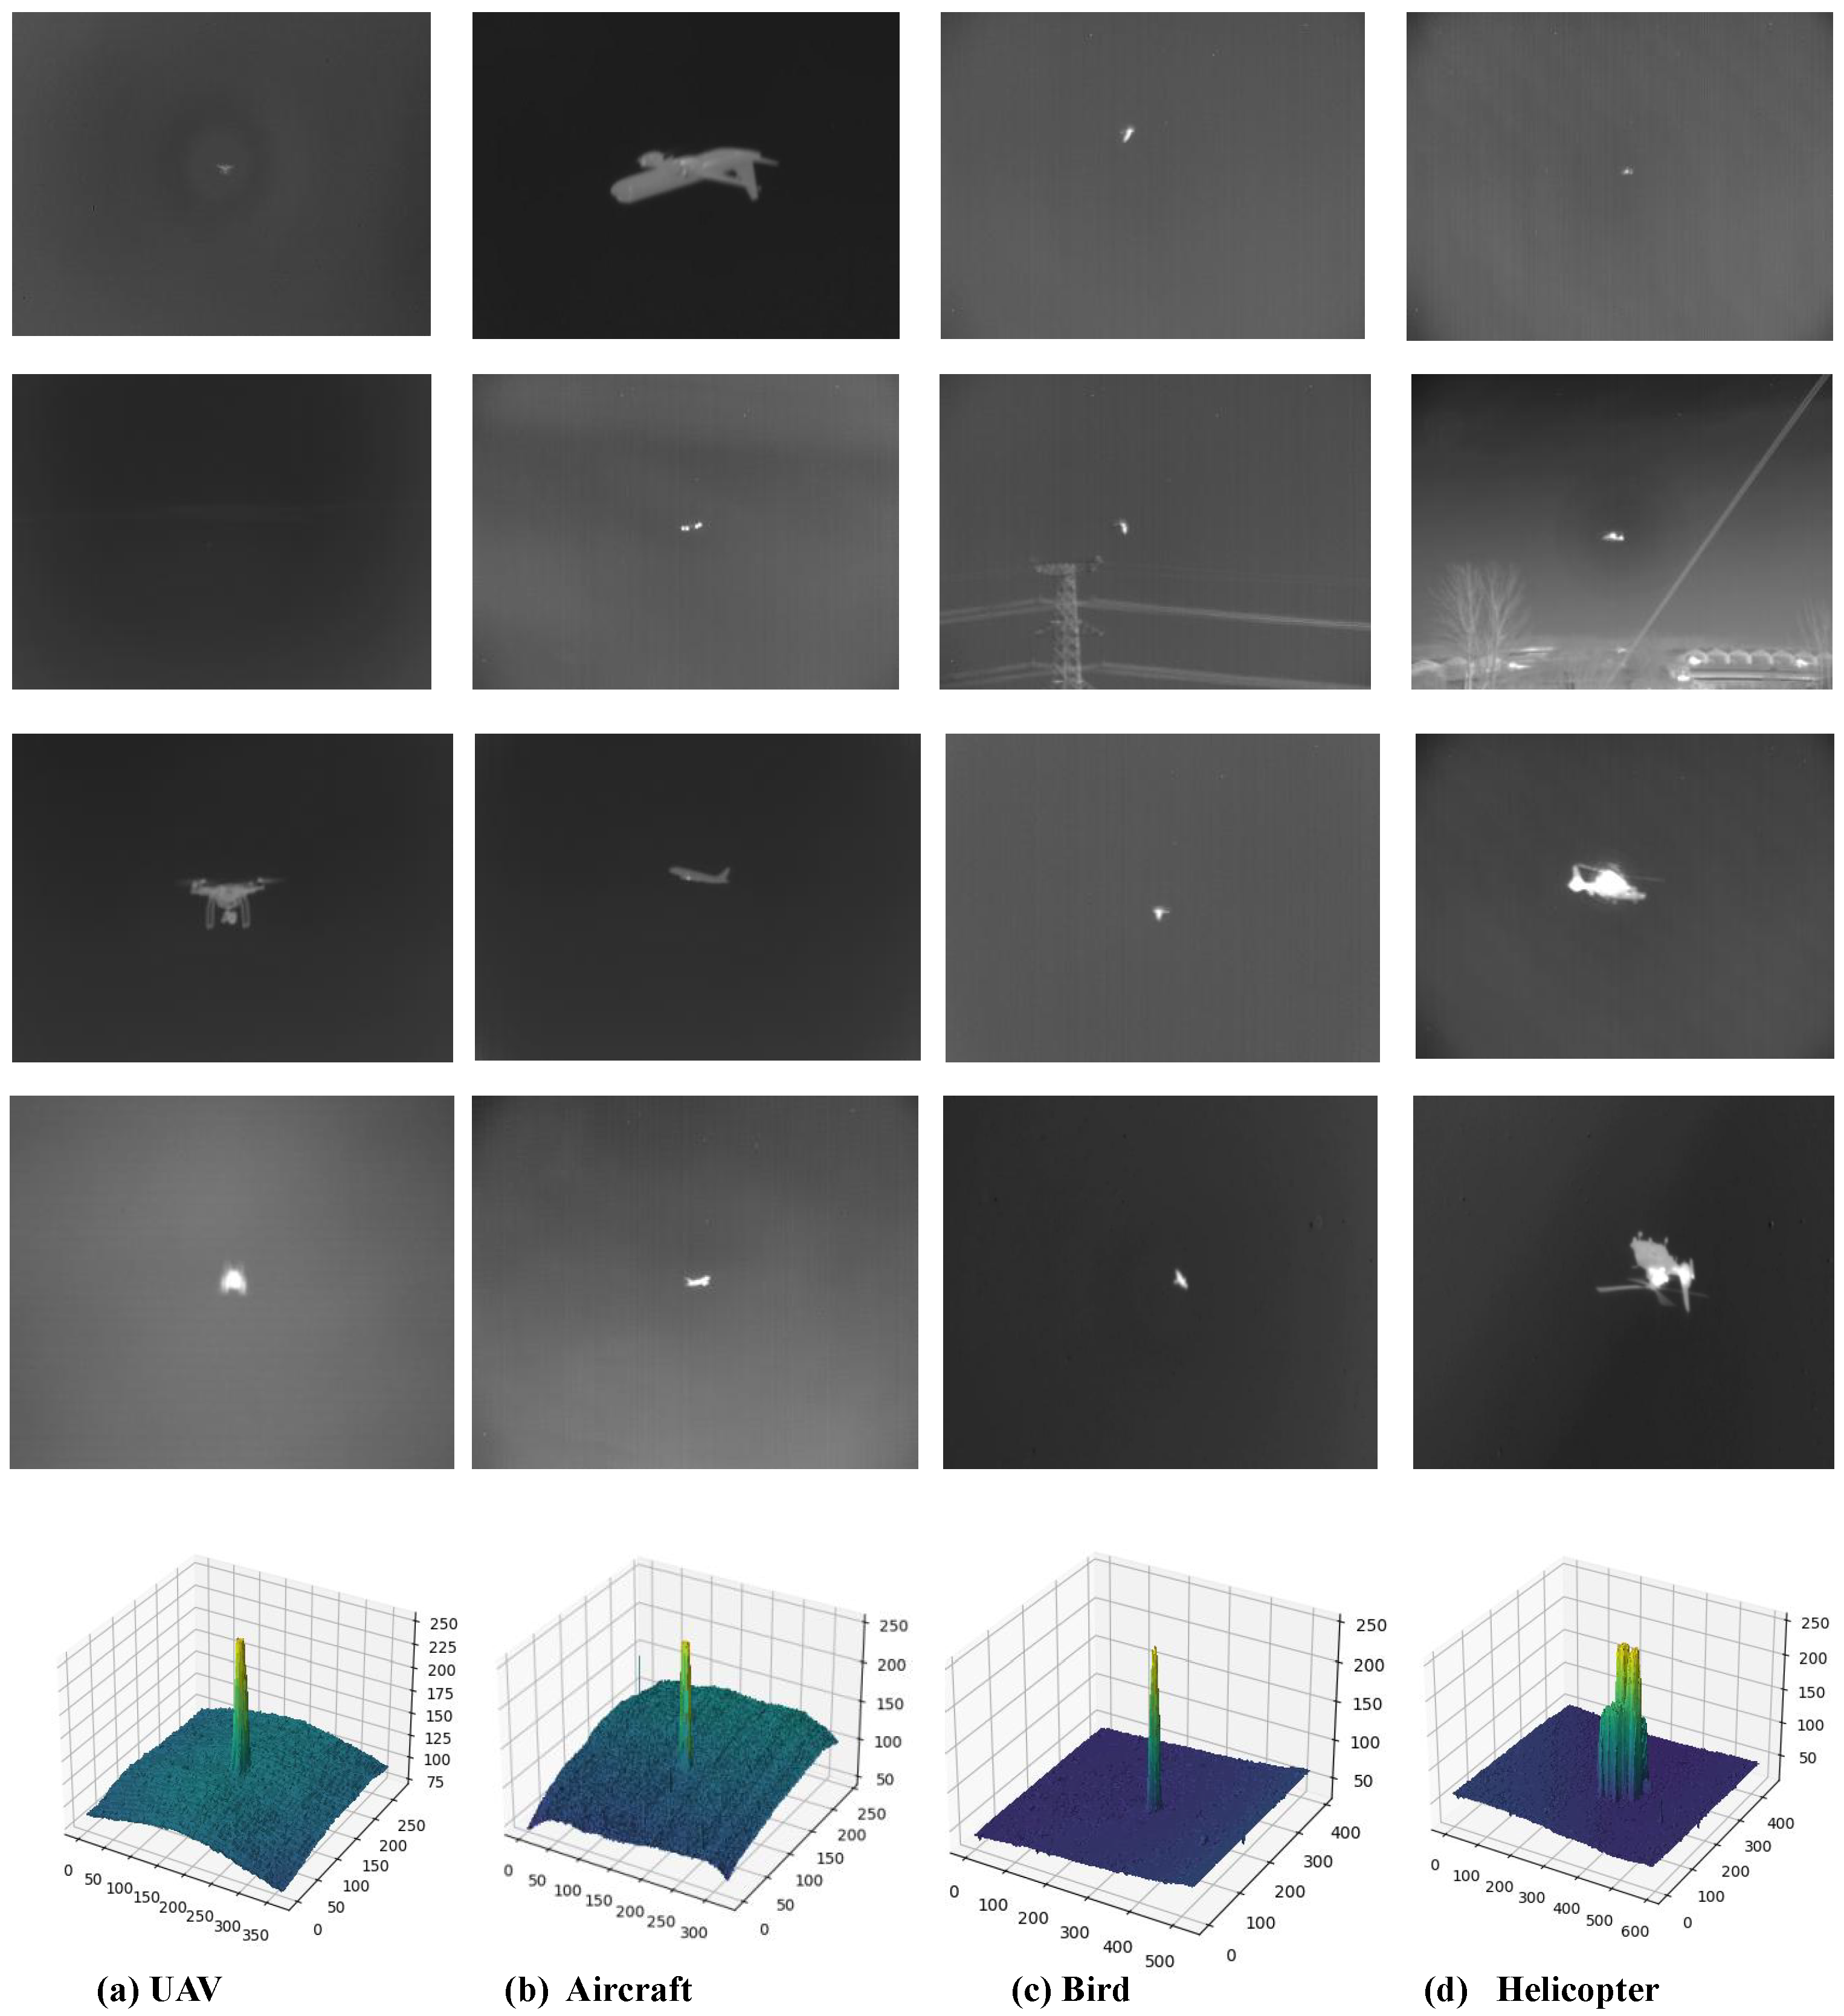
The primary experimental workflow is as follows: First, target data were collected using an infrared measurement prototype, and an image was captured every 40 frames from the video clips. Subsequently, data augmentation techniques such as noise addition, image flipping, and image fusion were applied to the captured images. Then, the augmented image dataset underwent preprocessing and annotation. Figure 10 comprehensively displays representative images from the spatial infrared weak target dataset, accompanied by average grayscale distribution maps for each detected target. These images not only intuitively reflect the complexity and challenges posed by infrared weak targets in the spatial environment but also, through the average grayscale maps, provide an insightful glimpse into the radiation characteristics and contrast differences of each target in the infrared spectrum. This serves as invaluable data support and an analytical foundation for the subsequent optimization of target detection and recognition algorithms.
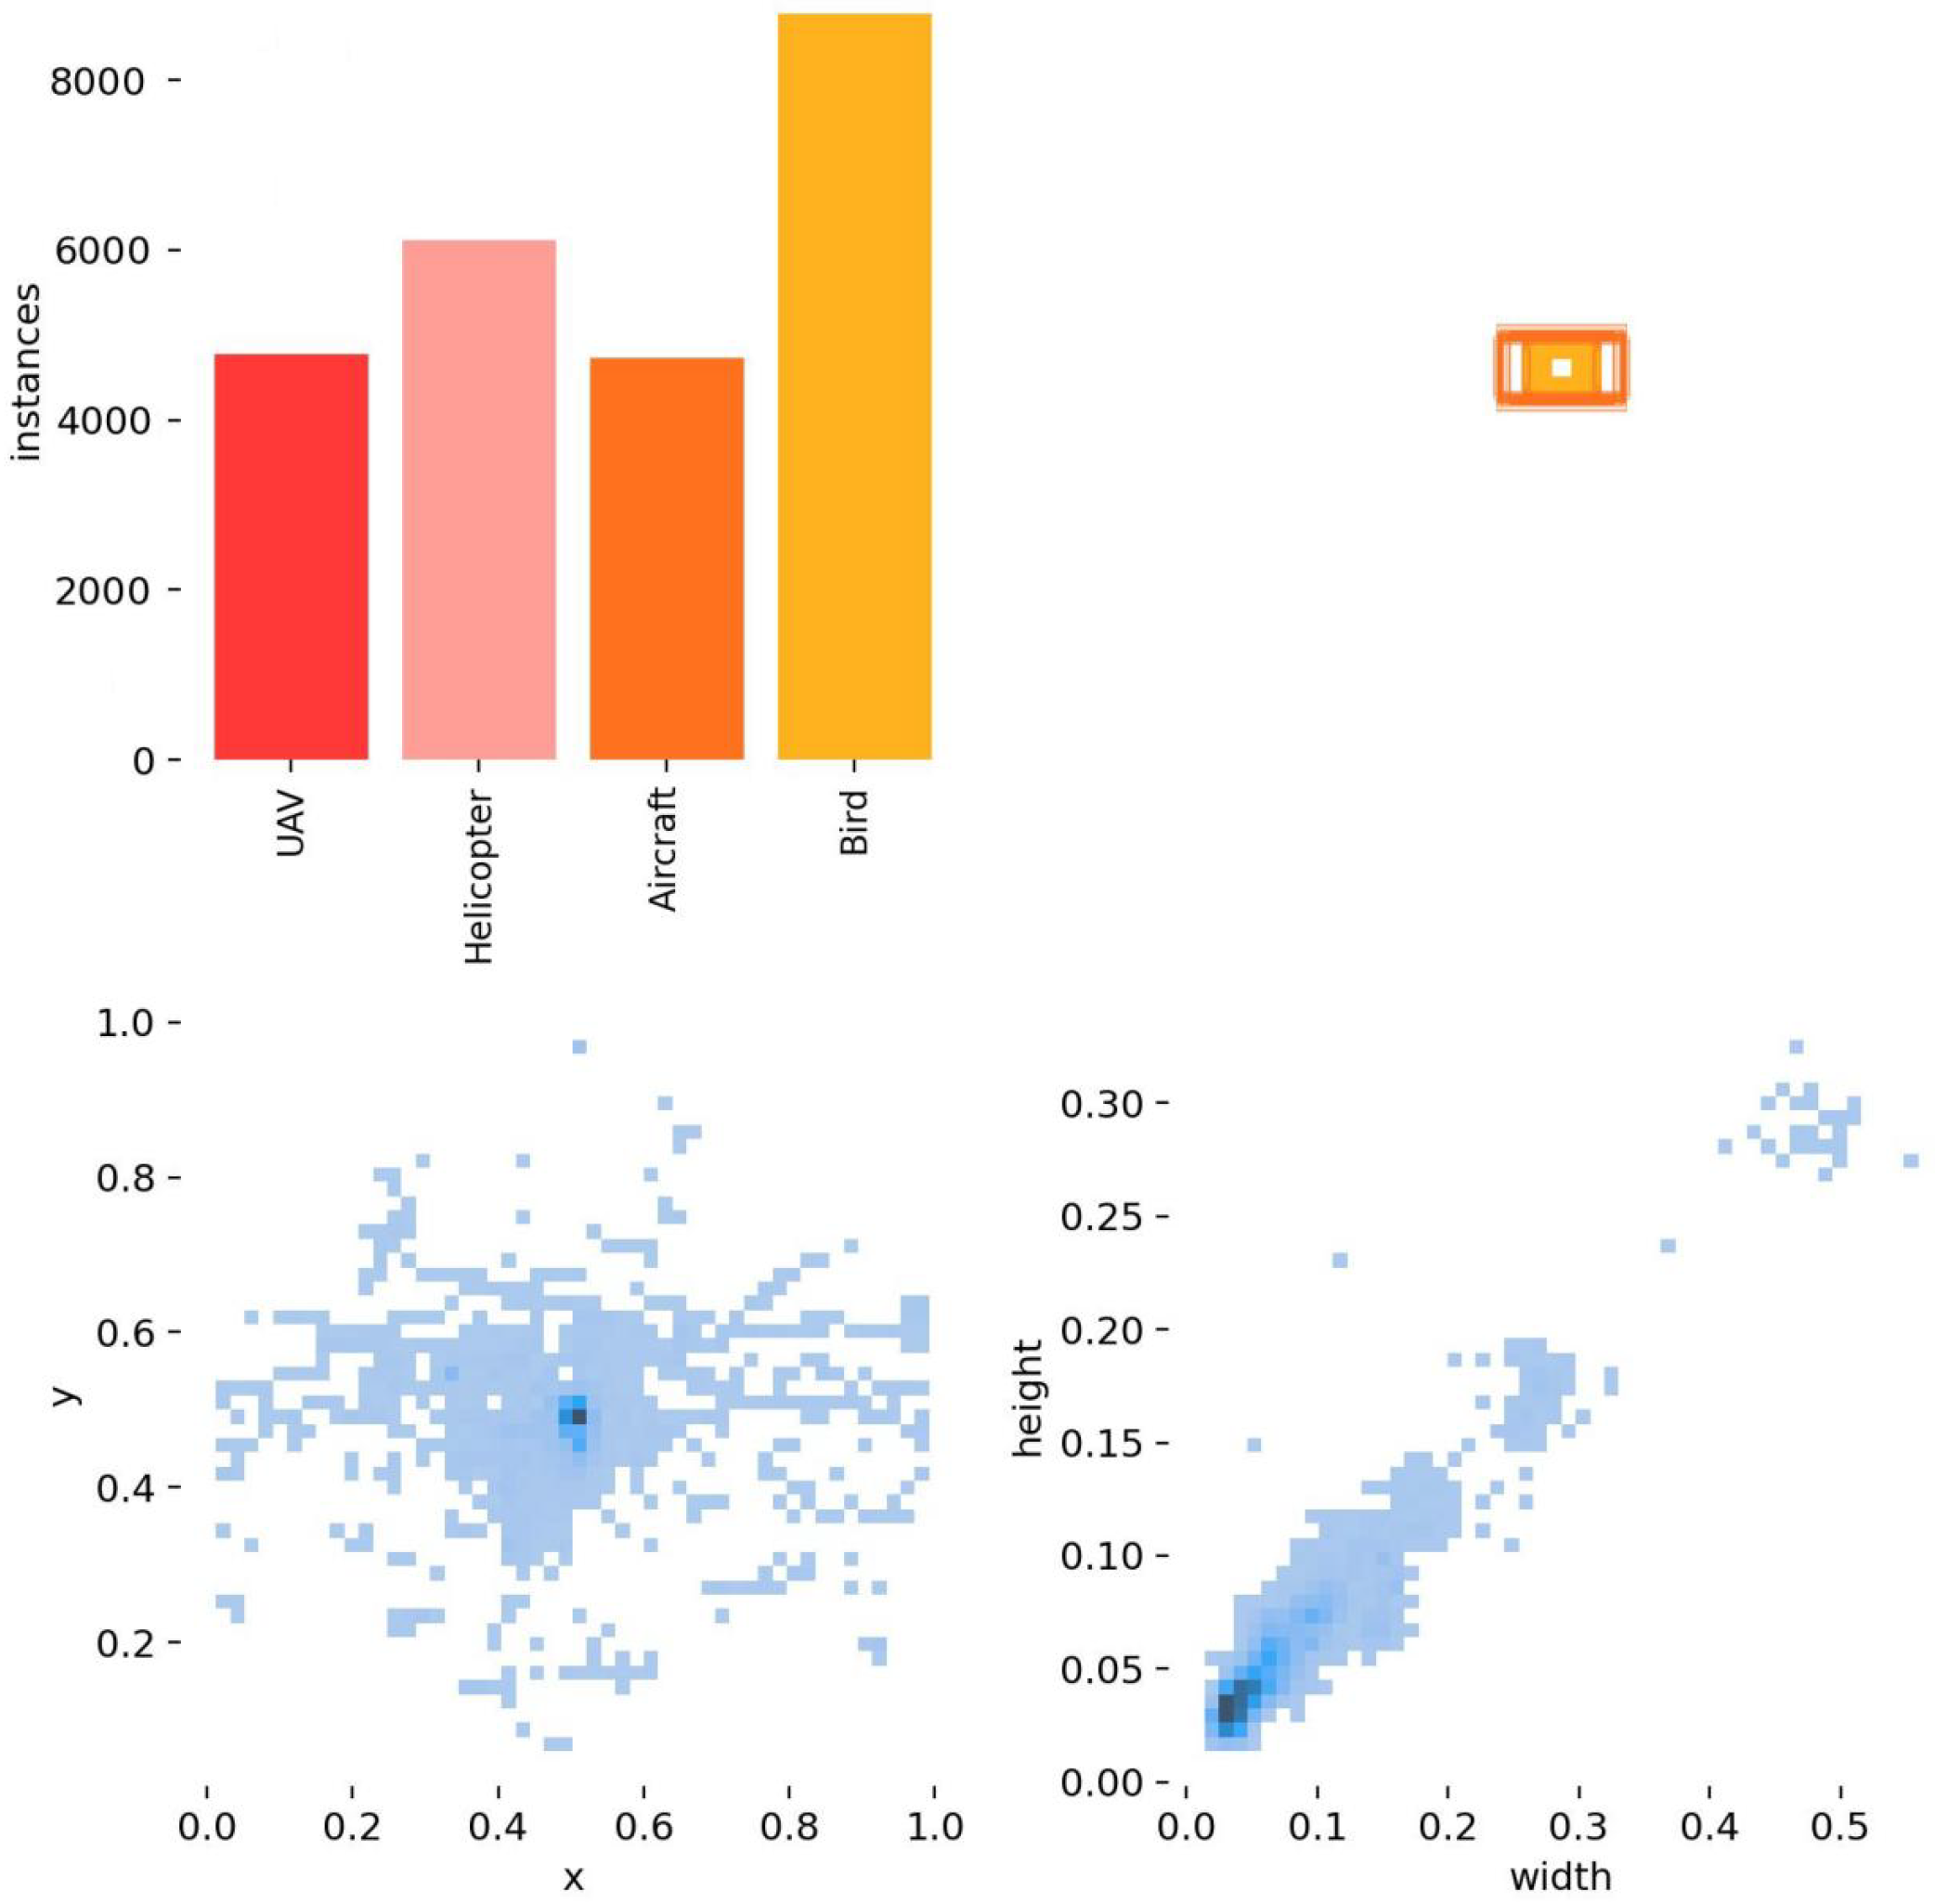
The dataset encompasses four different types of aerial infrared weak targets, including UAVs, helicopters, civil aviation aircraft, and birds. Figure 11 illustrates the details of the dataset. The top of the figure shows the sample count for each target category in the data. The bottom left of the figure depicts the size of the object bounding boxes in the dataset, indicating that the dataset contains a large number of infrared small targets. The bottom right of the figure represents the coordinate distribution of the center points of the object bounding boxes, revealing that small targets are primarily concentrated in the center of the images, with a relatively high distribution around the edges. The fourth figure is a scatter plot of the widths and heights of the annotated object bounding boxes in the dataset. By observing the last figure, it can be seen that the darkest region is in the lower left corner, further indicating that the current dataset is dominated by small target objects.

3.1.2. Experimental Basis and Settings

The experiments were conducted under the Ubuntu 20.04 TLS operating system environment, utilizing an Intel I7-8700M CPU as the computational core. Image processing was based on the OpenCV 3.4 library, while the training and testing of the deep learning model were implemented using the Python 3.6 programming language and the PyTorch deep learning framework. To accelerate the computational process, a high-performance GeForce RTX 4080 Ti GPU was selected.
The experimental design primarily focused on the following key components:
  • The introduction of the Shuffle-Attention (SA) detection module, aiming to enhance the model’s recognition ability for complex targets by improving the feature extraction and integration mechanisms.
  • The design and integration of a dedicated detection layer for small and weak targets, to enhance the model’s detection performance for small targets in complex backgrounds.
  • The incorporation of the deformable convolution DCNV4 module to address detection challenges posed by targets in complex backgrounds and with deformations.
  • The adoption of the optimized WIoU-v3 loss function for model training, aiming to improve the model’s accuracy in locating target boundaries.
  • After integrating all the aforementioned improvement measures, we meticulously constructed and deployed the optimized MY-YOLOv8 model (with a special emphasis on MY-YOLOv8, as it is a newly introduced, advanced model designed specifically for object detection tasks in this paper). Subsequently, we applied the improved MY-YOLOv8 model for object detection and conducted thorough performance evaluations to validate its effectiveness.
Additionally, to visually demonstrate the model’s target localization capabilities, an in-depth visualization analysis was conducted, intuitively presenting the model’s decision-making basis and performance during the detection process.

3.1.3. Evaluation Metrics

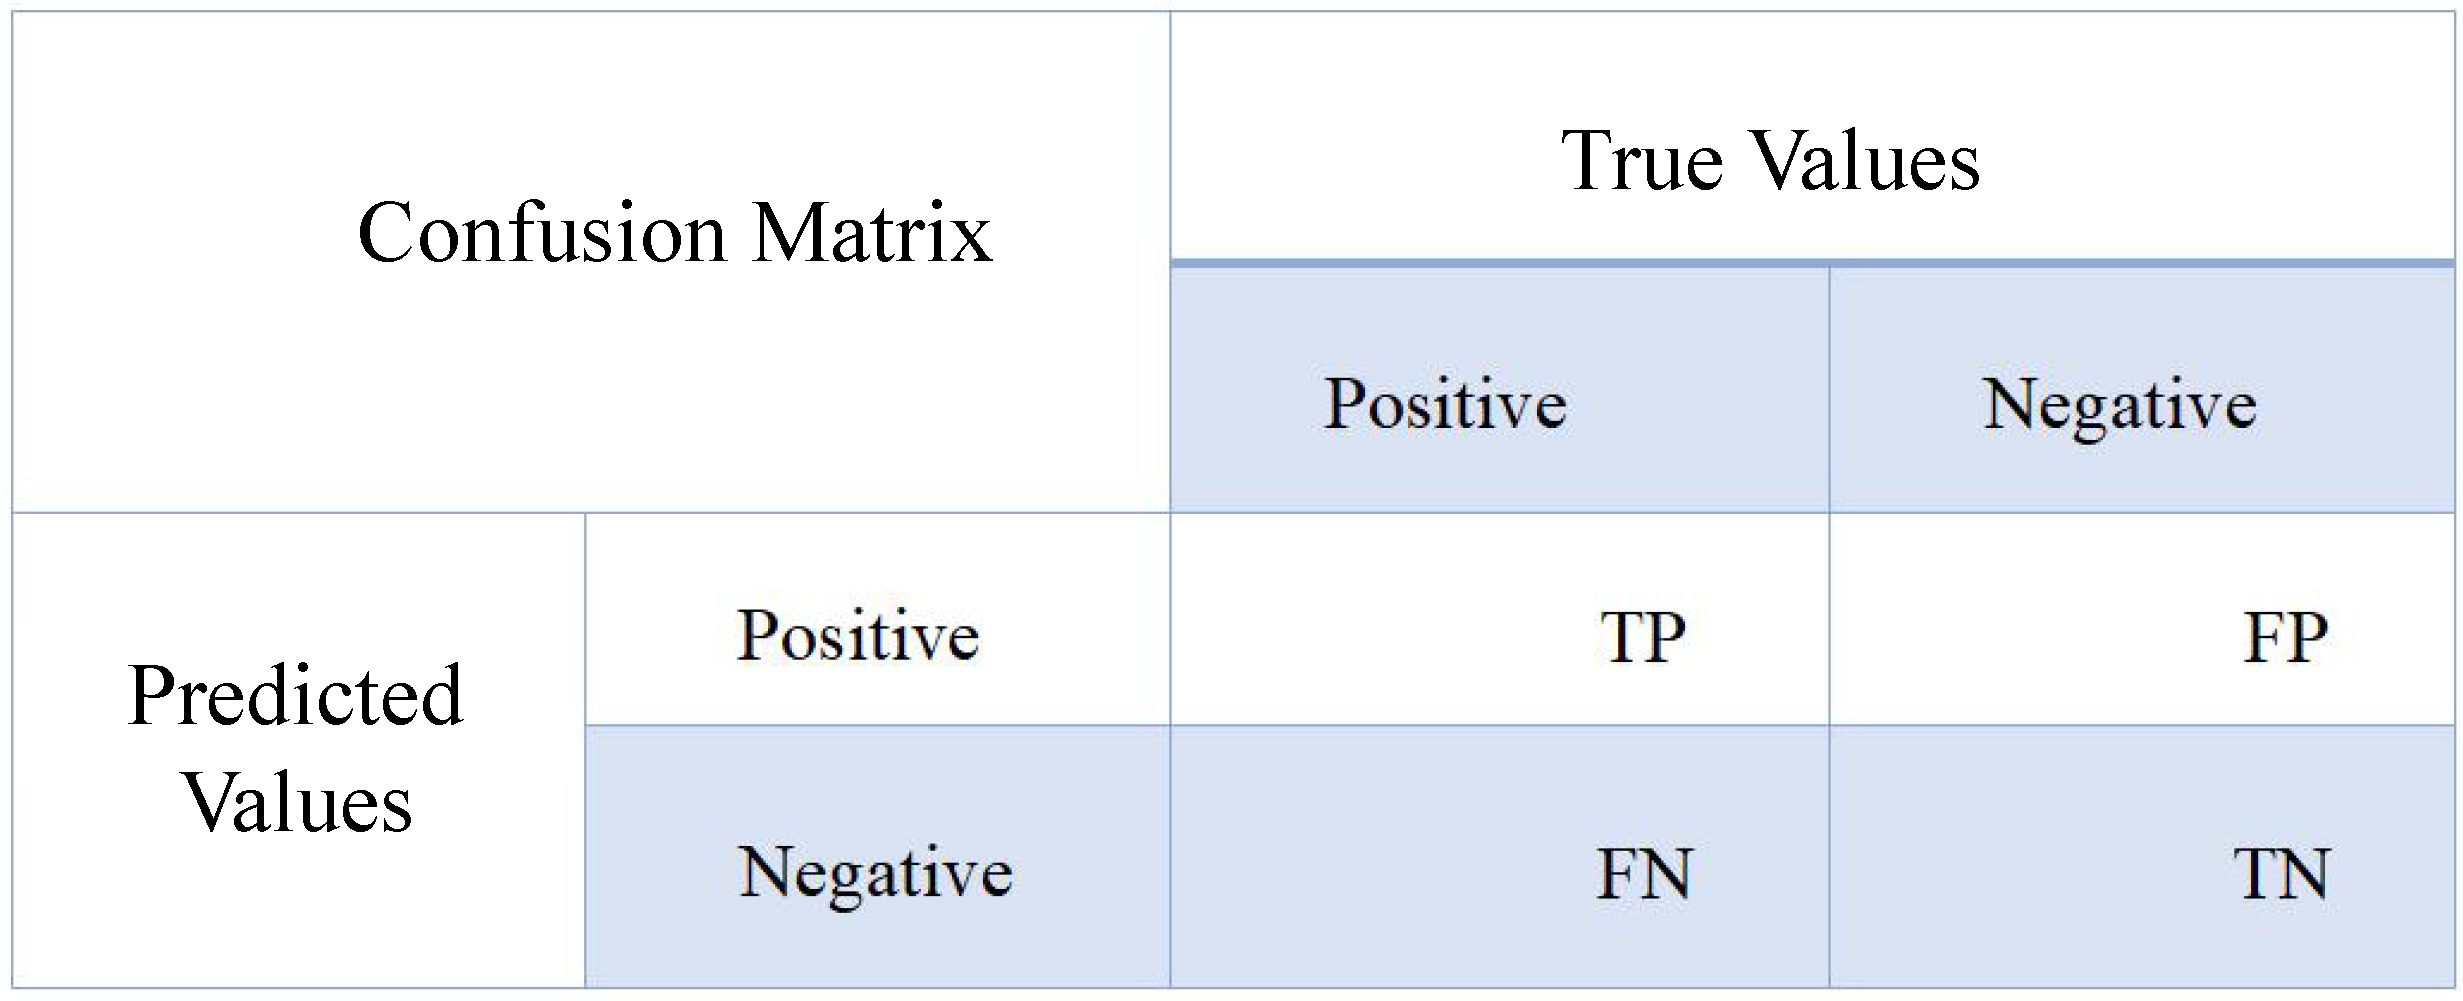
The confusion matrix Figure 12 serves as the fundamental framework for evaluating the accuracy of object recognition, with each of its elements possessing a distinct and well-defined meaning, as depicted in the figure below. Specifically, true positive (TP) denotes the number of instances where both the actual class and the model’s prediction are positive; false negative (FN) represents the count of cases where the true class is positive, but the model predicts a negative outcome; false positive (FP) signifies the number of instances where the true class is negative, yet the model predicts a positive outcome; and true negative (TN) refers to the count of instances where both the true class and the model’s prediction are negative.
Based on the confusion matrix, various performance metrics can be derived, offering a comprehensive overview of the model’s performance. Among these, Precision measures the proportion of true positives among all instances predicted as positive by the model. Recall, on the other hand, reflects the fraction of all true positives that are correctly identified by the model. Average precision (AP) represents the mean precision across different recall levels, often used to assess the model’s performance under varying thresholds. Mean average precision (mAP), being the average of AP across different categories, is suitable for evaluating the performance of multi-class classification tasks. Additionally, the precision–recall curve (P-R curve) provides a visual representation of the model’s performance by plotting the relationship between precision and recall.
In the context of object detection and classification tasks, to ensure a comprehensive assessment of the model’s performance, this study employs precision, recall, and mAP as the primary evaluation metrics.
(1)
Average Precision and Mean Average Precision
Average precision (AP) refers to the mean precision of a particular category, indicating the model’s performance on that specific class. Meanwhile, mean average precision (mAP) is the average of AP across all categories, representing the model’s overall classification performance across all classes. The computation of these metrics is as follows:
Firstly, a precision–recall (P-R) curve is plotted with recall as the horizontal axis and precision as the vertical axis. The P-R curve visualizes the changes in precision and recall values as the target threshold varies, considering precision as a function of recall. AP can be interpreted as the area under the P-R curve, namely:
A P = 0 1 p ( r ) d r
However, in practice, the computation of AP involves multiplying the maximum precision value among all thresholds by the corresponding change in recall, formulated as:
A P = k = 1 N max k ˜ k P ( k ˜ ) Δ r ( k )
m A P = i = 1 C k = 1 N max k ˜ k P ( k ˜ ) Δ r ( k ) C
where (N) represents the number of samples in a particular category, r(k) denotes the change in recall, and (P(k)) represents the maximum precision value corresponding to that change. The summation is performed over all (N) samples. For multi-class classification tasks, the overall performance is evaluated using mAP, which is the average of AP across all (C) target classes present in the dataset.
(2)
Precision
Precision, also known as the positive predictive value, serves as a metric to evaluate the accuracy of predictions. Specifically, it measures the proportion of true positives among all instances predicted as positive by the model. The mathematical formula for precision is:
Percision = T P T P + F P
(3)
Recall
Recall, alternatively known as the sensitivity or true positive rate, assesses the completeness of the model’s predictions. It quantifies the fraction of true positives that are correctly identified by the model. The formula for recall is:
Recall = T P T P + F P N

3.2. Experimental Results

3.2.1. Experiment 1: Attention Mechanism Comparison

To comprehensively evaluate the effectiveness of Shuffle Attention (SA) in spatial infrared weak target detection tasks, we carefully selected the following four attention mechanisms as reference baselines:
  • EMHSA (Efficient Multi-Head Self-Attention);
  • SGE (Spatial Group-wise Enhance);
  • AFT (Attention Free Transformer);
  • Outlook Attention.
To ensure the fairness and precision of the comparison, we strictly unified the experimental conditions, including the dataset, data preprocessing procedure, training strategy, learning rate, batch size, and the number of training epochs.
Table 1 details the performance comparison of the YOLOv8 model in spatial infrared weak target detection tasks when utilizing different attention mechanisms:
From the experimental results, the baseline model without attention mechanism achieved a precision of 90.3%, a recall of 91.2%, an mAP of 93.2%, and a FPS of 147. When introducing different attention mechanisms, the model performance varied. EMHSA slightly outperformed in mAP (94.5%), but its precision and recall were slightly lower than the baseline, and its FPS was 128, indicating higher computational complexity. SGE achieved the highest precision (91.2%), but its recall was lower, with an mAP similar to the baseline and a FPS of 120, also indicating higher computational complexity. AFT performed better in FPS (132), but the improvements in precision, recall, and mAP were not significant. Outlook Attention had a slightly higher mAP than the baseline (94.1%), but its precision and recall were relatively low, with a FPS of 136, demonstrating a relatively balanced performance and computational complexity.
In contrast, Shuffle Attention (SA) excelled in all key metrics. It achieved a precision of 92.4%, a recall of 90.8%, and an mAP of 94.3%, the highest among all the compared mechanisms. Additionally, its FPS was 132, similar to AFT and Outlook Attention, demonstrating a good balance between computational complexity and performance. This result indicates that Shuffle Attention (SA) not only significantly improved the precision, recall, and mAP of the YOLOv8 model in spatial infrared weak target detection tasks, but also maintained high efficiency while achieving outstanding performance. Therefore, Shuffle Attention (SA) demonstrated superior performance advantages in this task.

3.2.2. Experiment 2: Design and Integration of a Small Target Detection Layer

To comprehensively and accurately evaluate the performance enhancement of the small target detection layer, we integrated it into the YOLOv8 model and conducted detailed comparative experiments with the original model. In the experiments, we ensured consistency in the dataset, data preprocessing methods, training strategies, and evaluation metrics, aiming to obtain fair and accurate experimental results.
The experimental data demonstrate that the YOLOv8 model integrated with the small target detection layer exhibits superior performance in small target detection tasks. Specifically, as shown in Table 2, the model integrated with the small target detection layer significantly outperforms the original model in terms of core metrics such as precision, recall, and mAP. Additionally, we recorded the FPS value to assess the model’s real-time performance.
By comparison, the YOLOv8-n-Small model integrated with the small target detection layer exhibits significant performance improvements. Specifically, the model achieved a 4.1% increase in precision, a 2.6% increase in recall, and a 3.1% increase in mAP. These substantial gains in core metrics confirm the effectiveness of the small target detection layer. Although the detection speed (FPS) decreased from 147 frames/s to 66 frames/s, resulting in a slight decline in the model’s real-time performance, it still meets the real-time requirement.

3.2.3. Experiment 3: Integration of Deformable Convolutional Networks V4 (DCNV4) Module

To validate the performance enhancement of the YOLOv8 model after introducing the DCNV4 module, we conducted detailed comparative experiments. Table 3 presents the performance comparison data of the YOLOv8 model before and after the integration of the DCNV4 module on the test set:
As is evident from the data in the table, the introduction of the DCNV4 module has elevated the performance of the YOLOv8 model. By enabling the convolution kernels to sample irregularly on the feature maps, the DCNV4 module enhances the spatial adaptability of the model, enabling it to capture target deformations and scale variations more effectively. This improvement is reflected significantly in the experimental results, where the accuracy has increased by 1.4 percentage points, from 90.3% to 91.7%, indicating a higher proportion of true positives among the detected targets. Meanwhile, the mAP has also increased by 1 percentage point, from 93.2% to 94.2%, demonstrating an improvement in the detection performance across multiple categories. Although the FPS (frames per second) has decreased from 147 to 103, the model still maintains a high real-time performance, meeting the requirements of practical applications. In summary, the incorporation of the DCNV4 module not only improves the accuracy and mAP of the YOLOv8 model but also significantly enhances its spatial adaptability, providing robust support for the model in object detection tasks in complex scenarios.

3.2.4. Experiment 4: Training the Model with the Optimized WIoU-v3 Loss Function

In object detection tasks, the choice of loss function is crucial for the training effectiveness and performance of the model. To further enhance the target localization accuracy of the YOLOv8 model, this experiment specifically adopted the optimized WIoU-v3 loss function for model training and conducted a detailed comparative experiment with advanced IoU variants such as CIoU [44], DIoU [45], GIoU [46], and EIoU [47].
In this experiment, we employed a uniform and standardized experimental setup and dataset to ensure a fair comparison of the performance impact of different loss functions on the YOLOv8 model. Specifically, we applied the CIoU, DIoU, GIoU, EIoU, and optimized WIoU-v3 loss functions one by one to the training process of the YOLOv8 model and recorded their performance under the same number of iterations.
As is evident from the data in Table 4, the use of the optimized WIoU-v3 loss function for training the YOLOv8 model has achieved significant improvements in precision, recall, average precision, and mAP. Compared to the baseline IoU loss function, WIoU-v3 elevated the precision from 90.3% to 92.6%, recall from 91.2% to 92.5%, and mAP from 93.2% to 94.7%. This remarkable performance enhancement demonstrates the effectiveness of the WIoU-v3 loss function in capturing the spatial relationship between predicted and ground truth bounding boxes, thereby significantly improving the model’s localization accuracy and detection performance.For further details and supplementary information on the WIoU-v3 loss function and its comparison with other IoU variants, please refer to Appendix A.1.
Compared to other IoU variants such as CIoU, DIoU, GIoU, and EIoU, WIoU-v3 exhibited superior performance across all metrics, indicating its advantage in optimizing anchor box matching and detection performance. This advantage is primarily attributed to the unique dynamic non-monotonic focusing mechanism of WIoU-v3, which assesses anchor box quality through “outlierness” and optimizes the gradient gain allocation strategy, enabling the model to more accurately identify targets and reduce false positives and missed detections.
Notably, despite being a more complex loss function, WIoU-v3 has a minimal impact on the model’s real-time performance. While maintaining high detection accuracy, the model’s FPS remains at 143 frames per second, similar to the baseline model, meeting the requirements of real-time applications. This result indicates that the WIoU-v3 loss function is an ideal choice for enhancing the target localization accuracy of the YOLOv8 model while balancing real-time performance.

3.2.5. Experiment 5: Target Detection Using the Improved MY-YOLOv8 Model

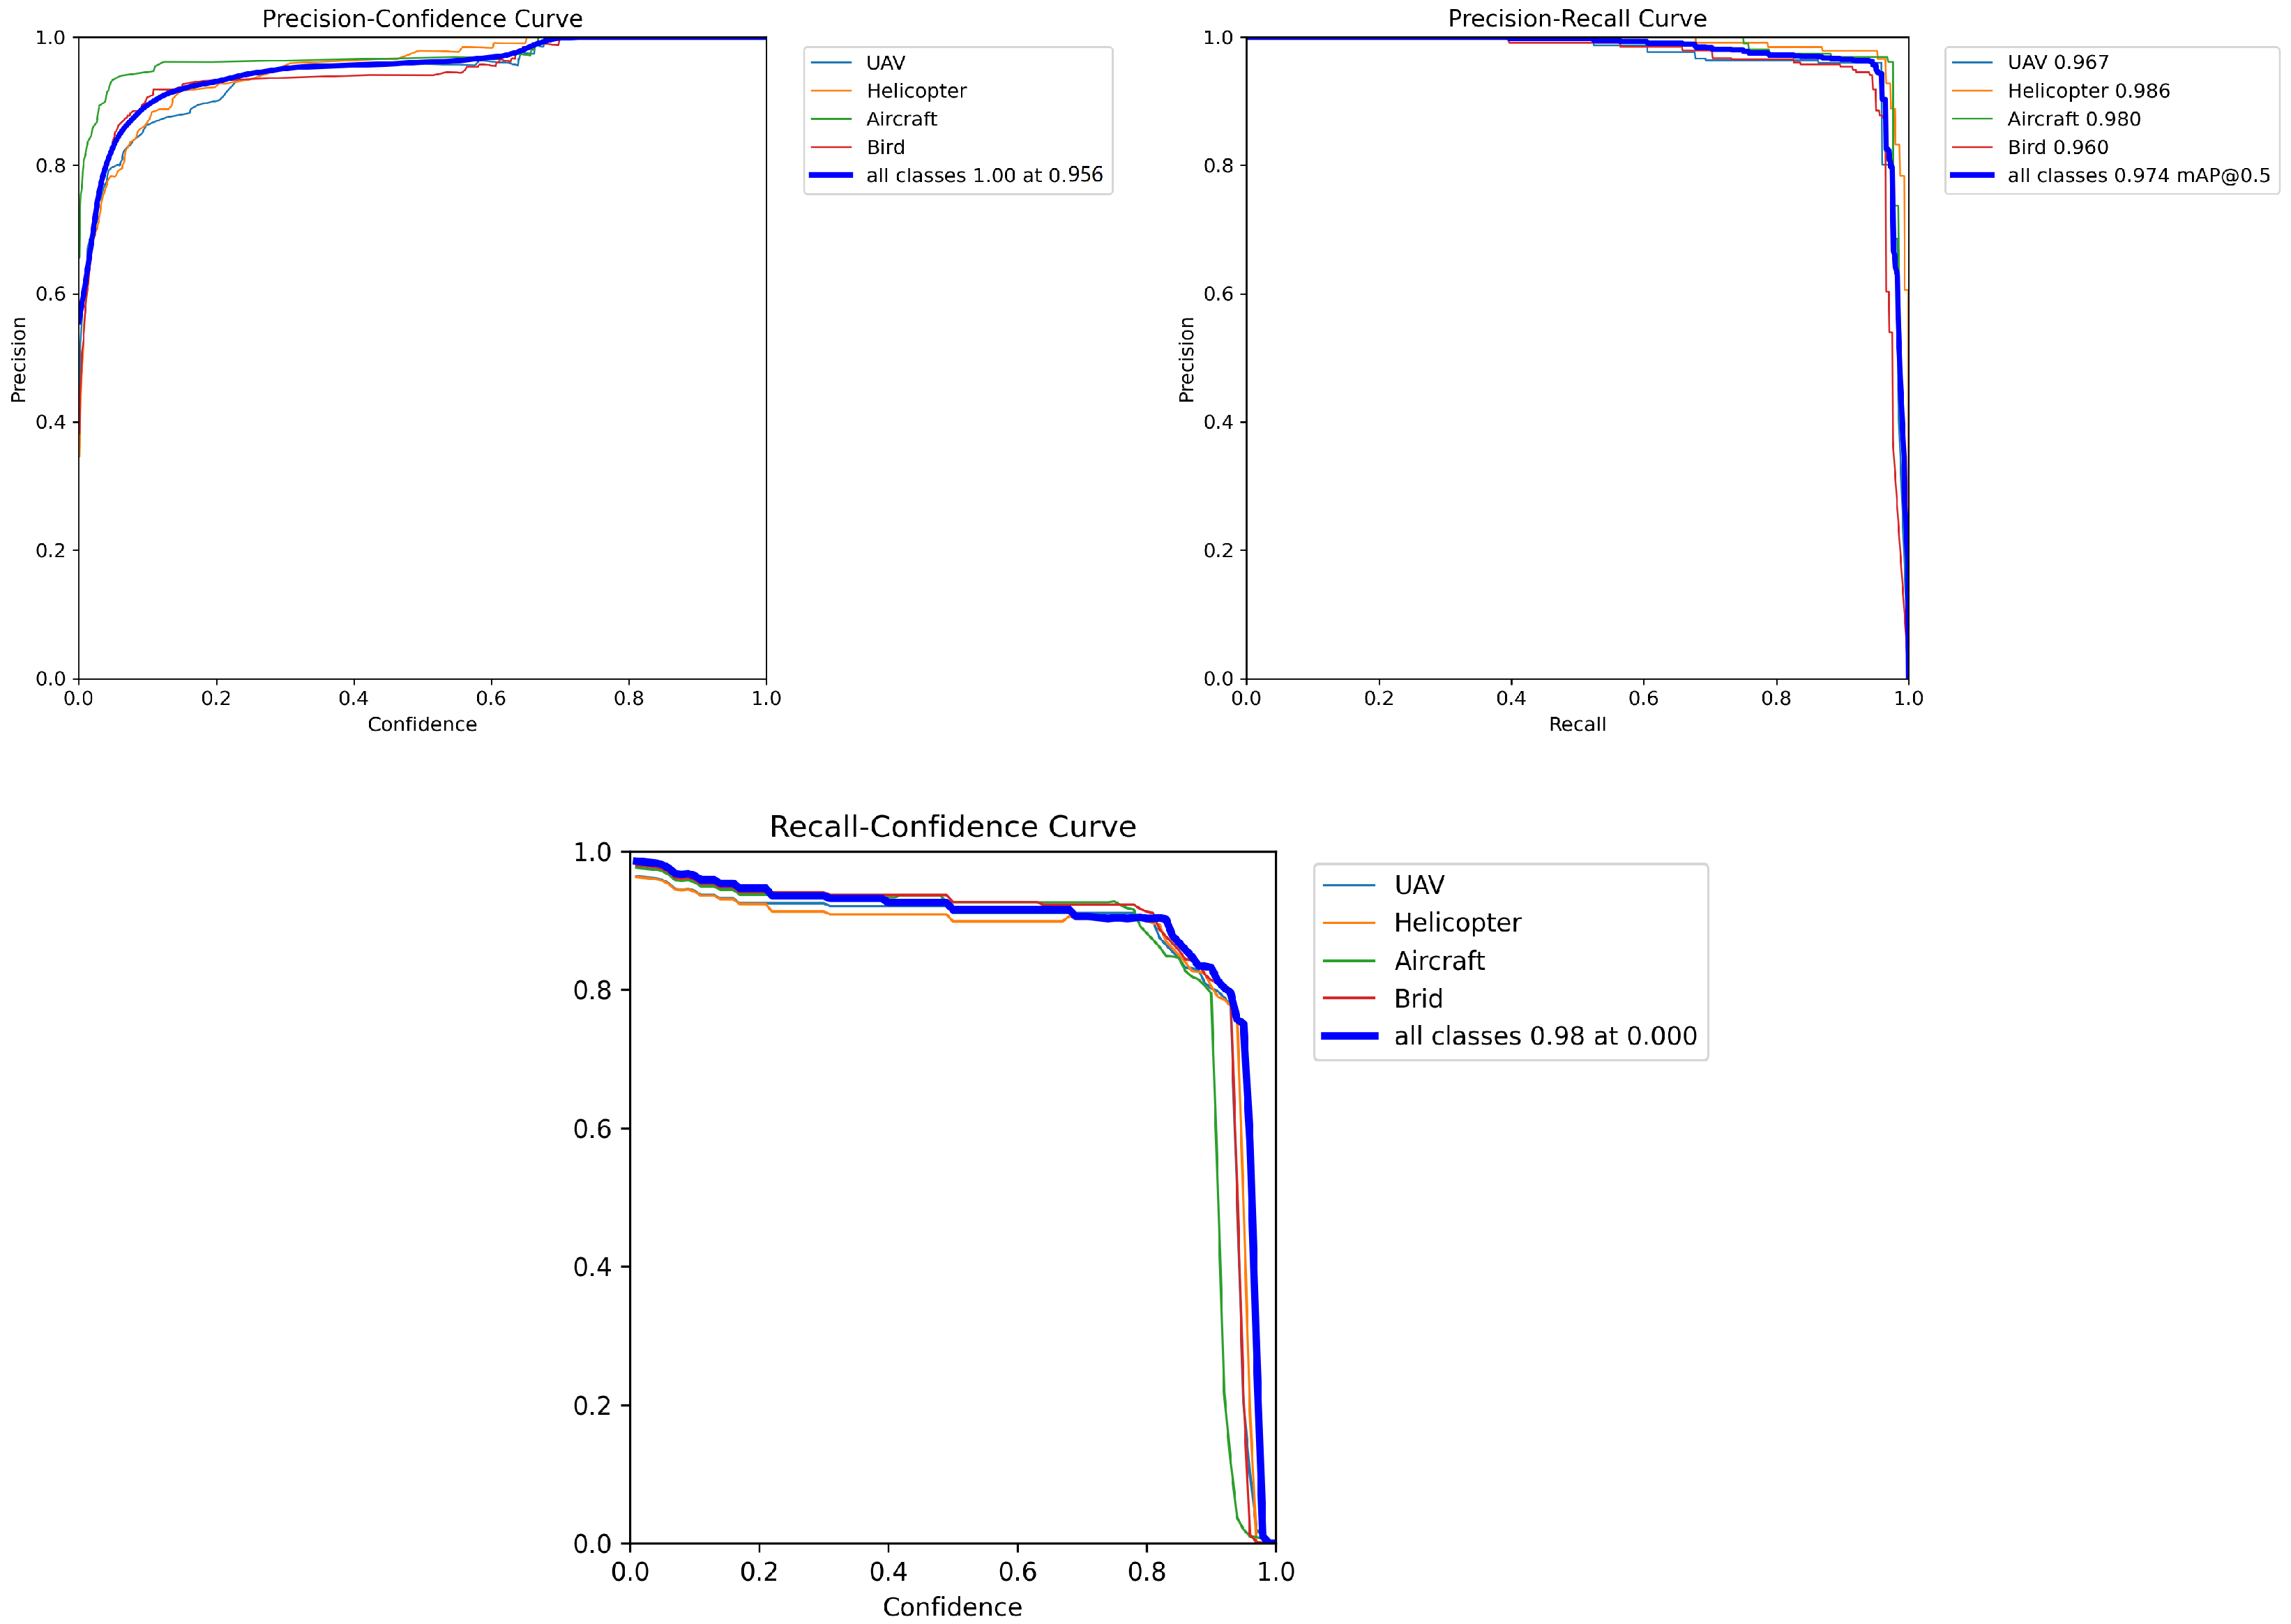
In this experiment, we employed the enhanced MY-YOLOv8 model for spatial target detection and conducted a comparative analysis with several other prevalent target detection models, including YOLOv4, YOLOv5, YOLOv7, YOLOv8, SSD, Faster R-CNN, and a baseline CNN model. The objective of this comparative study was to comprehensively evaluate the performance of the MY-YOLOv8 model in target detection tasks and determine its advantages and limitations in different metrics. All models were trained and tested on the same spatial infrared weak target dataset to ensure a fair comparison.The detection results of multiple spatial infrared weak targets are shown in Table 5. The curve chart of MY-YOLOv8 model training results (precision, recall, and mean average precision (mAP)) is presented in Figure 13. The comparison of detection results of different models is shown in Table 6.
During the experimental process, we utilized the same dataset, data preprocessing methods, and evaluation strategies to guarantee a fair comparison. To comprehensively assess the performance of the models, we adopted multiple evaluation metrics, including precision, recall, mean average precision (mAP), and frames per second (FPS).
The following is a comparison table of the experimental results:
As is evident from the table, the MY-YOLOv8 model demonstrates significant performance advantages in the task of spatial infrared weak target detection. Compared to other popular target detection models, MY-YOLOv8 achieves the highest scores in three crucial metrics: precision, recall, and mean average precision (mAP). Specifically, the MY-YOLOv8 model achieves a precision of 95.6%, indicating its ability to accurately identify true target objects; a recall rate of 94.7%, suggesting its effectiveness in detecting a majority of target objects; and a remarkable mAP of 97.4%, further proving its exceptional performance in multi-class target detection.
In terms of frames per second (FPS), although MY-YOLOv8 exhibits a slight decrease compared to some models like YOLOv8, its speed of 59 frames per second still satisfies the requirements for real-time target detection, especially in application scenarios that demand high accuracy and reliability.
The comparative table of experimental results also reveals that MY-YOLOv8 achieves significant improvements in various metrics compared to other versions of the YOLO series, such as YOLOv4, YOLOv5, YOLOv7, and YOLOv8. Specifically, MY-YOLOv8 demonstrates effectiveness in model optimization, particularly in terms of precision and mAP. Compared to SSD, Faster R-CNN, and basic CNN models, MY-YOLOv8 maintains relatively high FPS while preserving high precision and recall rates, which is crucial in practical applications.
In summary, the MY-YOLOv8 model exhibits outstanding performance in target detection tasks, particularly in the specific domain of spatial infrared weak target detection. Through comparative experiments with other models, we validate the significant advantages of MY-YOLOv8 in terms of precision, recall, and mAP, providing strong support for its practical application.

3.3. Visual Analysis

Visual analysis plays a crucial role in object detection tasks, as it aids in intuitively understanding model performance, identifying potential issues, and assessing the model’s behavior across different scenarios. In this section, we will conduct a detailed visual analysis of the MY-YOLOv8 model’s object detection results, including a confusion matrix and visualization of the detection outcomes.

3.3.1. Confusion Matrix

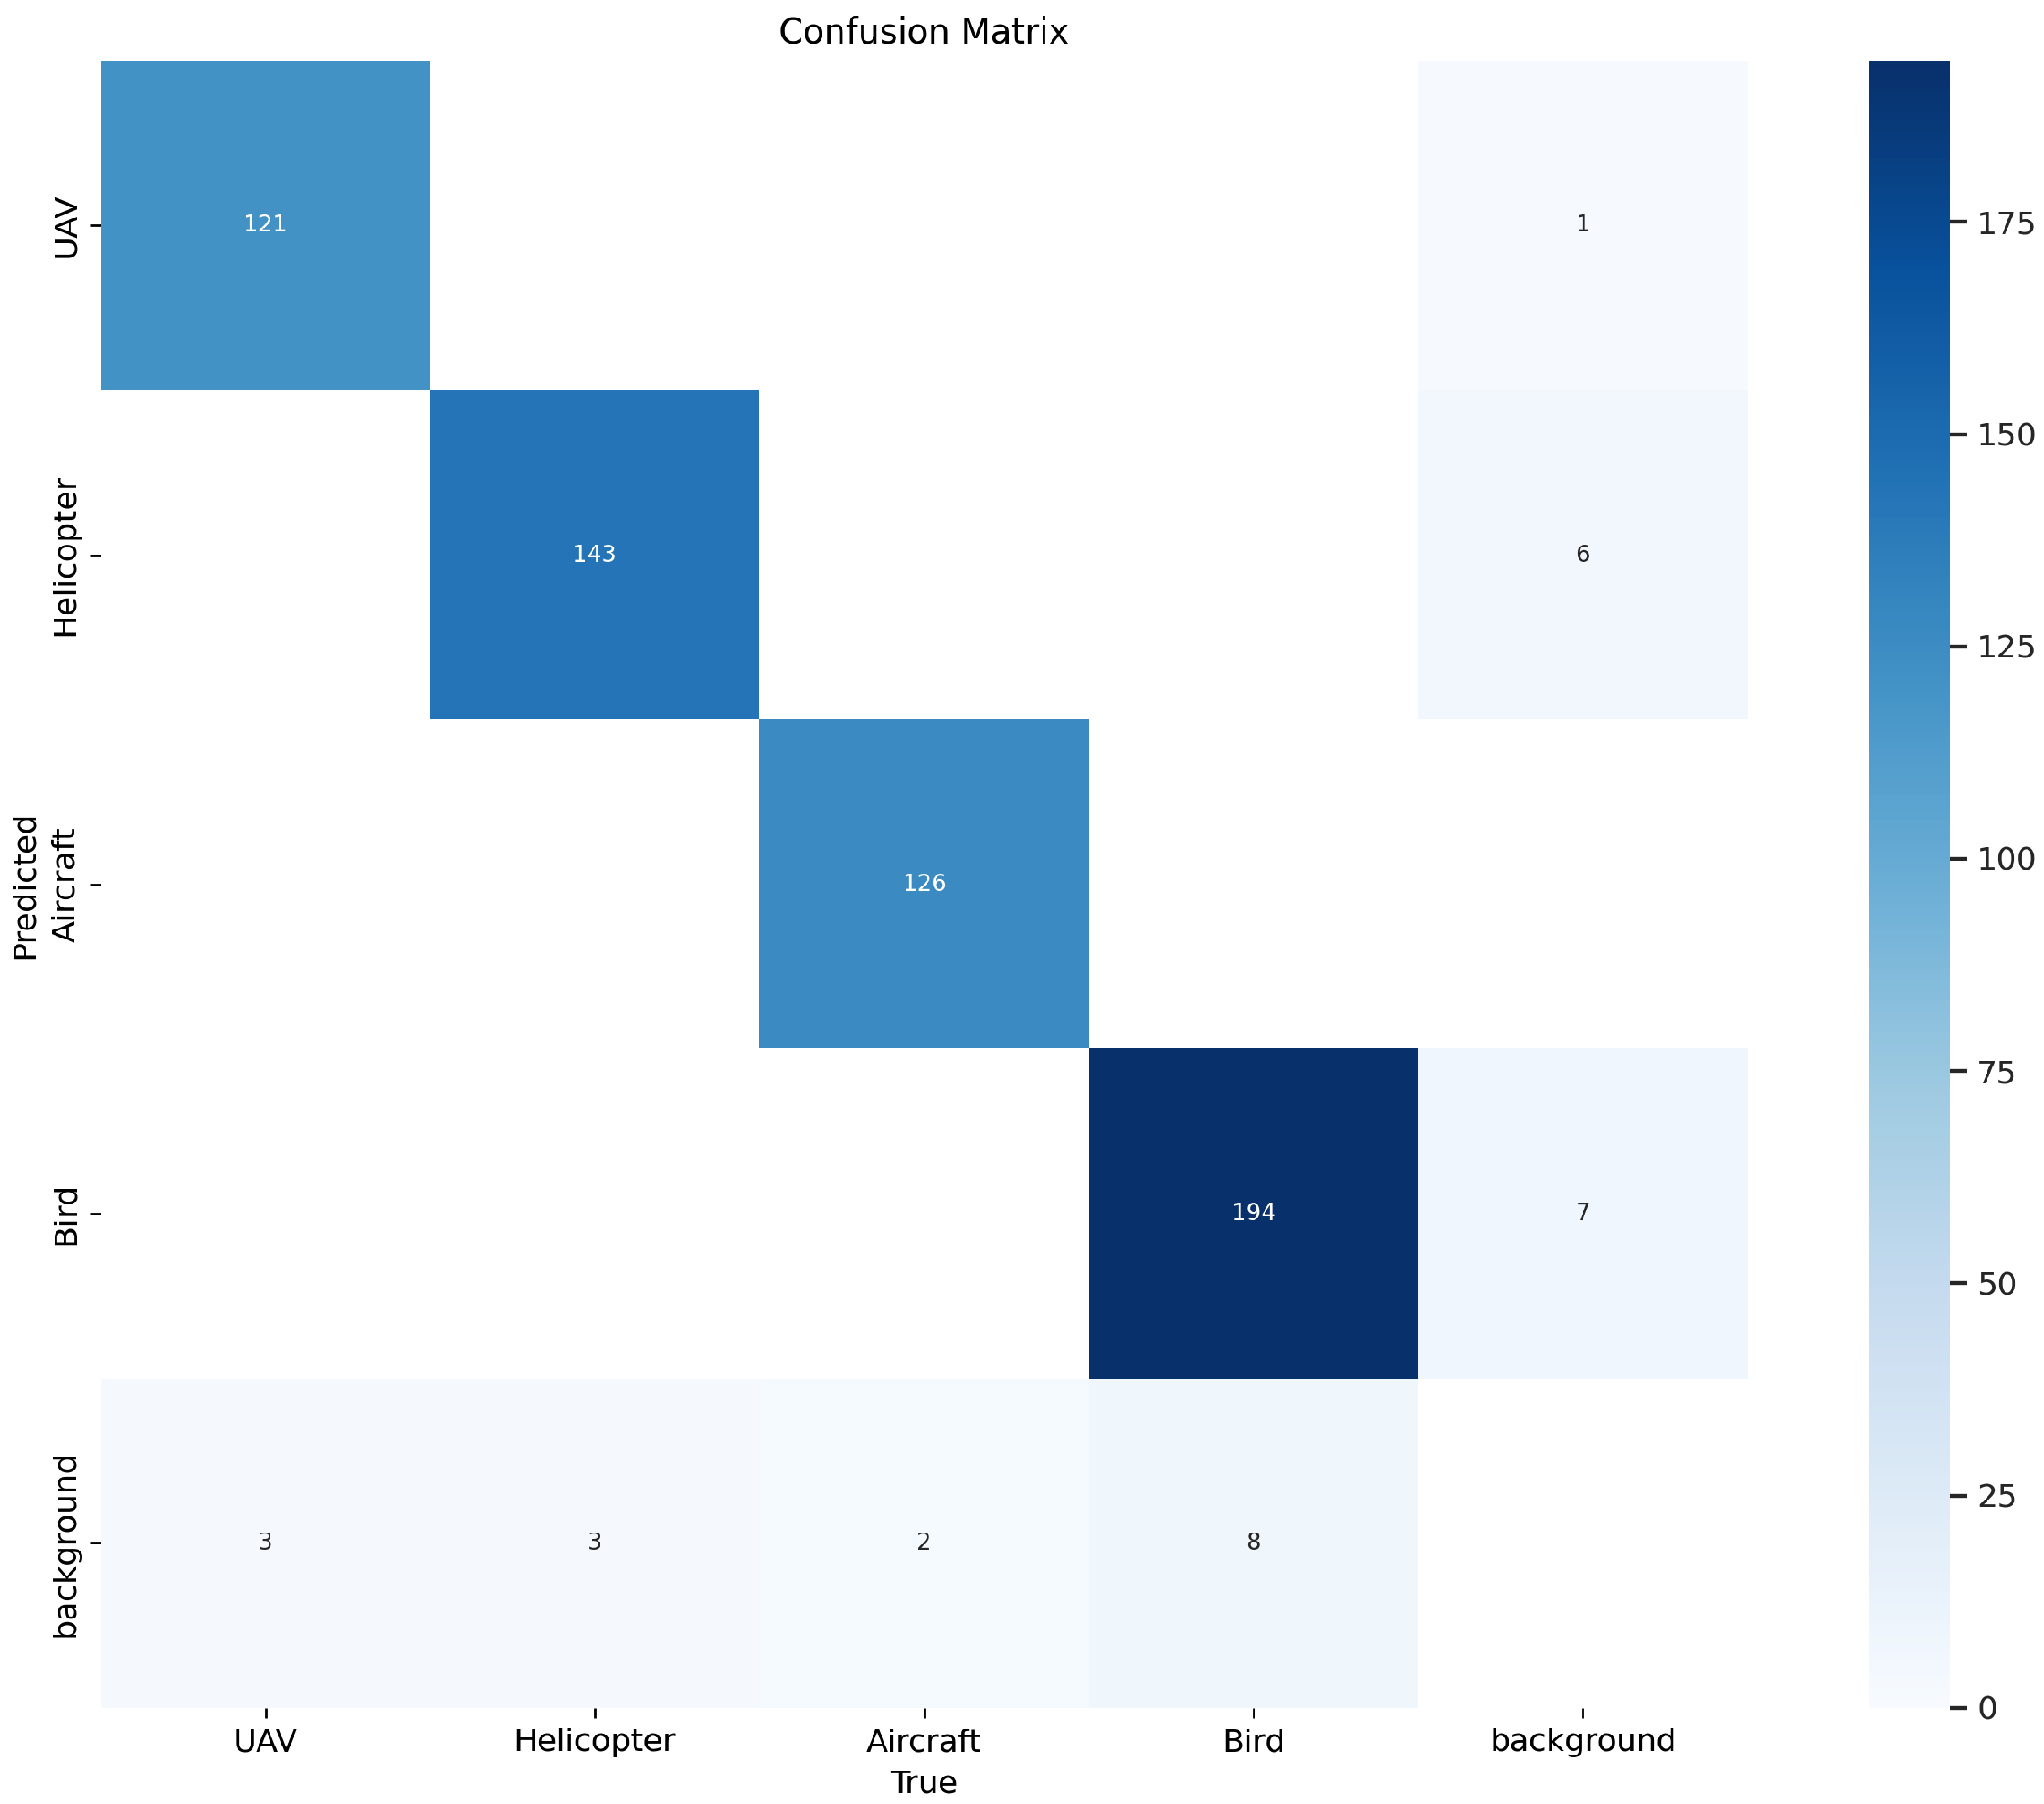
To thoroughly analyze the performance of the MY-YOLOv8 model in object detection tasks, we employ the confusion matrix, which is a classical evaluation tool. The confusion matrix clearly demonstrates the model’s predictions for various classes of samples, thus facilitating an understanding of the model’s classification capabilities, false positives, and false negatives.
By analyzing the confusion matrix in Figure 14, we can draw the following conclusions:
Firstly, the elements on the diagonal indicate that the model performs relatively well for most categories, with high true positive (TP) values, indicating the model’s ability to accurately identify objects belonging to these categories. However, for some categories, the false negative (FN) values are relatively high, suggesting that the model misses detecting objects from these categories, necessitating further optimization to improve the recall rate.
Secondly, observing the off-diagonal elements, we find that the model exhibits some false positive (FP) cases for certain categories. This could be attributed to the similarity in features between these categories and others, making it difficult for the model to distinguish accurately. To reduce the false positive rate, we can consider increasing the training samples for these categories or employing more sophisticated feature extraction methods to enhance the model’s ability to distinguish between categories.

3.3.2. Detection Results

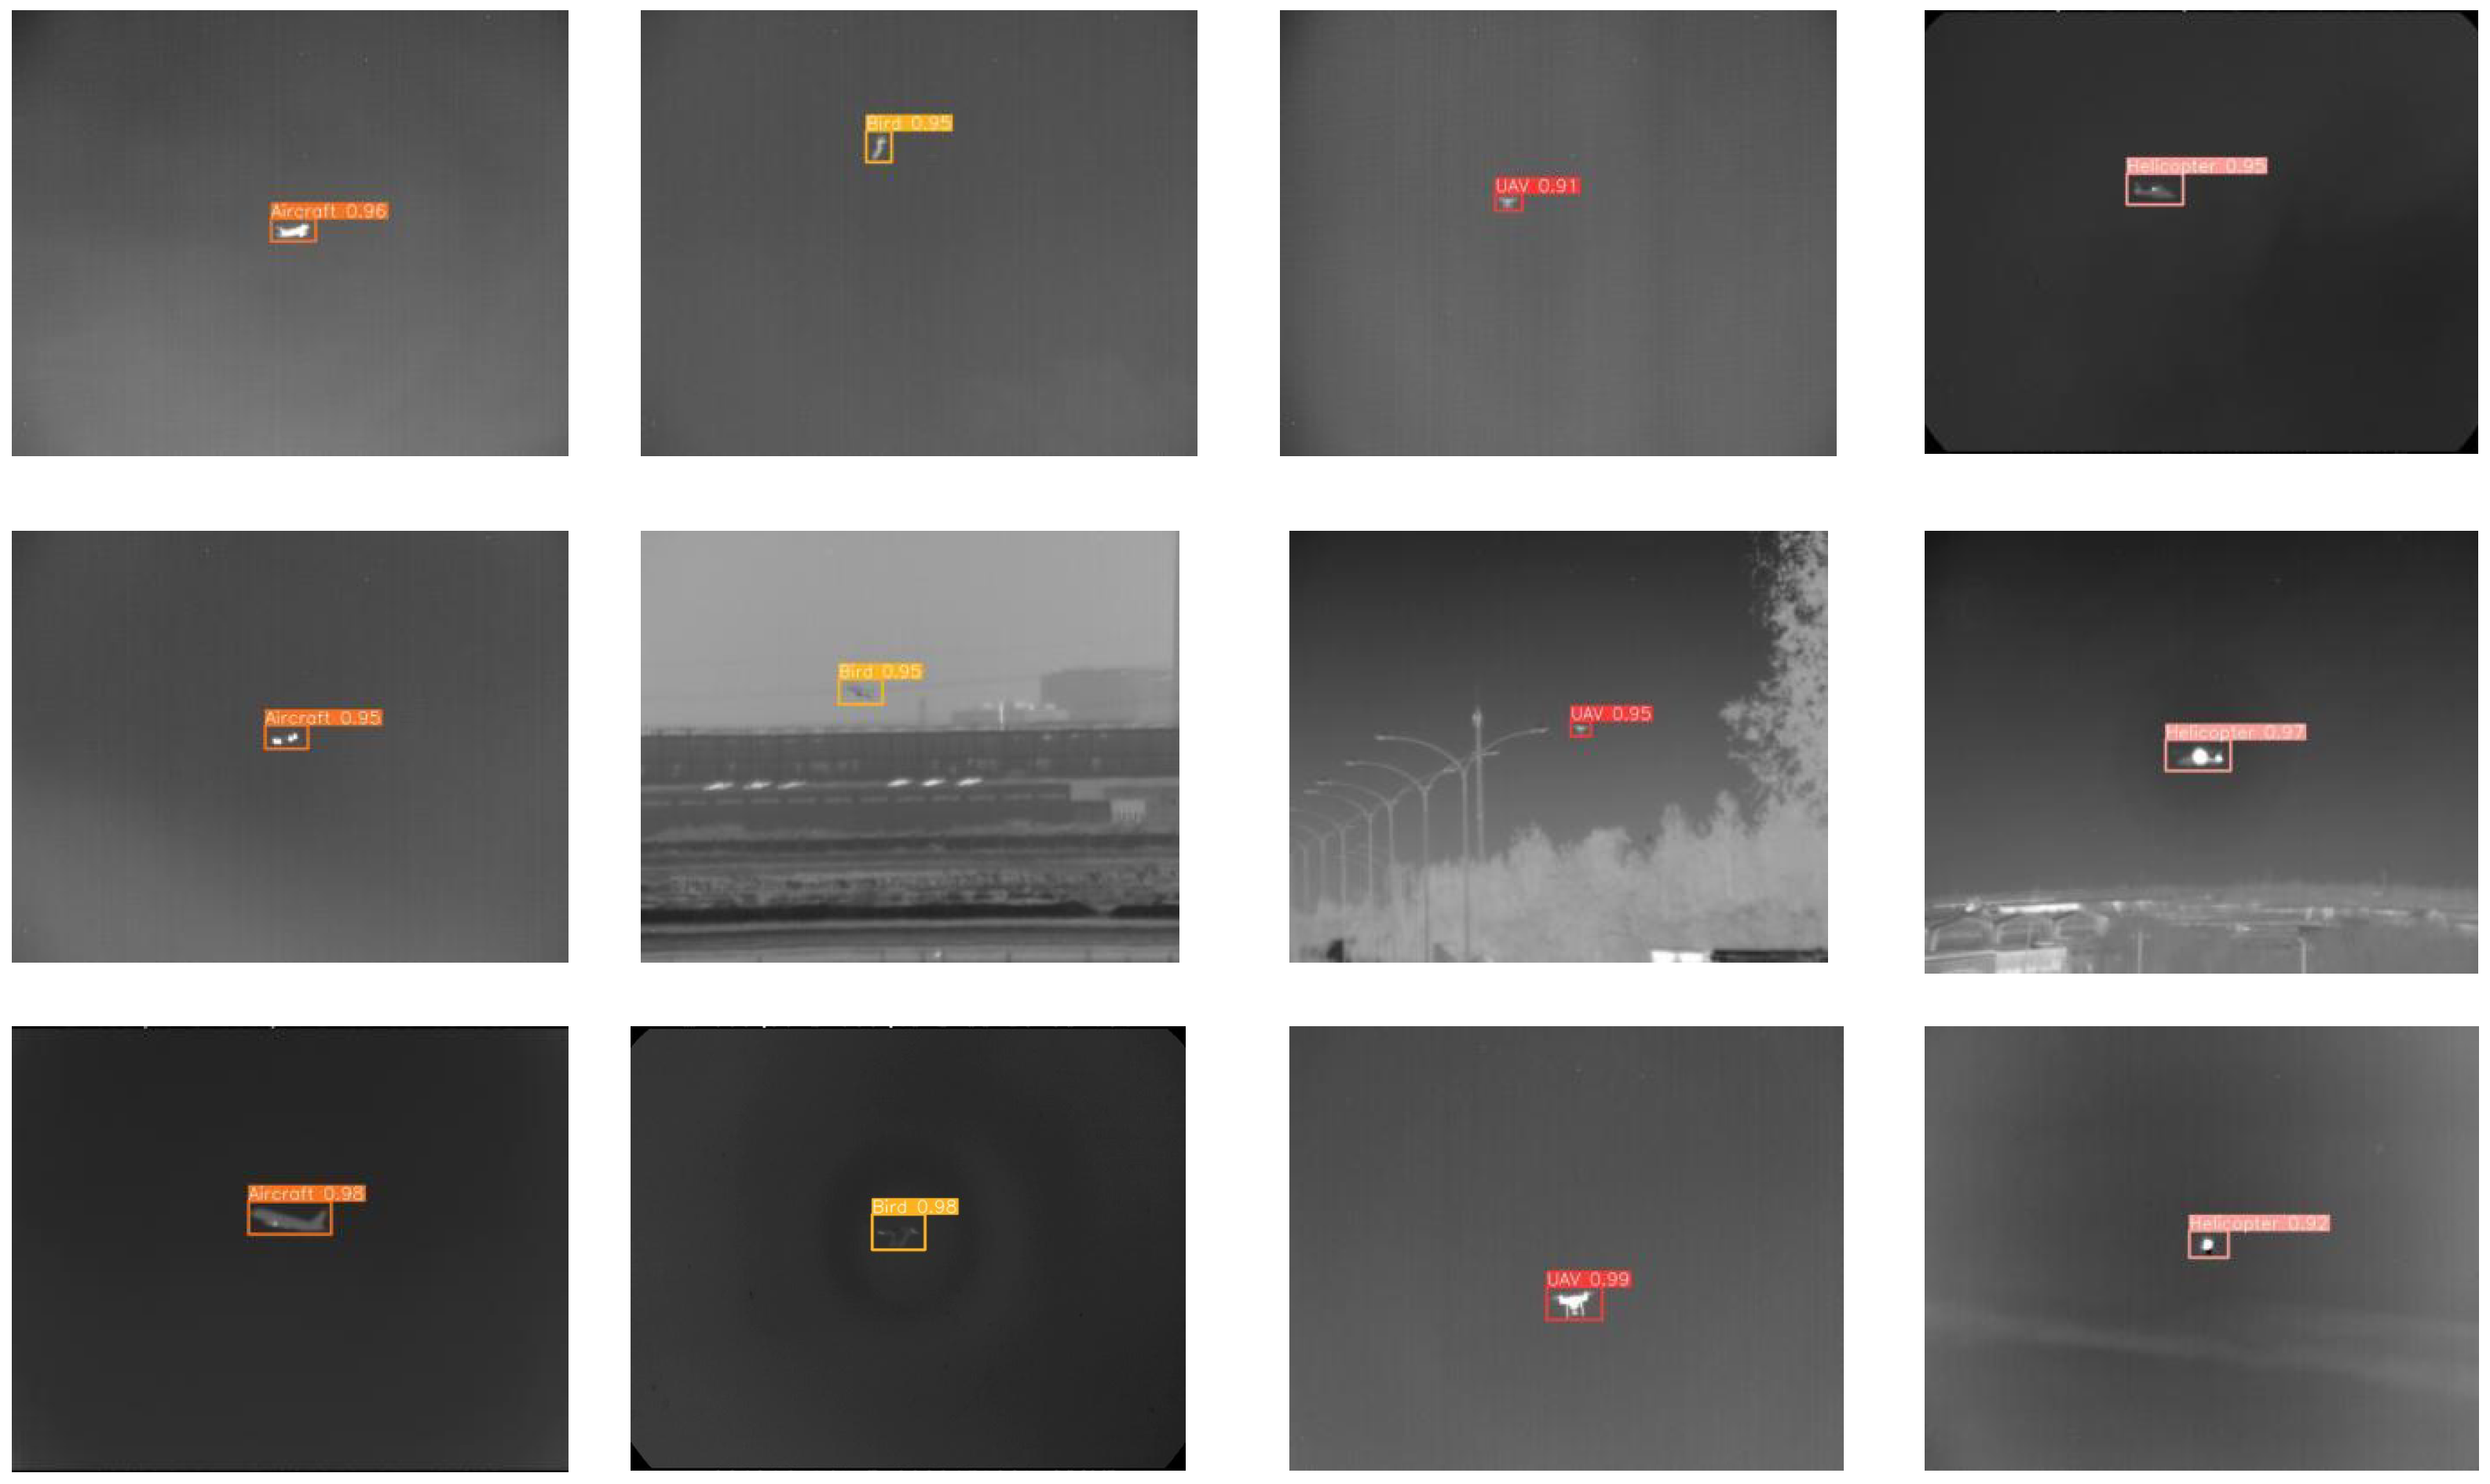
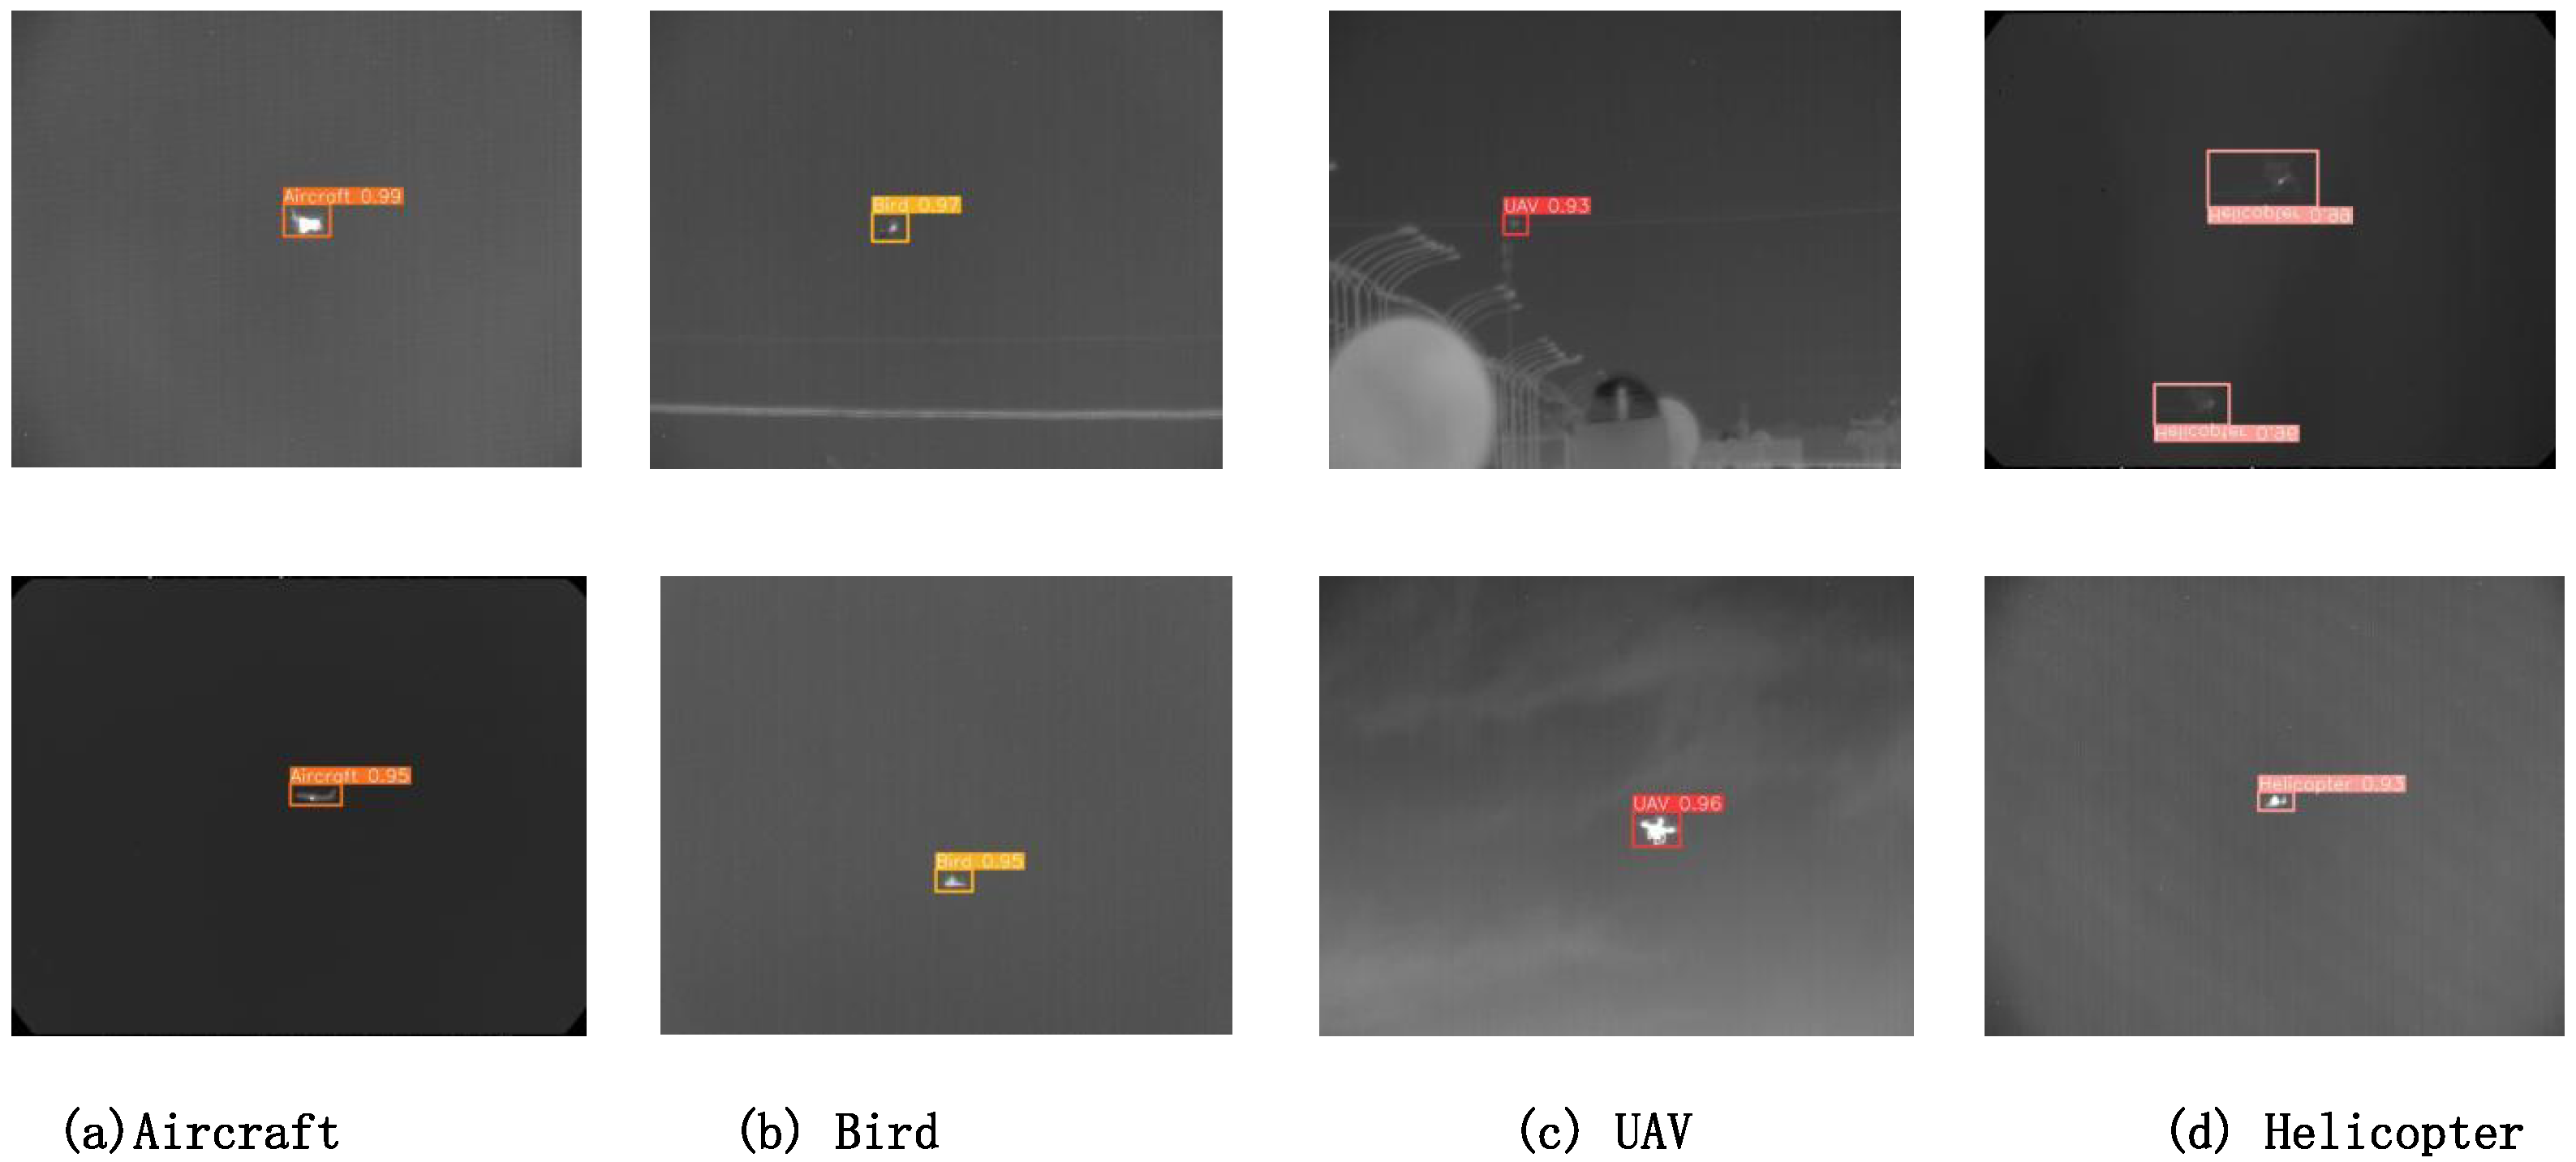
This paper specifically focuses on the task of detecting spatial infrared weak targets, presenting a series of detection result images to demonstrate the performance of the MY-YOLOv8 model in this domain. These result images comprise 20 detection images, covering four categories that appear as infrared weak targets in space: civil aviation, birds, UAVs, and helicopters, with five images for each category.
In the result images (Figure 15), we can observe the remarkable performance of the MY-YOLOv8 model in identifying these spatial infrared weak targets. Each image meticulously displays both the predicted bounding box and the prediction score. The predicted bounding box precisely pinpoints the location of the target as forecasted by the model, while the prediction score quantifies the model’s degree of accuracy in detecting that target. Taking the first image on the left of Figure 15 as an example, the predicted bounding box tightly hugs the true position of the target, and “AirCraft 0.96” signifies that the model has a 96% confidence level in identifying the target as an aircraft, showcasing the model’s high precision and reliability in detecting such targets. Even when these targets exhibit low contrast and blurred features in infrared images, the MY-YOLOv8 model is still able to accurately recognize and locate them. Notably, the detection accuracy of all images exceeds 95%, fully demonstrating the efficiency and accuracy of the MY-YOLOv8 model in the task of spatial infrared weak target detection. Whether they are civil aircraft, birds, UAVs, or helicopters, the model can precisely identify these weak targets in infrared images and provide corresponding predicted bounding boxes.
Furthermore, the result images also display different categories of targets detected by the model, along with the confidence scores corresponding to each predicted bounding box. High confidence scores not only reflect the model’s certainty in its predictions, but also further validate the reliability of the MY-YOLOv8 model in spatial infrared weak target detection tasks.
By analyzing these 20 detection result images, we can comprehensively understand the performance of the MY-YOLOv8 model in spatial infrared weak target detection tasks. The model not only excels in different categories, but also maintains stable detection performance across various infrared image scenarios. This reflects the robustness and generalization capabilities of the MY-YOLOv8 model in handling spatial infrared weak targets. In summary, the detection result images in this paper provide a visual and comprehensive basis for evaluating the performance of the MY-YOLOv8 model in spatial infrared weak target detection tasks. These results not only demonstrate the model’s efficiency and accuracy in detecting infrared weak targets, but also reveal its unique advantages in such tasks, providing valuable references for subsequent model optimization and applications.

4. Conclusions and Discussion

The MY-YOLOv8 model has demonstrated significant advantages in the field of object detection, particularly in the detection of spatial infrared weak targets. Through the effective combination of a deep network structure and multi-scale feature fusion techniques, the model has achieved remarkable improvements in the accuracy of object detection. Specifically, in comparative experiments, MY-YOLOv8 achieved a precision of 95.6%, significantly surpassing other competing models such as YOLOv8 with 90.3% and YOLOv4 with 86.3%. This advantage is particularly evident when dealing with complex backgrounds and weak targets, as shown in Table 5, where the model achieved high detection accuracy across multiple categories including UAVs, helicopters, civil aviation aircraft, and birds.
Simultaneously, MY-YOLOv8 maintains a fast detection speed while ensuring high accuracy, achieving 59 frames per second (FPS), meeting the demands of applications requiring high real-time performance. Compared to other models, MY-YOLOv8 provides both high performance and high frame rates, providing strong support for practical applications.
Moreover, through data augmentation and stable training strategies, MY-YOLOv8 exhibits good robustness and stability. The model maintains consistent performance across various scenarios and conditions, providing developers with a reliable solution. Additionally, its open-source nature and modular design endow the model with excellent usability and scalability, offering broad application prospects for developers.
However, despite the numerous advantages of the MY-YOLOv8 model, there are still limitations in extreme conditions and small object detection. Under extremely low lighting or severe occlusion, the model may have difficulty accurately identifying and locating targets. Additionally, for small objects, due to their weak feature information, the model faces challenges in extraction and recognition.
To address the current limitations of the MY-YOLOv8 model, future work can focus on the following aspects:
(1)
Improve the model structure by introducing more sophisticated feature extraction networks and attention mechanisms to optimize detection performance for small objects and extreme conditions. For instance, exploring the use of more advanced network structures such as Transformers or more complex convolutional neural network architectures.
(2)
Enhance the robustness and generalization capabilities of the model by utilizing data augmentation techniques and unsupervised learning methods to reduce reliance on labeled data. For example, employing more unsupervised learning methods for pre-training the model to improve its adaptability to unknown data.
(3)
Optimize the model’s training strategies and parameter adjustments by exploring automated and intelligent training methods to reduce the difficulty of parameter tuning. For instance, investigating deep learning-based hyperparameter optimization methods such as Bayesian optimization or genetic algorithms.
(4)
Expand the model’s application domains and functionalities by applying MY-YOLOv8 to broader tasks such as video object tracking and 3D object detection, further tapping its potential. Through these efforts, we aim to further enhance the performance of the MY-YOLOv8 model and promote its development in the field of object detection.

Author Contributions

Conceptualization, Y.L.; methodology, Y.L. and L.C.; software, Y.L.; validation, Y.L., N.L., X.H. and Y.Z.; formal analysis, Y.Z., Y.L. and X.N.; investigation, D.D., N.L., X.H., Y.Z. and Y.L.; resources, D.D., Y.L., X.N. and N.L.; data curation, Y.L., X.H. and N.L.; writing—original draft preparation, X.N., Y.L., N.L. and D.D.; writing—review and editing, Y.L. and L.C.; supervision, X.N., L.C. and Y.L.; project administration, X.H. and Y.L.; funding acquisition, L.C. All authors have read and agreed to the published version of the manuscript.

Funding

This research received no external funding.

Data Availability Statement

No new data were created or analyzed in this study. Data sharing is not applicable to this article.

Conflicts of Interest

The authors declare no conflicts of interest.

Appendix A. Supplementary Information on xIoU Variants

Appendix A.1. Explanation of xIoU Variants

The primary purpose of this appendix is to provide detailed explanations of the various xIoU metrics, denoted by ‘x’ as C, E, S, W, L, and others (e.g., DFL, FPN, etc.). These metrics are crucial for evaluating the performance of object detection algorithms and are presented in a table below for clarity.
Table A1. Explanation of different xIoU variants.
AbbreviationFull FormDescription
CIoUCircle IoUA variant of IoU that considers the circular nature of objects, useful for circular objects.
EIoUEllipse IoUAdapts IoU for elliptical objects, taking into account the major and minor axes of ellipses.
SIoUSquare IoUA square-shaped version of IoU, typically used for objects with square or rectangular shapes.
WIoUWeighted IoUA weighted version of IoU that assigns different importance to different parts of the bounding box.
LIoULine IoUDesigned for line segment detection, considering the length and orientation of lines.
DFLDistance-Weighted Focal LossA loss function that combines focal loss with the distance between the predicted and true boxes.
FPNFeature Pyramid NetworkA feature extraction architecture that creates a pyramid of features for object detection.

References

  1. He, Y.; Zhang, R.; Xi, C.; Zhu, H. Learning background restoration and local sparse dictionary for infrared small target detection. Opt. Photonics J. 2024, 20, 437–448. [Google Scholar] [CrossRef]
  2. Qian, K.; Sheng, H.; Zheng, K. Anti-interference small target tracking from infrared dual waveband imagery. Infrared Phys. Technol. 2021, 118, 103882. [Google Scholar] [CrossRef]
  3. Liu, Y.F.; Cao, L.H.; Ning, L.I.; Zhang, Y.F. Detection of space infrared weak target based on YOLOv4. Liq. Cryst. Disp. 2021, 36, 615–623. [Google Scholar] [CrossRef]
  4. He, S.; Xie, Y.; Yang, Z.; He, X.; Liu, X. IHBF-Based Enhanced Local Contrast Measure Method for Infrared Small Target Detection. Infrared Technol. 2022, 44, 1132–1138. [Google Scholar]
  5. Hou, W.; Sun, X.; Shang, Y.; Yu, Q. Present State and Perspectives of Small Infrared Targets Detection Technology. Infrared Technol. 2015, 37, 1–10. [Google Scholar]
  6. Du, J.; Lu, H.; Hu, M.; Zhang, L.; Shen, X. CNN-Based Infrared Dim Small Target Detection Algorithm Using Target-Oriented Shallow-Deep Features and Effective Small Anchor. IET Image Process. 2021, 15, 1–15. [Google Scholar] [CrossRef]
  7. Jiang, P.; Ergu, D.; Liu, F.; Cai, Y.; Ma, B. A Review of YOLO algorithm developments. Procedia Comput. Sci. 2022, 199, 1066–1073. [Google Scholar] [CrossRef]
  8. Dai, J.; Zhao, X.; Li, L.; Liu, W.; Chu, X. Improved YOLOv5-based infrared dim-small target detection under complex background. Infrared Technol. 2022, 44, 504–512. [Google Scholar]
  9. YOLOv8. Available online: https://github.com/ultralytics/ultralytics (accessed on 10 September 2023).
  10. Ju, M.; Luo, J.; Liu, G.; Luo, H. ISTDet: An Efficient End-to-End Neural Network for Infrared Small Target Detection. Infrared Phys. Technol. 2021, 114, 103659. [Google Scholar] [CrossRef]
  11. Deng, H.; Zhang, Y.; Li, Y.; Cheng, K.; Chen, Z. BEmST: Multiframe Infrared Small-Dim Target Detection Using Probabilistic Estimation of Sequential Backgrounds. IEEE J. Sel. Top. Appl. Earth Obs. Remote Sens. 2024, 62, 5003815. [Google Scholar] [CrossRef]
  12. Mirzaei, B.; Nezamabadi-Pour, H.; Raoof, A.; Derakhshani, R. Small Object Detection and Tracking: A Comprehensive Review. Sensors 2023, 23, 6887. [Google Scholar] [CrossRef]
  13. Hou, R.; Yan, P.; Duan, X.; Wang, X. Unsupervised Image Sequence Registration and Enhancement for Infrared Small Target Detection. IEEE Trans. Geosci. Remote Sens. 2024, 62, 5620814. [Google Scholar] [CrossRef]
  14. Wang, W.; Xiao, C.; Dou, H.; Liang, R.; Yuan, H.; Zhao, G.; Chen, Z.; Huang, Y. CCRANet: A Two-Stage Local Attention Network for Single-Frame Low-Resolution Infrared Small Target Detection. Remote. Sens. 2023, 15, 5539. [Google Scholar] [CrossRef]
  15. Yi, W.; Fang, Z.; Li, W.; Hoseinnezhad, R.; Kong, L. Multi-Frame Track-Before-Detect Algorithm for Maneuvering Target Tracking. IEEE Trans. Veh. Technol. 2020, 69, 4104–4118. [Google Scholar] [CrossRef]
  16. Peng, J.; Zhao, H.; Hu, Z.; Zhuang, Y.; Wang, B. Siamese infrared and visible light fusion network for RGB-T tracking. Int. J. Mach. Learn. Cybern. 2023, 14, 3281–3293. [Google Scholar] [CrossRef]
  17. Cheng, Y.; Lai, X.; Xia, Y.; Zhou, J. Infrared Dim Small Target Detection Networks: A Review. Sensors 2024, 24, 3885. [Google Scholar] [CrossRef] [PubMed]
  18. Xinlong, L.; Hamdulla, A. Research on Infrared Small Target Tracking Method. In Proceedings of the 12th International Conference on Measuring Technology and Mechatronics Automation (ICMTMA), Phuket, Thailand, 28–29 February 2020; pp. 610–614. [Google Scholar]
  19. Chen, Y.; Wang, Z.; Shao, W.; Yang, F.; Sun, J. Multi-scale Transformer Fusion Method for Infrared and Visible Images. Infrared Technol. 2023, 45, 266–275. [Google Scholar]
  20. Zhang, Y.H.; Zhang, P.C.; He, Z.F.; Wang, S. Lightweight Real-time Detection Model of Infrared Pedestrian Embedded in Fine-scale. Acta Photonica Sin. 2022, 51, 091000. [Google Scholar]
  21. Hu, R.; Rui, T.; Ouyang, Y.; Wang, J.; Jiang, Q.; Du, Y. DMFFNet: Dual-Mode Multi-Scale Feature Fusion-Based Pedestrian Detection Method. IEEE Access 2022, 1, 1. [Google Scholar] [CrossRef]
  22. Hou, F.; Zhang, Y.; Zhou, Y.; Zhang, M.; Lv, B.; Wu, J. Review on Infrared Imaging Technology. Sustainability 2022, 14, 11161. [Google Scholar] [CrossRef]
  23. Sun, H.; Liu, Q.; Wang, J.; Ren, J.; Wu, Y.; Zhao, H.; Li, H. Fusion of Infrared and Visible Images for Remote Detection of Low-Altitude Slow-Speed Small Targets. IEEE J. Sel. Top. Appl. Earth Obs. Remote Sens. 2021, 14, 2971–2983. [Google Scholar] [CrossRef]
  24. Wang, Y.; Zhao, L.; Ma, Y.; Shi, Y.; Tian, J. Multiscale YOLOv5-AFAM-Based Infrared Dim-Small-Target Detection. Appl. Sci. 2023, 13, 7779. [Google Scholar] [CrossRef]
  25. Varghese, R.; Sambath, M. YOLOv8: A Novel Object Detection Algorithm with Enhanced Performance and Robustness. In Proceedings of the 2024 International Conference on Advances in Data Engineering and Intelligent Computing Systems (ADICS), Chennai, India, 18–19 April 2024; pp. 1–6. [Google Scholar]
  26. Terven, J.; Córdova-Esparza, D.-M.; Romero-González, J.-A. A Comprehensive Review of YOLO Architectures in Computer Vision: From YOLOv1 to YOLOv8 and YOLO-NAS. Mach. Learn. Knowl. Extr. 2023, 5, 1680–1716. [Google Scholar] [CrossRef]
  27. Hao, X.; Luo, S.; Chen, M.; He, C.; Wang, T.; Wu, H. Infrared small target detection with super-resolution and YOLO. Opt. Laser Technol. 2024, 177, 111221. [Google Scholar] [CrossRef]
  28. Jing, J.; Jia, B.; Huang, B.; Liu, L.; Yang, X. YOLO-D: Dual-Branch Infrared Distant Target Detection Based on Multi-level Weighted Feature Fusion. In Neural Information Processing. ICONIP 2023. Communications in Computer and Information Science; Luo, B., Cheng, L., Wu, Z.G., Li, H., Li, C., Eds.; Springer: Singapore, 2024; Volume 1967. [Google Scholar]
  29. Vasanthi, P.; Mohan, L. Multi-Head-Self-Attention based YOLOv5X-transformer for multi-scale object detection. Multimed. Tools Appl. 2024, 83, 36491–36517. [Google Scholar] [CrossRef]
  30. Yi, H.; Liu, B.; Zhao, B.; Liu, E. Small Object Detection Algorithm Based on Improved YOLOv8 for Remote Sensing. IEEE J. Sel. Top. Appl. Earth Obs. Remote Sens. 2023, 17, 1734–1747. [Google Scholar] [CrossRef]
  31. Chien, C.T.; Ju, R.Y.; Chou, K.Y.; Lin, C.S.; Chiang, J.S. YOLOv8-AM: YOLOv8 with Attention Mechanisms for Pediatric Wrist Fracture Detection. arXiv 2024, arXiv:2402.09329. [Google Scholar]
  32. Chen, J.; Xu, X.; Jeon, G.; Camacho, D.; He, B.G. WLR-Net: An Improved YOLO-V7 with Edge Constraints and Attention Mechanism for Water Leakage Recognition in the Tunnel. IEEE Trans. Emerg. Top. Comput. Intell. 2024, 8, 3105–3116. [Google Scholar] [CrossRef]
  33. Hu, D.; Yu, M.; Wu, X.; Hu, J.; Sheng, Y.; Jiang, Y.; Huang, C.; Zheng, Y. DGW-YOLOv8: A Small Insulator Target Detection Algorithm Based on Deformable Attention Backbone and WIoU Loss Function. IET Image Process. 2024, 18, 1096–1108. [Google Scholar] [CrossRef]
  34. Yao, J.; Song, B.; Chen, X.; Zhang, M.; Dong, X.; Liu, H.; Liu, F.; Zhang, L.; Lu, Y.; Xu, C. Pine-YOLO: A Method for Detecting Pine Wilt Disease in Unmanned Aerial Vehicle Remote Sensing Images. Forests 2024, 15, 737. [Google Scholar] [CrossRef]
  35. Hou, Y.; Tang, B.; Ma, Z.; Wang, J.; Liang, B.; Zhang, Y. YOLO-B: An Infrared Target Detection Algorithm Based on Bi-Fusion and Efficient Decoupled. PLoS ONE 2024, 19, e0298677. [Google Scholar] [CrossRef] [PubMed]
  36. Yang, S.; Zhang, Z.; Wang, B.; Wu, J. DCS-YOLOv8: An Improved Steel Surface Defect Detection Algorithm Based on YOLOv8. In Proceedings of the 7th International Conference on Image and Graphics Processing, Beijing, China, 19–21 January 2024. [Google Scholar]
  37. Zhao, S.; Tao, R.; Jia, F. DML-YOLOv8: An SAR Image Object Detection Algorithm. In Signal, Image and Video Processin; Springer: Berlin/Heidelberg, Germany, 2024. [Google Scholar]
  38. Zhang, M.; Wang, Z.; Song, W.; Zhao, D.; Zhao, H. Efficient Small Target Detection in Underwater Images Using Enhanced YOLOv8 Network. Appl. Sci. 2024, 14, 1095. [Google Scholar] [CrossRef]
  39. Khow, Z.J.; Tan, Y.F.; Karim, H.A.; Rashid, H.A.A. Improved YOLOv8 Model for a Comprehensive Approach to Object Detection and Distance Estimation. IEEE Access 2024, 12, 63754–63767. [Google Scholar] [CrossRef]
  40. Gao, Y.; Liu, W.; Chui, H.-C.; Chen, X. Large Span Sizes and Irregular Shapes Target Detection Methods Using Variable Convolution-Improved YOLOv8. Sensors 2024, 24, 2560. [Google Scholar] [CrossRef] [PubMed]
  41. Zheng, Z.; Wang, P.; Liu, W.; Li, J.; Ye, R.; Ren, D. Distance-IoU Loss: Faster and Better Learning for Bounding Box Regression. arXiv 2019, arXiv:1911.08287. [Google Scholar] [CrossRef]
  42. Zhang, Y.F.; Ren, W.; Zhang, Z.; Jia, Z.; Wang, L.; Tan, T. Focal and Efficient IOU Loss for Accurate Bounding Box Regression. Neurocomputing 2022, 506, 146–157. [Google Scholar] [CrossRef]
  43. Tong, Z.; Chen, Y.; Xu, Z.; Yu, R. Wise-IoU: Bounding Box Regression Loss with Dynamic Focusing Mechanism. arXiv 2023, arXiv:2301.10051. [Google Scholar]
  44. Huang, P.; Tian, S.; Su, Y.; Tan, W.; Dong, Y.; Xu, W. IA-CIOU: An Improved IOU Bounding Box Loss Function for SAR Ship Target Detection Methods. IEEE J. Sel. Top. Appl. Earth Obs. Remote Sens. 2024, 17, 10569–10582. [Google Scholar] [CrossRef]
  45. Sun, S.; Deng, M.; Luo, J.; Zheng, X.; Pan, Y. ST-YOLO: An Improved Metal Defect Detection Model Based on Yolov5. In Proceedings of the 3rd Asian Conference on Algorithms, Computation, and Machine Learning, Shanghai, China, 22–24 March 2024. [Google Scholar]
  46. Ren, C.; Hou, S.; Hou, J.; Pang, Y. SwiF-YOLO: A Deep Learning Method for Lung Nodule Detection. Int. J. Biol. Life Sci. 2024, 5, 20–27. [Google Scholar] [CrossRef]
  47. Kumar, A.; Dhanalakshmi, R. EYE-YOLO: Multi-Spatial Pyramid Pooling and Focal-EIOU Loss Inspired Tiny YOLOv7 for Fundus Disease Detection. Int. J. Intell. Comput. Control. Theory 2024, 17, 503–522. [Google Scholar] [CrossRef]
Figure 1. Infrared and visible comparative images.
Remotesensing 16 02878 g001
Figure 2. Structure of the YOLOv8 Model. YOLOv8 is an advanced real-time object detection algorithm that achieves efficient and accurate detection performance through its unique network architecture design. The figure annotates the main components of the YOLOv8 network, including the input layer, feature extraction layers (which may consist of various convolutional blocks, residual connections, etc.), feature fusion layers, and the final detection layer. These layers work together to process the input image and output the results of object detection.
Remotesensing 16 02878 g002
Figure 3. Schematic diagram of the SA attention mechanism model.
Remotesensing 16 02878 g003
Figure 4. Enhancing small object detection in YOLOv8 with a deformable convolution layer.
Remotesensing 16 02878 g004
Figure 5. Infrared weak targets of various spatial objects and their grayscale displays. The above displays infrared images of a helicopter (a), drone (b), civil aircraft (c), and bird (d), with corresponding grayscale histograms. The histograms show prominent target peaks against a relatively uniform background, facilitating target identification.
Remotesensing 16 02878 g005
Figure 6. Spatial infrared weak target (image inverted 180°). This figure presents the results of 180° inversion for infrared images of a helicopter (a), a drone (b), a civil aviation aircraft (c), and a bird (d), along with their corresponding grayscale histograms. Despite the mirroring effect caused by the inversion, the grayscale histograms clearly indicate that the contrast between the targets and the background remains unchanged, with the target grayscale values remaining prominently visible against the background.
Remotesensing 16 02878 g006
Figure 7. Spatial infrared weak targets (with noise added).This figure presents infrared images of spatial infrared weak targets, including a helicopter (a), UAV (b), civilian aircraft (c), and bird (d), after the addition of salt-and-pepper noise. The noise, appearing as randomly distributed black and white pixels, simulates common noise conditions in real environments. Image inversion is utilized to further analyze the impact of noise on infrared imagery. The grayscale histogram above reveals significant changes in the grayscale distribution post-noise addition, notably the prominent peaks at extreme grayscale values (pure black and pure white), reflecting the randomness of the noise. Remarkably, despite the increased complexity introduced by the noise, the target objects, such as helicopters and UAV, maintain a certain level of contrast against the background.
Remotesensing 16 02878 g007
Figure 8. Spatial infrared weak targets (image fusion). (ad) demonstrate the infrared image fusion results of drone–bird, helicopter–drone, helicopter–bird, and airliner–bird pairs. These fusions span across different perspectives, significantly enriching the dataset, enhancing its diversity, and effectively expanding the sample size. By comparing the grayscale histograms before and after fusion, it is evident that noise peaks at extreme grayscale values are significantly suppressed, while the grayscale distribution of target objects becomes more concentrated and stable, resulting in improved contrast and enhanced recognizability. This validates the effectiveness of the fused images as high-quality, newly added samples.
Remotesensing 16 02878 g008
Figure 9. Illustration of the loss function.
Remotesensing 16 02878 g009
Figure 10. Display of spatial infrared weak target dataset images and their grayscale versions. This figure presents a carefully selected sample of images from the current training dataset along with their corresponding grayscale distribution characteristics. Located at the top left corner, four image blocks showcase the infrared imaging effects of UAVs, civil aircraft, birds, and helicopters under varying environmental conditions. Each block contains four images, displaying the infrared features of their respective targets against diverse backgrounds, thoroughly demonstrating the remarkable capability of infrared imaging technology in capturing a wide range of targets. Immediately following each image block are their corresponding average grayscale histograms. These histograms, derived from statistical analysis, visually represent the distribution differences in grayscale levels between the target images and their backgrounds. Clearly discernible from the histograms, the grayscale value distributions within the target regions of UAVs, civil aircraft, birds, and helicopters are more concentrated and stable compared to their backgrounds, creating a sharp contrast. This indicates that these spatial infrared targets exhibit higher contrast in infrared images, making them more prominent and facilitating subsequent tasks such as recognition, tracking, and analysis.
Remotesensing 16 02878 g010
Figure 11. Detailed schematic diagram of the spatial infrared weak target dataset.
Remotesensing 16 02878 g011
Figure 12. Confusion matrix.
Remotesensing 16 02878 g012
Figure 13. Training model result curves (precision, recall, mAP).
Remotesensing 16 02878 g013
Figure 14. Confusion matrix of the MY-YOLOv8 model.
Remotesensing 16 02878 g014
Figure 15. Exhibition of detection results. This figure set showcases the remarkable achievements of the optimized MY-YOLOv8 model in detecting four specific targets: civil aviation aircraft, birds, drones, and helicopters. The first column on the left features five images focusing on the detection of civil aviation aircraft, followed by detection results for birds, drones, and helicopters, respectively. Upon close examination of these detection outcomes, it becomes evident that the MY-YOLOv8 model demonstrates exceptionally high detection accuracy, achieving a stable recognition accuracy rate of over 95% for all target categories. This solidifies the model’s robust capability for efficient and precise detection of multiple target types in complex environments.
Remotesensing 16 02878 g015aRemotesensing 16 02878 g015b
Table 1. Performance comparison of YOLOv8 model on spatial infrared weak target detection tasks.
Attention MechanismPrecision (%)Recall (%)mAP (%)FPS (Frames/s)
No Attention90.391.293.2147
EMHSA90.190.694.5128
SGE91.290.193.2120
AFT91.489.893.5132
Outlook Attention90.589.294.1136
Shuffle Attention (SA)92.490.894.3132
Table 2. Performance comparison between YOLOv8 model and the model integrated with small target detection layer.
ModelPrecision (%)Recall (%)mAP (%)FPS (Frames/s)
YOLOv8_n (Original Model)90.391.293.2147
YOLOv8_n_Small94.493.896.366
Table 3. Performance comparison of YOLOv8 model before and after incorporating the DCNV4 module.
ModelPrecision (%)Recall (%)mAP (%)FPS (Frames/s)
YOLOv8_n (Original Model)90.391.293.2147
YOLOv8_n_DCNV491.791.494.2103
Table 4. Performance comparison of different loss functions in training the YOLOv8 model.
Loss FunctionPrecision (%)Recall (%)mAP (%)FPS
IoU90.391.293.2147
CIoU91.591.793.8142
DIoU91.191.693.3144
GIoU90.989.293.5140
EIoU91.290.894.1141
WIoU-v392.692.594.7143
Table 5. Detection results of multiple spatial infrared weak targets.
TargetPrecision (%)Recall (%)mAP (%)FPS (Frames/s)
UAV95.194.396.758
Helicopter96.794.298.661
Civil Aviation96.395.198.059
Bird94.395.396.061
Overall95.694.797.459
Table 6. Experimental results comparing MY-YOLOv8 model with other models.
ModelPrecision (%)Recall (%)mAP (%)FPS (Frames/s)
MY-YOLOv895.694.797.459
YOLOv890.391.293.2147
YOLOv781.283.184.495
YOLOv582.681.285.194
YOLOv486.382.884.538
SSD82.181.583.244
Faster R-CNN84.586.985.832
CNN85.288.684.127
Disclaimer/Publisher’s Note: The statements, opinions and data contained in all publications are solely those of the individual author(s) and contributor(s) and not of MDPI and/or the editor(s). MDPI and/or the editor(s) disclaim responsibility for any injury to people or property resulting from any ideas, methods, instructions or products referred to in the content.