Article

Effect of Target Properties on Regolith Production

School of Physics and Electronic Information Engineering, Guilin University of Technology, Guilin 541000, China
*
Author to whom correspondence should be addressed.
Remote Sens. 2024, 16(14), 2650; https://doi.org/10.3390/rs16142650
Submission received: 10 May 2024 / Revised: 1 July 2024 / Accepted: 13 July 2024 / Published: 20 July 2024

Abstract

:
Based on the measurements of regolith thicknesses on the lunar maria (basalts), the lunar regolith was determined to have accumulated at a rate of about 1 m/Gyr since the era of the late heavy bombardment. However, regolith production on porous targets (e.g., crater ejecta deposits) is less studied, especially for Copernican units, and how target properties affect regolith production is not well understood. Here, we measured regolith thicknesses on the ejecta blanket of the Copernicus crater, showing that the regolith production rate sensitively depends on the initial target properties. The regolith production rate of the Copernicus ejecta blanket (3.0 ± 0.1 m/Gyr) is significantly larger than that of the Copernicus impact melt, which was previously estimated to be 1.2 ± 0.2 m/Gyr. Although crater production varies with different targets, our observed crater density of the Copernicus impact melt is indistinguishable from that of the Copernicus ejecta because impacts fracture the melt, causing it to resemble the ejecta. However, due to the fact that the formation of crater ejecta had already caused them to undergo fragmentation, ejecta require fewer fragmentation times to become regolith compared to impact melt; thus, the growth of regolith on the ejecta is faster than the melt. This indicates that similar observed size–frequency distributions do not indicate similar regolith production, especially for the targets with significant differences in initial physical properties.

1. Introduction

Regolith is a thin layer of loose, fragmented material that is produced as a result of an enormous number of small impacts and evolves over time. Lunar regolith mainly consists of soil and dust but also contains fragments of rock and breccia [1,2]. Regolith covers the solid bedrock on the lunar maria, whereas, for the lunar highlands, regolith usually forms at the uppermost layer of megaregolith (megaregolith mainly consists of the ejecta of large craters, which is coarser than regolith). Apart from impacts, other processes could also contribute to the formation of regolith, such as volcanic eruption [3] and thermal stress weathering [4]. Except for being regarded as a potential resource, the lunar regolith provides important information on lunar geology, the impact history of the inner solar system, the solar wind, and galactic cosmic rays [3,5,6,7,8].
Regolith thickness increases with time and is typically thicker on the lunar highlands compared to the lunar maria. Regolith thickness can be estimated by different methods, including in situ seismic measurements [9,10], measurements of small fresh crater morphology [7,11,12,13,14], crater counting [7,15], mapping blocky craters [16,17], and electromagnetic–radar wave-based methods [18,19,20]. Due to the random nature of impact events, regolith is heterogeneous in thickness and is typically 1–8 m in the lunar maria and up to 40 m in the lunar highlands [2,7,11,12,13,14,19,21,22]. Relatively shallow regolith thicknesses of between 2.5 and 15 cm were observed in the vicinity of Surveyor landers based on the depths at which the surface sampler instrument encountered coherent material [15].
The regolith production rate on porous targets (e.g., crater ejecta deposits) is less studied and not well understood, especially for post-mare units (e.g., Copernicus ejecta deposits). Target properties such as bulk density and strength continuously evolve as impact craters accumulate, which affects the size of each subsequently formed crater and, hence, the crater size–frequency distribution (SFD) on the lunar surface, eventually influencing the regolith growth [23]. In this work, we aim to investigate the effect of target properties on regolith production. Impact melt and ejecta blanket of the Copernicus crater (Figure 1a) were formed almost simultaneously during the Copernicus impact event; hence, if their regolith thicknesses are statistically different, they may have been potentially caused by different target properties.

2. Materials and Methods

As Xie, Xiao, Xu, Fa, and Xu [7] already conducted the observation of regolith thickness at the melt of Copernicus crater (see Figure 1a for the location of the regolith measurement), here, we only need to observe regolith thicknesses at the Copernicus ejecta (Section 2.1). Then, in Section 2.2, we investigate the relationship between regolith thickness distribution and the shape of production function based on a regolith growth model. Finally, we measure SFDs of craters on Copernicus ejecta and impact melt to investigate how target properties affect regolith production through comparison between their SFDs.
Although the Copernicus ejecta (termed megaregolith) consists of fragments, they are coarser than the fine-grain regolith. The regolith measured on Copernicus ejecta forms from the repeated gardening of the Copernicus ejecta. According to impact experiments that demonstrated the formation of different crater types on layered targets with different strengths [11], there is a well-defined strength contrast boundary between the regolith layer and the underlying megaregolith, as evidenced by the enormous craters with different types of craters forming on Copernicus ejecta (see below).
Note that the aim of using the two approaches given in Section 2.1 and Section 2.2 is to show that the second approach is unreliable if neglecting the effect of target properties. For the first approach, we use crater type to determine regolith thickness, which is a direct measurement of regolith thickness, whereas the second approach indirectly calculates the thickness distribution of regolith filling into craters in equilibrium (apart from the homogeneous thin layer of regolith overlies the initial pre-impact surface), which depends on the production of craters. The two approaches are independent; thus, the measured craters with different types are not used in the regolith distribution model.

2.1. Regolith Thickness Distribution at the Ejecta of Copernicus Crater

Impact experiments in the laboratory [11] indicated that small (diameter D < 250 m), fresh lunar craters with normal, central-mound, flat-bottomed, and concentric geometry are formed by impacts on layered targets with cohesive substrate underlying weaker material. The conditions for the formations of these crater types can be used to estimate regolith thickness [11]. We used CraterTools [24] to measure the rim-to-rim diameters of small, fresh craters. A crater considered to be fresh is required to appear sharp (e.g., with well-preserved raised rims and a steep inner-wall slope) and to be superposed by a minimum number of craters (i.e., within 1 diameter from the center of the crater of interest; superposed craters with diameters larger than ~10% of the diameter of the crater of interest should be fewer than 5), and usually, but not necessarily, should possess impact rays or bright/dark halos [11,25]. High-resolution (0.5 m) Lunar Reconnaissance Orbiter (LRO) Narrow Angle Cameras (NACs) images (M144768961L and M144768961R) with incidence angles of 51° [26] were used for crater mapping (Figure 1b).
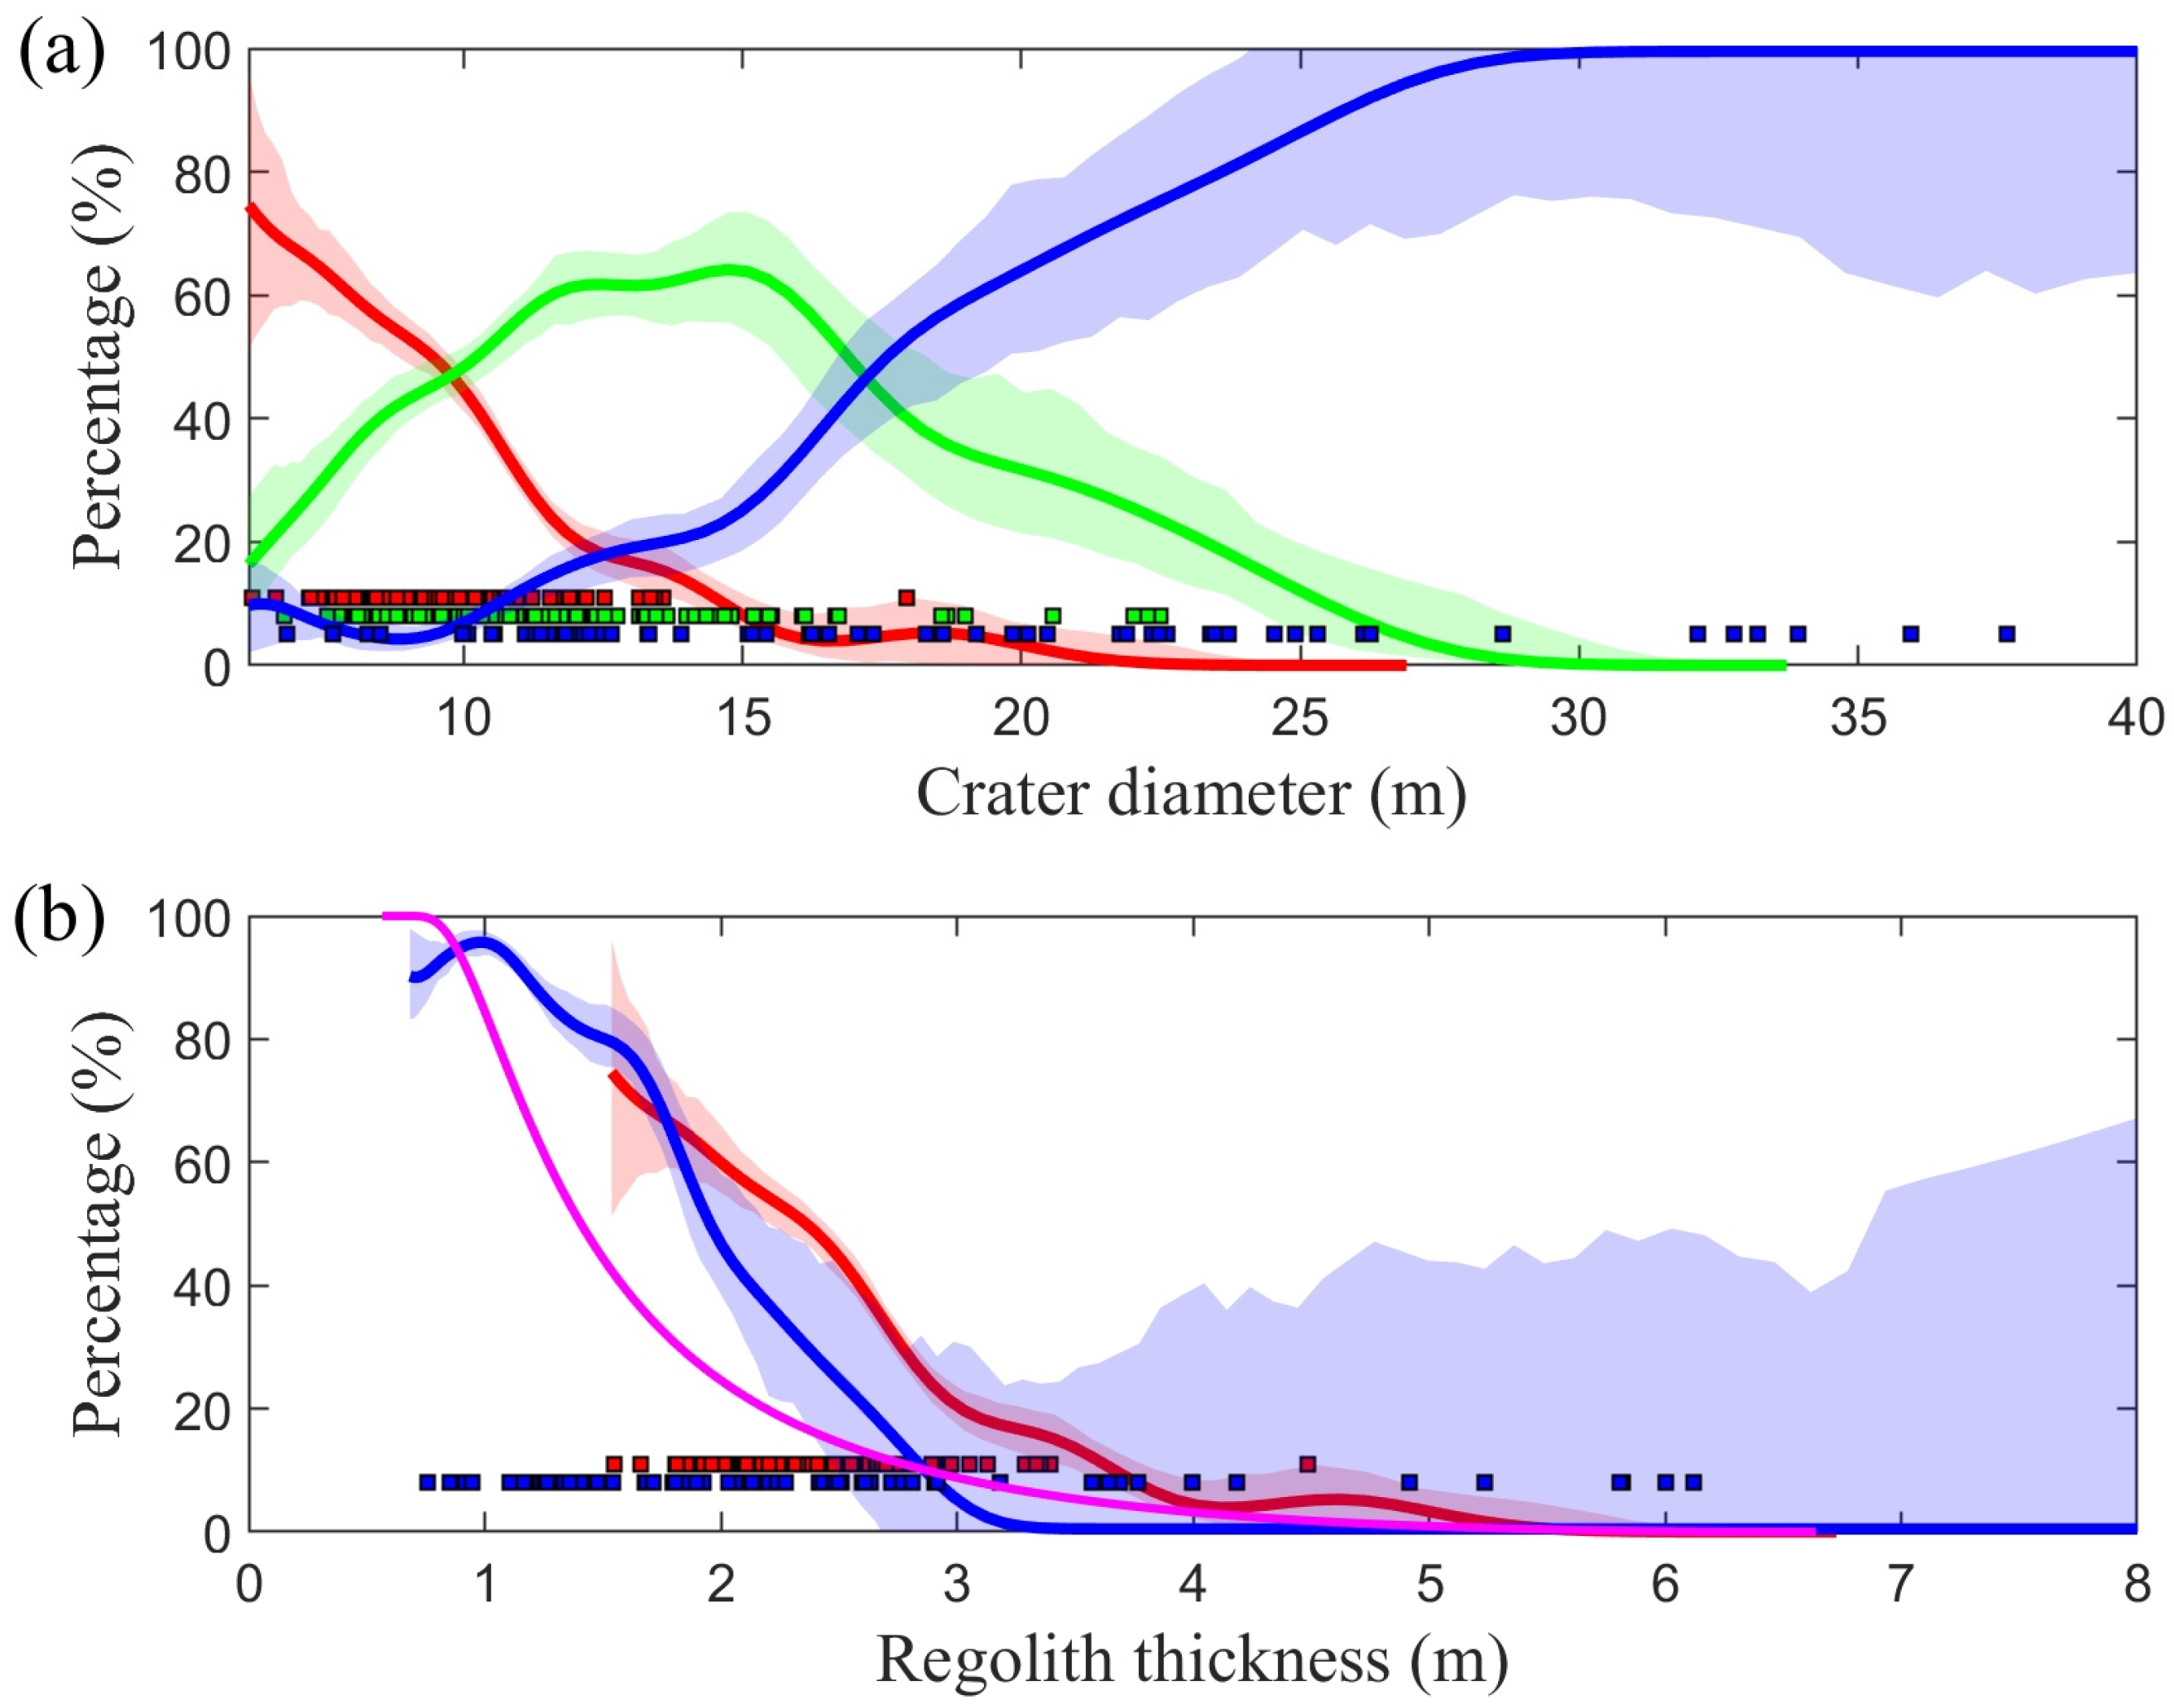
We adopted the method of Xie, Xiao, Xu, Fa, and Xu [7] to calculate the SFD of each type of measured fresh craters as well as SFD uncertainties, which is established from a bootstrap and kernel density estimator-based method [27]. Normal craters form entirely in the regolith, whereas concentric craters penetrate the underlying stronger layer. As a result, the proportion of one type (normal or concentric) of craters in a given small size interval indicates the proportion of area sampled by that size of craters with a regolith thickness larger or smaller than regolith thickness T = Dgm/n, respectively, where Dgm is the geometric mean of its corresponding diameter interval boundaries, and for normal and concentric craters, the values of n are 4 ± 0.1 and 9 ± 0.6 (1σ uncertainty) [11], respectively. Figure 2a shows the proportion of one type (normal or concentric craters) to all crater types in each small diameter interval, and Figure 2b shows regolith thickness distributions derived from the proportion of two types (i.e., normal or concentric craters). The 1σ uncertainty of a median diameter (the diameter corresponds to 50% surface coverage, e.g., 17.6 m for concentric craters of Figure 2a) is adopted to be half of the diameter interval with a confidence interval from 16% to 84% for simplicity of showing uncertainty. For instance, the lower and upper boundaries of the blue-filled polygons in Figure 2a represent the 16% and 84% cumulative probabilities derived from a bootstrap and kernel density estimator-based method, respectively, and the corresponding diameter interval with a confidence interval from 16% to 84% is 3.4 m, resulting in a 1σ uncertainty of 1.7 m. Considering the uncertainties of both the median diameter and n [28], we derived the uncertainty of the median regolith thickness. For simplicity, we ignored the uncertainty of the number of all crater types when deriving the proportion of each crater type in each size interval because all crater types together have better statistics than any crater type.

2.2. Regolith Thickness Distribution Model

Lunar regolith is formed by a combination of excavation of bedrocks by relatively larger craters and repeated gardening by smaller craters. The formation and growth of lunar regolith thickness have been simulated using crater-accumulation models. Shoemaker, Batson, Holt, Morris, Rennilson, and Whitaker [15] utilized crater size–frequency distribution to predict the lunar regolith thickness as a function of surface age, whereas more complicated Monte Carlo models were established to simulate regolith growth, which considered the relationship between crater type (i.e., the geometry of craters can be normal, concentric, central-mound and flat-bottomed) and the volume of excavated material [29,30]. The two models predict consistent results using the same crater production function [1]. We adopted the model of Xie, Xiao, Xu, Fa, and Xu [7], which is revised from the model of Shoemaker, Batson, Holt, Morris, Rennilson, and Whitaker [15], to calculate regolith thickness distribution as a function of SFD slope. We briefly summarize their model as follows:
(i)
Determine the largest craters in equilibrium by calculating the intersection point between the production and equilibrium populations.
For simplicity, a production function is assumed as:
N ( > D ) = a D b
where N(>D) is the cumulative density of diameter > D craters, and both a and b are constant. The cumulative density of craters in equilibrium is:
N e q ( > D ) = 1.54 a e q D 2
where aeq is a constant. Craters reached equilibrium at a crater density of between 1% and 10% of geometric saturation density [31], which corresponds to aeq between 0.01 and 0.1. We adopt a typical value of aeq = 0.06. Calculating the intersection point between equations (1) and (2) gives the largest craters in equilibrium D e q = ( 1.54 a e q / a ) 1 / ( b + 2 ) . The maximum regolith thickness is located within the largest crater that has reached equilibrium.
(ii)
Calculate the distribution of regolith based on craters in equilibrium.
For regolith in cavities (below pre-impact surface) of craters in equilibrium, the fraction of surface covered by regolith thicker than regolith thickness T is [7]:
W ( > T ) = 1 exp ( π k 2 a b 4 ( D e q b + 2 b + 2 + D min b + 2 ( b + 1 ) ( b + 2 ) D min D e q b + 1 b + 1 ) )
where β = 0.8, λ = 0.17 for diameter < 400 m craters, k = 0.86, and D min = T / ( β λ ) is the minimum diameter of craters whose maximum depth of regolith equals T (relative to the pre-impact surface).
In general, all craters have some infilled regolith except for the newly formed one, which is extremely rare; thus, limiting crater sizes to ≤Deq seems to potentially underestimate regolith thickness. But when calculating regolith thickness, all craters smaller than Deq are implicitly assumed to be fully filled by regolith (actually, at any crater smaller than Deq, the density of craters fully filled by regolith is the density difference between production and equilibrium populations rather than the production density), and, hence, this would overestimate the regolith thickness. The latter may approximately compensate for the underestimate. A detailed study on this compensation is beyond the scope of this research, and for simplicity, we neglect the regolith of craters larger than Deq and assume all craters ≤Deq are fully filled by regolith.
Except for regolith in crater cavities (below the pre-impact surface), there should be additional regolith on the pre-impact surface due to a lower regolith density than bedrock by a factor of 1.5 [29]. Based on the conservation of mass, the thickness of the additional regolith, Ta, can be determined. Thus, the median thickness is T m e d = T m e d _ c a v i t i e s + T a , where Tmed_ cavities is determined by numerically solving W(>Tmed_ cavities) = 0.5.
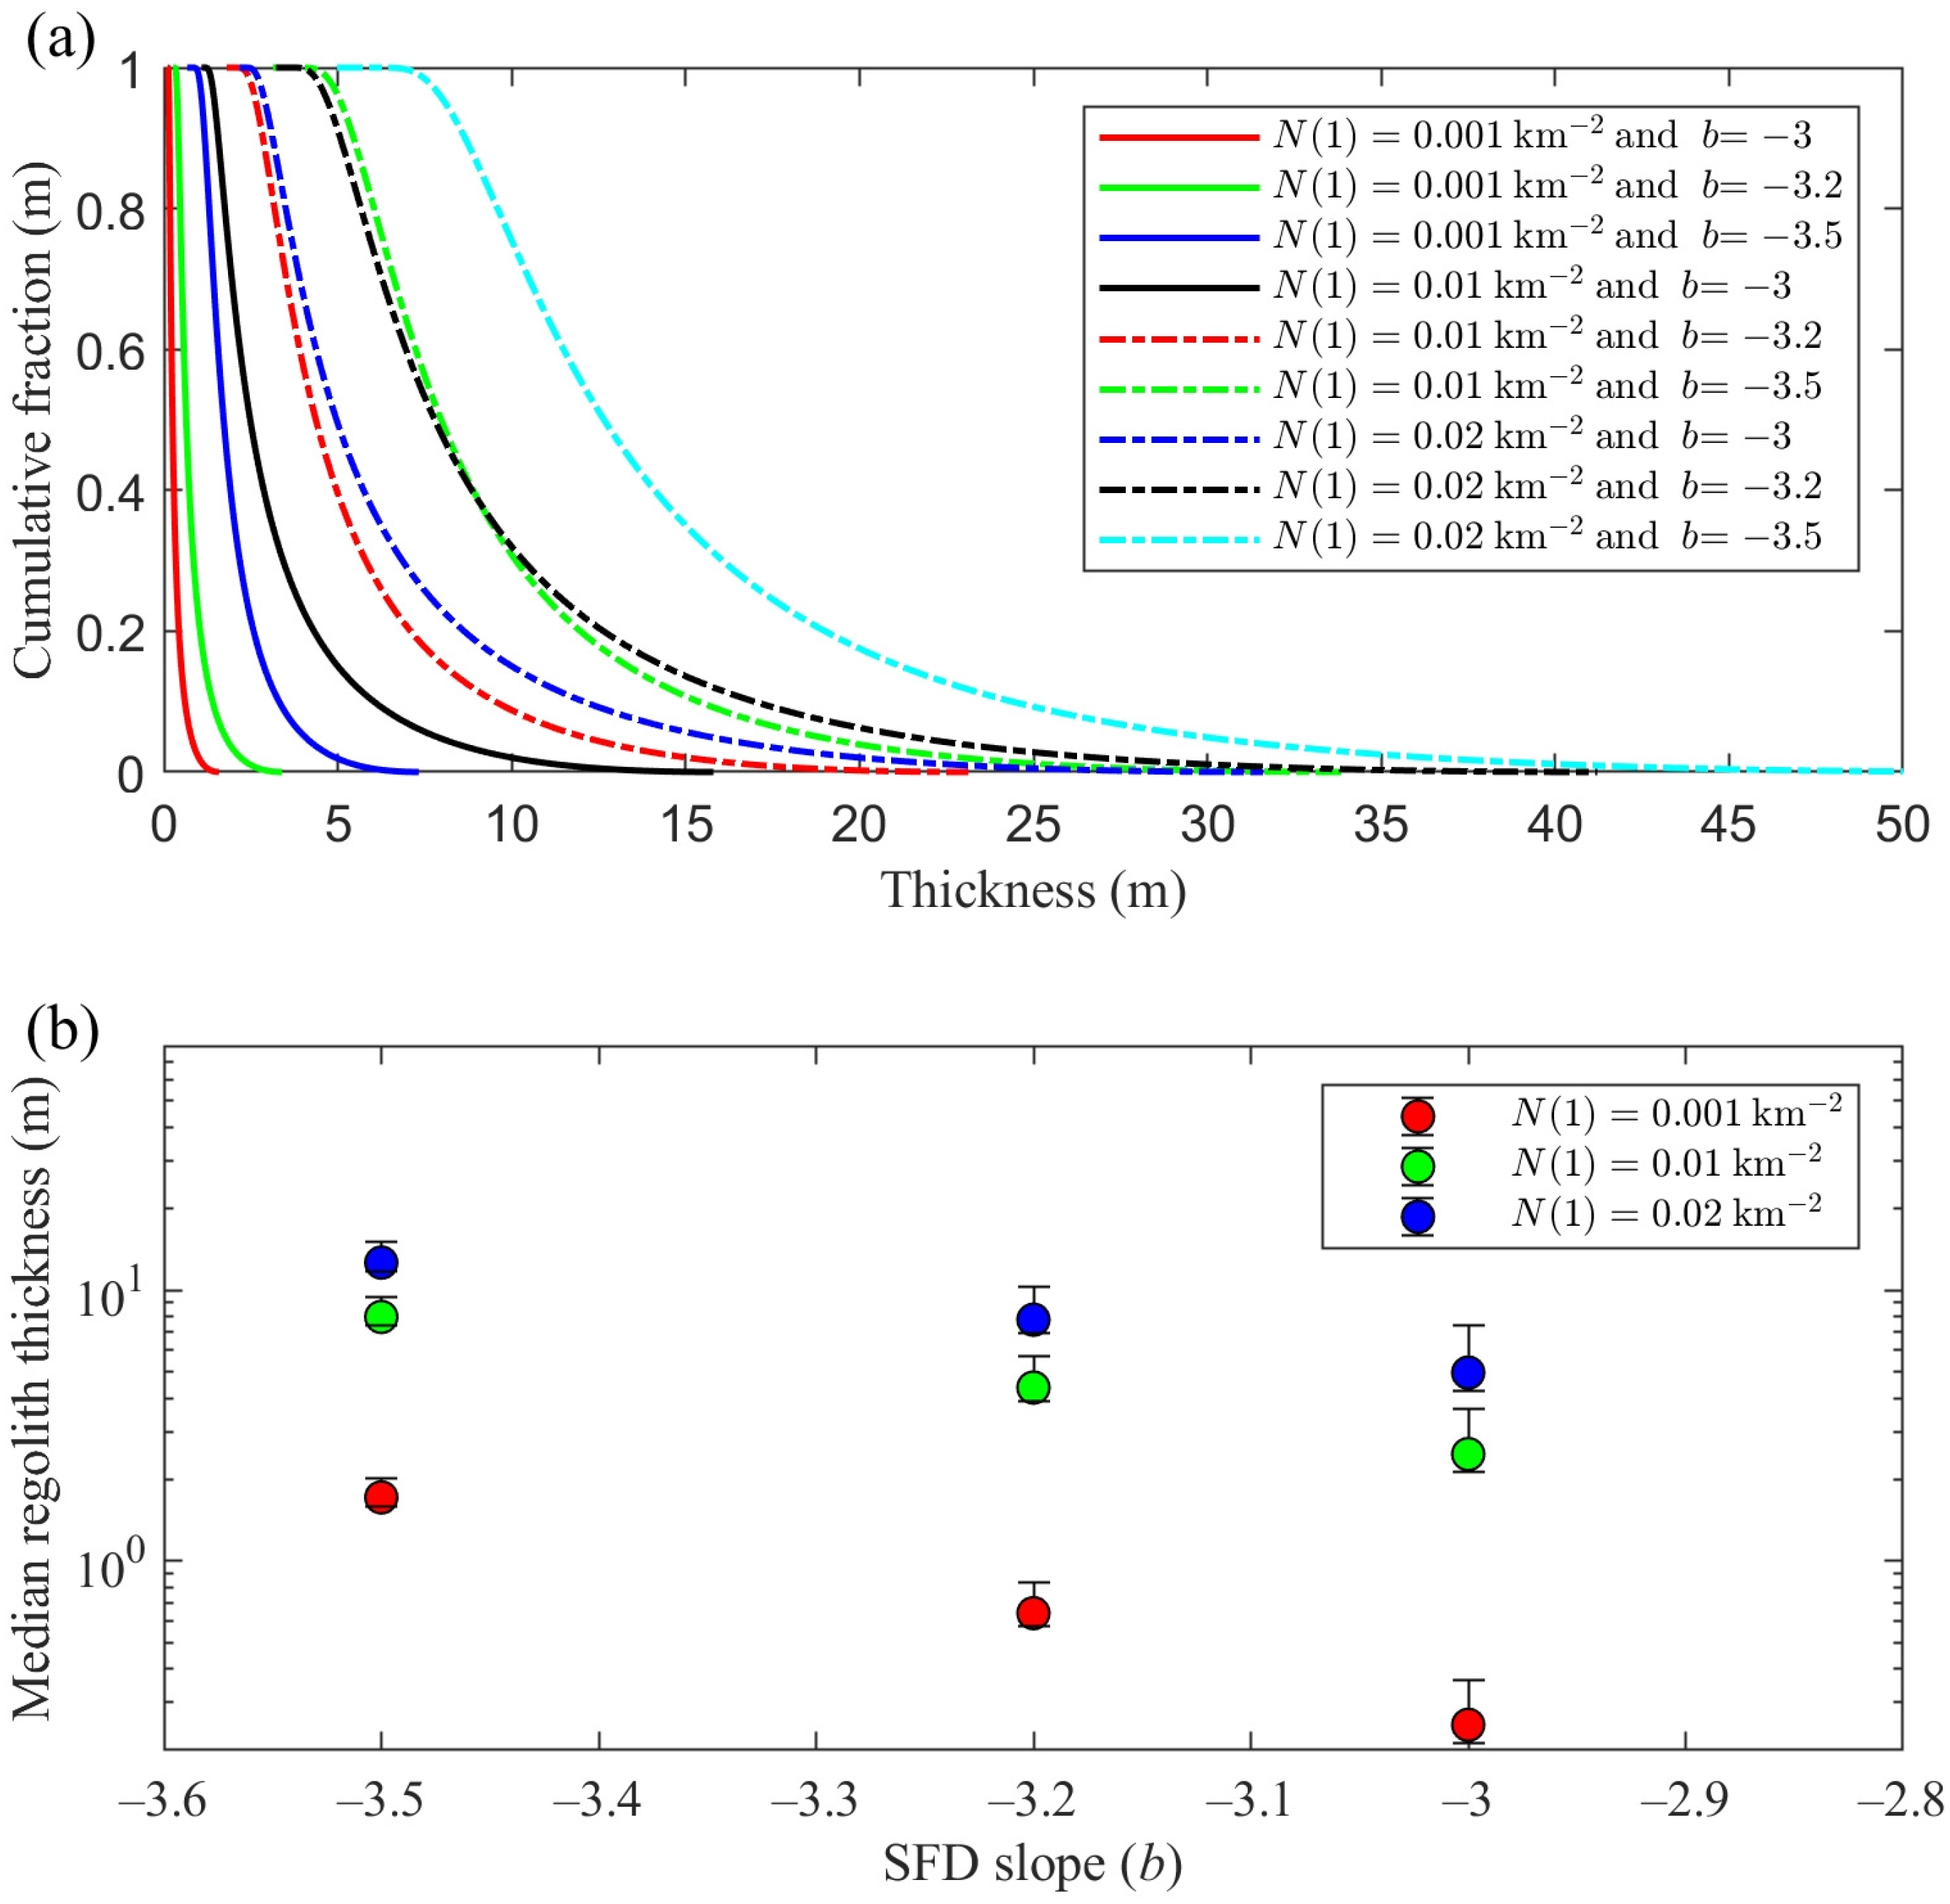
The dependence of regolith thickness distribution on SFD slope (i.e., b) and crater density (while varying the value of b or crater density N(1), other parameters keep constant) is shown in Figure 3. N(1) is the cumulative density of craters larger than 1 km in diameter, equivalent to a.

2.3. Crater Size–Frequency Distributions

Apart from the direct measurement of regolith thickness (Section 2.1), regolith thickness can also be estimated from a crater SFD, which was initially proposed by Shoemaker, Batson, Holt, Morris, Rennilson, and Whitaker [15]. The SFD of craters larger than Deq was used to estimate crater production population, and then the model of Shoemaker, Batson, Holt, Morris, Rennilson, and Whitaker [15] was applied to predict regolith distribution, e.g., [17]. As in Section 2.1, Copernicus ejecta was observed to have a thicker regolith than Copernicus impact melt. The model of Shoemaker, Batson, Holt, Morris, Rennilson, and Whitaker [15] would suggest that the density of diameter > Deq craters on Copernicus ejecta would be larger than that of impact melt. However, as mentioned above, target properties affect crater SFD for a given impact population, and hence, regolith distributions of same-aged units could be different. Here, we test the prediction by observing the crater SFDs of both ejecta and impact melt of the Copernicus crater, which would allow us to investigate how target properties affect regolith production.
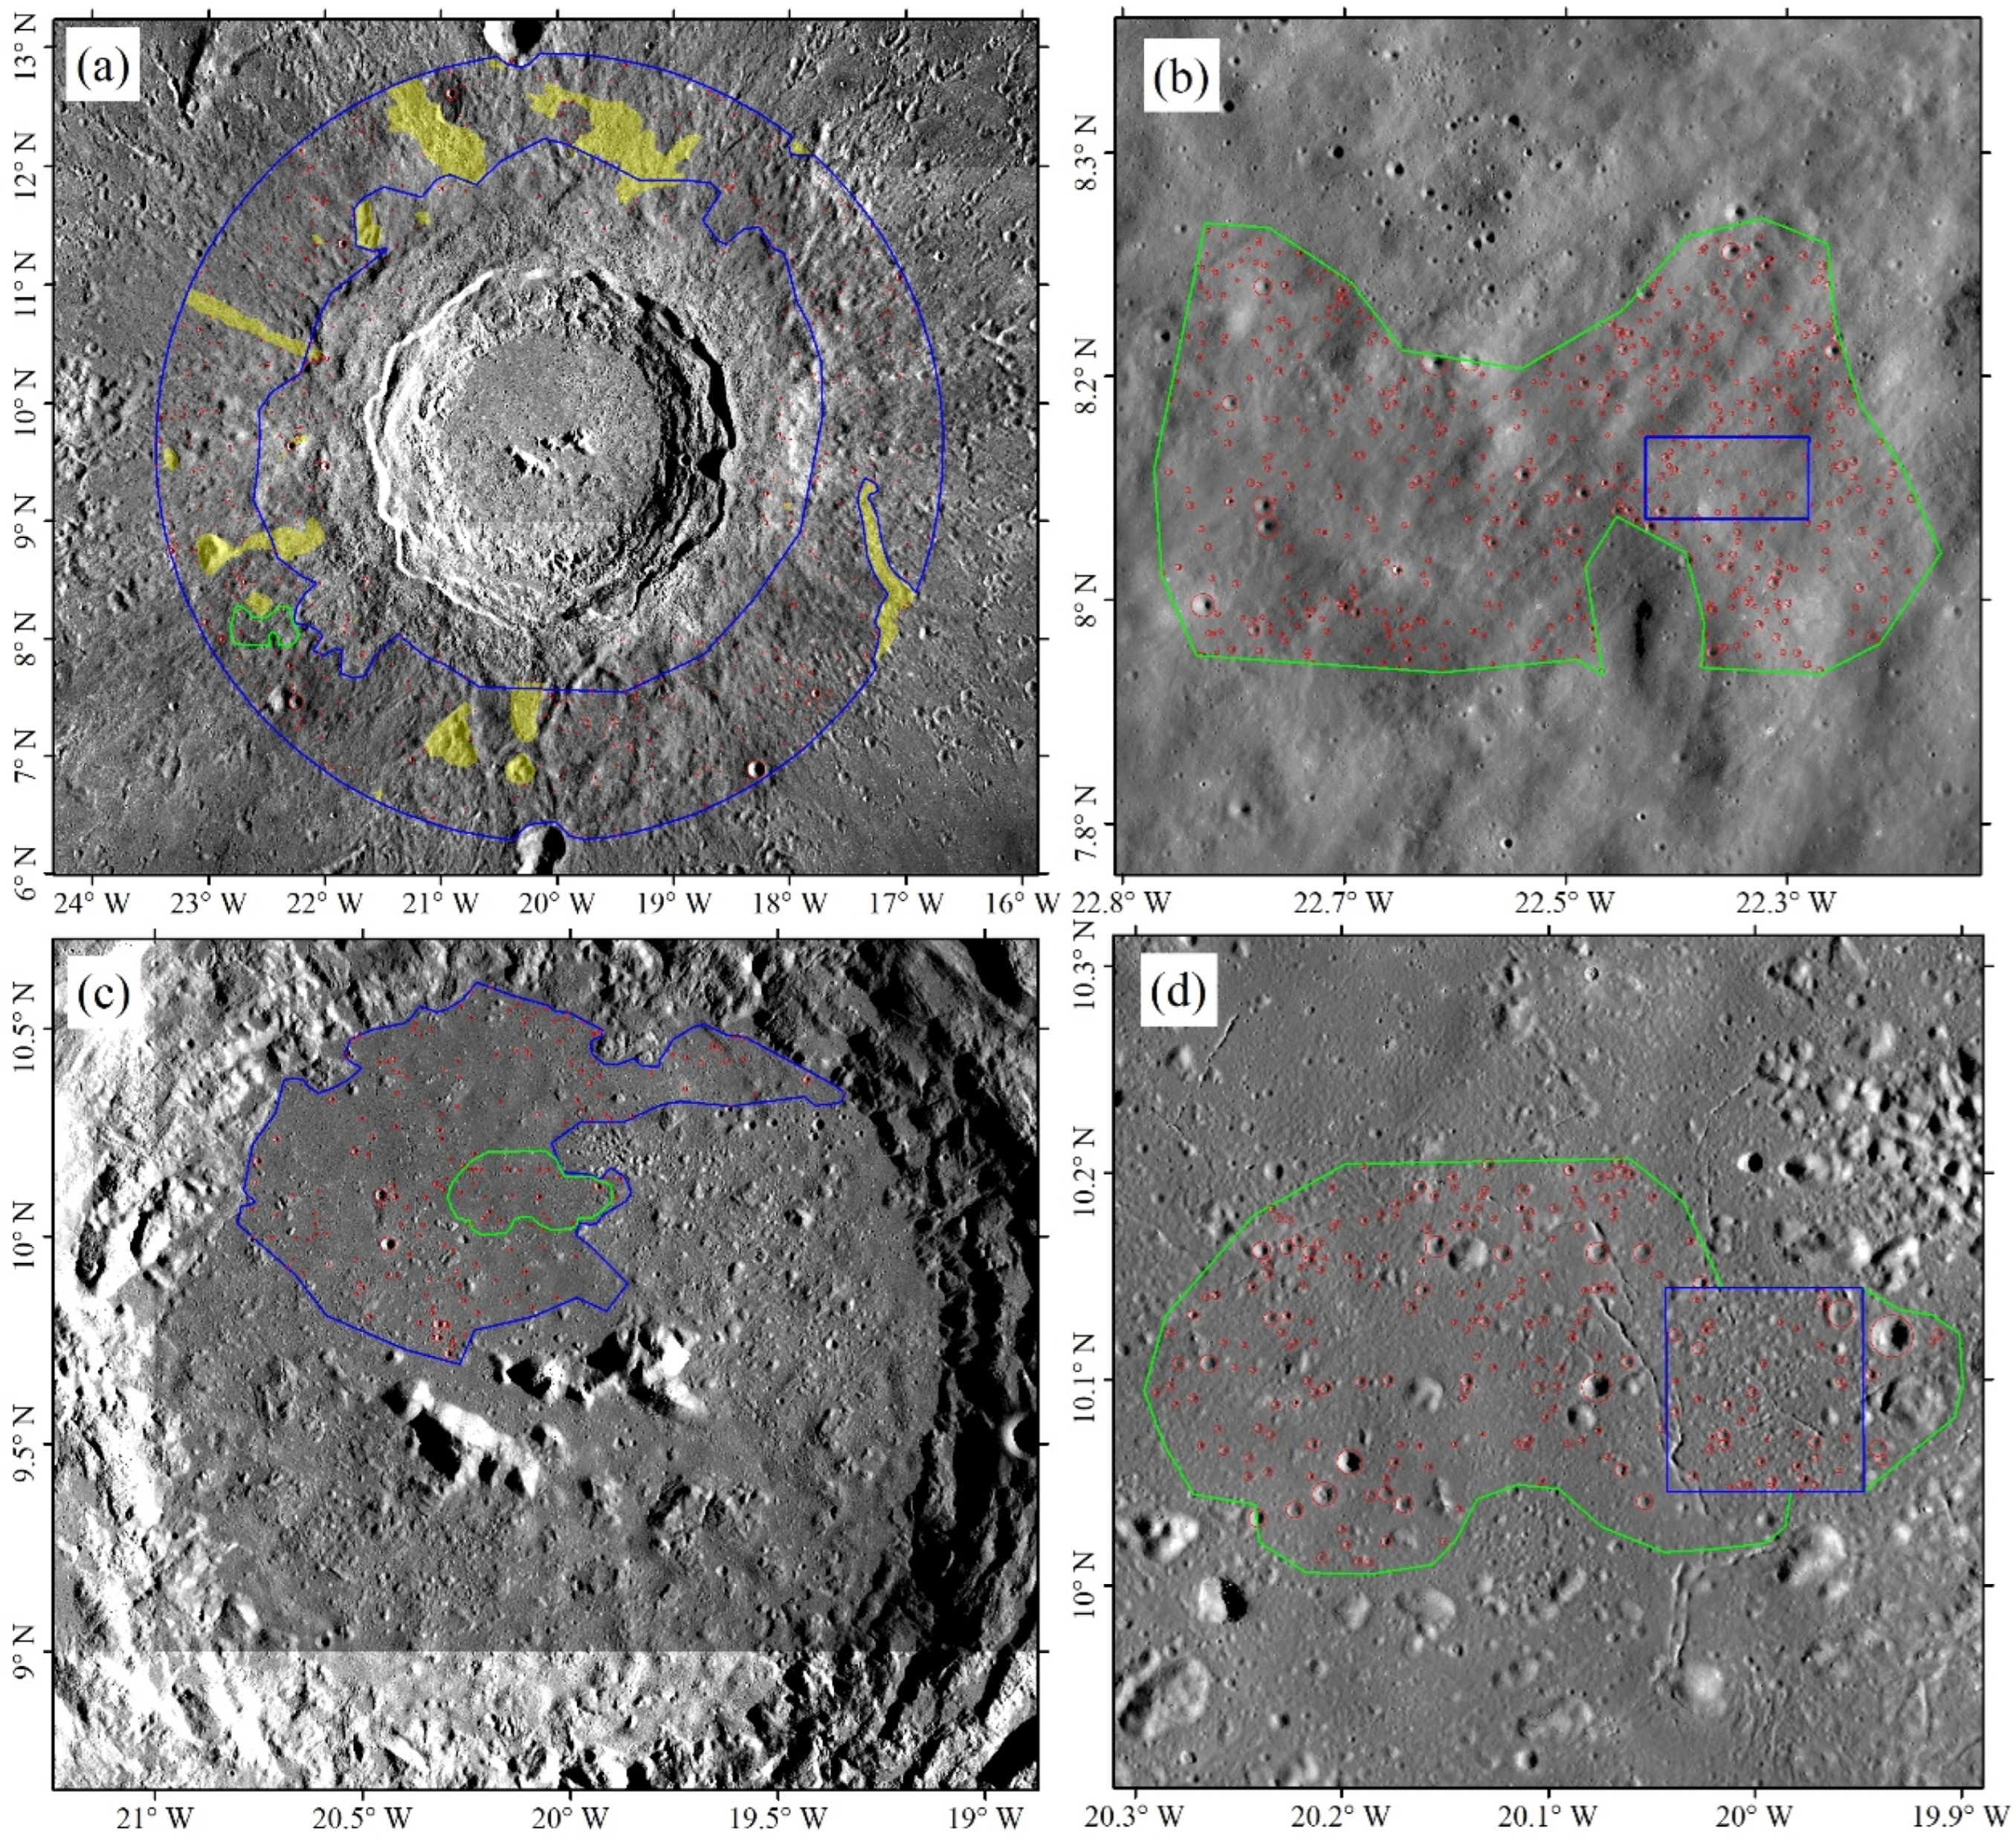
We used Kaguya TC morning images [32] to map craters, as shown in Figure 4. To avoid mapping the enormous number of craters, we adopted a nested crater counting technique [31,33] to map craters; in other words, we mapped large craters in a large area (usually corresponding to the whole crater mapping region) and smaller craters in an interior nested smaller area(s). Specifically, for craters on ejecta, we counted large craters in a large area (the blue polygon in Figure 4a) and smaller craters in a smaller region (the green polygon in Figure 4b; see also Figure 4a). The area of mapping craters on Copernicus ejecta is restrained in a relatively smooth, flat region within the Copernicus ejecta blanket. Boulder-rich areas are excluded, as they could prevent the formation of craters [34]. Typical secondary craters (appearance in chains or clusters) are also excluded (yellow regions). Some pre-Copernicus craters, which can be identified by the appearance of radial ejecta flow (approximately traced back to the Copernicus center) crossing the craters, are large enough to survive the burial by Copernicus ejecta, and hence they should also be excluded. For mapping craters on Copernicus impact melt, we selected a relatively flat subregion of the Copernicus crater floor. Similarly, a large region was used to map large craters (the blue polygon in Figure 4c), and a smaller region was used to map smaller craters (the green polygon in Figure 4d; see also Figure 4c).

3. Results

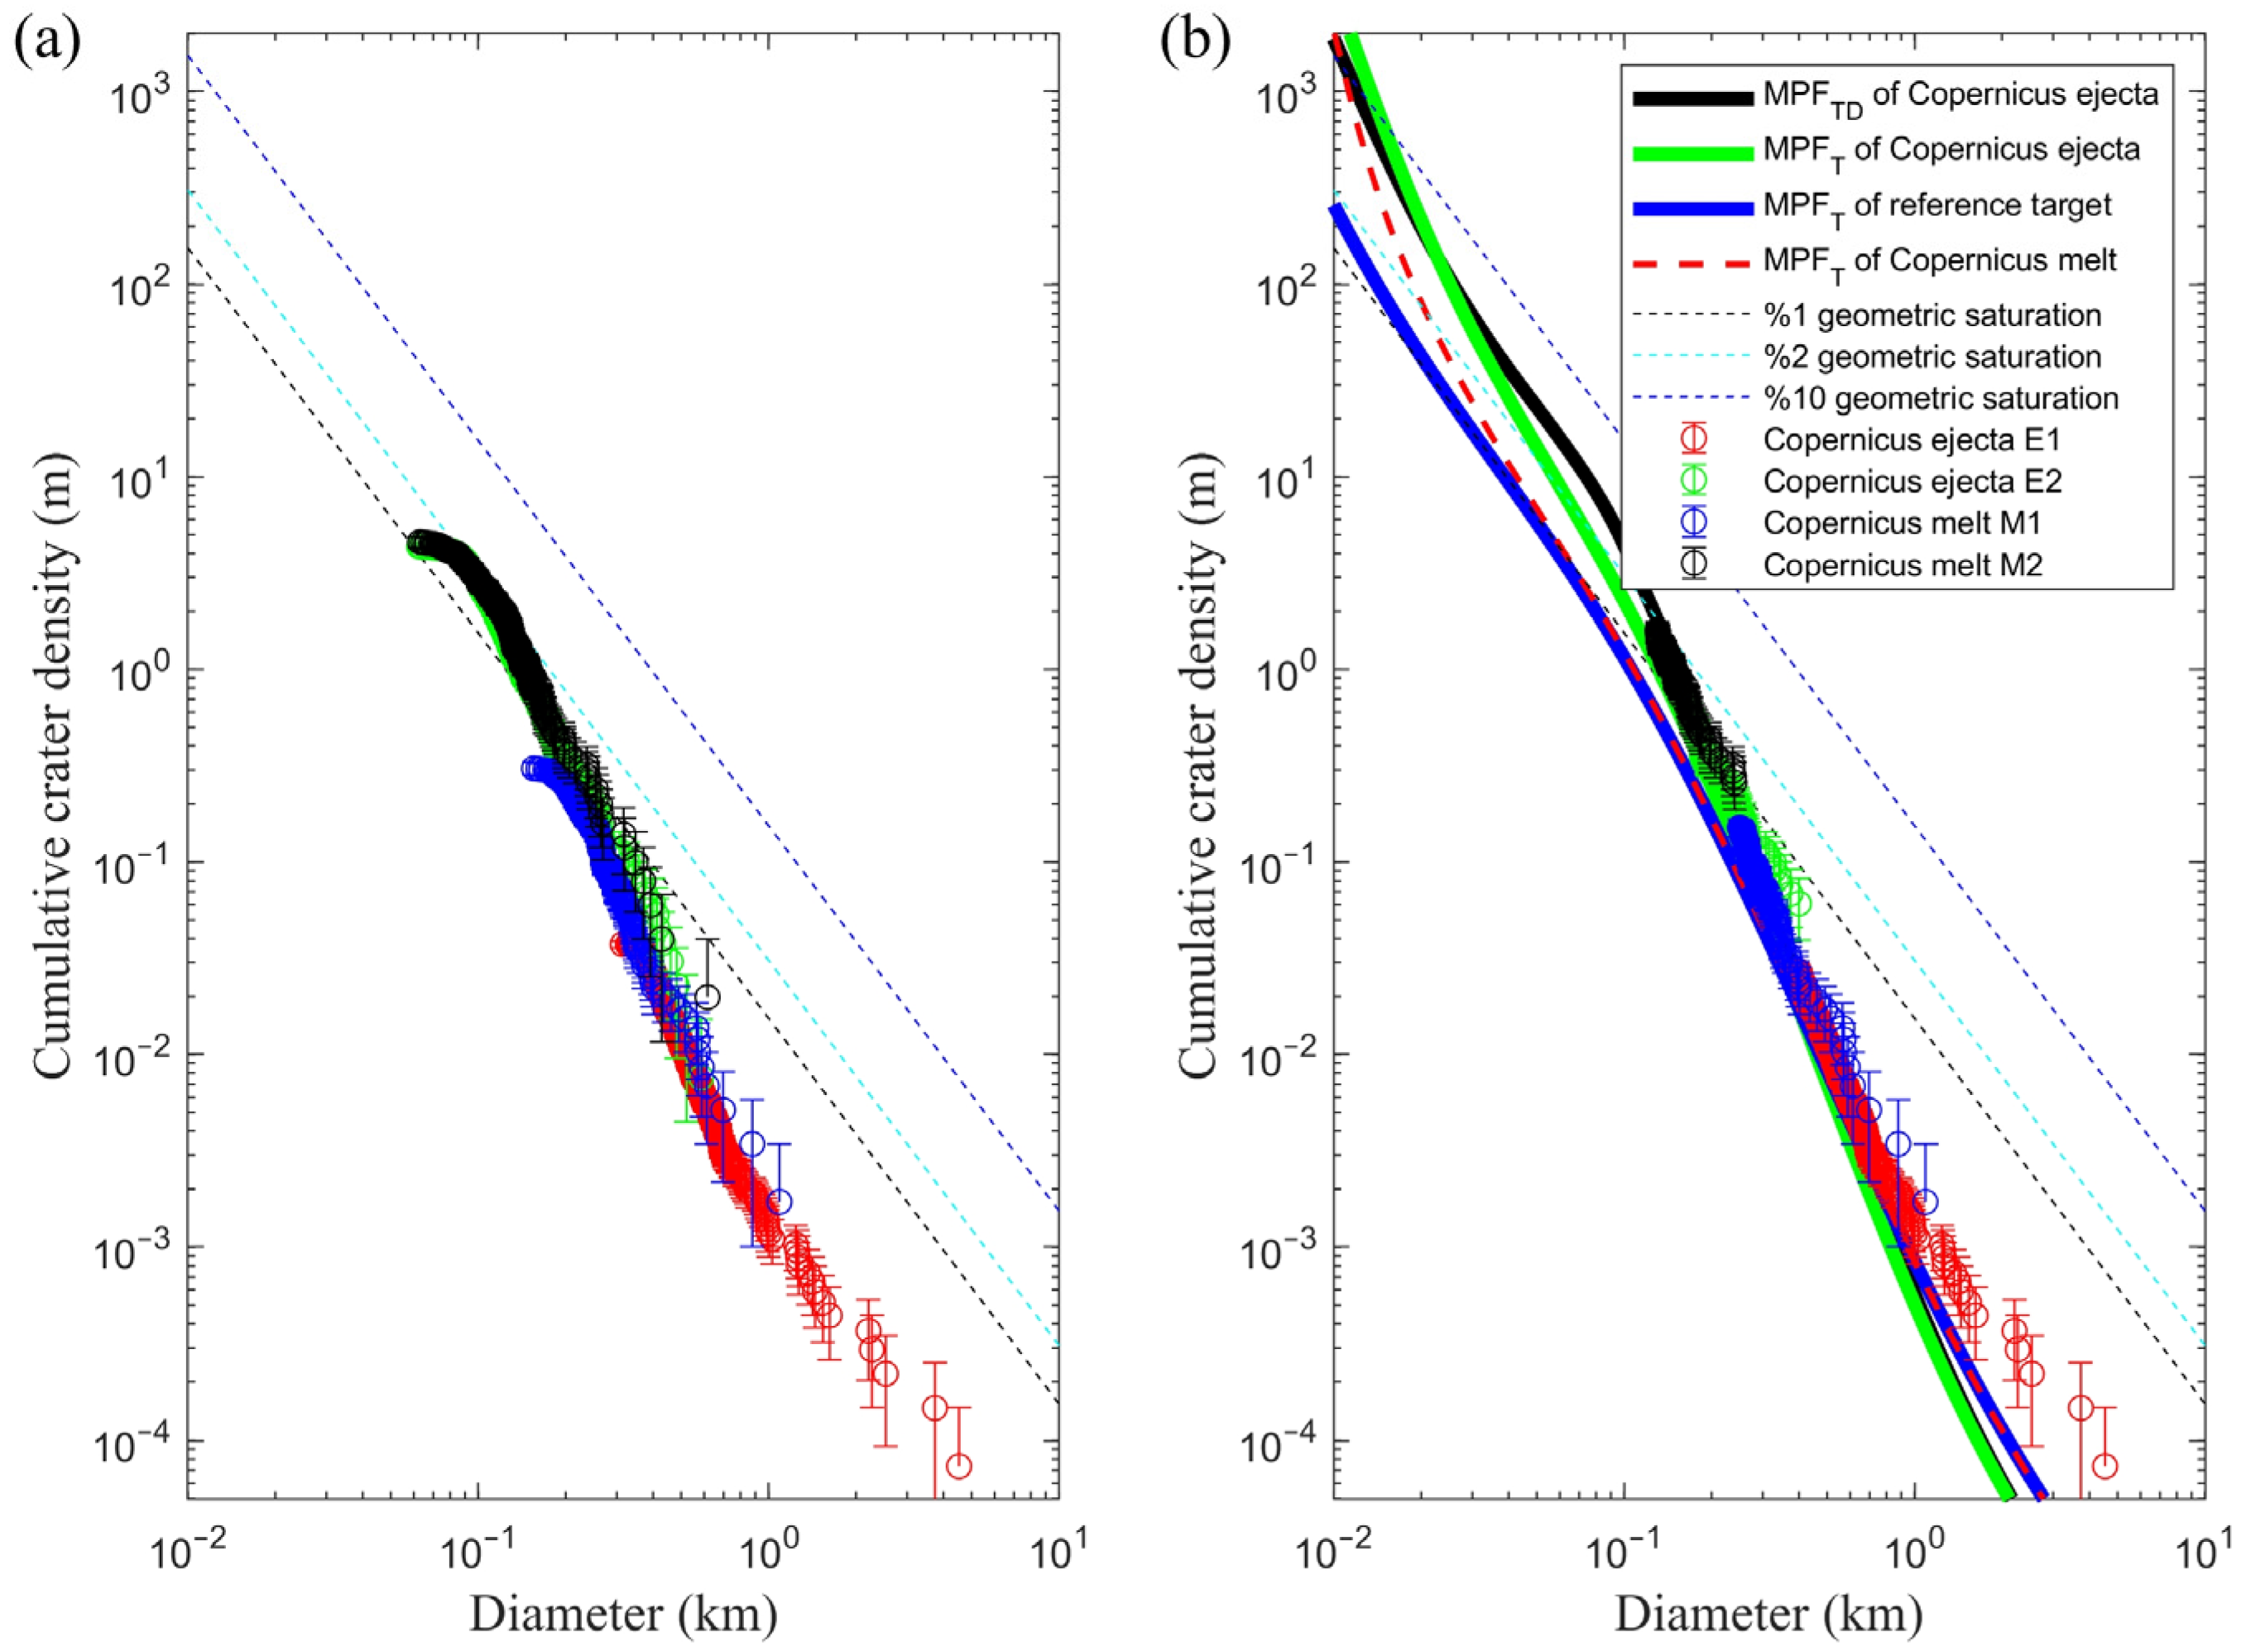
The regolith distribution derived from concentric craters has a median thickness of 2 0.1 + 0.2 m (1σ uncertainty), as shown in Figure 2b. However, the regolith distribution derived from normal craters suggests a little thicker regolith with a median thickness of 2.36 m (its 1σ uncertainty is taken to be 0.12 m). We adopt the larger value (2.36 ± 0.12 m), as the regolith thickness distribution derived from the normal craters has better statistics. For comparison, the regolith of Copernicus melt has a median thickness of only 0.94 ± 0.15 m [7], which is less than that of the ejecta blanket by a factor of 2.5. Adopting that the age of Copernicus crater is 0.8 Ga [35], which is supported by the match between a modeled production function (the black line) and the SFDs observed at Copernicus (Figure 5b), the regolith production rate on impact melt (1.2 ± 0.2 m/Gyr) is significantly less than that on the ejecta blanket (3.0 ± 0.2 m/Gyr).
SFDs of raw measured crater diameters are shown in Figure 5a. For a better comparison between SFDs of Copernicus ejecta and impact melt, we remove the data that are incomplete, and for the overlapped diameter ranges, we adopt the data with better statistics (Figure 5b). Crater SFDs given by crater diameter measurements show that the observed density of craters at the ejecta blanket is consistent with that of the impact melt within 1σ uncertainty (Figure 5b). This is consistent with the result of Xiao and Werner [36], who also conducted crater SFD measurements on four impact melt pools, and their results are consistent with those of larger diameters on the northwestern crater floor measured by Namiki and Honda [37] and the ejecta measured by Hiesinger et al. [38]. Therefore, all these results suggest that the crater density of Copernicus ejecta is similar to that of Copernicus impact melt.
The observed Deq is about 120 m (Figure 5a), which is similar to a previous estimate of 100 m [36]. However, the density of the craters in equilibrium only reaches about 2% of the geometric saturation, which is significantly less than the model-adopted value of 6%. When mapping craters, the density of craters in equilibrium is sensitive to the incident angle, and a larger incident angle results in a higher density (crater densities differ by a factor up to about 2), whereas for larger (i.e., diameter > Deq) craters, crater SFDs mapped by different crater counters are similar [39]. In addition, compared with larger ones, the density of craters in equilibrium is more easy to be altered, such as by ejecta blanketing. Therefore, we prefer to use a fixed value of geometric saturation rather than using an observed value, achieving a more robust result. Therefore, the regolith distribution model given in Section 2.2 does not require observed SFD of craters in equilibrium to determine regolith thickness distribution. For comparison, we also calculate the median thicknesses by taking 1 and 10% geometric saturations to serve as the upper and lower bounds of the assumed typical median thickness with 6% geometric saturation (Figure 3b).
Figure 5. Observed crater SFDs of Copernicus crater by using the nested crater counting technique. (a) SFDs of the raw diameter data, and (b) constructed SFDs of Copernicus ejecta and impact melt. The data points in panel (a) correspond to the data with the same colors shown in panel (b). The 1, 2, and 10% geometric saturations (the dashed lines) are shown for comparison. The MPFT represents the modeled production population of craters on a 0.8 Ga-old target (Copernicus ejecta, Copernicus impact melt, or a competent-rock-like reference target) with consideration of target properties [40]. The MPFTD of Copernicus ejecta, which considers the effect of topographic degradation on the MPFT of Copernicus ejecta, matches with the observed Copernicus SFDs (as measurement error has a minor effect on SFDs; thus, here we neglect the measurement error when comparing SFDs). In contrast to the MPFT of a reference target (competent rock does not change with time), the MPFT of Copernicus melt accounts for the fragmentation by subsequent impacts, and hence, it gradually follows the trend in the MPFT of Copernicus ejecta for craters smaller than about 10 m.
Remotesensing 16 02650 g005

4. Discussion

4.1. The Contribution of Regolith Growth from Secondary Cratering

The contribution of self-secondary craters is minor. The median regolith thickness of Tycho (85 km in diameter) ejecta deposits is only about 0.1 m [15], which provides a constraint on the upper limit of regolith production from self-secondary cratering for Tycho-size crater (note that this does not consider secondary craters from distal craters), such as Copernicus crater (93 km in diameter). This indicates that the contribution of regolith production from Copernicus self-secondary cratering is unlikely to be significantly larger than 0.1 m. Therefore, Copernicus self-secondary cratering should not be a major regolith growth contributor on Copernicus regolith (likely less than 7%).
Potential contribution from distal secondary craters is also likely unimportant. Although the minor contribution from self-secondary craters does not rule out the possible dominance by background secondary craters [41,42,43], the consistency between modeled and observed crater SFDs indicates the lunar crater populations are not dominated by background secondary craters [40,44,45]. Therefore, we prefer that our observed craters be dominated by primary craters, and the Copernicus regolith is mainly produced by primary impacts (note that when conducting regolith and SFD measurements, we exclude typical secondary craters, and hence potential contribution has to be from primary-crater-like secondary craters, e.g., background secondary craters).

4.2. The Effect of Target Properties on Regolith Production

The impact melt of Copernicus should be similar to competent rocks, whereas the ejecta deposits of Copernicus are fragmental rocks. Our observations show that the crater density of Copernicus ejecta is similar to that of Copernicus impact melt. This seems to raise difficulty in explaining the larger regolith production rate on ejecta compared with impact melt. However, the difference in the regolith production rate can be interpreted as being a consequence of the initial fragmentation state of the ejecta in contrast to the melt. So, rather than requiring a higher rate of crater production to have a quicker regolith development, the ejecta was already in a state that required fewer impacts (fewer fragmentation times) to develop into what is recognized as regolith, giving it an effective starting advantage. As a result, similar observed SFDs should not indicate similar regolith production, especially for the targets with significant differences in initial physical properties.
Ejecta may consist of a mixture of fractured bedrock and regolith. Different impact events result in varying proportions of these components within the ejecta. The content of regolith within the ejecta potentially affects the rate of regolith development. Although the match between modeled crater production functions and observed SFDs on both regolith and ejecta by using the same sand scaling law suggests that regolith and ejecta act similarly to impacts in terms of crater production [23], a different proportion of regolith mixed in ejecta should affect regolith production as more regolith (equivalent to less rock) content requires fewer fragmentation times.
Measurements of crater size–frequency distribution can be used to estimate regolith thickness [7,15]. Above Deq, the trend was believed to present the production population of craters. However, crater degradation causes the actually observed craters to have a steeper SFD slope than the production population [46]. In addition, this work shows that similar observed SFDs correspond to different regolith thicknesses, and hence, observed SFDs could lead to misleading results if they are considered as production populations and the effect of initial target properties is overlooked. Thus, it is important to take target properties into account when evaluating regolith thickness by examining crater SFDs.
As time goes on, the difference between Copernicus ejecta and impact melt will disappear due to the gradual fragmentation of the melt which causes it to resemble ejecta, i.e., fragmented rocks [23]. However, the model of Xie and Xiao [40] predicts that the modeled production density of craters on impact melt, which is fractured by subsequent impacts, is less than that on ejecta of craters smaller than 1 km in diameter by a factor up to about four (a factor of two in the diameter range from 120 m to 1 km; Figure 5b). This may imply an underestimate of the fracturing rate of target rocks by Xie and Xiao [40], resulting in a slower transformation of the melt into fragments. In other words, the depth of fragments is deeper than they assumed due to the neglect of the damage of the target rock beneath the crater cavity, e.g., [47,48]. When modeling the accumulation of craters, they neglect the transition zone between regolith and bedrock. The neglect is likely the main reason for the underestimation. To remedy this discrepancy, a simple way is to artificially increase the thickness of the regolith layer to approximate the actual target layering. Future works are needed to improve the understanding of the accumulation of crater populations with consideration of the changes in target properties.

5. Conclusions

In this work, we measured regolith thicknesses on the ejecta blanket and impact melt of the Copernicus crater. The regolith production rate of impact melt is observed to be significantly less than that on the ejecta blanket. This difference in the regolith production rate is caused by different target properties. The observed crater density of Copernicus impact melt is similar to that of Copernicus ejecta. Thus, similar observed SFDs do not indicate similar regolith production (note that a similar crater production population should produce similar regolith), especially for the targets with significant differences in initial physical properties.

Author Contributions

Conceptualization, M.X.; Data curation, M.X. and Y.L.; Formal analysis, M.X. and Y.L.; Funding acquisition, M.X.; Investigation, M.X.; Methodology, M.X. and Y.L.; Project administration, M.X.; Resources, M.X.; Software, M.X. and Y.L.; Supervision, M.X.; Validation, M.X. and Y.L.; Visualization, M.X.; Writing—original draft, M.X. and Y.L.; Writing—review and editing, M.X. and Y.L. All authors have read and agreed to the published version of the manuscript.

Funding

This research was supported by the B-type Strategic Priority Program of the Chinese Academy of Sciences (grant No. XDB41000000) and the National Natural Science Foundation of China (grant No. 12173011).

Data Availability Statement

The data were deposited in Zenodo (10.5281/zenodo.12775908).

Acknowledgments

Kaguya TC morning images can be downloaded from https://www.darts.isas.jaxa.jp/planet/pdap/selene/ (accessible on 12 July 2024). LRO images are downloaded from the SER WMS System (http://wms.lroc.asu.edu/lroc/search, accessed on 12 July 2024), and LRO NAC images are processed using the USGS Integrated Software for Imagers and Spectrometers (ISIS 2), which is available online (at https://isis.astrogeology.usgs.gov, accessed on 12 July 2024).

Conflicts of Interest

The authors declare no conflicts of interest.

References

  1. Melosh, H.J. Impact Cratering: A Geologic Process; Oxford University Press: New York, NY, USA, 1989; p. 253. [Google Scholar]
  2. McKay, D.S.; Heiken, G.; Basu, A.; Blanford, G.; Simon, S.; Reedy, R.; French, B.M.; Papike, J. The lunar regolith. In Lunar Sourcebook; Cambridge University Press: Cambridge, UK, 1991; pp. 285–356. [Google Scholar]
  3. Head, J.W.; Wilson, L. Rethinking Lunar Mare Basalt Regolith Formation: New Concepts of Lava Flow Protolith and Evolution of Regolith Thickness and Internal Structure. Geophys. Res. Lett. 2020, 47, e2020GL088334. [Google Scholar] [CrossRef]
  4. Molaro, J.; Byrne, S. Rates of temperature change of airless landscapes and implications for thermal stress weathering. J. Geophys. Res. 2012, 117, E10011. [Google Scholar] [CrossRef]
  5. Fruchter, J.; Rancitelli, L.; Laul, J.; Perkins, R. Lunar regolith dynamics based on analysis of the cosmogenic radionuclides Na-22, Al-26, and Mn-53. In Proceedings of the 8th Lunar Science Conference, Houston, TX, USA, 14–18 March 1977; pp. 3595–3605. [Google Scholar]
  6. Fa, W.; Jin, Y. Global inventory of Helium-3 in lunar regoliths estimated by a multi-channel microwave radiometer on the Chang-E 1 lunar satellite. Chinese. Sci. Bull. 2010, 55, 4005–4009. [Google Scholar] [CrossRef]
  7. Xie, M.; Xiao, Z.; Xu, L.; Fa, W.; Xu, A. Change in the Earth–Moon impactor population at about 3.5 billion years ago. Nat. Astron. 2021, 5, 128–133. [Google Scholar] [CrossRef]
  8. Isachenkov, M.; Chugunov, S.; Akhatov, I.; Shishkovsky, I. Regolith-based additive manufacturing for sustainable development of lunar infrastructure—An overview. Acta Astronaut. 2021, 180, 650–678. [Google Scholar] [CrossRef]
  9. Nakamura, Y.; Dorman, J.; Duennebier, F.; Lammlein, D.; Latham, G. Shallow lunar structure determined from the passive seismic experiment. Moon 1975, 13, 57–66. [Google Scholar] [CrossRef]
  10. Cooper, M.R.; Kovach, R.L.; Watkins, J.S. Lunar near-surface structure. Rev. Geophys. 1974, 12, 291–308. [Google Scholar] [CrossRef]
  11. Quaide, W.L.; Oberbeck, V.R. Thickness determinations of the lunar surface layer from lunar impact craters. J. Geophys. Res. 1968, 73, 5247–5270. [Google Scholar] [CrossRef]
  12. Fa, W.; Liu, T.; Zhu, M.H.; Haruyama, J. Regolith thickness over Sinus Iridum: Results from morphology and size-frequency distribution of small impact craters. J. Geophys. Res. 2014, 119, 1914–1935. [Google Scholar] [CrossRef]
  13. Bart, G.D. The quantitative relationship between small impact crater morphology and regolith depth. Icarus 2014, 235, 130–135. [Google Scholar] [CrossRef]
  14. Di, K.; Sun, S.; Yue, Z.; Liu, B. Lunar regolith thickness determination from 3D morphology of small fresh craters. Icarus 2016, 267, 12–23. [Google Scholar] [CrossRef]
  15. Shoemaker, E.; Batson, R.; Holt, H.; Morris, E.; Rennilson, J.; Whitaker, E. Observations of the lunar regolith and the Earth from the television camera on Surveyor 7. J. Geophys. Res. 1969, 74, 6081–6119. [Google Scholar] [CrossRef]
  16. Shoemaker, E.M.; Morris, E.C. Physical Characteristics of the Lunar Regolith Determined From Surveyor Television Observations. Radio Sci. 1970, 5, 129–155. [Google Scholar] [CrossRef]
  17. Wilcox, B.; Robinson, M.; Thomas, P.; Hawke, B. Constraints on the depth and variability of the lunar regolith. Meteorit. Planet. Sci. 2005, 40, 695–710. [Google Scholar] [CrossRef]
  18. Fa, W.; Wieczorek, M.A. Regolith thickness over the lunar nearside: Results from Earth-based 70-cm Arecibo radar observations. Icarus 2012, 218, 771–787. [Google Scholar] [CrossRef]
  19. Shkuratov, Y.G.; Bondarenko, N.V. Regolith layer thickness mapping of the Moon by radar and optical data. Icarus 2001, 149, 329–338. [Google Scholar] [CrossRef]
  20. Ding, C.; Li, Q.; Xu, J.; Lei, Z.; Li, J.; Su, Y.; Huang, S. Moon-Based Ground Penetrating Radar Derivation of the Helium-3 Reservoir in the Regolith at the Chang’E-3 Landing Site. IEEE J. Sel. Top. Appl. Earth Obs. Remote Sens. 2023, 16, 2764–2776. [Google Scholar] [CrossRef]
  21. Hirabayashi, M.; Howl, B.A.; Fassett, C.I.; Soderblom, J.M.; Minton, D.A.; Melosh, H.J. The Role of Breccia Lenses in Regolith Generation From the Formation of Small, Simple Craters: Application to the Apollo 15 Landing Site. J. Geophys. Res. 2018, 123, 527–543. [Google Scholar] [CrossRef]
  22. Bart, G.D.; Nickerson, R.D.; Lawder, M.T.; Melosh, H.J. Global survey of lunar regolith depths from LROC images. Icarus 2011, 215, 485–490. [Google Scholar] [CrossRef]
  23. Xie, M.; Xiao, Z.; Xu, A. Time-Dependent Production Functions of Lunar Simple Craters on Layered Targets With Consideration of Topographic Degradation. Geophys. Res. Lett. 2019, 46, 10987–10996. [Google Scholar] [CrossRef]
  24. Kneissl, T.; van Gasselt, S.; Neukum, G. Map-projection-independent crater size-frequency determination in GIS environments—New software tool for ArcGIS. Planet. Space Sci. 2011, 59, 1243–1254. [Google Scholar] [CrossRef]
  25. Oberbeck, V.R.; Quaide, W.L. Estimated thickness of a fragmental surface layer of Oceanus Procellarum. J. Geophys. Res. 1967, 72, 4697–4704. [Google Scholar] [CrossRef]
  26. Robinson, M.; Brylow, S.; Tschimmel, M.; Humm, D.; Lawrence, S.; Thomas, P.; Denevi, B.; Bowman-Cisneros, E.; Zerr, J.; Ravine, M. Lunar reconnaissance orbiter camera (LROC) instrument overview. Space Sci. Rev. 2010, 150, 81–124. [Google Scholar] [CrossRef]
  27. Robbins, S.J.; Riggs, J.D.; Weaver, B.P.; Bierhaus, E.B.; Chapman, C.R.; Kirchoff, M.R.; Singer, K.N.; Gaddis, L.R. Revised recommended methods for analyzing crater size-frequency distributions. Meteorit. Planet. Sci. 2018, 53, 891–931. [Google Scholar] [CrossRef]
  28. Bevington, P.R.; Robinson, D.K. Data Reduction and Error Analysis for Physical Sciences; McGraw-Hill: New York, NY, USA, 2003. [Google Scholar]
  29. Oberbeck, V.; Quaide, W.; Mahan, M.; Paulson, J. Monte Carlo calculations of lunar regolith thickness distributions. Icarus 1973, 19, 87–107. [Google Scholar] [CrossRef]
  30. Zhang, M.; Fa, W.; Barnard, E.M.; Eke, V.R. Modeling the Evolution of Lunar Regolith: 2. Growth Rate and Spatial Distribution. J. Geophys. Res. 2023, 128, e2023JE008035. [Google Scholar] [CrossRef]
  31. Gault, D.E. Saturation and equilibrium conditions for impact cratering on the lunar surface: Criteria and implications. Radio Sci. 1970, 5, 273–291. [Google Scholar] [CrossRef]
  32. Haruyama, J.; Ohtake, M.; Matsunaga, T.; Morota, T.; Yokota, Y.; Honda, C.; Hirata, N.; Demura, H.; Iwasaki, A.; Nakamura, R. Planned radiometrically calibrated and geometrically corrected products of lunar high-resolution Terrain Camera on SELENE. Adv. Space Res. 2008, 42, 310–316. [Google Scholar] [CrossRef]
  33. Kirchoff, M.R.; Marchi, S. New insights into lunar terrain properties and their effect on derivation of absolute model ages using Apollo landing sites. Icarus 2023, 391, 115336. [Google Scholar] [CrossRef]
  34. Williams, J.P.; Pathare, A.V.; Costello, E.S.; Gallinger, C.L.; Hayne, P.O.; Ghent, R.R.; Paige, D.A.; Siegler, M.A.; Russell, P.S.; Elder, C.M. The Effects of Terrain Properties Upon the Small Crater Population Distribution at Giordano Bruno: Implications for Lunar Chronology. J. Geophys. Res. 2022, 127, e2021JE007131. [Google Scholar] [CrossRef]
  35. Stöffler, D.; Ryder, G. Stratigraphy and isotope ages of lunar geologic units: Chronological standard for the inner solar system. Space Sci. Rev. 2001, 96, 9–54. [Google Scholar] [CrossRef]
  36. Xiao, Z.; Werner, S.C. Size-frequency distribution of crater populations in equilibrium on the Moon. J. Geophys. Res. 2015, 120, 2277–2292. [Google Scholar] [CrossRef]
  37. Namiki, N.; Honda, C. Testing hypotheses for the origin of steep slope of lunar size-frequency distribution for small craters. Earth Planets Space 2003, 55, 39–51. [Google Scholar] [CrossRef]
  38. Hiesinger, H.; Bogert, C.; Pasckert, J.; Funcke, L.; Giacomini, L.; Ostrach, L.; Robinson, M. How old are young lunar craters? J. Geophys. Res. 2012, 117, E00H10. [Google Scholar] [CrossRef]
  39. Ostrach, L.; Robinson, M.; Denevi, B.; Thomas, P. Effects of incidence angle on crater counting observations. Proc. Lunar Planet. Sci. Conf. 2011, 42, 1202. [Google Scholar]
  40. Xie, M.; Xiao, Z. A new chronology from debiased crater densities: Implications for the origin and evolution of lunar impactors. Earth. Planet. Sci. Lett. 2023, 602, 117963. [Google Scholar] [CrossRef]
  41. Shoemaker, E.M. Preliminary analysis of the fine structure of the lunar surface in Mare Cognitum. In The Nature of the Lunar Surface; Hess, W., Menzel, D., O’Keeffe, J., Eds.; Johns Hopkins Press: Baltimore, MA, USA, 1965; pp. 23–77. [Google Scholar]
  42. McEwen, A.S.; Bierhaus, E.B. The importance of secondary cratering to age constraints on planetary surfaces. Annu. Rev. Earth Planet. Sci. 2006, 34, 535–567. [Google Scholar] [CrossRef]
  43. Xiao, Z. On the importance of self-secondaries. Geosci. Lett. 2018, 5, 17. [Google Scholar] [CrossRef]
  44. Marchi, S.; Mottola, S.; Cremonese, G.; Massironi, M.; Martellato, E. A new chronology for the Moon and Mercury. Astron. J. 2009, 137, 4936. [Google Scholar] [CrossRef]
  45. Williams, J.-P.; Pathare, A.V.; Aharonson, O. The production of small primary craters on Mars and the Moon. Icarus 2014, 235, 23–36. [Google Scholar] [CrossRef]
  46. Xie, M.; Zhu, M.-H.; Xiao, Z.; Wu, Y.; Xu, A. Effect of Topography Degradation on Crater Size-Frequency Distributions: Implications for Populations of Small Craters and Age Dating. Geophys. Res. Lett. 2017, 44, 10,171–10,179. [Google Scholar] [CrossRef]
  47. Senft, L.E.; Stewart, S.T. Modeling impact cratering in layered surfaces. J. Geophys. Res. 2007, 112, E11002. [Google Scholar] [CrossRef]
  48. Ahrens, T.J.; Xia, K.; Coker, D. Depth of cracking beneath impact craters: New constraint for impact velocity. In AIP Conference Proceedings, Proceedings of the Shock Compression of Condensed Matter—2001: 12th APS Topical Conference, Atlanta, GA, USA, 24–29 June 2001; AIP Publishing: Melville, NY, USA, 2002; pp. 1393–1396. [Google Scholar]
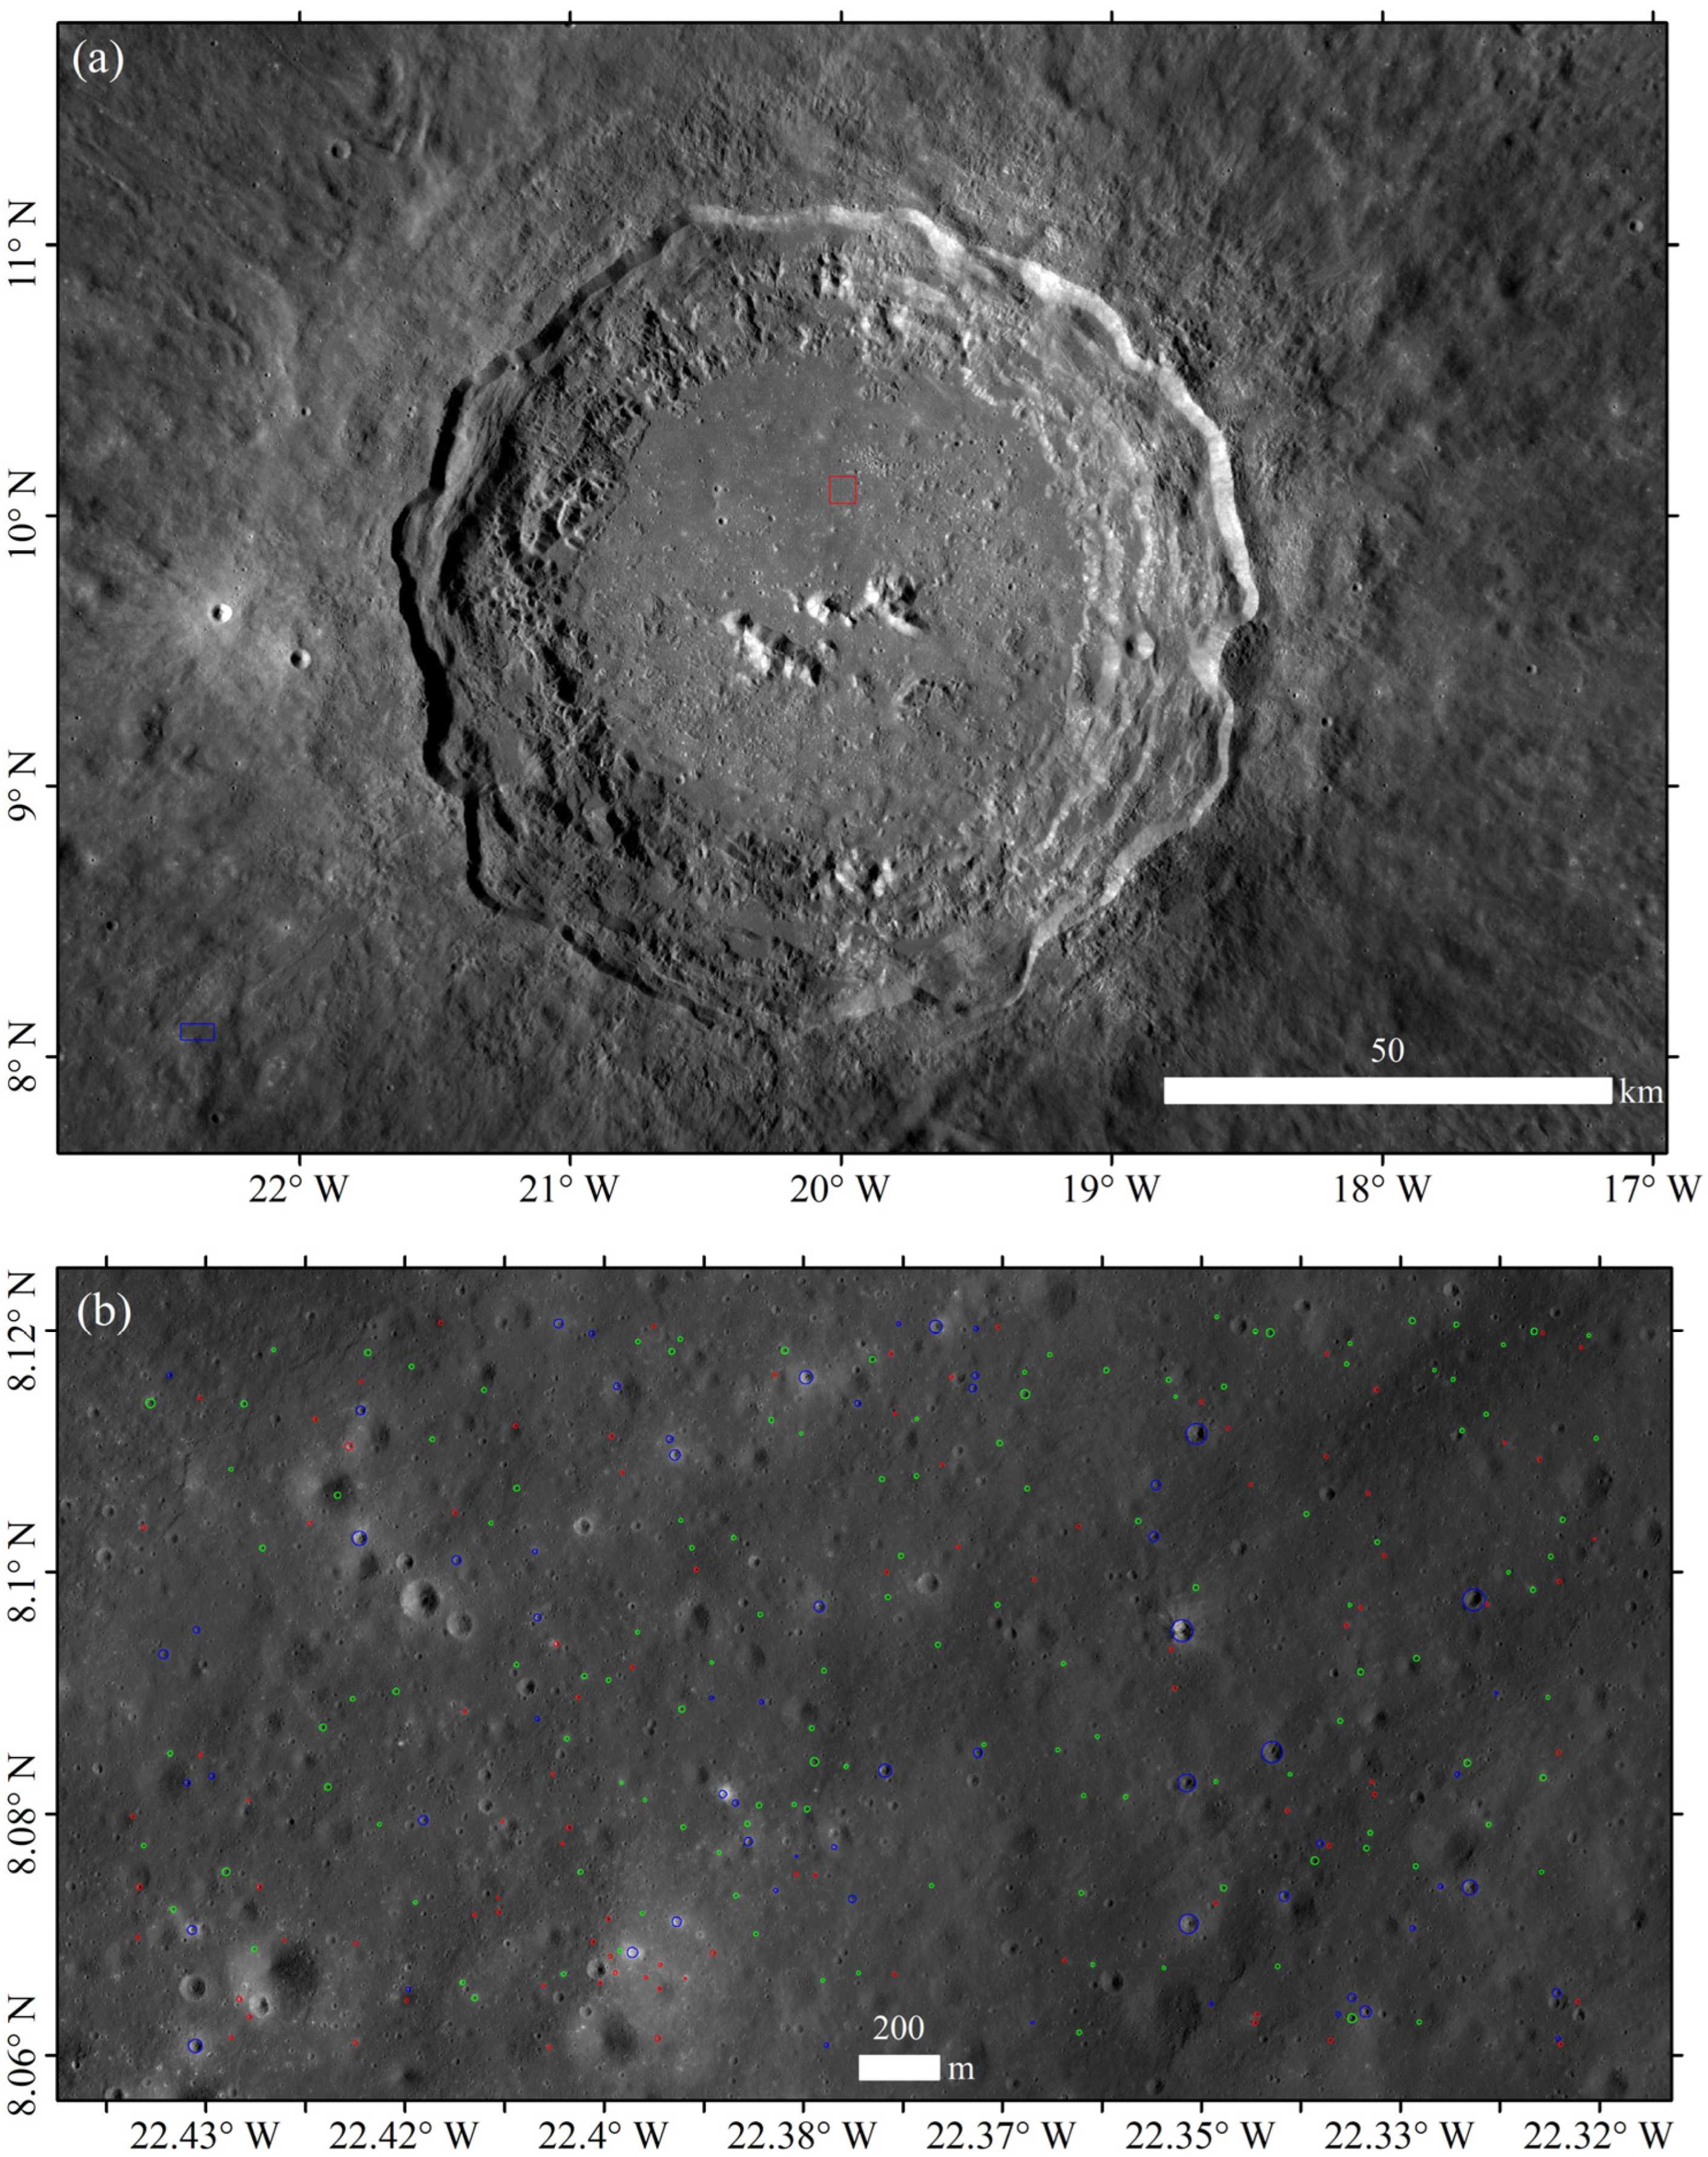
Figure 1. Measurements of regolith thickness distribution at Copernicus crater. (a) The location of regolith thickness distribution measurement at Copernicus ejecta (blue). The location of regolith measurement at Copernicus melt is also shown for comparison (red). The base map is LROC WAC Mosaic. (b) Mapped fresh craters (the circles) at the Copernicus ejecta. The red, green, and blue circles represent normal, flat-bottom, and concentric craters. The base map is LROC NAC M144768961 mosaic.
Remotesensing 16 02650 g001
Figure 2. (a) Diameter distributions of the three types of fresh craters. The red, green, and blue are normal, flat-bottom, and concentric craters, respectively. Each curve represents the fraction of one crater type to all crater types, and their corresponding 1σ uncertainties are shown. The squares represent the raw diameters. (b) Regolith thickness distributions (i.e., cumulative percentages of regolith thicker than a given value). The regolith thicknesses derived from the normal (red) and concentric (blue) craters are the diameters of panel (a) divided by n = 4 and 9, respectively. A median regolith thickness corresponds to the thickness with a 50% cumulative percentage. The squares represent the regolith thicknesses directly derived from the raw diameters.
Remotesensing 16 02650 g002
Figure 3. The relationship between regolith thickness and crater production function. The regolith thickness distribution panel (a) and median thickness panel (b) depend on SFD slope and crater density. The uncertainties are calculated by adopting 0.1 and 0.01% geometric saturations.
Remotesensing 16 02650 g003
Figure 4. Crater size–frequency measurements at Copernicus crater. Mapping (a) large and (b) smaller craters (the red circles) on Copernicus ejecta. Secondary crater fields are excluded (yellow). An interior nested small area (the green polygon in panel (a)) is the same as that in panel (b). Counting (c) large and (d) smaller craters (the red circles) on Copernicus impact melt. The blue rectangles in panels (b,d) are regolith mapping regions (see also Figure 1). All panels are given in Mercator projection, and all base maps are Kaguya TC morning images.
Remotesensing 16 02650 g004
Disclaimer/Publisher’s Note: The statements, opinions and data contained in all publications are solely those of the individual author(s) and contributor(s) and not of MDPI and/or the editor(s). MDPI and/or the editor(s) disclaim responsibility for any injury to people or property resulting from any ideas, methods, instructions or products referred to in the content.