Article

Concept-Based Explanations for Millimeter Wave Radar Target Recognition

1
School of Computer Science and Technology, Harbin Institute of Technology, Harbin 150001, China
2
Intelligent Science and Technology Academy of CASIC, Beijing 100041, China
*
Author to whom correspondence should be addressed.
Remote Sens. 2024, 16(14), 2640; https://doi.org/10.3390/rs16142640
Submission received: 27 May 2024 / Revised: 12 July 2024 / Accepted: 17 July 2024 / Published: 19 July 2024

Abstract

:
This paper presents exploratory work on the use of Testing with Concept Activation Vectors (TCAV) within a concept-based explanation framework to provide the explainability of millimeter-wave (MMW) radar target recognition. Given that the radar spectrum is difficult for non-domain experts to understand visually, defining concepts for radar remains a significant challenge. In response, drawing from the visual analytical experience of experts, some basic concepts based on brightness, striping, size, and shape are adopted in this paper. However, the simplicity of basic concept definitions sometimes leads to vague correlations with recognition targets and significant variability among individuals, limiting their adaptability to specific tasks. To address these issues, this study proposes a Basic Concept-Guided Deep Embedding Clustering (BCG-DEC) method that can effectively discover task-specific composite concepts. BCG-DEC methodically analyzes the deep semantic information of radar data through four distinct stages from the perspective of concept discovery, ensuring that the concepts discovered accurately conform to the task-specific property of MMW radar target recognition. The experimental results show that the proposed method not only expands the number of concepts but also effectively solves the problem of difficulty in annotating basic concepts. In the ROD2021 MMW radar explainability experiments, the concepts proved crucial for recognizing specific categories of radar targets.

1. Introduction

Due to the outstanding stability of radar systems in dark or adverse weather conditions, radar technology has become indispensable across the military, civilian, and industrial sectors. Concurrently, the advent of deep learning has facilitated the development of an increasing number of sophisticated radar target detection and recognition algorithms [1,2]. However, the ‘black box’ nature of deep learning models significantly impedes their broader application. Specifically, in areas with high safety requirements, such as global maritime surveillance [3] and autonomous driving [4,5,6,7,8], providing model explainability becomes particularly crucial. Therefore, in-depth research into the explanatory mechanisms of deep learning models has become an important task in current research.
In deep learning, explainability methods aim to elucidate the principles behind model decisions [9]. Depending on the focus of the research, explainability approaches can be categorized into two main types: intrinsic explainability [10] and post hoc explainability. Intrinsic explainability methods ensure that models are designed with clear explainability from the very beginning. In contrast, post hoc explainability methods apply explanatory techniques to clarify the working principles of existing models. Due to the inherent lack of built-in explanatory mechanisms in most deep learning models, post hoc explanatory analysis has become a key method for elucidating these models’ decision-making processes. Currently, post hoc explainability encompasses a wide array of methods that target decision attribution, primarily including feature attribution and concept attribution. Within feature attribution methods, a series of Class Activation Mapping (CAM) [11,12,13,14,15] techniques provide visual explanations by generating activation maps. While activation maps can display the areas focused on by the model, CAM and its derivatives primarily reveal pixel-level, low-level features, which can diverge from human understanding of higher-level concepts to some extent. Moreover, these methods often provide only localized explanations [16] and are unreliable in attributions under input transformations [17] and adversarial perturbations [18]. However, methods based on concept attribution can overcome these limitations and offer explainability in understandable terms (i.e., concepts) to humans [19]. Among these, the Testing with Concept Activation Vectors (TCAV) method [20] allows users to define concepts of interest and the datasets representing these concepts to detect the sensitivity of target categories to these concepts and provide a global explanation of the model by calculating TCAV scores. This robust explanatory capability has led to the application of TCAV across numerous deep learning domains, including image classification [16,21,22], among others [23,24].
In the field of image classification, models typically deal with concrete optical images—such as animals, plants, and everyday objects—where the concepts are relatively intuitive to humans. For example, in analyzing the GoogleNet [25] model for the category ‘zebra’, the developers of TCAV were able to easily identify prominent features such as ‘striped’, ‘zigzagged’, and ‘dotted’ as key concepts. In contrast, the inherent abstraction and analytical complexity of millimeter-wave (MMW) radar data make the concepts less apparent. Therefore, we have designed the following method to explore and discover concepts, aiming to reveal the hidden complexities within MMW radar data.
Initially, we employ visualization techniques to convert the MMW radar’s Range-Angle (RA) spectrogram data into visual images. Based on expert experience in the radar field, we provided a series of basic concepts through visual analysis that reflect the characteristics of radar target recognition. These concepts not only have practical application value but also align with human cognitive attributes.
However, due to the subjectivity of manual concept annotation and the high complexity of MMW radar spectrograms, relying solely on manual concept annotation methods may overlook key concepts in radar data that are difficult to detect. These concepts may be crucial for the model’s prediction accuracy during the actual recognition process. Additionally, since basic concept definitions typically focus on a single aspect, they may neglect other key concepts, potentially leading to a vague correspondence between concepts and recognition categories. Furthermore, as the definitions of basic concepts vary among individuals, it becomes challenging to generalize these concepts to specific tasks. To more comprehensively explain the model and improve concept quality, we propose a Basic Concept-Guided Deep Embedding Clustering (BCG-DEC) method aimed at uncovering task-specific composite concepts guided by domain expertise.
BCG-DEC trains an autoencoder on a large set of RA spectrograms to learn general feature representations of MMW radar data and employs the encoder segment to extract embeddings from the concept dataset. Initial clustering centroids are determined through k-means [26] clustering of these embeddings. During the deep clustering process, this method utilizes existing basic concepts to adjust the initial centroids in feature space, effectively ensuring that task-specific composite concepts focus on multiple meaningful key attributes of MMW radar targets. After that, we evaluate the quality of clustering by clustering entropy. For the clustering results that do not meet the standard, we choose to re-cluster so as to find the concept that has a clear correspondence with the category. The concepts discovered by BCG-DEC are highly abstract and complex. To make the task-specific composite concepts more comprehensible to humans, we introduced a ‘Category Association Index’ (CAI) to describe the categories represented by the concepts. Ultimately, we employed TCAV scores to quantify the importance of basic and task-specific composite concepts for different recognition categories, thus providing a quantitative explanation of which concepts are critical for the model to accurately predict certain types of targets.
Our research contributions are summarized as follows:
  • This study is the first, to our knowledge, to deeply explore and validate the basic concepts learned during the process of MMW radar target recognition using the TCAV method. This novel approach allows for a clearer understanding of how these basic concepts contribute to target recognition.
  • We innovatively propose the BCG-DEC method, which effectively resolves the ambiguity in the correspondence between basic concepts and categories, as well as the subjectivity and variability inherent in manually annotated concept methods. The BCG-DEC method’s capability to discover concepts in MMW radar data is an innovative development in the field.
  • Our research not only pioneers the process of concept discovery within MMW radar target recognition models but also provides a valuable framework for future research in this area that utilizes both basic concepts and task-specific composite concepts for explanation. This framework offers a useful reference for further improving the explainability of radar target recognition models.
Experimental results demonstrate the importance of the discovered concepts for MMW radar target recognition. These outcomes not only confirm the effectiveness of our newly developed methodologies but also highlight their substantial practical relevance and potential for broad applicability in real-world radar systems.

2. Related Work

2.1. TCAV Theory

TCAV is a relatively mainstream method to analyze the explainability of deep learning models using concepts. It can detect the sensitivity of a user-defined concept to the target class to be recognized by the model by the user defining the concept of interest.
This method involves inputting datasets corresponding to both user-defined concepts and random concepts unrelated to the user’s definition into the model to be explained, thereby obtaining activations of these concepts in the hidden layer of the network. Subsequently, the TCAV technique classifies these activations by training a binary concept classifier to distinguish between user-defined concepts and random concepts. After classification, we can obtain the concept activation vector (CAV), which is orthogonal to the classification hyperplane.
CAV can help us calculate the sensitivity of the class to which a single sample belongs with that concept. It is calculated as follows:
S C , k , l x = lim ϵ 0 h l , k f l x + ϵ v C l h l , k f l x ϵ = h l , k f l x · v C l ,
where C represents the concept, l represents the layer of the neural network, k represents the category, v c l is the CAV of the concept dataset in layer l, f l x represents the activation of input x in l, and h l , k represents the mapping function from the activation of the model in the l layer to the output of the k class.
Then, the TCAV method calculates S C , k , l x for all samples in the target class to obtain the TCAV score. This score reflects the global interpretation of the model and is calculated as follows:
T C A V C , k , l = x X k S C , k , l x X k ,
X k denotes the dataset for the target category k , and X k represents the number of samples in this dataset.

2.2. Deep Learning Models for Radar Target Recognition

Nowadays, a large number of radar target recognition models have been designed by researchers, but they are difficult to use in real-life situations because they cannot provide an explanation for the model.
The RECORD model based on U-net architecture proposed by Colin Decourt et al. [2] shows excellent performance in a variety of radar application scenarios (such as parking lots, campus roads, city streets, and highways), and its average precision (AP) and average recall (AR) indicators of detection are excellent. The architecture of its single-view spatio-temporal decoder and encoder is shown in Figure 1.
This model has the advantages of good performance, a small number of parameters, short training time, and so on, which is very valuable for practical application. Therefore, we chose to analyze the explainability of this model to help put it into practical application.

3. Explanation Based on Basic Concepts

Concepts are units that are easier for humans to understand than individual features, pixels, characters, etc. It can be used to explain the rationality of deep learning models. The definition of a precise concept usually needs to satisfy three properties: meaningfulness, coherency, and importance. Meaningfulness indicates that a concept belongs semantically to a certain class of objects. Coherency indicates that the data constituting the same concept are perceptually similar. Importance means that the concept is necessary for the prediction of that class [27]. Building on a thorough consideration of the aforementioned three properties, we will discuss methods for discovering basic concepts in MMW radar data and how these discovered concepts can be used to explain the model.
In the process of radar target recognition, certain discriminative features can help differentiate between objects [28], including polarization characteristics, size, and shape, among others. Polarization refers to the orientation of the electric field in electromagnetic waves. Given that polarization properties are a crucial aspect for understanding and interpreting MMW radar images, we analyzed radar images based on how the surface characteristics of an object affect the polarization state of reflected waves. We observed that smooth metallic surfaces might reflect waves of specific polarization more strongly, producing brighter signals on the radar spectrogram. Typically, if a target has a larger radar cross-section (RCS), its reflected signal will be stronger, resulting in greater brightness on the spectrogram. Based on this observation, we define brightness as a concept for radar target recognition.
In radar spectrograms, the characteristic of striping is also vital for classifying targets. Variations in the number of stripes generally reflect the complexity of the target. Complex targets with multiple independent structures or parts may each reflect radar waves separately. From a structural perspective, objects with cavities or frameworks, such as certain vehicles, may produce additional striping in the spectrogram due to reflections from external structures. Based on these observations, we selected striping as one of our basic concepts.
Beyond brightness and striping, the size and shape of bright spots in the spectrogram are crucial for understanding the physical characteristics of a target. Size refers to how large the target appears on the spectrogram, which is useful for estimating the target’s actual size. Shape in the spectrogram typically refers to the geometric outline of the target, which can reflect its structural characteristics. For example, large and complex shapes may represent large vehicles or structures, while small dots might indicate individual pedestrians or small objects.
Based on the above analysis, we have discovered four groups of concepts: brightness, striping, size, and shape. Our experience indicates that these concepts are meaningful for inferring the types of targets. Throughout the experimental process, we ensure that radar spectrograms within the same concept dataset exhibit similarity, thereby maintaining the coherency of concepts. Next, we use the TCAV [20] method to demonstrate the importance of these basic concepts.
For the four groups of basic concepts that have been discovered, we assign sub-concepts of basic concepts to each group based on the target categories of the dataset. These sub-concepts of basic concepts reflect finer-grained attributes in the context of each basic concept, corresponding to the recognition characteristics of different categories of radar targets. Throughout this paper, for simplicity, we will use ‘sub-concepts’ to refer to these ‘sub-concepts of basic concepts’. Drawing from our experience with TCAV, we selected 100 radar data samples for each sub-concept.
To better understand the discovered concepts, we use TCAV scores to characterize the importance of concepts for the model to recognize a particular category. Before the computation of the TCAV score, it is imperative to determine several critical parameters integral to the TCAV methodology. Initially, a concept C, such as the aforementioned sub-concept, must be selected. Subsequently, the target class k, which the model is intended to recognize (e.g., a car), should be determined. Lastly, the hidden layer l that will be used to extract activations from the input data must be determined in the model. After these parameters are determined, we need to prepare a dataset corresponding to concept C, a random concept dataset without concept C, and a dataset X k corresponding to target class k. Using these datasets, we can calculate the concept activation vector (CAV), the directional derivative S C , k , l x , x X k , and the TCAV score, in turn, using the theory introduced in Section 2.1. The final TCAV score reflects the proportion of the radar target recognition model that is positively influenced by concept C when predicting x X k as the class k.
To prevent getting meaningless CAVs, the developers of TCAV perform statistical significance tests to ensure that concepts are important. We use the same method to perform a two-sided t-test on TCAV scores on the basis of multiple training CAVs, and the results shown are all CAVs that pass the test. In our experiments, TCAV is implemented in PyTorch instead of Tensorflow by the original authors.

4. Explanation Based on Task-Specific Composite Concepts

In the context of utilizing concept-based explanations for deep learning models in radar target recognition, relying solely on basic concepts and manual annotation methods presents numerous challenges.
First, the inherent subjectivity of manual annotations and the complex nature of MMW radar spectrograms make it difficult to comprehensively discover and utilize key concepts, which are crucial for accurate model predictions. Additionally, basic concepts are often overly simplistic and defined with a focus on a single attribute, leading to a lack of clarity in their correspondence with actual recognition categories. This issue is compounded by the variability of these definitions across different individuals, which hinders the generalization of the concepts to specific tasks. For instance, a concept deemed ‘high brightness’ in ship recognition tasks might not be applicable in the context of autonomous driving, underscoring the ambiguity of basic concepts across tasks. Each task may require a redefinition of concepts, adding to the complexity and inefficiency of the process. We prefer to find concepts that can describe a certain class of targets, which is of great significance to verify whether the model can correctly recognize a certain class of targets. To address these issues, this study employs clustering methods to explore more task-specific composite concepts within MMW radar to characterize the features of different target categories.
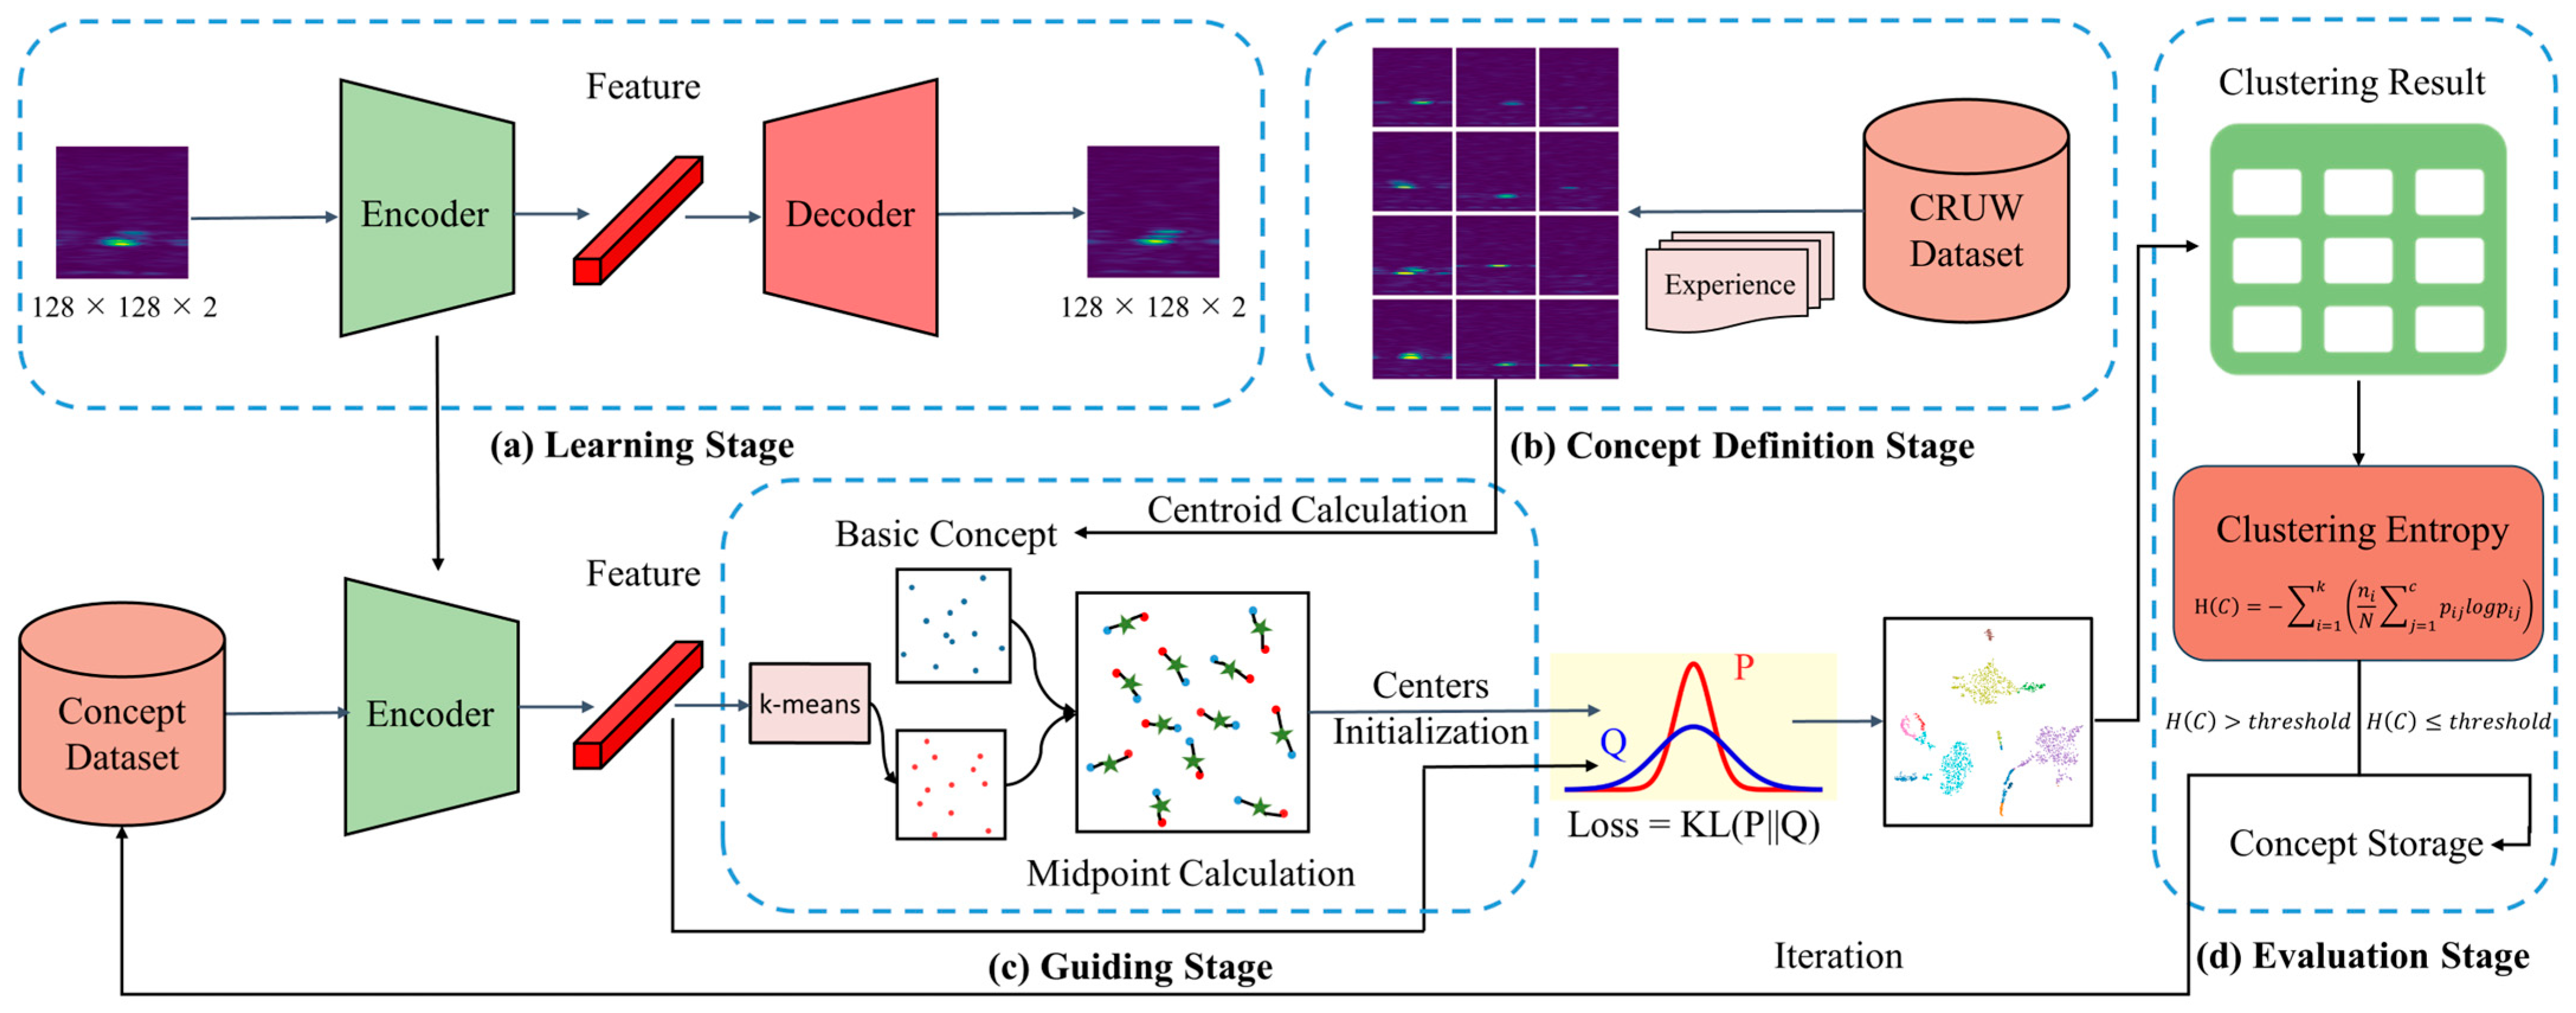
However, common deep clustering approaches, such as those that extract features using models pre-trained on other datasets followed by traditional clustering methods, often fail to adequately capture the characteristics of the current dataset. Furthermore, the constant fixation of pre-trained model parameters can lead to a lack of adaptability to the specific clustering tasks currently underway. Deep Embedding Clustering (DEC) [29], proposed by J. Xie et al., can better deal with the above problems because it optimizes the representation of data points in the feature space during the training process and overcomes the limitations of traditional clustering methods that heavily rely on predefined feature space and distance metrics. Inspired by the DEC method, we propose a Basic Concept-Guided Deep Embedding Clustering (BCG-DEC) method to solve the problems of manually labeling concept methods. BCG-DEC is capable of exploring task-specific composite concepts that more accurately reflect the multifaceted attributes of targets and more effectively adapt to specific task requirements. It comprises four stages: In the first stage, the autoencoder is trained on a large amount of MMW radar data to learn the representations of Range-Angle (RA) spectrograms. In the second stage, we define each basic concept dataset based on existing concepts and our experience with visual analysis of MMW radar. In the third stage, the training of the clustering model is guided by computing the centroids of each basic concept dataset. In the fourth stage, clustering entropy is used to evaluate the quality of clustering results from the perspective of task-specific composite concept discovery, and if it is greater than our empirical threshold, deep clustering will be iterated. Through these four stages, BCG-DEC achieves joint tuning of pre-trained model parameters and the clustering process, thereby facilitating the perception of meaningful concepts within the MMW radar data domain during the clustering. The implementation process of the proposed method is shown in Figure 2.
We now provide a detailed description of the implementation process for the BCG-DEC method. Initially, to thoroughly mine the deep semantic features contained within radar data, we designed a CNN-based autoencoder for the data space X during the first stage to learn the subtle features of a large volume of spectrograms. The training loss function employed is the Mean Squared Error (MSE). Upon completion of training, we obtain the initial nonlinear mapping f θ : X→Z, where θ represents the learnable parameters within the encoder, and Z denotes the latent features learned by the autoencoder. We then extract the encoder part of the autoencoder and incorporate it into the basic concept-guided clustering model to perceive the task-specific composite concepts from the concept dataset.
Subsequently, in the second stage—the concept definition stage—we select the RA spectrogram of the corresponding concept from a large number of MMW radar data based on the discovered basic concepts, and our visual analytical experience ensures the importance of the concept. In addition, we will check the selected RA spectrograms to ensure that the spectrograms of the same concept are similar to ensure the coherency of the concept.
Next, we enter the third stage—the guiding stage. At the start of this stage, we employ the k-means algorithm to cluster the embeddings generated by the encoder, thus obtaining the initial cluster centers, μ. To utilize meaningful information from basic concepts in concept discovery and prevent clustering around centers of irrelevant features, we introduce basic concepts to correct the initial μ positions in the feature space. Each basic concept corresponds to multiple RA spectrograms selected in the second stage, yet we only need one representative center for guidance. Therefore, we will calculate the centroid of the basic concept set as follows:
Given a concept dataset H ⊂ X, each radar data h i H is encoded into a latent vector z i = f θ h i . To fully consider the density and structure of the latent data distribution, the centroid of set H, h c e n t r o i d , is determined through an adaptive weighting scheme in the feature space, as shown in Equation (3).
h c e n t r o i d = i = 1 H e x p d z i , Z i 2 2 σ 2 · z i i = 1 H e x p d z i , Z i 2 2 σ 2
The adaptive weighting scheme employs a distance-based weighted average, where the weight of each data point is a decreasing function of its distance to other points in the cluster. Weights are implemented using a Gaussian kernel function e x p d z i , Z i 2 2 σ 2 , where d z i , Z i represents the Euclidean distance between point z i and other points in H, and σ is the bandwidth parameter of the Gaussian kernel, controlling the influence range of neighboring points on the centroid.
We assign the center h c e n t r o i d of each basic concept set H, computed by Equation (3), to a set H . For each initial cluster center μ j determined by the k-means algorithm, BCG-DEC searches for the h c e n t r o i d with the closest Euclidean distance to μ j , and takes the midpoint between μ j and h c e n t r o i d as the new cluster center μ j , as shown in Equation (4).
μ j = μ j + argmin h H μ j h 2
Equation (4) reflects the process in which latent features are guided by basic concepts. We can then use the new cluster center μ j to calculate the Q distribution (i.e., soft assignment), which is designed to calculate the probability of each embedding assignment to each cluster center. As shown in the following equation:
q i j = 1 + e i μ j 2 1 j 1 + e i μ j 2 1 ,
e i = f θ x i is the latent representation of the input sample x i X obtained by the encoder f θ . q i j reflects the probability that the sample x i is assigned to the new cluster center μ j .
To improve the cluster purity and assign the radar samples to clusters with high confidence, we compute the auxiliary distribution P [29] based on the distribution Q, following the method in DEC, as follows:
p i j = q i j 2 / f j j q i j 2 / f j ,
where f j = i q i j denotes the soft assignment frequency of all sample points in cluster j, j represents the index variable used in the summation process, iterating over all possible cluster centers.
We calculate the KL divergence of the Q distribution and P distribution as the loss function of the basic concept-guided clustering model training and jointly tune the cluster centers and encoder parameters by Stochastic Gradient Descent (SGD).
Finally, in the fourth stage—the evaluation stage—we hope to obtain task-specific composite concepts to overcome the subjectivity of manual concept annotation and the oversimplification of basic concept definitions. A task-specific composite concept usually characterizes the main features of a certain class of objects, that is, clusters that mainly contain one class of data points. To judge whether the clustering results meet the above requirements, we evaluate the quality of the clustering results using clustering entropy, which can measure the uncertainty of the distribution of the classes within each cluster. A cluster that describes a certain class well has a lower entropy, while a cluster with a uniform class distribution has a higher entropy. We calculate the entropy of each cluster and weighted average the entropy of all clusters to obtain H, the entropy of the whole cluster. The calculation formula is shown in Equation (7):
H = i = 1 k n i N j = 1 c p i j l o g p i j ,
where p i j is the relative frequency of category j in cluster i, c is the category number of the data itself, n i is the total number of data points in cluster i, N is the total number of data points in the dataset, and k is the number of clusters.
If the clustering entropy is greater than the empirical threshold, it represents that the current clustering result has weak correspondence with the category, which is not suitable as a task-specific composite concept, and deep clustering needs to be performed again. If the clustering entropy is less than the empirical threshold, the current clustering results can be saved as concepts.
Considering that BCG-DEC cannot give a human-understandable description of the mined task-specific composite concepts, we give an indicator to characterize the task-specific composite concepts, which is the Category Association Index (CAI), as shown in the following equation:
C A I = argmax k X k C
CAI is used to describe the category represented by the concept set C. X k is the set of all data belonging to class k. X k C is the number of data points belonging to category k in the concept set C. By calculating CAI, we can determine which kinds of targets have the greatest degree of relevance to the task-specific composite concepts discovered, so that these concepts are easier for users to understand.
With this, we have completed the exploration and description of task-specific composite concepts. By using basic concepts to guide the discovery of task-specific composite concepts and employing clustering entropy to filter the clustering results, we have enhanced their meaningfulness. During the experimental process, we will also filter out the concepts obtained by the BCG-DEC method that have less MMW radar data in the clustering results to further ensure their meaningfulness. Among the retained task-specific composite concepts, we will manually inspect the RA spectrograms within each concept to verify their coherency.
For the task-specific composite concepts that have been discovered, similarly, we adopt the TCAV approach described in Section 3 to emphasize the importance of the concept. It is important to note that since the task-specific composite concepts are the outcomes of clustering, each concept’s associated radar data may exceed 100 samples, and the clusters may contain multiple categories. So, we employ stratified sampling based on the proportion of categories within each cluster and select 100 radar data samples for each task-specific composite concept.

5. Experiment and Results

5.1. Datasets

The dataset we use is a subset of CRUW [30], which was published at the ROD2021 challenge. The ROD2021 dataset provides 50 sequences, each of which contains RGB images and radar frames saved as NumPy arrays. They are all obtained by sampling from a camera with a frame rate of 30FPS and an MMW radar sensor. Since we mainly use radar frames when training the RECORD model, we focus on the preprocessing process of radar data in the following.
The radar data provided by ROD2021 are obtained by Fourier transforming the original sampled data twice. Firstly, after the radar chirp signal is collected by the receiving antenna, the first Fourier transform is performed on it, and the echo range is estimated. Then, the signal after the Fourier transform is low-pass filtered to filter out high-frequency noise. Because multiple receive antennas can help us calculate the angle of the object, taking the second Fourier transform of the low-pass filtered signal along the antenna direction gives us the Range-Angle (RA) spectrogram, which is the data we used to train the model and discover the concept.
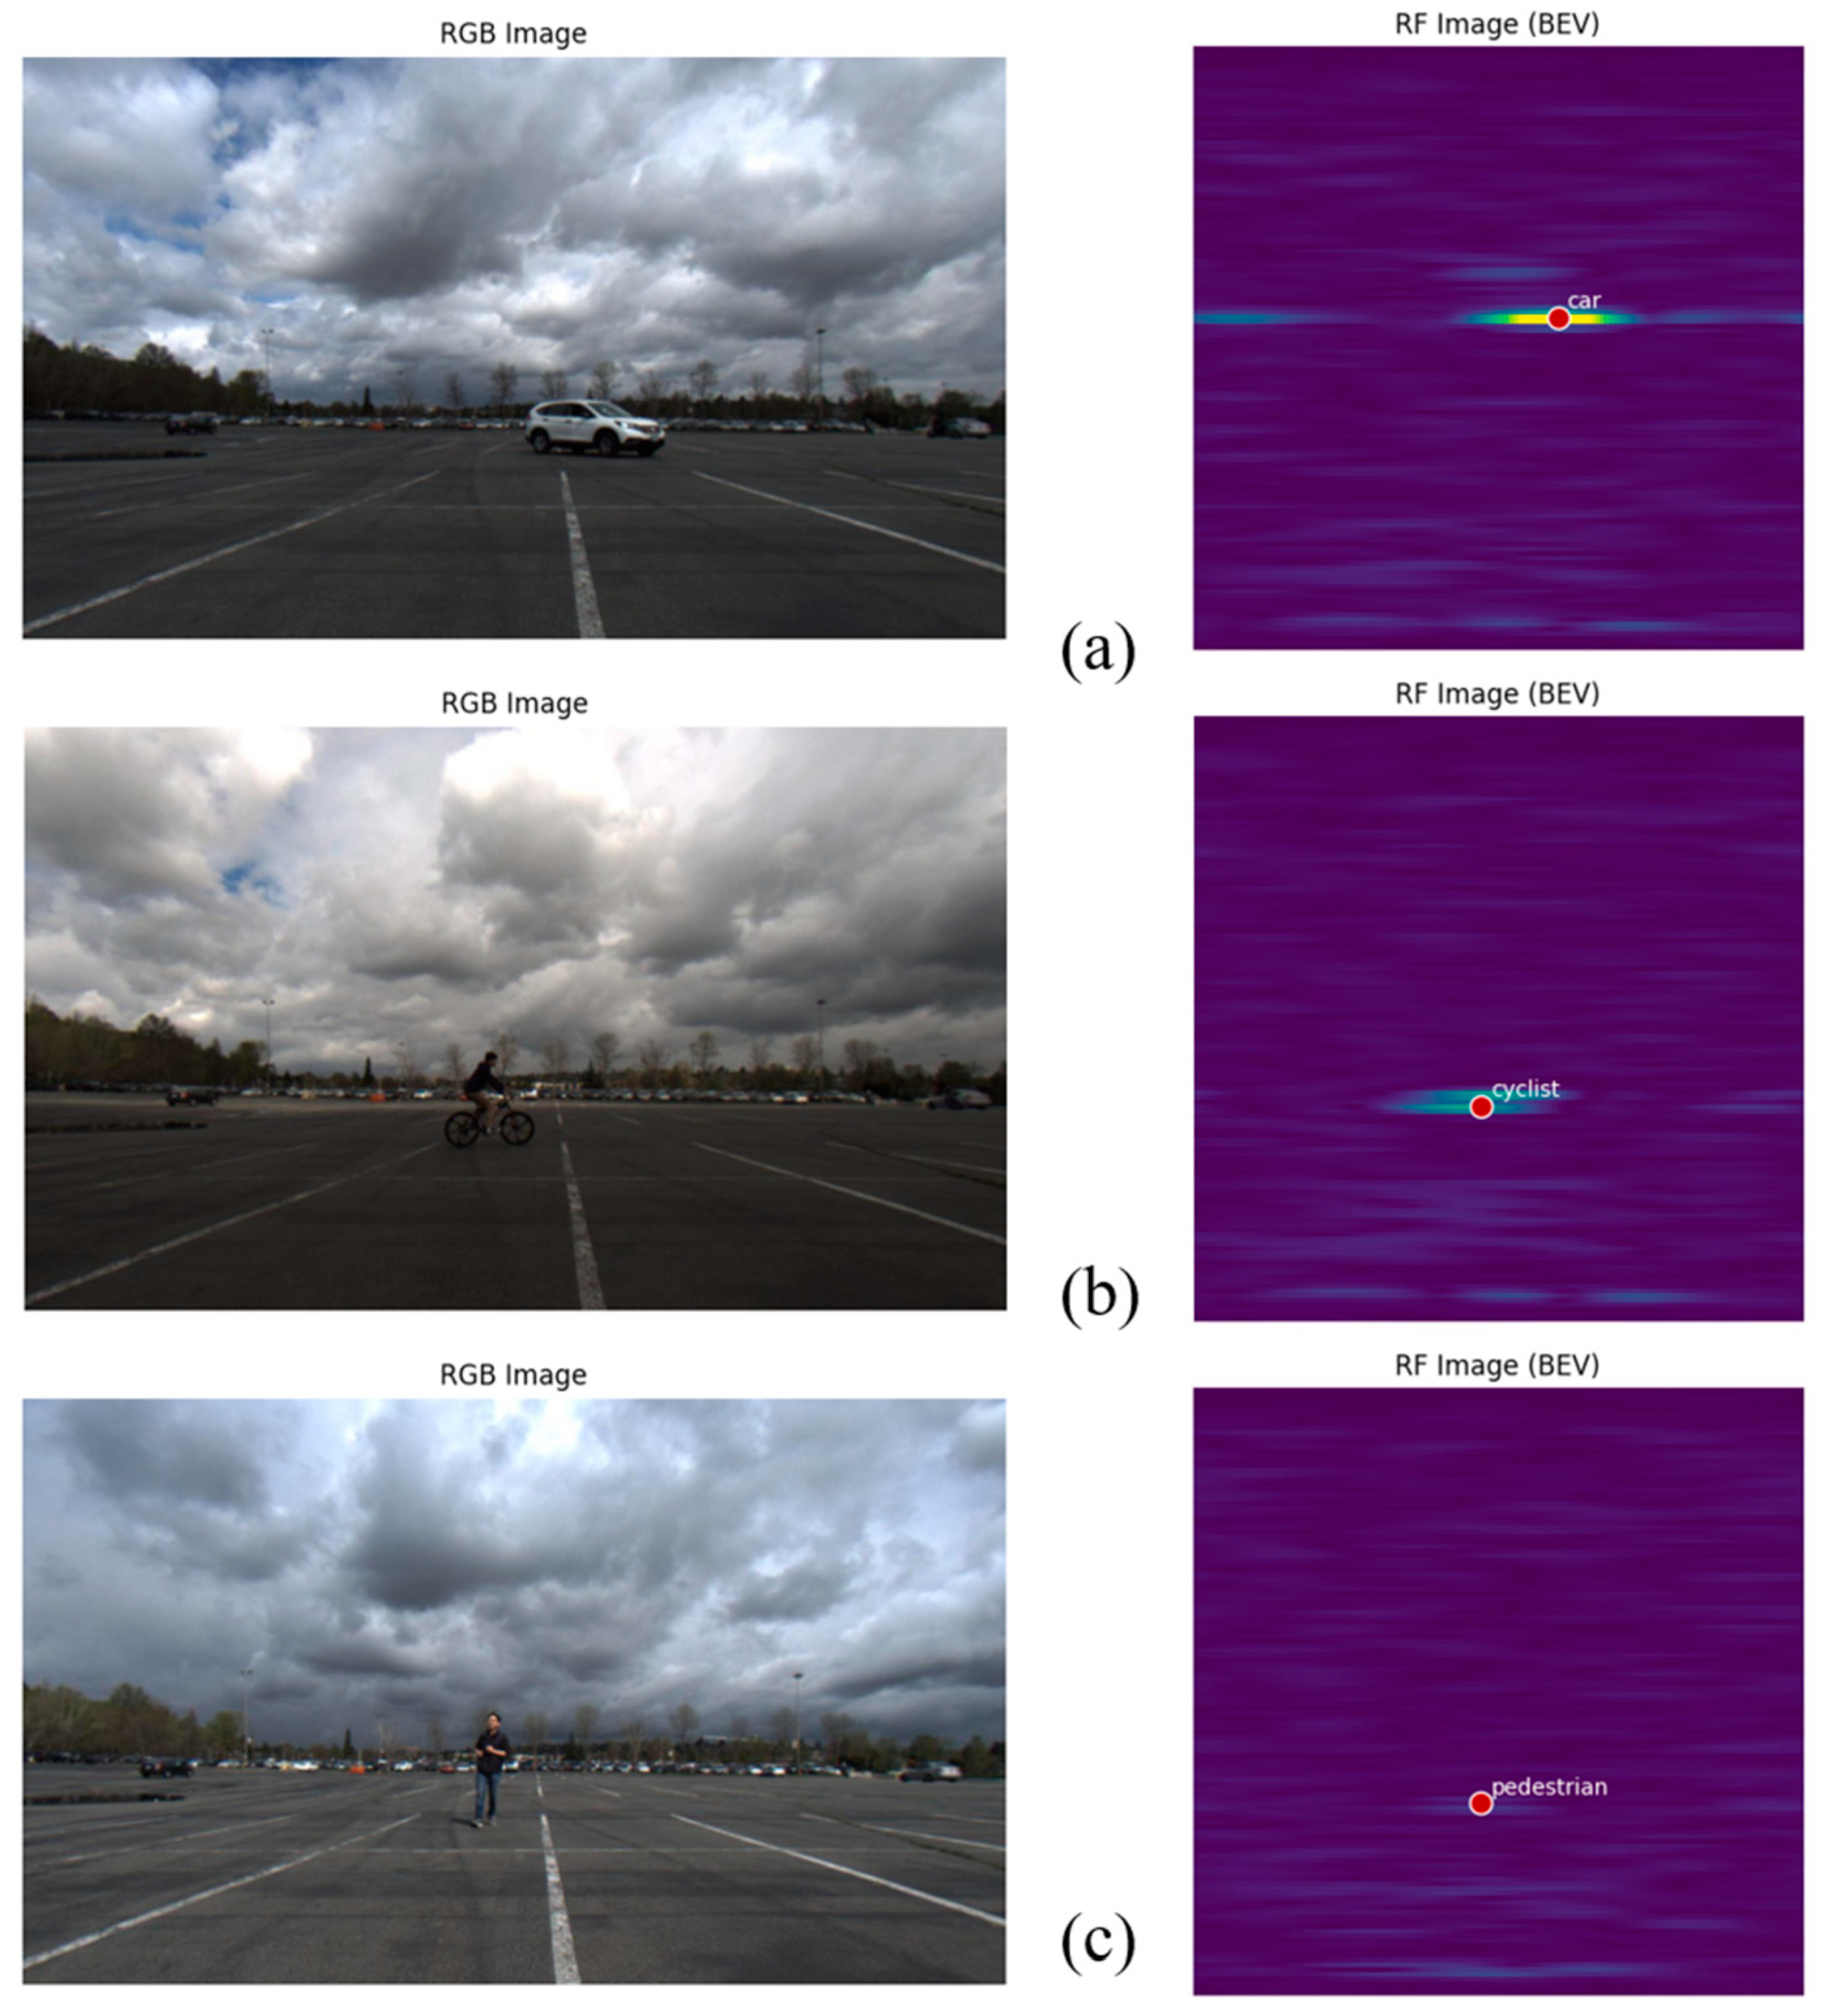
The ROD2021 dataset contains a total of three classes of objects, which are cars, cyclists, and pedestrians. Figure 3 illustrates the RGB images and the corresponding RA spectrograms of these three classes of targets.

5.2. Concepts Discovery and Model Training

The ROD2021 dataset stores the Range-Angle (RA) radar data as a NumPy array of shapes (128, 128, 2). Since we need to extract concepts from the radar data through visual analytical experience, we convert the radar data into RA spectrograms using the following equation:
c h i r p a b s = c h i r p : , : , 0 2 + c h i r p : , : , 1 2
c h i r p a b s represents the processed image, where the value of each pixel is the square root of the sum of squares of the corresponding values of the original two channels, channel 0 and channel 1.
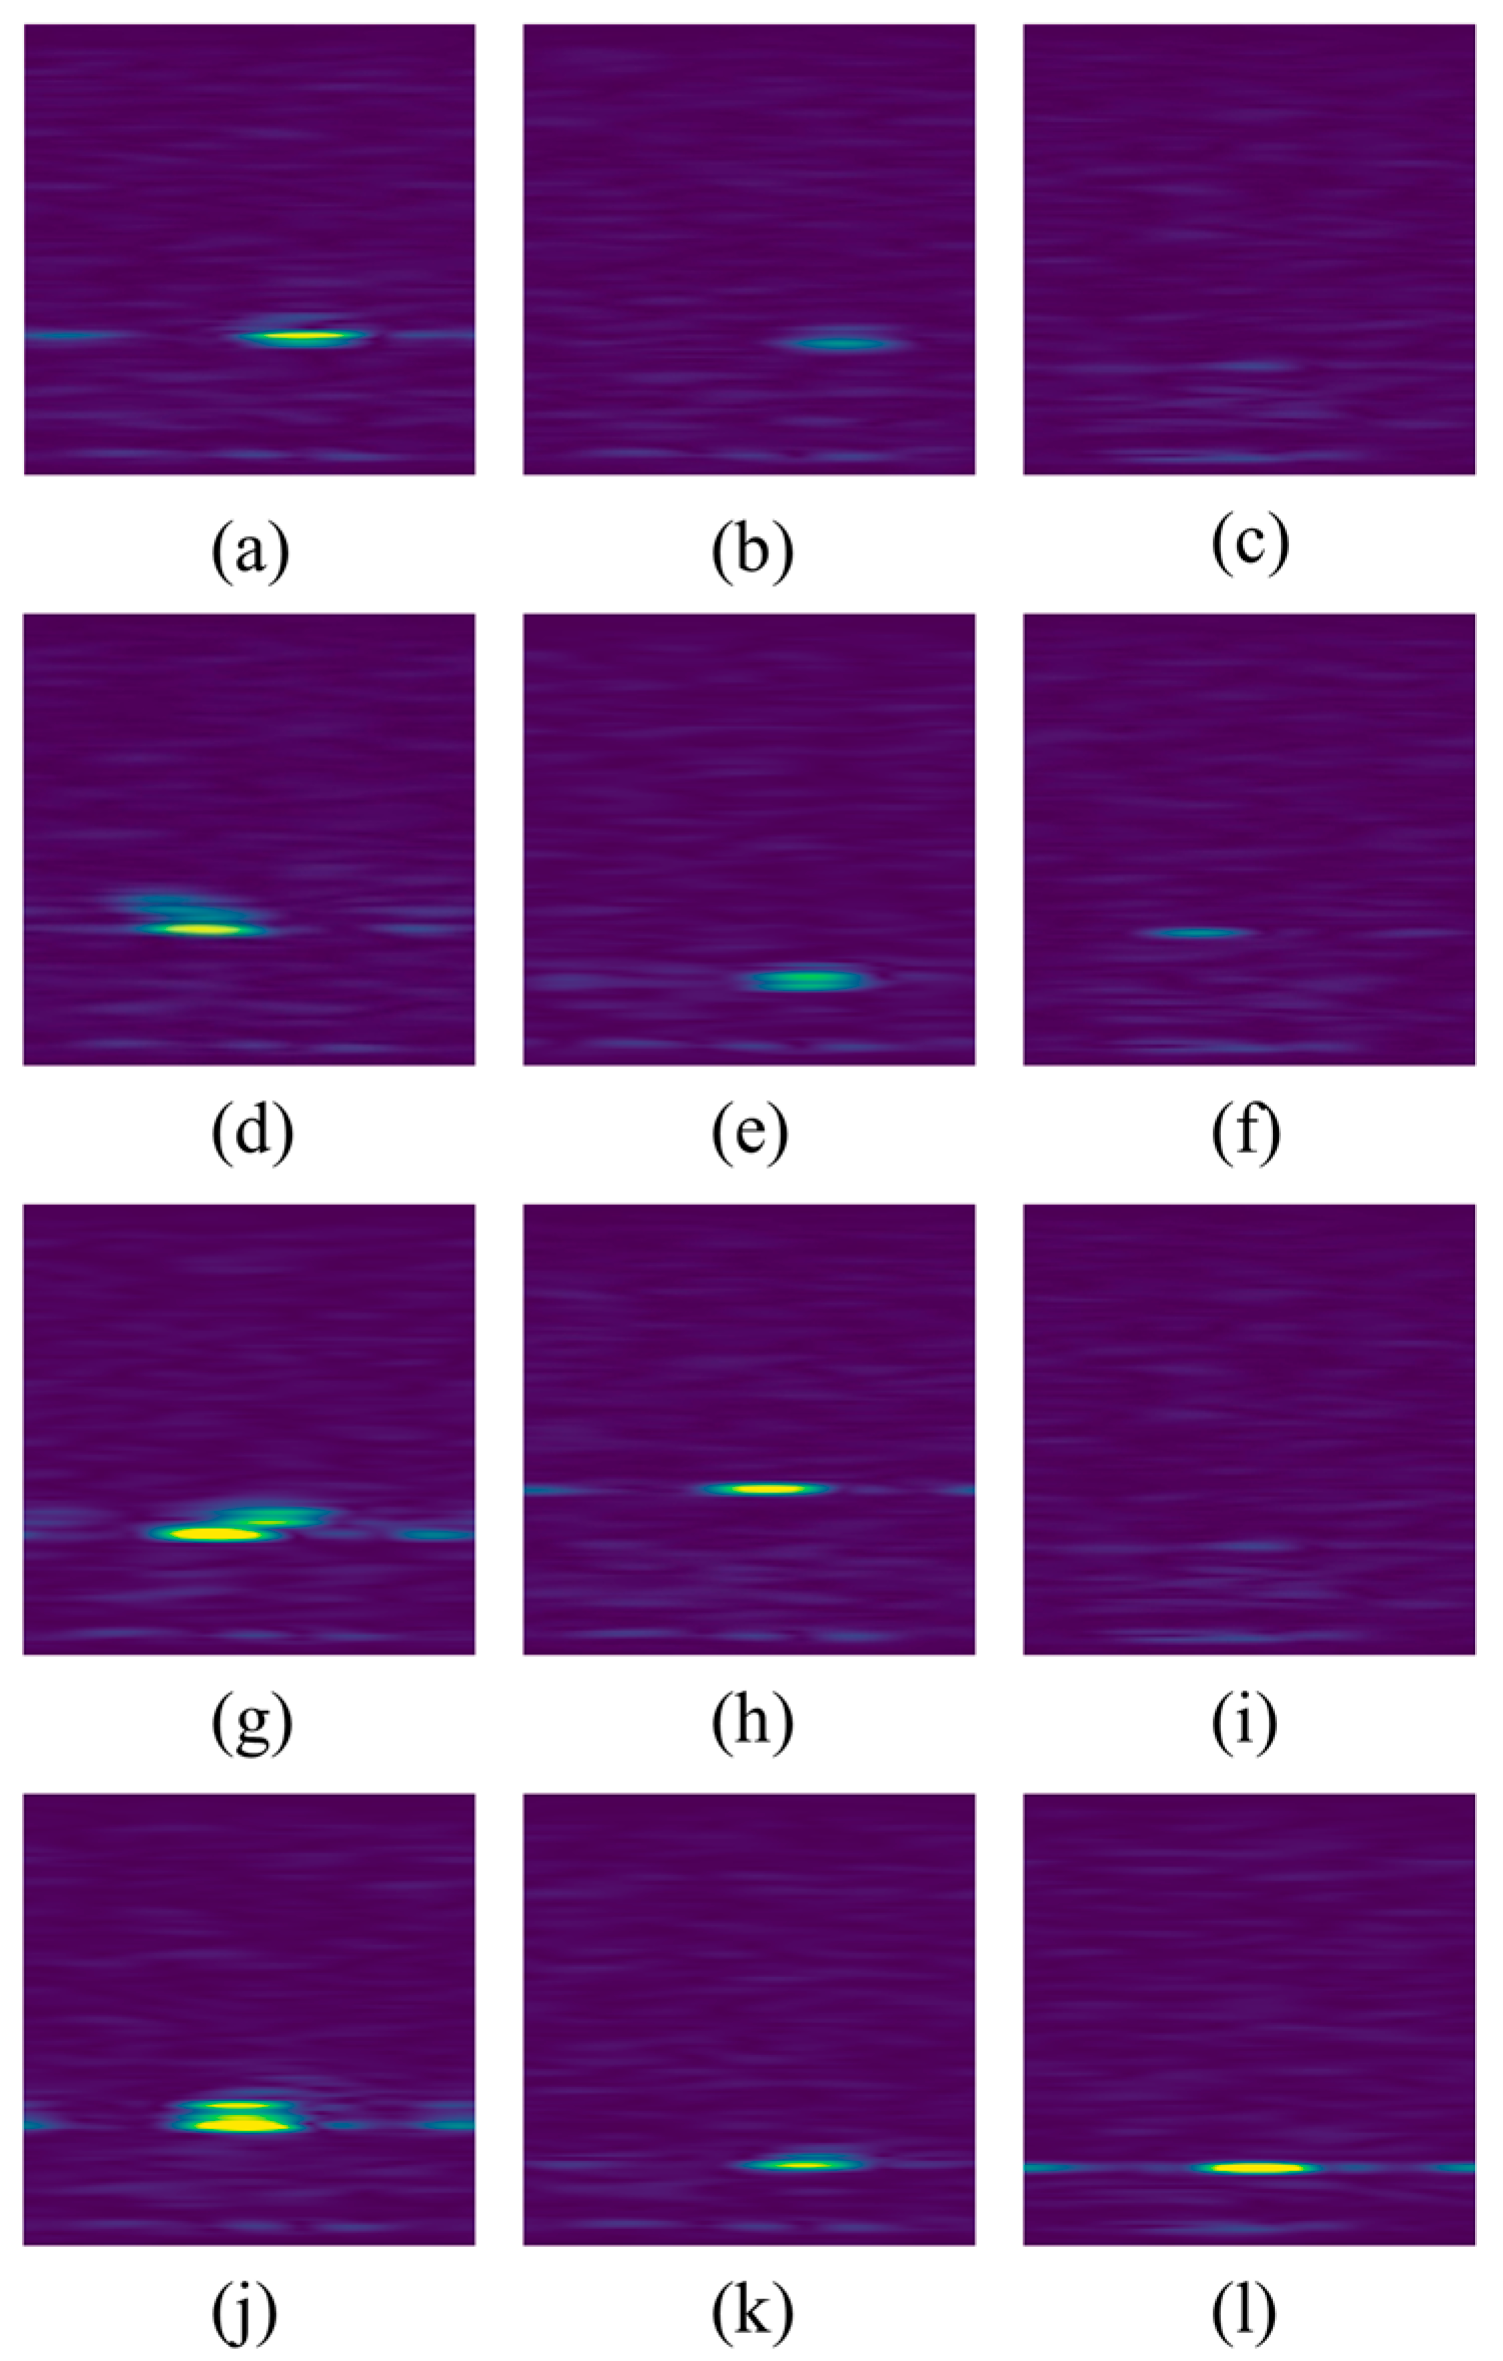
Using the method described in Section 3, we analyzed a significant number of RA spectrograms and corresponding RGB images from the ROD2021 dataset. Through analysis, we observed that targets of different types displayed varying levels of brightness in the spectrograms. Metal cars typically reflect radar waves while preserving their original polarization state due to their uniform and conductive surfaces. In contrast, non-metallic objects such as human bodies or bicycles tend to scatter the waves, potentially altering their polarization state due to their varied and less conductive surfaces. Moreover, the radar cross-section (RCS) is large for cars, moderate for cyclists, and minimal for pedestrians. Drawing on this expert experience, further visual analysis revealed that in most cases, the RA spectrograms of cars exhibit high brightness, those of cyclists show moderate brightness, and pedestrians appear with low brightness. These target recognition characteristics are particularly pronounced under conditions where range and angle are similar. In the context of the brightness concept, we have defined three sub-concepts: high brightness, moderate brightness, and low brightness. Similarly, our visual analysis typically reveals that targets in the car category, due to their relatively complex structures, display many stripes in their RA spectrograms. Targets in the cyclist category generally exhibit moderate stripes, while those in the pedestrian category show fewer stripes. In the context of the concept of stripes, we have defined three sub-concepts: high striping, moderate striping, and minimal striping. In terms of size, cars usually occupy a large area in RA spectrograms. Compared to a single pedestrian, a cyclist may appear as a moderately sized reflective region in an RA spectrogram. Because the RCS of pedestrians is usually smaller than that of cars and cyclists, the size of pedestrians on RA spectrograms is often small. In the context of the size concept, we have defined three sub-concepts: large size, medium size, and small size. The shape usually reflects the geometric contours of the targets. Guided by visual analysis, we generally find that car targets in RA spectrograms are relatively thick, cyclist targets are thinner, and pedestrian targets appear elongated. In the context of the shape concept, we have defined three sub-concepts: thick, thin, and elongated. Figure 4 shows a representative visualization of each of the basic concepts.
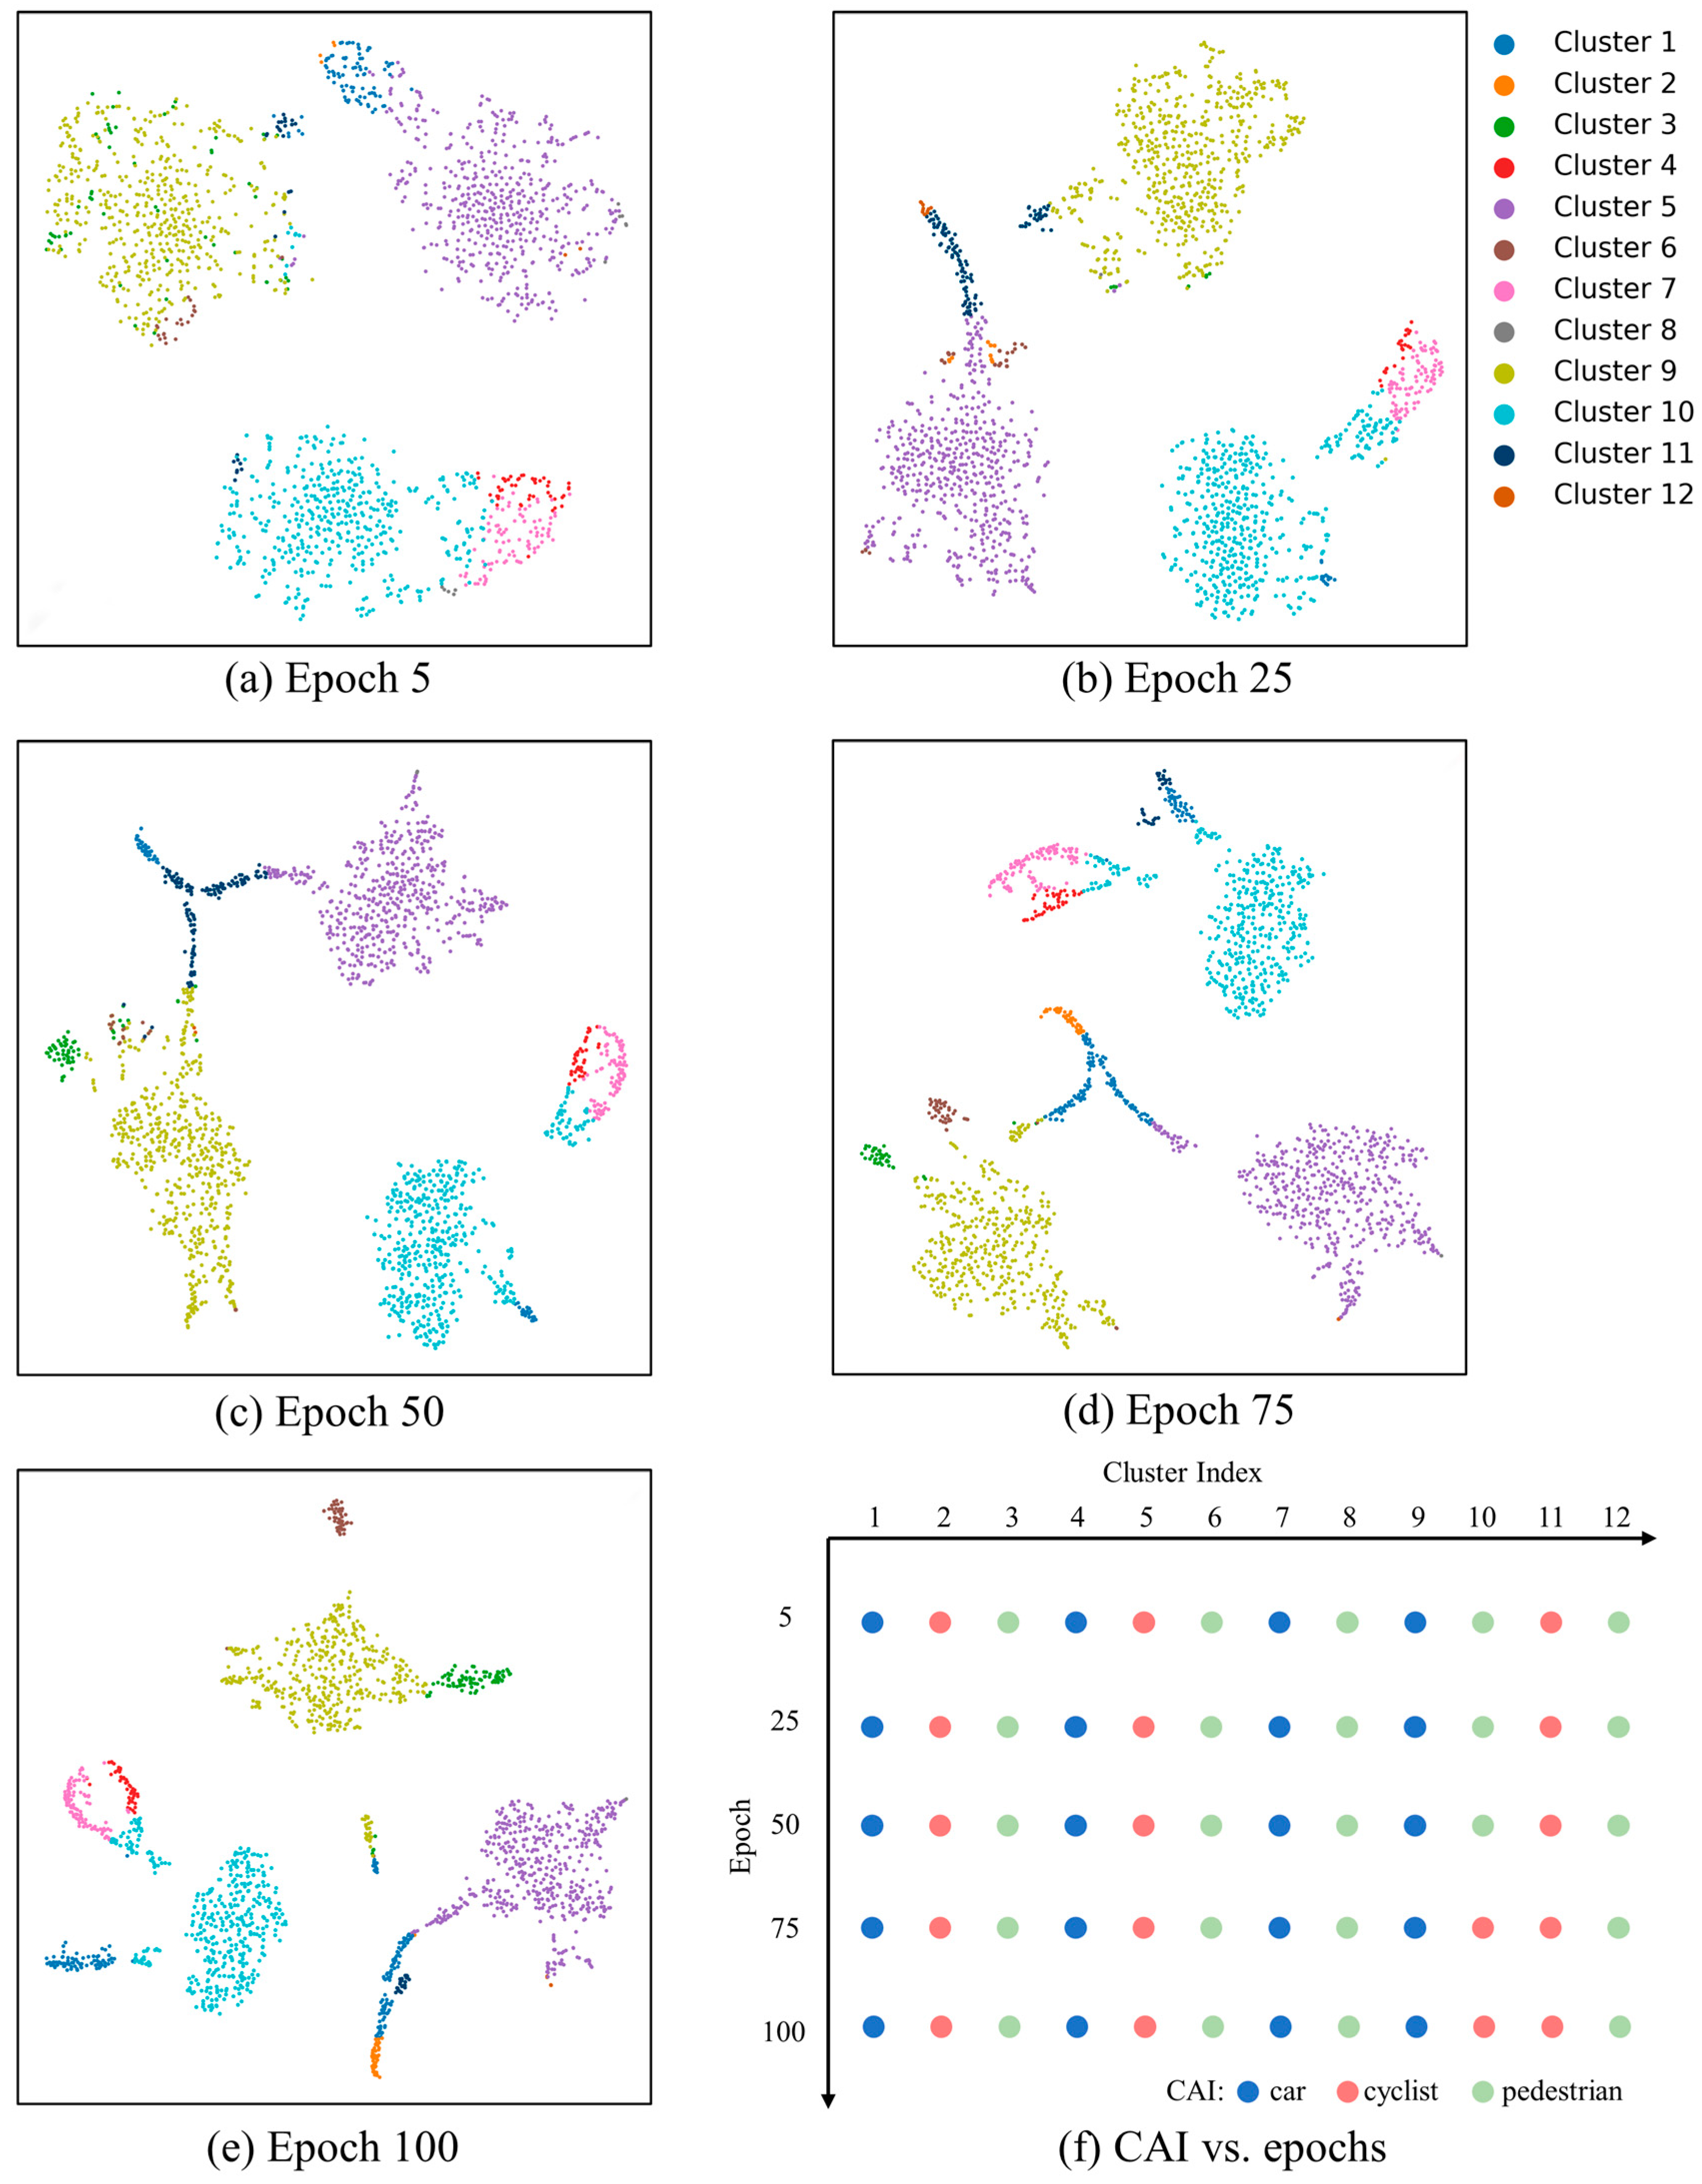
The correlation between basic concepts and target identification is statistically significant, but not absolute. Specific task radar target recognition relies on an integrated analysis of multiple basic concepts to ultimately determine the target category. Therefore, after extracting the basic concepts, we use Basic Concept-Guided Deep Embedding Clustering (BCG-DEC) to discover the task-specific composite concepts. First, we use all the data from the ROD2021 dataset to train the autoencoder with 2.5G parameters on GeForce RTX 3090 for discovering task-specific composite concepts. The number of k-means initial clustering clusters in BCG-DEC is set to 12, the parameter σ of the Gaussian kernel function with adaptive weighting is set to 10, and the empirical threshold used to evaluate the clustering quality is set to 0.3. The concept dataset was selected from three sequences within the ROD2021 dataset: 2019_04_09_BMS1000, 2019_04_09_CMS1002, and 2019_04_09_PMS1000. From each sequence, 2128 RA spectrograms containing only a single target were chosen, totaling 6384 RA spectrograms. Figure 5 shows the clustering results at different stages of the training process after dimensionality reduction by t-SNE [31], as well as the changes in the Category Association Index (CAI) for each cluster across epochs:
In the framework of concept-based explanations, each concept is defined by a corresponding dataset. Thus, during the clustering process, the BCG-DEC method mines deep semantic information from millimeter-wave radar data to identify data with similar representations, reflecting target recognition characteristics for specific tasks. As depicted in Figure 5, with increasing training epochs, the clusters become more concentrated and the boundaries between them more defined. This demonstrates the ability of the BCG-DEC method to dynamically learn the distribution patterns of MMW radar data and fully consider the data points that represent transitional states between categories. Figure 5f also exemplifies this, where cluster10 shifts its CAI from ‘pedestrian’ to ‘cyclist’ after the 50th epoch, illustrating the method’s ability to adjust and refine its understanding of data distributions and the concepts inherent in target categories. After passing the clustering evaluation stage, the results of clustering from the 100th epoch are shown in Table 1:
Table 1 presents detailed information on the 12 task-specific composite concepts from cluster1 to cluster12, including the total number of radar data within each task-specific composite concept, the number of different categories of data, and the CAI obtained after calculation by Equation (8). By observing Table 1, we find that the task-specific composite concept ‘cluster12’ contains fewer than 100 total MMW radar data points. This suggests that the task-specific composite concept ‘cluster12’ is not a major feature of pedestrians. In order to satisfy the meaningfulness of the concept definition, we remove the task-specific composite concept of ‘cluster12’. After Equation (9) is used to convert the data in the task-specific composite concept into RGB images, we check and confirm that the remaining task-specific composite concepts meet the criteria for coherency.
After determining the concept datasets for the basic concept and task-specific composite concept, we used ROD2021 data outside the concept dataset to train the RECORD model proposed by Colin Decourt [2] in GeForce RTX 3090.

5.3. TCAV Experiment

After completing the concept discovery and training of the RECORD model, we will focus on computing the TCAV scores of different concepts for different target categories. TCAV scores can not only explain the model but also reflect the importance of the concept. In the TCAV experiment, we chose four layers of the RECORD model as shown in Figure 1: the encoder (i.e., the last layer of the encoder part), up_conv3 (the last upper convolutional layer), conv_head1 (the first convolutional output head), and conv_head2 (the second convolutional output head) for explanation. The position of these layers in Figure 1 is from bottom to top.

5.3.1. Explanation of Basic Concepts

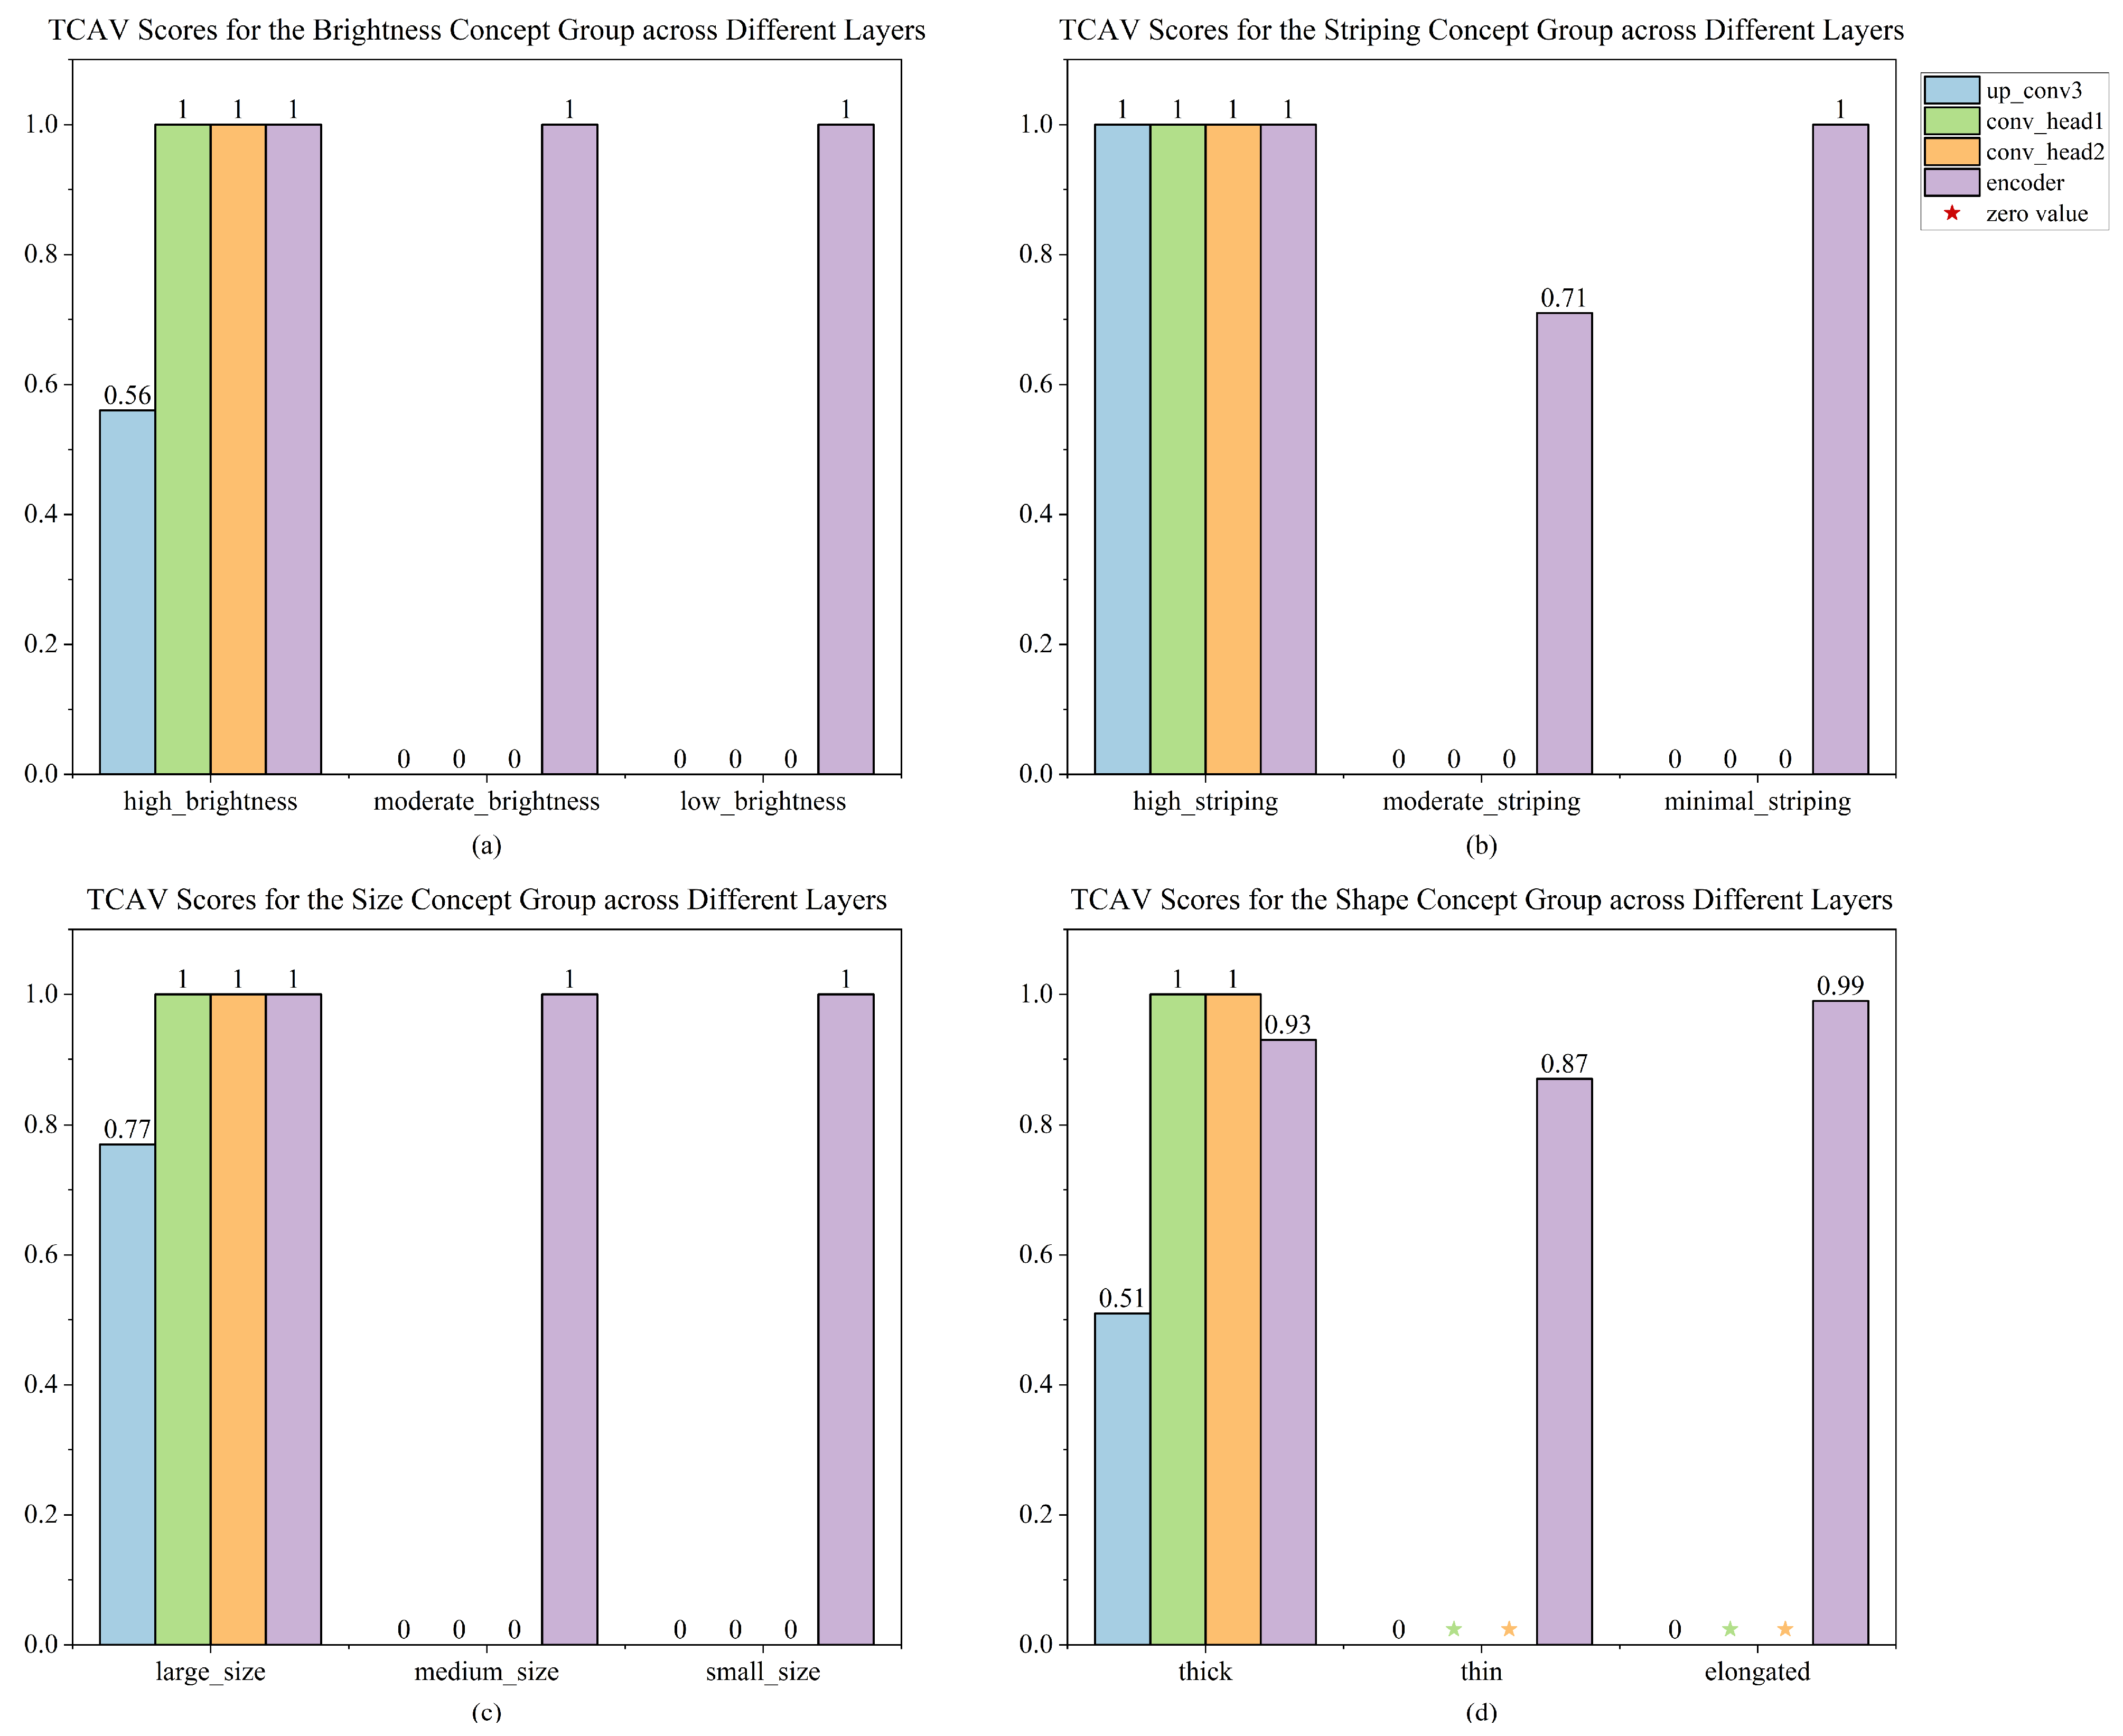
Based on TCAV theory, we calculated TCAV scores for three types of targets recognizable by the RECORD model—car, cyclist, and pedestrian—using twelve basic concepts. Figure 6 shows the TCAV scores of basic concepts for the car category on four layers.
According to Figure 6, we find that four concepts—high brightness, high striping, large size, and thick—are important for RECORD to recognize the car category. These four concepts have more hidden layers and have higher TCAV scores than the other concepts, while the other concepts have sparse scores (i.e., only have scores on the encoder).
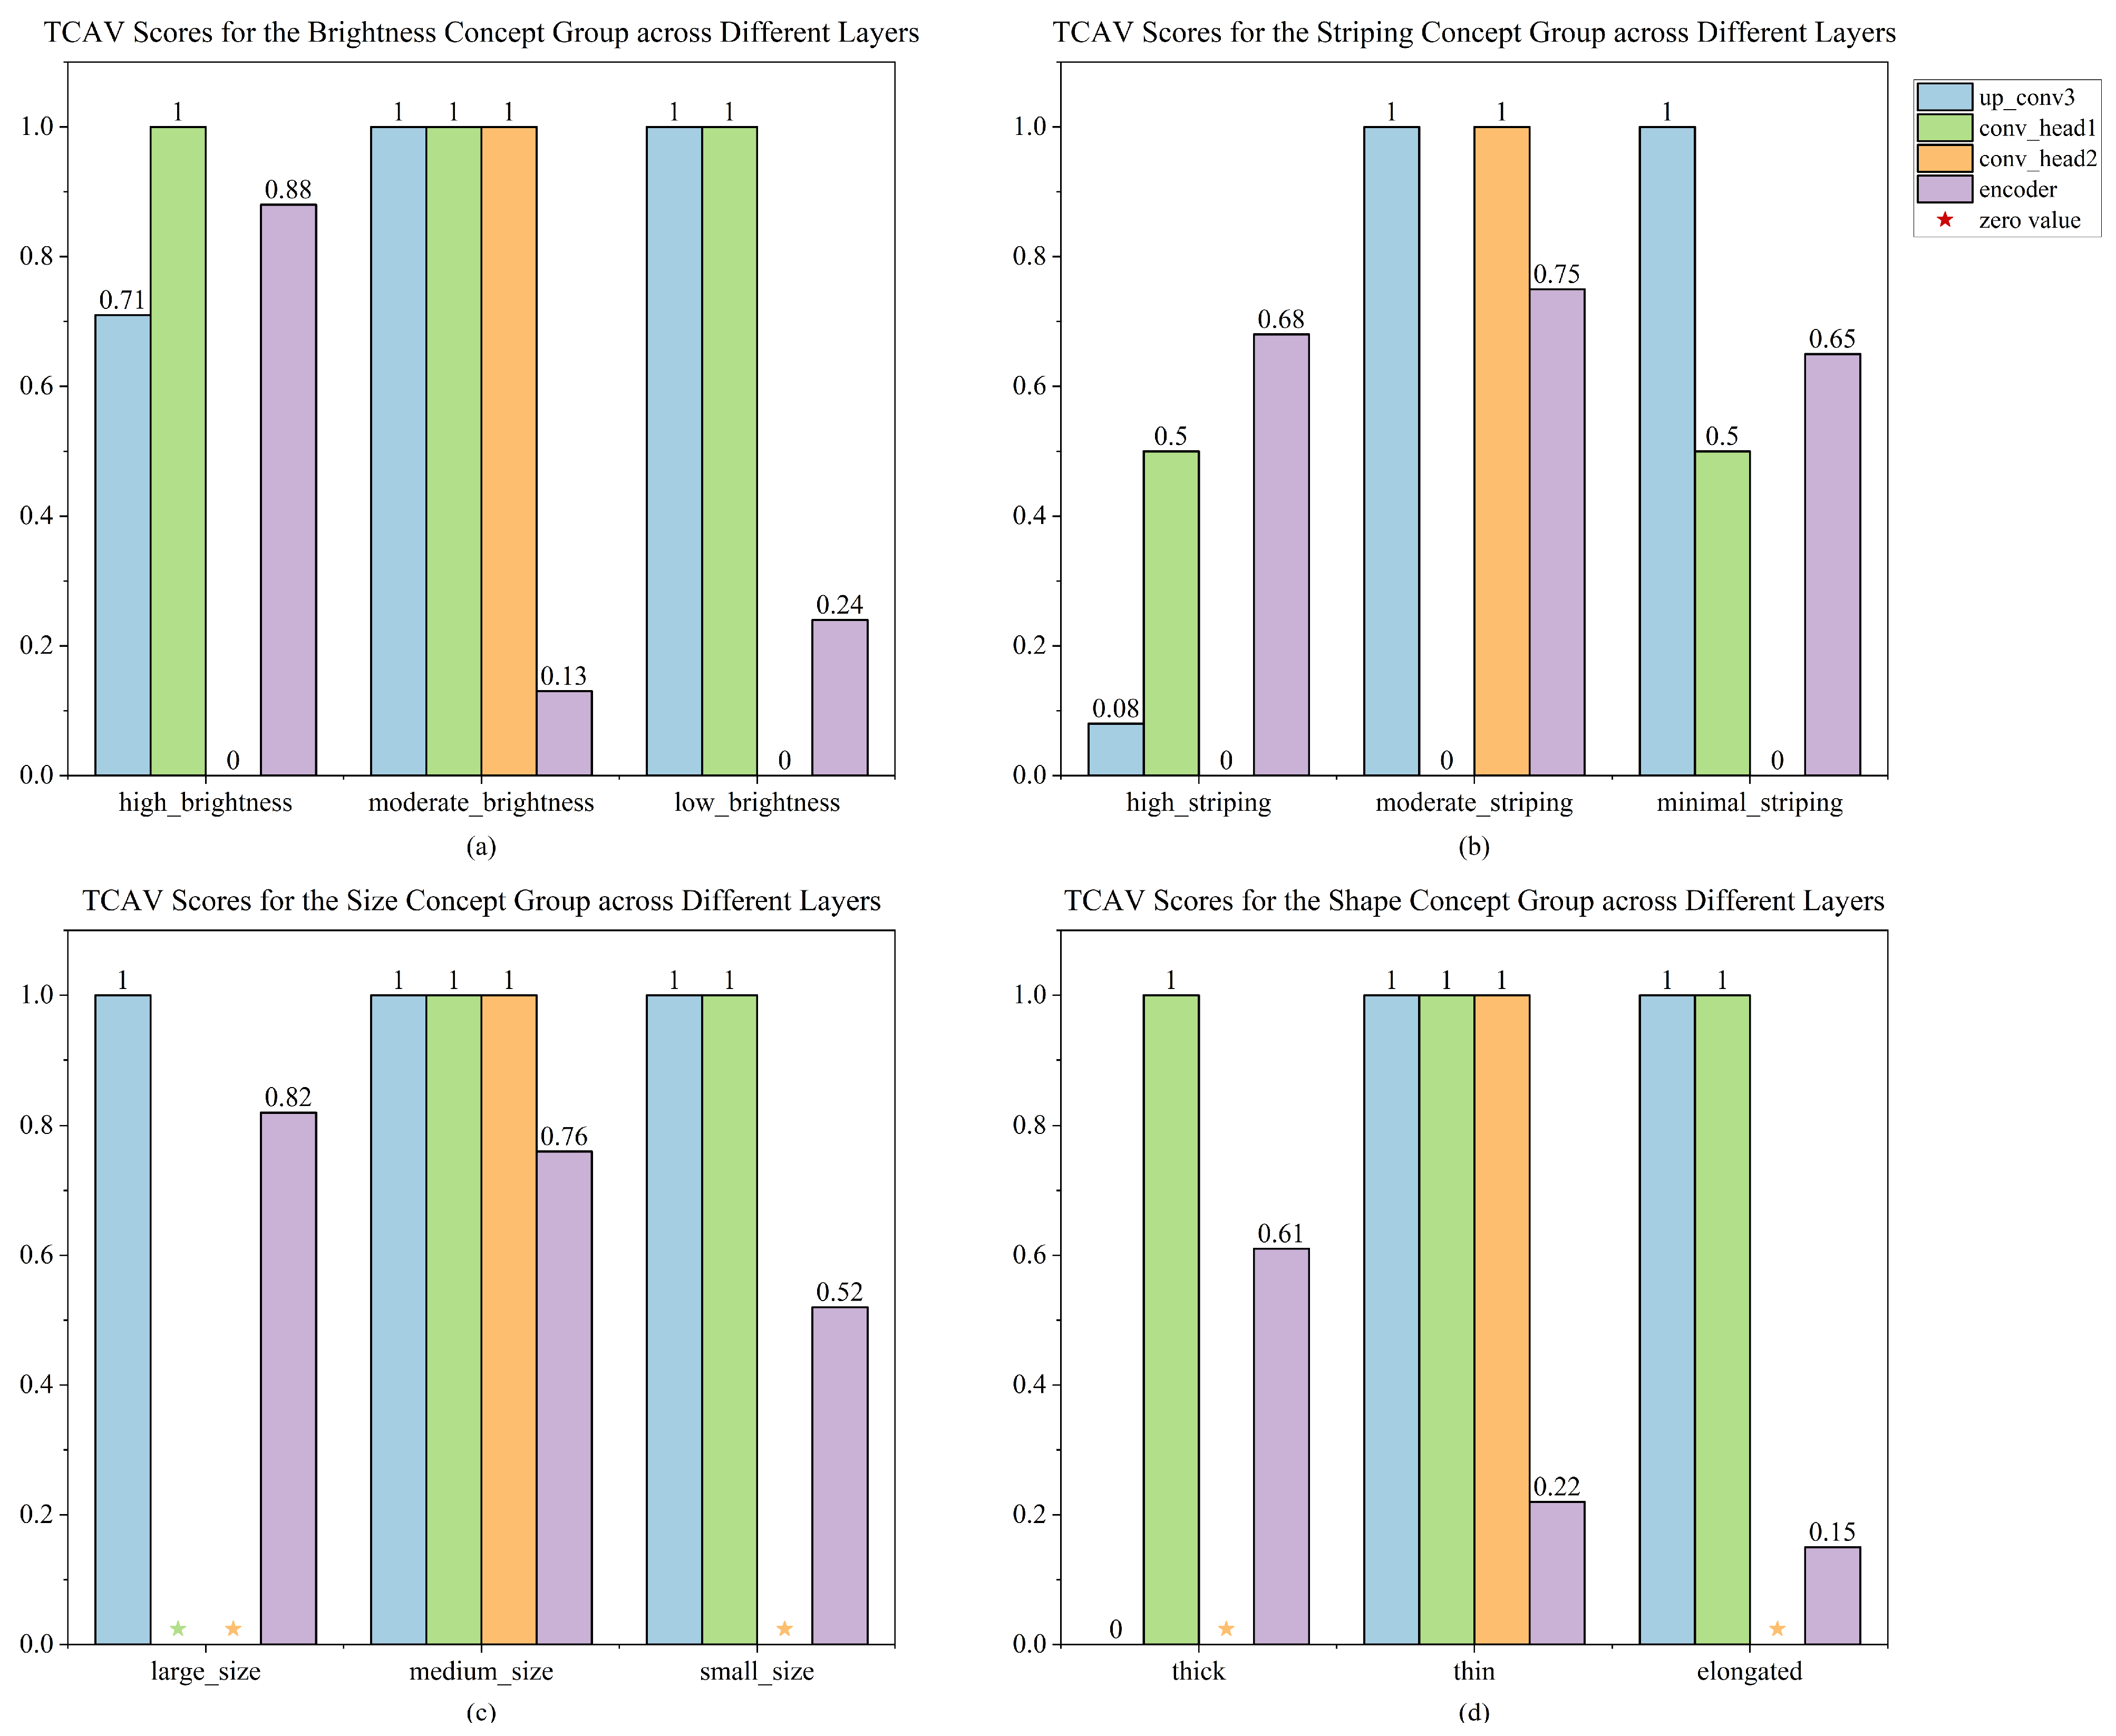
Figure 7 shows the TCAV scores of basic concepts for the cyclist category on four layers.
According to Figure 7, we find that four concepts—moderate brightness, moderate striping, medium size, and thin—are important for RECORD to recognize the category of cyclist. Compared with other concepts, the TCAV scores of these four concepts are generally higher.
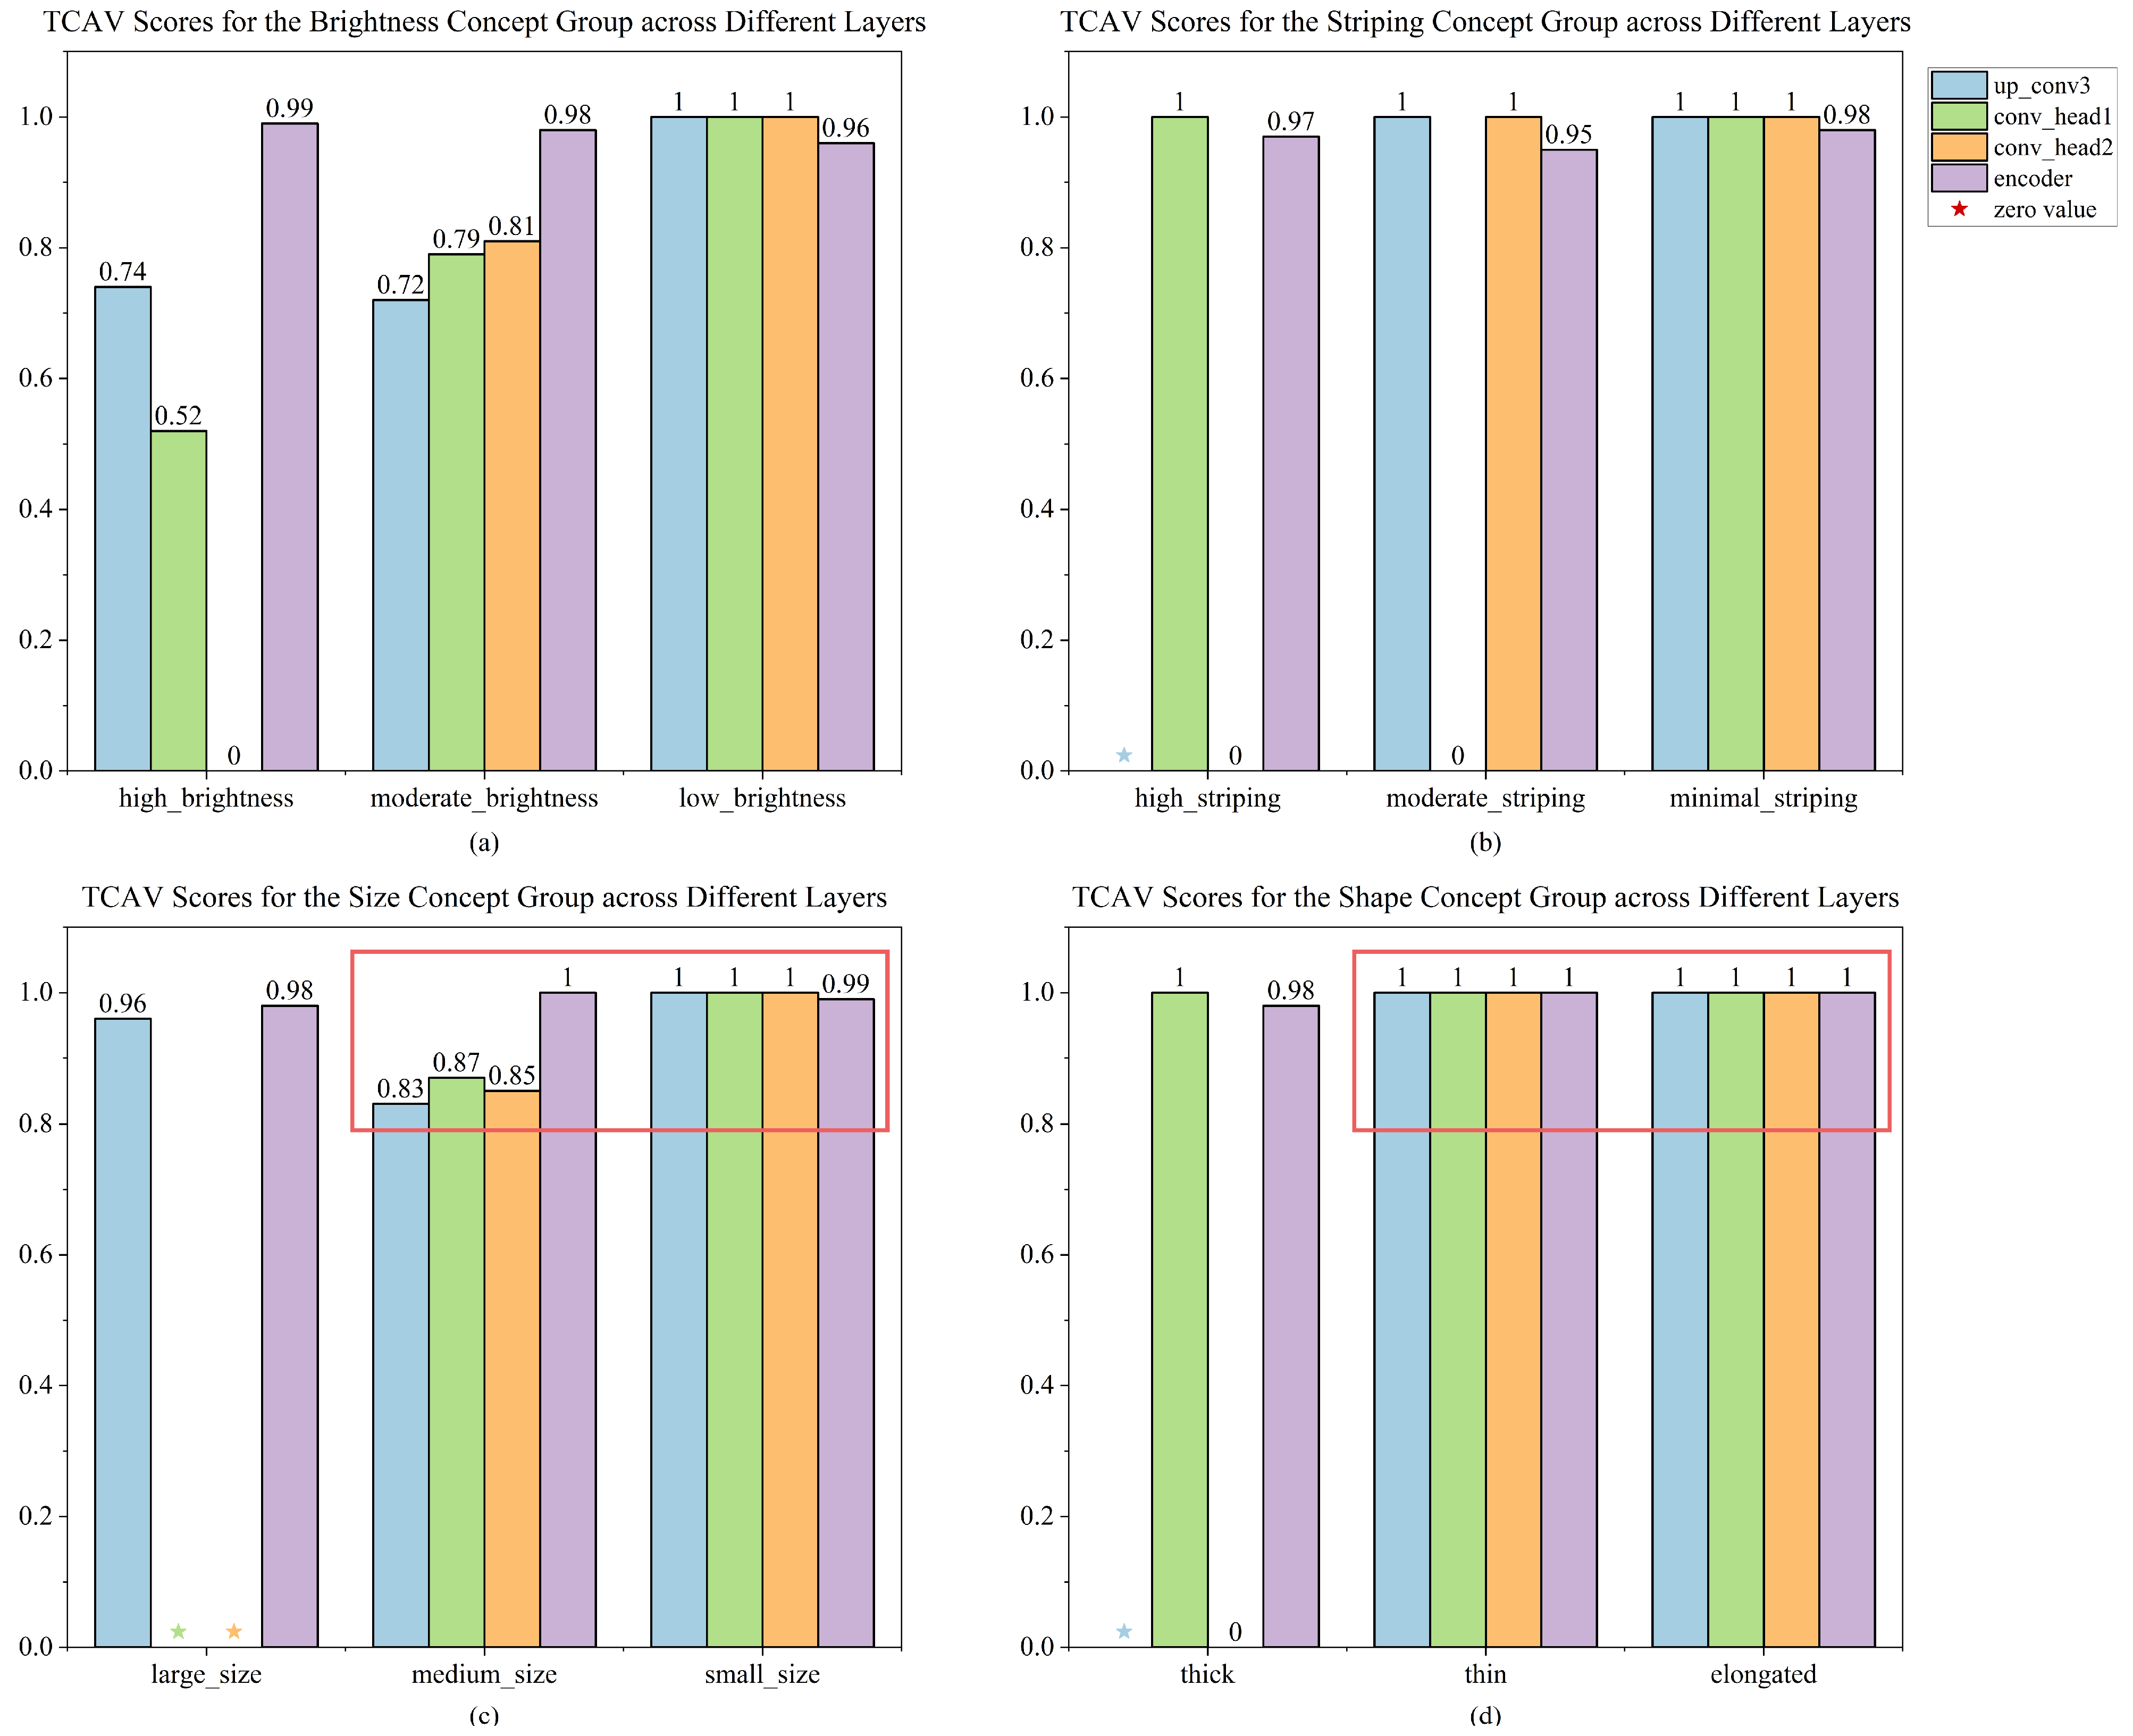
Figure 8 shows the TCAV scores of basic concepts for the pedestrian category on four layers.
According to Figure 8, we observe that the pedestrian category has higher TCAV scores for the four concepts of low brightness, minimal striping, small size, and elongated. In addition, we can see that ‘moderate size’ and ‘thin’ scores are also high and concentrated. This phenomenon indicates that the concepts of moderate size and thin are also more sensitive to pedestrian categories. The phenomenon observed likely stems from the inherent subjectivity of manual concept annotation and the narrow focus on basic concepts. To effectively differentiate between target categories, there is a need for concepts that are both intricate and tailored to specific tasks. The following task-specific composite concept explanation experiment proves that BCG-DEC can solve this problem well.
Interestingly, the encoder layer scored across all concepts, particularly achieving high scores on various concepts associated with cars and pedestrians. This is because the feature representation output by the encoder is relatively primitive and contains low-level semantic information, which cannot be well associated with a certain type of concept. In contrast, the features generated by other layers in the decoder part, especially those close to the output layer, contain higher-level semantic information and are more directional in the correlation between different concepts and categories.
Overall, these results are consistent with our visual analytical experience, and the high TCAV scores reflect the importance of these basic concepts for recognizing the target.

5.3.2. Explanation of Task-Specific Composite Concepts

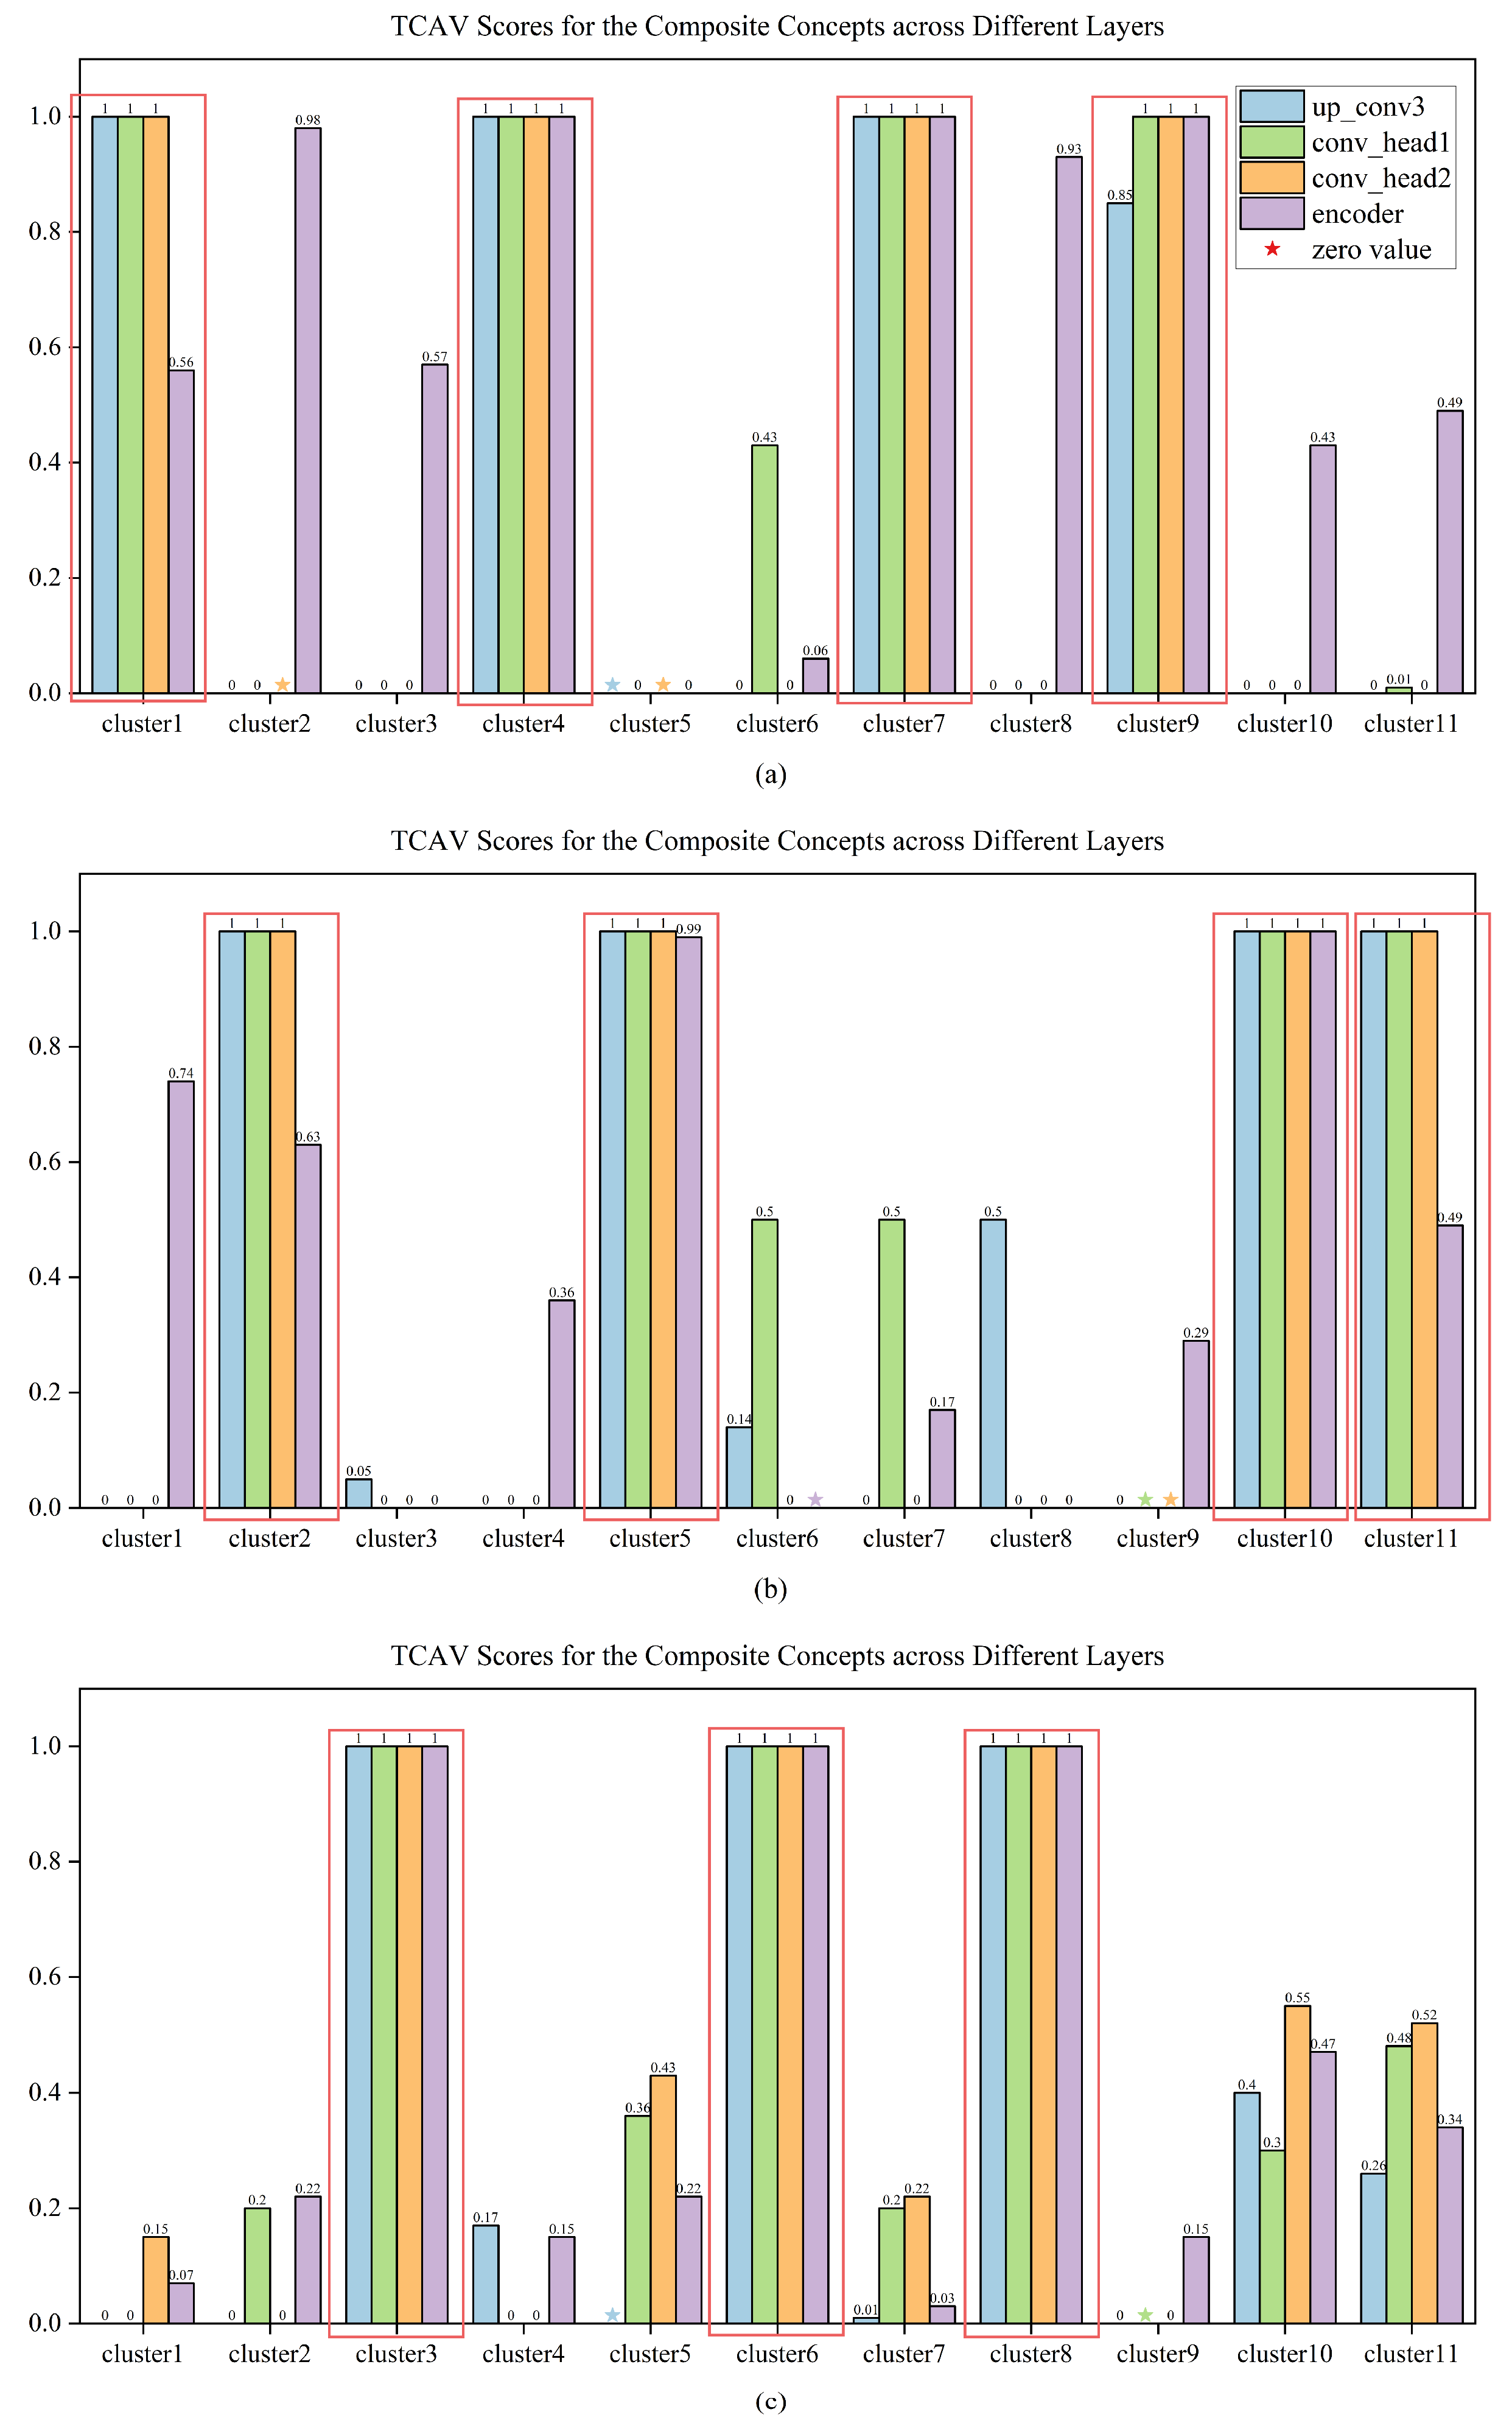
Similar to explaining the RECORD model using basic concepts, we calculate TCAV scores using the 11 task-specific composite concepts discovered in Section 5.2 in combination with TCAV theory. The experimental results are shown in Figure 9:
As can be seen from the CAI index in Table 1, the task-specific composite concepts cluster1, cluster4, cluster7, and cluster9 are the concepts most associated with cars. In Figure 9a, we selected the target class as cars, and it is not difficult to see that these concepts score highly and intensively in different layers. This means that cluster1, cluster4, cluster7, cluster9 are important for the model to recognize car categories. The target class of Figure 9b is cyclists. We find that the highest TCAV scores are concentrated in cluster2, cluster5, cluster10, and cluster11. These concepts are the task-specific composite concepts most associated with cyclists. This suggests that the task-specific composite concept describing the characteristics of a cyclist is important for their recognition. In the experiment (c) in Figure 9, we chose pedestrians as the target class. We found that the task-specific composite concepts cluster3, cluster6, and cluster8 have TCAV scores of 1 across all layers. The CAI of these concepts indicates that they are the concepts most associated with the pedestrian category. Similarly, this also shows that the concepts cluster3, cluster6, and cluster8 describe pedestrian characteristics that are important for the model to identify pedestrians. Although the task-specific composite concepts cluster10 and cluster11 contain radar data for many pedestrian categories, it is clear from Figure 9c that their TCAV scores are lower overall than cluster3, cluster6, and cluster8. This shows that the task-specific composite concept fully characterizes the characteristics of categories and has better attributes to distinguish different categories in terms of relative basic concepts.
In summary, we use the task-specific composite concepts to illustrate that the RECORD model prediction mechanism is reasonable and has good explainability. At the same time, the high TCAV score also reflects the importance of task-specific composite concepts for model recognition targets.

5.4. Ablation Analysis

To further demonstrate the validity of the proposed BCG-DEC, we conducted ablation studies on different stages of the clustering stage of concept discovery. Corresponding ablation experiments included (1) k-means clustering directly after extracting features using an encoder only and (2) DEC clustering without adding basic concept guidance.
We find that small-scale clusters with few sample points will appear in the clustering results. Small-scale clusters indicate that these concepts are not major, and these infrequent clusters also indicate that the concepts they represent are not generic concepts of the target class. If there are too many small clusters in the clustering result, the clustering method is not suitable for concept discovery.
To sum up, we choose the number of small-scale clusters to evaluate the clustering method. The smaller the number of small-scale clusters, the more suitable the clustering method is for the concept discovery task.
We performed the above two ablation experiments and compared them with BCG-DEC under the index of the number of small-scale clusters. We defined clusters with data less than 100 as small-scale clusters, and the experimental results are shown in Table 2.
From the experimental results, we found that k-means clustering had the most small-scale clusters, followed by DEC, and BCG-DEC had the least. This is because k-means is affected by outliers and the calculation principle of the k-means method. k-means clustering is based on minimizing the sum of squares of the Euclidean distance of the data point to its cluster center. This approach leads to the so-called “hard boundary” problem, where data points either belong to this cluster or that cluster, with no transition state in between, which ignores possible relative relationships and continuity between data points. DEC not only considers assigning points to cluster centers but also adjusts the feature space itself through the neural network so that similar points are closer together and different points are more spread out. In this way, the transition point can be mapped to a location in the feature space that forms a kind of “soft boundary” between the different clusters, thus better preserving the continuous relationship between the data points. BCG-DEC is influenced by meaningful information from basic concepts, resulting in the majority of the discovered task-specific composite concepts being frequently occurring and significant. Consequently, this leads to a reduction in the number of small-scale clusters within the BCG-DEC method.
In summary, BCG-DEC has the advantage of minimizing the number of small-scale clusters, so this method is a better choice for concept discovery.

6. Conclusions

As more deep learning models for radar target recognition are designed, there is increasing concern about the reliability and security of these models. Providing the explainability of the model can effectively respond to this need of the user. In our work, we define a series of basic concepts with a reference value that significantly elucidates the decision-making basis of radar target recognition models. Furthermore, we propose a Basic Concept-Guided Deep Embedding Clustering (BCG-DEC) method and prove its effectiveness. The BCG-DEC method addresses the inherent subjectivity and variability of manual concept annotation methods successfully. The task-specific composite concepts it discovers demonstrate a strong correspondence with the categories relevant to the current task. Experiments on the ROD2021 dataset show that we verify that the 12 basic concepts and the 11 task-specific composite concepts found after filtering are important for the model to recognize the target class. While this research primarily focuses on providing explainability for target category recognition, it is currently specialized for MMW radar sensors and target recognition domains. In future work, we aim to broaden our investigations to include explanations of individual sample positions and to explore and mine spatial concepts. This effort will allow us to extend our concept-based explanation approach to comprehensive radar target recognition and detection models. Additionally, we plan to expand our research beyond MMW radars to include a wider variety of radar sensors, enhancing the generalizability of our methods and providing more comprehensive explanations for a broader array of radar target recognition models. We hope that this work serves as a foundational direction for developing scalable, explainable methods for radar target recognition.

Author Contributions

Conceptualization, Q.S. and T.Z.; methodology, Q.S. and T.Z.; software, Q.S., T.Z. and L.Z.; validation, L.Z., Y.Z. and Z.M.; formal analysis, Y.Z.; investigation, Q.S., T.Z. and Z.M.; resources, Y.Z. and Z.M.; data curation, L.Z. and Q.S.; writing—original draft preparation, Q.S. and T.Z.; writing—review and editing, T.Z., Q.S. and L.Z.; visualization, L.Z. and Z.M.; supervision, T.Z. and Z.M.; project administration, T.Z. and L.Z.; funding acquisition, T.Z. and L.Z. All authors have read and agreed to the published version of the manuscript.

Funding

This research was funded by the Young Scientists Fund of the National Natural Science Foundation of China, grant number 62206258.

Data Availability Statement

No new data were created or analyzed in this study. Data sharing is not applicable to this article.

Acknowledgments

We would also like to express our gratitude to the anonymous reviewers and the editors for their valuable advice and assistance.

Conflicts of Interest

The authors declare no conflicts of interest.

References

  1. Wang, Y.; Jiang, Z.; Li, Y.; Hwang, J.N.; Xing, G.; Liu, H. RODNet: A real-time radar object detection network cross-supervised by camera-radar fused object 3D localization. IEEE J. Sel. Top. Signal Process. 2021, 15, 954–967. [Google Scholar] [CrossRef]
  2. Decourt, C.; VanRullen, R.; Salle, D.; Oberlin, T. A recurrent CNN for online object detection on raw radar frames. arXiv 2022, arXiv:2212.11172. [Google Scholar] [CrossRef]
  3. Zhao, J.; Guo, W.; Zhang, Z.; Yu, W. A coupled convolutional neural network for small and densely clustered ship detection in SAR images. Sci. China Inf. Sci. 2019, 62, 1–16. [Google Scholar] [CrossRef]
  4. Nabati, R.; Qi, H. Rrpn: Radar region proposal network for object detection in autonomous vehicles. In Proceedings of the 2019 IEEE International Conference on Image Processing (ICIP), Taiwan, China, 22–25 September 2019; pp. 3093–3097. [Google Scholar]
  5. Hajri, H.; Rahal, M.C. Real time lidar and radar high-level fusion for obstacle detection and tracking with evaluation on a ground truth. arXiv 2018, arXiv:1807.11264. [Google Scholar]
  6. Qian, K.; Zhu, S.; Zhang, X.; Li, L.E. Robust multimodal vehicle detection in foggy weather using complementary lidar and radar signals. In Proceedings of the IEEE/CVF Conference on Computer Vision and Pattern Recognition, Nashville, TN, USA, 20–25 June 2021; pp. 444–453. [Google Scholar]
  7. Paek, D.-H.; Kong, S.-H.; Wijaya, K.T. K-radar: 4d radar object detection for autonomous driving in various weather conditions. Adv. Neural Inf. Process. Syst. 2022, 35, 3819–3829. [Google Scholar]
  8. Tan, B.; Ma, Z.; Zhu, X.; Li, S.; Zheng, L.; Chen, S.; Huang, L.; Bai, J. 3D Object Detection for Multiframe 4D Automotive Millimeter-Wave Radar Point Cloud. IEEE Sens. J. 2022, 23, 11125–11138. [Google Scholar] [CrossRef]
  9. Schrouff, J.; Baur, S.; Hou, S.; Mincu, D.; Loreaux, E.; Blanes, R.; Wexler, J.; Karthikesalingam, A.; Kim, B. Best of both worlds: Local and global explanations with human-understandable concepts. arXiv 2021, arXiv:2106.08641. [Google Scholar]
  10. Alvarez Melis, D.; Jaakkola, T. Towards robust interpretability with self-explaining neural networks. Adv. Neural Inf. Process. Syst. 2018, 31, 7775–7784. [Google Scholar]
  11. Zhou, B.; Khosla, A.; Lapedriza, A.; Oliva, A.; Torralba, A. Learning deep features for discriminative localization. In Proceedings of the 2016 IEEE Conference on Computer Vision and Pattern Recognition, Las Vegas, NV, USA, 27–30 June 2016; pp. 2921–2929. [Google Scholar]
  12. Selvaraju, R.R.; Das, A.; Vedantam, R.; Cogswell, M.; Parikh, D.; Batra, D.J. Grad-CAM: Why did you say that? arXiv 2016, arXiv:1611.07450. [Google Scholar]
  13. Chattopadhay, A.; Sarkar, A.; Howlader, P.; Balasubramanian, V.N. Grad-cam++: Generalized gradient-based visual explanations for deep convolutional networks. In Proceedings of the 2018 IEEE Winter Conference on Applications of Computer Vision (WACV), Lake Tahoe, NV, USA, 12–15 March 2018; pp. 839–847. [Google Scholar]
  14. Jiang, P.-T.; Zhang, C.-B.; Hou, Q.; Cheng, M.-M.; Wei, Y. Layercam: Exploring hierarchical class activation maps for localization. IEEE Trans. Image Process. 2021, 30, 5875–5888. [Google Scholar] [CrossRef]
  15. Wang, H.; Wang, Z.; Du, M.; Yang, F.; Zhang, Z.; Ding, S.; Mardziel, P.; Hu, X. Score-CAM: Score-weighted visual explanations for convolutional neural networks. In Proceedings of the IEEE/CVF Conference on Computer Vision and Pattern Recognition Workshops, Seattle, WA, USA, 14–19 June 2020; pp. 24–25. [Google Scholar]
  16. Lucieri, A.; Bajwa, M.N.; Braun, S.A.; Malik, M.I.; Dengel, A.; Ahmed, S. On interpretability of deep learning based skin lesion classifiers using concept activation vectors. In Proceedings of the 2020 International Joint Conference on Neural Networks (IJCNN), Glasgow, UK, 19–24 July 2020; pp. 1–10. [Google Scholar]
  17. Kindermans, P.-J.; Hooker, S.; Adebayo, J.; Alber, M.; Schütt, K.T.; Dähne, S.; Erhan, D.; Kim, B. The (un)reliability of saliency methods. Explain. AI Interpret. Explain. Vis. Deep. Learn. 2019, 11700, 267–280. [Google Scholar]
  18. Ghorbani, A.; Abid, A.; Zou, J. Interpretation of neural networks is fragile. In Proceedings of the AAAI Conference on Artificial Intelligence, Honolulu, HI, USA, 27 January–1 February 2019; pp. 3681–3688. [Google Scholar]
  19. Doshi-Velez, F.; Kim, B. Towards a rigorous science of interpretable machine learning. arXiv 2017, arXiv:1702.08608. [Google Scholar]
  20. Kim, B.; Wattenberg, M.; Gilmer, J.; Cai, C.; Wexler, J.; Viegas, F. Interpretability beyond feature attribution: Quantitative testing with concept activation vectors (tcav). In Proceedings of the International Conference on Machine Learning, Vienna, Austria, 10–15 July 2018; pp. 2668–2677. [Google Scholar]
  21. Amara, J.; König-Ries, B.; Samuel, S. Concept explainability for plant diseases classification. arXiv 2023, arXiv:2309.08739. [Google Scholar]
  22. Wang, A.; Lee, W.-N. Exploring Concept Contribution Spatially: Hidden Layer Interpretation with Spatial Activation Concept Vector. arXiv 2022, arXiv:2205.11511. [Google Scholar]
  23. Pendyala, V.; Choi, J. Concept-Based Explanations for Tabular Data. arXiv 2022, arXiv:2209.05690. [Google Scholar]
  24. Nejadgholi, I.; Fraser, K.C.; Kiritchenko, S. Improving generalizability in implicitly abusive language detection with concept activation vectors. arXiv 2022, arXiv:2204.02261. [Google Scholar]
  25. Szegedy, C.; Liu, W.; Jia, Y.; Sermanet, P.; Reed, S.; Anguelov, D.; Erhan, D.; Vanhoucke, V.; Rabinovich, A. Going deeper with convolutions. In Proceedings of the IEEE Conference on Computer Vision and Pattern Recognition, Boston, MA, USA, 7–12 June 2015; pp. 1–9. [Google Scholar]
  26. MacQueen, J. Some methods for classification and analysis of multivariate observations. In Proceedings of the Fifth Berkeley Symposium on Mathematical Statistics and Probability, Berkeley, CA, USA, 27 December 1965–7 January 1966; University of California Press: Berkeley, CA, USA, 1967; pp. 281–297. [Google Scholar]
  27. Ghorbani, A.; Wexler, J.; Zou, J.Y.; Kim, B. Towards automatic concept-based explanations. Adv. Neural Inf. Process. Syst. 2019, 32, 9273–9282. [Google Scholar]
  28. Kreithen, D.E.; Halversen, S.D.; Owirka, G.J. Discriminating targets from clutter. Linc. Lab. J. 1993, 6, 25–52. [Google Scholar]
  29. Xie, J.; Girshick, R.; Farhadi, A. Unsupervised deep embedding for clustering analysis. In Proceedings of the International Conference on Machine Learning, New York, NY, USA, 20–22 June 2016; pp. 478–487. [Google Scholar]
  30. Wang, Y.; Wang, G.; Hsu, H.-M.; Liu, H.; Hwang, J.-N. Rethinking of radar’s role: A camera-radar dataset and systematic annotator via coordinate alignment. In Proceedings of the IEEE/CVF Conference on Computer Vision and Pattern Recognition, Nashville, TN, USA, 21–25 June 2021; pp. 2815–2824. [Google Scholar]
  31. Van der Maaten, L.; Hinton, G. Visualizing data using t-SNE. J. Mach. Learn. Res 2008, 9, 2579–2605. [Google Scholar]
Figure 1. The network architecture of the RECORD model [2]. The network utilizes a fully convolutional recurrent encoder to extract spatial information and employs inverted residuals (IR) to reduce the number of parameters, while a Bottleneck LSTM is used for learning temporal information. The decoder consists of three transposed convolution layers. The final two output heads are used for classification or segmentation. Black line arrows added between the encoder and decoder represent skip connections, which are used to integrate features of different resolutions.
Remotesensing 16 02640 g001
Figure 2. The overall framework of the proposed Basic Concept-Guided Deep Embedding Clustering (BCG-DEC). (a) Learning Stage: Autoencoder training on millimeter-wave (MMW) radar data; (b) Concept Definition Stage: Defining datasets for each basic concept; (c) Guiding Stage: Using centroids to guide clustering model training; (d) Evaluation Stage: Using clustering entropy to evaluate clustering results.
Remotesensing 16 02640 g002
Figure 3. Three examples from the dataset. (a) An RGB image and its corresponding Range-Angle (RA) spectrogram of a car; (b) An RGB image and its corresponding RA spectrogram of a cyclist; (c) An RGB image and its corresponding RA spectrogram of a pedestrian.
Remotesensing 16 02640 g003
Figure 4. Visualization of basic concepts. (a) high brightness; (b) moderate brightness; (c) low brightness; (d) high striping; (e) moderate striping; (f) minimal striping; (g) large size; (h) medium size; (i) small size; (j) thick; (k) thin; (l) elongated.
Remotesensing 16 02640 g004
Figure 5. Visualization of the clustering results of 2000 randomly selected data points and Category Association Index (CAI) changes across training epochs. Subfigures (ae) show clustering results at epochs 5, 25, 50, 75, and 100, respectively. Subfigure (f) displays the variation in CAI for each cluster across epochs.
Remotesensing 16 02640 g005
Figure 6. TCAV score results for basic concepts relative to the car category. (a) TCAV scores of brightness concepts at four layers; (b) TCAV scores of striping concepts at four layers; (c) TCAV scores of size concepts at the four layers; (d) TCAV scores for shape concepts across the four layers. The horizontal axis represents the concept name, and the vertical axis is the TCAV score. ‘★’’s mark CAVs were omitted after statistical testing.
Remotesensing 16 02640 g006
Figure 7. TCAV score results for basic concepts relative to the cyclist category. (a) TCAV scores of brightness concepts at four layers; (b) TCAV scores of striping concepts at four layers; (c) TCAV scores of size concepts at the four layers; (d) TCAV scores for shape concepts across the four layers. The horizontal axis represents the concept name, and the vertical axis is the TCAV score. ‘★’’s mark CAVs were omitted after statistical testing.
Remotesensing 16 02640 g007
Figure 8. TCAV score results for basic concepts relative to the pedestrian category. (a) TCAV scores of brightness concepts at four layers; (b) TCAV scores of striping concepts at four layers; (c) TCAV scores of size concepts at the four layers; (d) TCAV scores for shape concepts across the four layers. The horizontal axis represents the concept name, and the vertical axis is the TCAV score. ‘★’’s mark CAVs were omitted after statistical testing. The red box highlights the concept of similar TCAV scores.
Remotesensing 16 02640 g008
Figure 9. TCAV score results for task-specific composite concepts relative to three categories. (a) TCAV scores of task-specific composite concepts relative to the car category; (b) TCAV scores of task-specific composite concepts relative to the cyclist category; (c) TCAV scores of task-specific composite concepts relative to the pedestrian category. The horizontal axis represents the concept name, and the vertical axis is the TCAV score. ‘★’’s mark CAVs omitted after statistical testing. Red boxes highlight the areas of each subplot where the task-specific composite concepts scored most significantly.
Remotesensing 16 02640 g009
Table 1. Results of Concept Discovery with Basic Concept-Guided Deep Embedding Clustering.
Task-Specific
Composite Concept
Total Radar Data Points Car Samples CountCyclist
Samples Count
Pedestrian
Samples Count
Category Association Index (CAI)
cluster172072000Car
cluster224302421Cyclist
cluster329200292Pedestrian
cluster434734601Car
cluster575607560Cyclist
cluster681300813Pedestrian
cluster727127100Car
cluster864200642Pedestrian
cluster979179100Car
cluster107360493243Cyclist
cluster117420637105Cyclist
cluster12310031Pedestrian
Table 2. The experimental results for the ablation study.
MethodNumber of Small-Scale Clusters
AE + k-means5
DEC2
BCG-DEC1
Disclaimer/Publisher’s Note: The statements, opinions and data contained in all publications are solely those of the individual author(s) and contributor(s) and not of MDPI and/or the editor(s). MDPI and/or the editor(s) disclaim responsibility for any injury to people or property resulting from any ideas, methods, instructions or products referred to in the content.