Abstract
Phenology is a critical mirror reflecting vegetation growth and has a major impact on terrestrial ecosystems. The Loess Plateau (LP) is a paramount ecological zone in China that has experienced considerable vegetation changes. However, understanding the dynamics of vegetation phenology is limited by ambiguous vegetation interpretation and anthropogenic-induced forces. This study combined the multi-climatic and anthropogenic datasets to characterize the interactions between phenology shifts and environmental variables. The principal findings were as follows: (1) Phenological shifts exhibit spatial heterogeneity and an interannually increasing trend in greenness (R2 > 0.6, p < 0.05). Notably, SOS (the start of the growing season) advances while EOS (the end of the growing season) delays in both the southeastern and northwestern regions. (2) SOS and EOS, primarily in the range of 100–150 and 285–320 days, respectively. Phenological changes vary depending on vegetation types. The forest has an early SOS, within 80–112 days, and a delayed EOS, within 288–320 days. The SOS of shrub is mainly within 80–144 days. (3) EOS shows a strong response to the preseason of each climate variable. Precipitation (R = 0.76), soil moisture (R = −0.64), and temperature (R = 0.89) are the governing determinants in shaping vegetation phenology. In addition, agriculture and urbanization play a significant role in shaping the spatial variations of SOS. These findings provide a basis for a systematic understanding of the processes that affect vegetation growth, which is crucial for maintaining the health and sustainability of arid and semiarid ecosystems.
1. Introduction
A proverbial lyric “My home is on the Loess Plateau, where gales sweep across the slopes” alludes to the typical characteristics of the Loess Plateau (LP) in North China, cradling the development of regional agriculture and animal husbandry [1]. In recent years, the LP has experienced a considerable change stemming from anthropogenic interventions [2] and natural processes [3]. For example, massive afforestation implemented to reduce soil erosion [4] has had a profound influence on the emergence of ecological attributes, such as the distribution, diversity, function, and structural composition of vegetation species. In terrestrial ecosystems, vegetation plays pivotal roles in the governance of carbon cycling and energy conversion [5,6], sequestration of atmospheric CO2, and modification of the land surface status and water cycle [7]. Therefore, quantitative analysis of vegetation change is important for assessing the ecological diversity and health of vegetation in the changing environment of the LP [8].
Vegetation phenology is a natural calendar [9] that reflects various phenomena of the life cycle of plants (i.e., germination, greening, blossoming, fruiting, and senescence [10,11]) and encompasses multiple indicators (e.g., the start of the growing season (SOS), the end of the growing season (EOS), and the length of the growing season (LOS) [12]). Moreover, vegetation phenology is sensitive to the effects of climate change, which can induce profound consequences on vegetation productivity, evapotranspiration [9,13,14], agronomy, and human society [15], further affecting the environment by altering vegetation cycling activities.
Various influences, such as climatic and anthropogenic factors, can affect vegetation phenology [16,17,18,19], which can cause rapid acceleration in vegetation growth and phenological shifts [5]. Considerable research attention has focused on phenology-related changes in vegetation on the LP, providing valuable insights for understanding the interaction between vegetation and environmental evolution [20,21,22]. However, consensus is lacking regarding the dynamic processes and main influencing factors owing to limitations in phenological detection and incomplete knowledge of the regulating laws for single seasons and/or multiple seasons.
Various methods have been developed to detect phenology-related processes [23,24,25], and phenological information can be obtained through field-based phenology observations, using digital cameras, and applying phenological models that incorporate remote sensing data [15,26]. Field-based phenology observations provide a detailed and intuitive perspective on vegetation cycling [27,28]. A digital camera represents a robust tool with customizable precision and range suitable for recording variations in plant development [29]. Digital cameras are usually deployed across multiple sites with different vegetation types and linked by sensor networks [15]. The cameras are generally installed on towers or in visible observational locations [26], thereby allowing direct monitoring of vegetation growth and/or habitat conditions. They can also be used to assess canopy greenness and provide other physiological information [15]. Phenological models that incorporate remote sensing data generally have the advantage of being able to evaluate phenological status despite missing historical data, and they are capable of untangling the dynamics and alterations in vegetation growth and development by offering long-term and/or large-scale perspectives [30]. However, the application of each method is limited by its specific drawbacks. Field-based phenology observations are greatly affected by subjective factors and are representative of only small-scale areas [31]. Moreover, the processes involved in their acquisition are time-consuming and expensive [32]. Digital cameras require an appropriate communication network, and their placement and stabilization can lead to large observational errors [15]. Phenological models that incorporate remote sensing data have shortcomings in obtaining a complete picture in earlier or later stages of vegetation physiological growth owing to coarse spatial scales [33]. For example, when testing the sensitivity of spring phenology to temperature, the performance of models in relation to an experimental greenhouse does not translate well to natural environmental conditions [29,34,35]. Most models are established using inputs from past data, which can limit extrapolation under future climate scenarios [15]. Overall, it is difficult to directly obtain a general picture of the phenology of LP vegetation using the above approaches. Fortunately, an advanced analysis platform (i.e., Google’s cloud) and various related datasets are available to support an investigation of the phenological characteristics of vegetation in a changing environment on the LP.
Phenology affects the fluxes of various circulations that interact with the atmosphere, hydrosphere, and lithosphere [36]. Phenological alterations can have feedback to changes in regional biological systems in terms of structure, function, habit, and diversity [37] and to the related environment [9]. However, determination of the dynamics of phenology shifts is limited by the spatial variation of vegetation across large-scale regions. In the context of ecological and environmental transformations attributable to climate change and urbanization, as well as widespread ecohydrological and societal interests, the problem of how to best unravel the controlling factors/mechanisms behind seasonal phenology change on the LP and to mitigate their impacts remains a challenge. Consequently, there is an urgent need to conduct a thorough characterization of the phenological features of vegetation on the LP.
Although shifts in vegetation phenology within ecosystems have garnered significant attention, quantitative studies of phenological changes across different vegetation types remain limited, particularly in the LP. The diverse triggers influencing vegetation development in arid and semi-arid regions are not well understood. This study aims to achieve a comprehensive and systematic understanding of the phenological shifts of vegetation on the LP from varying perspectives, including phenological indicators (SOS, EOS, and LOS), seasonal characteristics, and vegetation type. The study investigates the impacts of climatic factors (precipitation, temperature, and soil moisture) and anthropogenic influences (urbanization, assessed using proxies such as annual nighttime light (ANL) and impervious surface percentage (ISP)); the schematic illustration is shown in Figure 1. The specific objectives of this study are as follows: (1) to analyze vegetation and phenological variability on the LP from 2003 to 2021; (2) to identify the phenological responses to evolving environmental shifts, both climatic and anthropogenic; (3) to assess the phenological changes across different vegetation types; and (4) to determine the primary factors influencing phenological indicators. This study provides insights that deepen the understanding of hydrological and agricultural systems in changing environments.
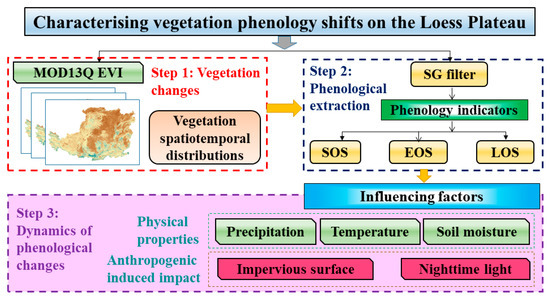
Figure 1.
Schematic illustrations of the present study.
2. Study Area
The LP in northwestern China covers an area of approximately 640,000 km2. It stretches to the Great Wall in the north, south to the Qinling Mountains, and from the Qilian Mountains in the west to the Taihang Mountains in the east (Figure 2). The elevation of the land is higher in the west and lower in the east, and the relief also changes dramatically [38]. The primary landform categories of the LP comprise plains, hills, high plateaus, and mountainous terrain [39]. The LP features a temperate continental monsoon climate, with annual mean temperatures ranging from −6 to 16 °C. The highest (lowest) temperatures are usually recorded in July (January). Average annual precipitation is approximately 100–800 mm, but rainfall occurs predominantly in the summer and autumn [40]. River discharge has notable seasonal variation and is characterized by apparent periods of high and low flow. The flood season has a very short duration, with frequent flood events mainly occurring between April and September [41]. The soil type within the region is mostly loess, characterized by its loose and porous structure [40]. The vegetation distribution from the east to the west reflects the following ecosystems: warm temperate deciduous broadleaved forests, forest-grassland transitional zones, typical grasslands, and desert grasslands [42].
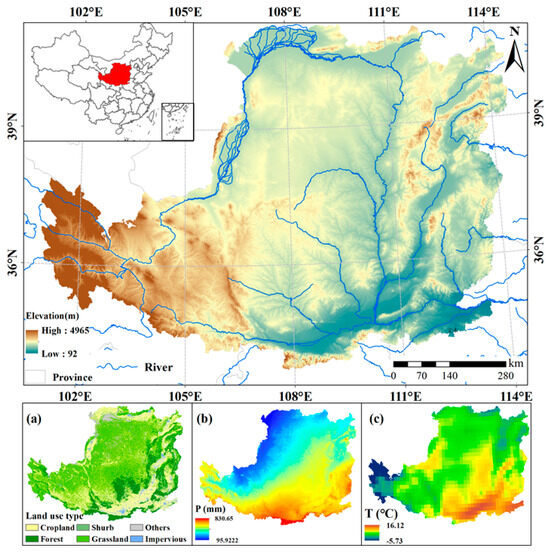
Figure 2.
Location of the Loess Plateau and physical characteristics: (a) land use type, (b) multiyear average precipitation (P) during 2003–2022, and (c) multiyear average temperature (T) during 2003–2022.
The LP plays an essential role in the economic development of the Yellow River Basin. It previously featured abundant vegetation; however, since the end of the previous century, it has transformed into an ecologically fragile area with several environmental issues (e.g., vegetation degradation, soil erosion, and increasing ecological fragility) owing to extensive human activities and inefficient and unsustainable resource exploitation [43]. At the end of the previous century, the Chinese government initiated the Grain for Green Program, following which the vegetation on the LP exhibited a remarkable expansion [44,45]. In 2019, a major strategy for the ecological conservation and high-quality development of the Yellow River Basin was proposed, which is a demand for continuous adaptation to socially stable development [46]. This substantially enhanced the potential for continuous development in terms of the ecological, social, and economic aspects of the LP. Nevertheless, the area still faces major challenges related to ecological sustainability and societal transformation [47].
3. Data and Methodology
3.1. Data Source
This study collected a series of meteorological, soil and urbanization datasets to investigate how catchment characteristics influence the phenology shifts on the LP. It has been evidenced that temperature and precipitation are essential elements affecting the dynamics of vegetation phenology in arid regions [48]. Additionally, soil moisture as a physical property within the catchment also plays a key role in influencing phenology. Otherwise, ISP and ANL are representative urbanization indices have been widely employed to unravel the influence of anthropogenic activities on landscape [49,50]. The datasets span 2003–2022 and were predominantly archived using the Google Earth Engine (https://earthengine.google.com/ (accessed on 21 January 2023)).
The UCSB-CHG/CHIRPS/DAILY dataset served as our primary source of precipitation data [51]. This dataset comprises a comprehensive time series of precipitation data spanning more than 30 years. The daily mean station temperature dataset comprises data from automated and human-facilitated observation stations compiled in the Global Historical Climatology Network-Daily database (National Centers for Environmental Information) and undergoes regular quality and consistency control.
The enhanced vegetation index (EVI) was adopted as the proxy indicator of vegetation. Its synthesis algorithm has undergone rigorous atmospheric and soil background correction/enhancement, and it demonstrates superior performance particularly in terms of reducing saturation effects [52]. Thus, the EVI is particularly beneficial for monitoring vegetation growth in regions with high vegetation coverage [53].
The surface soil moisture product [54] used has 1 km resolution, and the daily data are known to exhibit superior and precise coverage, with excellent performance.
Given the absence of ANL data spanning the entirety of the period 2003–2021, two ANL datasets were combined: the Consistent and Corrected Nighttime Light dataset (BNU/FGS/CCNL/v1, band name: b1, from 2003 to 2012) [55] and the Annual Visible and Infrared Imaging Suite Nighttime Light data (NOAA/VIIRS/DNB/ANNUAL_V21, band name: average, from 2013 to 2021) [56].
This study also included an ISP and vegetation types dataset with a resolution of 30 m for 2003–2021 [57], which can reveal the annual change in surface area.
In the course of data processing, owing to varying levels of precision, all data were standardized to spatial resolution of 250 m × 250 m. Further information is available in Table 1.

Table 1.
Information on the datasets used in this study.
3.2. Phenology Extraction Design and Processing
TIMESAT 3.3 is a software package used to derive phenological parameters. It provides three methods for fitting smoothed time series to remote sensing data (EVI), i.e., the Savitzky–Golay filtering (SG), double-logistic, and asymmetric Gaussian models, which are capable of detecting outliers [58] when using the least squares method to generate indexes. The first model uses local polynomial functions for the fitting, whereas the other models use the normal least squares method. The SG filter excels in preserving data integrity and capturing more details in vegetation index time series, while effectively filtering out noise [59]. Meanwhile, previous studies shown that SG outperforms in practical applications [60,61]. In this study, SG filtering was utilized to reconstruct an EVI time series, from which the starting (when the EVI reaches 20% of the annual value on the ascending limb) and ending points (when the EVI drops to 20% of the annual value on the descending limb [62]) were extracted for SOS and EOS during 2003–2021. LOS can be determined by subtracting SOS from EOS. The phenological information of vegetation types was extracted following a similar procedure.
3.3. Pixel-Wise Regression Model
A pixel-wise regression model was constructed to investigate the spatiotemporal variation in the phenology of vegetation on the LP. The study performed a pixel-wise correlation analysis individually for the SOS, EOS, and LOS datasets. This involved independently applying regression models to each pixel in the long-term time series with multiple images, which can facilitate the identification of distinct trends and relationships in phenological shifts at a fine spatial scale. In this study, the outcomes of the Pearson correlation coefficient R (linear dependence between two random variables with a value in the range of −1 to 1 that reflects the negative (<0) and positive (>0) impact of one variable on another [63]), slope (the linear trend of a variable that reflects a negative (<0) or positive (>0) trend of change), R2 (a measure of the degree of model fitting with a value in the range of 0 to 1; the larger the value, the better the fitting performance), and p-value (measure of the consistency between the sample and the hypothesis with a value in the range of 0–1; a value of <0.05 indicates passing the significance test) of the pixel-wise regression model were extracted to investigate the trend of change in phenology, and to assess the impact and/or underlying mechanisms of the environmental factors (i.e., temperature, precipitation, and soil moisture) on phenological change. The Pearson correlation coefficient can be used to assess the linear dependence between two random variables, such as the impact of environmental factors (i.e., temperature, precipitation, and soil moisture) on phenological change.
4. Result
4.1. Delineate Trends in Vegetation Development and Evolution
The EVI exhibits an overall upward tendency and a discernible spatial distribution with a gradual decline from the southeast toward the northwest (Figure 3). It shows a relatively stable transformation/alteration in central and western regions during 2003–2011. After 2012, a steady increase is evident, with a noticeable reduction in regions where the EVI values fall below 0.4. Generally, southern areas consistently display the highest EVI values, while northwestern regions maintain the lowest values.
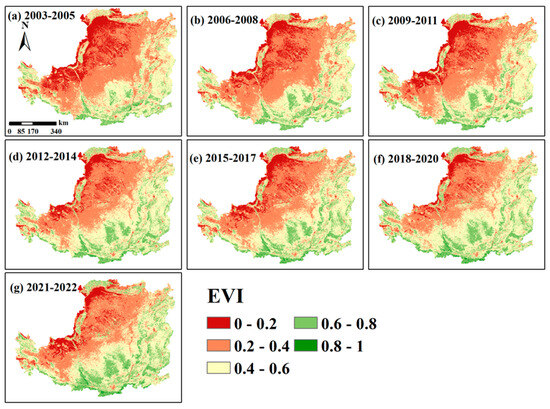
Figure 3.
Spatiotemporal distributions of maximum enhanced vegetation index (EVI) values during 2003–2022. The higher the value of the index, the more vigorous the vegetation growth.
The monthly mean EVI value is 0.225, with an anomaly of 0.182 (Figure 4). Positive anomalies are chiefly concentrated during May–September, whereas negative anomalies are distributed from October through to the subsequent April. Overall, there is a noticeable variability in the positive anomalies in comparison with the negative anomalies. Monthly averages generally show a rise, with slight variations. Peaks in July and August contrast the troughs in January and February. The range between the highest (July 2018; 0.371) and lowest (January 2008; 0.051) values is 0.32. Anomalies during May–September (2003–2010) show limited disparities. July 2018 marks the peak positive anomaly (0.189) and October 2021 marks the smallest positive anomaly (0.003). The highest negative anomaly is in January 2008 (−0.131), and the lowest negative anomaly is in October 2019 (−0.008). During October–April (2003–2007), the anomalies demonstrate stable fluctuation.
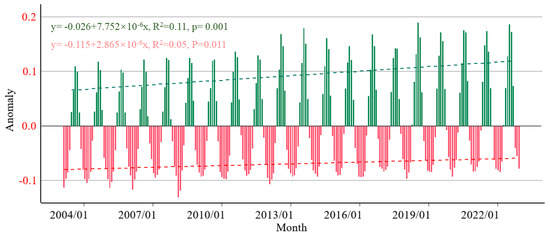
Figure 4.
Anomalies of monthly mean enhanced vegetation index (EVI), the fitting lines and liner regression equations during 2003–2022. Green and red lines represent the trends of positive and negative anomalies, respectively.
4.2. Variability in Vegetation Phenological Changes of SOS and EOS
Advances in SOS span from the southeast to the northwest (Figure 5). In most areas, SOS occurs between 100–150 days; areas where the value exceeds 160 days are primarily in northwestern and central parts of the LP. The variation is more pronounced in the north than in the south, and a regular shift in the pattern is evident after 2010. The range of 80–90 days has a trend of increase in the southern region.
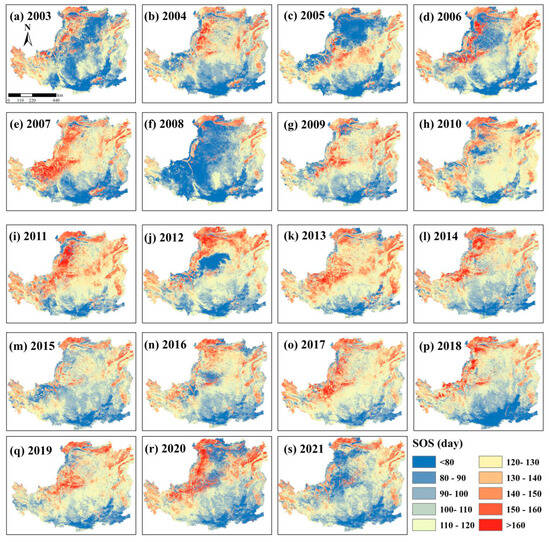
Figure 5.
Spatiotemporal distributions of the start of the growing season (SOS), 2003–2021.
A divergent pattern in EOS is evident across various geographic zones of the LP (Figure 6). In most regions, EOS is concentrated within 285–320 days. Although central parts have seen notable shift in EOS over the past two decades, a small portion of the southern region has seen minimal change, with EOS maintained at approximately 270 days. Notably, northern and central regions experienced advances in EOS during 2004–2006. The EOS in northern regions in 2003 was notably prolonged compared with that in 2004 and 2005. In 2012, EOS in most regions advanced in comparison with that of the preceding year.
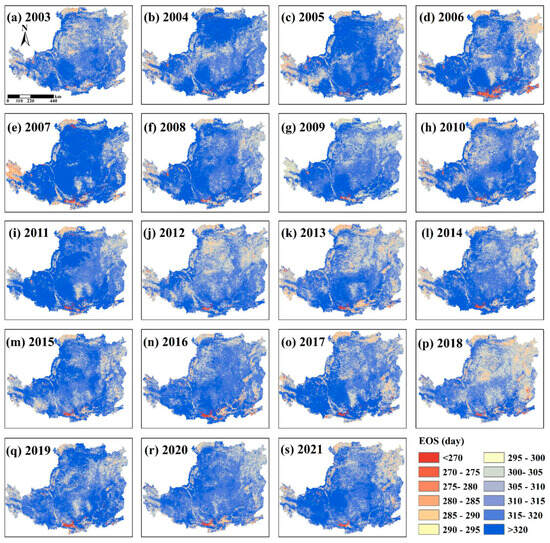
Figure 6.
Spatiotemporal distributions of the end of the growing season (EOS), 2003–2021.
4.3. Phenological Pixel-Wise Regression Analysis
Figure 7 shows the spatial distribution of the trend of change in vegetation phenology over the past two decades on the LP. There is an evident substantial trend of SOS advancement in the northwestern, southwestern, and southern regions during 2003–2021. Conversely, northeastern, central, and certain southern areas exhibit a pattern of delay. The southeastern region displays a trend of advance (slope < 0), whereas the northern and northwestern regions show a trend of delay (slope > 0). There is also a trend of postponement characterizing the overall EOS of vegetation phenology in the period 2003–2021. Specifically, the southern and northwestern regions demonstrate prominent delays in phenological change. Conversely, central and southern regions exhibit a trend of early occurrence (slope < 0), leading to EOS advancement. In the southeastern region, there is a trend of delay in EOS (slope > 0), whereas the central and western regions show advancement (slope < 0), coupled with a certain degree of temporal lag.
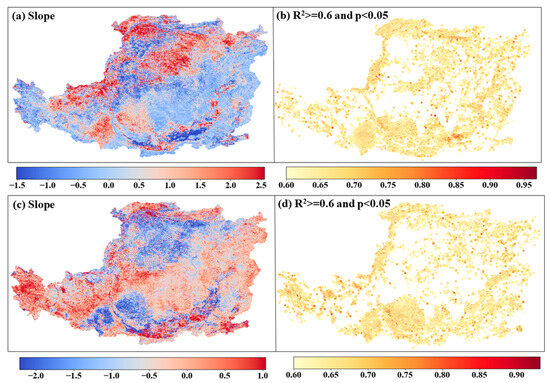
Figure 7.
Statistical spatiality of vegetation phenology from pixel-wise regression model at the start of the growing season (SOS) and the end of the growing season (EOS) during 2003–2021. Variation rate and trend of SOS (a) and EOS (c). Spatial pattern of the effective linear fitting and statistically significant regions for SOS (b) and EOS (d).
The study investigated the temporal variations of SOS and EOS for four vegetation types (Figure 8 and Figure 9). The highest proportion of SOS is within 80–112 days. Distributions of SOS for cropland and grassland are higher than those for the other two vegetation types at <80 days. Over the past 20 years, grassland has seen notable fluctuation, with its largest (smallest) proportion in 2003 (2018). The proportion of forest with SOS within 80–112 days is higher than that of the other vegetation types. Among the five periods, the distribution of cropland has the highest proportion between 144 and 176 days; however, the opposite is true for forest. In the period of >176 days, the overall proportion is small; however, cropland in 2012 has the largest value, and forest has the same condition as in 2003. The proportion of shrubs is focused on the period of 80–144 days.
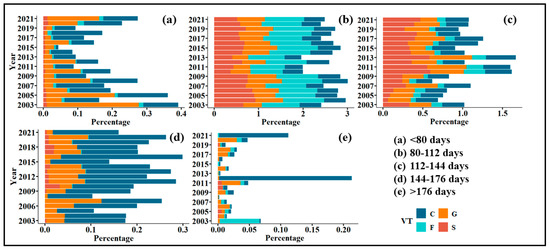
Figure 8.
Vegetation proportions at the start of the growing season (SOS) in different periods across varying vegetation types during 2003–2021. The five diagrams depict the distributions of vegetation proportions across various temporal intervals: (a) <80 days, (b) 80–112 days, (c) 112–144 days, (d) 144–176 days, and (e) >176 days. VT stands for vegetation type; C, F, S, and G represent cropland, forest, shrub, and grassland, respectively.
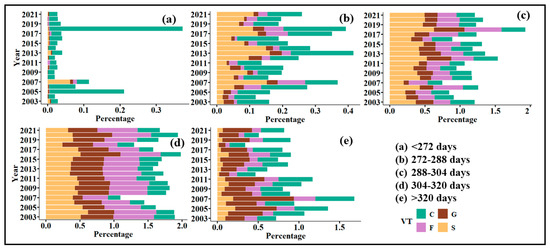
Figure 9.
Vegetation proportions at the end of the growing season (EOS) in different periods across varying vegetation types during 2003–2021. The five diagrams depict the distributions of vegetation proportions across various temporal intervals: (a) <272 days, (b) 272–288 days, (c) 288–304 days, (d) 304–320 days, and (e) >320 days. VT stands for vegetation type: C, F, S, and G represent cropland, forest, shrub, and grassland, respectively.
The phenological EOS shows a trend of delay and varies with vegetation type (Figure 9). The major range is concentrated within 288–320 days. In the period of <272 days, only cropland exhibits an annual distribution, i.e., that of the other vegetation types in intermittent. The distributions of shrub and forest in 288–320 days are larger compared with those of other periods. Within 272–288 days, the proportion of cropland shows little increase in 2013 and 2018. During 288–304 days, grassland is minimal in comparison with the other vegetation types. The variability at 304–320 days of the four vegetation types is relatively limited compared with that of the other periods.
4.4. Response of Phenology Shifts to Changing Environment
To evaluate the factors related to changes in vegetation phenology, this study analyzed the association of factors and phenological indicator quantiles (Figure 10 and Figure 11). EOS shows a significantly higher correlation with temperature than EOS50 (R = 0.89). SOS90 is more sensitive to PRE_SOS than SOS. Temperature and precipitation in SOS period are positive with ISP (R = 0.67 and 0.28). SM_LOS shows a remarkable relationship with TEM_EOS, EOS and SM_SOS (R = −0.69 and 0.85).
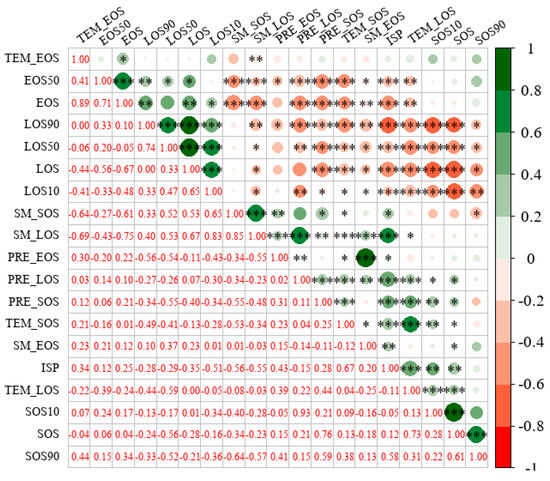
Figure 10.
Correlation between phenology and influencing factors. SOS, EOS, and LOS are the start of the growing season, end of the growing season, and length of the growing season, respectively. PRE_SOS, TEM_SOS, and SM_SOS are the mean temperatures in April and May; PRE_EOS, TEM_EOS, and SM_EOS are the mean temperatures in November; and PRE_LOS, TEM_LOS, and SM_LOS are the mean temperatures from March to November. ISP is impervious surface percentage. Attached numerals of 10, 50, and 90 represent the corresponding percentile. Note: *** means p < 0.001, ** means p < 0.01, * means p < 0.05.

Figure 11.
Correlation coefficient between phenology characteristics and annual nighttime light (ANL) based on pixel-wise regression: (a) start of the growing season (SOS), (b) end of the growing season (EOS), and (c) length of the growing season (LOS). The upper-left corner of each plot shows the frequency distribution of the relation results. Blue and red bars represent negative and positive values, respectively.
The annual phenological indicators and ANL were individually investigated (Figure 11). It shows that the proportion of positive is greater than negative correlations in both SOS and EOS (Figure 11a,b), and exhibits a spatial distribution of positive correlations in the northwest and southeast for SOS, and southeast and northern regions for EOS. In contrast to LOS, the relationship shows a relatively even distribution (Figure 11c).
5. Discussion
5.1. Spatiotemporal Characteristics of Phenology Shifts
Phenological shifts are the combined result of changes in vegetation growth and environmental conditions. Vegetation on the LP has consistently expanded and demonstrated a strong upward trend over the past two decades. This expansion can be attributed to the combined dynamics associated with human activities and changes in natural climatic conditions [64]. Previous studies showed that human activities make a greater contribution (≥50%) to vegetation recovery. The Grain for Green Program, as a reforestation and ecological restoration project, has made a substantial contribution to the prevention of further degradation of the ecological environment of the LP [17,65]. Findings show that the majority of vegetation greening on the LP is concentrated in low-elevation and relatively flat regions, consistent with the results of Li et al. [7].
Phenology varies with vegetation type, and different types of vegetation do not share identical growth cycles; thus, they are present in various proportions during different SOS and EOS periods. Changes in vegetation phenology can influence energy generation (e.g., adjustment of leaf reflectance and emission of organic gases into the atmosphere) [9] and are associated with the inherent characteristics of specific vegetation types. For example, one of the important contributors to phenological change stems from gene expression [66], functional traits, and physical distinctions between herbaceous and woody plants [67,68,69]. Additionally, physical drivers represent other controlling factors that can influence vegetation changes. On the LP, there is a latitudinal gradient in vegetation reduction from lower to higher latitudes. For example, the relatively flat topography and favorable moisture and thermal conditions in southern areas facilitate rapid extension of the growth period of vegetation [70].
Results also found that cropland is a significant contributor to SOS and EOS shifts. A part of SOS begins later, which has a larger proportion of 144–176d than the other three vegetation types. It has been evidenced that temperature requirements for crop greening are distinct from those of natural vegetation [71,72]. Moreover, seed variety and types also have an impact on it, causing more complicated crop phenology shifts in a changing environment. This is consistent with the study by Zhao et al. [73].
5.2. Patterns and Mechanisms of LOS
The phenology of vegetation on the LP exhibits noticeable annual and seasonal variation. Typically, SOS and EOS are mainly distributed within 100–150 and 285–320 days, respectively. However, EOS demonstrates greater change than SOS and has a higher sensitivity to climate change [20]. To gain insight into how SOS and EOS influence vegetation growth, the study calculated LOS (i.e., EOS minus SOS), whereby LOS is the outcome of the mutual relationship between SOS and EOS (i.e., the advance or delay of SOS and/or EOS). Thus, LOS represents the temporal span across the entire process of vegetation growth and development [74,75]. On the LP, the regional vegetation exhibits a tendency toward SOS advance and EOS delay associated with climate change (slope > 0, R2 > 0.6).
In central, eastern, southern, and southwestern areas of the LP, EOS exhibits an upward trend (Figure 12; slope > 0). In contrast, in some northwestern and southern regions, a declining trend is noticeable (slope < 0). In high-elevation regions, LOS change is less pronounced than in low-elevation areas, and this is attributed to the varying impacts of the climate and human activities at different elevations [76,77]. Regions at lower latitudes and lower elevations tend to have relatively high temperatures with early SOS and delayed EOS, which contribute to the prolonged LOS. It has been demonstrated that the combination of elevated temperatures and increased precipitation is conducive for the growth and maturation of vegetation [78]. LOS shows a positive association with the net primary productivity of vegetation because prolonged LOS increases the overall potential for vegetative production [10]. Previous research indicated that extending LOS by a single day could increase the daily gross primary productivity and net primary productivity by 0.6% and 2.8 g Cm−2 yr−1, respectively [79].
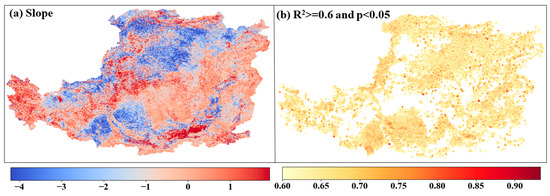
Figure 12.
Same as Figure 7 but for the length of the growing season (LOS).
5.3. Drivers of Phenology Linked to Environment Change
The controls on SOS and EOS vary greatly among environmental factors. Based on relevance, the study found that temperature has a greater influence on EOS (R = 0.89) than on SOS. Keenan and Richardson [80] revealed that temperature and the photoperiod predominantly contribute to the regulation of autumn phenology for deciduous trees, and another study found that increasing temperatures play an essential role in delaying EOS [81]. The reasons for this might reflect the complexity of the influencing factors of leaf coloration and leaf drop and the protracted characteristics of autumn events that make the mechanism between climate and phenology change in terms of EOS more obscure than that of SOS [82]. Changes in autumn temperatures can impact vegetation and its susceptibility to disasters such as frost damage because elevated temperatures might reduce the likelihood of the occurrence of such events [81]. Rising temperatures can increase the activity of photosynthetic enzymes, thereby facilitating vegetation growth and significantly impacting terrestrial cyclic events [83,84]. A higher maximum temperature can accelerate plant senescence by increasing evaporation, leading to reduced moisture levels [37,85]. In contrast, a higher minimum temperature can delay vegetation development by slowing down physiological processes [86]. In addition, EOS has a significant response to soil moisture, precipitation, and temperature during the SOS period. It is shown that high preseason temperatures can promote and/or delay vegetation dynamics through controlled photosynthesis, thus changing autumn phenology [6]. In LP, an arid and semiarid area, drought frequency was intensified in post-spring and pre-summer under global warming [87]. This potentially leads to an earlier EOS to some extent. Earlier flowering in spring also has an impact on earlier EOS, which is associated with the increasing risk of frost and pest outbreaks in this stage, leading to earlier senescence in autumn [88].
The study observed that SOS (R = 0.76) is more sensitive than EOS (R = 0.22) to the impact of precipitation. Zeppel et al. [89] suggested that seasonal changes in precipitation in cold seasons might have a greater effect than similar changes in warm seasons. This is partially because precipitation is the main factor controlling vegetation growth in arid regions [78]. In spring, when vegetation is recovering from its dormancy period, a reduction in precipitation triggers water stress in plants, thereby retarding the development of vegetation; however, there is no apparent effect in autumn or winter [89].
Findings show that the phenology of vegetation with late SOS has a stronger negative correlation with soil moisture (R = −0.64), consistent with previous research [90]. Soil moisture throughout the entire growing season is positively correlated with LOS (R = 0.67). The growth of vegetation entails substantial depletion of soil water, which is essential to sustain the burgeoning stages, particularly during the transition to the flowering stage [13]. The earlier onset of vegetation growth induces moisture decline, which exacerbates the reduction in surface evaporative cooling [13]. The observed SOS shifts on the LP are associated with the changes in soil moisture resulting from spring sowing, which is responsible for substantial water consumption in arid and semiarid regions. Moreover, this sowing pattern can coincide with limited precipitation (i.e., severe drought in spring) in the northern regions of the LP, resulting in enhanced soil moisture decline as reported by Lian et al. [13]. In turn, these SOS shifts can consequently influence the accuracy of forecasts of summer climactic change.
This study selected two indicators (i.e., ANL and ISP) to investigate the influence of anthropogenic factors on phenological change (Figure 11 and Figure 12). It is noted that urbanization has a stronger impact on SOS compared to EOS and LOS. This is consistent with the study investigated by Yao et al. [91]. High-correlation areas are concentrated along the riverbanks (e.g., the Fenhe and Weihe Rivers), coinciding with significant human activity. This confirms that urbanization and agriculture are the major anthropogenic factors that contribute to phenological change by altering local climatic conditions (e.g., the urban heat island effect), land surface features, and hydrological and environmental cycles [92,93]. It has been proven that the rate of warming depends on the variation of urban and rural circumstances in most areas, the changes in urban temperature and precipitation associated with anthropogenic gas emissions, building density, and population distribution [94]. Regional urbanization-related processes alter the underlying surfaces and lead to a heterogeneous spatial distribution of vegetation types across the land surface [95], thereby manifesting distinct phenological responses.
6. Conclusions
This study investigated the vegetation phenology changes on the Loess Plateau during 2003–2022 and elucidated the primary drivers. It shows a noticeable vegetation greening with an evident spatiotemporal characteristic. SOS and EOS were mainly within 100–150 and 285–320 days, respectively. Clear variations of phenological shifts emerged at the regional scale; the southeastern and northwestern regions exhibited a notable change with advanced SOS, delayed EOS, and prolonged LOS. Overall, the cropland proportions of SOS and EOS indicate significant seasonal shift changes in Loess Plateau. Grasslands with an SOS of less than 80 days have exhibited the most significant changes over the past twenty years. The primary controlling factors that influence SOS, EOS, and LOS are precipitation, temperature, and soil moisture, respectively. Rising temperatures and precipitation can result in earlier SOS and later EOS. Preseason climatic conditions have a lagged effect on phenology. Anthropogenic-induced drivers also have a role, i.e., urbanization contributes to the spatial changes of vegetation phenology, and specific mechanisms are needed to further investigate.
This study enhances our knowledge of how vegetation phenology responds to the temporal dynamics across ecosystems on the Loess Plateau. However, there are some uncertainties associated with the methods and data utilized in this study. Despite the EVI undergoing atmospheric correction, it can still contain uncertainties in areas with cloud cover or substantial atmospheric variations. Moreover, the resolution of the data used might be inadequate for detecting subtle variations in vegetation growth at smaller scales and/or over short timescales. In future work, comprehensive integration of a suite of observational and remote sensing data will build up an understanding of the patterns and drivers of vegetation phenology in a changing environment.
Author Contributions
Methodology, T.W.; software, T.W., X.X., X.C. and S.L.; data processing, T.W., X.C. and X.X.; writing—original draft, T.W.; writing—review and editing, T.W., X.X., X.C., S.L., D.K., Y.Z., Y.T., Y.C., J.Z. and G.Z.; conceptualization, S.L., J.Z. and G.Z. All authors have read and agreed to the published version of the manuscript.
Funding
This research is jointly funded by the National Natural Science Foundation of China (42101038 and 42201086), the Natural Science Foundation of Shandong Province (ZR2019BD059), and the Natural Science Foundation of the Ningxia Hui Autonomous Region (2022AAC03668). The authors thank the China Scholarship Council (202308060113) for sponsoring Shixuan Lyu.
Data Availability Statement
The data presented in this study are available on request from the corresponding author (junlong.zhang@sdnu.edu.cn).
Acknowledgments
We thank the associate editor, and the three anonymous reviewers and editors for their thoughtful comments and suggestions regarding our article. We also thank language editor for editing the English text of a draft of this manuscript.
Conflicts of Interest
The authors declare no conflicts of interest.
References
- Hao, H.; Li, Y.; Zhang, H.; Zhai, R.; Liu, H. Spatiotemporal variations of vegetation and its determinants in the National Key Ecological Function Area on Loess Plateau between 2000 and 2015. Ecol. Evol. 2019, 9, 5810–5820. [Google Scholar] [CrossRef]
- Huang, W.; Wang, P.; He, L.; Liu, B. Improvement of water yield and net primary productivity ecosystem services in the Loess Plateau of China since the “Grain for Green” project. Ecol. Indic. 2023, 154, 110707. [Google Scholar] [CrossRef]
- Zhang, Y.; Feng, T.; Wang, L.; Wang, X.; Wei, T.; Wang, P. Effects of long-term vegetation restoration on soil physicochemical properties mainly achieved by the coupling contributions of biological synusiae to the Loess Plateau. Ecol. Indic. 2023, 152, 110353. [Google Scholar] [CrossRef]
- Jiang, W.; Cheng, Y.; Yang, X.; Yang, S.; Wan, S. Chinese Loess Plateau vegetation since the Last Glacial Maximum and its implications for vegetation restoration. J. Appl. Ecol. 2013, 50, 440–448. [Google Scholar] [CrossRef]
- Dang, C.; Shao, Z.; Huang, X.; Zhuang, Q.; Cheng, G.; Qian, J. Climate warming-induced phenology changes dominate vegetation productivity in Northern Hemisphere ecosystems. Ecol. Indic. 2023, 151, 110326. [Google Scholar] [CrossRef]
- Li, P.; Liu, Z.; Zhou, X.; Xie, B.; Li, Z.; Luo, Y.; Zhu, Q.; Peng, C. Combined control of multiple extreme climate stressors on autumn vegetation phenology on the Tibetan Plateau under past and future climate change. Agric. For. Meteorol. 2021, 308–309, 108571. [Google Scholar] [CrossRef]
- Li, J.; Peng, S.; Li, Z. Detecting and attributing vegetation changes on China’s Loess Plateau. Agric. For. Meteorol. 2017, 247, 260–270. [Google Scholar] [CrossRef]
- Liang, W.; Bai, D.; Wang, F.; Fu, B.; Yan, J.; Wang, S.; Yang, Y.; Long, D.; Feng, M. Quantifying the impacts of climate change and ecological restoration on streamflow changes based on a Budyko hydrological model in China’s Loess Plateau. Water Resour. Res. 2015, 51, 6500–6519. [Google Scholar] [CrossRef]
- Wang, L. Spring phenology alters vegetation drought recovery. Nat. Clim. Chang. 2023, 13, 123–124. [Google Scholar] [CrossRef]
- Wu, L.; Ma, X.; Dou, X.; Zhu, J.; Zhao, C. Impacts of climate change on vegetation phenology and net primary productivity in arid Central Asia. Sci. Total Environ. 2021, 796, 149055. [Google Scholar] [CrossRef]
- Gao, X.; Zhao, D. Impacts of climate change on vegetation phenology over the Great Lakes Region of Central Asia from 1982 to 2014. Sci. Total Environ. 2022, 845, 157227. [Google Scholar] [CrossRef] [PubMed]
- Mei, L.; Bao, G.; Tong, S.; Yin, S.; Bao, Y.; Jiang, K.; Hong, Y.; Tuya, A.; Huang, X. Elevation-dependent response of spring phenology to climate and its legacy effect on vegetation growth in the mountains of northwest Mongolia. Ecol. Indic. 2021, 126, 107640. [Google Scholar] [CrossRef]
- Lian, X.; Piao, S.; Li, L.Z.; Li, Y.; Huntingford, C.; Ciais, P.; Cescatti, A.; Janssens, I.A.; Peñuelas, J.; Buermann, W. Summer soil drying exacerbated by earlier spring greening of northern vegetation. Sci. Adv. 2020, 6, eaax0255. [Google Scholar] [CrossRef] [PubMed]
- Wang, X.; Xiao, J.; Li, X.; Cheng, G.; Ma, M.; Zhu, G.; Altaf Arain, M.; Andrew Black, T.; Jassal, R.S. No trends in spring and autumn phenology during the global warming hiatus. Nat. Commun. 2019, 10, 2389. [Google Scholar] [CrossRef] [PubMed]
- Tang, J.; Körner, C.; Muraoka, H.; Piao, S.; Shen, M.; Thackeray, S.J.; Yang, X. Emerging opportunities and challenges in phenology: A review. Ecosphere 2016, 7, e01436. [Google Scholar] [CrossRef]
- Workie, T.G.; Debella, H.J. Climate change and its effects on vegetation phenology across ecoregions of Ethiopia. Glob. Ecol. Conserv. 2018, 13, e00366. [Google Scholar] [CrossRef]
- Zheng, K.; Wei, J.-Z.; Pei, J.-Y.; Cheng, H.; Zhang, X.-L.; Huang, F.-Q.; Li, F.-M.; Ye, J.-S. Impacts of climate change and human activities on grassland vegetation variation in the Chinese Loess Plateau. Sci. Total Environ. 2019, 660, 236–244. [Google Scholar] [CrossRef]
- Sun, Y.; Zhang, S.; Xu, Q. Pollen-based land cover changes reveal temporal and spatial differences of human activity in north-central China during the Holocene. Catena 2022, 219, 106620. [Google Scholar] [CrossRef]
- Cao, J.; Pan, G.; Zheng, B.; Liu, Y.; Zhang, G.; Liu, Y. Significant land cover change in China during 2001–2019: Implications for direct and indirect effects on surface ozone concentration. Environ. Pollut. 2023, 335, 122290. [Google Scholar] [CrossRef]
- Ge, C.; Sun, S.; Yao, R.; Sun, P.; Li, M.; Bian, Y. Long-term vegetation phenology changes and response to multi-scale meteorological drought on the Loess Plateau, China. J. Hydrol. 2022, 614, 128605. [Google Scholar] [CrossRef]
- He, L.; Asseng, S.; Zhao, G.; Wu, D.; Yang, X.; Zhuang, W.; Jin, N.; Yu, Q. Impacts of recent climate warming, cultivar changes, and crop management on winter wheat phenology across the Loess Plateau of China. Agric. For. Meteorol. 2015, 200, 135–143. [Google Scholar] [CrossRef]
- Pei, T.; Ji, Z.; Chen, Y.; Wu, H.; Hou, Q.; Qin, G.; Xie, B. The Sensitivity of Vegetation Phenology to Extreme Climate Indices in the Loess Plateau, China. Sustainability 2021, 13, 7623. [Google Scholar] [CrossRef]
- Parker, A.K.; De CortÁZar-Atauri, I.G.; Van Leeuwen, C.; Chuine, I. General phenological model to characterise the timing of flowering and veraison of Vitis vinifera L. Aust. J. Grape Wine Res. 2011, 17, 206–216. [Google Scholar] [CrossRef]
- Piao, S.; Liu, Q.; Chen, A.; Janssens, I.A.; Fu, Y.; Dai, J.; Liu, L.; Lian, X.; Shen, M.; Zhu, X. Plant phenology and global climate change: Current progresses and challenges. Glob. Chang. Biol. 2019, 25, 1922–1940. [Google Scholar] [CrossRef] [PubMed]
- Piper, E.L.; Boote, K.J.; Jones, J.W.; Grimm, S.S. Comparison of two phenology models for predicting flowering and maturity date of soybean. Crop Sci. 1996, 36, 1606–1614. [Google Scholar] [CrossRef]
- Sonnentag, O.; Hufkens, K.; Teshera-Sterne, C.; Young, A.M.; Friedl, M.; Braswell, B.H.; Milliman, T.; O’Keefe, J.; Richardson, A.D. Digital repeat photography for phenological research in forest ecosystems. Agric. For. Meteorol. 2012, 152, 159–177. [Google Scholar] [CrossRef]
- Beamish, A.L.; Nijland, W.; Edwards, M.; Coops, N.C.; Henry, G.H.R. Phenology and vegetation change measurements from true colour digital photography in high Arctic tundra. Arct. Sci. 2016, 2, 33–49. [Google Scholar] [CrossRef]
- Morris, D.; Boyd, D.; Crowe, J.; Johnson, C.; Smith, K. Exploring the Potential for Automatic Extraction of Vegetation Phenological Metrics from Traffic Webcams. Remote Sens. 2013, 5, 2200–2218. [Google Scholar] [CrossRef]
- Dai, W.; Jin, H.; Zhang, Y.; Liu, T.; Zhou, Z. Detecting temporal changes in the temperature sensitivity of spring phenology with global warming: Application of machine learning in phenological model. Agric. For. Meteorol. 2019, 279, 107702. [Google Scholar] [CrossRef]
- Chmielewski, F.-M.; Blümel, K.; Henniges, Y.; Blanke, M.; Weber, R.W.S.; Zoth, M. Phenological models for the beginning of apple blossom in Germany. Meteorol. Z. 2011, 20, 487–496. [Google Scholar] [CrossRef]
- Zeng, L.; Wardlow, B.D.; Xiang, D.; Hu, S.; Li, D. A review of vegetation phenological metrics extraction using time-series, multispectral satellite data. Remote Sens. Environ. 2020, 237, 111511. [Google Scholar] [CrossRef]
- Crimmins, M.A.; Crimmins, T.M. Monitoring Plant Phenology Using Digital Repeat Photography. Environ. Manag. 2008, 41, 949–958. [Google Scholar] [CrossRef] [PubMed]
- Gao, F.; Zhang, X. Mapping Crop Phenology in Near Real-Time Using Satellite Remote Sensing: Challenges and Opportunities. J. Remote Sens. 2021, 2021, 8379391. [Google Scholar] [CrossRef]
- Migliavacca, M.; Sonnentag, O.; Keenan, T.F.; Cescatti, A.; O’Keefe, J.; Richardson, A.D. On the uncertainty of phenological responses to climate change, and implications for a terrestrial biosphere model. Biogeosciences 2012, 9, 2063–2083. [Google Scholar] [CrossRef]
- Wolkovich, E.M.; Cook, B.I.; Allen, J.M.; Crimmins, T.M.; Betancourt, J.L.; Travers, S.E.; Pau, S.; Regetz, J.; Davies, T.J.; Kraft, N.J.B.; et al. Warming experiments underpredict plant phenological responses to climate change. Nature 2012, 485, 494–497. [Google Scholar] [CrossRef]
- Richardson, A.D.; Keenan, T.F.; Migliavacca, M.; Ryu, Y.; Sonnentag, O.; Toomey, M. Climate change, phenology, and phenological control of vegetation feedbacks to the climate system. Agric. For. Meteorol. 2013, 169, 156–173. [Google Scholar] [CrossRef]
- Shen, M.; Wang, S.; Jiang, N.; Sun, J.; Cao, R.; Ling, X.; Fang, B.; Zhang, L.; Zhang, L.; Xu, X.; et al. Plant phenology changes and drivers on the Qinghai–Tibetan Plateau. Nat. Rev. Earth Environ. 2022, 3, 633–651. [Google Scholar] [CrossRef]
- Dai, W.; Zeng, Y.; Jing, T.; Wang, Z.; Zong, R.; Ni, L.; Fang, N. Estimation of rainfall erosivity on the Chinese Loess Plateau: A new combination of the ERA5 dataset and machine learning. J. Hydrol. 2023, 624, 129892. [Google Scholar] [CrossRef]
- Liu, Y.; Xie, X.; Tursun, A.; Wang, Y.; Jiang, F.; Zheng, B. Surface water expansion due to increasing water demand on the Loess Plateau. J. Hydrol. Reg. Stud. 2023, 49, 101485. [Google Scholar] [CrossRef]
- Tian, P.; Tian, X.; Geng, R.; Zhao, G.; Yang, L.; Mu, X.; Gao, P.; Sun, W.; Liu, Y. Response of soil erosion to vegetation restoration and terracing on the Loess Plateau. Catena 2023, 227, 107103. [Google Scholar] [CrossRef]
- Wang, L.; Liu, L. Water-sediment synergistic relationship in the flood season in the coarse sand source regions of the loess plateau, China. J. Contam. Hydrol. 2022, 245, 103935. [Google Scholar] [CrossRef] [PubMed]
- Tan, W.-F.; Zhang, R.; Cao, H.; Huang, C.-Q.; Yang, Q.-K.; Wang, M.-k.; Koopal, L.K. Soil inorganic carbon stock under different soil types and land uses on the Loess Plateau region of China. Catena 2014, 121, 22–30. [Google Scholar] [CrossRef]
- Kou, P.; Xu, Q.; Jin, Z.; Yunus, A.P.; Luo, X.; Liu, M. Complex anthropogenic interaction on vegetation greening in the Chinese Loess Plateau. Sci. Total Environ. 2021, 778, 146065. [Google Scholar] [CrossRef] [PubMed]
- Gao, Y.; Liu, Z.; Li, R.; Shi, Z. Long-Term Impact of China’s Returning Farmland to Forest Program on Rural Economic Development. Sustainability 2020, 12, 1492. [Google Scholar] [CrossRef]
- Yurui, L.; Xuanchang, Z.; Zhi, C.; Zhengjia, L.; Zhi, L.; Yansui, L. Towards the progress of ecological restoration and economic development in China’s Loess Plateau and strategy for more sustainable development. Sci. Total Environ. 2021, 756, 143676. [Google Scholar] [CrossRef] [PubMed]
- Jiang, L.; Zuo, Q.; Ma, J.; Zhang, Z. Evaluation and prediction of the level of high-quality development: A case study of the Yellow River Basin, China. Ecol. Indic. 2021, 129, 107994. [Google Scholar] [CrossRef]
- Xiao, Y.; Wang, R.; Wang, F.; Huang, H.; Wang, J. Investigation on spatial and temporal variation of coupling coordination between socioeconomic and ecological environment: A case study of the Loess Plateau, China. Ecol. Indic. 2022, 136, 108667. [Google Scholar] [CrossRef]
- Currier, C.M.; Sala, O.E. Precipitation versus temperature as phenology controls in drylands. Ecology 2022, 103, e3793. [Google Scholar] [CrossRef] [PubMed]
- Li, L.; Zhan, W.; Hu, L.; Chakraborty, T.; Wang, Z.; Fu, P.; Wang, D.; Liao, W.; Huang, F.; Fu, H. Divergent urbanization-induced impacts on global surface urban heat island trends since 1980s. Remote Sens. Environ. 2023, 295, 113650. [Google Scholar] [CrossRef]
- Zhao, M.; Zhou, Y.; Li, X.; Cao, W.; He, C.; Yu, B.; Li, X.; Elvidge, C.D.; Cheng, W.; Zhou, C. Applications of Satellite Remote Sensing of Nighttime Light Observations: Advances, Challenges, and Perspectives. Remote Sens. 2019, 11, 1971. [Google Scholar] [CrossRef]
- Funk, C.; Peterson, P.; Landsfeld, M.; Pedreros, D.; Verdin, J.; Shukla, S.; Husak, G.; Rowland, J.; Harrison, L.; Hoell, A.; et al. The climate hazards infrared precipitation with stations—A new environmental record for monitoring extremes. Sci. Data 2015, 2, 150066. [Google Scholar] [CrossRef] [PubMed]
- Matsushita, B.; Yang, W.; Chen, J.; Onda, Y.; Qiu, G. Sensitivity of the enhanced vegetation index (EVI) and normalized difference vegetation index (NDVI) to topographic effects: A case study in high-density cypress forest. Sensors 2007, 7, 2636–2651. [Google Scholar] [CrossRef] [PubMed]
- Silveira, E.M.d.O.; de Carvalho, L.M.; Junior, F.W.A.; de Mello, J.M. The assessment of vegetation seasonal dynamics using multitemporal NDVI and EVI images derived from MODIS. In Proceedings of the 2007 International Workshop on the Analysis of Multi-Temporal Remote Sensing Images, Leuven, Belgium, 18–20 July 2007; pp. 1–5. [Google Scholar]
- Song, P.; Zhang, Y.; Guo, J.; Shi, J.; Zhao, T.; Tong, B. A 1 km daily surface soil moisture dataset of enhanced coverage under all-weather conditions over China in 2003–2019. Earth Syst. Sci. Data 2022, 14, 2613–2637. [Google Scholar] [CrossRef]
- Elvidge, C.D.; Zhizhin, M.; Ghosh, T.; Hsu, F.-C.; Taneja, J. Annual Time Series of Global VIIRS Nighttime Lights Derived from Monthly Averages: 2012 to 2019. Remote Sens. 2021, 13, 922. [Google Scholar] [CrossRef]
- Zhao, C.; Cao, X.; Chen, X.; Cui, X. A consistent and corrected nighttime light dataset (CCNL 1992–2013) from DMSP-OLS data. Sci. Data 2022, 9, 424. [Google Scholar] [CrossRef] [PubMed]
- Yang, J.; Huang, X. The 30 m annual land cover dataset and its dynamics in China from 1990 to 2019. Earth Syst. Sci. Data 2021, 13, 3907–3925. [Google Scholar] [CrossRef]
- Stanimirova, R.; Cai, Z.; Melaas, E.K.; Gray, J.M.; Eklundh, L.; Jönsson, P.; Friedl, M.A. An empirical assessment of the MODIS land cover dynamics and TIMESAT land surface phenology algorithms. Remote Sens. 2019, 11, 2201. [Google Scholar] [CrossRef]
- Zhang, R.; Qi, J.; Leng, S.; Wang, Q. Long-Term Vegetation Phenology Changes and Responses to Preseason Temperature and Precipitation in Northern China. Remote Sens. 2022, 14, 1396. [Google Scholar] [CrossRef]
- Lara, B.; Gandini, M. Assessing the performance of smoothing functions to estimate land surface phenology on temperate grassland. Int. J. Remote Sens. 2016, 37, 1801–1813. [Google Scholar] [CrossRef]
- Liu, J.; Zhan, P. The impacts of smoothing methods for time-series remote sensing data on crop phenology extraction. In Proceedings of the 2016 IEEE International Geoscience and Remote Sensing Symposium (IGARSS), Beijing, China, 10–15 July 2016; pp. 2296–2299. [Google Scholar]
- Jönsson, P.; Eklundh, L. TIMESAT—A program for analyzing time-series of satellite sensor data. Comput. Geosci. 2004, 30, 833–845. [Google Scholar] [CrossRef]
- Zhou, H.; Deng, Z.; Xia, Y.; Fu, M. A new sampling method in particle filter based on Pearson correlation coefficient. Neurocomputing 2016, 216, 208–215. [Google Scholar] [CrossRef]
- Shi, S.; Yu, J.; Wang, F.; Wang, P.; Zhang, Y.; Jin, K. Quantitative contributions of climate change and human activities to vegetation changes over multiple time scales on the Loess Plateau. Sci. Total Environ. 2021, 755, 142419. [Google Scholar] [CrossRef] [PubMed]
- Wang, X.; Wang, B.; Xu, X.; Liu, T.; Duan, Y.; Zhao, Y. Spatial and temporal variations in surface soil moisture and vegetation cover in the Loess Plateau from 2000 to 2015. Ecol. Indic. 2018, 95, 320–330. [Google Scholar] [CrossRef]
- Satake, A.; Kawagoe, T.; Saburi, Y.; Chiba, Y.; Sakurai, G.; Kudoh, H. Forecasting flowering phenology under climate warming by modelling the regulatory dynamics of flowering-time genes. Nat. Commun. 2013, 4, 2303. [Google Scholar] [CrossRef] [PubMed]
- Ren, S.; Yi, S.; Peichl, M.; Wang, X. Diverse Responses of Vegetation Phenology to Climate Change in Different Grasslands in Inner Mongolia during 2000–2016. Remote Sens. 2017, 10, 17. [Google Scholar] [CrossRef]
- Yu, L.; Liu, T.; Bu, K.; Yan, F.; Yang, J.; Chang, L.; Zhang, S. Monitoring the long term vegetation phenology change in Northeast China from 1982 to 2015. Sci. Rep. 2017, 7, 14770. [Google Scholar] [CrossRef] [PubMed]
- Jeganathan, C.; Dash, J.; Atkinson, P.M. Remotely sensed trends in the phenology of northern high latitude terrestrial vegetation, controlling for land cover change and vegetation type. Remote Sens. Environ. 2014, 143, 154–170. [Google Scholar] [CrossRef]
- Sun, W.; Song, X.; Mu, X.; Gao, P.; Wang, F.; Zhao, G. Spatiotemporal vegetation cover variations associated with climate change and ecological restoration in the Loess Plateau. Agric. For. Meteorol. 2015, 209–210, 87–99. [Google Scholar] [CrossRef]
- Zhang, J.; Tian, H.; Yang, J.; Pan, S. Improving Representation of Crop Growth and Yield in the Dynamic Land Ecosystem Model and Its Application to China. J. Adv. Model. Earth Syst. 2018, 10, 1680–1707. [Google Scholar] [CrossRef]
- Zhang, W.J.; Wang, H.M.; Yang, F.T.; Yi, Y.H.; Wen, X.F.; Sun, X.M.; Yu, G.R.; Wang, Y.D.; Ning, J.C. Underestimated effects of low temperature during early growing season on carbon sequestration of a subtropical coniferous plantation. Biogeosciences 2011, 8, 1667–1678. [Google Scholar] [CrossRef]
- Zhao, G.; Dong, J.; Yang, J.; Wang, H.; Dai, J.; Zhou, Y.; Cui, Y.; Ge, Q. Cropland expansion delays vegetation spring phenology according to satellite and in-situ observations. Agric. Ecosyst. Environ. 2023, 356, 108651. [Google Scholar] [CrossRef]
- Jiao, F.; Liu, H.; Xu, X.; Gong, H.; Lin, Z. Trend Evolution of Vegetation Phenology in China during the Period of 1981–2016. Remote Sens. 2020, 12, 572. [Google Scholar] [CrossRef]
- Wang, L.; Fensholt, R. Temporal Changes in Coupled Vegetation Phenology and Productivity are Biome-Specific in the Northern Hemisphere. Remote Sens. 2017, 9, 1277. [Google Scholar] [CrossRef]
- Deng, C.; Ma, X.; Xie, M.; Bai, H. Effect of Altitude and Topography on Vegetation Phenological Changes in the Niubeiliang Nature Reserve of Qinling Mountains, China. Forests 2022, 13, 1229. [Google Scholar] [CrossRef]
- Qiu, B.; Zhong, M.; Tang, Z.; Chen, C. Spatiotemporal variability of vegetation phenology with reference to altitude and climate in the subtropical mountain and hill region, China. Chin. Sci. Bull. 2013, 58, 2883–2892. [Google Scholar] [CrossRef]
- Wang, H.; Li, Z.; Cao, L.; Feng, R.; Pan, Y. Response of NDVI of Natural Vegetation to Climate Changes and Drought in China. Land 2021, 10, 966. [Google Scholar] [CrossRef]
- Piao, S.; Friedlingstein, P.; Ciais, P.; Viovy, N.; Demarty, J. Growing season extension and its impact on terrestrial carbon cycle in the Northern Hemisphere over the past 2 decades. Glob. Biogeochem. Cycles 2007, 21, GB3018. [Google Scholar] [CrossRef]
- Keenan, T.F.; Richardson, A.D. The timing of autumn senescence is affected by the timing of spring phenology: Implications for predictive models. Glob. Chang. Biol. 2015, 21, 2634–2641. [Google Scholar] [CrossRef]
- Ma, R.; Shen, X.; Zhang, J.; Xia, C.; Liu, Y.; Wu, L.; Wang, Y.; Jiang, M.; Lu, X. Variation of vegetation autumn phenology and its climatic drivers in temperate grasslands of China. Int. J. Appl. Earth Obs. Geoinf. 2022, 114, 103064. [Google Scholar] [CrossRef]
- Gallinat, A.S.; Primack, R.B.; Wagner, D.L. Autumn, the neglected season in climate change research. Trends Ecol. Evol. 2015, 30, 169–176. [Google Scholar] [CrossRef]
- Shen, X.; Liu, Y.; Zhang, J.; Wang, Y.; Ma, R.; Liu, B.; Lu, X.; Jiang, M. Asymmetric Impacts of Diurnal Warming on Vegetation Carbon Sequestration of Marshes in the Qinghai Tibet Plateau. Glob. Biogeochem. Cycles 2022, 36, e2022GB007396. [Google Scholar] [CrossRef]
- Mo, Y.; Chen, S.; Wu, Z.; Tang, J.; Fu, Y. The Advancement in Spring Vegetation Phenology in the Northern Hemisphere Will Reverse After 2060 Under Future Moderate Warming Scenarios. Earth’s Future 2024, 12, e2023EF003788. [Google Scholar] [CrossRef]
- Qiao, C.; Shen, S.; Cheng, C.; Wu, J.; Jia, D.; Song, C. Vegetation Phenology in the Qilian Mountains and Its Response to Temperature from 1982 to 2014. Remote Sens. 2021, 13, 286. [Google Scholar] [CrossRef]
- Hui, D.; Shi, C.; Sun, G.; Zhang, H.; Xiao, B.; Ze, B.; Zhang, N.; Wu, N. Effects of Warming on Chlorophyll Degradation and Carbohydrate Accumulation of Alpine Herbaceous Species during Plant Senescence on the Tibetan Plateau. PLoS ONE 2014, 9, e107874. [Google Scholar] [CrossRef]
- Liu, Z.; Wang, Y.; Shao, M.; Jia, X.; Li, X. Spatiotemporal analysis of multiscalar drought characteristics across the Loess Plateau of China. J. Hydrol. 2016, 534, 281–299. [Google Scholar] [CrossRef]
- Liu, Q.; Fu, Y.H.; Zhu, Z.; Liu, Y.; Liu, Z.; Huang, M.; Janssens, I.A.; Piao, S. Delayed autumn phenology in the Northern Hemisphere is related to change in both climate and spring phenology. Glob. Chang. Biol. 2016, 22, 3702–3711. [Google Scholar] [CrossRef] [PubMed]
- Zeppel, M.J.B.; Wilks, J.V.; Lewis, J.D. Impacts of extreme precipitation and seasonal changes in precipitation on plants. Biogeosciences 2014, 11, 3083–3093. [Google Scholar] [CrossRef]
- Luo, M.; Meng, F.; Sa, C.; Duan, Y.; Bao, Y.; Liu, T.; De Maeyer, P. Response of vegetation phenology to soil moisture dynamics in the Mongolian Plateau. Catena 2021, 206, 105505. [Google Scholar] [CrossRef]
- Yao, R.; Wang, L.; Huang, X.; Guo, X.; Niu, Z.; Liu, H. Investigation of Urbanization Effects on Land Surface Phenology in Northeast China during 2001–2015. Remote Sens. 2017, 9, 66. [Google Scholar] [CrossRef]
- Leong, M.; Ponisio, L.C.; Kremen, C.; Thorp, R.W.; Roderick, G.K. Temporal dynamics influenced by global change: Bee community phenology in urban, agricultural, and natural landscapes. Glob. Chang. Biol. 2016, 22, 1046–1053. [Google Scholar] [CrossRef]
- Ren, Q.; He, C.; Huang, Q.; Zhou, Y. Urbanization Impacts on Vegetation Phenology in China. Remote Sens. 2018, 10, 1905. [Google Scholar] [CrossRef]
- Wang, L.; De Boeck, H.J.; Chen, L.; Song, C.; Chen, Z.; McNulty, S.; Zhang, Z. Urban warming increases the temperature sensitivity of spring vegetation phenology at 292 cities across China. Sci. Total Environ. 2022, 834, 155154. [Google Scholar] [CrossRef] [PubMed]
- Dallimer, M.; Tang, Z.; Gaston, K.J.; Davies, Z.G. The extent of shifts in vegetation phenology between rural and urban areas within a human-dominated region. Ecol. Evol. 2016, 6, 1942–1953. [Google Scholar] [CrossRef] [PubMed]
Disclaimer/Publisher’s Note: The statements, opinions and data contained in all publications are solely those of the individual author(s) and contributor(s) and not of MDPI and/or the editor(s). MDPI and/or the editor(s) disclaim responsibility for any injury to people or property resulting from any ideas, methods, instructions or products referred to in the content. |
© 2024 by the authors. Licensee MDPI, Basel, Switzerland. This article is an open access article distributed under the terms and conditions of the Creative Commons Attribution (CC BY) license (https://creativecommons.org/licenses/by/4.0/).