Abstract
Collaborative perception enhances onboard perceptual capability by integrating features from other platforms, effectively mitigating the compromised accuracy caused by a restricted observational range and vulnerability to interference. However, current implementations of collaborative perception overlook the prevalent issues of both limited and low-reliability communication, as well as misaligned observations in remote sensing. To address this problem, this article presents an innovative distributed collaborative perception network (DCP-Net) specifically designed for remote sensing applications. Firstly, a self-mutual information match module is proposed to identify collaboration opportunities and select suitable partners. This module prioritizes critical collaborative features and reduces redundant transmission for better adaptation to weak communication in remote sensing. Secondly, a related feature fusion module is devised to tackle the misalignment between local and collaborative features due to the multiangle observations, improving the quality of fused features for the downstream task. We conduct extensive experiments and visualization analyses using three semantic segmentation datasets, namely Potsdam, iSAID, and DFC23. The results demonstrate that DCP-Net outperforms the existing collaborative perception methods comprehensively, improving mIoU by 2.61% to 16.89% at the highest collaboration efficiency and achieving state-of-the-art performance.
1. Introduction
With the advancement of edge intelligence, remote sensing intelligent interpretation has demonstrated exceptional performance in onboard real-time processing tasks, which has been applied in disaster detection [1,2], maritime monitoring [3,4,5], and urban mapping [6,7]. However, the individual platform faces inherent limitations, such as the restricted observation range, along with challenges like occlusion [8] and image degradation [9,10]. These issues result in incomplete data acquisition, significantly hampering the platform’s perception performance.
As to the limitation of single-platform observation, collaborative perception among multiple platforms serves as an effective solution. This approach enhances the perceptual capability through sharing observations among multiple platforms [11], as illustrated in Figure 1. Multiple intelligent remote sensing platforms compose a collaborative group, observing the same scene from diverse perspectives. Within this group, platforms share their local information, thereby expanding the scope of observation and leveraging collaborative information to enrich individual platform perception.
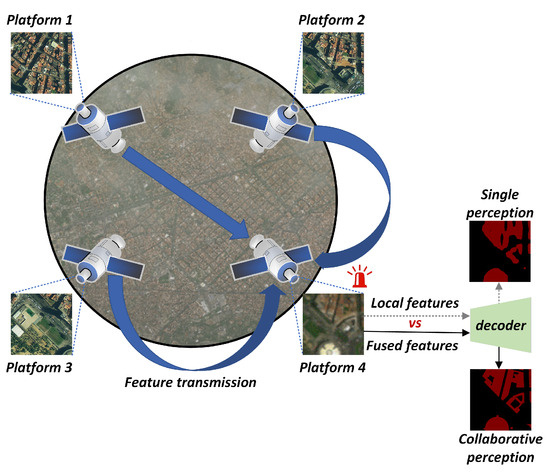
Figure 1.
Illustration of multiple remote sensing platforms’ collaborative perception. The members of the collaborative group can enhance their local perception with the help of collaborative information from other platforms.
Current collaborative perception approaches are categorized into three types: raw-data-based early collaboration, result-based late collaboration, and feature-based intermediate collaboration [12]. Early collaboration [13], aggregating raw data from all platforms, typically presents superior performance but requires substantial transmission cost, which is difficult to accommodate in remote sensing scenarios. Late collaboration [14], focusing on sharing prediction outcomes, minimizes transmission costs but leads to significant information loss and potential result conflicts. Intermediate collaboration [15,16], sharing intermediate-layer features, strikes a balance between semantic information and transmission overhead, making it more suitable for onboard collaborative interpretation. For instance, recent studies [15,16,17,18] accomplish aerial robots’ collaborative semantic segmentation and depth estimation through sharing complementary features.
However, several significant challenges need to be addressed while implementing feature-based intermediate collaborative perception in remote sensing. Firstly, high-speed mobility [19] and long-distance transmission [20,21] contribute to limited bandwidth [22] and low-reliability communication [23] among platforms, posing obstacles to the interaction in collaborative perception. Consequently, this can lead to performance degradation and even complete interaction failure. Although some collaborative methods [17,18] alleviate this issue by reducing the amount of transmitted data through the utilization of processed features rather than raw data, the frequent transmission of data streams and the indiscriminative fully connected interaction mode remain insufficient for the weak communication in remote sensing. Secondly, the multiangle characteristic [24,25] of remote sensing introduces observational distinction across different platforms for an identical scene, resulting in information misalignment between platforms. Existing collaborative perception methods [15,16] tend to overlook this critical issue. In remote sensing scenarios, where targets are typically small and densely clustered, these methods simply add or concatenate features from various platforms without adequately considering their potential distinctions in the same region. In this way, it can interfere with the original observations and deteriorate the perception performance.
As to the first issue, we recognize that not all collaboration is necessary, and not all collaborative information is equally crucial. Therefore, we adopt a dynamic on-demand manner rather than relying on frequent fully connected interactions. The prevalent Who2com [15] lacks flexibility as it selects a perception supporter each time, potentially resulting in redundancy for well-informed platforms and inadequacy for those with severe observation deficiencies. Although When2com [16] further determines collaboration based on platform correlation, it may lead to low-profit collaboration prompted by highly relevant platforms, even when local information is abundant. To this end, we propose establishing collaboration only when necessary and prioritizing the transmission of crucial collaboration information, reducing the frequency and volume of transmission while enhancing interaction efficiency during collaborative perception. As a result, it better adapts to the prevalent weak communication environment commonly encountered in remote sensing scenarios. Regarding the second issue, exploring the correspondence between observations from different perspectives can effectively mitigate the interference caused by feature misalignment on the original local features during collaboration. Existing collaborative methods [15,16,17] typically overlook this aspect, often directly concatenating or adding local and collaborative features. Although MRCP-GNN [18] utilizes graph networks for feature-level fusion, it does not explicitly address feature misalignment. Consequently, when filtering the collaborative features among different platforms, we establish their correlation with the guidance of the local features. This approach facilitates the extraction of relevant information and ensures the alignment and integration of features, thus guaranteeing the overall performance of collaborative perception.
To implement the solutions mentioned above, this paper introduces the distributed collaborative perception network (DCP-Net) for multiple remote sensing platforms. DCP-Net realizes dynamic interactions through the design of a self-mutual information match (SMIM) module. Based on the local information, interplatform relevance, and designed strategy, the SMIM module evaluates the necessity of collaboration and identifies suitable platforms for collaboration, effectively avoiding redundant interactions and minimizing the interference caused by low-correlation information. This process contributes to relieving the transmission burden in weak communication while maintaining the perception performance. Furthermore, this paper presents a related feature fusion (RFF) module to overcome the challenge of information misalignment. The RFF module models the relationship between local and collaborative features and selectively integrates locally required information for feature fusion. This approach effectively mitigates the interference caused by misaligned features. With the implementation of these designed modules, DCP-Net facilitates collaborative perception among remote sensing platforms with low transmission cost and high-quality fusion. To validate the effectiveness of our proposed DCP-Net, we conduct semantic segmentation as the downstream task, using Potsdam, iSAID, and DFC23 datasets across three distinct difficulty modes. The results demonstrate that, compared with single-platform perception, DCP-Net enhances segmentation performance ranging from 2.61% to 16.89% through our appropriately designed multiplatform collaboration strategy. Moreover, DCP-Net significantly outperforms existing collaborative perception methods across all tested scenarios. Specifically, compared with the previous state-of-the-art method, When2com, DCP-Net achieves a performance improvement of approximately 3% to 13% while also exhibiting the highest collaboration efficiency. These findings underscore the superior collaboration efficiency and effectiveness of DCP-Net.
In conclusion, the main contributions of this article can be summarized as follows:
- This paper proposes DCP-Net, a novel method that leverages multiplatform observations to achieve collaborative perception for onboard intelligent processing. To the best of our knowledge, this is the first study to investigate feature-based collaborative perception in remote sensing.
- An SMIM module is designed to reduce redundant transmission and avoid irrelevant interference, thereby improving adaptation to weak communication in remote sensing. This module determines the opportunities and partners for collaboration, balancing perception enhancement and communication overhead.
- This paper presents an RFF module to address the issue of information misalignment and ensure the quality of the fused feature representation. This module is responsible for feature filtering and facilitates the effective integration of both local and collaborative features.
2. Related Work
2.1. Collaborative Perception
Collaborative perception is a burgeoning application for multiagent systems, where agents integrate local observations with those of neighboring agents in a learnable manner to enhance accuracy in perception tasks. This field has gained significant attention, and several works have been established to support and advance research in this area.
Liu et al. [15] are the first to propose the concept of collaborative perception and introduce a multistage handshake communication mechanism called Who2com. This mechanism guides neural networks to compress relevant information for each stage of communication. They also utilize the AirSim simulator [26] to develop a simulated dataset, which is perceived by a group of aerial robots. When2com [16], an upgraded version of Who2com, reformulates the communication framework by constructing communication groups and determining the optimal time for communication. The effectiveness of When2com is showcased through multiagent 3D shape recognition and collaborative semantic segmentation. For better adaption to sparse object detection tasks, Hu et al. [27] propose Where2com, which aims to optimize communication efficiency by conveying spatially sparse but perceptually essential information. Viewing the relationship among agents as a graph, Zhou et al. [18] adopt a Graph Neural Network to improve single-robot perception accuracy and resilience to sensor failures and disturbances in multirobot monocular depth estimation. Apart from the feature-level collaboration approaches above, Glaser et al. [17] introduce MASH, which utilizes result-level collaboration techniques. MASH gathers predictions from collaborators, processes them with local features, and generates masked predictions for the final fusion.
In some domains of cross-applications, collaborative perception is increasingly embraced. A collaborative perception framework called Swarm-SLAM [28] is proposed to tackle the challenge of localization and mapping among multiple robots in GPS-absent conditions. This framework creates a unified global understanding by establishing local mappings based on inter-robot links. In the realm of few-shot learning, FS-MAP [29] is presented as a metric-based framework for air–ground collaboration. The framework incorporates multiple UAVs to collect few-shot face samples and a self-driving campus delivery vehicle for target queries. It starts by sending face queries from the vehicle to UAVs for matching. The UAVs then return similarity scores to the delivery vehicle, which filters the target and operates subsequent path planning. In the field of games, Nash et al. [30] introduce a novel paradigm called Herd’s Eye View. It employs collaborative perception to obtain global reasoning abilities for better decision-making of reinforcement learning (RL) agents. In contrast to previous collaborative perception approaches, the method combines RL to address both low-level control tasks and high-level planning challenges, demonstrating superior performance compared with traditional ego-centric perception models.
While there is limited research on collaborative perception in remote sensing, Gao et al. [31] highlight the potential of multiplatform networking and collaboration in modern earth observation systems. This collaboration can improve the accuracy of earth observation data, enhance information dimensions, and achieve higher spacetime resolution compared with current systems. With the increasing prevalence of satellite constellations and unmanned aerial vehicle swarms, there are numerous applications that can benefit from exploring collaborative perception.
2.2. Remote Sensing Semantic Segmentation
Semantic segmentation in natural scenes has advanced significantly with deep neural networks. Long et al. [32] replace fully connected layers with convolution layers for semantic segmentation. U-Net [33] performs feature upsampling and concatenates neighboring layer’s features to recover lost spatial information. Chen et al. [34] propose the DeepLab series, incorporating dilated convolutions for multiscale contextual information capture. UPerNet [35] tackles localization and boundary challenges by adopting a feature pyramid network and a pyramid pooling module. In addition to CNN-based methods, there are also novel approaches that leverage transformer-based [36] architectures. SETR [37] employs a vision transformer [38] as the encoder and uses progressive up-sampling with multilevel feature aggregation to relieve the noise. SegFormer [39] utilizes a hybrid architecture that combines transformers with a lightweight multilayer decoder. Recent methods have begun to improve semantic segmentation strategically, but they neglect the constraints of backbones. Zhou et al. [40] develop a nonparametric framework to represent each category as a prototype and adopt metric learning for segmentation. Inspired by human vision, Li et al. [41] create a pixel-level hierarchical segmentation strategy, which simplifies complex scenes into multilevel parts. Chen et al. [42] present a generative model that maps images to semantic masks through conditional distribution approximation. Overall, these studies highlight a prevailing trend in semantic segmentation network design and training strategies.
Semantic segmentation in remote sensing commonly adapts techniques from natural scenes and modifies them for specific scenarios [43,44]. Concerning CNN-based methods, Mou et al. [45] incorporate relation-augmented representations into FCNs for capturing long-range spatial relationships in satellite images. Yi et al. [46] combines ResNet [47] and U-Net [33] architectures for handling varied object sizes in remote sensing imagery. With the development of vision transformer [38], ST-UNet [48] demonstrates the effectiveness of a UNet-like transformer decoder in modeling global information for urban scene segmentation. Wang et al. [49,50] utilize the Swin Transformer [51] as the backbone for improved local feature extraction and long-range spatial dependency modeling. Zhang et al. [52] and Chen et al. [53] employ an integrated architecture that merges CNN and transformer blocks to capture extensive global context and enhance channel interactions effectively. As to the training strategy, Niu et al. [54] incorporate graph reasoning and disentangled learning to improve the localization and precision of the segmentation results. DSCTs [55] propose a novel cross-model knowledge distillation framework to harness the complementary advantages of CNNs and transformers. Pastorino et al. [56] combines probabilistic graphical models with FCNs to deal with the scarce ground truth in very high-resolution data.
These models above are generally large and challenging to deploy on intelligent platforms. For the sake of simplicity and practicality, DCP-Net employs a lightweight FCN-based decoder to facilitate onboard intelligent processing across multiple platforms. Moreover, PSPNet, DeepLabV3, and UPerNet serve as the decoders for supplementary experiments to validate the generalizability of DCP-Net.
3. Method
3.1. Overview
The DCP-Net, illustrated in Figure 2, is composed of five integral parts: data preprocessing, feature extraction, collaboration establishment, multiplatform feature fusion, and downstream prediction. The specific process can be described as follows:
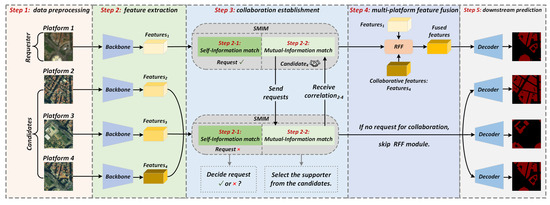
Figure 2.
Overall framework of the proposed DCP-Net. This framework defines the platform in need of collaboration as requester, potential collaborating platforms as candidates, and the selected candidate as a supporter. In the given scenario, platform 1 acts as the requester, while the remaining platforms serve as candidates. Platform 4 is selected as the supporter through the SMIM module, responsible for providing collaborative features.
Firstly, each observation platform undergoes a data preprocessing phase. It starts with data corrections to reduce image distortions. Next, various filtering techniques are employed to mitigate sensor or external noise. Subsequently, small patches are extracted from full-size observations and standardized to a uniform size of 512 × 512 pixels. These patches of identical geographic coordinates from different platforms serve as inputs for DCP-Net.
Secondly, a lightweight backbone serves as the feature extractor. Each platform inputs observations of the identical scene from various angles into the backbone, generating features with generally similar content but localized differences in detail.
Thirdly, the SMIM module utilizes the previously generated features to calculate a self-information confidence score locally to determine the collaboration request. Additionally, it interactively generates mutual information match scores for selecting collaborative platforms based on interplatform feature relationships.
Fourthly, the RFF module captures the correlation between local features and those from the selected collaborative platform. It filters locally required features and facilitates the fusion of misaligned features.
Finally, the fused features are fed into the downstream decoder, generating predicted results based on collaborative perception.
3.2. Self-Mutual Information Match Module
A reliable information collaboration strategy should be able to determine the necessity for a request and select appropriate collaborative platforms, precisely as described in Figure 3. Additionally, the interaction cost must be taken into account.
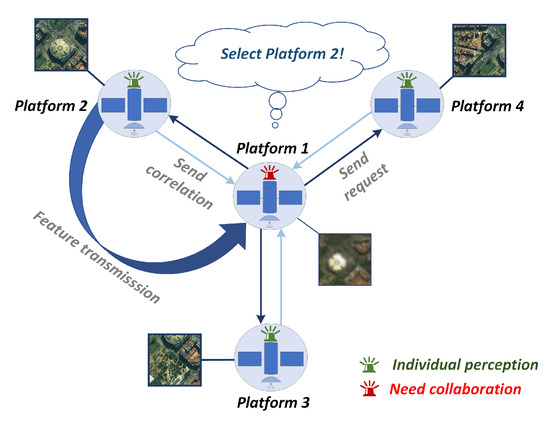
Figure 3.
Functional Schematic of the SMIM Module. Within the collaborative perception network, each remote sensing platform makes autonomous decisions based on its local observations. For instance, platform 1, upon recognizing the necessity for collaboration, sends requests to other platforms. Upon assessing the correlation feedback, platform 1 selects platform 2 as the suitable supporter. Meanwhile, platforms 2, 3, and 4 execute their perception task independently.
However, previous distributed collaborative strategies exhibit certain shortcomings. Who2com [15] persistently chooses a perception supporter in each iteration, which is redundant with sufficient local information but inadequate in cases of severe observation scarcity. Another strategy, When2com [16], builds upon Who2com [15] and further identifies suitable collaboration opportunities via inter-platform relevance. This can lead to low-profit collaboration prompted by high-relevant platforms, even when local information is abundant.
In contrast to these two approaches, we implement a two-stage collaboration strategy through the SMIM module. During the self-information match stage, the module first evaluates the need for collaboration to avoid unnecessary transmission expenditure. Subsequently, in the mutual information match stage, it selects platforms whose match scores exceed the collaboration threshold to act as perception supporters. This pre-filtering, based on the necessity of collaboration, prevents redundant interactions potentially brought by When2com [16] and ensures that highly relevant perception helpers are more likely to provide valuable information to the requester. Furthermore, the mechanism of selecting perception supporters based on the collaboration threshold is more flexible than the single-helper selection scheme in Who2com [15], enabling the integration of complementary information from multiple platforms. To illustrate this mechanism, the architecture of the SMIM module is detailed in Figure 4 and the specific operation is described below.
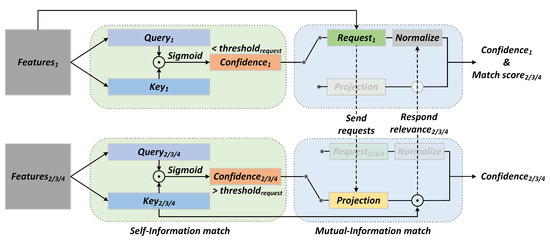
Figure 4.
Process framework of the SMIM Module. The module is divided into two stages: “self-information match”, depicted in the left part, and “mutual information match”, depicted in the right part.
Initially, platform i encodes local features into query and key vector as the inputs of the self-information match stage:
where Q and K refer to the query and key encoders, parameterized by and , respectively. Notably, the collaborative group comprises a total of N platforms. Additionally, the vector space of the query and key is represented by .
Subsequently, the dot-product self-attention [36,57] mechanism, is utilized to calculate the correlation between and . This correlation indicates the amount of local information for agent i.
Then, through the sigmoid activation, the correlation is compressed into the interval to generate the self-information confidence score . This score represents the probability that the platform does not require collaboration:
During the inference phase, a predefined request threshold is set to determine whether collaboration is necessary. If exceeds the threshold, it indicates that the local information is sufficient for the perceptual task independently without collaboration. This operation conserves communication resources by avoiding unnecessary requests for subsequent interactions.
When platform i seeks assistance, it generates a compact request vector by condensing the required features into a lower dimension r, which is significantly smaller than k, the feature dimension of the key generated in the self-information match stage:
where R denotes the request encoders, parameterized by . This compression results in a significant reduction in transmission cost. The platform i broadcasts its request to the candidates for collaboration.
In the mutual information match stage, the SMIM module calculates the relevance between each candidate and requester to select the appropriate supporter. By reutilizing the key generated in the self-information match stage, candidate j can directly respond to the request from the requester, platform i, without incurring repeated feature encoding. To handle inconsistent vector dimensions, we adopt the asymmetric dot-product attention. The request is first projected onto the feature space with the same dimension as the key , using the projection matrix . Each candidate then feeds back the relevance to the requester, which is subsequently normalized using the Softmax function to obtain the mutual information match score . Intuitively, a higher score indicates that the candidate (platform j) can provide more informative information to the requester (platform i).
In order to prioritize more helpful platforms for the requester and avoid low-yield interactions, a collaboration threshold is set to . During the inference stage, the candidates whose mutual information match scores exceed the collaboration threshold are designated as supporters and subsequently engaged in perceptive interaction with the requester.
3.3. Related Feature Fusion Module
Discrepancies in the observation scope and perspective among various platforms contribute to inconsistent feature representations within the same scene. This inconsistency presents challenges in executing effective multiplatform feature fusion.
Previous distributed collaborative methods [15,16] rely on simple concatenation for feature fusion. However, this operation can cause feature misalignment, disturb the original observation information, and reduce perception accuracy. Centralized collaborative methods, despite their advanced fusion techniques, also have drawbacks. MASH [18], a result-level fusion approach, carries a risk of significant information loss and potential conflicts in predictions [58]. Alternatively, MRCP-GNN [17] utilizes a GCN-based feature fusion mechanism to aggregate feature maps from neighboring platforms, but this method suffers from computational inefficiency [59] and limited interpretability [60]. Considering the drawbacks mentioned above, it is sensible to adopt feature-level fusion combined with the computationally efficient and more interpretable CNN paradigm for multiplatform information fusion.
To address these issues, we designed the RFF module, inspired by nonlocal attention [61], to help DCP-Net achieve multiplatform global feature interaction. The RFF module initially utilizes the requester’s features as a reference to select the correlated portion of the collaborative feature. Subsequently, it fuses these processed features with self-information confidence scores and mutual information match scores. The integration captures the intricate interdependencies between the feature sequences, for more accurate and efficient feature fusion. For a comprehensive understanding, the implementation details for the RFF module are exhibited in Figure 5.
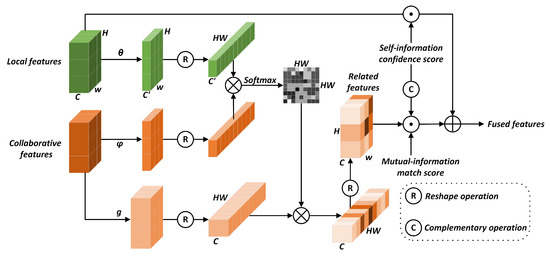
Figure 5.
Exhibition of the RFF Module. The reshape operation converts the image features into a sequence format. In addition, the complementary operation can be simply regarded as subtracting the input from 1.
The generic calculation of related features is listed as follows:
where , , and represent local features, collaborative features, and related features, respectively. The pairwise function h computes the relationship between and , and the function normalizes the relationship to obtain the affinity matrix. Ultimately, the related feature is generated by the calculated affinity matrix and collaborative feature . As to the concrete operation, the representation of input features is computed using linear embedding functions , , and g, implemented as convolution. Moreover, h is implemented in a dot-product manner, and Softmax is selected as the normalization function.
The specific steps of conducting the RFF module are demonstrated below.
Firstly, the local features and collaborative features are embedded by their respective encoders and , projecting the channel-wise dimension from C to , . This reduction in dimension reduces the complexity of subsequent affinity matrix computation. Additionally, the collaborative features are embedded by encoder g and fixed in the original dimension for subsequent feature selection.
Secondly, a global cross-attention operation is performed on the flattened embeddings , , calculating the relationship between each feature vector of the supporter and requester and achieving a fine-grained feature match. The resulting relationship is then normalized using Softmax to obtain the affinity matrix , which represents the relationship between the entire feature sequences.
Thirdly, the related feature is obtained with the affinity matrix and embedded collaborative features.
Ultimately, the fused features are obtained by integrating local features with related features, along with the self-information confidence score and mutual information match score determined by the SMIM module. This fused feature is then inputted into the downstream decoder to make predictions.
3.4. Training Strategy
Throughout the training process, it is necessary to instruct the platform on identifying the collaboration opportunities and selecting the appropriate supporter, which is a dynamic decision problem. Reinforcement learning is a widely employed approach to tackle such dynamic strategies [62,63]. However, it heavily depends on the reward mechanism design, presenting a significant challenge in collaborative perception. In contrast to intricate reinforcement learning methods, our proposed DCP-Net optimizes collaborative strategies solely based on the supervision of the ground truth from the downstream task.
To implement the collaboration strategy, DCP-Net utilizes centralized training and distributed inference. During the training process, DCP-Net combines the features from all platforms and quantitatively evaluates the effect of each candidate’s features on perception enhancement. In the inference stage, the principles designed in the SMIM module dynamically filter out unnecessary collaboration opportunities and candidates. In this way, the requester learns to make decisions that maximize downstream prediction improvements by assessing local observations and interacting with the candidates.
Additionally, our experiments choose semantic segmentation as the downstream task and utilize cross-entropy loss for optimization. Through iterative loss minimization, DCP-Net progressively enhances its ability to select information and fuse features, ultimately achieving peak performance in collaborative perception. The overall loss function in our collaborative perception network during the training process is
The analysis below delves into the reasons for DCP-Net’s ability to achieve interactive strategy training solely through downstream supervision. The objective function optimization aims to minimize the downstream task’s loss, which heavily relies on the quality of the fused feature provided to the decoder. Essentially, minimizing the loss corresponds to obtaining the optimal fused features, where the primary perception enhancement originates from integrating collaborative features during collaborative perception. The ideal fused features should follow a strategy that promotes perception while minimizing redundancy and interference. Consequently, in the SMIM module, when additional information is required to enhance perception, the calculated self-information confidence score is significantly lower. Meanwhile, candidates who provide greater improvement in perception are assigned higher mutual information match scores. Additionally, the RFF module extracts more relevant and helpful information from collaborative features to achieve better feature fusion.
It is worth noting that the collaborative strategy supervised solely based on the ground truth of the downstream task provides convenience in terms of dataset availability. This approach eliminates the need for human intervention in identifying optimal collaboration opportunities and partners, thus reducing the challenge of sample annotation.
4. Experiments
This section is structured into six parts. Initially, it describes the methodology for constructing datasets for multiplatform collaborative perception. Subsequently, an overview of the experimental environment is presented. The third part details the data evaluation method implemented in this study. The fourth part describes the fundamental collaborative semantic segmentation experiments. In the fifth part, ablation studies are conducted to examine the impact of the proposed modules and various hyperparameters. Finally, the sixth part provides visualizations to demonstrate the effectiveness of DCP-Net.
4.1. The Construction of Datasets
We evaluate DCP-Net through collaborative semantic segmentation tasks on simulated multiplatform datasets for aerial and satellite remote sensing, respectively, as well as a real-world joint observation dataset, DFC23 [64].
Due to the current scarcity of datasets for multiplatform collaborative observations, we generate analogous multiplatform datasets by utilizing existing datasets, including ISPRS Potsdam [65] and iSAID [66]. This process is accomplished by following the steps outlined below:
Firstly, a full-size remote sensing image is cropped into multiple subsets of size 1024 × 1024 by sliding windows. Secondly, four observation views of size 512 × 512 are randomly extracted from each 1024 × 1024 subset. By implementing these steps, a collection of images with overlapping observation ranges of identical scenes is obtained, simulating the observation of the same scene by four platforms. Figure 6 and Figure 7 below visually illustrate the resulting simulated datasets.

Figure 6.
Simulated multiplatform observation dataset of ISPRS Potsdam.

Figure 7.
Simulated multiplatform observation dataset of iSAID.
The real multiplatform observation dataset is created with the help of DFC23 to evaluate the effectiveness of the proposed algorithm in a more realistic setting. This dataset is jointly collected by the SuperView-1 and Gaofen-2 satellites and primarily comprises urban building clusters for collaborative semantic segmentation [67], aimed at assessing the practical effectiveness of various methods. Figure 8 depicts the full-scale observations captured by SuperView-1 and Gaofen-2. Notably, differences in observation perspectives, imaging characteristics, and resolutions make this dataset highly challenging, reflecting real-world scenarios.
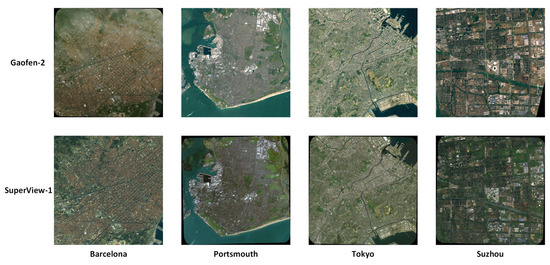
Figure 8.
The images taken by Gaofen-2 and SuperView-1 are presented in row 1 and row 2, respectively.
As displayed in Figure 9, column 1 presents the image captured by Gaofen-2, while columns 2 to 4 showcase images captured by SuperView-1. The image in column 2, taken at the same geographic coordinates as column 1, exhibits significant differences in observation perspective, observation range, and imaging payload. The nearby images in columns 3 and 4, which overlap 25–50% with column 2, serve as supplementary information or similar interferences. This evaluation confirms DCP-Net’s capability to discern and select valuable supplementary information while filtering out redundant data.

Figure 9.
Multiplatform joint observation dataset of DFC23.
We examine three experimental modes, categorized as homogeneous complete information supplement (Homo-CIS), homogeneous partial information supplement (Homo-PIS), and heterogeneous partial information supplement (Hetero-PIS). Details for each mode are outlined below.
The Homo-CIS mode aims to verify the accuracy of collaboration establishment and supporter selection. The term “homogeneous” implies that all platforms within the collaborative network possess the same imaging payload, while “complete” means that the requester can obtain all the necessary information comprehensively. In this mode, one platform suffers from imaging degradation, and its original, noise-free observation randomly appears among the other members within the group. Out of the four platforms, only one is selected as a potential victim of degradation. We introduce noise into 50% of the images captured by this platform and randomly replace another platform’s observations with the nondegraded original images. As depicted in Figure 10, column 1 displays the degraded image captured by the selected platform. Columns 2 and 3 show the observation information from other platforms, while column 4 presents the original, noise-free observation image. Furthermore, it is worth noting that only the segmentation mask of the potentially degraded platform is used as supervision during the training process. An ideal goal of the Homo-CIS mode is that the platform is capable of recognizing the degradation of local observations and utilizing the original information provided by other platforms to compensate for its perception.

Figure 10.
Visualization of the Homo-CIS mode.
In the Homo-PIS mode, we eliminate the assumption that there exists original, noise-free observation of the degraded platform among the partners within the group. Due to differences in observation range among various remote sensing platforms, only the partial overlap of observations conforms to practical scenarios. In this mode, we investigate the improvement in perception with the help of supporters that only cover partially overlapped views. The degraded platform can only collaborate with candidates whose mutual information match score exceeds the collaboration threshold. As depicted in Figure 11, the image in column 1 is marred by noise, thereby leading to a degraded observation. In contrast, the images in the remaining columns offer clear and detailed representations of the overlapped scene. The ultimate goal of the Homo-PIS mode is to improve the perception of the degraded platform by effectively utilizing the partially overlapped collaborative features.

Figure 11.
Visualization of the Homo-PIS mode.
The Hetero-PIS mode presents a more complex scenario compared with the Homo-PIS mode, as it takes into account the diverse imaging payloads across different platforms. This heterogeneity in payloads contributes to domain discrepancy, posing challenges in integrating diverse sources of information. In this mode, we utilize observations from multiple satellites, each equipped with unique imaging capabilities, perspective biases, and range limitations. As shown in Figure 12, the images in columns 2–4, sourced from Gaofen-2, are used to collaborate with the degraded observations in column 1 sourced from SuperView-1. This design aims to reflect the realistic complexity and difficulty of practical scenarios.

Figure 12.
Visualization of the Hetero-PIS mode.
4.2. Implementation Details
In our experimental setup, ResNet-18 [47] is employed as the feature backbone for DCP-Net, alongside other baselines. For the segmentation task, FCN serves as the primary decoder. To validate the generality of DCP-Net, we also incorporate PSPNet [68], DeepLabV3 [34], and UPerNet [35] as alternative decoders in our experiments. Additionally, three multiplatform datasets are partitioned into training and validation subsets, as specified in Table 1. In terms of optimization, the Adam optimizer is utilized with coefficient values of set to 0.9 and 0.999. The models undergo 50 epochs of training with a learning rate of . All experiments are conducted on an RTX-3090 GPU with PyTorch version 1.7.1.

Table 1.
Summary of datasets utilized in the study: the number of classes and training/validation samples.
4.3. Evaluation Metrics
Our study evaluates various collaborative perception approaches in the task of collaborative segmentation, focusing on three principal metrics: mean Intersection over Union (mIoU), Communication Cost (Comm. Cost), and Collaboration Efficiency (CE).
mIoU is a widely used metric in image segmentation, quantifying the overlap between predicted and ground truth targets. Specifically, IoU is computed by dividing the intersection area of the predicted and ground truth regions by their union, ranging between 0 and 1. Consequently, mIoU represents the average IoU across multiple targets and offers a concise and comprehensive assessment of an algorithm’s performance on diverse targets. A higher mIoU indicates superior capabilities in target localization and segmentation. This metric primarily evaluates the ability of various collaborative perception methods to execute collaborative segmentation tasks, reflecting their contribution to enhancing perceptual information.
Comm. Cost evaluates the average communication volume in the interactions of the collaborative perception task. Additionally, we adopt an indicator called MegaBytes per frame (MBpf) to quantify Comm. Cost. MBpf is determined by both the frequency of collaboration establishment and the volume of transmitted features. The calculation of MBpf takes into account two key factors: the frequency of collaboration establishment and the volume of transmitted features. This metric quantifies the average communication overhead associated with the adopted collaboration strategy during the process of collaborative tasks.
CE is introduced to balance perceptual enhancement against interaction cost in collaborative perception tasks. Accordingly, CE is defined as the ratio of the improvement in accuracy achieved in the collaborative semantic segmentation to the communication cost incurred during the interaction, represented as follows:
where denotes the increase in segmentation performance brought by collaborative perception compared with the No-Interaction manner. Consequently, a higher value of and a lower Comm. Cost is desirable in collaborative perception, as it signifies a more effective and efficient collaboration. This metric links performance improvement with communication overhead, serving as a comprehensive indicator of the efficacy of various collaboration strategies.
4.4. Collaborative Semantic Segmentation Experiments
We quantitatively compare the experimental results of our proposal DCP-Net with several centralized and distributed baselines in three modes mentioned in Section 4.1. A brief introduction of the baseline methods is provided in Table 2 below.

Table 2.
Description and comparison of different collaborative perception methods.
Additionally, Table 3 presents each advanced collaboration method’s corresponding parameters and computational complexities. It is worth mentioning that these calculations exclude the encoder of the backbone network and the decoder for the downstream task. The Params and FLOPs of our designed DCP-Net are slightly larger than those of previous distributed collaboration methods due to their more flexible collaborative strategy and effective feature fusion techniques. Given the performance improvements it brings, this increase in parameters and computational complexity is acceptable. However, DCP-Net still remains significantly smaller than centralized collaboration methods.

Table 3.
Comparison of different advanced methods in terms of parameters (Params) and computational complexity measured in floating-point operations (FLOPs).
4.4.1. Homogeneous Complete Information Supplementation
In the Homo-CIS mode, we investigate the improvement brought by the collaborative perception in the background of both the same imaging payload and the supplement of the complete original information. Table 4 shows the comparative performance of various baseline models against our proposed model.

Table 4.
Baselines and DCP-Net experimental results in the Homo-CIS mode. Arrows indicate whether a higher or lower value is preferable: ↑ means higher is better, and ↓ means lower is better. Since there is no transmission cost in No-Interaction, the value of Comm. Cost and CE is represented as N/A.
In both simulated multiplatform Potsdam and iSAID datasets, all centralized methods outperform the No-Interaction baseline in terms of predicted mIoU. However, their reliance on all observations for each collaboration leads to substantial bandwidth usage. In contrast, distributed methods, except for Randcom, approach or even exceed the performance of centralized methods but with only 1/6 to 1/3 of the communication overhead of the centralized one. Randcom lacks a collaborative strategy, resulting in the selection of optimal perception supporters, similar to the unpredictability of winning a lottery. Therefore, it shows only a marginal improvement in the simulated multiplatform iSAID dataset but even behaves much worse than No-Interaction in the simulated multiplatform Potsdam dataset.
Among the listed methods, our proposed DCP-Net achieves the optimal mask prediction in the Homo-CIS mode. Specifically, it enhances the average mIoU by 14.71% and 16.89% in the multiplatform Potsdam dataset and the multiplatform iSAID dataset, respectively. Besides, DCP-Net consumes the least Comm. Cost in this mode. In other words, regarding the CE, DCP-Net significantly outperforms other baselines, realizing the ideal goal of the most perception enhancement and the least transmission cost.
The primary objective of the Homo-CIS mode is to test the capability of accurately identifying collaboration opportunities and selecting suitable perception supporters. The other baselines, apart from Who2com [15] and When2com [16], lack the capability of intelligent dynamic interaction. Furthermore, When2com, an upgraded version of Who2com, requires continuous interaction among multiple platforms to determine collaboration opportunities and supporters simultaneously. We compare DCP-Net’s accuracy in assessing collaborative opportunities and selecting supporters to When2com’s. To calculate these metrics, we maintain the index that records whether the platform suffers imaging degradation and the location of original information. The accuracy of both collaboration opportunity and supporter selection can be calculated as follows:
It is worth noting that there is a difference between the true positive (TP) values of these two metrics:
For the collaboration opportunity, TP represents that the model accurately predicts the need for collaboration due to imaging degradation.
Regarding the supporter selection, TP represents that the model not only correctly identifies the need for collaboration but also accurately locates the original information.
True negative (TN) represents that the model accurately predicts that collaboration is unnecessary for each platform in the absence of imaging degradation.
refers to the overall count of predictions.
As depicted in Figure 13, DCP-Net consistently outperforms When2com in both evaluating collaboration opportunities and selecting supporters in the simulated multiplatform Potsdam and iSAID datasets, highlighting the effectiveness of the SMIM module. In contrast to When2com, DCP-Net initially generates a self-information confidence score to assess collaboration needs and subsequently calculates mutual information match scores for supporter selection. This two-step, asynchronous operation sounds more reasonable and contributes to better performance while minimizing redundant communication overhead.
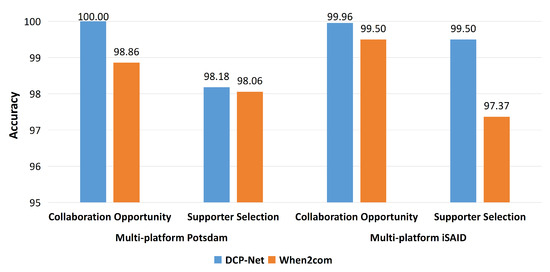
Figure 13.
The discrepancies of accuracy in assessing collaboration opportunities and supporter selection between DCP-Net and When2com in the Homo-CIS mode.
4.4.2. Homogeneous Partial Information Supplementation
The Homo-PIS mode is designed to evaluate the method’s ability to handle the challenge of misaligned collaborative features when platform observations only partially overlap. However, the complexity of overlapped collaborative features makes the accurate designation of optimal supporters challenging. Therefore, this mode does not include an assessment of supporter selection accuracy.
According to the results presented in Table 5, the margin of performance improvement for all methods is smaller with respect to No-Interaction, compared with more significant improvement observed in the Homo-CIS mode. Centralized approaches generally outperform all other distributed methods, except for our DCP-Net in the multiplatform Potsdam and iSAID datasets. Among the listed methods, DCP-Net achieves the optimal mask prediction and attains the highest collaboration efficiency in both datasets. This finding suggests that DCP-Net, in contrast to alternative distributed methods, still maintains a more remarkable perception improvement while consuming less communication cost, approximately 0.39 MBpf. The experimental results quantitatively demonstrate that in the Homo-PIS mode, DCP-Net improves the average mIoU by 6.18% and 7.34% in the multiplatform Potsdam dataset and the multiplatform iSAID dataset, respectively.

Table 5.
Experimental results of baselines and DCP-Net in the Homo-PIS mode.
It is worth noting that When2com incurs the lowest communication costs due to its inability to handle the misaligned collaborative features. Additionally, Table 5 reveals that When2com exhibits a substantial reduction in collaboration frequency in the multiplatform iSAID dataset and even a negligible level of information exchange in the multiplatform Potsdam dataset. This situation reflects a concession to maintain the original perception. Due to misalignment between collaborative features and local features, a simple fusion can result in distorted observations. This distortion makes collaboration susceptible to being treated as interference in When2com. As to the other methods, they conduct collaborative perception in a compulsory manner and have adapted to utilizing misaligned collaborative features to enhance local perception. However, they are still inferior to our proposed DCP-Net, which can be attributed to the effectiveness of our designed RFF module.
4.4.3. Heterogeneous Partial Information Supplement Mode
The Hetero-PIS mode is designed to evaluate the efficacy of all methods in intricate real-world scenarios. In the DFC23 dataset, the platforms exhibit variations in observation angle, range, resolution, and imaging payload. This diversity presents greater challenges compared with the Homo-PIS mode. In this mode, effective collaboration among heterogeneous data sources is crucial to compensate for local ambiguous observations of building clusters and improve prediction results.
Table 6 reveals that, in real-world situations like the DFC23 dataset where buildings have similar appearances, the perception enhancement by all centralized and distributed methods is more constrained compared with that observed in simulated experiments. Nevertheless, DCP-Net consistently surpasses other methods in prediction accuracy with a relatively low Comm. Cost of 0.36 MBpf and undoubtedly owns the highest CE. To comprehensively validate the generalizability of DCP-Net, we conduct supplementary experiments in this mode. We perform ablation studies with prevalent lightweight backbones, such as MobileNetV2-1.0 [69] and EfficientNet-B0 [70], as feature extractors, as shown in Table 7. Additionally, we also adopt various decoders for semantic segmentation, including PSPNet [68], DeepLabV3 [34], and UPerNet [35], with the results detailed in Table 8.

Table 6.
Experimental results of baselines and DCP-Net in the Hetero-PIS mode.

Table 7.
Experimental results of various backbones in Hetero-PIS mode using DFC23 dataset.

Table 8.
Experimental results of various downstream decoders in the Hetero-PIS mode.
In these evaluations, DCP-Net maintains its superior performance in both semantic segmentation accuracy and CE. These results affirm the generalizability and applicability of DCP-Net in real-world scenarios.
4.5. Ablation Study
4.5.1. Designed Modules Ablation Analysis
Extensive ablation experiments are conducted on three datasets to evaluate the effectiveness of our designed SMIM module and RFF module. Table 9, Table 10 and Table 11 demonstrate a consistent trend across all datasets. DCP-Net, equipped solely with either SMIM or RFF module, exhibits enhanced performance over the No-Interaction baseline. This finding offers initial confirmation of the effectiveness of each module. The single-module DCP-Net, without the SMIM module, loses dynamic interaction capabilities but achieves the best performance through centralized collaborative perception, markedly outperforming centralized baselines. This phenomenon reveals the efficiency of the RFF module in leveraging collaborative features. DCP-Net, without the RFF module, significantly reduces communication costs while still maintaining high prediction accuracy. This result highlights the SMIM module’s proficiency in identifying appropriate collaboration opportunities and supporters. However, under complex conditions, such as the multiplatform Potsdam dataset within the Homo-PIS mode, DCP-Net without the RFF module exhibits weakness in handling misaligned feature fusion and gives up the opportunity for collaborative perception. This observation underscores the critical role of the RFF module. Furthermore, dual-module DCP-Net achieves optimal collaborative efficiency, effectively balancing enhanced performance with minimized information transmission. This further validates the combined effectiveness of both the SMIM and RFF modules.

Table 9.
Ablation experiments on each designed module in the Homo-CIS mode.

Table 10.
Ablation experimentson each designed module in the Homo-PIS mode.

Table 11.
Ablation experiments on each designed module in the Hetero-PIS mode.
4.5.2. Hyperparameter Ablation Analysis
In the SMIM module, the request threshold is predefined as a hyperparameter during the self-information match stage. The platform with a self-information confidence score below the request threshold sends collaboration requests. An appropriate setting of this threshold is crucial for effective collaborative perception. Consequently, an ablation experiment is performed to ascertain the impact of various thresholds on the performance of the multiplatform Potsdam dataset in the Homo-PIS mode, as illustrated in Figure 14. When the request threshold is lowered from 1 to 0.9, the average mIoU shows a negligible decrease, indicating stable performance in downstream tasks. However, this adjustment notably doubles CE, implying a reduction in redundant transmission. Conversely, by reducing the request threshold from 0.2 to 0, both the average mIoU and CE experience a significant decline, which can be attributed to the abrupt decrease in collaboration frequency. Interestingly, a similar trend is also observed in the Homo-PIS mode. To achieve an optimal balance between accuracy and efficiency, this study sets the request threshold at 0.8.
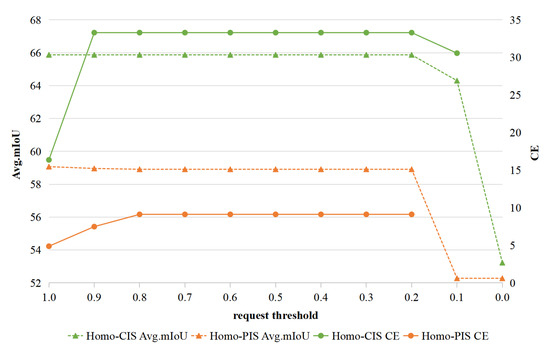
Figure 14.
Ablation experiments on the request threshold in the self-information match stage of the SMIM module.
In the SMIM module, each mutual information match score is calculated based on the compressed request and its corresponding key. The ratio of compression can affect the subsequent supporter selection process. So, it is essential to explore the influence of the request vector size on collaborative perception prediction. To investigate this, an ablation experiment is conducted using the multiplatform Potsdam dataset in the Homo-PIS mode, varying the request vector size from 2 to 1024. Figure 15 exhibits that when the request size is set to 32, there is a distinct turning point in the curve for both metrics. Our proposed DCP-Net achieves the best results in terms of semantic segmentation prediction and collaboration efficiency. Consequently, the size of the compressed request is set at 32 in the SMIM module.
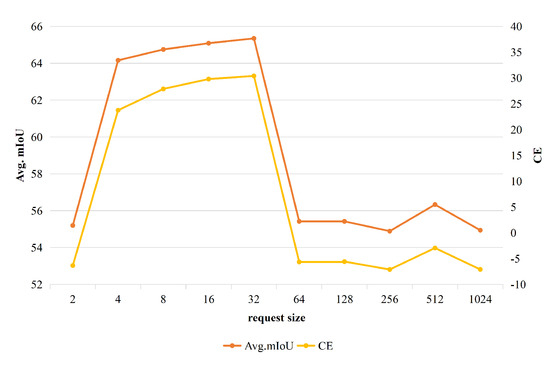
Figure 15.
Ablation experiments on the request size used in the mutual information match stage of the SMIM module.
4.6. Visualization
To further demonstrate the effectiveness of DCP-Net, we conduct a quantitative and visual analysis to examine the influence of our designed SMIM and RFF modules on request and collaboration platforms. This analysis includes the confidence scores, match scores, and relationship matrices at the specific scenes in different modes.
As shown in Figure 16, in the Homo-CIS mode, platform 1 initially evaluates its observation in the self-information match stage of the SMIM module and obtains a confidence score of 0.24, which is lower than the request threshold. Consequently, in the mutual information match stage of the SMIM module, platform 1 sends collaboration requests to platforms 2, 3, and 4. Each platform responds with its relevance. Afterward, the requester platform 1 calculates match scores and selects platform 4 as a supporter due to its high match score of 0.94, which surpasses the collaboration threshold. The decision also aligns with visual intuitiveness and the objective of the Homo-CIS mode, which aims to identify and supplement the original information without interference. In the subsequent step, the requester platform 1 takes advantage of the RFF module to capture and integrate its related features from the supporter platform 4. Additionally, when provided with a specific patch of query features, the attention matrix of related features is attached to the supporter’s observation for an intuitive visualization.
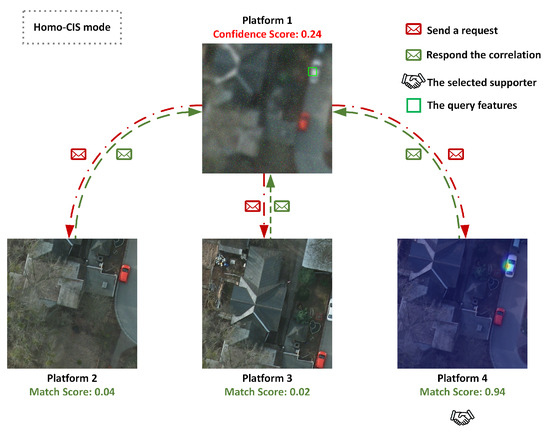
Figure 16.
The quantitative and visual descriptions of the influence of our designed SMIM and RFF modules in the collaboration of Homo-CIS mode.
As depicted in Figure 17, in the Homo-PIS mode, platform 1 obtains a confidence score of 0.18 and sends collaboration requests to collaboration platforms. During the mutual information stage of the SMIM module, platforms 2 and 3 are chosen as the preferred supporters. Evidently, the platforms with a larger overlap can enrich platform 1 with more comprehensive information. To validate the efficacy of the RFF module, when querying features related to the roof, the attention heat map showcases the precise distribution of relevant features. Overall, the results confirm the objective of the Homo-PIS mode: to select suitable collaboration supporters and related features even in the absence of complementary original observations.
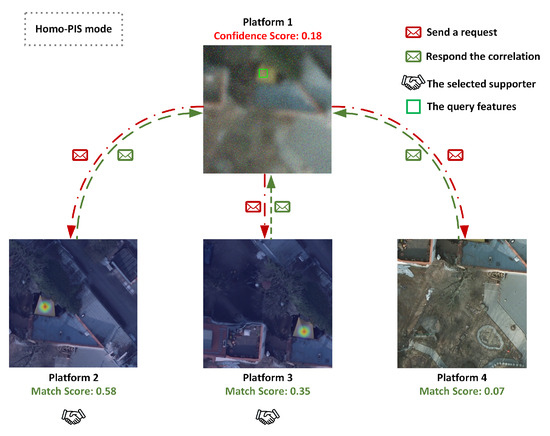
Figure 17.
The quantitative and visual descriptions of the influence of our designed SMIM and RFF modules in the collaboration of Homo-PIS mode.
As illustrated in Figure 18, in the Hetero-PIS mode, platforms 3 and 4 are chosen as the supporters through the SMIM module. Given a query of the red building, the attention heat map generated by the RFF module can precisely highlight the distribution of related features. These findings prove that our designed SMIM and RFF modules remain effective in the collaboration of heterogeneous images with partial overlaps.
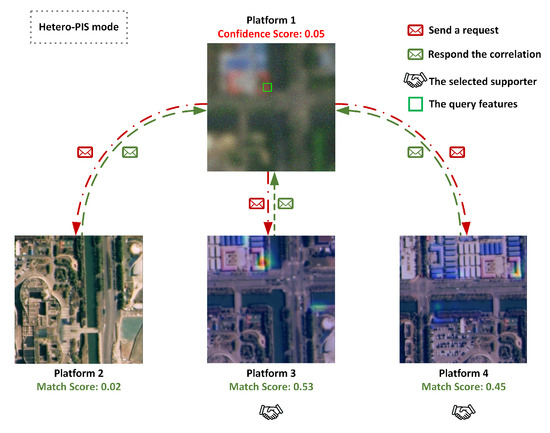
Figure 18.
The quantitative and visual descriptions about the influence of our designed SMIM and RFF modules in the collaboration of Hetero-PIS mode.
Additionally, we visualize the enhancements in downstream semantic segmentation tasks through collaborative perception. These improvements are intuitively illustrated in Figure 19, Figure 20, Figure 21, Figure 22, Figure 23 and Figure 24.

Figure 19.
The visualization of results predicted by various baselines and DCP-Net in the Homo-CIS mode of the Potsdam dataset.

Figure 20.
The visualization of results predicted by various baselines and DCP-Net in the Homo-PIS mode of the Potsdam dataset.

Figure 21.
The visualization of results predicted by various baselines and DCP-Net in the Homo-CIS mode of the iSAID dataset.

Figure 22.
The visualization of results predicted by various baselines and DCP-Net in the Homo-PIS mode of the iSAID dataset.

Figure 23.
The visualization of results predicted by various baselines and DCP-Net in the Hetero-PIS mode of the DFC23 dataset.
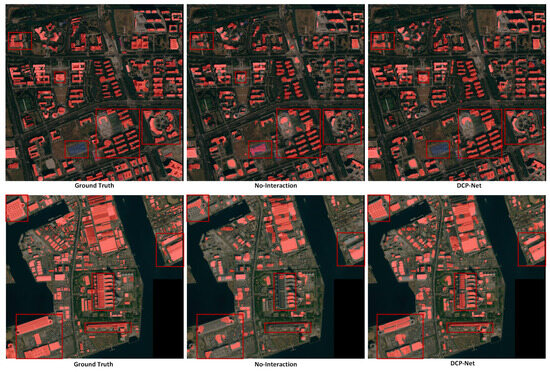
Figure 24.
The large-scale visualization of predicted results in the DFC23 dataset.
In Figure 19 and Figure 20, for the multiplatform Potsdam dataset of both modes, No-Interaction tends to classify uncertain objects resulting from image degradation as clutter and often misclassifies blurry buildings as impervious surfaces. Additionally, it struggles to differentiate between trees and low vegetation. Compared with other baselines, our DCP-Net can provide more accurate predictions for the foreground objects and boundary regions with the help of appropriate selection and fusion of collaborative features during the collaborative perception.
In the multiplatform iSAID dataset of both modes, it is more challenging to discriminate 16 classes, particularly in a lower resolution. For clarity, only six classes are visualized. Due to the incomplete representation, No-Interaction often mistakes some large vehicles for the small ones in Figure 21 and directly ignores some tiny objects, such as the small vehicles in Figure 22. In contrast to other methods, DCP-Net can remedy the issues mentioned above better and provide a more accurate regional prediction.
In the practical scene of DFC23, the buildings are densely clustered, and No-Interaction often misclassifies certain ranges of degraded observations as background indiscriminately. Furthermore, it is also tricky to improve the degraded perception with the help of heterogeneous collaborative features. Despite these challenging conditions, our DCP-Net still outperforms other methods. In Figure 23, DCP-Net delivers a clearer boundary between buildings and effectively enhances prediction accuracy in both the upper and lower areas. Besides, two large regions of improved predictions are illustrated in Figure 24. These visualizations of predicted masks prove the effectiveness of DCP-Net in practical applications.
5. Discussion
In this study, the collaborative transmission of information involves the entire feature map. Future research should explore methods for selecting sparse feature maps as complementary information to further reduce transmission costs. Additionally, the collaborative observation datasets in this paper maintain the same resolution for observations of identical scenes. Investigating how to handle scale inconsistencies among multiplatform collaborative observations is a promising direction. Moreover, our datasets consist solely of satellite and aerial imagery, without considering low-altitude drone collaboration. While collaborative tasks are common in drone swarms, their observations vary significantly due to different viewing angles and altitudes. Aligning features in such scenarios presents a greater challenge for feature-level collaboration, making it a valuable direction for future research. Lastly, it is encouraged to extend the concept of collaborative perception to a broader range of downstream tasks, such as object detection, to address common issues like cloud occlusion.
6. Conclusions
Motivated by the limitations of single-platform perception, this paper proposes DCP-Net, a novel collaborative perception framework based on feature-level interactions among multiple remote sensing platforms. DCP-Net leverages the innovative SIMM module to dynamically establish adaptive collaborations with other platforms. Additionally, the RFF module is designed to effectively integrate multiplatform features to facilitate superior subsequent predictions. Notably, the entire process can be completed without human intervention to determine optimal collaboration opportunities and partners. Extensive experiments and visualization analyses are conducted on three datasets, namely Potsdam, iSAID, and DFC23, which are redesigned in three difficulty modes. Comparative analysis with existing methods in collaborative perception comprehensively demonstrates the superiority of DCP-Net.
Author Contributions
Conceptualization, Z.W. (Zhechao Wang); methodology, Z.W. (Zhechao Wang); software, Z.W. (Zhechao Wang); validation, Z.W. (Zhechao Wang), P.C., S.D., K.C. and Z.W. (Zhirui Wang); formal analysis, Z.W. (Zhechao Wang) and P.C.; writing—original draft preparation, Z.W. (Zhechao Wang); writing—review and editing, Z.W. (Zhechao Wang), P.C., S.D., K.C., Z.W. (Zhirui Wang), X.L. and X.S.; visualization, Z.W. (Zhechao Wang); supervision, P.C., Z.W. (Zhirui Wang), and X.S.; project administration, P.C., Z.W. (Zhirui Wang), X.L. and X.S.; funding acquisition, Z.W. (Zhirui Wang), X.L. and X.S. All authors have read and agreed to the published version of the manuscript.
Funding
This work was supported by the National Nature Science Foundation of China under Grant 62331027 and Grant 62076241, and supported by the Strategic Priority Research Program of the Chinese Academy of Sciences, Grant No. XDA0360300.
Data Availability Statement
The experiments described in this article are based on open-source datasets, and the simulated datasets utilized are available for access at the DCP-Net GitHub repository: https://github.com/WangzcBruce/DCP-Net (accessed on 5 June 2024).
Conflicts of Interest
The authors declare no conflicts of interest.
References
- Wang, C.; Zhao, D.; Qi, X.; Liu, Z.; Shi, Z. A Hierarchical Decoder Architecture for Multi-level Fine-grained Disaster Detection. IEEE Trans. Geosci. Remote Sens. 2023, 61, 1–14. [Google Scholar]
- Liu, J.; Liao, X.; Ye, H.; Yue, H.; Wang, Y.; Tan, X.; Wang, D. UAV swarm scheduling method for remote sensing observations during emergency scenarios. Remote Sens. 2022, 14, 1406. [Google Scholar] [CrossRef]
- Xu, Q.; Li, Y.; Shi, Z. LMO-YOLO: A ship detection model for low-resolution optical satellite imagery. IEEE J. Sel. Top. Appl. Earth Obs. Remote Sens. 2022, 15, 4117–4131. [Google Scholar] [CrossRef]
- Chen, J.; Chen, K.; Chen, H.; Li, W.; Zou, Z.; Shi, Z. Contrastive learning for fine-grained ship classification in remote sensing images. IEEE Trans. Geosci. Remote Sens. 2022, 60, 1–16. [Google Scholar] [CrossRef]
- Parajuli, J.; Fernandez-Beltran, R.; Kang, J.; Pla, F. Attentional dense convolutional neural network for water body extraction from sentinel-2 images. IEEE J. Sel. Top. Appl. Earth Obs. Remote. Sens. 2022, 15, 6804–6816. [Google Scholar] [CrossRef]
- Gu, Y.; Wang, C.; Li, X. An intensity-independent stereo registration method of push-broom hyperspectral scanner and LiDAR on UAV platforms. IEEE Trans. Geosci. Remote Sens. 2022, 60, 1–14. [Google Scholar] [CrossRef]
- Gu, Y.; Xiao, Z.; Li, X. A Spatial Alignment Method for UAV LiDAR Strip Adjustment in Non-urban Scenes. IEEE Trans. Geosci. Remote Sens. 2023, 61, 1–13. [Google Scholar]
- Ren, Y.; Zhu, C.; Xiao, S. Deformable faster r-cnn with aggregating multi-layer features for partially occluded object detection in optical remote sensing images. Remote Sens. 2018, 10, 1470. [Google Scholar] [CrossRef]
- Li, C.; Li, Z.; Liu, X.; Li, S. The Influence of Image Degradation on Hyperspectral Image Classification. Remote Sens. 2022, 14, 5199. [Google Scholar] [CrossRef]
- Zhang, J.; Xu, T.; Li, J.; Jiang, S.; Zhang, Y. Single-image super resolution of remote sensing images with real-world degradation modeling. Remote Sens. 2022, 14, 2895. [Google Scholar] [CrossRef]
- Ngo, H.; Fang, H.; Wang, H. Cooperative Perception With V2V Communication for Autonomous Vehicles. IEEE Trans. Veh. Technol. 2023, 72, 11122–11131. [Google Scholar] [CrossRef]
- Li, Y.; Ren, S.; Wu, P.; Chen, S.; Feng, C.; Zhang, W. Learning distilled collaboration graph for multi-agent perception. Adv. Neural Inf. Process. Syst. 2021, 34, 29541–29552. [Google Scholar]
- Chen, Q.; Tang, S.; Yang, Q.; Fu, S. Cooper: Cooperative perception for connected autonomous vehicles based on 3d point clouds. In Proceedings of the 2019 IEEE 39th International Conference on Distributed Computing Systems (ICDCS), Richardson, TX, USA, 7–9 July 2019; IEEE: Pisgetway, NJ, USA, 2019; pp. 514–524. [Google Scholar]
- Zeng, W.; Wang, S.; Liao, R.; Chen, Y.; Yang, B.; Urtasun, R. Dsdnet: Deep structured self-driving network. In Proceedings of the Computer Vision–ECCV 2020: 16th European Conference, Glasgow, UK, 23–28 August 2020; Proceedings, Part XXI 16. Springer: Berlin/Heidelberg, Germany, 2020; pp. 156–172. [Google Scholar]
- Liu, Y.C.; Tian, J.; Ma, C.Y.; Glaser, N.; Kuo, C.W.; Kira, Z. Who2com: Collaborative perception via learnable handshake communication. In Proceedings of the 2020 IEEE International Conference on Robotics and Automation (ICRA), Paris, France, 31 May–31 August 2020; IEEE: Pisgetway, NJ, USA, 2020; pp. 6876–6883. [Google Scholar]
- Liu, Y.C.; Tian, J.; Glaser, N.; Kira, Z. When2com: Multi-agent perception via communication graph grouping. In Proceedings of the IEEE/CVF Conference on Computer Vision and Pattern Recognition, Seattle, WA, USA, 14–19 June 2020; pp. 4106–4115. [Google Scholar]
- Glaser, N.; Liu, Y.C.; Tian, J.; Kira, Z. Overcoming obstructions via bandwidth-limited multi-agent spatial handshaking. In Proceedings of the 2021 IEEE/RSJ International Conference on Intelligent Robots and Systems (IROS), Prague, Czech Republic, 27 September–1 October 2021; IEEE: Pisgetway, NJ, USA, 2021; pp. 2406–2413. [Google Scholar]
- Zhou, Y.; Xiao, J.; Zhou, Y.; Loianno, G. Multi-robot collaborative perception with graph neural networks. IEEE Robot. Autom. Lett. 2022, 7, 2289–2296. [Google Scholar] [CrossRef]
- Wang, W.Q. Large-area remote sensing in high-altitude high-speed platform using MIMO SAR. IEEE J. Sel. Top. Appl. Earth Obs. Remote Sens. 2013, 6, 2146–2158. [Google Scholar] [CrossRef]
- Ren, Q.; Sun, Y.; Wang, T.; Zhang, B. Energy-Efficient Cooperative MIMO Formation for Underwater MI-Assisted Acoustic Wireless Sensor Networks. Remote Sens. 2022, 14, 3641. [Google Scholar] [CrossRef]
- Zhang, B.; Wu, Y.; Zhao, B.; Chanussot, J.; Hong, D.; Yao, J.; Gao, L. Progress and challenges in intelligent remote sensing satellite systems. IEEE J. Sel. Top. Appl. Earth Obs. Remote Sens. 2022, 15, 1814–1822. [Google Scholar] [CrossRef]
- Koubaa, A.; Ammar, A.; Abdelkader, M.; Alhabashi, Y.; Ghouti, L. AERO: AI-enabled remote sensing observation with onboard edge computing in UAVs. Remote Sens. 2023, 15, 1873. [Google Scholar] [CrossRef]
- Warnick, K.F.; Maaskant, R.; Ivashina, M.V.; Davidson, D.B.; Jeffs, B.D. Phased Arrays for Radio Astronomy, Remote Sensing, and Satellite Communications; Cambridge University Press: Cambridge, UK, 2018. [Google Scholar]
- Yao, Y.; Leung, Y.; Fung, T.; Shao, Z.; Lu, J.; Meng, D.; Ying, H.; Zhou, Y. Continuous multi-angle remote sensing and its application in urban land cover classification. Remote Sens. 2021, 13, 413. [Google Scholar] [CrossRef]
- Yang, J.; Yamaguchi, Y.; Boerner, W.M.; Lin, S. Numerical methods for solving the optimal problem of contrast enhancement. IEEE Trans. Geosci. Remote Sens. 2000, 38, 965–971. [Google Scholar] [CrossRef]
- Shah, S.; Dey, D.; Lovett, C.; Kapoor, A. Airsim: High-fidelity visual and physical simulation for autonomous vehicles. In Proceedings of the Field and Service Robotics: Results of the 11th International Conference; Springer: Berlin/Heidelberg, Germany, 2018; pp. 621–635. [Google Scholar]
- Hu, Y.; Fang, S.; Lei, Z.; Zhong, Y.; Chen, S. Where2comm: Communication-efficient collaborative perception via spatial confidence maps. arXiv 2022, arXiv:2209.12836. [Google Scholar]
- Lajoie, P.Y.; Beltrame, G. Swarm-slam: Sparse decentralized collaborative simultaneous localization and mapping framework for multi-robot systems. arXiv 2023, arXiv:2301.06230. [Google Scholar] [CrossRef]
- Fan, C.; Hu, J.; Huang, J. Few-Shot Multi-Agent Perception with Ranking-Based Feature Learning. IEEE Trans. Pattern Anal. Mach. Intell. 2023, 45, 11810–11823. [Google Scholar] [CrossRef] [PubMed]
- Nash, A.; Vardy, A.; Churchill, D. Herd’s Eye View: Improving Game AI Agent Learning with Collaborative Perception. arXiv 2023, arXiv:2306.06544. [Google Scholar] [CrossRef]
- Gao, G.; Yao, L.; Li, W.; Zhang, L.; Zhang, M. Onboard Information Fusion for Multisatellite Collaborative Observation: Summary, challenges, and perspectives. IEEE Geosci. Remote Sens. Mag. 2023, 11, 40–59. [Google Scholar] [CrossRef]
- Long, J.; Shelhamer, E.; Darrell, T. Fully convolutional networks for semantic segmentation. In Proceedings of the IEEE Conference on Computer Vision and Pattern Recognition, Boston, MA, USA, 7–12 June 2015; pp. 3431–3440. [Google Scholar]
- Ronneberger, O.; Fischer, P.; Brox, T. U-net: Convolutional networks for biomedical image segmentation. In Proceedings of the Medical Image Computing and Computer-Assisted Intervention–MICCAI 2015: 18th International Conference, Munich, Germany, 5–9 October 2015; Proceedings, Part III 18. Springer: Berlin/Heidelberg, Germany, 2015; pp. 234–241. [Google Scholar]
- Chen, L.C.; Papandreou, G.; Schroff, F.; Adam, H. Rethinking atrous convolution for semantic image segmentation. arXiv 2017, arXiv:1706.05587. [Google Scholar]
- Xiao, T.; Liu, Y.; Zhou, B.; Jiang, Y.; Sun, J. Unified perceptual parsing for scene understanding. In Proceedings of the European Conference on Computer Vision (ECCV), Munich, Germany, 8–14 September 2018; pp. 418–434. [Google Scholar]
- Vaswani, A.; Shazeer, N.; Parmar, N.; Uszkoreit, J.; Jones, L.; Gomez, A.N.; Kaiser, Ł.; Polosukhin, I. Attention is all you need. Adv. Neural Inf. Process. Syst. 2017, 30. [Google Scholar]
- Zheng, S.; Lu, J.; Zhao, H.; Zhu, X.; Luo, Z.; Wang, Y.; Fu, Y.; Feng, J.; Xiang, T.; Torr, P.H.; et al. Rethinking semantic segmentation from a sequence-to-sequence perspective with transformers. In Proceedings of the IEEE/CVF Conference on Computer Vision and Pattern Recognition, Virtual, 19–25 June 2021; pp. 6881–6890. [Google Scholar]
- Dosovitskiy, A.; Beyer, L.; Kolesnikov, A.; Weissenborn, D.; Zhai, X.; Unterthiner, T.; Dehghani, M.; Minderer, M.; Heigold, G.; Gelly, S.; et al. An image is worth 16x16 words: Transformers for image recognition at scale. arXiv 2020, arXiv:2010.11929. [Google Scholar]
- Xie, E.; Wang, W.; Yu, Z.; Anandkumar, A.; Alvarez, J.M.; Luo, P. SegFormer: Simple and efficient design for semantic segmentation with transformers. Adv. Neural Inf. Process. Syst. 2021, 34, 12077–12090. [Google Scholar]
- Zhou, T.; Wang, W.; Konukoglu, E.; Van Gool, L. Rethinking semantic segmentation: A prototype view. In Proceedings of the IEEE/CVF Conference on Computer Vision and Pattern Recognition, New Orleans, LA, USA, 18–24 June 2022; pp. 2582–2593. [Google Scholar]
- Li, L.; Zhou, T.; Wang, W.; Li, J.; Yang, Y. Deep hierarchical semantic segmentation. In Proceedings of the IEEE/CVF Conference on Computer Vision and Pattern Recognition, New Orleans, LA, USA, 18–24 June 2022; pp. 1246–1257. [Google Scholar]
- Chen, J.; Lu, J.; Zhu, X.; Zhang, L. Generative semantic segmentation. In Proceedings of the IEEE/CVF Conference on Computer Vision and Pattern Recognition, Vancouver, BC, Canada, 18–22 June 2023; pp. 7111–7120. [Google Scholar]
- Yang, Y.; Sun, X.; Diao, W.; Yin, D.; Yang, Z.; Li, X. Statistical sample selection and multivariate knowledge mining for lightweight detectors in remote sensing imagery. IEEE Trans. Geosci. Remote Sens. 2022, 60, 1–14. [Google Scholar] [CrossRef]
- Yin, D.; Yang, Y.; Wang, Z.; Yu, H.; Wei, K.; Sun, X. 1% vs 100%: Parameter-efficient low rank adapter for dense predictions. In Proceedings of the IEEE/CVF Conference on Computer Vision and Pattern Recognition, Vancouver, BC, Canada, 18–22 June 2023; pp. 20116–20126. [Google Scholar]
- Zhou, W.; Fan, X.; Yu, L.; Lei, J. MISNet: Multiscale cross-layer interactive and similarity refinement network for scene parsing of aerial images. IEEE J. Sel. Top. Appl. Earth Obs. Remote Sens. 2023, 16, 2025–2034. [Google Scholar] [CrossRef]
- Yi, Y.; Zhang, Z.; Zhang, W.; Zhang, C.; Li, W.; Zhao, T. Semantic segmentation of urban buildings from VHR remote sensing imagery using a deep convolutional neural network. Remote Sens. 2019, 11, 1774. [Google Scholar] [CrossRef]
- He, K.; Zhang, X.; Ren, S.; Sun, J. Deep residual learning for image recognition. In Proceedings of the IEEE Conference on Computer Vision and Pattern Recognition, Las Vegas, NV, USA, 27–30 June 2016; pp. 770–778. [Google Scholar]
- He, X.; Zhou, Y.; Zhao, J.; Zhang, D.; Yao, R.; Xue, Y. Swin transformer embedding UNet for remote sensing image semantic segmentation. IEEE Trans. Geosci. Remote Sens. 2022, 60, 1–15. [Google Scholar] [CrossRef]
- Wang, L.; Li, R.; Duan, C.; Zhang, C.; Meng, X.; Fang, S. A novel transformer based semantic segmentation scheme for fine-resolution remote sensing images. IEEE Geosci. Remote Sens. Lett. 2022, 19, 1–5. [Google Scholar] [CrossRef]
- Panboonyuen, T.; Jitkajornwanich, K.; Lawawirojwong, S.; Srestasathiern, P.; Vateekul, P. Transformer-based decoder designs for semantic segmentation on remotely sensed images. Remote Sens. 2021, 13, 5100. [Google Scholar] [CrossRef]
- Liu, Z.; Lin, Y.; Cao, Y.; Hu, H.; Wei, Y.; Zhang, Z.; Lin, S.; Guo, B. Swin transformer: Hierarchical vision transformer using shifted windows. In Proceedings of the IEEE/CVF International Conference on Computer Vision, Virtual, 11–17 October 2021; pp. 10012–10022. [Google Scholar]
- Zhang, Z.; Liu, F.; Liu, C.; Tian, Q.; Qu, H. ACTNet: A dual-attention adapter with a CNN-transformer network for the semantic segmentation of remote sensing imagery. Remote Sens. 2023, 15, 2363. [Google Scholar] [CrossRef]
- Chen, X.; Li, D.; Liu, M.; Jia, J. CNN and Transformer Fusion for Remote Sensing Image Semantic Segmentation. Remote Sens. 2023, 15, 4455. [Google Scholar] [CrossRef]
- Niu, R.; Sun, X.; Tian, Y.; Diao, W.; Feng, Y.; Fu, K. Improving semantic segmentation in aerial imagery via graph reasoning and disentangled learning. IEEE Trans. Geosci. Remote Sens. 2021, 60, 1–18. [Google Scholar] [CrossRef]
- Dong, Z.; Gao, G.; Liu, T.; Gu, Y.; Zhang, X. Distilling Segmenters from CNNs and Transformers for Remote Sensing Images Semantic Segmentation. IEEE Trans. Geosci. Remote Sens. 2023, 61, 5613814. [Google Scholar] [CrossRef]
- Pastorino, M.; Moser, G.; Serpico, S.B.; Zerubia, J. Semantic segmentation of remote-sensing images through fully convolutional neural networks and hierarchical probabilistic graphical models. IEEE Trans. Geosci. Remote Sens. 2022, 60, 1–16. [Google Scholar] [CrossRef]
- Luong, M.T.; Pham, H.; Manning, C.D. Effective approaches to attention-based neural machine translation. arXiv 2015, arXiv:1508.04025. [Google Scholar]
- Gadzicki, K.; Khamsehashari, R.; Zetzsche, C. Early vs late fusion in multimodal convolutional neural networks. In Proceedings of the 2020 IEEE 23rd International Conference on Information Fusion (FUSION), Rustenburg, South Africa, 6–9 July 2020; IEEE: Piscatway, NJ, USA, 2020; pp. 1–6. [Google Scholar]
- Liu, X.; Yan, M.; Deng, L.; Li, G.; Ye, X.; Fan, D.; Pan, S.; Xie, Y. Survey on graph neural network acceleration: An algorithmic perspective. arXiv 2022, arXiv:2202.04822. [Google Scholar]
- Huang, Q.; Yamada, M.; Tian, Y.; Singh, D.; Chang, Y. Graphlime: Local interpretable model explanations for graph neural networks. IEEE Trans. Knowl. Data Eng. 2022, 35, 6968–6972. [Google Scholar] [CrossRef]
- Wang, X.; Girshick, R.; Gupta, A.; He, K. Non-local neural networks. In Proceedings of the IEEE Conference on Computer Vision and Pattern Recognition, Salt Lake City, UT, USA, 18–23 June 2018; pp. 7794–7803. [Google Scholar]
- Mou, L.; Saha, S.; Hua, Y.; Bovolo, F.; Bruzzone, L.; Zhu, X.X. Deep reinforcement learning for band selection in hyperspectral image classification. IEEE Trans. Geosci. Remote Sens. 2021, 60, 1–14. [Google Scholar] [CrossRef]
- Feng, J.; Li, D.; Gu, J.; Cao, X.; Shang, R.; Zhang, X.; Jiao, L. Deep reinforcement learning for semisupervised hyperspectral band selection. IEEE Trans. Geosci. Remote Sens. 2021, 60, 1–19. [Google Scholar] [CrossRef]
- Persello, C.; Hänsch, R.; Vivone, G.; Chen, K.; Yan, Z.; Tang, D.; Huang, H.; Schmitt, M.; Sun, X. 2023 IEEE GRSS Data Fusion Contest: Large-Scale Fine-Grained Building Classification for Semantic Urban Reconstruction [Technical Committees]. IEEE Geosci. Remote Sens. Mag. 2023, 11, 94–97. [Google Scholar] [CrossRef]
- Rottensteiner, F.; Sohn, G.; Gerke, M.; Wegner, J.D. ISPRS Semantic Labeling Contest; ISPRS: Leopoldshöhe, Germany, 2014; Volume 1. [Google Scholar]
- Waqas Zamir, S.; Arora, A.; Gupta, A.; Khan, S.; Sun, G.; Shahbaz Khan, F.; Zhu, F.; Shao, L.; Xia, G.S.; Bai, X. isaid: A large-scale dataset for instance segmentation in aerial images. In Proceedings of the IEEE/CVF Conference on Computer Vision and Pattern Recognition Workshops, Long Beach, CA, USA, 16–17 June 2019; pp. 28–37. [Google Scholar]
- Huang, X.; Ren, L.; Liu, C.; Wang, Y.; Yu, H.; Schmitt, M.; Hänsch, R.; Sun, X.; Huang, H.; Mayer, H. Urban Building Classification (UBC)—A Dataset for Individual Building Detection and Classification From Satellite Imagery. Proc. IEEE Conf. Comput. Vis. Pattern Recognit. Workshops 2022, 1413–1421. [Google Scholar]
- Zhao, H.; Shi, J.; Qi, X.; Wang, X.; Jia, J. Pyramid scene parsing network. In Proceedings of the IEEE Conference on Computer Vision and Pattern Recognition, Honolulu, HI, USA, 21–26 July 2017; pp. 2881–2890. [Google Scholar]
- Sandler, M.; Howard, A.; Zhu, M.; Zhmoginov, A.; Chen, L.C. Mobilenetv2: Inverted residuals and linear bottlenecks. In Proceedings of the IEEE Conference on Computer Vision and Pattern Recognition, Salt Lake City, UT, USA, 18–22 June 2018; pp. 4510–4520. [Google Scholar]
- Tan, M.; Le, Q. EfficientNet: Rethinking model scaling for convolutional neural networks. In Proceedings of the 36th International Conference on Machine Learning (ICML 2019), Long Beach, CA, USA, 9–15 June; 2019; pp. 6105–6114. [Google Scholar]
Disclaimer/Publisher’s Note: The statements, opinions and data contained in all publications are solely those of the individual author(s) and contributor(s) and not of MDPI and/or the editor(s). MDPI and/or the editor(s) disclaim responsibility for any injury to people or property resulting from any ideas, methods, instructions or products referred to in the content. |
© 2024 by the authors. Licensee MDPI, Basel, Switzerland. This article is an open access article distributed under the terms and conditions of the Creative Commons Attribution (CC BY) license (https://creativecommons.org/licenses/by/4.0/).