Satellite Remote Sensing False Forest Fire Hotspot Excavating Based on Time-Series Features
Abstract
1. Introduction
2. Materials and Methods
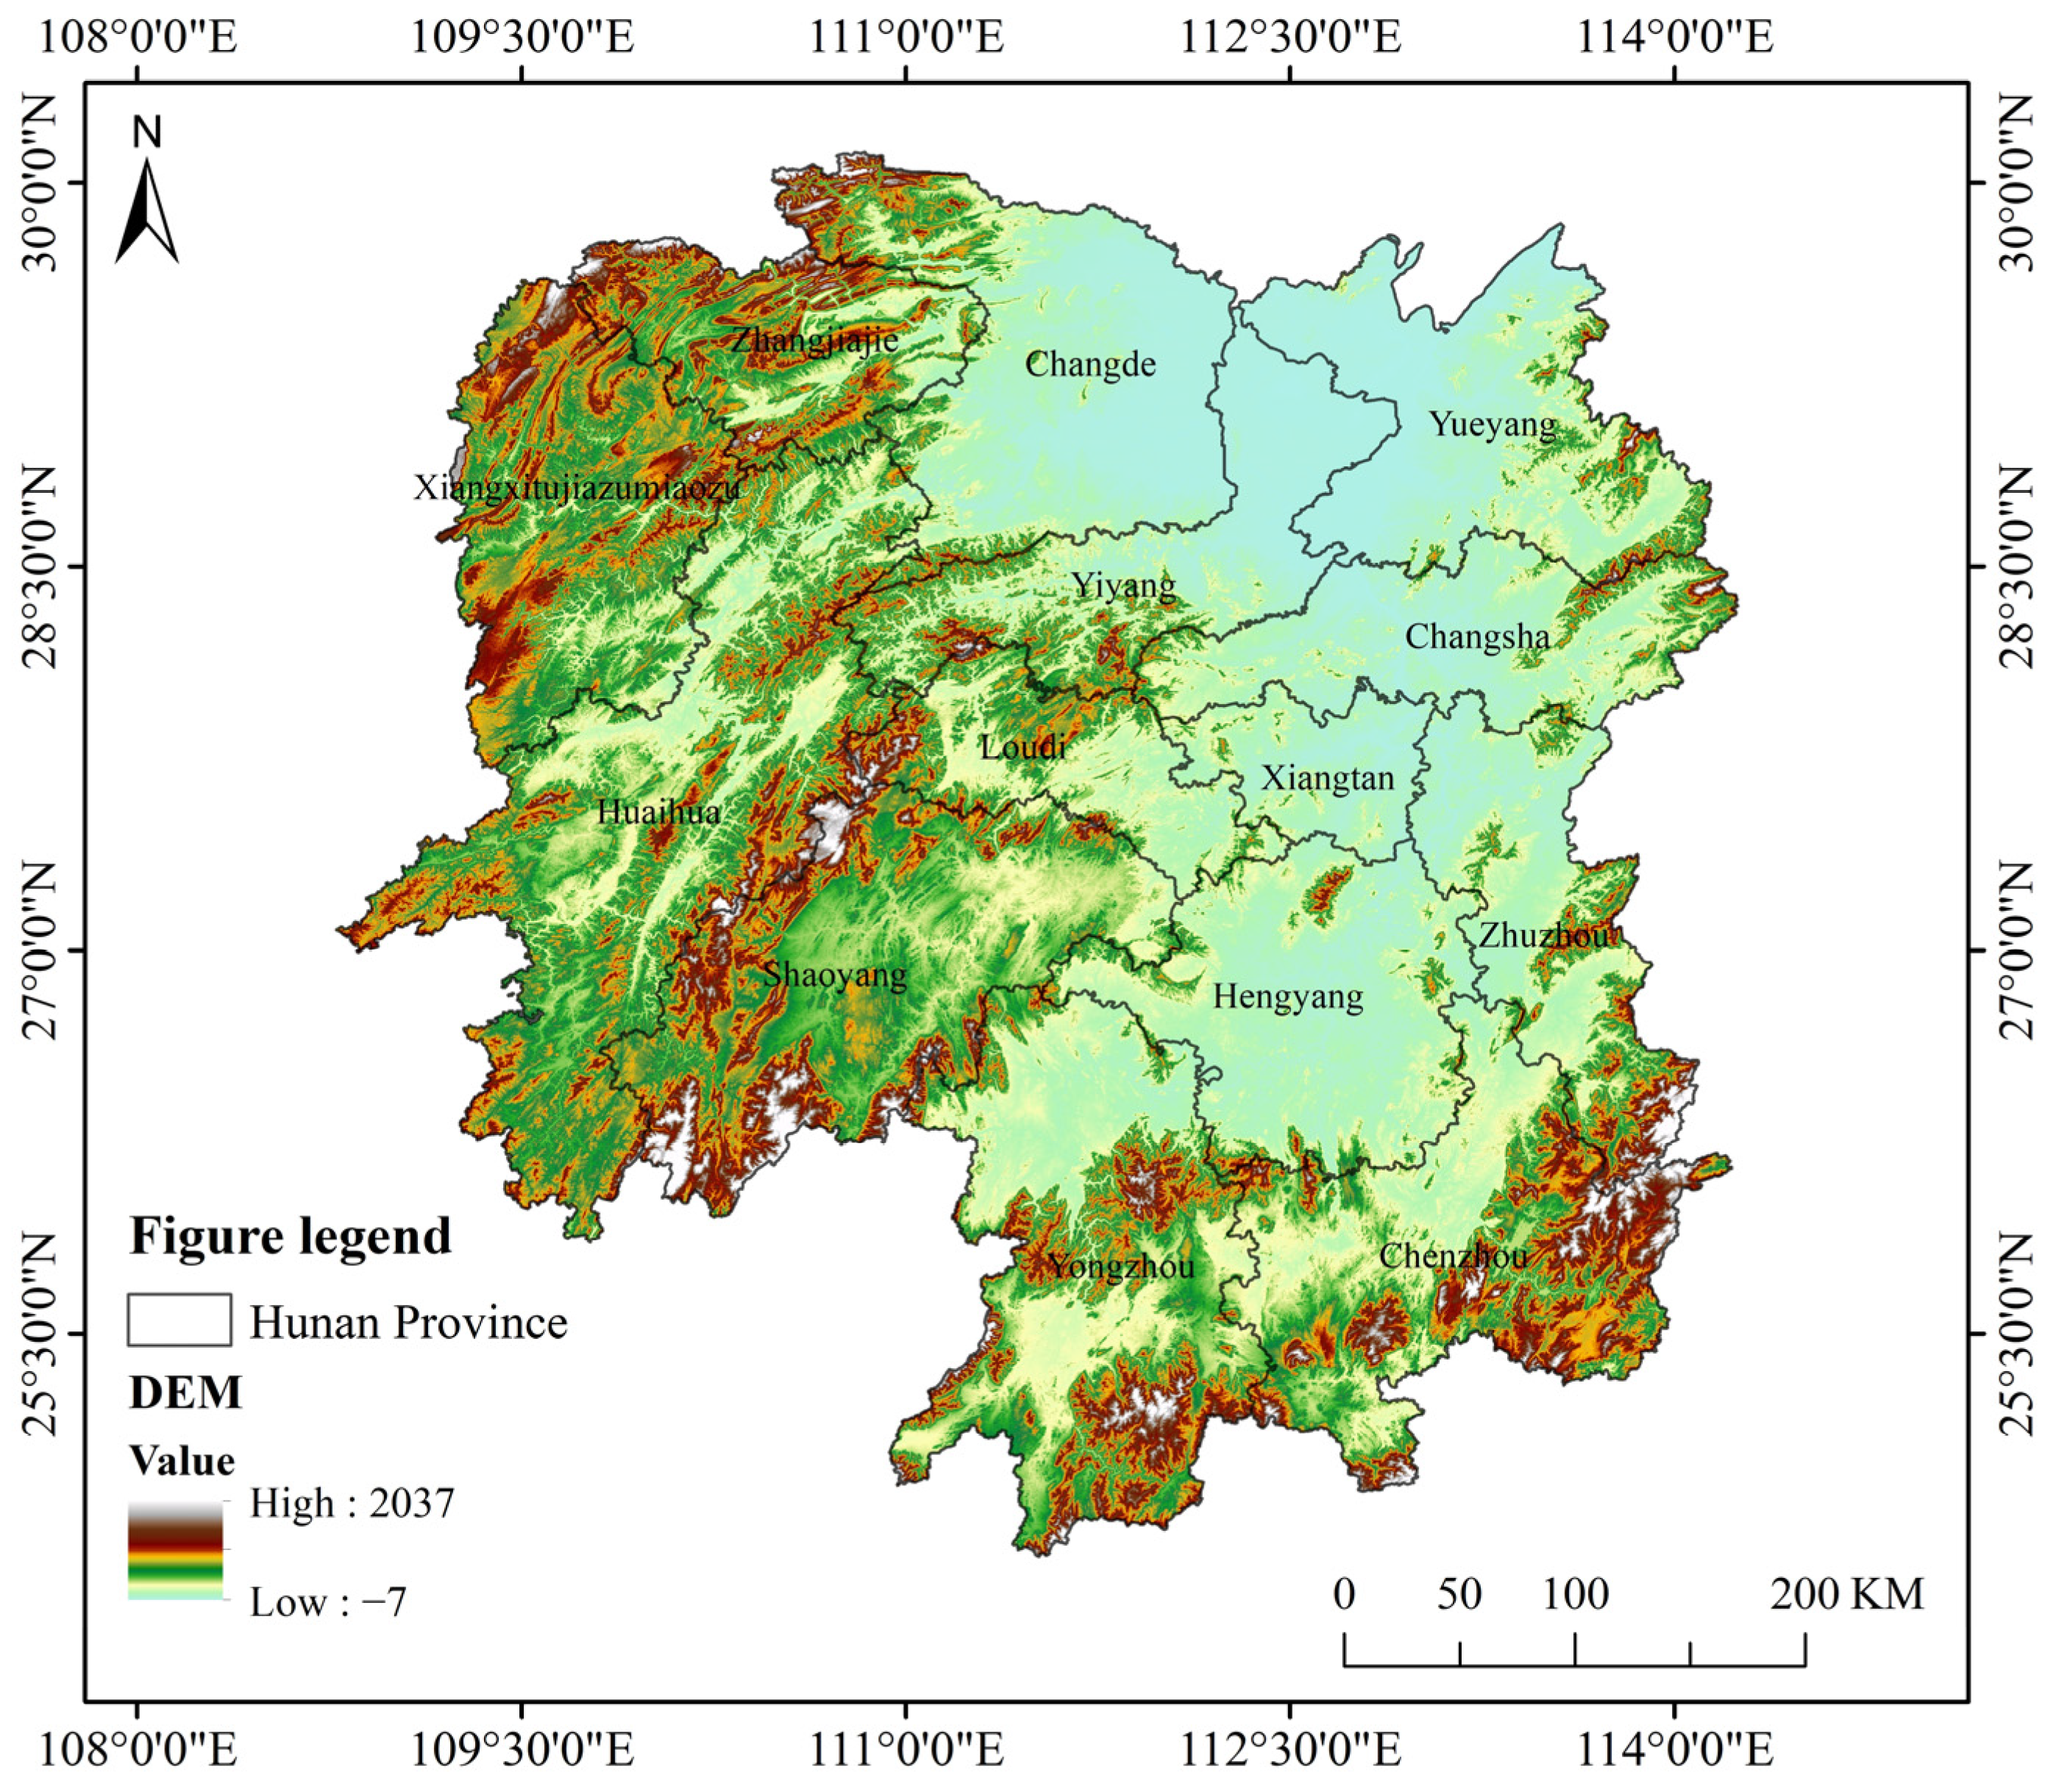
2.1. Study Area
2.2. Data and Processing
2.2.1. Satellite Data
2.2.2. Satellite Data Processing
2.3. Analysis of False Forest Fire Hotspots
- (1)
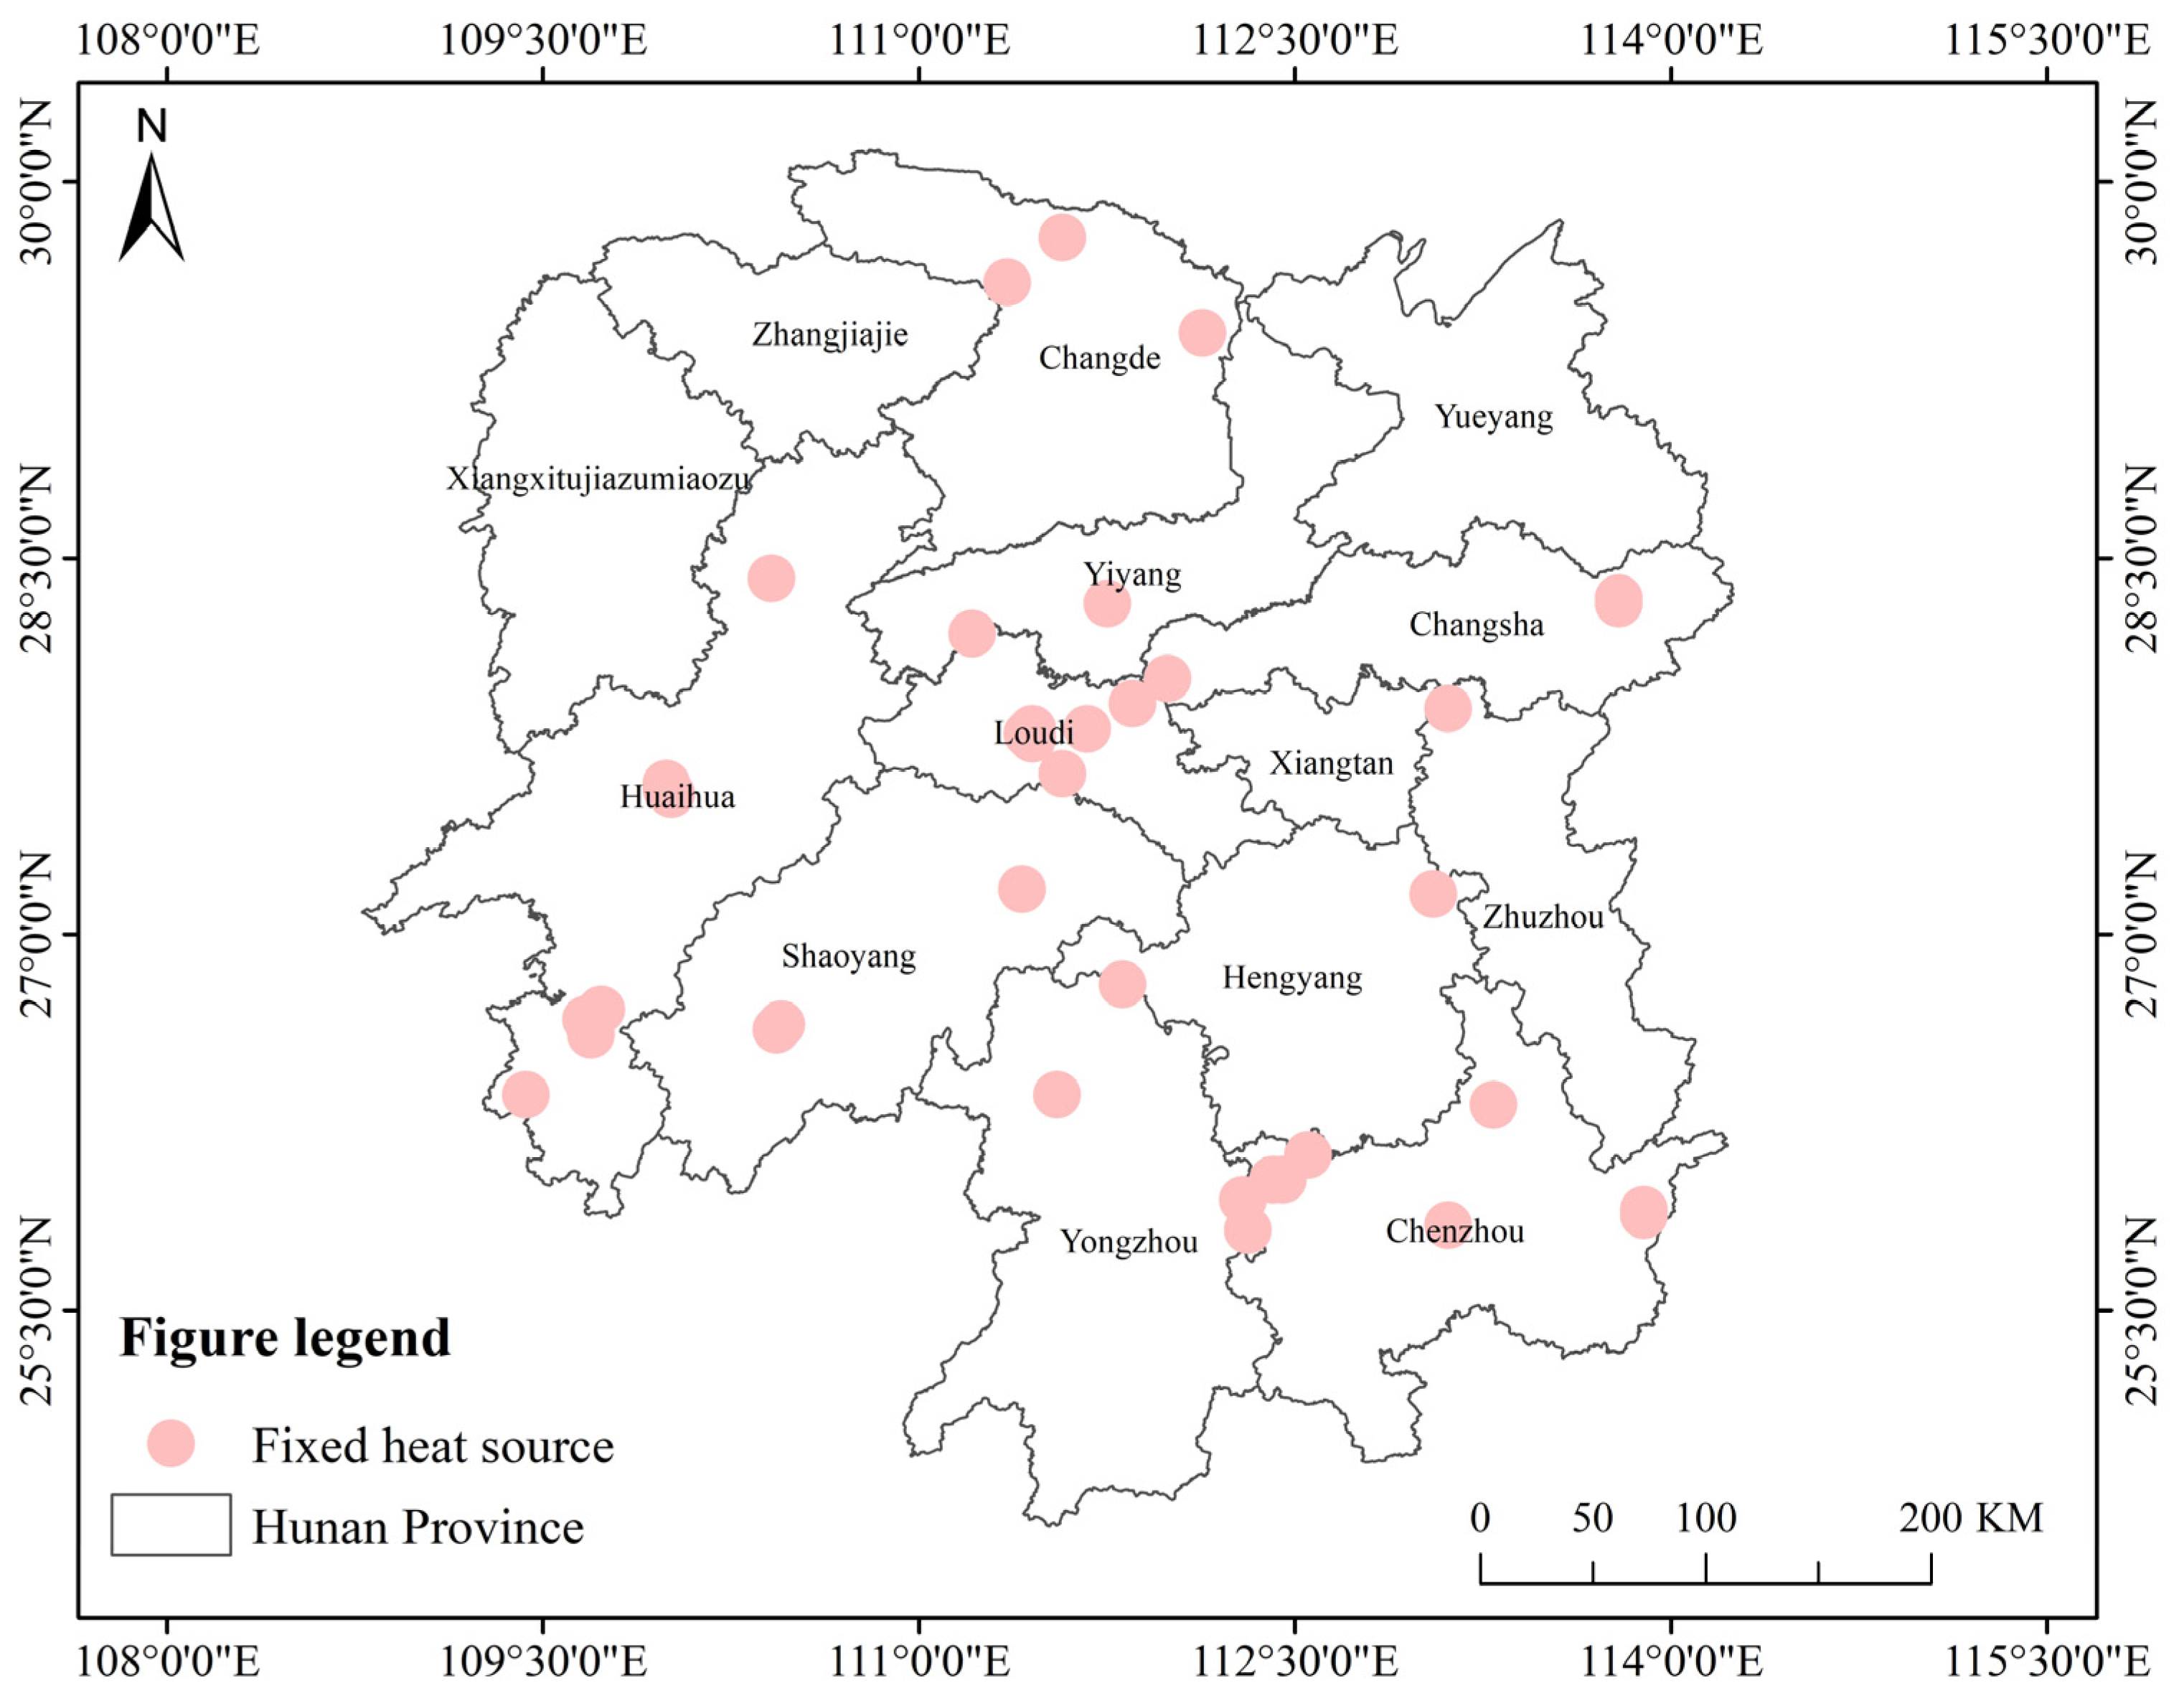
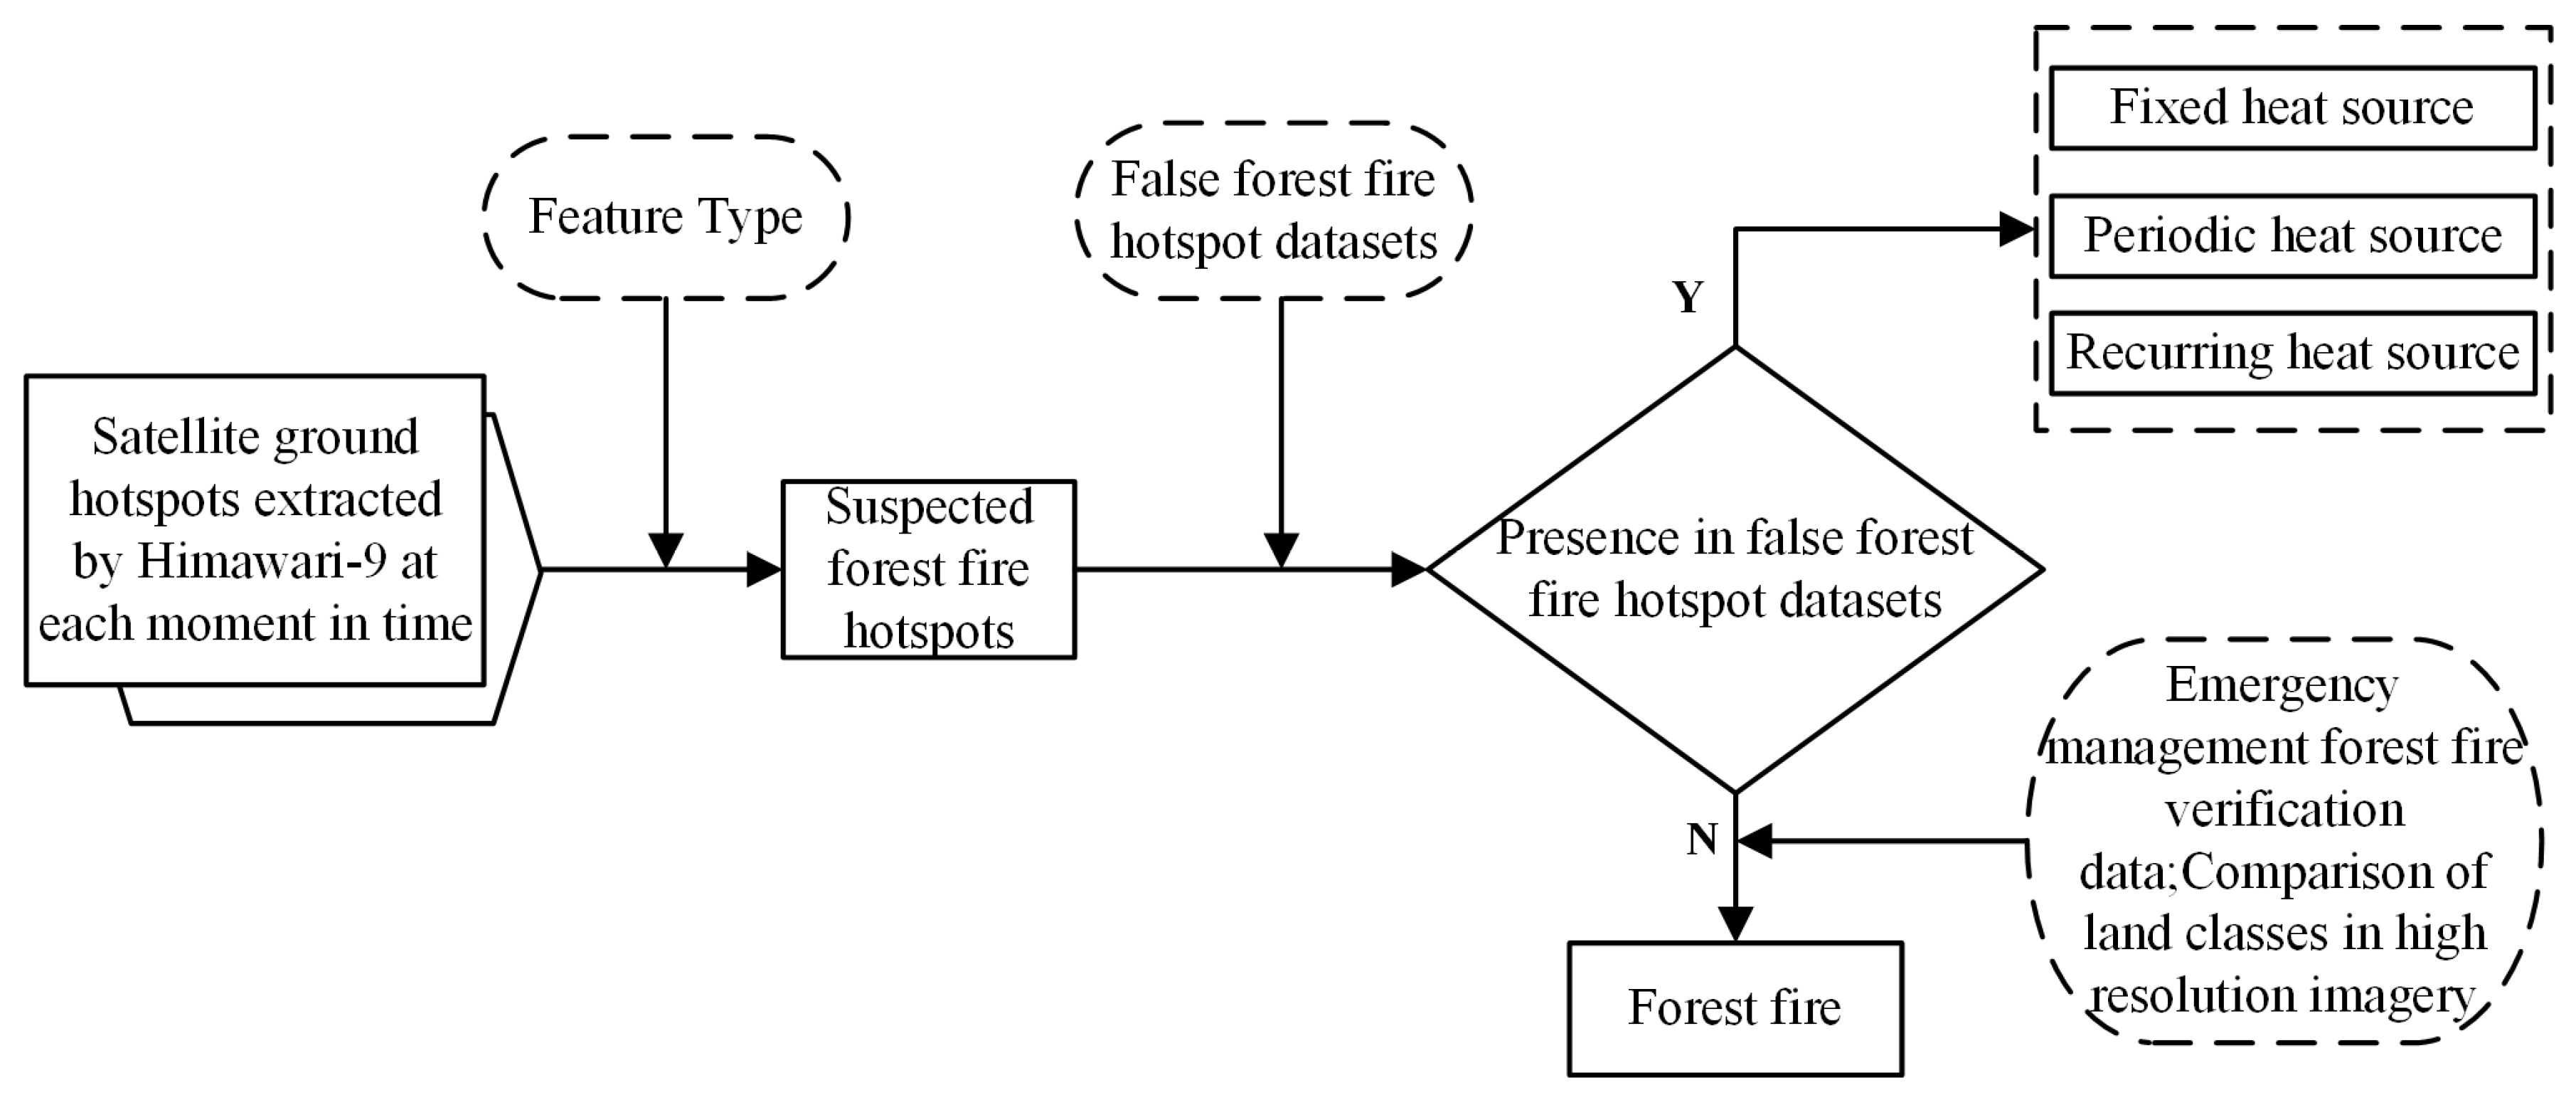
- Fixed heat source: Fixed heat sources in forests include dispersed small factories, forest barbecues and exposed rocks. These sources emit heat continuously and are geographically dispersed, making their positions difficult to pinpoint accurately. However, the continuous heat release from these hotspots aligns with satellite heat source extraction characteristics, leading to the identification of forest fire hotspots during satellite monitoring. Satellite ground hotspots extracted from forests over seven consecutive months are regarded as fixed heat sources.
- (2)
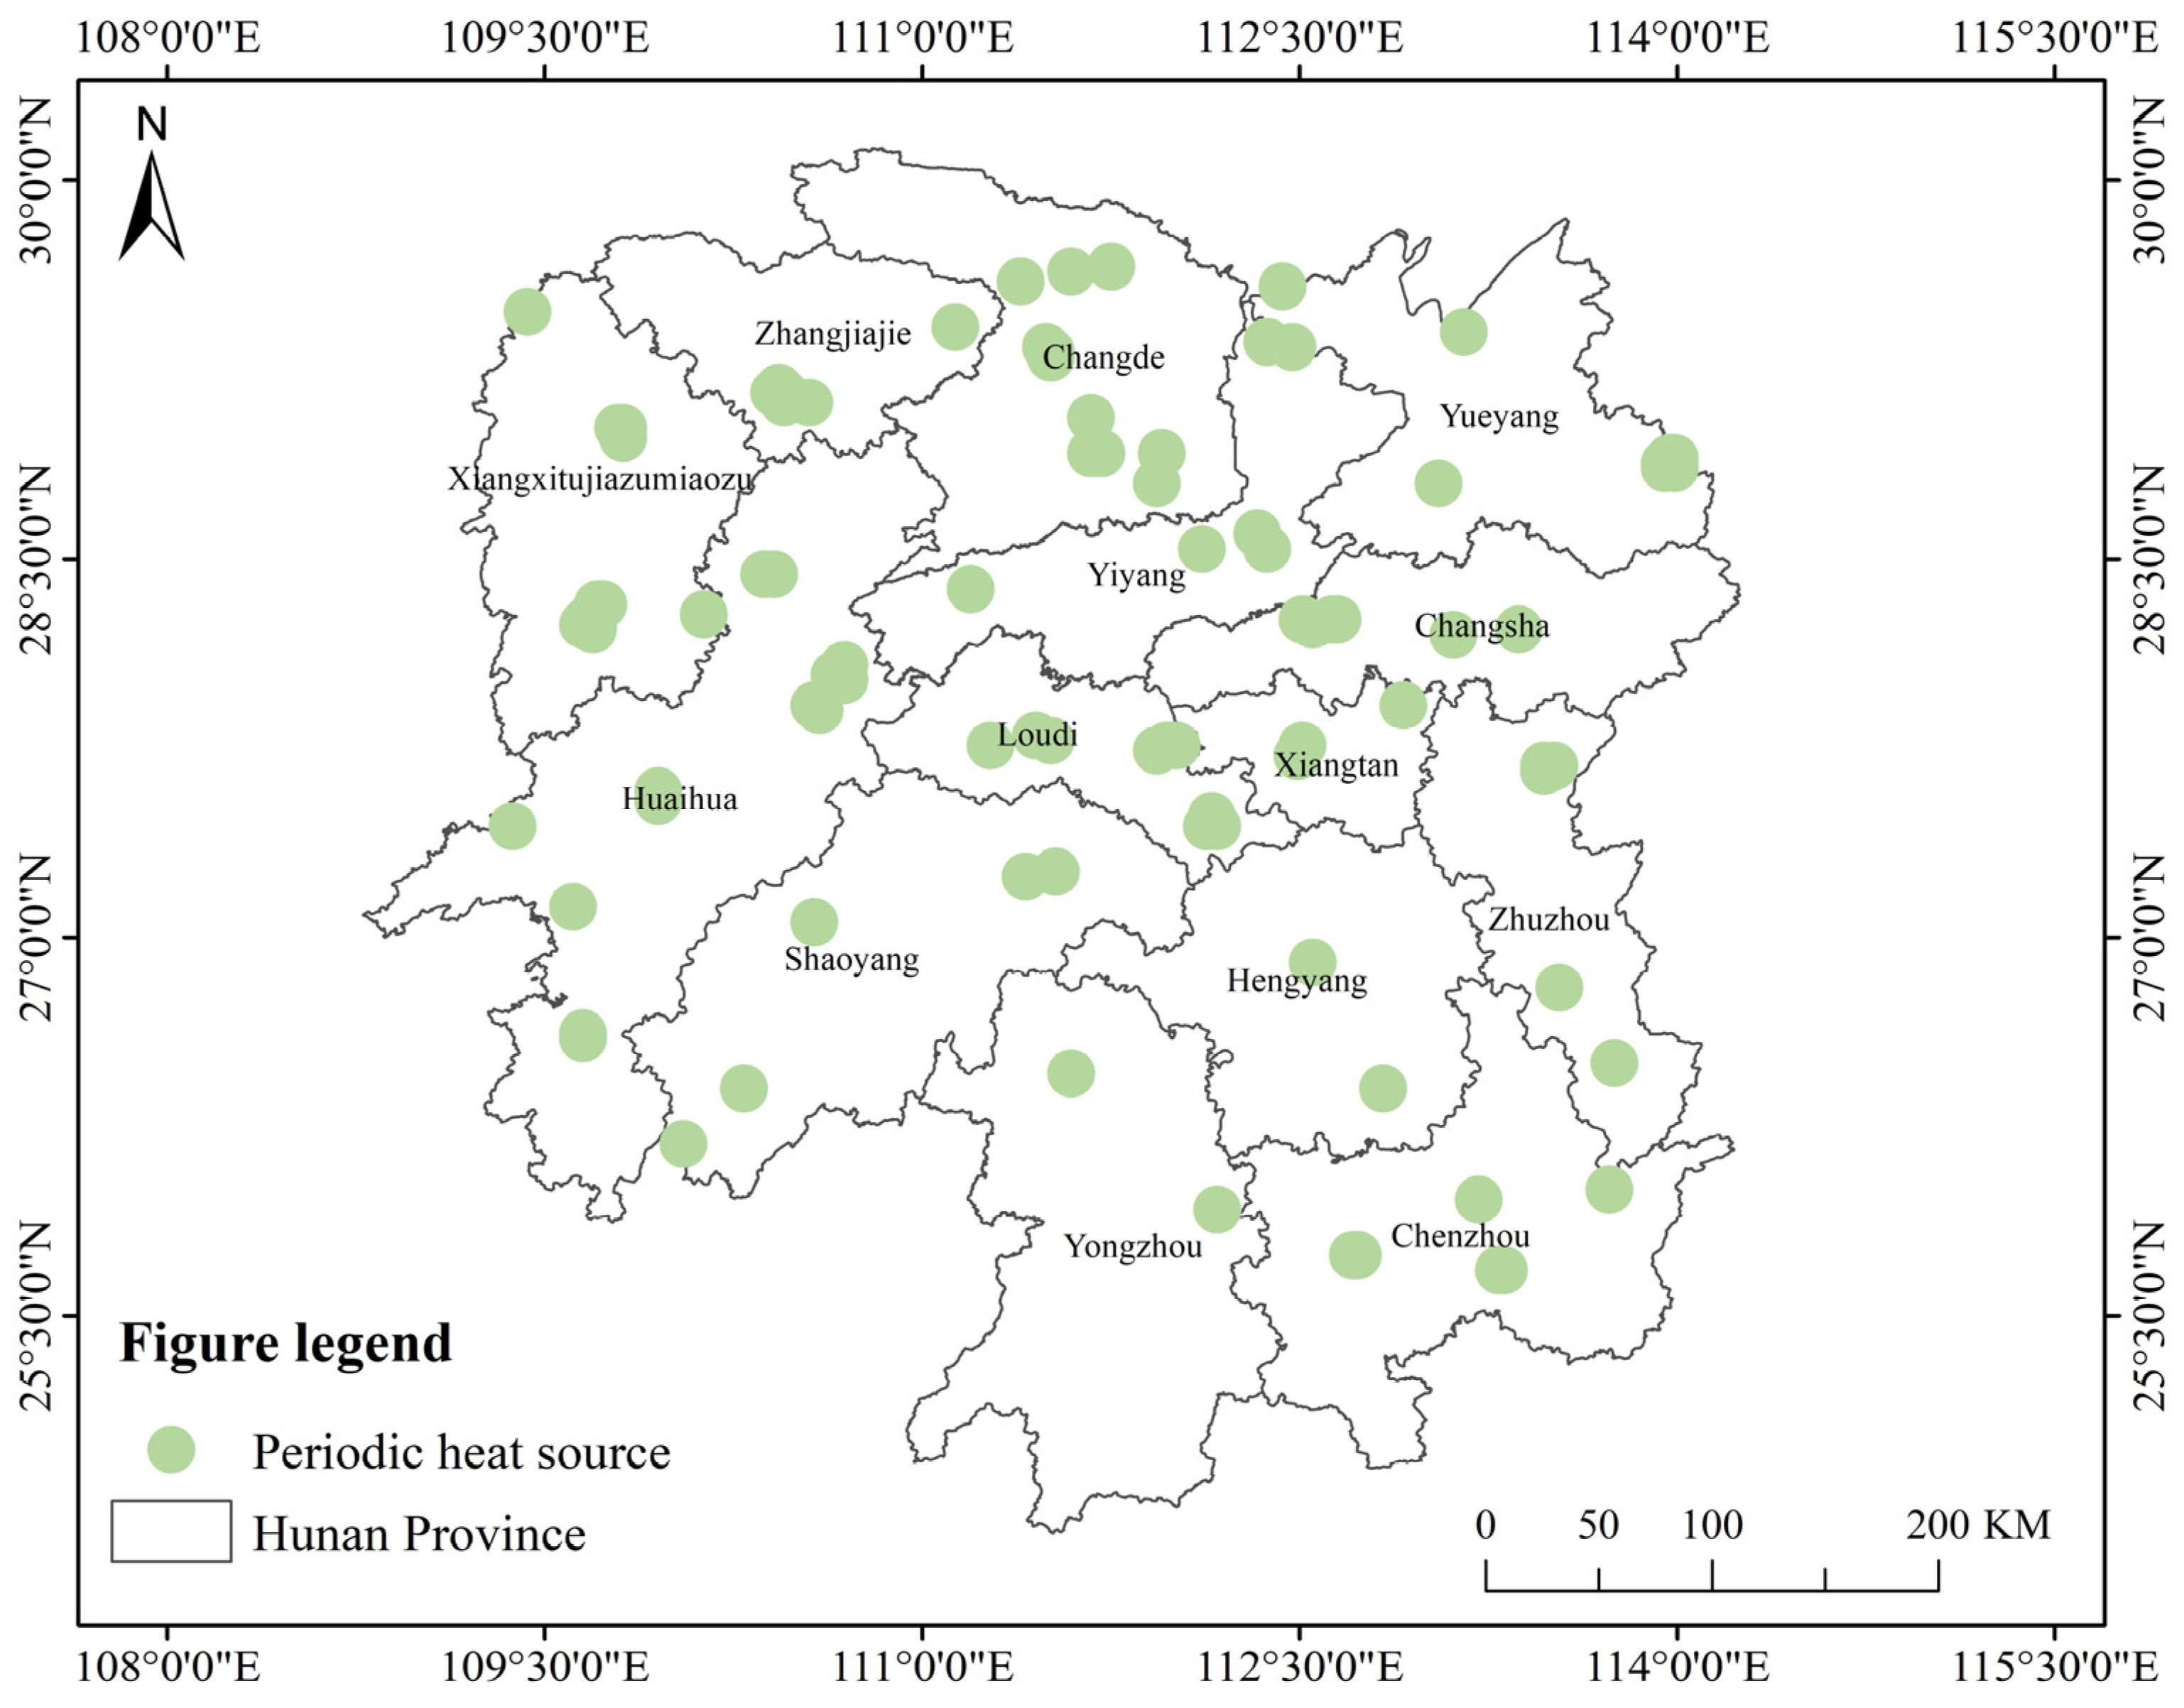
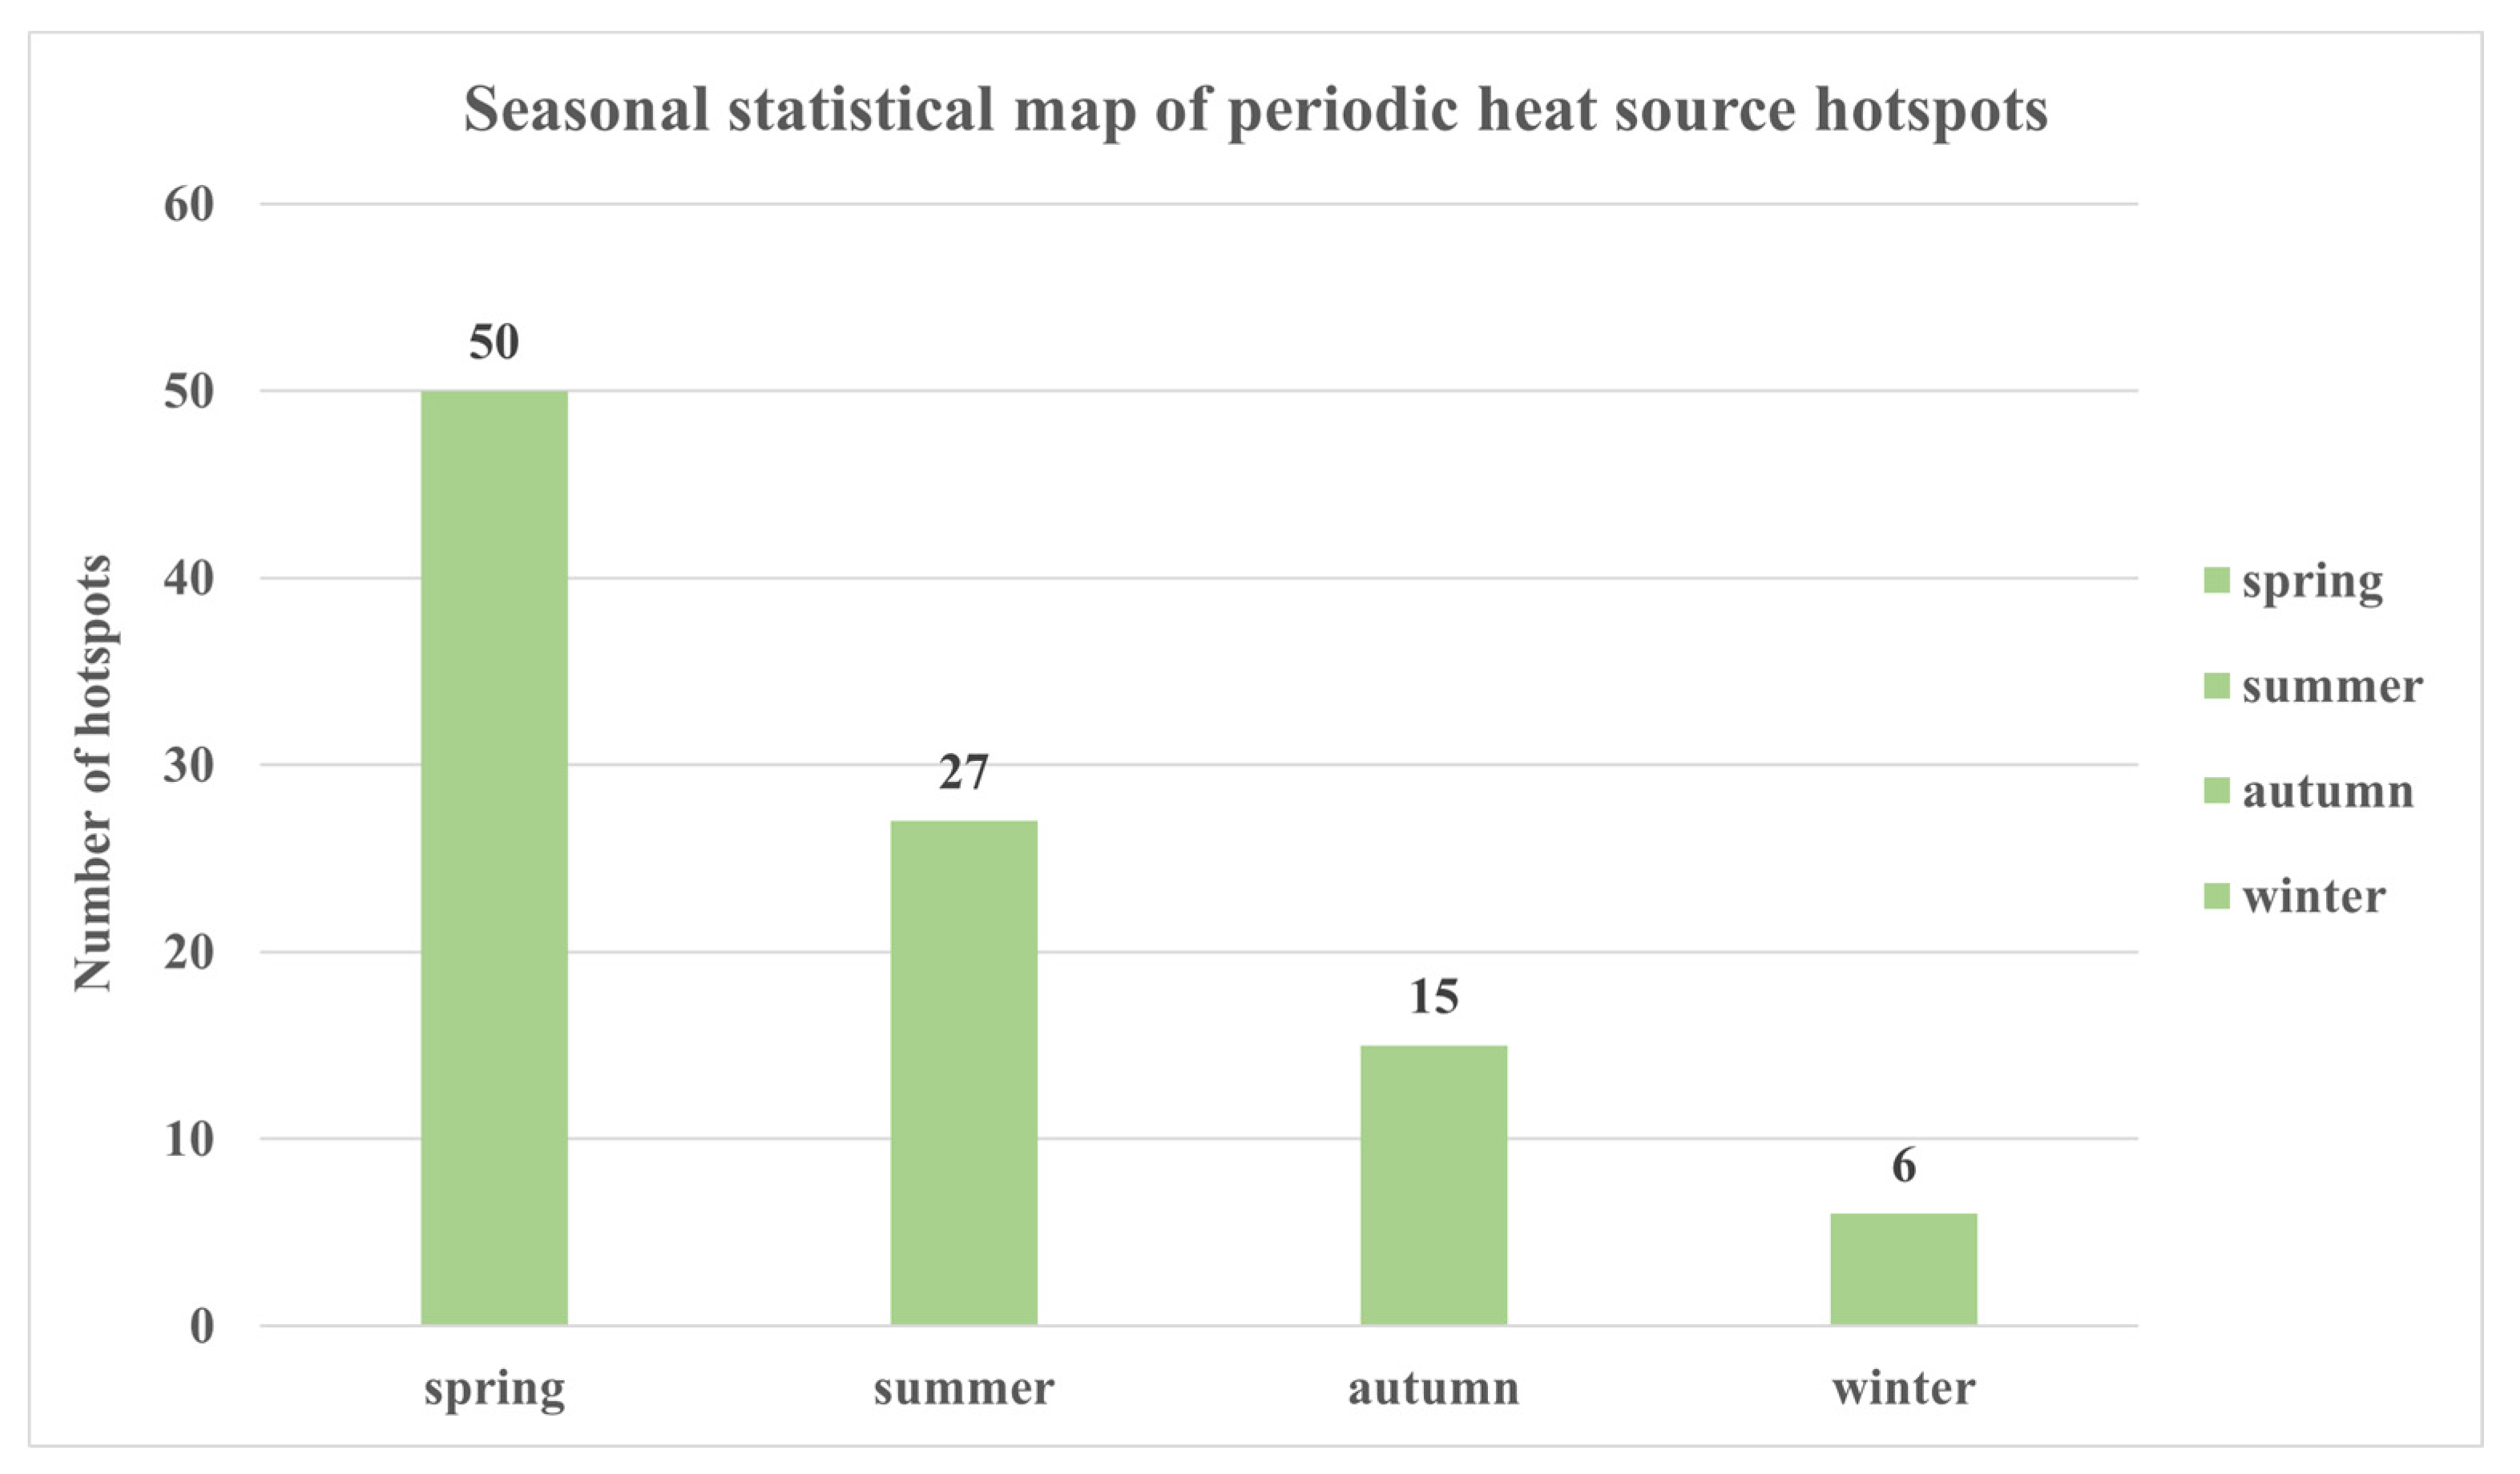
- Periodic heat source: Periodic heat sources in forests refer to satellite ground hotspots with seasonal characteristics, which appear in the same season annually and are relatively concentrated in location, producing heat source temperatures consistent with those extracted from satellite data. They are identified as forest fire hotspots during satellite monitoring. Satellite ground-based hotspots extracted consistently in the same season every year are classified as periodic heat sources.
- (3)
- Recurring heat source: Recurring heat sources in forests are irregularly occurring hot spots that often manifest in the same location. These include activities such as rubbish burning, kiln burning and brick burning. These heat sources typically exhibit irregular and frequent behavior across various time periods. However, their high temperatures can lead to misclassification as real forest fires during forest fire detection. In fact, they are false forest fire hotspots, which somewhat compromise the accuracy of forest fire monitoring. Satellite ground hotspots that have accumulated more than 11 different days in the excavated forest are classified as recurring heat sources.
2.4. Ground Object Classification Methods
2.5. Mining Methods
2.5.1. Sliding Window Algorithm
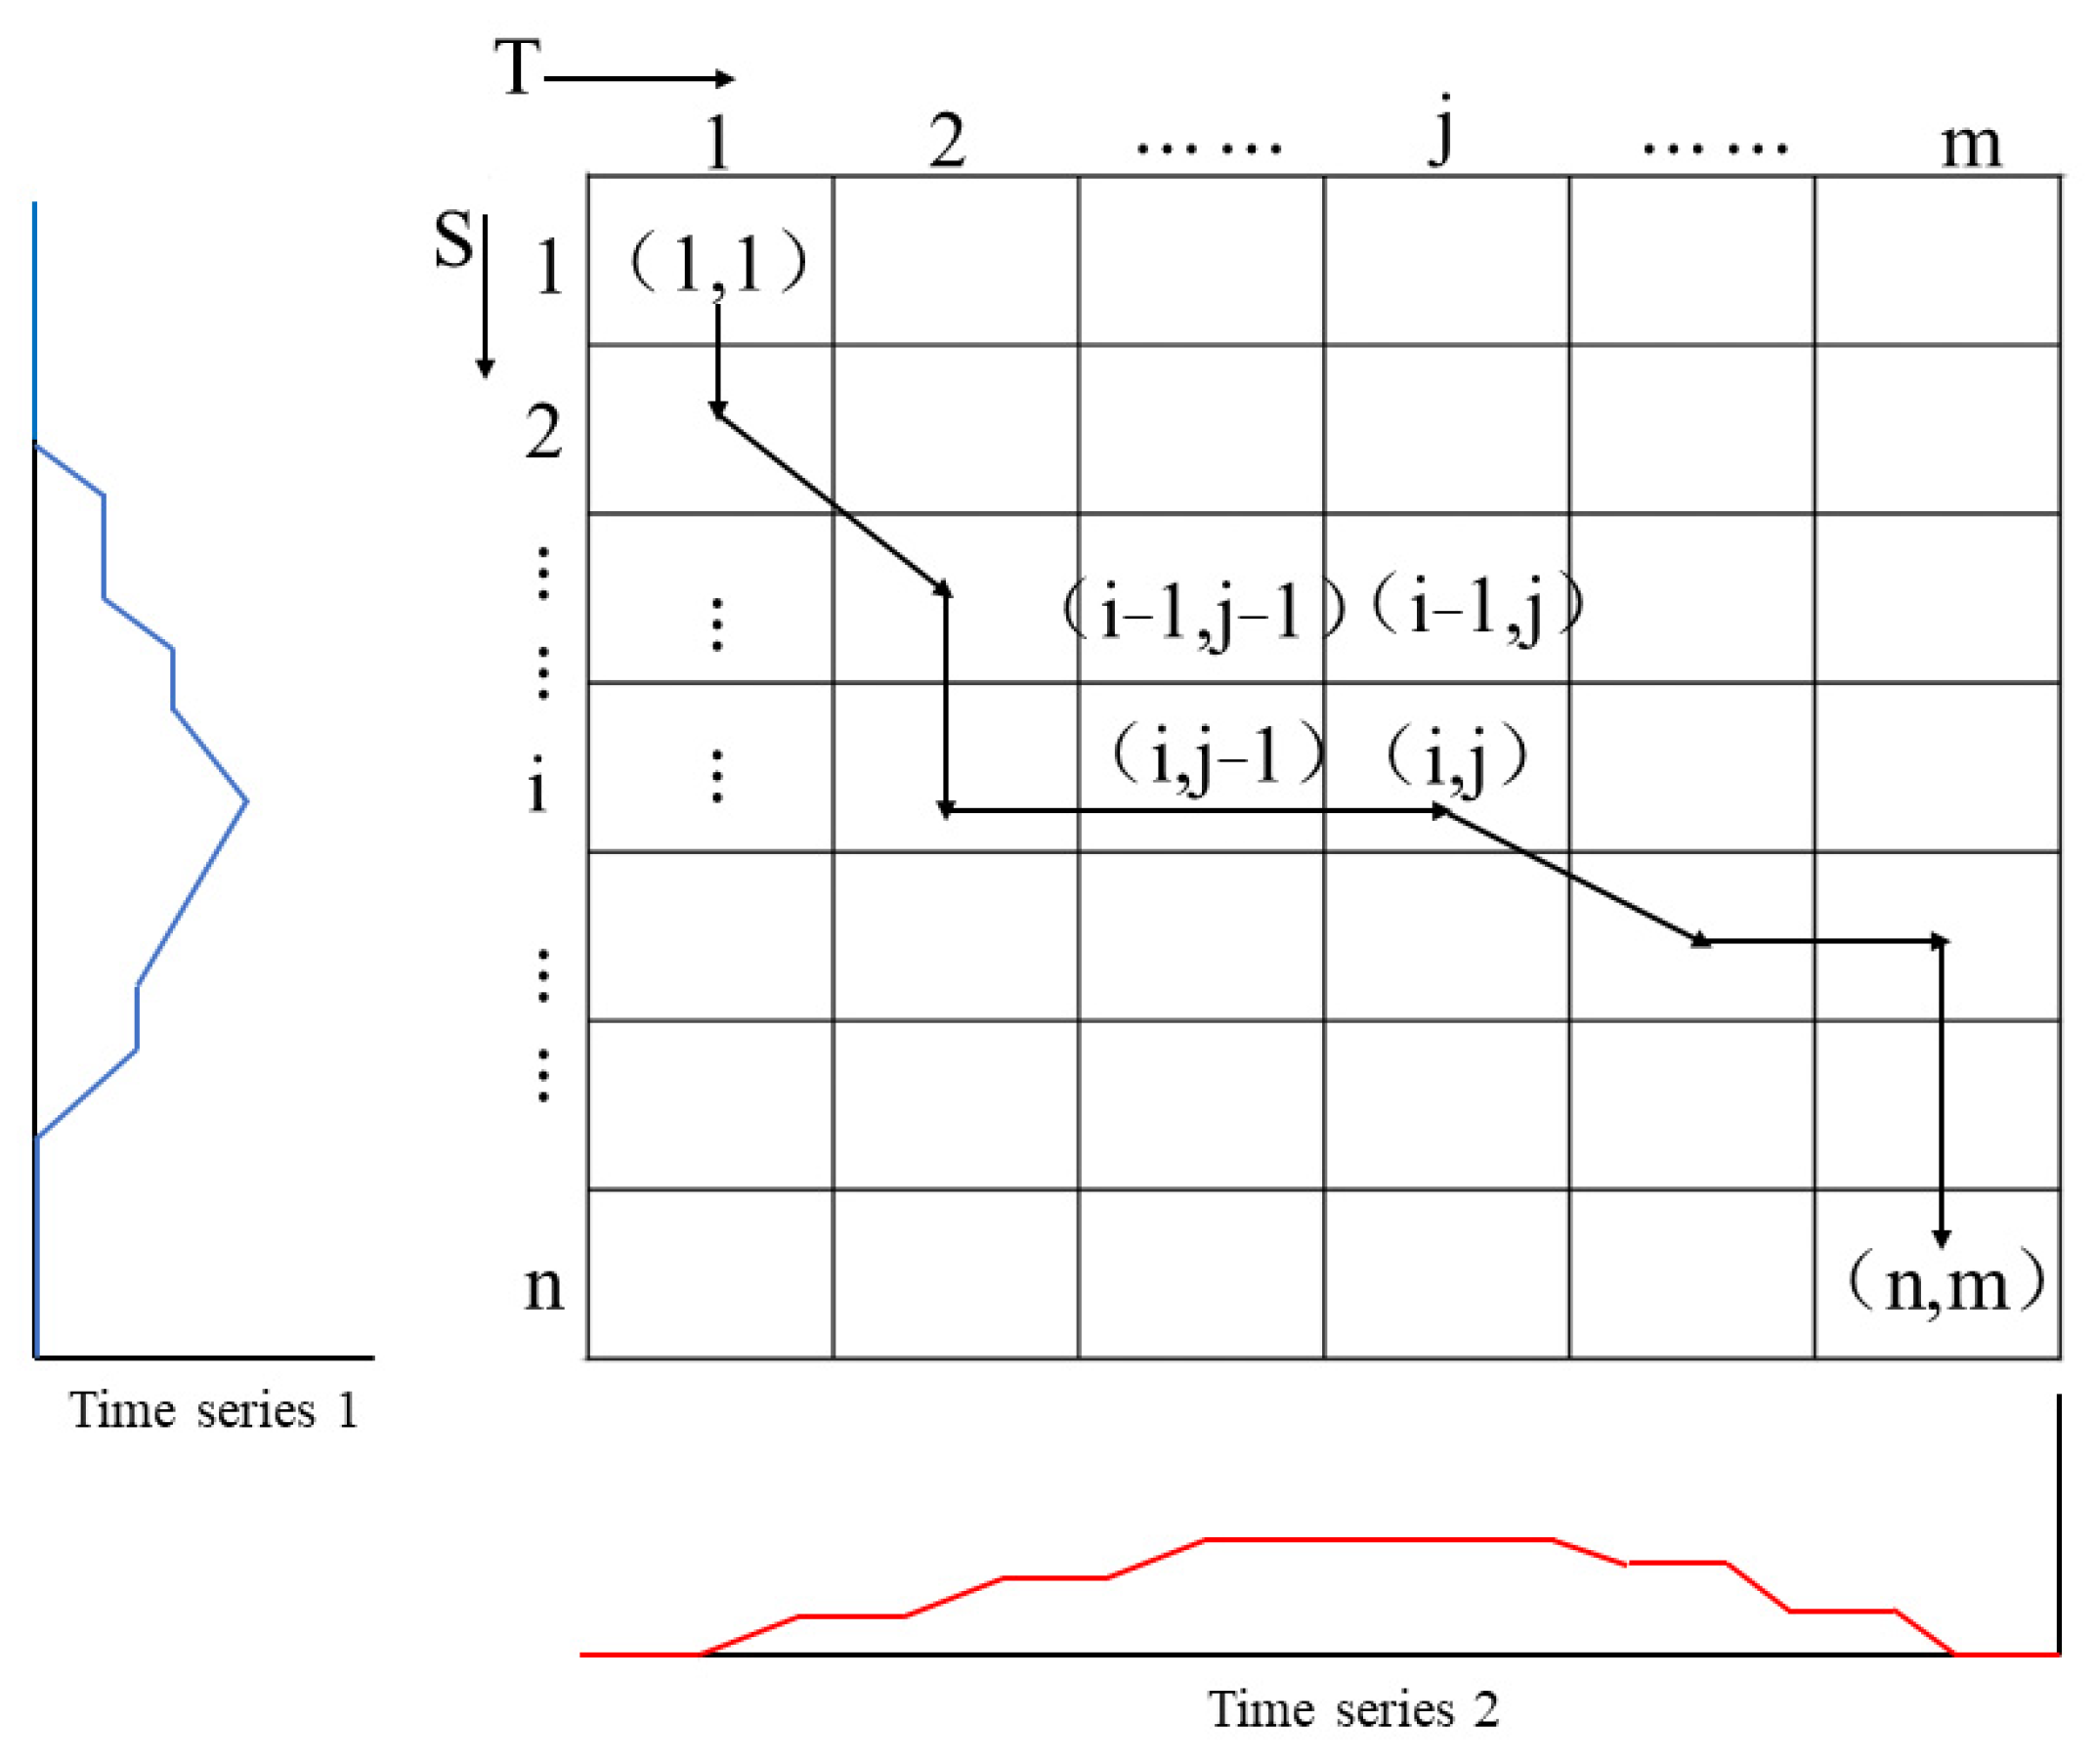
2.5.2. Dynamic Time Warping
- (1)
- Borderline: Any bending path must satisfy the condition where the starting point is and the ending point is , and the sequential order of the sequence cannot be altered during the construction of the optimal bending path using dynamic data bending.
- (2)
- Monotonicity: If and are two neighboring points on the curved path, then and must be satisfied to ensure that the alignment process of the time series always maintains a unidirectional and incremental character, preventing cross-correspondence.
- (3)
- Contiguity: If and are any two neighboring points on the bending path, then and must be satisfied, ensuring that the bending path can only move along the diagonal, horizontal or vertical directions, thus avoiding out-of-value matching.
2.5.3. Statistical Method
3. Results
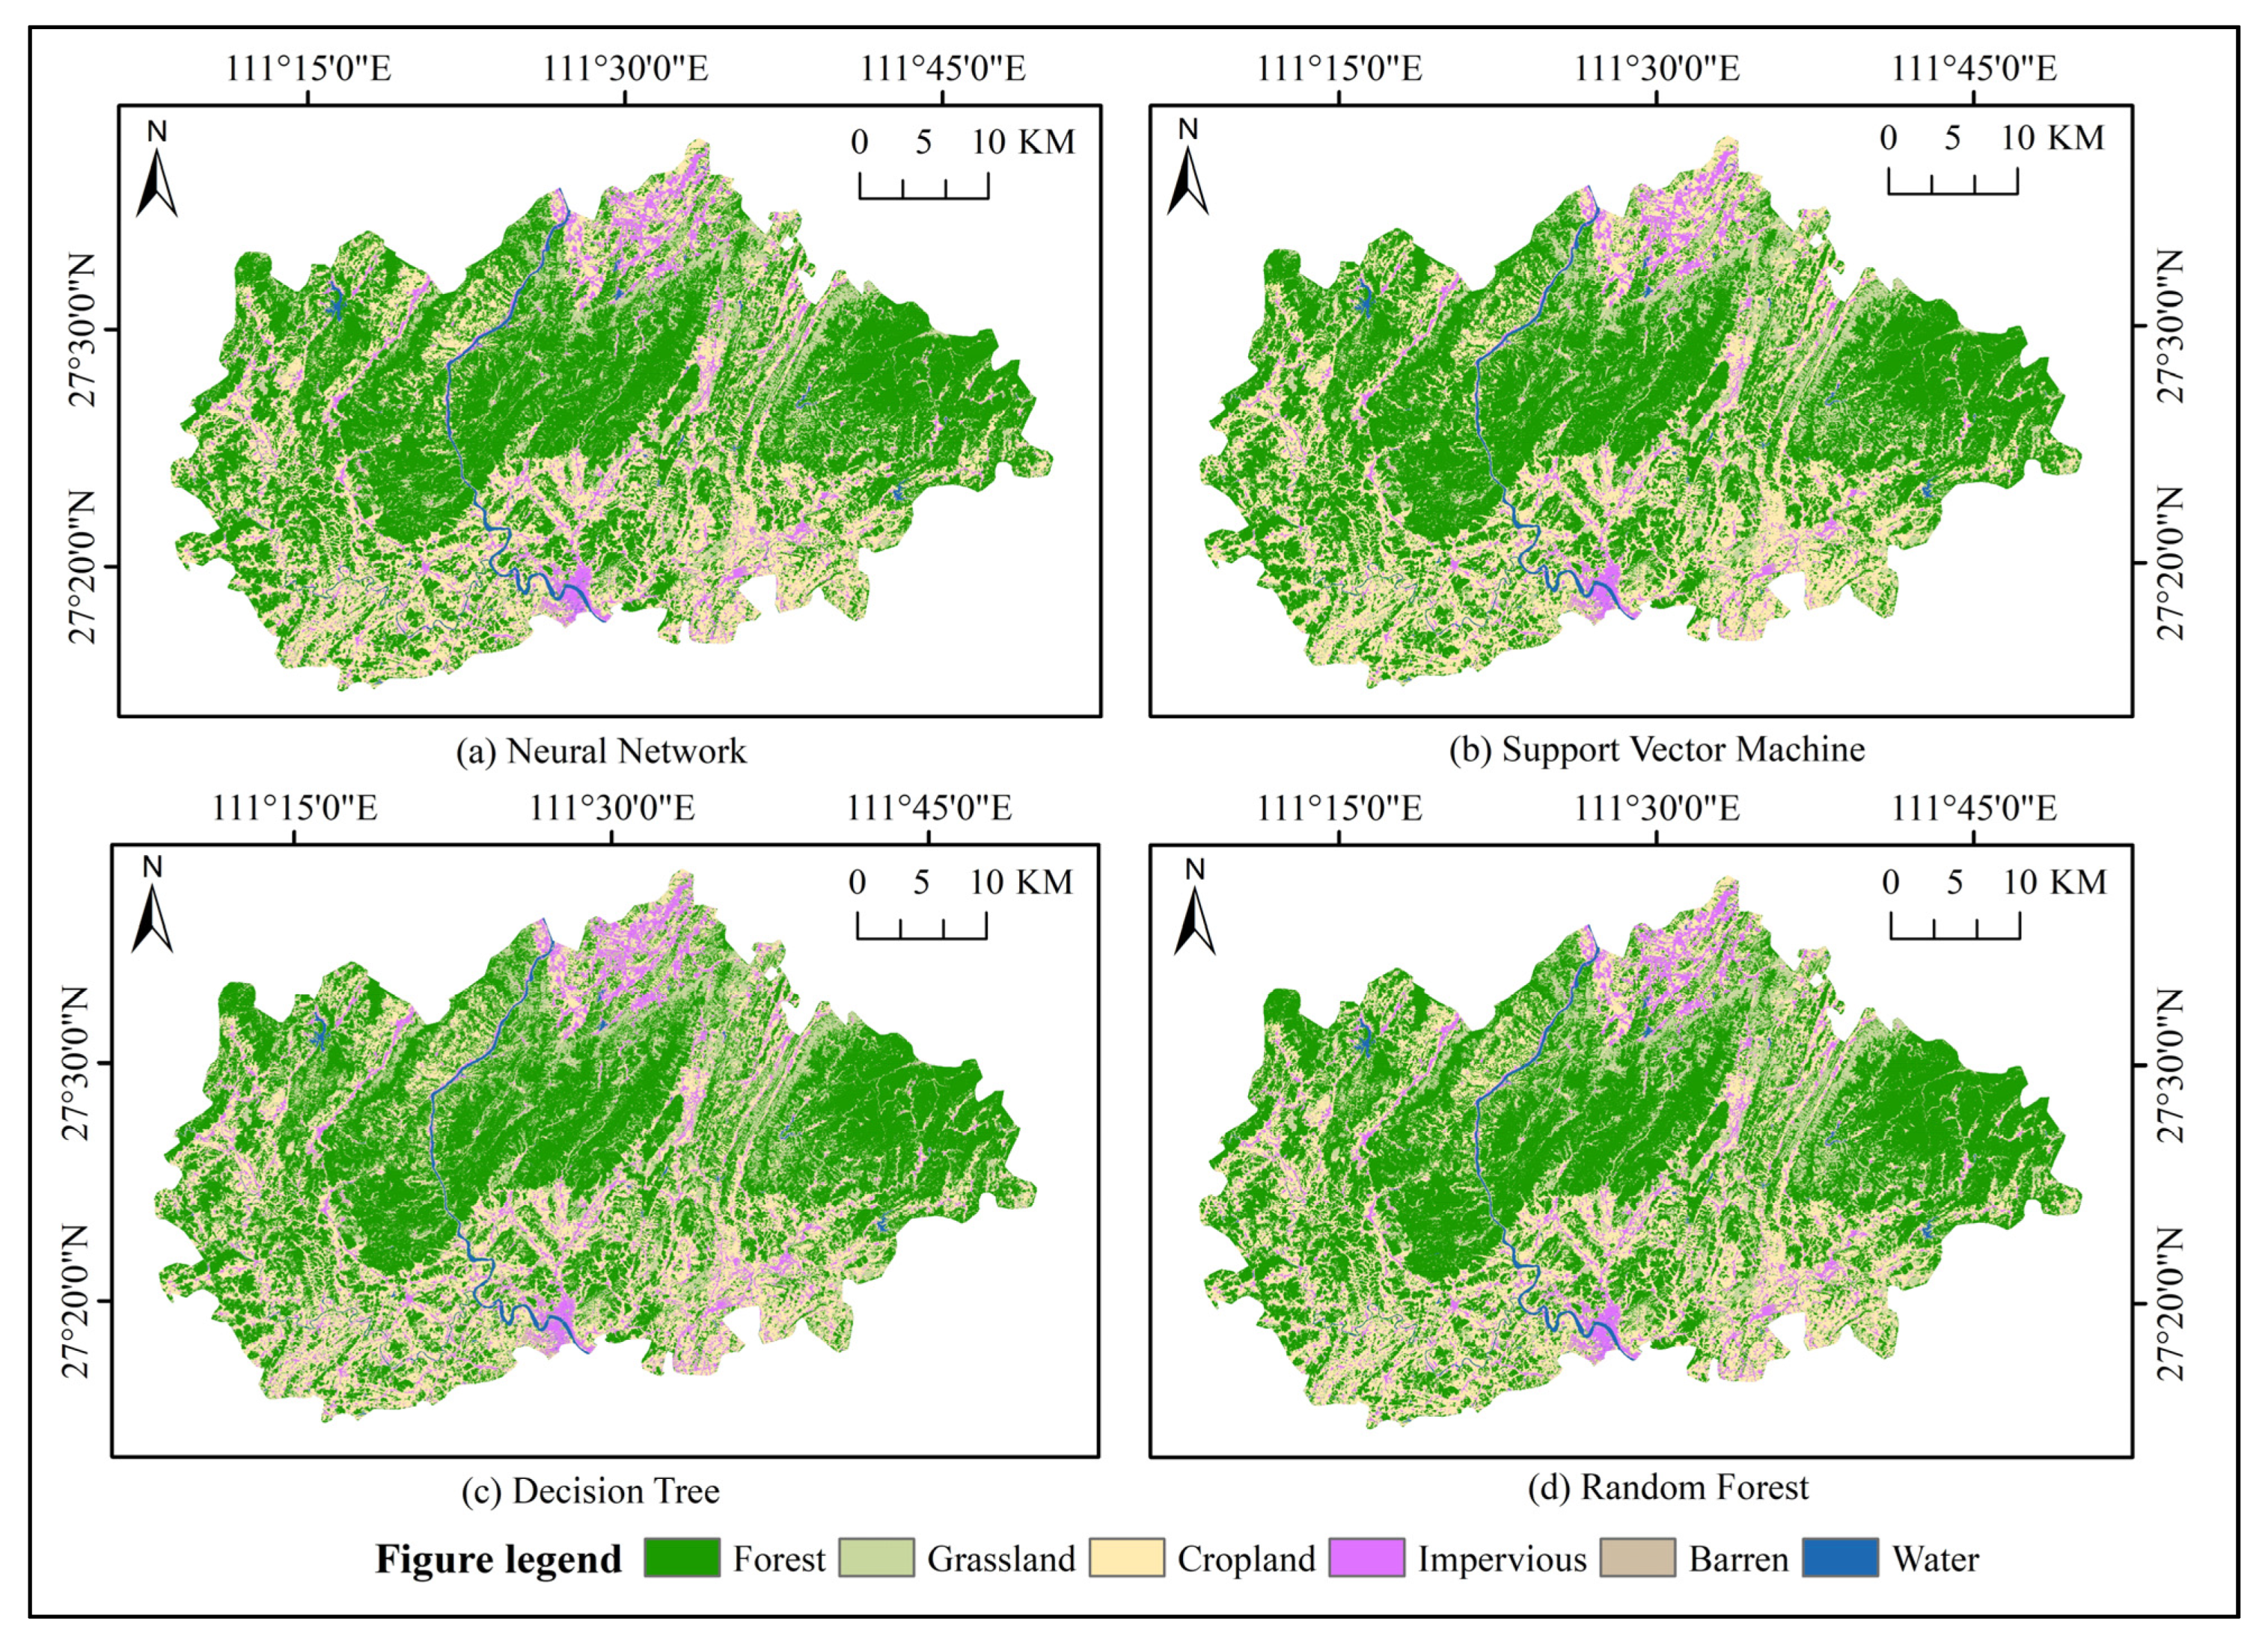
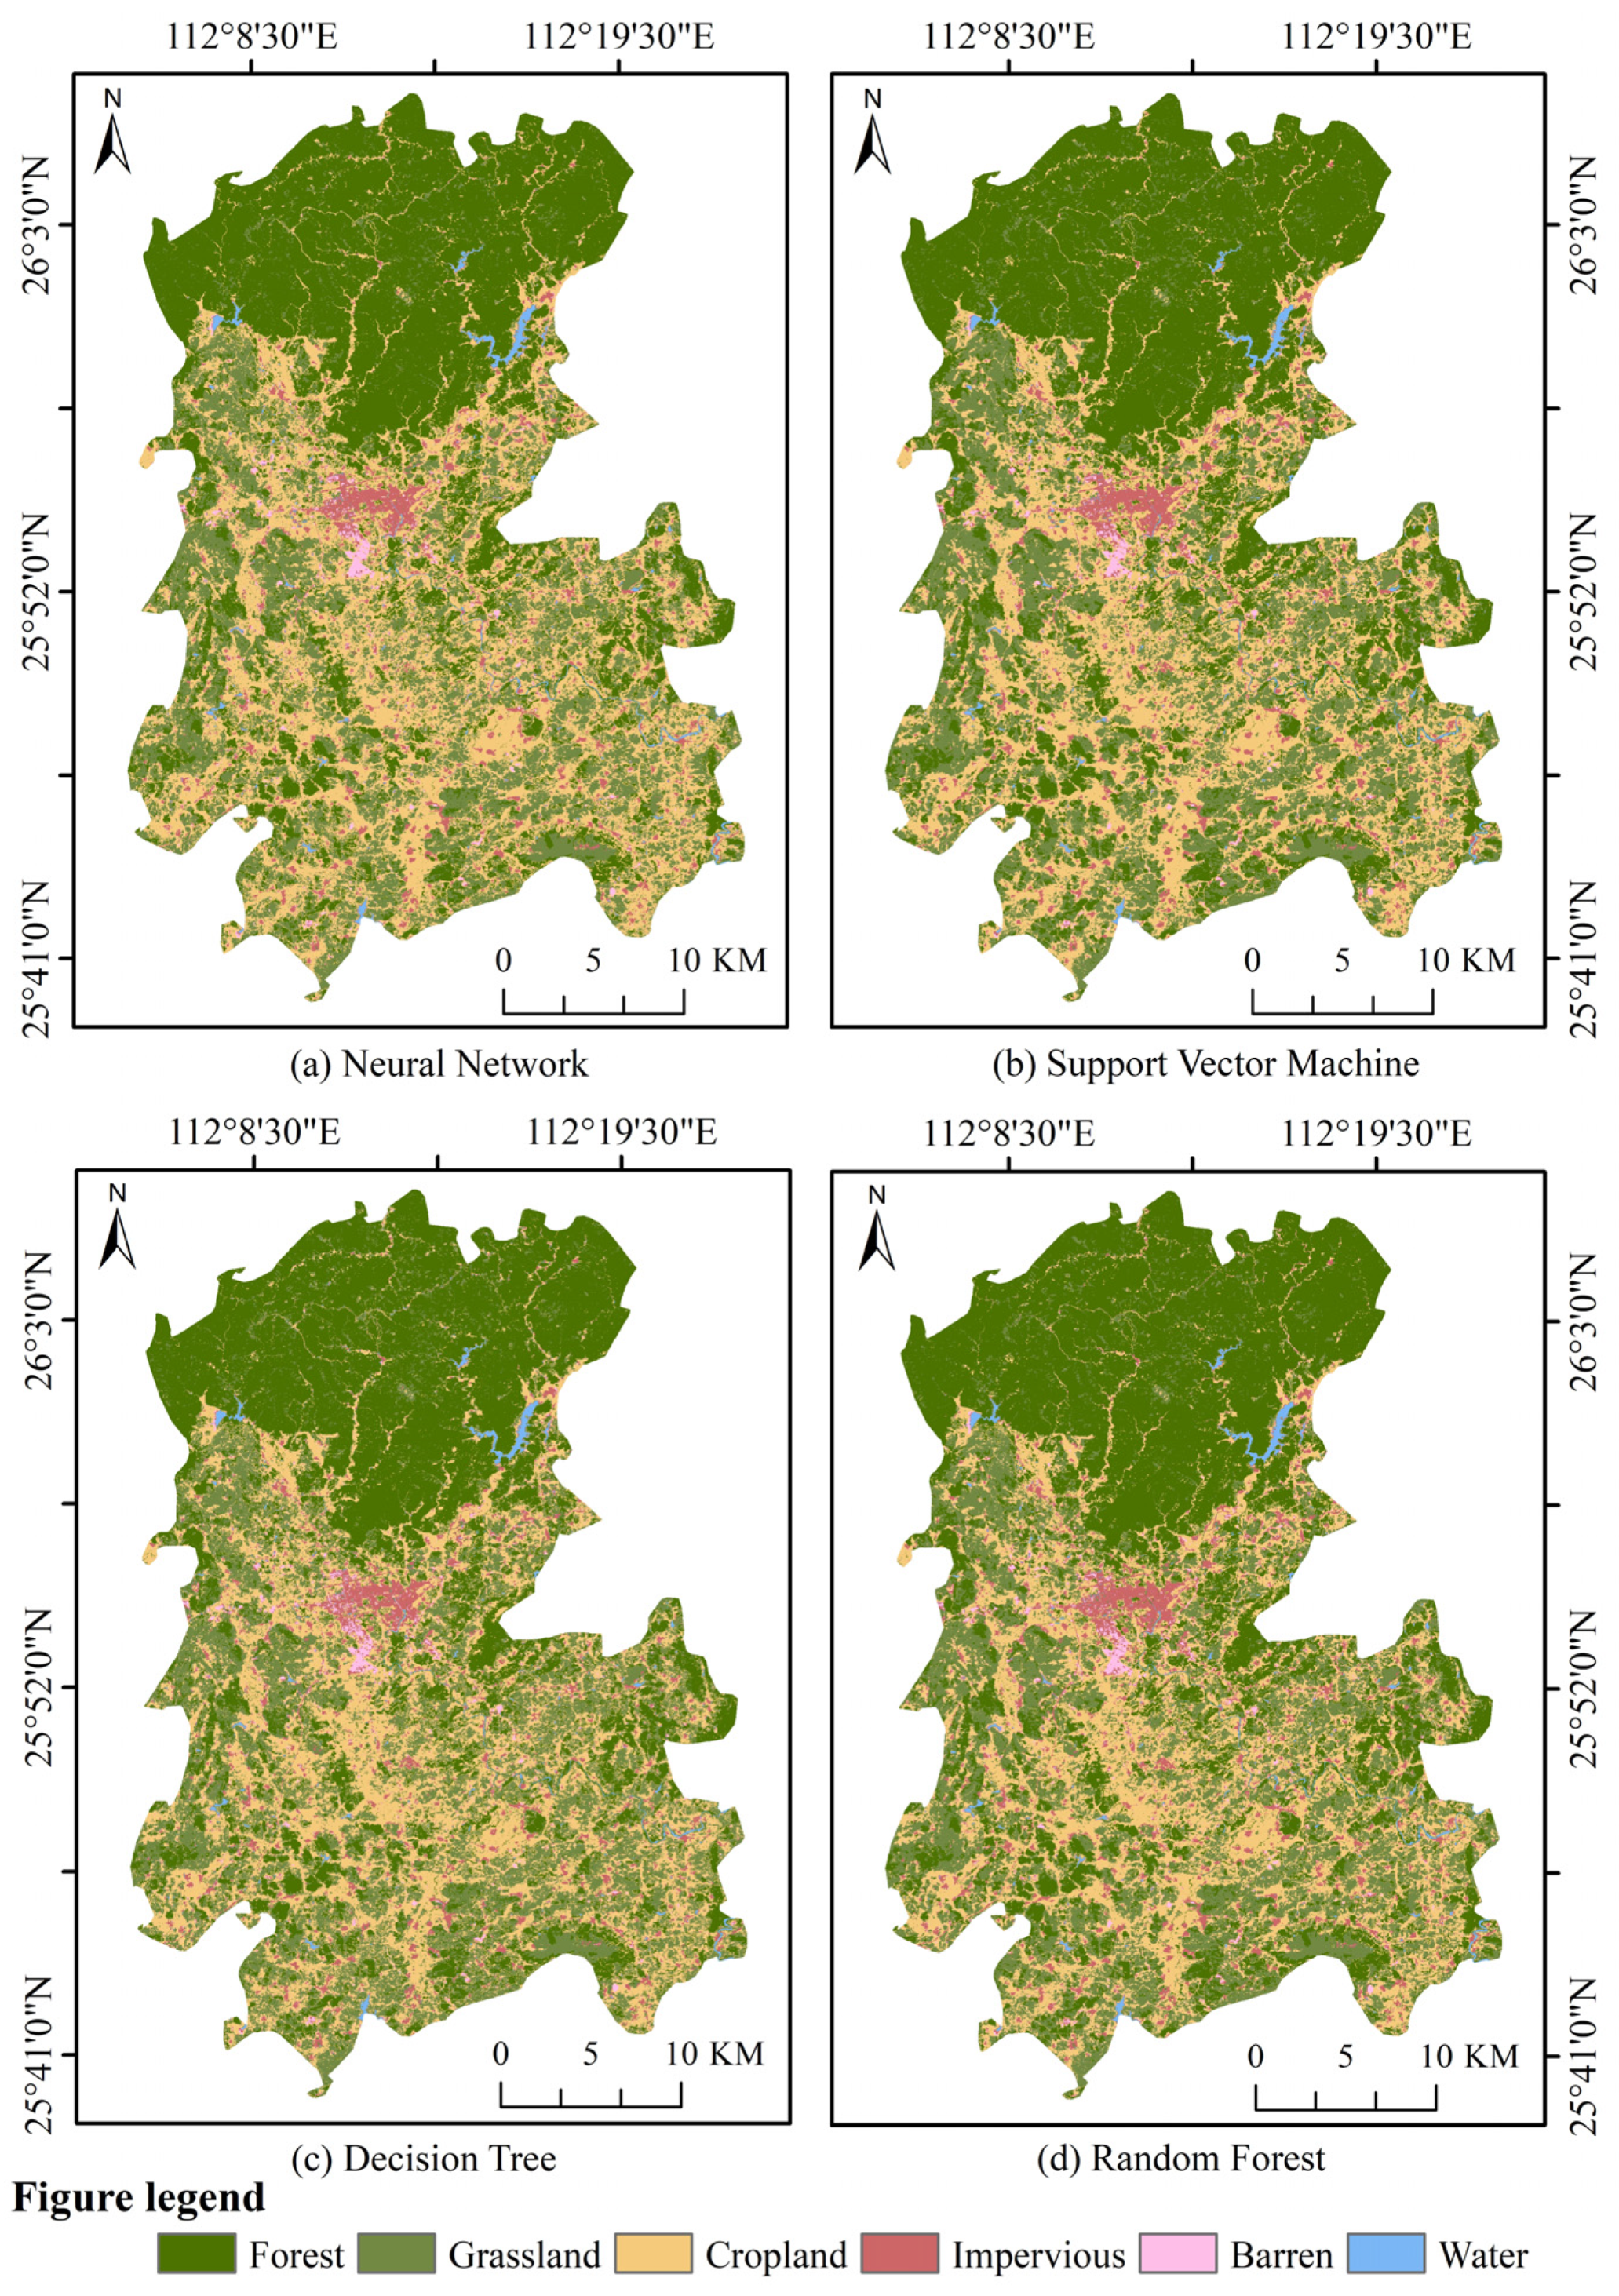
3.1. Ground Object Classification Results
3.2. Mining Results
3.2.1. Fixed Heat Source
3.2.2. Periodic Heat Source
3.2.3. Recurring Heat Source
3.2.4. Analysis of Result
3.3. Forest Fire Monitoring Application Case
4. Discussion
5. Conclusions
Author Contributions
Funding
Data Availability Statement
Acknowledgments
Conflicts of Interest
References
- Xu, H.; Zhang, G.; Zhou, Z.; Zhou, X.; Zhang, J.; Zhou, C. Development of a Novel Burned-Area Subpixel Mapping (BASM) Workflow for Fire Scar Detection at Subpixel Level. Remote Sens. 2022, 14, 3546. [Google Scholar] [CrossRef]
- Petitjean, F.; Inglada, J.; Gançarski, P. Satellite image time series analysis under time waring. IEEE Trans. Geosci. Remote Sens. 2012, 50, 3081–3095. [Google Scholar] [CrossRef]
- Wang, S.; Cao, J.; Philip, S.Y. Deep learning for spatio-temporal data mining: A survey. IEEE Trans. Knowl. Data Eng. 2020, 34, 3681–3700. [Google Scholar] [CrossRef]
- Atluri, G.; Karpatne, A.; Kumar, V. Spatio-temporal data mining: A survey of problems and methods. ACM Comput. Surv. 2018, 51, 1–41. [Google Scholar] [CrossRef]
- Joshi, K.P.; Adhikari, G.; Bhattarai, D.; Adhikari, A.; Lamichanne, S. Forest fire vulnerability in Nepal’s chure region: Investigating the influencing factors using generalized linear model. Heliyon 2024, 10, E28525. [Google Scholar] [CrossRef]
- Ying, L.; Han, J.; Du, Y.; Shen, Z. Forest fire characteristics in China: Spatial patterns and determinants with thresholds. For. Ecol. Manag. 2018, 424, 345–354. [Google Scholar] [CrossRef]
- Wijayanto, A.K.; Sani, O.; Kartika, N.D.; Herdiyeni, Y. Classification model for forest fire hotspot occurrences prediction using ANFIS algorithm. IOP Conf. Ser. Earth Environ. Sci. 2017, 54, 012059. [Google Scholar] [CrossRef]
- Xu, H.; Zhang, G.; Zhou, Z.; Zhou, X.; Zhou, C. Forest fire monitoring and positioning improvement at subpixel level: Application to himawari-8 fire products. Remote Sens. 2022, 14, 2460. [Google Scholar] [CrossRef]
- Zheng, Y.; Zhang, G.; Tan, S.; Yang, Z.; Wen, D.; Xiao, H. A forest fire smoke detection model combining convolutional neural network and vision transformer. Front. For. Glob. Chang. 2023, 6, 1136969. [Google Scholar] [CrossRef]
- Spoto, F.; Sy, O.; Laberinti, P.; Martimort, P.; Fernandez, V.; Colin, O.; Meygret, A. Overview of sentinel-2. In Proceedings of the International Geoscience and Remote Sensing Symposium, Igarss’12, Munich, Germany, 22–27 July 2012; pp. 1707–1710. [Google Scholar]
- Bessho, K.; Date, K.; Hayashi, M.; Ikeda, A.; Imai, T.; Inoue, H.; Yoshida, R. An introduction to Himawari-8/9—Japan’s new-generation geostationary meteorological satellites. J. Meteorol. Soc. Jpn. Ser. II 2016, 94, 151–183. [Google Scholar] [CrossRef]
- Feng, L.; Xiao, H.; Yang, Z.; Zhang, G. A Multiscale Normalization Method of a Mixed-Effects Model for Monitoring Forest Fires Using Multi-Sensor Data. Sustainability 2022, 14, 1139. [Google Scholar] [CrossRef]
- Karamizadeh, S.; Abdullah, S.M.; Halimi, M.; Shayan, J.; Javad Rajabi, M. Advantage and drawback of support vector machine functionality. In Proceedings of the 2014 International Conference on Computer, Communications, and Control Technology (I4CT), Langkawi, Malaysia, 2–4 September 2014; pp. 63–65. [Google Scholar]
- Safavian, S.R.; Landgrebe, D. A survey of decision tree classifier methodology. IEEE Trans. Syst. Man Cybern. 1991, 21, 660–674. [Google Scholar] [CrossRef]
- Breiman, L. Random forests. Mach. Learn. 2001, 45, 5–32. [Google Scholar] [CrossRef]
- Khiali, L.; Ndiath, M.; Alleaume, S.; Ienco, D.; Ose, K.; Teisseire, M. Detection of spatio-temporal evolutions on multi-annual satellite image time series: A clustering based approach. Int. J. Appl. Earth Obs. Geoinf. 2019, 74, 103–119. [Google Scholar] [CrossRef]
- Baldán, F.J.; Benítez, J.M. Complexity measures and features for times series classification. Expert Syst. Appl. 2023, 213, 119227. [Google Scholar] [CrossRef]
- Abanda, A.; Mori, U.; Lozano, J.A. A review on distance based time series classification. Data Min. Knowl. Discov. 2019, 33, 378–412. [Google Scholar] [CrossRef]
- Shatkay, H.; Zdonik, S.B. Approximate queries and representations for large data sequences. In Proceedings of the Twelfth International Conference on Data Engineering, New Orleans, LA, USA, 26 February–1 March 1996; pp. 536–545. [Google Scholar]
- Keogh, E.; Chakrabarti, K.; Pazzani, M.; Mehrotra, S. Dimensionality reduction for fast similarity search in large time series databases. Knowl. Inf. Syst. 2001, 3, 263–286. [Google Scholar] [CrossRef]
- Yi, B.K.; Jagadish, H.V.; Faloutsos, C. Efficient retrieval of similar time sequences under time waring. In Proceedings of the 14th International Conference on Data Engineering, Orlando, FL, USA, 23–27 February 1998; pp. 201–208. [Google Scholar]
- Sant’Anna, A.; Wickström, N. Symbolization of time-series: An evaluation of sax, persist, and aca. In Proceedings of the 2011 4th International Congress on Image and Signal Processing, Iwssip 2011, Shanghai, China, 15–17 October 2011; pp. 2223–2228. [Google Scholar]
- Guedes, E.F.; Zebende, G.F. DCCA cross-correlation coefficient with sliding windows approach. Phys. A Stat. Mech. Its Appl. 2019, 527, 121286. [Google Scholar] [CrossRef]
- Kaya, H.; Gündüz-Öğüdücü, Ş. A distance based time series classification framework. Inf. Syst. 2015, 51, 27–42. [Google Scholar] [CrossRef]
- Folgado, D.; Barandas, M.; Matias, R.; Martins, R.; Carvalho, M.; Gamboa, H. Time alignment measurement for time series. Pattern Recognit. 2018, 81, 268–279. [Google Scholar] [CrossRef]
- Fulcher, B.D.; Jones, N.S. Highly comparative feature-based time-series classification. IEEE Trans. Knowl. Data Eng. 2014, 26, 3026–3037. [Google Scholar] [CrossRef]
- Fulcher, B.D. Feature-based time-series analysis. In Feature Engineering for Machine Learning and Data Analytics; CRC Press: Boca Raton, FL, USA, 2018; pp. 87–116. [Google Scholar]
- Chen, B.M.; Zhou, X.P. Explanation of current land use condition classification for national standard of the People’s Republic of China. J. Nat. Resour. 2007, 22, 994–1003. [Google Scholar]
- Liu, Y.; Yao, Y.; Wang, Z.; Plested, J.; Gedeon, T. Generalized Alignment for Multimodal Physiological Signal Learning. In Proceedings of the 2019 International Joint Conference on Neural Networks, (IJCNN), Budapest, Hungary, 14–19 July 2019. [Google Scholar]
- Li, X.; Zhang, G.; Tan, S.; Yang, Z.; Wu, X. Forest Fire Smoke Detection Research Based on the Random Forest Algorithm and Sub-Pixel Maping Method. Forests 2023, 14, 485. [Google Scholar] [CrossRef]
- Sudhakar, S.; Vijayakumar, V.; Kumar, C.S.; Priya, V.; Ravi, L.; Subramaniyaswamy, V. Unmanned Aerial Vehicle (UAV) based Forest Fire Detection and monitoring for reducing false alarms in forest-fires. Comput. Commun. 2020, 149, 1–16. [Google Scholar] [CrossRef]
- Brum-Bastos, V.; Long, J.; Church, K.; Robson, G.; de Paula, R.; Demšar, U. Multi-source data fusion of optical satellite imagery to characterize habitat selection from wildlife tracking data. Ecol. Inform. 2020, 60, 101149. [Google Scholar] [CrossRef]
- Borstad, G.A.; Brown, L.N.; Fissel, D.B. Examining change and long-term trends in the marine environment using satellite-based time series. In Proceedings of the OCEANS 2009, Biloxi, MS, USA, 26–29 October 2009; pp. 1–9. [Google Scholar]
- Guttler, F.; Ienco, D.; Nin, J.; Teisseire, M.; Poncelet, P. A graph-based approach to detect spatiotemporal dynamics in satellite image time series. ISPRS J. Photogramm. Remote Sens. 2017, 130, 92–107. [Google Scholar] [CrossRef]
- Chelali, M.; Kurtz, C.; Puissant, A.; Vincent, N. Urban land cover analysis from satellite image time series based on temporal stability. In Proceedings of the 2019 Joint Urban Remote Sensing Event (JURSE), Vannes, France, 22–24 May 2019; pp. 1–4. [Google Scholar]
- Petitjean, F.; Kurtz, C.; Passat, N.; Gançarski, P. Spatio-temporal reasoning for the classification of satellite image time series. Pattern Recognit. Lett. 2012, 33, 1805–1815. [Google Scholar] [CrossRef]



| Area | Longitude and Latitude Range | Sentinel-2 (UTC) | Himawari-8/9 (CST) |
|---|---|---|---|
| Xintian county | Latitudes 25°40′ to 26°06′N and longitudes 112°02′ to 112°23′E | 14 October 2022 03:06 (Atmospheric correction, resample, crop) | / |
| Xinshao county | Latitudes 27°15′ to 27°38′N and longitudes 111°8′ to 111°50′E | 14 October 2022 03:06 (Atmospheric correction, resample, crop) | / |
| Hunan province | / | 1 December 2022~31 December 2022 (131 images) | 1 January 2019~31 December 2023 8:00~17:30 (Interval 30 min) (Band extraction, crop) |
| Band | Centre Wavelength (μm) | Resolution (km) | Main Application |
|---|---|---|---|
| 1 | 0.47 | 1.0 | Oceanic water colors, Atmospheric environment |
| 2 | 0.51 | 1.0 | Oceanic water colors, Atmospheric environment |
| 3 | 0.64 | 0.5 | Land, Cloud |
| 4 | 0.86 | 1.0 | Oceanic water colors, Cloud |
| 5 | 1.61 | 2.0 | Land, Snow cover |
| 6 | 2.26 | 2.0 | Cloud |
| 7 | 3.89 | 2.0 | Surface temperature, Cloud top temperature |
| 8 | 6.24 | 2.0 | Cirrus, Atmospheric water vapor |
| 9 | 6.94 | 2.0 | Oceanic water colors, Phytoplankton |
| 10 | 7.35 | 2.0 | Oceanic water colors, Phytoplankton |
| 11 | 8.59 | 2.0 | Oceanic water colors, Phytoplankton |
| 12 | 9.64 | 2.0 | Atmospheric water vapor |
| 13 | 10.41 | 2.0 | Surface temperature, Cloud top temperature |
| 14 | 11.24 | 2.0 | Surface temperature, Cloud top temperature |
| 15 | 12.38 | 2.0 | Surface temperature, Cloud top temperature |
| 16 | 13.28 | 2.0 | Cloud top temperature |
| Year | Forest Wildfires (Number) | Area of Victimized Forests (Hectares) | ||
|---|---|---|---|---|
| General Wildfires | Large Wildfires | Major/Particularly Important Wildfires | ||
| 2019 | 171 | 101 | - | 865 |
| 2020 | 33 | 26 | - | 284 |
| 2021 | 33 | 25 | - | 277 |
| 2022 | 86 | 86 | 1 | 1773 |
| Classification Method | Overall Accuracy (%) | Kappa | Producer’s Accuracy (%) | User’s Accuracy (%) |
|---|---|---|---|---|
| Neural Network | 85.73 | 0.85 | 77.78 | 84.09 |
| Support Vector Machine | 79.70 | 0.79 | 70.67 | 76.58 |
| Decision Tree | 82.61 | 0.82 | 75.08 | 79.98 |
| Random Forest | 91.48 | 0.90 | 88.90 | 89.42 |
| Classification Method | Overall Accuracy (%) | Kappa | Producer’s Accuracy (%) | User’s Accuracy (%) |
|---|---|---|---|---|
| Neural Network | 86.55 | 0.86 | 79.04 | 84.23 |
| Support Vector Machine | 82.59 | 0.82 | 76.32 | 80.53 |
| Decision Tree | 81.39 | 0.81 | 78.64 | 80.46 |
| Random Forest | 92.31 | 0.90 | 89.56 | 90.96 |
| Juncture | Total Hotspots | Suspected Forest Fire Hotspots | False Forest Fire Hotspot Statistics | ||
|---|---|---|---|---|---|
| Fixed Heat Source | Periodic Heat Source | Recurring Heat Source | |||
| 8:00 | 5 | 4 | - | 4 | - |
| 10:04 | 4 | 2 | - | 1 | - |
| 10:32 | 7 | 4 | - | - | - |
| 11:00 | 27 | 18 | - | - | - |
| 11:34 | 10 | 1 | - | - | - |
| 12:02 | 12 | 3 | - | 3 | - |
| 13:04 | 15 | 2 | - | - | - |
| 13:32 | 20 | 8 | - | 4 | - |
| 14:00 | 6 | 3 | - | 2 | - |
| 14:34 | 30 | 9 | - | 7 | 1 |
| 15:02 | 8 | 3 | - | - | - |
| 15:30 | 12 | 5 | - | - | - |
| 16:04 | 7 | 1 | - | - | - |
Disclaimer/Publisher’s Note: The statements, opinions and data contained in all publications are solely those of the individual author(s) and contributor(s) and not of MDPI and/or the editor(s). MDPI and/or the editor(s) disclaim responsibility for any injury to people or property resulting from any ideas, methods, instructions or products referred to in the content. |
© 2024 by the authors. Licensee MDPI, Basel, Switzerland. This article is an open access article distributed under the terms and conditions of the Creative Commons Attribution (CC BY) license (https://creativecommons.org/licenses/by/4.0/).
Share and Cite
Wang, H.; Zhang, G.; Yang, Z.; Xu, H.; Liu, F.; Xie, S. Satellite Remote Sensing False Forest Fire Hotspot Excavating Based on Time-Series Features. Remote Sens. 2024, 16, 2488. https://doi.org/10.3390/rs16132488
Wang H, Zhang G, Yang Z, Xu H, Liu F, Xie S. Satellite Remote Sensing False Forest Fire Hotspot Excavating Based on Time-Series Features. Remote Sensing. 2024; 16(13):2488. https://doi.org/10.3390/rs16132488
Chicago/Turabian StyleWang, Haifeng, Gui Zhang, Zhigao Yang, Haizhou Xu, Feng Liu, and Shaofeng Xie. 2024. "Satellite Remote Sensing False Forest Fire Hotspot Excavating Based on Time-Series Features" Remote Sensing 16, no. 13: 2488. https://doi.org/10.3390/rs16132488
APA StyleWang, H., Zhang, G., Yang, Z., Xu, H., Liu, F., & Xie, S. (2024). Satellite Remote Sensing False Forest Fire Hotspot Excavating Based on Time-Series Features. Remote Sensing, 16(13), 2488. https://doi.org/10.3390/rs16132488


