Abstract
High-accuracy optical clocks have garnered increasing attention for their potential application in various fields, including geodesy. According to the gravitational red-shift effect, clocks at lower altitudes on the Earth’s surface run slower than those at higher altitudes due to the differential gravitational field. Consequently, the geopotential difference can be determined by simultaneously comparing the frequency of two optical clocks at disparate locations. Here, we report geopotential difference measurements conducted using a pair of transportable 40Ca+ optical clocks with uncertainties at the level. After calibrating the output frequencies of two optical clocks in the horizontal position, frequency comparison is realized by moving Clock 2 to two different positions using a high-precision optical fiber time–frequency transmission link with Clock 1. The elevation difference of the two different positions, as processed by ensemble empirical mode decomposition (EEMD), is measured as −88.4 cm ± 16.7 cm and 104.5 cm ± 20.1 cm, respectively, which is consistent with the geometric measurement results within the error range. This experimental result validates the credibility of the optical clock time–frequency comparison used in determining geopotential differences, thereby providing a novel measurement model for the establishment of a global unified elevation datum.
1. Introduction
The unification of the global elevation datum is an urgent issue in the geodesy discipline and is also the basis for global spatial information sharing and exchange. The Global Geodetic Observing System (GGOS) plan implemented by the International Association of Geodesy (IAG) clearly proposes the establishment of a global vertical reference system related to global gravity. Its primary scientific objectives include supporting the unification of global physical and geometric elevation systems at the centimeter level and unifying all existing regional elevation reference systems, which requires the robust and consistent connection of those systems [1]. However, the elevation datum is defined as the geoid passing through the horizontal origin determined by long-term tide gauges. The sea level has been in a state of dynamic adjustment for an extended period due to global changes in climate, ocean currents, and geological activities such as volcanic eruptions and earthquakes. As a result, the level of origin defined by tide station observation data is also subject to constant change. Moreover, while all levels of leveling networks currently utilize network adjustment to optimize errors, they lack methods for external consistency verification. Therefore, the redefinition of the geoid and elevation datum demands innovative approaches that address the constraints inherent in current geodetic theory concerning the elevation datum and measurement.
The enhancement in the accuracy of optical clocks, coupled with advancements in transportable optical clocks and remote time-frequency transmission technology, has garnered increasing attention as precise measurement tools within the fields of geodesy. In the future, a global optical clock network is proposed to be established for time–frequency comparison to determine elevations and establish an elevation datum more accurately. Its accuracy of 1.0 × 10⁻¹⁸ corresponds to a geopotential difference of 0.1 m2·s2 or an elevation difference of 1 cm. Consequently, high-precision optical clock frequency comparison technology allows for direct determination of geopotential differences over long distances without accumulating measurement errors. This technology provides a novel measurement model to establish a unified global elevation datum beyond traditional geodetic techniques, which is significant for geodesy’s technological innovation and development.
The current uncertainty of optical clocks has reached or even lower [2,3,4,5,6,7,8,9,10,11,12,13], theoretically enabling centimeter-level or even higher-precision geodetic elevation measurements. However, long-distance time–frequency transmission technology is one of the limiting factors in applying optical clocks for geodesy. Based on the different carriers used for time–frequency transmission, current technologies encompass satellite, very-long-baseline interferometry, and optical fiber [14] methods. Technology based on satellites includes two-way time–frequency transmission via satellites, as well as GNSS precision single-point positioning. The frequency transmission uncertainty of these technologies has achieved orders of magnitude [15]. The time–frequency transmission uncertainty based on very-long-baseline interferometry technology has also reached the order of [16]. While these methods are cost-effective and capable of long-distance time–frequency transmission, they are currently unable to meet the needs of centimeter-level or higher-precision elevation measurements. In contrast, optical fiber is a highly reliable and stable medium for frequency transmission. It is currently the most accurate method for time–frequency transmission, with fractional frequency uncertainty better than [17,18], offering technical support for the achievement of height difference measurement with a resolution of 1 mm or higher. Therefore, utilizing the existing optical fiber network in the country is the best solution for establishing a high-precision optical clock frequency comparison system.
Furthermore, the development of transportable optical clocks (TOCs) is a crucial step towards their application in geodetic surveying. Presently, numerous institutions are vigorously developing TOCs that reference different atomic spectra. There have been several previous reports on relativistic geodesy and demonstrations testing the GR theory [19,20,21,22,23,24,25]. In 2018, Grotti et al. [20] first reported meter-level geodetic elevation measurements outdoors using a transportable Sr lattice atomic clock compared with a stationary Yb lattice atomic clock via about 150 km long optical fiber links. In 2024, the same team utilized a transportable Sr lattice atomic clock and another stationary one to execute a long-distance, decimeter-level optical geodetic clock experiment. The two clocks were positioned 450 km apart and connected via an optical fiber link [26]. In 2020, Takamoto et al. reported a geodetic elevation measurement experiment with a centimeter-scale resolution, using two transportable Sr lattice atomic clocks [3]. In the same year, Wenbin Shen et al. used two hydrogen clocks to realize elevation difference measurement utilizing a GNSS time–frequency transmission link. However, the uncertainty in elevation difference reached 95 m, limited by the accuracy of the hydrogen clock [27]. In 2022, Bothwell et al. conducted a geodetic verification experiment with millimeter-level resolution in the laboratory using Sr lattice atomic clocks [28]. In addition, the Innovation Academy for Precision Measurement Science and Technology, Chinese Academy of Sciences (APM), demonstrated elevation difference measurement with a decimeter-level resolution using transportable 40Ca+-ion optical clocks [22,25,29].
In this paper, we demonstrate elevation measurement using a pair of transportable calcium-ion optical clocks with uncertainties at levels [29]. The frequencies of the two optical clocks were compared using a high-precision optical fiber time–frequency transmission link.The obtained results were then processed with the EEMD method to effectively remove periodic noise after optimizing the decomposed parameters of EEMD. Consequently, the statistical uncertainty of the elevation measurement was increased to 4.5 cm and 3.8 cm at the high and low positions, respectively. After correcting the systematic shifts, the height difference with a total resolution of approximately 20 cm was ultimately measured. This result is consistent with the geometric measurement results within the error range, thereby validating the reliability of height difference measurement using optical clocks.
2. Method
2.1. Theoretical Principles
Based on the gravitational red-shift effect, it is feasible to transform the frequency difference measurements of two clocks into height difference determination through time–frequency transmission links like optical fiber, space light, or satellites, as shown in Figure 1.
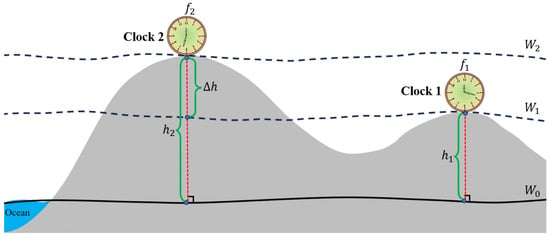
Figure 1.
Schematic diagram of height difference measurement using two optical clocks.
When the disparity in gravitational values at the two measurement locations is negligible, the conversion relationship can be expressed as follows [30]:
where represents the difference in the output frequencies of the two optical clocks at positions 1 and 2 (denoted as ), represents the height difference between these two positions (denoted as −), and represents the average gravitational value between the two positions. Additionally, c represents the speed of light. As per Formula (1), the height difference () measured by the optical clock can be obtained as /. Furthermore, its uncertainty () can be calculated by the following formula:
where , , , and . , , , and represent the uncertainty of , , c, and , respectively. According to Formulas (1) and (2), the elevation measurement can be transformed into a high-precision optical clock time–frequency comparison measurement. In this paper, since the contributions of , , and to are negligible, the elevation difference measurement uncertainty is solely determined by the accuracy of the optical clock.
2.2. Experimental Process
In this study, two transportable calcium-ion optical clocks are interconnected via a 10-m optical fiber time–frequency transmission link in the laboratory. This link employs phase noise cancellation technology to ensure high precision in time–frequency transmission, thereby acting as a bridge for elevation difference measurement. The actual procedure involves using one optical clock as a reference and moving the other one to low and high positions to perform a frequency comparison. This process is followed by corresponding system uncertainty analysis and evaluation, ultimately achieving the measurement of the elevation difference.
To ensure the reliability of the elevation measurement results, it is first necessary to realize a calibration measurement when the two optical clocks are located at the same position. The primary aim is to confirm that the output frequencies of the two optical clocks are consistent within the error range (after correcting for systematic frequency shifts), as shown in Figure 2a. Secondly, by moving Clock 2 to another position with an elevation difference () relative to Clock 1, elevation measurement can be realized by comparing the two optical clock frequencies, as shown in Figure 2b.
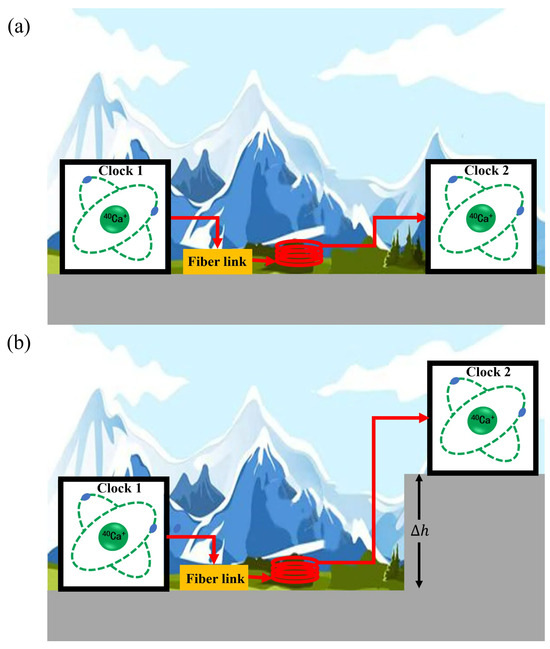
Figure 2.
Schematic diagram of the steps for measuring elevation using transportable optical clocks. (a) TOCs of Clock 1 and Clock 2 are in the same horizontal position; (b) Clock 1 is positioned horizontally, while Clock 2 is placed at an elevation difference of from Clock 1.
This study realized 11 days of continuous frequency comparison at high (107.2 cm) and low (79.2 cm) positions, with an average measurement time of more than 6 h per day. The calcium-ion optical clock exhibits high sensitivity to magnetic fields. The optimal period for daily frequency comparison is limited to approximately 0:00 am to 6:30 am due to environmental magnetic field fluctuations induced by nearby subway operations during daylight hours.
2.3. Data Processing
2.3.1. Optical Clock Uncertainty Analysis
The difference in the two optical clocks’ frequencies is measured as , and the total uncertainty is evaluated as , which includes the systematic uncertainty (), the statistical uncertainty (), and the path error uncertainty (); their relationship is expressed as follows:
Path error uncertainty () is caused by the time–frequency transmission link used for optical clock frequency comparison. In this study, a 10 m fiber time–frequency transmission link was used, which employs phase noise cancellation technology to suppress the transmission signal phase or frequency fluctuations typically caused by temperature changes and mechanical vibration within the optical fiber. Residual path error uncertainty is evaluated by measuring the beat frequency and calculating the Allan deviation. As shown in Figure 3, the stability of time–frequency transmission following fiber noise cancellation is about 3.010−18 at an averaging time of 1 s. Compared with the systematic uncertainty of both Clock 1 and Clock 2 at the level of 10−17, this result is about an order of magnitude higher than the two optical clocks’ systematic uncertainties, so the path error uncertainty is negligible.
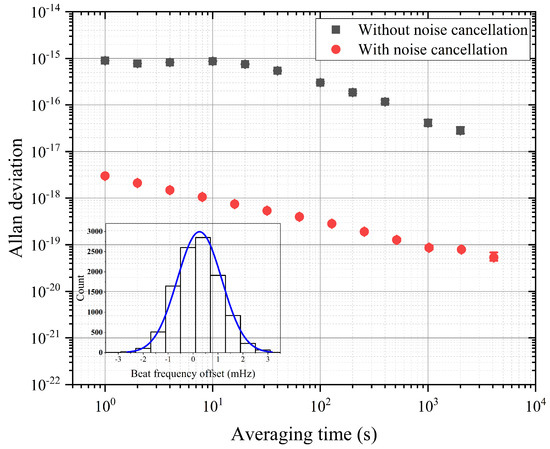
Figure 3.
The stability of frequency transmission in fiber both before and following noise cancellation. Inset: Histogram of beat frequency offset in optical fiber links. The mean of the beat frequency offset is 0.2 mHz, with a relative frequency of 4.910−19. Consequently, it can be inferred that the frequency offset induced by the optical fiber is negligible compared to the precision of the two transportable calcium-ion optical clocks employed in this study.
Systematic uncertainty () of frequency difference arises due to the correction of the total systematic frequency shifts caused by various physical effects (black-body radiation frequency shift, ion motion effect, Doppler effect, etc.). This uncertainty is calculated using the two optical clocks’ systematic uncertainties ( and ) with the formula of . The evaluation results of are presented in Table 1 [29].

Table 1.
The total systematic shift and uncertainty for evaluation of the two TOCs.
Statistical uncertainty () is obtained by counting the output frequency difference of the two optical clocks. Assuming a set of experiments lasts for m days, the equally weighted frequency difference average on the ith day is calculated as (), with the corresponding statistical uncertainty represented by . The final calculation using the following formulas yields the weighted average of the frequency difference () and its total statistical uncertainty ().
During measurement, the optical clock is subject to various factors that can alter its output frequency. These include temperature, humidity fluctuations, and vibrations. To reduce these influences, it is advantageous to employ the EEMD method for processing of optical clock frequency comparison data [31,32]. This approach can effectively reduce the impact of periodic noise and enhance statistical uncertainty.
2.3.2. EEMD Method
In this paper, the EEMD method is applied to process the optical clock time–frequency comparison data (see Appendix A for the principle). Since the essence of EEMD is still empirical mode decomposition (EMD), the Index of Orthogonality () can be calculated to evaluate the decomposition accuracy of EEMD [32]. In the process of applying the EEMD method, the obtained modal components are arranged in decreasing order of frequency. As each component has a different period, the correlation coefficient of different modal components within their common period is equal to 0. This implies that they are orthogonal.
Given the trend term of in Formula (A5) in Appendix A, the original signal sequence (x(t)) can be expressed as follows:
The index of orthogonality is defined as follows:
where , represents the square of the original signal.
The value of the ranges from −1 to 1. When the signal is completely decomposed with the EEMD method, the can be calculated. A value of 0 indicates that each modal component is completely orthogonal. Conversely, a value of ±1 indicates no orthogonality at all. However, the application of the EEMD method requires the determination of two important parameters, namely the white noise amplitude coefficient (k) and the overall mean (M). In this paper, we use the as the judgmental basis to optimize the EEMD decomposition parameters. The process of optimizing the k and M parameters is shown in Figure 4.
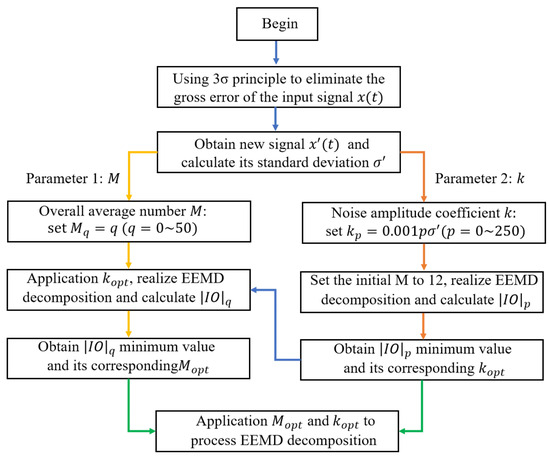
Figure 4.
Flow chart of EEMD decomposition parameter optimization.
First, as the original data contain many gross errors, we preprocess the data by using the 3 principle to remove the anomalous large errors ( is the standard deviation of the original data). After data preprocessing, the frequency difference series becomes more stable, which prevents gross errors from affecting the EEMD decomposition results. All operations are conducted on the preprocessed data sets, which are then subject to subsequent parameter optimization.
Next, the white noise amplitude coefficient (k) is optimized. The initial value of M is set to 12, and the preprocessed datasets are decomposed using different k values, increasing from 0 to 0.25 with a step size of 0.001. Here, denotes the standard deviation of the preprocessed data. After the above operations, we can obtain the relationship between the (the absolute value of ) and the k value. Subsequently, we solve for the corresponding to the minimum value of .
Then, the overall average number (M) is optimized. We initialize the value of k as , the preprocessed datasets are decomposed using different M values, increasing from 1 to 50 with a step of 1. Following these steps, we can get the relationship between and M value. Subsequently, we can find the value corresponding to the minimum value of .
Finally, and are used to perform EEMD decomposition on the preprocessed datasets. The decomposed results are obtained, including multiple IMFs and the trend of r. After removing multiple IMFs, the frequency difference of the two optical clocks is determined by the equally weighted average of the trend of r.
It has been previously reported that the EEMD method can be used to process optical clock data, but no parameter optimization scheme was mentioned [33,34]. This paper proposes an optimization method as described above. For each time–frequency comparison, the amount of effective data is different, so EEMD parameter optimization needs to be performed every time.
Now, we illustrate details of the optimization process of the EEMD method parameters using one day of time–frequency comparison data. As shown in Figure 5a, when the initial value of M is 12, the corresponding relationship between and the k value is obtained according to the optimization steps shown in Figure 4. Consequently, the minimum value of is calculated as 0.000234, and its corresponding k is , which is equal to 0.0163. Similarly, is used to realize the optimization of M. The optimization results are shown in Figure 5b; the minimum value of is calculated as 0.000028, and the corresponding M is , which is equal to 15.
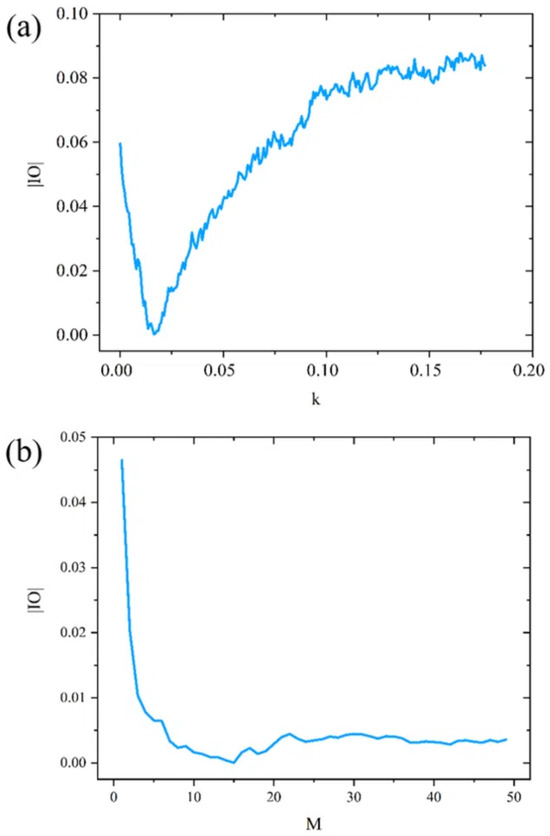
Figure 5.
(a) The relationship between the and the k value; (b) the relationship between the and the M value. It is evident from the graph that there exists a minimum value for . This minimum corresponds to an optimal value for either k or M.
The decomposition error in EEMD, attributed to the addition of noise, is contingent upon the values of k and M [32]. The correlation between these variables can be described as . When the value of e is less than or equal to 0.01, it signifies that the decomposition error caused by residual noise can be ignored. Consequently, this decomposition error can be used as a basis for preliminary judgment of the reliability of the best parameters ( and ). In cases where equals 0.0163 and equals 15, the value of e is 0.004201, which is found to be less than 0.01. Based on these findings, it can be concluded that this set of optimal EEMD decomposition parameters is reliable.
The result of applying and to perform EEMD decomposition with the optical clock time–frequency comparison data is shown in Figure 6, decomposed into eight IMFs and the trend of r. Periodic noise can be seen in the low-frequency part (such as IMF7).
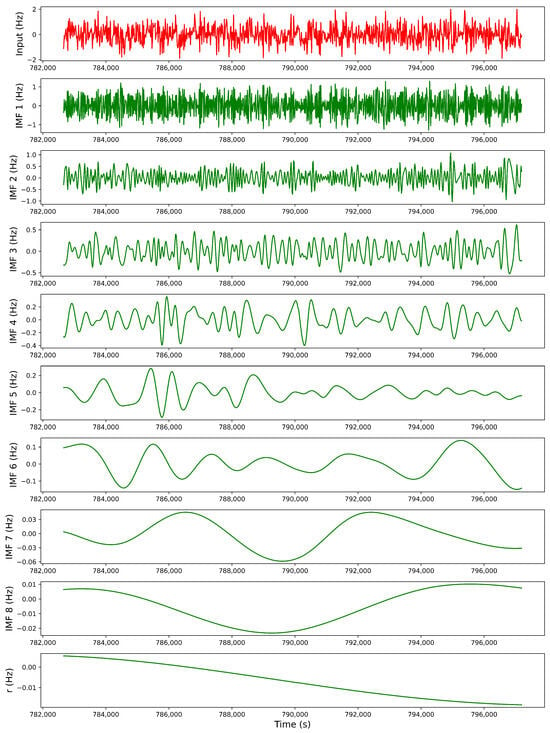
Figure 6.
EEMD processing of the data series of the frequency difference between two optical clocks, including the input data (first panel), intrinsic mode functions ((IMF1)→(IMF8)), and the trend of (r).
3. Results
Using the results processed by the EEMD method, we can compute the equally weighted average () and statistical uncertainty (STD denoted as ) of the daily frequency difference between the two transportable optical clocks. We then apply Formulas (4) and (5) to determine its weighted average () and total statistical uncertainty (). After correcting the system frequency shift, the frequency difference data related to the gravity position difference are finally obtained. According to the gravitational red-shift effect, this enables the conversion from precision optical clock frequency difference measurements to elevation difference determination.
In this paper, two transportable calcium-ion optical clocks realized calibration measurements at the same altitude for 16 days. After correcting the system frequency shift, the frequency difference was measured to be 1.3 ± 7.9 mHz, and the corresponding fractional frequency difference was (0.3 ± 1.9) × 10−17. Within the error range, the output frequencies of the two optical clocks agree with each other at the level of , which ensures the reliability of optical clock elevation measurement. Then, referenced to Clock 1, Clock 2 was moved to two positions, realizing continuous time–frequency comparison at each position for 11 days. As shown in Figure 7, the Allan deviation of the frequency was and for an averaging time (, in seconds). It is evident that longer averaging times lead to greater frequency instability. When the averaging time reaches 37,500 s, the frequency instability is about . Considering the uncertainty of the two optical clock systems, this result indicates that the measurement duration at both positions is sufficient. According to Equation (3), when the frequency difference instability reaches the level, the frequency comparison accuracy is limited by optical clock system uncertainty (at the level). Consequently, increasing the duration of the measurements provides no additional benefit in terms of improving the accuracy of time–frequency comparison results.
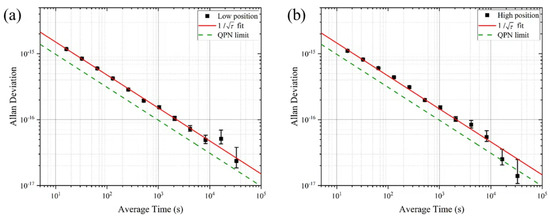
Figure 7.
(a,b) The Allan deviation of the frequency comparison between the static Clock 1 and Clock 2, with Clock 2 being moved to low and high positions respectively. The red solid line shows the fit of the data. The green dashed line represents the theoretical predicted quantum projection noise (QPN) limit of , calculated with a sampling rate of 16.2 s [35].
Then, the optimal EEMD decomposition parameters are applied to process the original time–frequency comparison results (in days). After removing the periodic IMFs, the trend of r is obtained. Compared with the original data, the result is improved due to the removal of periodic noise, as shown in Figure 8. Then, correcting the systematic frequency shifts ( as shown in Table 1), the height differences of the two positions are obtained. As shown in Table 2, when Clock 2 is placed at a low position, the weighted statistical average of the frequency difference between the two optical clocks is measured as −49.0 mHz, with a statistical uncertainty of 1.7 mHz. After correcting for the total systematic shift of −9.4 mHz ± 7.5 mHz, the final frequency difference is −39.6 mHz ± 7.5 mHz. Similarly, when Clock 2 is placed at a high position, the weighted statistical average of the frequency difference between the two optical clocks is measured as 39.4 mHz, with a statistical uncertainty of 2.0 mHz. After correcting the systematic shift, the values is −7.4 mHz ± 8.7 mHz, and the final frequency difference is 46.8 mHz ± 9.0 mHz.
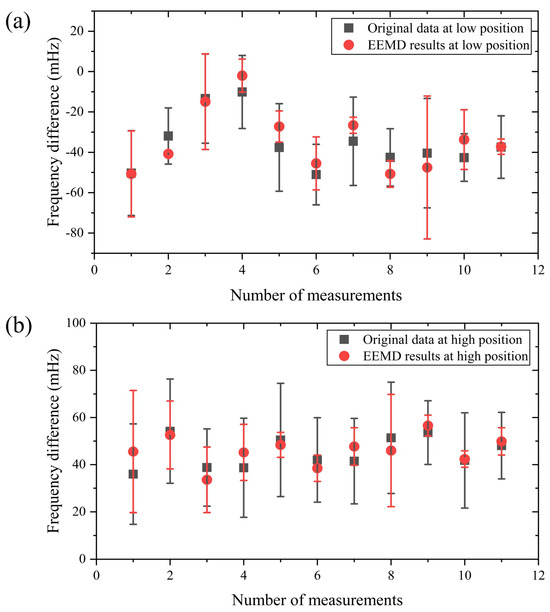
Figure 8.
(a,b) Daily average values of original data on frequency differences obtained by clock time–frequency comparison (black squares) and those processed by the ensemble empirical mode decomposition (EEMD) method (red solid dots) at a low and high position, respectively.

Table 2.
Results of the height difference obtained by comparing the optical clocks’ frequencies.
According to the the gravitational red-shift effect, the height difference is measured by comparing the frequencies of two optical clocks at two sites. Given = 411,042,129,776,400.15 ± 0.22 Hz [36], = 9.793461 ± 0.000002 m·s2 [37], and c = 29,9792,458 m/s, the height difference and the corresponding height measurement uncertainty can be calculated. As shown in Figure 9, the final elevation difference measurement results are 104.5 cm ± 20.1 cm and −88.4 cm ± 16.7 cm. Within the error range, these findings align with the geometric measurement results (107.2 cm ± 1.0 cm and −79.2 cm ± 1.0 cm) and the results of our previous study [29]. The results show that the data processed by EEMD do not deviate from the mean value of the original data within the error range. Meanwhile, it can be calculated that the corresponding statistical uncertainties of height measurement are 3.8 cm and 4.5 cm, respectively, which are significantly improved compared with the previous research results of 11.6 cm and 9.4 cm, respectively [29]. The main reason is that the EEMD method was used to process the optical clock time–frequency comparison data in this paper.
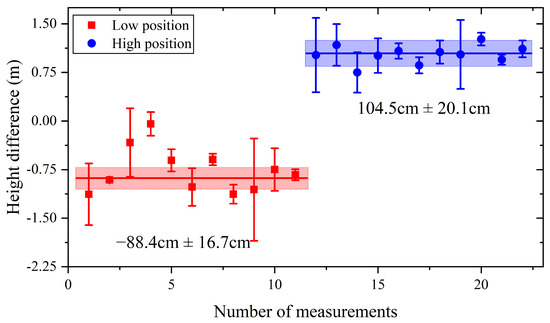
Figure 9.
The results of elevation measurement obtained through optical clock frequency comparison are presented herein. The red squares and blue dots represent the daily elevation difference (systematic shifts corrected). The corresponding error target represents statistical uncertainty. The red and blue solid horizontal lines illustrate the elevation difference results corrected for systematic shifts. The shading indicates the 1 error band.
4. Discussions
Based on the research reported in this paper, we explore the demand for optical clock accuracy and time–frequency transmission technology. The aim is to achieve a centimeter-level or even higher-resolution geoid, as well as unified elevation benchmarks. Furthermore, we contemplate the engineering and scientific applications that optical clocks can realize within the realm of geodesy. There are several key areas that require further exploration and development.
First, research into high-precision, reliable, transportable optical clocks is of utmost importance. For these clocks to be utilized to achieve precise elevation or geopotential difference measurements, they must have exceptionally accurate indicators for systematic uncertainty and frequency stability. This is crucial for improving the accuracy of observations. Moreover, to increase the practical utility of these optical clocks, their miniaturization and transportability are essential. Additionally, the development of a measurement platform that includes temperature control and vibration isolation is required.
Secondly, research into high-precision, high-reliability, long-distance time–frequency transmission technologies is imperative. To cater to the requirements of optical clock comparisons across diverse scenarios, there is a pressing need to develop time–frequency transmission methodologies that ensure both extended distance and reliability. These methodologies encompass but are not limited to optical fiber, satellites, very long interferometry, and free-air laser time–frequency transmission.
Thirdly, research into the engineering applications of optical clock measurement is important. The integration of optical clocks with diverse time–frequency transmission technologies to establish quantum reference points can facilitate the creation of a national elevation control network. This approach can, to a certain degree, supersede leveling and enhance the precision of the elevation control network.
Fourthly, research into the utilization of optical clock measurements in earth science should be pursued. By integrating optical clocks with diverse time–frequency transmission technologies, a continuously monitored optical clock network can be established. This network can facilitate the unification of high-precision geoid and global elevation benchmarks. Furthermore, it offers significant contributions to various earth science domains, including surface deformation monitoring, satellite gravity verification, gravity field modeling, and geophysical inversion.
5. Conclusions
This study successfully utilized optical clock time–frequency comparison technology for geopotential difference measurement. The obtained results are reliable at the decimeter level, thereby demonstrating the potential and feasibility of transportable optical clocks in geodesy applications. Additionally, this paper optimized the ensemble empirical mode decomposition (EEMD) method, identified optimal decomposition parameters, and applied these parameters to perform decomposition on the original frequency difference data from the two optical clocks. The results indicate a significant reduction in the influence of periodic noise and a decrease in statistical uncertainty. This provides fresh perspectives for the processing of optical clock elevation measurement data.
The accuracy of elevation measurement in this experiment was limited by the accuracy of the two transportable calcium-ion optical clocks. The accuracy of the optical clocks used in this experiment is . Therefore, the expected height difference measurements are in the decimeter range. The uncertainty of black-body radiation frequency shift is the main source of uncertainty in calcium-ion optical clocks. By improving the trap design and increasing black-body radiation shielding, the uncertainty of BBR frequency shift can be further reduced to a small coefficient of [38]. Therefore, a transportable calcium-ion optical clock can reach the order of and achieve centimeter-level elevation measurements.
In conclusion, the future holds the promise of an optical clock network comprising high-precision mobile optical clocks and long-distance time and frequency transmission links. This network is anticipated to establish a new quantum benchmark, enabling precise and long-term observations of gravitational potential energy. Furthermore, it will set a global unified centimeter-level precision elevation benchmark. This innovative network offers a novel measurement model for geodesy that is not reliant on traditional geodetic infrastructure, technology, or data. Additionally, its applications extend to navigation, positioning, and fundamental physics research [39,40,41,42,43,44].
Author Contributions
Initiation and data collection, L.B. and D.L.; methodology, D.L. and L.B.; software, D.L.; data processing, D.L.; validation, D.L., L.W., C.X. and L.B.; formal analysis, D.L., L.W. and L.B.; investigation, D.L., L.W., C.X. and L.B.; original draft preparation, D.L.; writing—review and editing, D.L., L.W., C.X. and L.B.; visualization, D.L.; supervision, L.B. and L.W.; project administration, L.B. All authors have read and agreed to the published version of the manuscript.
Funding
This work was supported by the National Natural Science Foundation of China (Grant Nos. 42174102, 42192535, and 41931076), the Basic Frontier Science Research Program of Chinese Academy of Sciences (Grant No. ZDBS-LY-DQC028), and the Hubei Provincial Science Foundation of China (Grant No. 2023AFB366).
Data Availability Statement
Dataset available on request from the corresponding author.
Acknowledgments
We would like to thank the reviewers for helpful and interesting discussions.
Conflicts of Interest
The authors declare no conflicts of interest.
Appendix A. Principle of the EEMD Method
Following EEMD, the original signal is decomposed into a series of local oscillator mode functions (Intrinsic Mode Functions, IMFs) and a long-term trend (r). The IMFs are indicative of the local change characteristics within the decomposed signal, while the long-term trend term (r) provides insight into the overarching change trajectory of the decomposed signal. The EEMD method is executed in several steps as follows:
(1) In the original signal sequence (), a Gaussian white noise sequence () is added to form a new signal sequence () to be decomposed.
(2) EMD is performed on to obtain IMFs and the long-term trend () as follows:
where represents .
(3) Different Gaussian white noise () is added to the original signal sequence , and steps (1) and (2) are repeated to obtain a series of and as follows:
(4) Based on the fact that the mean of Gaussian white noise is zero, the impact of Gaussian white noise on the original signal is eliminated through averaging. Therefore, a certain IMF sequence () can be expressed as follows:
(5) After executing steps (1) to (4), the original signal sequence () is ultimately decomposed into a series of IMF sequences () and a long-term trend () as follows:
References
- Sánchez, L.; Sideris, M.G. Vertical datum unification for the international height reference system (IHRS). Geophys. J. Int. 2017, 209, 570–586. [Google Scholar] [CrossRef]
- Brewer, S.M.; Chen, J.S.; Hankin, A.M.; Clements, E.R.; Chou, C.w.; Wineland, D.J.; Hume, D.B.; Leibrandt, D.R. 27Al+ quantum-logic clock with a systematic uncertainty below 10−18. Phys. Rev. Lett. 2019, 123, 033201. [Google Scholar] [CrossRef] [PubMed]
- Takamoto, M.; Ushijima, I.; Ohmae, N.; Yahagi, T.; Kokado, K.; Shinkai, H.; Katori, H. Test of general relativity by a pair of transportable optical lattice clocks. Nat. Photonics 2020, 14, 411–415. [Google Scholar] [CrossRef]
- Zhiqiang, Z.; Arnold, K.J.; Kaewuam, R.; Barrett, M.D. 176Lu+ clock comparison at the 10−18 level via correlation spectroscopy. Sci. Adv. 2023, 9, eadg1971. [Google Scholar] [CrossRef] [PubMed]
- Huang, Y.; Zhang, B.; Zeng, M.; Hao, Y.; Ma, Z.; Zhang, H.; Guan, H.; Chen, Z.; Wang, M.; Gao, K. Liquid-nitrogen-cooled Ca+ optical clock with systematic uncertainty of 3 × 10⁻¹⁸. Phys. Rev. Appl. 2022, 17, 034041. [Google Scholar] [CrossRef]
- Huntemann, N.; Sanner, C.; Lipphardt, B.; Tamm, C.; Peik, E. Single-ion atomic clock with 3 × 10⁻¹⁸ systematic uncertainty. Phys. Rev. Lett. 2016, 116, 063001. [Google Scholar] [CrossRef] [PubMed]
- Bothwell, T.; Kedar, D.; Oelker, E.; Robinson, J.M.; Bromley, S.L.; Tew, W.L.; Ye, J.; Kennedy, C.J. JILA SrI optical lattice clock with uncertainty of 2 × 10⁻¹⁸. Metrologia 2019, 56, 065004. [Google Scholar] [CrossRef]
- Ushijima, I.; Takamoto, M.; Das, M.; Ohkubo, T.; Katori, H. Cryogenic optical lattice clocks. Nat. Photonics 2015, 9, 185–189. [Google Scholar] [CrossRef]
- Cui, K.; Chao, S.; Sun, C.; Wang, S.; Zhang, P.; Wei, Y.; Yuan, J.; Cao, J.; Shu, H.; Huang, X. Evaluation of the systematic shifts of a 40 Ca+-−27Al+ optical clock. Eur. Phys. J. D 2022, 76, 140. [Google Scholar] [CrossRef]
- McGrew, W.; Zhang, X.; Fasano, R.; Schäffer, S.; Beloy, K.; Nicolodi, D.; Brown, R.; Hinkley, N.; Milani, G.; Schioppo, M.; et al. Atomic clock performance enabling geodesy below the centimetre level. Nature 2018, 564, 87–90. [Google Scholar] [CrossRef]
- Tofful, A.; Baynham, C.F.; Curtis, E.A.; Parsons, A.O.; Robertson, B.I.; Schioppo, M.; Tunesi, J.; Margolis, H.S.; Hendricks, R.; Whale, J.; et al. 171Yb+ optical clock with 2.2 × 10⁻¹⁸ systematic uncertainty and absolute frequency measurements. arXiv 2024, arXiv:2403.14423. [Google Scholar]
- Aeppli, A.; Kim, K.; Warfield, W.; Safronova, M.S.; Ye, J. A clock with 8 × 10⁻¹⁹ systematic uncertainty. arXiv 2024, arXiv:2403.10664. [Google Scholar]
- Hausser, H.N.; Keller, J.; Nordmann, T.; Bhatt, N.M.; Kiethe, J.; Liu, H.; von Boehn, M.; Rahm, J.; Weyers, S.; Benkler, E.; et al. An 115In+-172Yb+ Coulomb crystal clock with 2.5 × 10⁻¹⁸ systematic uncertainty. arXiv 2024, arXiv:2402.16807. [Google Scholar]
- Riehle, F. Optical clock networks. Nat. Photonics 2017, 11, 25–31. [Google Scholar] [CrossRef]
- Riedel, F.; Al-Masoudi, A.; Benkler, E.; Dörscher, S.; Gerginov, V.; Grebing, C.; Häfner, S.; Huntemann, N.; Lipphardt, B.; Lisdat, C.; et al. Direct comparisons of European primary and secondary frequency standards via satellite techniques. Metrologia 2020, 57, 045005. [Google Scholar] [CrossRef]
- Pizzocaro, M.; Sekido, M.; Takefuji, K.; Ujihara, H.; Hachisu, H.; Nemitz, N.; Tsutsumi, M.; Kondo, T.; Kawai, E.; Ichikawa, R.; et al. Intercontinental comparison of optical atomic clocks through very long baseline interferometry. Nat. Phys. 2021, 17, 223–227. [Google Scholar] [CrossRef]
- Raupach, S.M.; Koczwara, A.; Grosche, G. Brillouin amplification supports 1 × 10⁻²⁰ uncertainty in optical frequency transfer over 1400 km of underground fiber. Phys. Rev. A 2015, 92, 021801. [Google Scholar] [CrossRef]
- Xu, D.; Lee, W.K.; Stefani, F.; Lopez, O.; Amy-Klein, A.; Pottie, P.E. Studying the fundamental limit of optical fiber links to the 10−21 level. Opt. Express 2018, 26, 9515–9527. [Google Scholar] [CrossRef] [PubMed]
- Xiong, C.; Liu, D.; Wu, L.; Bao, L.; Zhang, P. Performance Evaluation and Requirement Analysis for Chronometric Leveling with High-Accuracy Optical Clocks. Remote Sens. 2022, 14, 4141. [Google Scholar] [CrossRef]
- Grotti, J.; Koller, S.; Vogt, S.; Häfner, S.; Sterr, U.; Lisdat, C.; Denker, H.; Voigt, C.; Timmen, L.; Rolland, A.; et al. Geodesy and metrology with a transportable optical clock. Nat. Phys. 2018, 14, 437–441. [Google Scholar] [CrossRef]
- Cao, J.; Zhang, P.; Shang, J.; Cui, K.; Yuan, J.; Chao, S.; Wang, S.; Shu, H.; Huang, X. A compact, transportable single-ion optical clock with 7.8 × 10⁻¹⁷ systematic uncertainty. Appl. Phys. B 2017, 123, 1–9. [Google Scholar] [CrossRef]
- Huang, Y.; Zhang, H.; Zhang, B.; Hao, Y.; Guan, H.; Zeng, M.; Chen, Q.; Lin, Y.; Wang, Y.; Cao, S.; et al. Geopotential measurement with a robust, transportable Ca+ optical clock. Phys. Rev. A 2020, 102, 050802. [Google Scholar] [CrossRef]
- Stuhler, J.; Hafiz, M.A.; Arar, B.; Bawamia, A.; Bergner, K.; Biethahn, M.; Brakhane, S.; Didier, A.; Fortágh, J.; Halder, M.; et al. Opticlock: Transportable and easy-to-operate optical single-ion clock. Meas. Sens. 2021, 18, 100264. [Google Scholar] [CrossRef]
- Abbasov, T.; Makarenko, K.; Sherstov, I.; Axenov, M.; Zalivako, I.; Semerikov, I.; Borisenko, A.; Khabarova, K.; Kolachevsky, N.; Chepurov, S.; et al. Compact transportable 171Yb+ single-ion optical fully automated clock with 4.9 E-16 relative instability. arXiv 2020, arXiv:2010.15244. [Google Scholar]
- Yuan, Y.; Cui, K.; Liu, D.; Yuan, J.; Cao, J.; Wang, D.; Chao, S.; Shu, H.; Huang, X. Demonstration of chronometric leveling using transportable optical clocks beyond laser coherence limit. Phys. Rev. Appl. 2024, 21, 044052. [Google Scholar] [CrossRef]
- Grotti, J.; Nosske, I.; Koller, S.; Herbers, S.; Denker, H.; Timmen, L.; Vishnyakova, G.; Grosche, G.; Waterholter, T.; Kuhl, A.; et al. Long-distance chronometric leveling with a portable optical clock. Phys. Rev. Appl. 2024, 21, L061001. [Google Scholar] [CrossRef]
- Wu, K.; Shen, Z.; Shen, W.; Sun, X.; Cai, C.; Wu, Y. A preliminary experiment of determining the geopotential difference using two hydrogen atomic clocks and TWSTFT technique. Geod. Geodyn. 2020, 11, 229–241. [Google Scholar] [CrossRef]
- Bothwell, T.; Kennedy, C.J.; Aeppli, A.; Kedar, D.; Robinson, J.M.; Oelker, E.; Staron, A.; Ye, J. Resolving the gravitational redshift across a millimetre-scale atomic sample. Nature 2022, 602, 420–424. [Google Scholar] [CrossRef] [PubMed]
- Liu, D.X.; Cao, J.; Yuan, J.B.; Cui, K.F.; Yuan, Y.; Zhang, P.; Chao, S.J.; Shu, H.L.; Huang, X.R. Laboratory demonstration of geopotential measurement using transportable optical clocks. Chin. Phys. B 2023, 32, 010601. [Google Scholar] [CrossRef]
- Pound, R.V.; Rebka, G.A., Jr. Apparent weight of photons. Phys. Rev. Lett. 1960, 4, 337. [Google Scholar] [CrossRef]
- Huang, N.E.; Shen, Z.; Long, S.R.; Wu, M.C.; Shih, H.H.; Zheng, Q.; Yen, N.C.; Tung, C.C.; Liu, H.H. The empirical mode decomposition and the Hilbert spectrum for nonlinear and non-stationary time series analysis. Proc. R. Soc. London Ser. A Math. Phys. Eng. Sci. 1998, 454, 903–995. [Google Scholar] [CrossRef]
- Wu, Z.; Huang, N.E. Ensemble empirical mode decomposition: A noise-assisted data analysis method. Adv. Adapt. Data Anal. 2009, 1, 1–41. [Google Scholar] [CrossRef]
- Wu, K.; Shen, W.B.; Sun, X.; Cai, C.; Shen, Z. Measuring the gravity potential between two remote sites with CVSTT technique using two hydrogen clocks. Geo-Spat. Inf. Sci. 2023, 1–20. [Google Scholar]
- Hoang, A.T.; Shen, Z.; Wu, K.; Ning, A.; Shen, W. Test of determining geopotential difference between two sites at wuhan based on optical clocks’ frequency comparisons. Remote Sens. 2022, 14, 4850. [Google Scholar] [CrossRef]
- Ludlow, A.D.; Boyd, M.M.; Ye, J.; Peik, E.; Schmidt, P.O. Optical atomic clocks. Rev. Mod. Phys. 2015, 87, 637. [Google Scholar] [CrossRef]
- Cao, J.; Yuan, J.; Wang, S.; Zhang, P.; Yuan, Y.; Liu, D.; Cui, K.; Chao, S.; Shu, H.; Lin, Y.; et al. A compact, transportable optical clock with 1 × 10⁻¹⁷ uncertainty and its absolute frequency measurement. Appl. Phys. Lett. 2022, 120, 054003. [Google Scholar] [CrossRef]
- Huang, P.W.; Tang, B.; Chen, X.; Zhong, J.Q.; Xiong, Z.Y.; Zhou, L.; Wang, J.; Zhan, M.S. Accuracy and stability evaluation of the 85Rb atom gravimeter WAG-H5-1 at the 2017 International Comparison of Absolute Gravimeters. Metrologia 2019, 56, 045012. [Google Scholar] [CrossRef]
- Zhang, P.; Cao, J.; Yuan, J.B.; Liu, D.X.; Yuan, Y.; Wei, Y.F.; Shu, H.L.; Huang, X.R. Evaluation of blackbody radiation shift with 2 × 10⁻¹⁸ uncertainty at room temperature for a transportable 40Ca+ optical clock. Metrologia 2021, 58, 035001. [Google Scholar] [CrossRef]
- Wolf, P. Next generation clock networks. Physics 2016, 9, 51. [Google Scholar] [CrossRef]
- Godun, R.; Nisbet-Jones, P.; Jones, J.; King, S.; Johnson, L.; Margolis, H.; Szymaniec, K.; Lea, S.; Bongs, K.; Gill, P. Frequency ratio of two optical clock transitions in 171Yb+ and constraints on the time variation of fundamental constants. Phys. Rev. Lett. 2014, 113, 210801. [Google Scholar] [CrossRef] [PubMed]
- Huntemann, N.; Lipphardt, B.; Tamm, C.; Gerginov, V.; Weyers, S.; Peik, E. Improved limit on a temporal variation of mp/me from comparisons of Yb+ and Cs atomic clocks. Phys. Rev. Lett. 2014, 113, 210802. [Google Scholar] [CrossRef] [PubMed]
- Rosenband, T.; Hume, D.; Schmidt, P.; Chou, C.W.; Brusch, A.; Lorini, L.; Oskay, W.; Drullinger, R.E.; Fortier, T.M.; Stalnaker, J.E.; et al. Frequency ratio of Al+ and Hg+ single-ion optical clocks; metrology at the 17th decimal place. Science 2008, 319, 1808–1812. [Google Scholar] [CrossRef] [PubMed]
- Derevianko, A.; Pospelov, M. Hunting for topological dark matter with atomic clocks. Nat. Phys. 2014, 10, 933–936. [Google Scholar] [CrossRef]
- Arvanitaki, A.; Huang, J.; Van Tilburg, K. Searching for dilaton dark matter with atomic clocks. Phys. Rev. D 2015, 91, 015015. [Google Scholar] [CrossRef]
Disclaimer/Publisher’s Note: The statements, opinions and data contained in all publications are solely those of the individual author(s) and contributor(s) and not of MDPI and/or the editor(s). MDPI and/or the editor(s) disclaim responsibility for any injury to people or property resulting from any ideas, methods, instructions or products referred to in the content. |
© 2024 by the authors. Licensee MDPI, Basel, Switzerland. This article is an open access article distributed under the terms and conditions of the Creative Commons Attribution (CC BY) license (https://creativecommons.org/licenses/by/4.0/).