Article

Improving Error Estimates for Evaluating Satellite-Based Atmospheric CO2 Measurement Concepts through Numerical Simulations

Laboratoire de Météorologie Dynamique (LMD/IPSL), École Polytechnique, Institut Polytechnique de Paris, Sorbonne Université, École Normale Supérieure, PSL Research University, CNRS, École des Ponts, 91128 Palaiseau, France
*
Author to whom correspondence should be addressed.
Remote Sens. 2024, 16(13), 2452; https://doi.org/10.3390/rs16132452
Submission received: 26 March 2024 / Revised: 4 June 2024 / Accepted: 21 June 2024 / Published: 3 July 2024
(This article belongs to the Special Issue Remote Sensing: 15th Anniversary)

Abstract

:
To assess the accuracy of satellite monitoring of anthropogenic CO 2 emissions, inversions of satellite data in SWIR are usually combined with the assimilation of the total CO 2 column into a Kalman filter that reconstructs the sources and sinks of atmospheric CO 2 . To provide error estimates of the total CO 2 column for multi-month assimilation experiments of simulated satellite data, we parametrise these errors using linear regressions. These regression are obtained from a database that links meteorological situations, albedos, and aerosols to the errors in the inversion of the total CO 2 column based on simulated satellite data for those conditions. The errors in this database are explicitly computed using the Bayesian estimation formalism, and the linear regressions are optimised by selecting appropriate predictors and predictants. For different levels of measurement noise, error simulations are performed over a period of several months using the albedo and aerosol data from MODIS.

1. Introduction

Estimating the concentration of carbon dioxide ( CO 2 ) in the atmosphere with a high degree of accuracy and precision is an important objective for identifying and quantifying its global sources and sinks as well as for monitoring international agreements aimed at limiting its emissions. Because of the important role played by the increase in atmospheric CO 2 in global change, in addition to in situ measurements of CO 2 at the surface, remote sensing data are used from the ground—Total Carbon Column Observing Network (TCCON) [1] and COllaborative Carbon Column Observing Network (COCCON) [2]—and from satellites—JAXA’s Greenhouse Gas Observation Satellites (GOSAT and GOSAT-2) [3], NASA’s Orbital Carbon Observatories (OCO-2 and OCO-3) [4,5], CNSA’s TanSat mission [6,7,8], pending data from AEMS [9], which was launched in 2022 and has on board an integrated path differential absorption lidar, and future missions such as MicroCarb [10] from CNES and CO2M [11] from ESA.
TRACE (TRAcking Carbon Emissions) is an initiative that aims to develop new technologies and methodologies for accurately quantifying and monitoring greenhouse gas (GHG) emissions, both at the local scale for industrial sites using low-cost sensor networks and at the global scale using space-based instruments. In this context, a two-step approach has been developed to link the instrument characteristics first to the accuracy and precision of the carbon dioxide column and then to the estimation of CO 2 fluxes. This two-step approach aligns with operational practice, where satellite data processing centres are separate from flux production centres. The former manages the spectral dimension of the observations using a radiative transfer model to simulate the radiance spectra and their sensitivity to different parameters, and the latter manages the temporal dimension using a Kalman filter [12]. This separation is made possible by the use of the averaging kernel (AVK) to eliminate in step 2 the linear contribution of the prior used in step 1 [13,14]. Appendix A specifies the conditions under which the two-step procedure is equivalent to the one-step procedure. Figure 1 provides a schematic comparison between one-step and two-step procedure.
The purpose of this paper is to present an approach for the rapid estimation of errors on XCO 2 retrieved from satellite observations operating in the SWIR spectral region. To provide error maps (and AVK), instead of using a complete inversion system by implementing an inverse method based on the Bayesian approach, we follow, as in Dogniaux et al. [15], the parameterised approach developed by Buchwitz et al. [16] as part of the preparation of the CarbonSat mission, which consists of performing these inversions only for a limited number of cases (a few hundred) in order to build up a database and then generalising the results by establishing linear regressions between the quantities of interest and the various available parameters. In addition, to build up the database, we use the Bayesian estimation formalism to determine the random errors without explicit inversion. Figure 2 presents the flowchart of our approach and shows how N inversions (with N of the order of several tens of thousands) are reduced to P simulations of spectra with their Jacobians (with P less than 1000) plus some matrix computations and linear regressions.
Section 2 of this paper is divided into five subsections. The first outlines the instrument concept provided by Thales Alenia Space (TAS), a leading European satellite manufacturer, which is co-funding the TRACE initiative. The second revisits the formalism of inversion by optimal estimation. The third presents the tools used to model direct and inverse radiative transfer. The fourth describes the data used from the Moderate Resolution Imaging Spectroradiometer (MODIS). The fifth presents the database of cases used to generate the CO 2 atmospheric error database. Section 3 then discusses the selection of the predictors and predictants used in the linear regressions. Additionally, it reports on the CO 2 error maps computed from the MODIS data over several months. The final section examines the relevance of working with a two-step approach, the limitations of the approach to random errors and averaging kernels, and the results in terms of error maps. Finally, conclusions and suggestions for future studies are presented.

2. Materials and Methods

2.1. Instrumental Concept

The concept being studied, subsequently called the TRACE instrument, is proposed by TAS as a complement to CO2M. It is modelled according to TAS specifications and has a MODIS orbit but a swath reduced by approximately 250 km, and it has a resolution of 2 km. Measurements are performed in three spectral bands identical to those of CO2M: two in the shortwave infrared region and one in the near infrared, called SWIR1, SWIR2, and NIR, respectively. Table 1 presents the specified characteristics of the measurements in the three bands. The sampling resolution is set as for CO2M to three times finer than the full width at half maximum (FWHM) of ISRF, resulting in 901 measurements in SWIR2, 851 in SWIR1, and 651 in NIR.
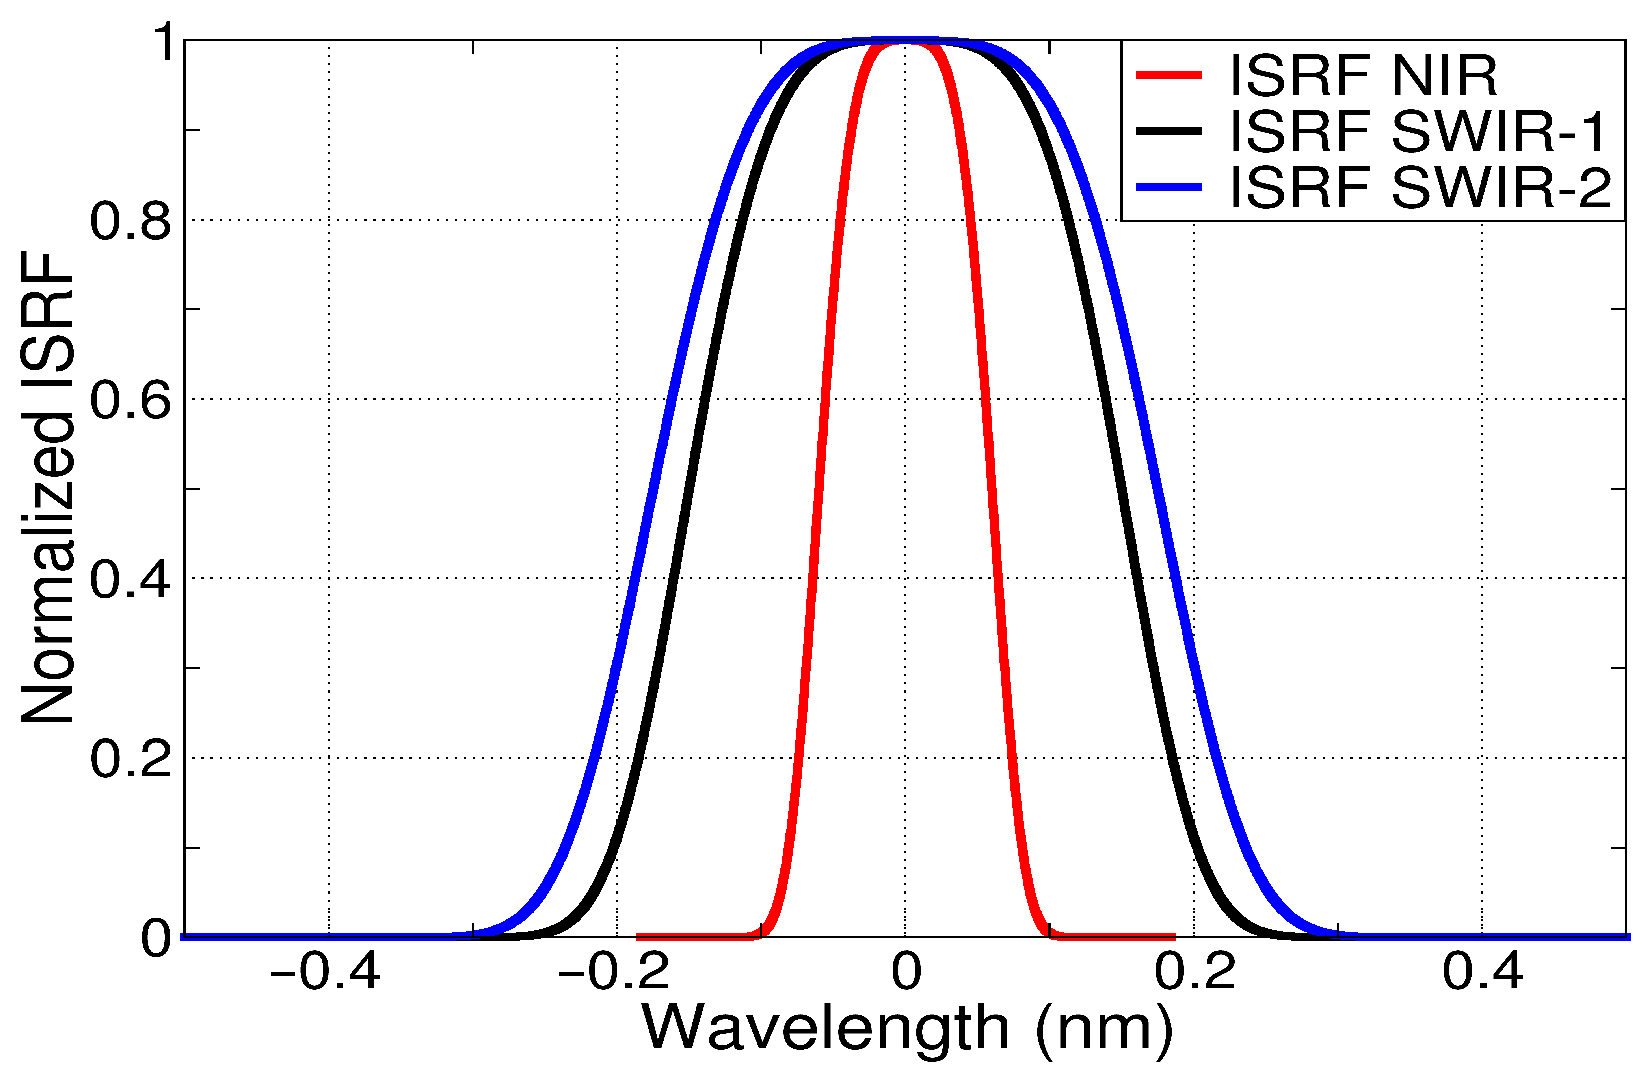
Figure 3 shows the ISRFs for the three frequency bands as a function of wavelength. When expressed in terms of wavenumber, the ISRFs vary for each spectral sample.
To represent the measurement uncertainty σ o , the signal-to-noise ratio (SNR) is used. Luminance refers to the flux of photons in a unit wavelength (to convert photons/s/cm2/sr/nm to W/m2/sr/cm−1, we multiply by h c ν ( cm 1 ) 10 13 , where h is the Planck’s constant, c is the speed of light, and ν = 1 λ ; the wavenumber is given in cm−1).
SNR = Luminance σ o = A Luminance A Luminance + B
Coefficients A and B specify the instrumental noise level, with their values provided by TAS for three different levels: “Threshold”, “Intermediate”, and “Goal” (see Table 2).
Table 3 compares the SNRs computed with these values with those specified for CarbonSat in Buchwitz et al. [16] and for CO2M in ESA MRD [11].
Figure 4 provides a visual and comprehensive comparison of the noise levels of the CarbonSat, CO2M and TRACE instruments in the SWIR1 and SWIR2 bands.
The comparison confirms that the TRACE instrument is designed to perform at a similar level to CO2M for the “Threshold” option and to exceed it for the other two options.

2.2. Bayesian Estimation

The unified notation for data assimilation and retrieval proposed by Ide et al. [18] is followed. In order to retrieve a control vector x from a set of observations y 0 , it is necessary to know the covariance matrix of the errors from the observations E as well as a prior estimate of x b , for which the uncertainties are characterised by the covariance matrix B. Furthermore, a non-linear relation H N L is required in order to compute the equivalent of the observations y 0 from the control vector x. The linear operator H is constructed on the partial derivatives of H N L with respect to the different elements of the control vector (Jacobian). The modelling error when using H N L is represented by the matrix F. Then, the matrix R = E + F represents the total observation error. In this context, the Bayesian estimation formalism, as presented in references [15,19,20], allows us to obtain not only the best linear unbiased estimator (BLUE), which is represented by x a , but also its random error, which is characterised by the covariance matrix A.
x a = x b + K ( y 0 H N L ( x b ) )
A = ( B 1 + H T R 1 H ) 1
The averaging kernel (AVK) is the partial derivative of the estimated state x a with respect to the actual state x t . The kernel is represented by K H , where K = A H T R 1 :
K H = I A B 1
The effective error ϵ a is estimated by:
ϵ a = x a x t = ( I K H ) ϵ b + K ( y 0 H N L ( x a ) )
= ( I K H ) ϵ b + K ϵ o K ϵ N L ( x a )
with ϵ N L ( x ) = H N L ( x ) H N L ( x t ) H ( x x t )
In these expressions, it is necessary to compute the Jacobians at x a . However, it should be noted that for moderately non-linear H N L relations, it is possible to use the Jacobian at x b . The term ϵ 0 refers to the observation error, while ϵ b is the a priori error.

2.3. Direct and Inverse Radiative Transfer Modelling

In this study, the observation vector y 0 corresponds to the radiances measured by the instrument (i.e., the spectrum convolved by the ISRF). The spectra and Jacobian matrices are computed using the 4A/OP (Automated Atmospheric Absorption Atlas/OPerational version) radiative transfer model [21,22]. The resolution of the spectrum simulated before convolution with the ISRF, shown in Figure 3, is 5 × 10 4 cm−1. The input data for the 4A/OP code are the ground reflectance, atmospheric variables—surface pressure, temperature, water vapour, and other gas profiles—and the geometry of the measurement—SZA (solar zenith angle) and VZA (viewing zenith angle). The 4A/OP code is based on atlases containing tabulated optical thicknesses at different pressures and temperatures, which are precomputed from the GEISA (Gestion et Étude des Informations Spectroscopiques Atmosphériques) database [23,24]. To handle scattering, the 4A/OP code is coupled to the LIDORT (LInearised Discrete Ordinate Radiative Transfer) [25] software. In our simulations, even when we do not use scattering particles, we keep the attenuation due to Rayleigh scattering. The optical scattering properties—AOD or COD (aerosol or cloud optical depth), single scattering albedo, and asymmetry coefficient—can be freely defined input variables or variables provided for a fixed mixture of scattering particles from the OPAC (Optical Properties of Aerosols and Clouds) [26] database. Atmospheric situations are taken from the Thermodynamic Initial Guess Retrieval (TIGR) [27] database. The reflectance is assumed to be Lambertian. Only two distinct fixed albedos are considered, one for SWIR and another for NIR.
The retrieval of XCO 2 is achieved through the utilisation of the Adaptable 4A inversion (5AI) system, as described in Dogniaux et al. [15] and applied in Dogniaux et al. [28] for the retrieval of XCO 2 and XCH 4 from the Scarbo concept. The 5AI system is fully interfaced with 4A/OP. The integrated vertical column is the only variable considered in the results, even if a complete profile of XCO 2 is inverted.
Figure 5 shows the main dependencies of the radiance spectra for the three bands with respect to solar incidence angles and scattering. The four curves represent simulations for three different aerosol types and without scattering. The signal intensity depends primarily on the zenith solar angle and albedo, followed by the competition between absorption and scattering by the aerosols. The OPAC database indicates that the MITR single scattering albedo is higher than that of WASO in NIR and smaller in SWIR. This explains why the red curve is higher than the blue curve in the NIR and lower in the SWIR. The simple scattering albedo for SOOT is much smaller than that of other aerosols. Consequently, the green curve is much lower because soot diffusion is small relative to its absorption. This results in a reduction in the radiances measured by the satellites in the presence of soot, whereas the other aerosols increase the radiance as the impact of their scattering is stronger than the impact of their absorption.
Figure 6 shows the standard deviations of the observation error ( σ o ) computed with Equation (1). As expected, the “Threshold”, “Intermediate”, and “Goal” noise levels correspond to decreasing σ o , for which the variations follow those of the radiances (Figure 5).

2.4. MODIS Data

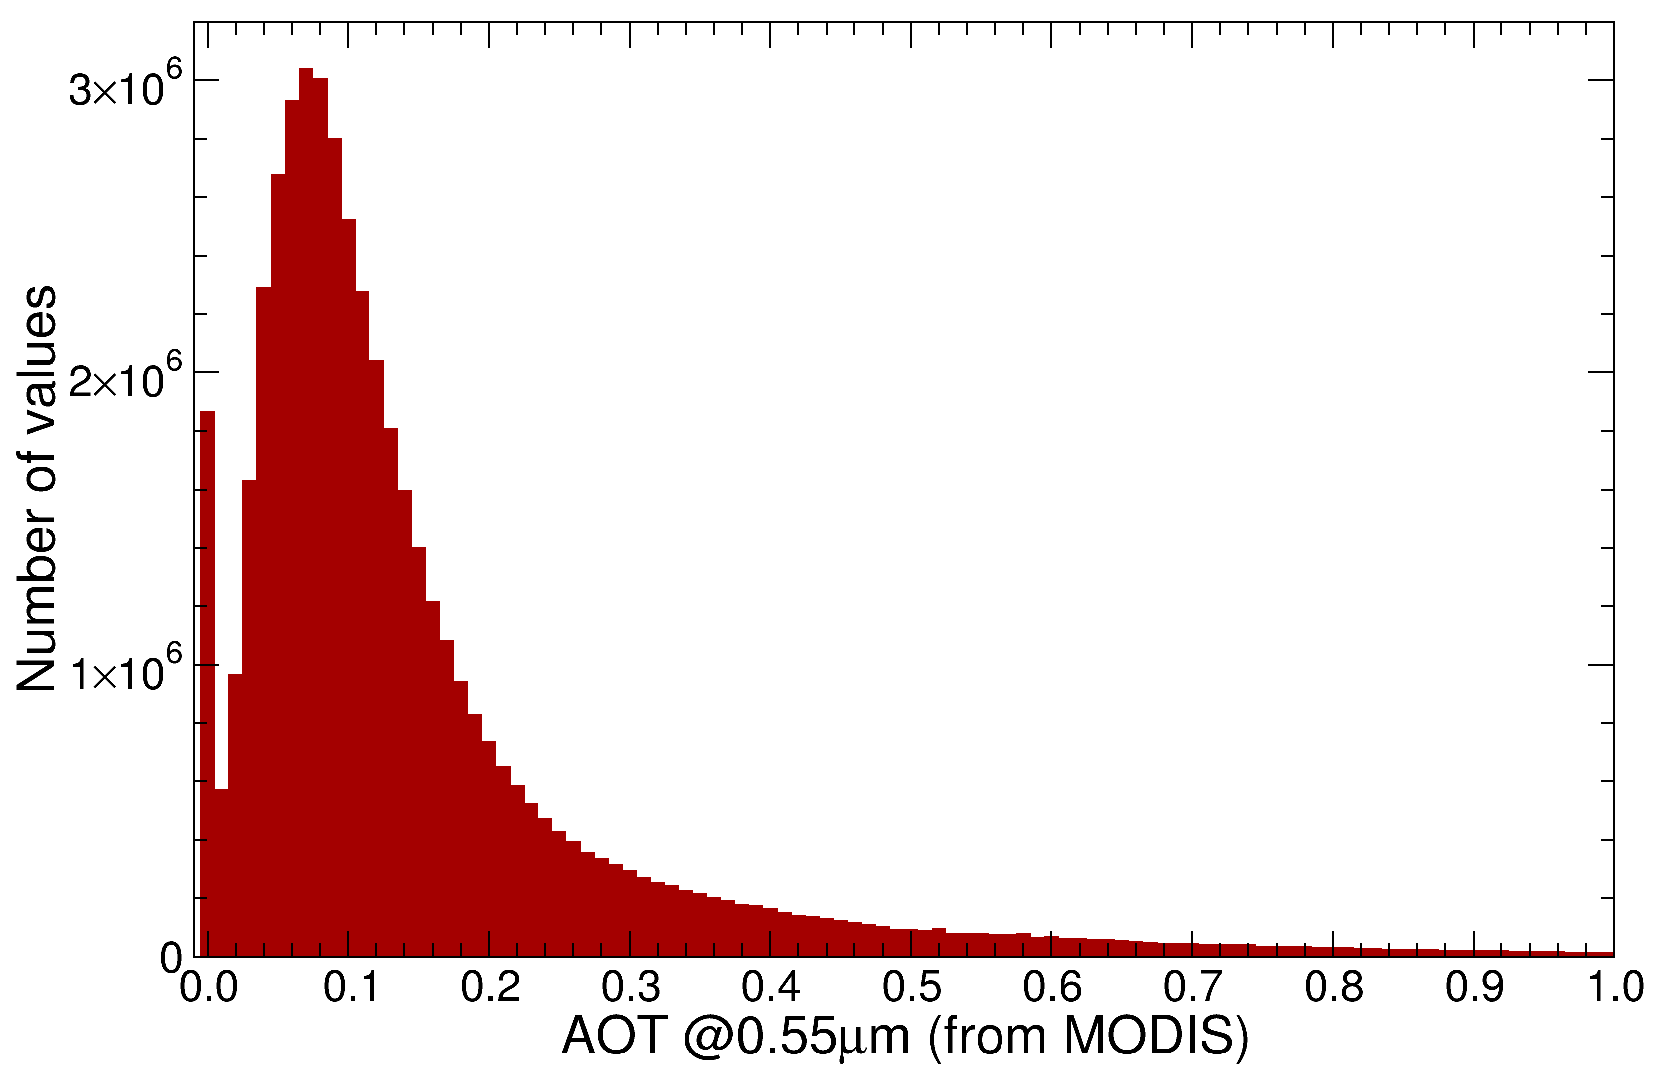
The MODIS [29,30] data were used for two distinct purposes. Firstly, the range of variation in albedo values for the SWIR and NIR bands as well as the aerosol content were determined. In terms of albedo, we obtained a overall range of 0.06 to 0.3/0.5 for NIR albedo values and a range of 0.02 to 0.15/0.3 for SWIR albedo values. It should be noted, however, that in some regions, such as deserts, the value may be higher. Based on Figure 7, and taking into account that high values will be reported in an operational system, we will use an aerosol optical thickness between 0.05 and 0.15 for the AOD values at 1.064 μm.
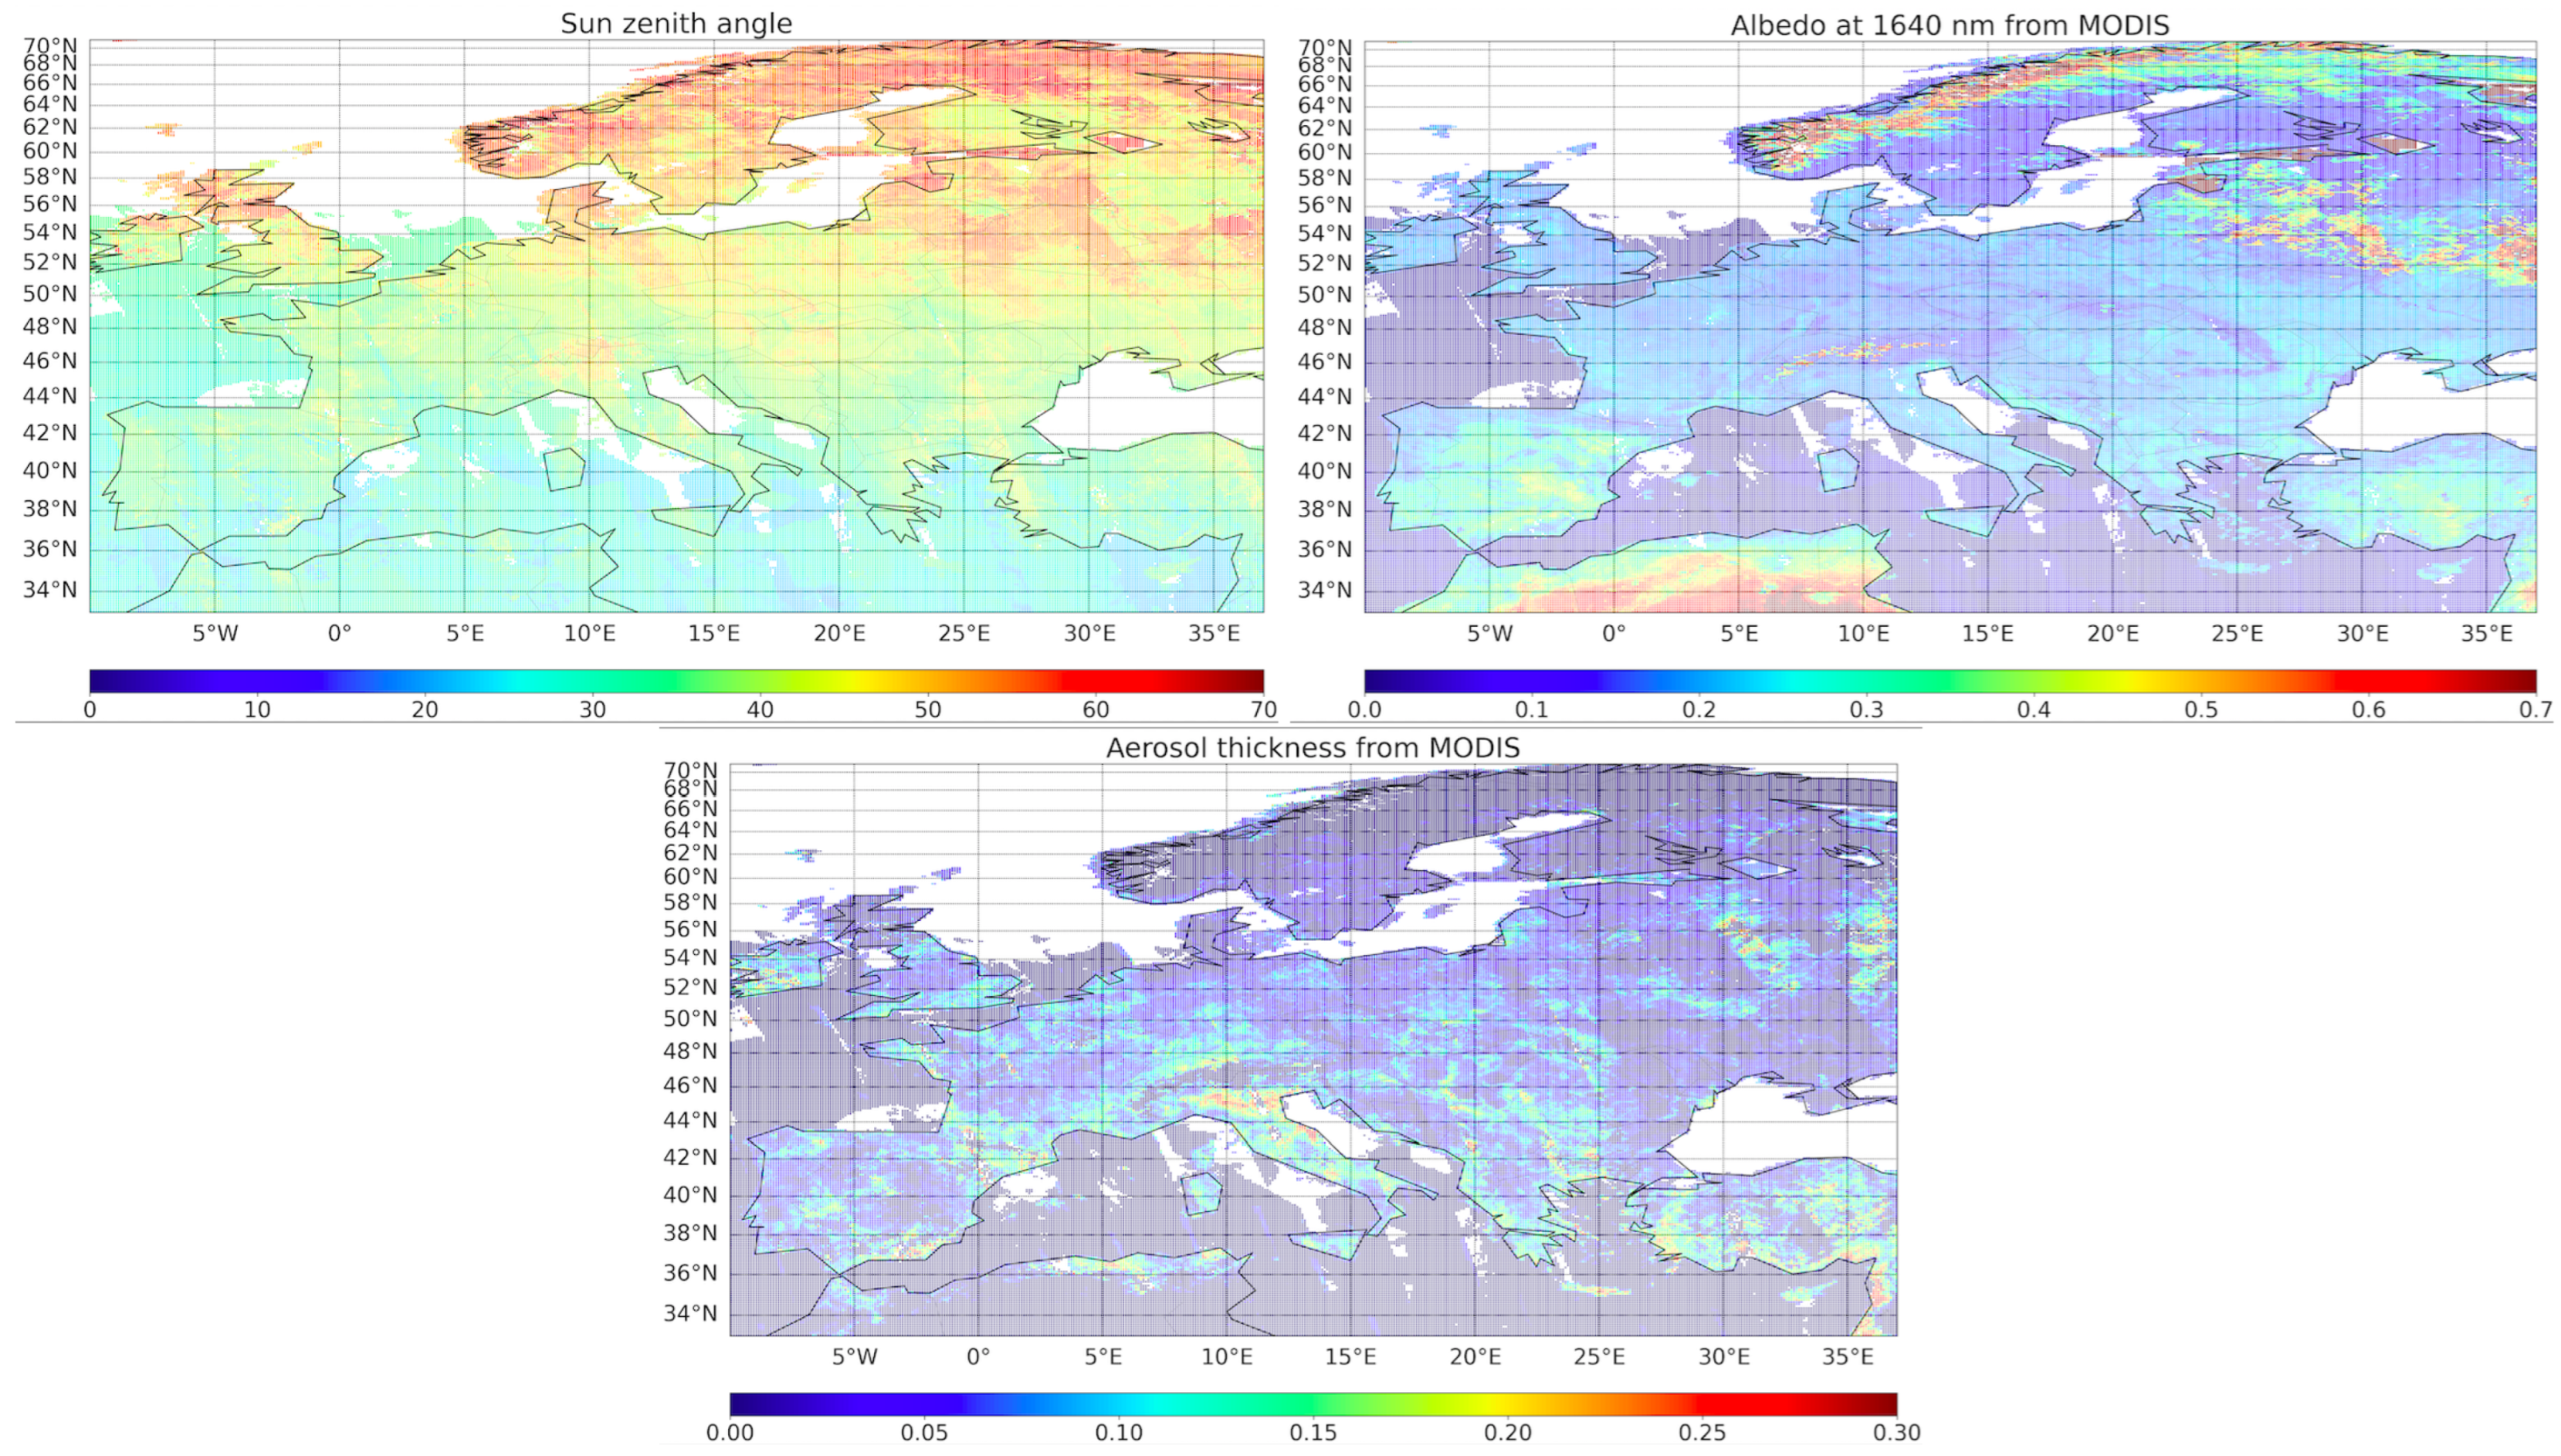
Secondly, the observed points of the database were prepared for use in Section 3.4. These included, in particular, SZA, albedo, and aerosol optical thickness, which are shown in Figure 8 for Europe for the months of March to May 2020. White areas are regions where there is no clear MODIS data.

2.5. Definition of the Case Database

A database of 945 cases was generated using different atmospheric profiles, albedos, solar zenith angles, and scattering conditions. It was not necessary to vary the greenhouse gas concentrations, as this was not relevant to the study. As the atmospheric concentrations of CO 2 and CH 4 , in fact, vary very little, the uncertainties in the restitution of CO 2 are independent of these small variations, which we, nevertheless, try to determine. In addition, the viewing zenith angle was fixed for this study.
  • CO 2 concentration: 394.88 ppm and CH 4 concentration: 1850 ppb;
  • Viewing zenith angle: nadir.
We have limited ourselves to extending the clear sky cases by considering disturbances due to relatively thin aerosol layers and semi-transparent cirrus clouds, but we have not attempted to treat very opaque atmospheres. Figure 9 summarises the 34 scattering situations added to the clear sky situation.
  • Cirrus: cases with no cirrus, cases with one cirrus layer in the [394.5; 438.0] hPa layer with a cloud top height (CTH) of 8 km, and cases with one cirrus layer in the [247.87; 275.95] hPa layer with a CTH of 12 km (cir100 in OPAC model); The cloud optical depth (COD) is 0.05 or 0.10 at 1.064 μm.
  • Aerosols: cases with an aerosol layer with an AOD of 0.05 or 0.15 at 1.064 μm. according to Figure 7, either according to the fine mode: OPAC MITR00 model (mineral transport—desert) in the layer [705.0; 783.0] hPa (at an altitude of about 3 km), or according to the coarse mode: OPAC WASO70 (water soluble—continental) or SOOT00 (soot) in the layer [848.69; 1013.25] hPa (at an altitude of about 1.5 km).
These 35 scattering patterns are used with 3 albedo sets and 3 SZAs, resulting in 315 cases.
  • Albedo: 3 values per frequency bands: SWIR 0.02, 0.15, or 0.30 and NIR 0.06, 0.3, or 0.5 according to the global distribution observed by MODIS.
  • Sun zenith angle: 0°, 50°, or 70.
We obtained the 945 cases (Figure 10) by applying these 315 cases to three typical TIGR atmospheres.
  • Atmospheric profiles (defined for 20 pressure levels), three from TIGR database: Trop1—tropical, very hot and very humid; Trop3—tropical, hot and moderately humid; and MidLat2—temperate, more or less hot and moderately humid.

3. Results

3.1. Generation of XCO 2 Errors

For the three levels of noise and the 945 cases of the database described above, we compute the random error ( σ a ) for the XCO 2 for the atmospheric column, the corresponding AVK, and the actual error ϵ a . From Equation (3), which gives the error covariance matrix for a CO 2 profile, we obtain Equation (8) for the scalar random error on the column of CO 2 . Only the SWIR1 and SWIR2 bands contribute, as there is no dependence on CO 2 in the NIR band since there is no absorption due to CO 2 in this band.
σ C O 2 2 = W T ( B 1 + H C O 2 S W I R 1 T E S W I R 1 + F S W I R 1 1 H C O 2 S W I R 1 + H C O 2 S W I R 2 T E S W I R 2 + F S W I R 2 1 H C O 2 S W I R 2 ) W
where W defines how to compute the vertical average of the XCO 2 profile. We use the vector w ( i ) = Δ P ( i ) P s (where P s is the surface pressure and Δ P ( i ) is the pressure thickness of layer i) even if, in all rigour, we should use w ( i ) = ( 1 q ( i ) ) Δ P ( i ) s u m ( 1 q ( j ) ) Δ P ( j ) , with q ( i ) being the specific humidity profile.
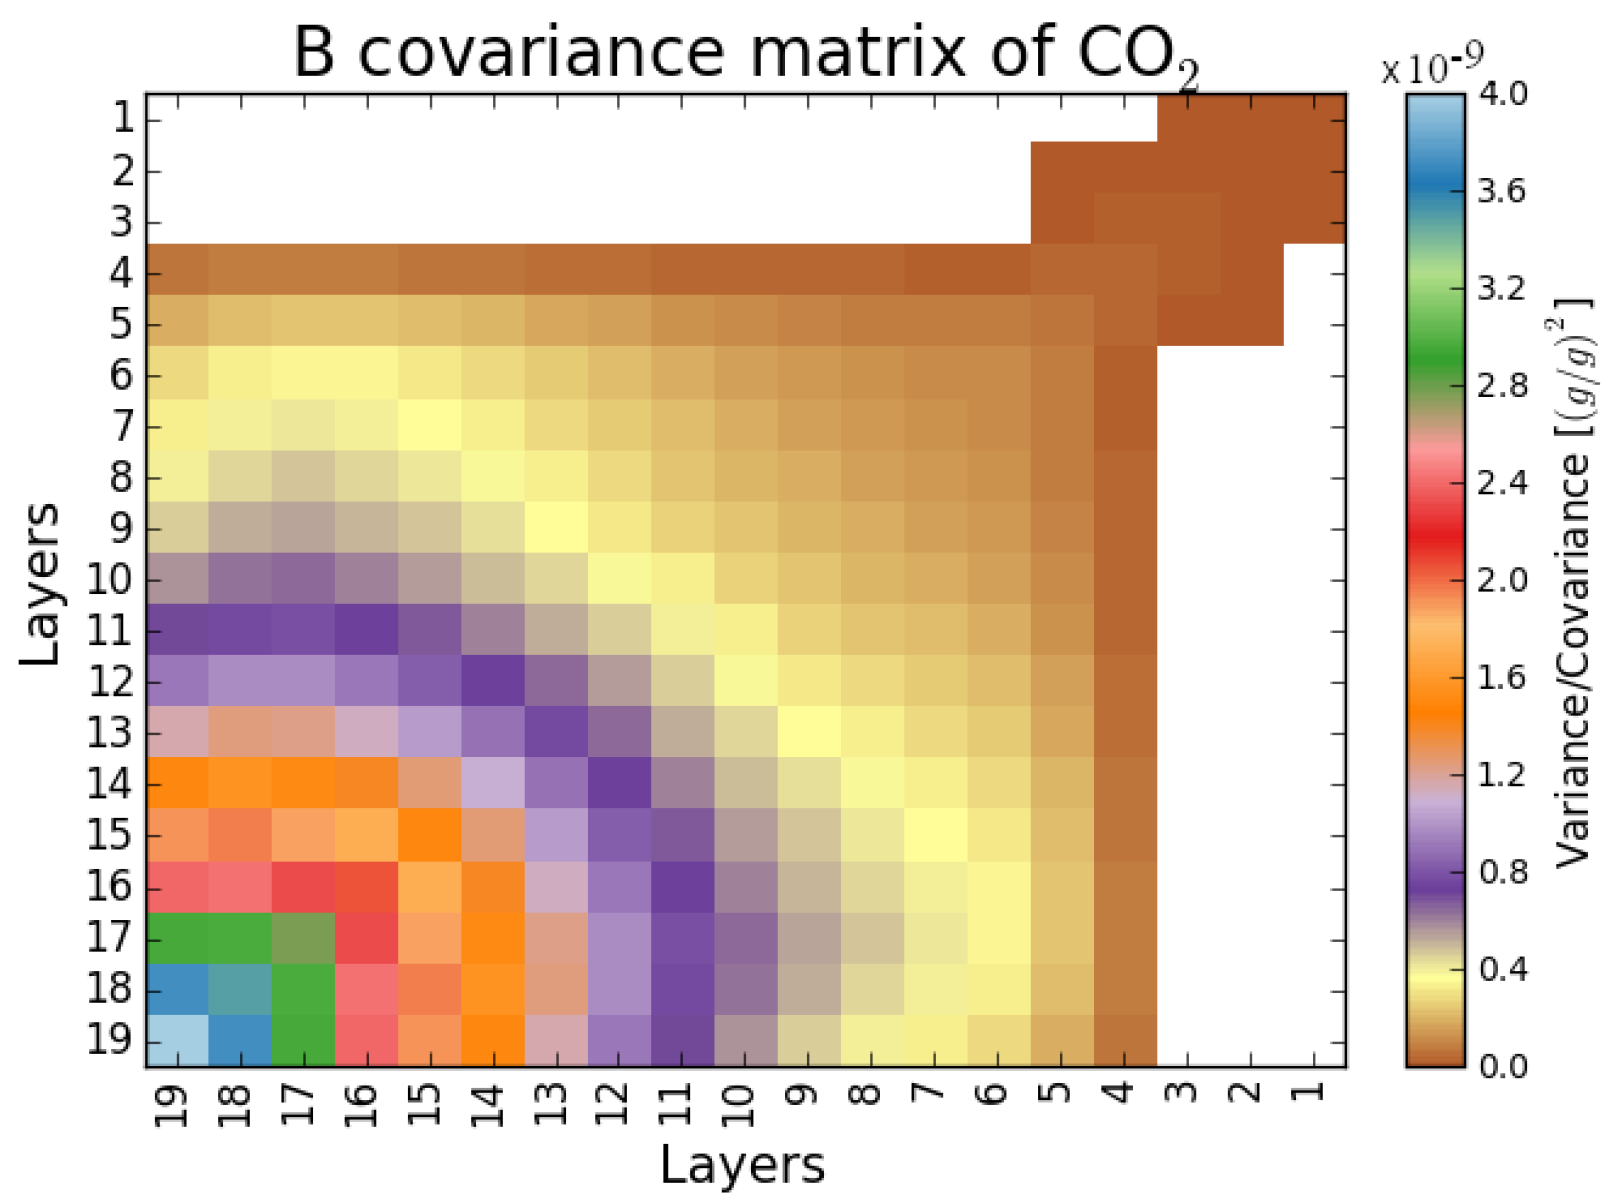
B is the background covariance matrix taken from Dogniaux et al. [28]. It gives the correlation of the errors on XCO 2 between the vertical levels (Figure 11).
H C O 2 S W I R is the vector, computed by 4A/OP, of the partial derivatives of the radiances in SWIR with respect to the concentration of CO 2 . E is the observational error, and F is the radiative transfer mode error. F should represent all sources of error in the direct non-linear model (knowledge of spectroscopy, vertical discretisation, horizontal homogeneity, etc.). As it is not possible to model all of them, F is usually estimated on real data, where the observation error is assumed to be well known. However, the optimal estimation formalism indicates that the errors in the control variables that are not correlated with the CO 2 profile or with each other must be considered as a matrix F = H x Σ x H x T , where H x is the Jacobian with respect to the variable x, and Σ x is the matrix of errors for this variable.
For each case in the database, we also ran 5AI to get σ a , which is the standard deviation of the CO 2 column concentration, CAVK = W T K H = W T W T A B 1 , which is the column averaging kernel, and ϵ a , which is the mean effective error. We assume accessing the mean effective error by running 5AI with no error in the measurements but only differences in the CO 2 concentration or in the AODs between the actual value used to compute the observations and the value used a priori induce an effective error. We check the results obtained with analytical Equations (3), (4) and (6) against those obtained with the 5AI code. For Equation (6), we proceed by iteration in the same way as for 5AI. In both cases, we need to evaluate the full non-linear radiative transfer model, but not at the same points.

3.2. Predictor and Predictant Selection for Random Error

Following the approach used for CarbonSat [16], we establish linear regressions to compute the random error.
First, a set of six predictors derived from Buchwitz et al. [16] is selected: solar zenith angle (SZA), shortwave infrared albedo (ALB), cirrus optical depth (COD), cirrus top height (CTH), aerosol optical depth (AOD), and a sixth predictor for which the original form was retained. This results in the following regression equation:
σ C O 2 = C 0 + C 1 S Z A + C 2 A L B + C 3 A O D + C 4 C O D + C 5 C T H + C 6 A O D cos ( 84 ) cos ( S Z A + 9 ) S Z A 75 1.01 A L B + 0.01 1 0.01
Then, for a better description of random error variability, we attempted to develop a rational approach to the definition of predictors by trying to express the variance of the estimate of XCO 2 analytically and simplifying it with limited developments. However, we were unable to obtain a set of predictors that could be justified by this approach. But an empirical approach guided by this research gives good results, so we did not pursue our investigations further. We define a second set of five predictors that lead to the following regression equation, with μ = cos ( S Z A ) :
σ C O 2 = A 0 + A 1 A L B A L B ( 1 + μ ) ( 1 + μ ) + A 2 A L B ( 1 + μ ) ( 1 + μ ) μ + A 3 A L B ( 1 + μ ) ( 1 + μ ) + A 4 ( A O D + C O D ) ( 1 A L B ) A L B ( 1 + μ ) 2 μ + A 5 ( A O D + C O D ) ( 1 A L B ) ( 1 + μ ) 2
We do not include a dependence on CTH in this second set because we did not find an expression with this variable that significantly improved the results.
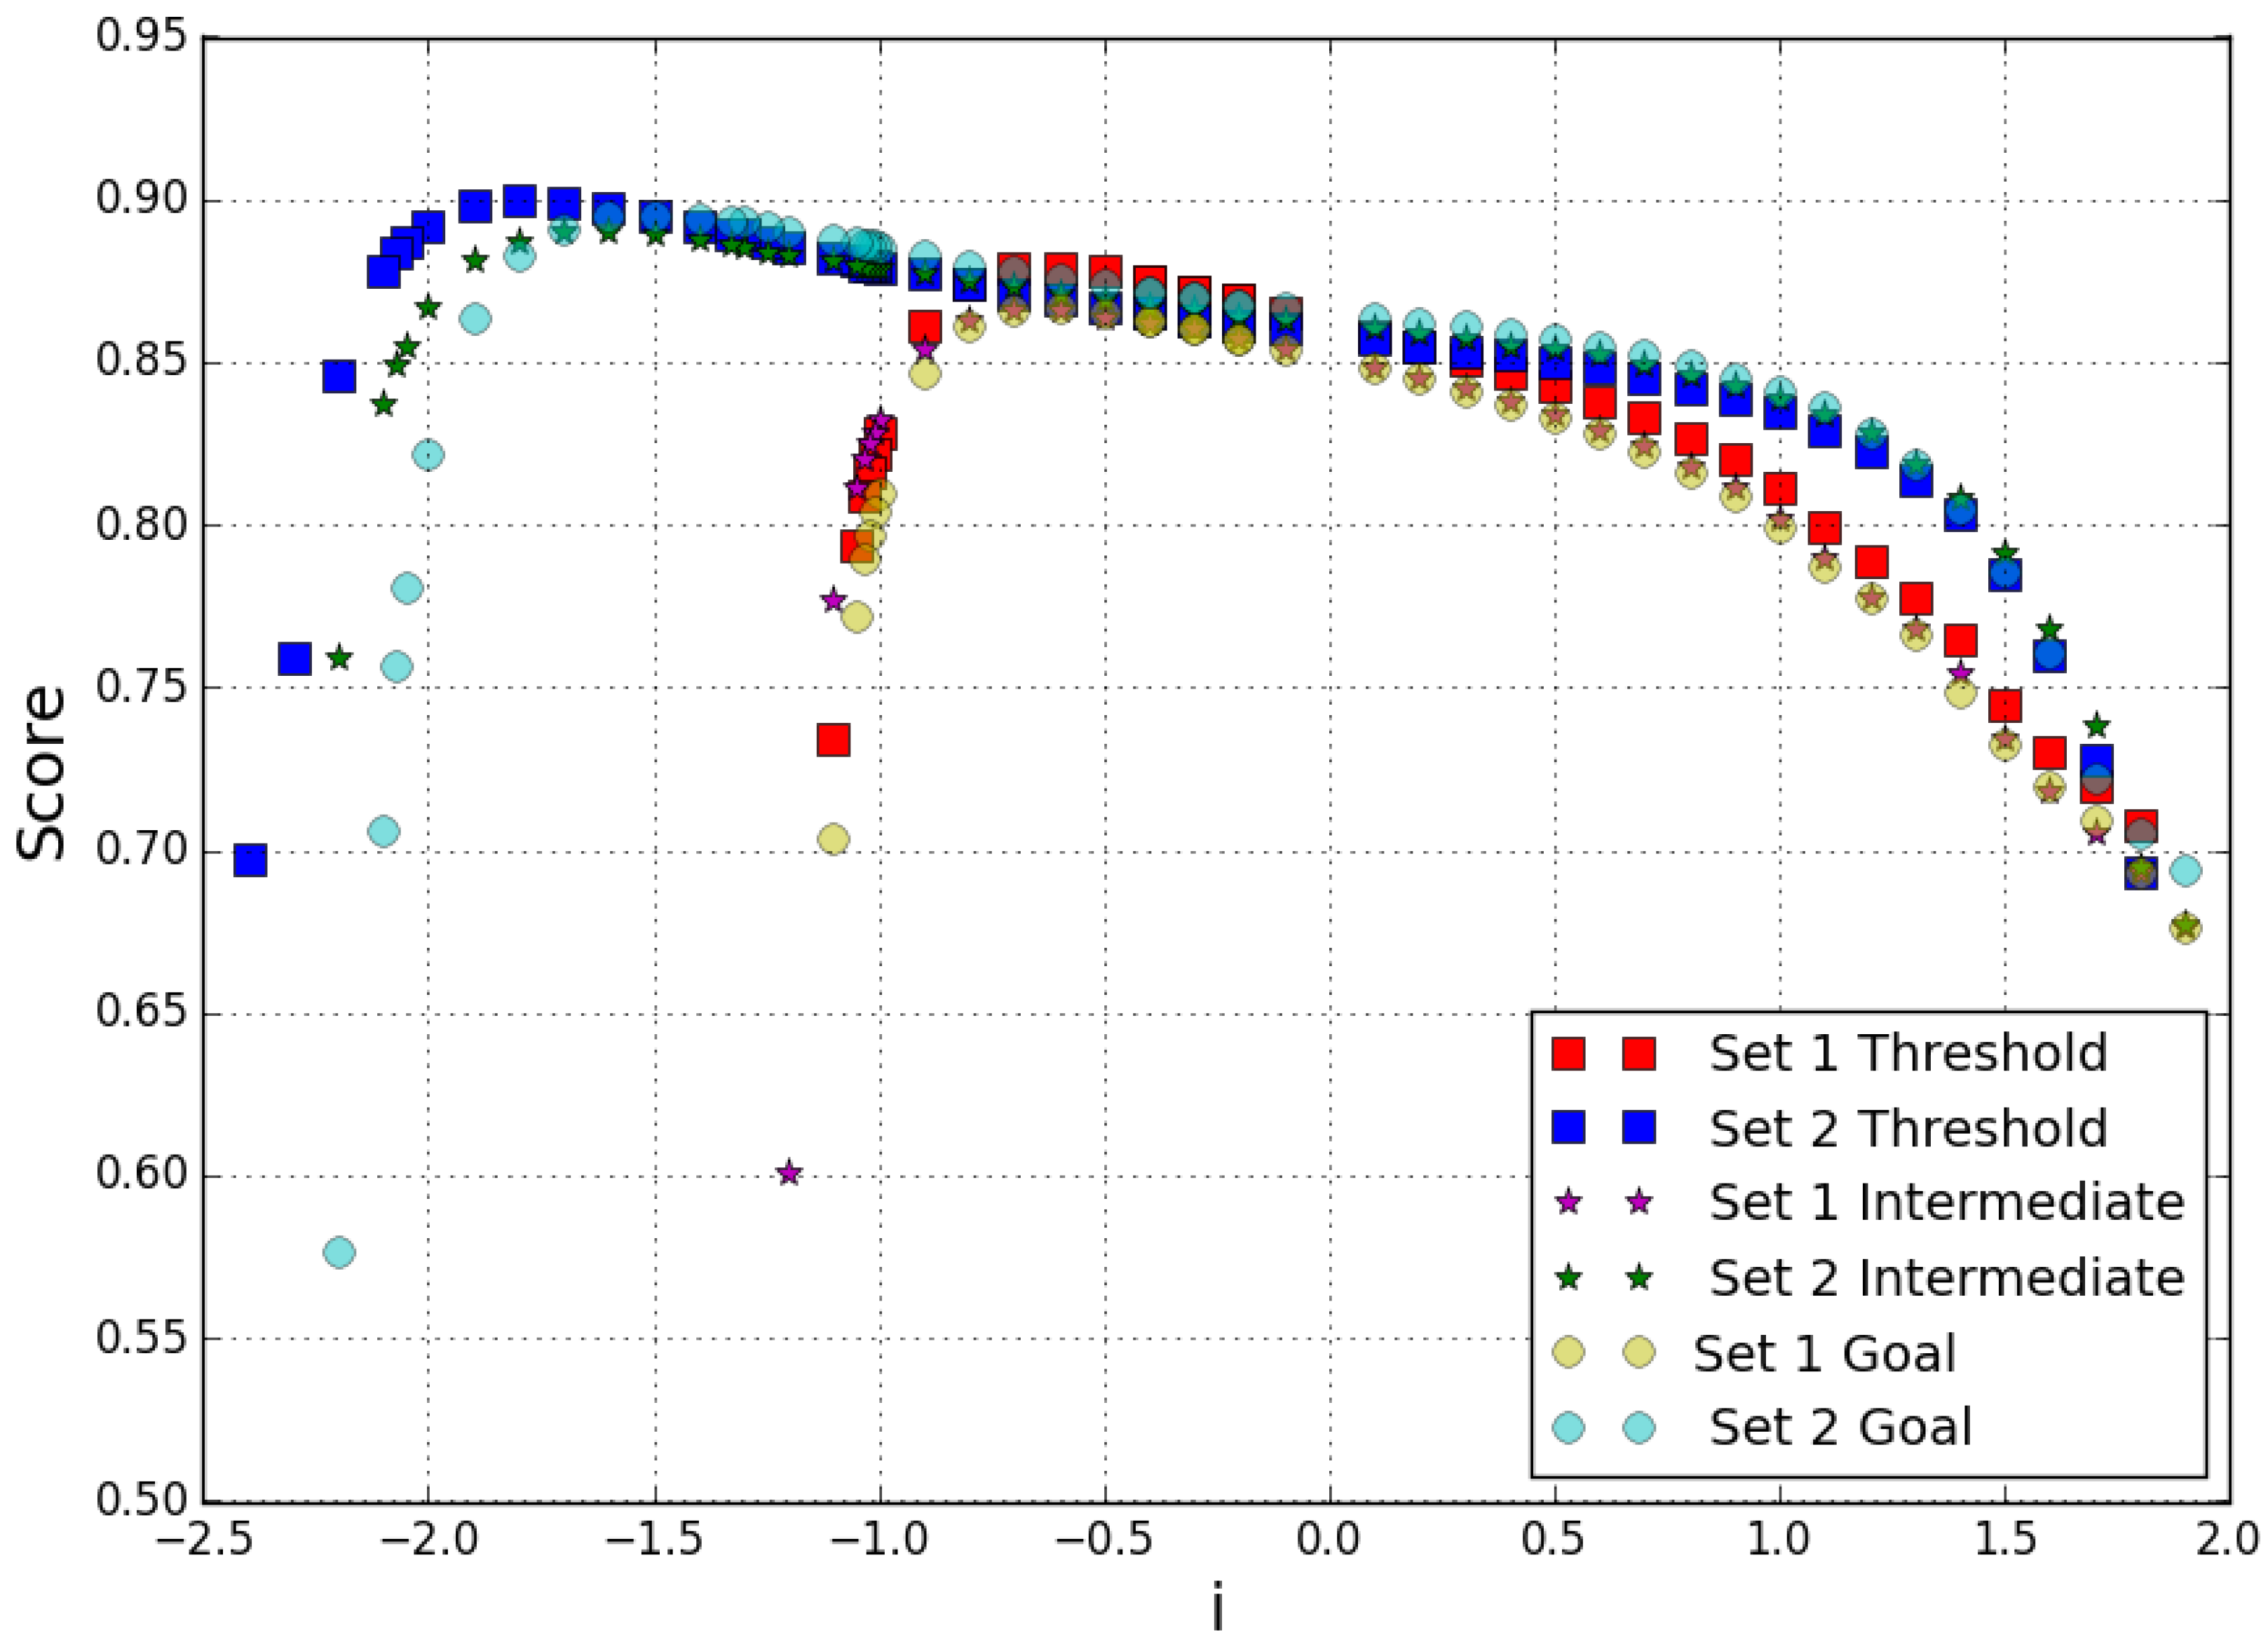
We also examine the effect on the adjustment of the use of a power of the standard deviation as a predictant. Indeed, it is natural to ask whether the linear regression should be on the standard deviation or on the variance of the random error. In addition, considering linear regression for negative powers of the standard deviation of the random error gives more weight to deviations for small values, which are more meaningful for later use, than to large values, which mainly indicate that the data are of poor quality. Instead of fitting the standard deviation of XCO 2 ( σ ), we assume that A 1 or σ 2 should be more predictable. Also, in the two-step assimilation scheme, it is preferable to have a good evaluation of small σ values than of large ones corresponding to poor-quality data. Since we could easily test values other than 1 or 2 for the exponent, we studied the sensitivity of the regression parameters to this exponent i. We observe that the result with set 1 can be improved by changing for the predictant the standard deviation exponent from i = 1 to i = −0.5 and that our empirical set gives better results for almost all exponents i.
For each of the three noise levels considered in Table 2, we fit the linear regression coefficients to the 975 values of the database using as predictants different powers of the standard deviation of the random error. To compare the results, we use the following score computed on the database:
s c o r e = 1 d a t a b a s e ( σ t r u e σ s i m ) 2 σ t r u e 2
This score is always less than one, and the quality of the fit to the database is measured by how close it is to one, regardless of the predictant chosen.
Figure 12 shows how the score varies with the i-value for the three noise levels. Set 1 gives the best score (0.879) for i close to −0.5. The best score for set 2 (0.91) is obtained with i close to −1.7. As i varies, the score varies less for this second set.
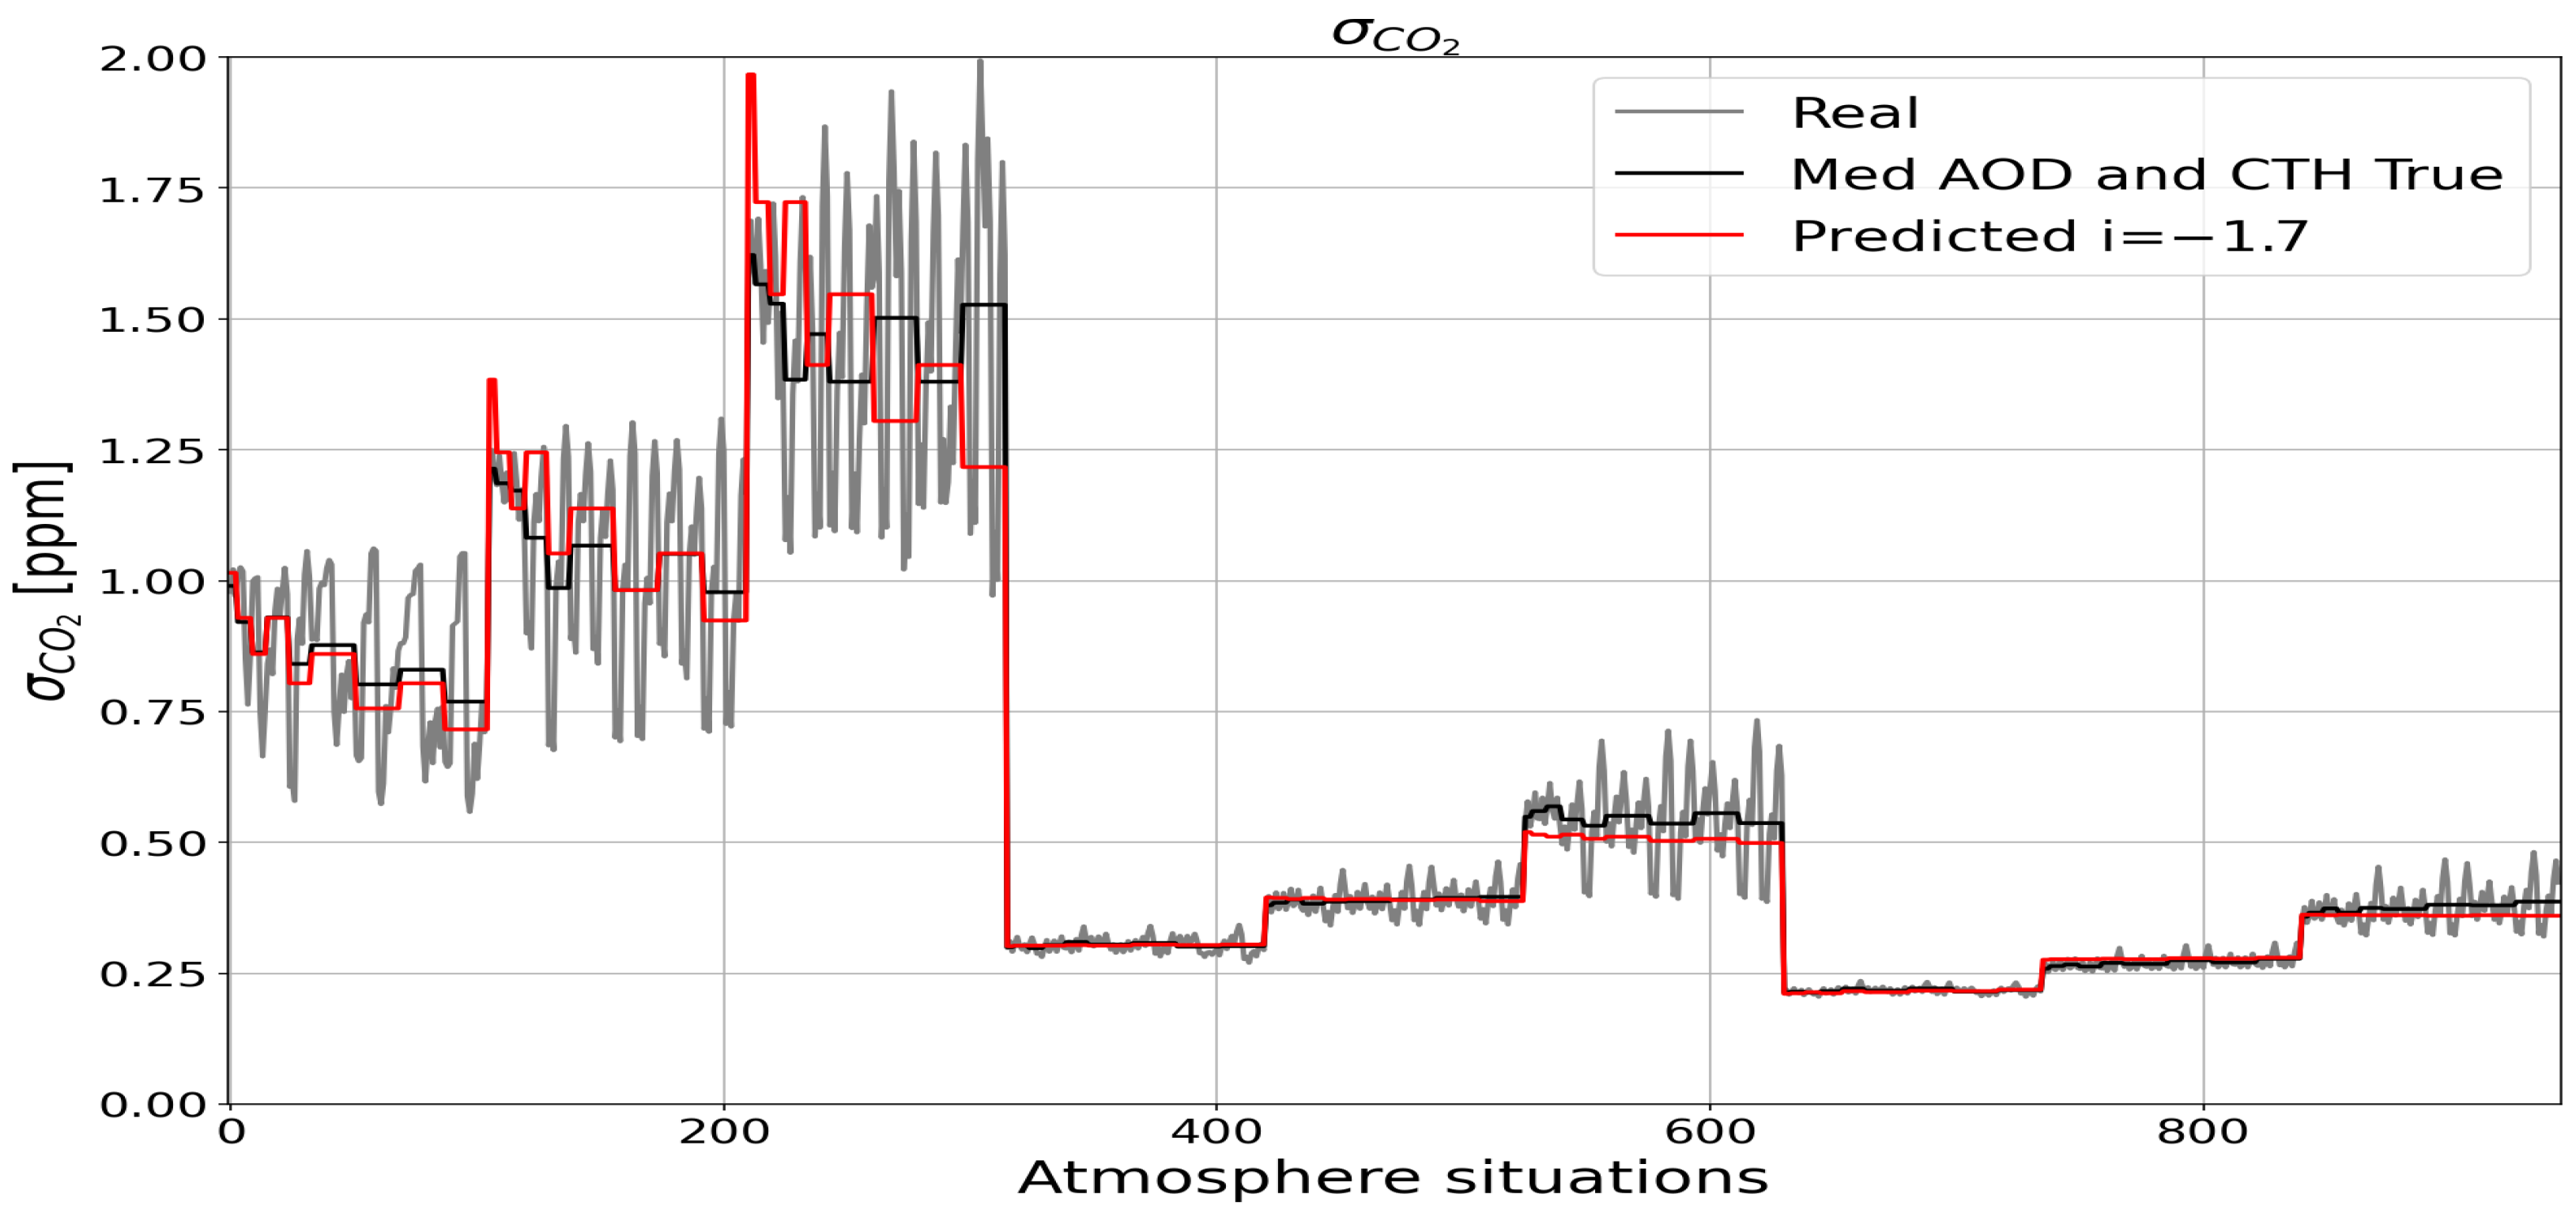
Figure 13 displays three curves: the grey curve represents σ C O 2 t r u e , the red curve represents σ C O 2 s i m computed with set 2, and the black curve is an average of the grey one and represents the variability accessible by the simulated standard deviation. The linear regression used to generate the red curve cannot capture variations in standard deviation for different atmospheres, aerosol types, or cirrus altitudes because it does not use that information. It is evident that the red curve is closer to the black curve than to the grey curve.
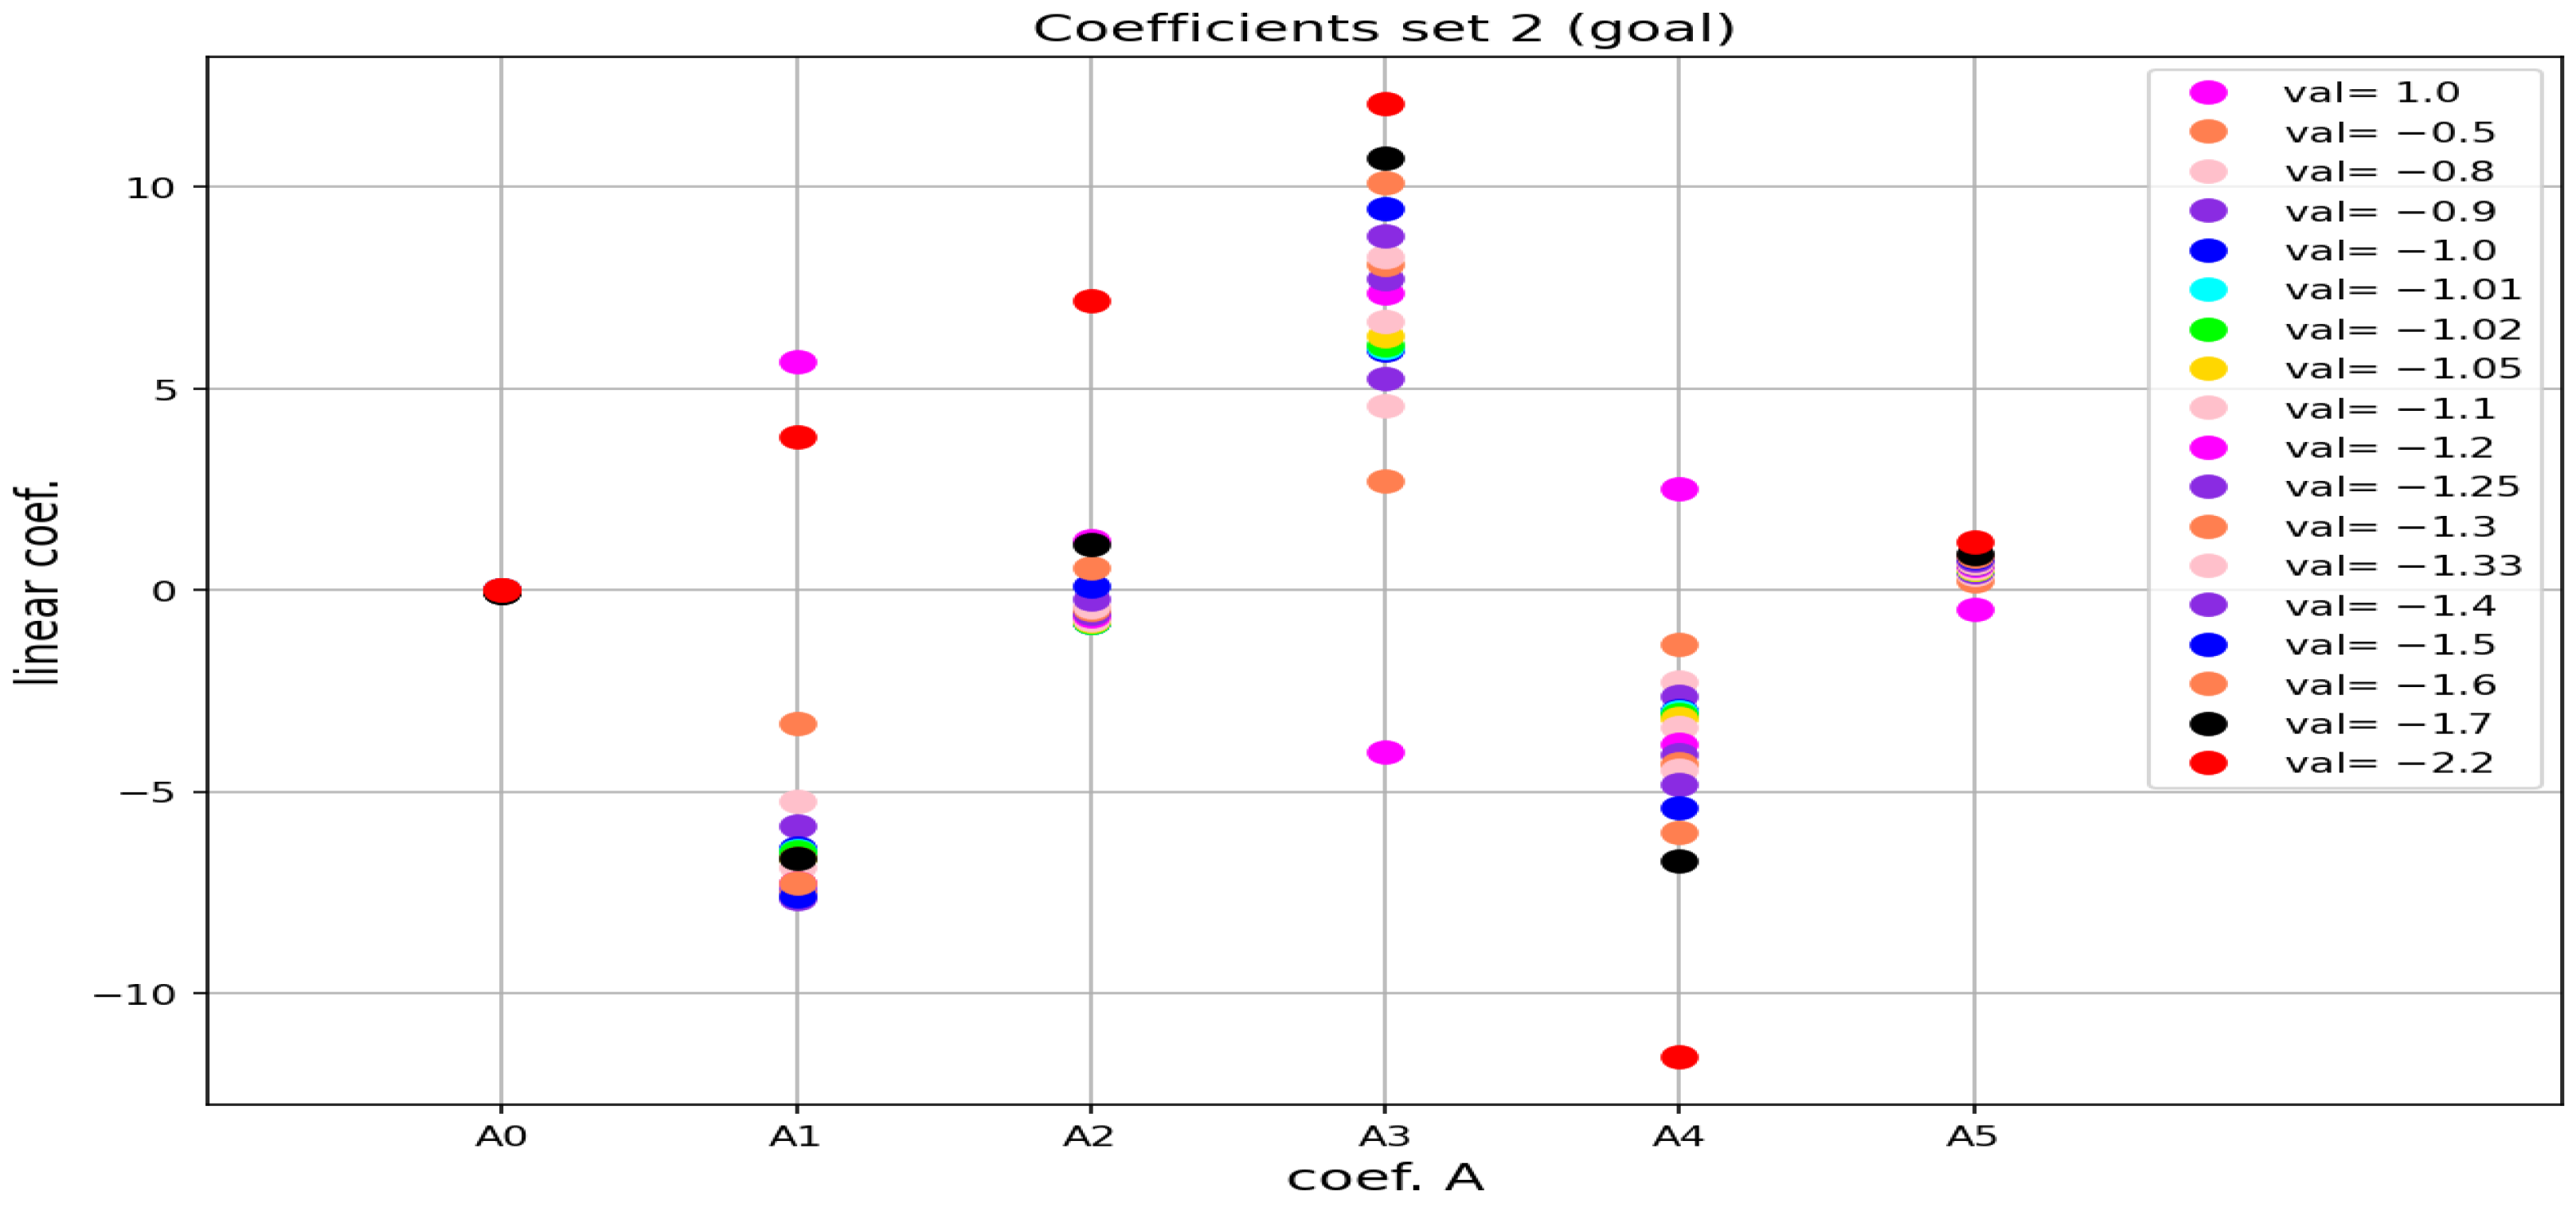
The most relevant coefficients are A 1 , A 3 , and A 4 (which are associated, respectively, with the terms ALB2 ( 1 + μ ) 2 , ALB μ ( 1 + μ ) 2 , and (AOD + COD) (1-ALB) ALB μ ( 1 + μ ) 2 dependencies, respectively). These coefficients exhibit the most significant values, varying slowly and regularly with i (see Figure 14). The variations are stronger for extreme values of i (the last red points) and are associated with a rapid decrease in the score illustrated in Figure 12.
Table 4 presents the five coefficients of set 2 obtained by linear regression with i = 1.7 for each noise level. These coefficients are used to estimate the random error on the CO 2 column in the multi-month simulations.

3.3. Averaging Kernel

In order to compare the gas columns obtained from different remote sensing instruments, we need to know the column averaging kernels (CAVK) that define how the vertical average is computed. These averaging kernels are also necessary for proper assimilation of the columns (to eliminate the influence of the a priori information used in the inversion).
Using Equation (4) and W from Equation (8), we compute the CAVKs as:
CAVK = W T K H = W T ( I A 1 B )
Figure 15 shows these CAVKs for different sets of albedos and SZAs and for scattering cases with only one layer of scatterers. When there are multiple layers of scatterers, the CAVKs are more or less identical to the combined curves for each scatterer taken separately. As already mentioned, we have checked that, apart from a few details (which can be explained by the fact that the H Jacobians are not computed at exactly the same point in the two approaches), the CAVKs computed in this way and those obtained using 5AI are identical.
It is clear that with sufficient albedo, the inversion results in a uniform average over the whole vertical column up to the stratosphere. The weight of the layers only decreases above 200 hPa. On the other hand, as the albedo approaches 0, the weight of the layers, on average, decreases almost linearly with the pressure from the ground. In the presence of a scattering layer, the importance of the CO 2 concentration immediately above it is significantly increased, with a corresponding decrease in the importance of the lower layers. This is particularly evident when modelling cirrus clouds with low albedo (the right column in Figure 15) and low or high SZA (the top or bottom row in Figure 15). If the vertical distribution of the scatterers is not homogeneous, this will significantly affect the estimate of the total CO 2 column. It is not possible to approximate the shape of CAVKs in the vertical by parabolic functions when the albedo is small.
We perform linear regressions at each level with the same predictors as previously defined for the σ C O 2 fit. The results (Figure 16) obtained with predictor sets 1 and 2 are comparable. The vertical variability of the CAVK is systematically reduced. Set 2 does not show the same advantage observed in the standard deviation simulation, as it has not been empirically tuned to represent the CAVK. Due to the low albedo cases, the level-by-level fits are not as effective as the random error fit and are often less than 0.5 (for an optimal value of 1).

3.4. Mapping of the CO2 Errors Using MODIS Data

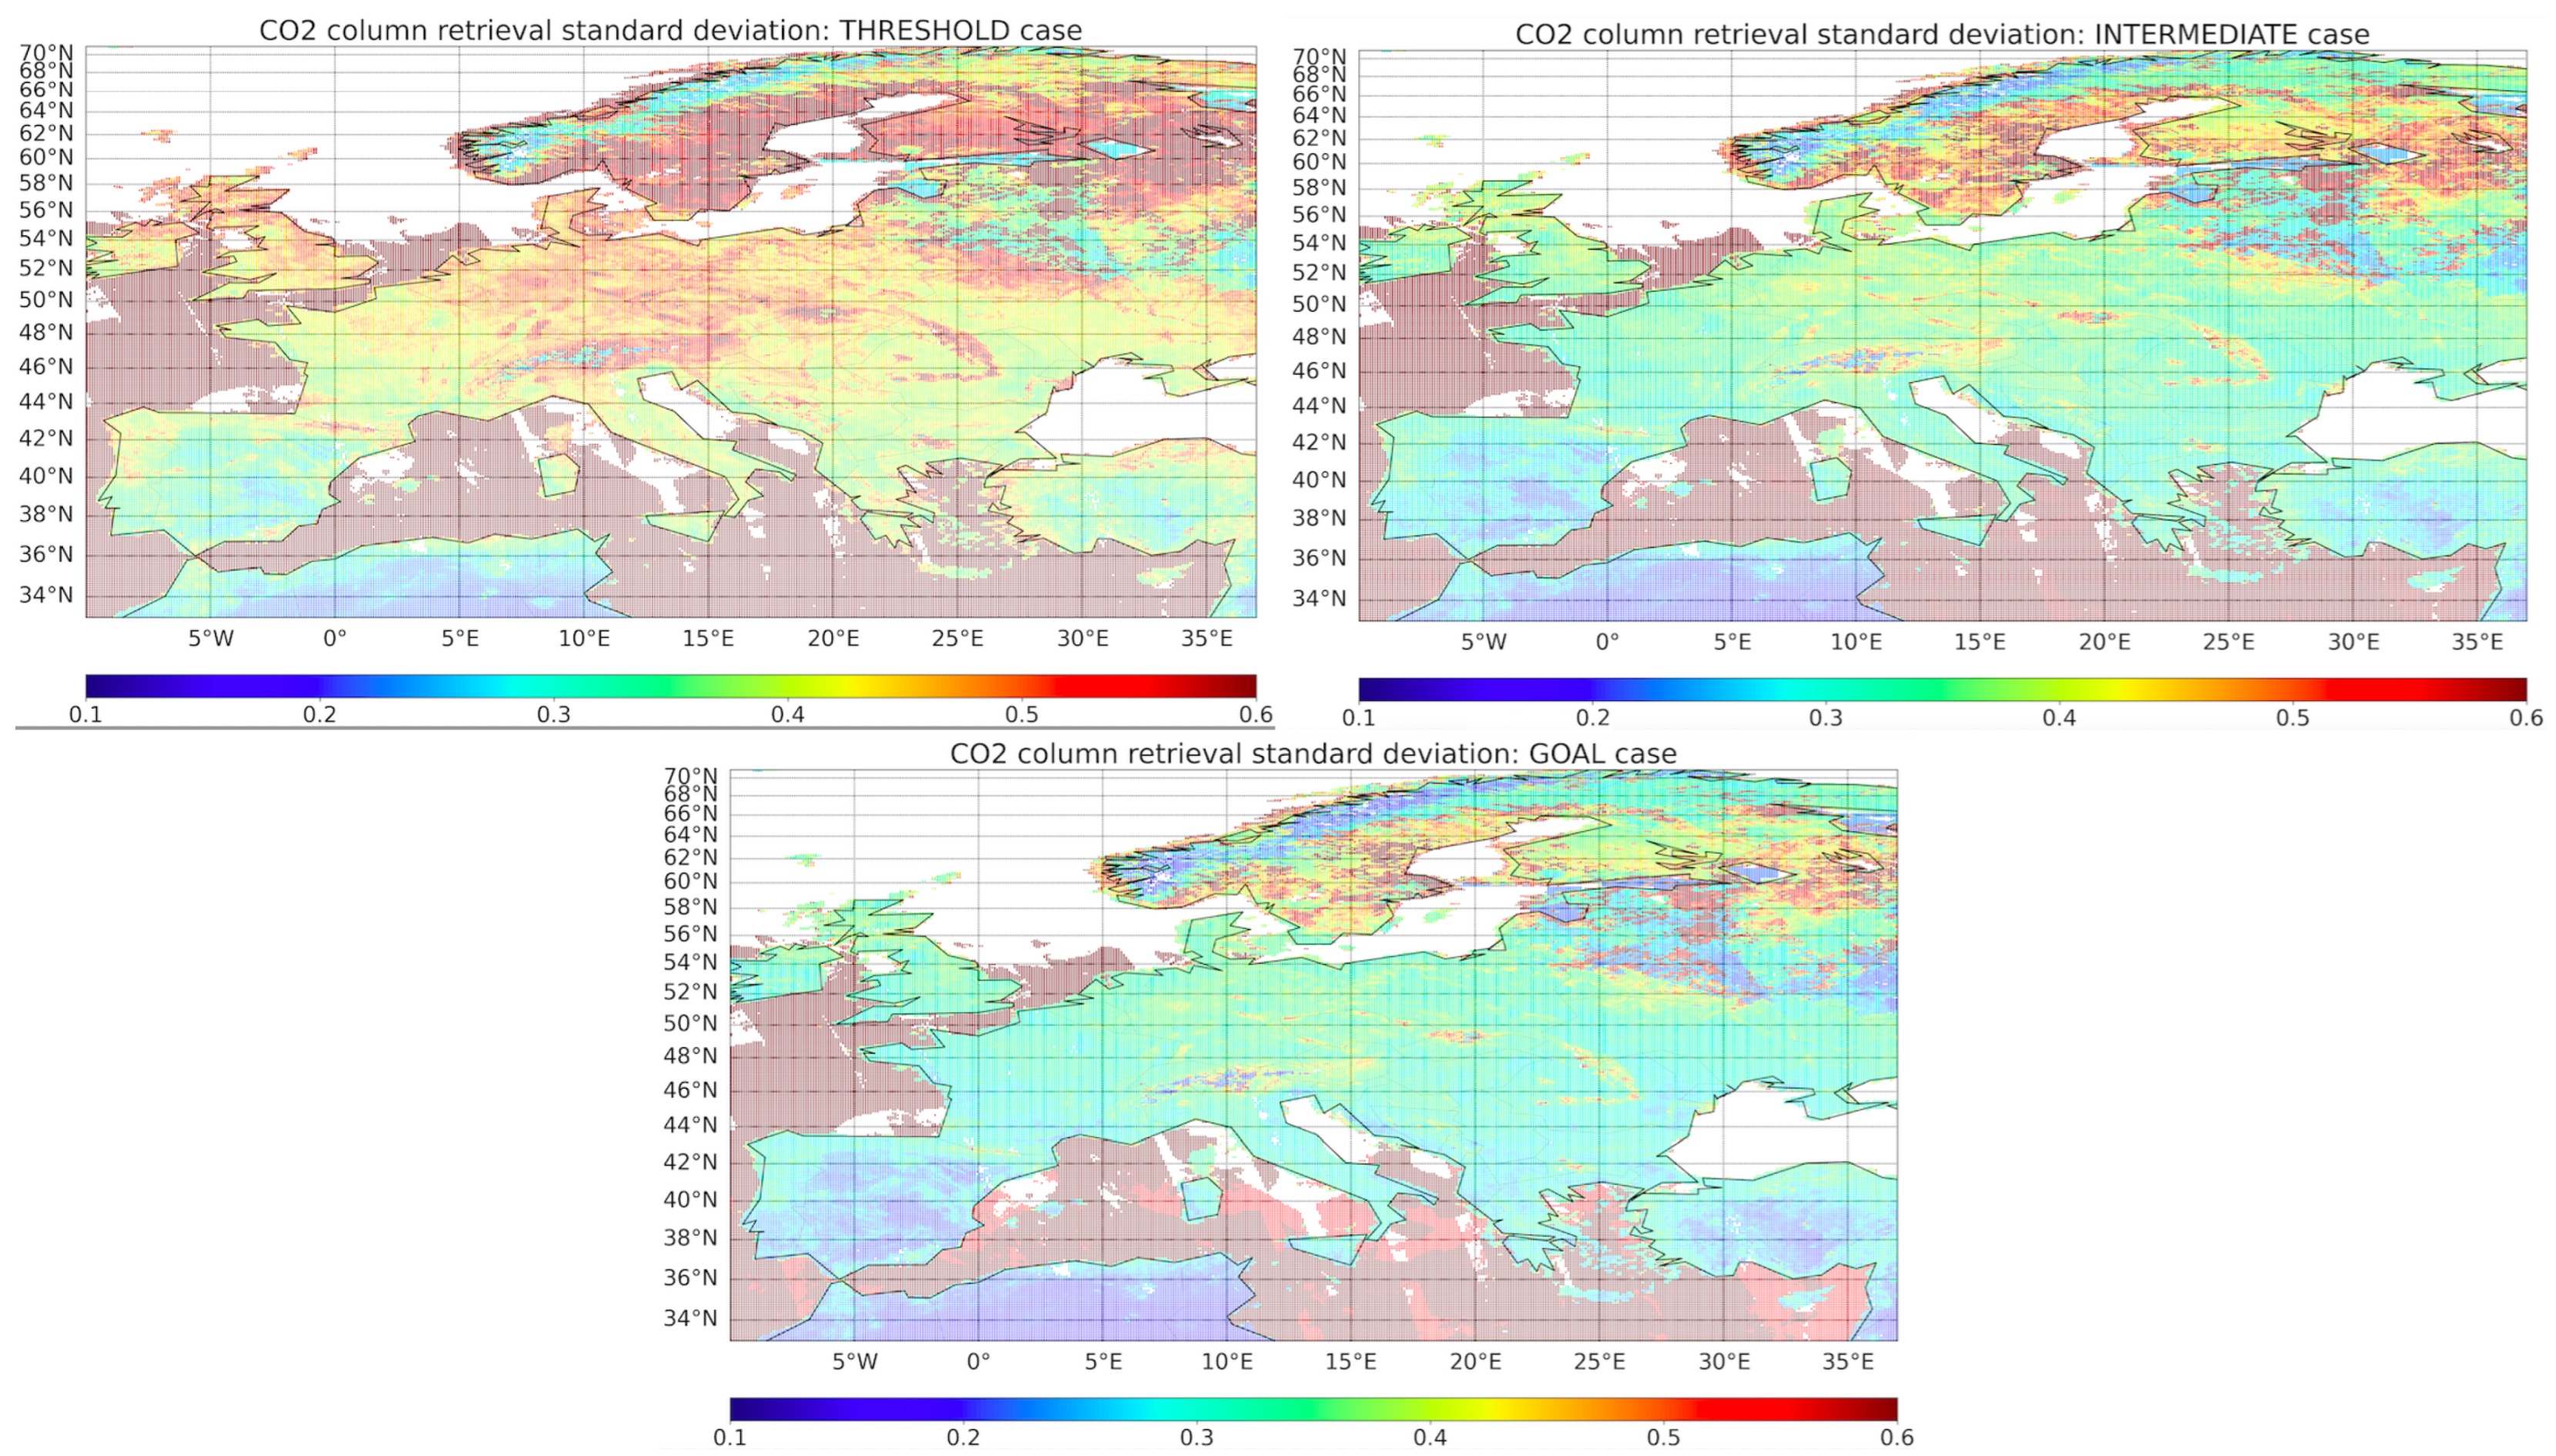
In order to obtain random error maps, linear regressions were applied to the MODIS data from March to May 2020. Over 6.6 million points were processed for each level of noise. The results of the linear regressions, which were established with the second set of predictors and the predictant ( σ X C O 2 ) 1.7 , are shown in Figure 17 for the three instrument noise levels.

4. Discussion

4.1. Two-Step Procedure Relevance

As shown in Appendix A, the two-step procedure is equivalent to the one-step procedure if care is taken to use the same error estimates for all sources of information or to make the appropriate corrections. There is no loss of information associated with the operational practice of separating data extraction and flux determination. However, at the level of the retrieved XCO 2 , there is often a loss of information due to the transition from profiles to integrated content.

4.2. Random Error and CAVK Versus Effective Error

It should be noted that the random error and the CAVK are necessary to estimate the contribution of a satellite instrument. However, the actual error is not. The actual error of XCO 2 results from the effective errors of the various radiative transfer parameters and is not a property of the observing system. However, estimating this error is a way of describing the effects of systematic errors for other parameters. For example, if we are working without diffusion, we may want to estimate the average bias due to undetected aerosols.
Without performing an inversion, it is possible to compute the random error and the CAVK using Equations (3) and (4) just by directly simulating the spectra and Jacobians. In contrast, the actual error and even the systematic error due to bias in the background estimate depend on a correction term that can only be computed by iterations if the difference between the background and the true state exceeds the linearity limit of H N L . In other words, it is not possible to predict the actual error or even its average value for a large number of measurements without using an iterative scheme that invokes the non-linear model. Nevertheless, in the absence of a full inversion procedure, the bias on XCO 2 resulting from the bias on some radiative transfer inputs can be estimated by a simple fixed-point scheme (Equation (6)).

4.3. Random Error Maps

The main visible feature is the contrast between land and sea, which is due to the low albedo values of the sea. Secondly, the error decreases with orography, which may indicate that the relative error in the CO 2 concentration remains constant. But we also notice that the albedo used is very high for snow-covered mountains. Regarding the variation of uncertainties with noise level, the features remain consistent across all maps, with only the intensity changing. In detail, the errors for XCO 2 with the TRACE instrument over land are around 0.4 ppm for the “Threshold” noise, around 0.35 ppm for the “Intermediate” noise, and around 0.30 ppm for the “Goal” noise. As a usual user requirement is about 1 ppm, these values appear optimistic, being 3 to 4 times better than those for the CarbonSat instrument. However, they are consistent with the level of noise prescribed for the TRACE instrument (refer to Figure 4), and, moreover, the radiative transfer modelling errors were not taken into account even for the aerosol properties. As our primary motivation was the development and validation of tools, we have focused our attention on the conceptual aspects of the project rather than spending time on the numerical results. For an effective performance evaluation, it would be essential to question and re-examine the various input data.

5. Conclusions and Perspectives

This article is primarily methodological, since the instrumental concept studied is not planned to fly. Three results are of particular interest.
First, to estimate the contribution of a satellite instrument on the basis of its noise level and spatial coverage, a two-step approach can be used, in line with operational practice. This consists of separating the inversion of the satellite data to obtain an atmospheric CO 2 profile from the assimilation of the latter in a Kalman filter to retrieve the carbon sources and sinks. This approach is not only effective, but it also provides the best linear unbiased estimate (BLUE) when rigorously implemented.
Second, random error maps of CO 2 content and maps of CAVK can be produced using the Bayesian formalism without implementing any inversion scheme. All that is required is a radiative transfer code that provides the sensitivity of the measurements to be simulated to CO 2 concentrations and certain other quantities (aerosol and cloud optical depth in this article). This can be used to evaluate a priori instrument performance without building an inversion system.
Third, linear regressions can be fitted to reproduce the variability of random errors and averaging kernels over hundreds of cases. These regressions can easily be used to produce random error maps over several months.
The perspectives arising from this work are to quantify the impact on the carbon fluxes of various simplifications during the step corresponding to the Kalman filter: not updating the covariance matrix error on the a priori contribution of the XCO 2 profile, using only the CO 2 column instead of the full profile, or defining super-observations to reduce the number of assimilated observations in a geographical box at a given time. Improving the description of CAVKs by identifying a different set of predictors from those used for σ a is also a development axis for the future.
It would also be of interest to test the results presented in Appendix A on real data: namely, that when a Kalman filter utilises data from a previous inversion, the value of the inverted columns and their uncertainties should be modified in accordance with the background covariance matrix at time t.

Author Contributions

C.C. initiated this work. B.B.S. and V.C. defined the steps to improve the error generation method. O.C. processed the MODIS data and prepared the configurations for the radiative transfer simulations. V.C. performed the mathematical developments. B.B.S. wrote the first version of this article and prepared the figures. C.C. made many comments and suggestions. O.C. carefully read the paper. All authors have read and agreed to the published version of the manuscript.

Funding

This research was funded by TRACE (TRAcking Carbon Emissions) and the ANR (Agence Nationale de la Recherche) industrial chair, financed by Suez, Thales Alenia Space (TAS), and TotalEnergies.

Data Availability Statement

The raw data supporting the conclusions of this article will be made available by the authors on request.

Acknowledgments

The authors would like to thank the sponsors of the TRACE chair for their support and Philippe Ciais (LSCE) for the management of the chair. They are grateful for the stimulating exchanges with Grégoire Broquet (LSCE) and Denis Siméoni (TAS) during the project. They are also grateful for the stimulating comments of the reviewers, which greatly improved this article.

Conflicts of Interest

The authors declare no conflicts of interest.

Abbreviations

The following abbreviations are used in this manuscript:
AEMSAtmospheric Environment Monitoring Satellite
ALBALBedo
ANRAgence Nationale pour la Recherche
AODAerosol Optical Depth
AVKAVeraging Kernel
BLUEBest Linear Unbiased Estimator
CAVKColumn AVeraging Kernel
CNESCentre National d’Etudes Spatiales
CNSAChinese National Space Administration
CODCirrus Optical Depth
CO2MCopernicus Carbon Dioxide Monitoring Mission
CTHCirrus Top Height
ESAEuropean Space Agency
ISRFInstrumental Spectral Response Function
JAXAJapanese Aerospace eXploration Agency
FWHMFull Width at Half Maximum
GEISAGestion et Etudes des Informations Spectroscopiques Atmosphériques
GHGGreenHouse Gas
GOSATGreenhouse gas Observation SATellite
IPDAIntegrated Path Differential Absorption
LIDORTLInearised Discrete Ordinate Radiative Transfer
LMDLaboratoire de Météorologie Dynamique
LSCELaboratoire des Sciences du Climat et de l’Environnement
MITRMIneral TRansported
MODISModerate Resolution Imaging Spectroradiometer
MRDMission Requirements Document
NASANational Aeronautics and Space Administration
NIRNear InfraRed
OCOOrbital Carbon Observatory
SNRSignal-to-Noise ratio
SWIRShort-Wave InfraRed
SZASun Zenith Angle
TASThales Alenia Space
TCCONTotal Carbon Column Observing Network
TIGRThermodynamic Initial Guess Retrieval
TRACETRAcking Carbon Emission
VZAViewing Zenith Angle
WASOWAter SOluble
4A/OPAutomated Atmospheric Absorption Atlas/OPerational version
5AIAdaptable 4A Inversion

Appendix A. Prerequisites for an Optimal Two-Step Procedure

Previous studies [31] have asserted that specific conditions must be met in order to ensure equivalence between the two-step procedure and the direct assimilation of satellite data into the flux model. In fact, the two procedures only differ, as we shall see, because of the limitation of the inversion of satellite data to the integrated column.
Subsequently, the variables x are marked x ˜ in the one-step procedure and x ˇ for step 1 and x ^ for step 2 in the two-step procedure. Using Equations (2)–(4), we obtain for the two-step procedure:
Step 1: The retrieval of the CO 2 concentration profile or column, denoted by x ˇ a , is carried out using an a priori value x ˇ b and its error covariance matrix, denoted by B ˇ , together with the observed radiances y 0 and their error covariance matrix, denoted by E ˇ . This is achieved through the use of a radiative transfer model, denoted by H ˇ N L , and its linearisation, denoted by H ˇ , with F ˇ denoting the radiative transfer modelling error. To address the scenario for which only a portion of a profile is retrieved, we introduce the G N L operator. This operator can be the identity operator, and its linearisation is denoted G. Its purpose is to reconstruct a complete profile, as required by radiative transfer, from the quantities to be retrieved, i.e., x ˇ .
x ˇ a = x ˇ b + K ˇ y o H ˇ N L G N L ( x ˇ b )
with K ˇ = B ˇ G T H ˇ T ( E ˇ + F ˇ + H ˇ G B ˇ G T H ˇ T ) 1
Step 2: In a flux model, data assimilation provides an estimated value of the sources and sinks of CO 2 (denoted by x ^ a ) derived from a priori x b ^ with its error covariance matrix B ^ and from x ˇ a , which are the retrieved parameters obtained in step 1 (profiles or columns), with their error covariance matrix E ^ . The transport model used to link CO 2 sources and sinks to CO 2 concentrations is denoted by H ^ N L ; its linearisation is by H ^ , while the transport modelling error is quantified by F ^ . The operator Z N L transforms the variables accessible in the transport model into the variables retrieved in step 1, and its linearisation is denoted Z.
To eliminate the linear impact of the a priori information used in step 1, the assimilated observations are y ^ o = x ˇ a ( I K ˇ H ˇ G ) x ˇ b = K ˇ y o H ˇ N L G N L ( x ˇ b ) + H ˇ G x ˇ b . This trick is the reason why the AVK ( K ˇ H ˇ G ) and the a priori ( x ˇ b ) have to be delivered together with x ˇ a . The observation error covariance matrix becomes E ^ = K ˇ ( E ˇ + F ˇ ) K ˇ T , the observation operator becomes H n e w N L = K ˇ H ˇ G Z N L H ^ N L , and the operator K ˇ H ˇ G Z carries into the observation space the model errors for the variables of the transport model represented by the matrix F ^ .
x ^ a = x ^ b + K ^ y ^ o H n e w N L ( x ^ b ) = x ^ b + K ^ y ^ o K ˇ H ˇ G Z N L H ^ N L ( x ^ b )
with K ^ = B ^ H n e w ( E ^ + K ˇ H ˇ G Z F ^ Z T G T H ˇ T K ˇ T + H n e w B H n e w T ) 1
K ^ = B ^ H ^ T Z T G T H ˇ T K ˇ T E ^ + K ˇ H ˇ G Z ( F ^ + H ^ B ^ H ^ T ) Z T G T H ˇ T K ˇ T 1
which can be written
x ^ a = x ^ b + K ^ K ˇ y o H ˇ G Z N L H ^ N L ( x ^ b )
with K ^ K ˇ = B ^ H ^ T Z T G T H ˇ T K ˇ T K ˇ E ˇ + F ˇ + H ˇ G Z ( F ^ + H ^ B ^ H ^ T ) Z T G T H ˇ T K ˇ T 1 K ˇ
For the one-step procedure with the same Bayesian formalism and the same notations, the estimates correspond to:
x ˜ a = x ^ b + K ˜ y o H ˇ N L G N L Z N L H ^ N L ( x ^ b )
with K ˜ = B ^ H ^ T Z T G T H ˇ T ( E ˇ + F ˇ + H ˇ G Z F ^ Z T G T H ˇ T + H ˇ G Z H ^ B ^ H ^ T Z T G T H ˇ T ) 1
where G N L Z N L represents the path from the variables available in the transport model to the variables needed for radiative transfer modelling via the subset of variables retrieved in step 1. It is possible that the operator G N L Z N L may result in the loss of information, particularly in relation to the decision to assimilate only a portion of the data available in step 1 in step 2. However, this loss of information is not inherent in the difference between the one-step procedure and the two-step procedure.
The quantity x ˜ a is, by construction, the BLUE. To ensure the two-step procedure gives the same result of x ^ a = x ˜ a , it is enough to have K ^ K ˇ = K ˜ . If we assume:
H ˇ G Z B ˇ Z T G T H ˇ T = H ˇ G Z ( H ^ B ^ H ^ + F ^ ) Z T G T H ˇ T
K ^ K ˇ = K ˜ becomes:
H ^ T Z T G T H ˇ T K ˇ T K ˇ H ˇ G Z B ˇ Z T G T H ˇ T + R ˇ K ˇ T 1 K ˇ = H ^ T Z T G T H ˇ T H ˇ G Z B ˇ Z T G T H ˇ T + R ˇ 1
but K ˇ = B ˇ G T H ˇ T H ˇ G B ˇ G T H ˇ T + R ˇ 1 = A ˇ G T H ˇ T R ˇ 1 , so it is enough that:
G T H ˇ T R ˇ 1 H ˇ G A ˇ B ˇ G T H ˇ T H ˇ G B ˇ G T H ˇ T + R ˇ 1 H ˇ G B ˇ 1 B ˇ G T H ˇ T = G T H ˇ T
which can be rewritten with A ˇ 1 B ˇ 1 = G T H ˇ T R ˇ 1 H ˇ G as
( A ˇ 1 B ˇ 1 ) A ˇ A ˇ ( A ˇ 1 B ˇ 1 ) B ˇ 1 B ˇ = I
that is,
( I B ˇ 1 A ˇ ) I B ˇ 1 A ˇ 1 = I
which is obviously always true.
Given the condition of Equation (A10), the two-step procedure is optimal. Information loss only occurs if the inversion of satellite data is limited to a subset of variables in step 1, which requires the reconstruction of all parameters necessary for radiative transfer with G. Equation (A10) is mandatory because it expresses that the background errors in the radiance space used in step 1 are indeed those that should be used in a direct assimilation of radiances in the flux model.
In addition, if the first step was performed with B ˇ = B ˇ 1 instead of B ˇ = B ˇ 2 (the value required by Equation (A10)), to obtain the optimal result, it is sufficient to replace the variables x ˇ a and A ˇ in the second step with:
x = A A ˇ 1 x ˇ a B ˇ 1 1 x ˇ b = A A ˇ 1 x ˇ a ( I x K ˇ H ˇ ) x ˇ b
A = A A ˇ 1 B ˇ 1 1 A ˇ = A A ˇ 1 K ˇ H ˇ A ˇ
with A 1 = B ˇ 2 1 B ˇ 1 1 + A ˇ 1

References

  1. Wunch, D.; Toon, G.C.; Blavier, J.F.L.; Washenfelder, R.A.; Notholt, J.; Connor, B.J.; Griffith, D.W.T.; Sherlock, V.; Wennberg, P.O. The Total Carbon Column Observing Network. Philos. Trans. R. Soc. A Math. Phys. Eng. Sci. 2011, 369, 2087–2112. [Google Scholar] [CrossRef]
  2. Frey, M.; Sha, M.K.; Hase, F.; Kiel, M.; Blumenstock, T.; Harig, R.; Surawicz, G.; Deutscher, N.M.; Shiomi, K.; Franklin, J.E.; et al. Building the COllaborative Carbon Column Observing Network (COCCON): Long-term stability and ensemble performance of the EM27/SUN Fourier transform spectrometer. Atmos. Meas. Tech. 2019, 12, 1513–1530. [Google Scholar] [CrossRef]
  3. Yokota, T.; Oguma, H.; Morino, I.; Higurashi, A.; Aoki, T.; Inoue, G. Test measurements by a BBM of the nadir-looking SWIR FTS aboard GOSAT to monitor CO2 column density from space. In Proceedings of the 4th International Asia-Pacific Environmental Remote Sensing Symposium 2004: Remote Sensing of the Atmosphere, Ocean, Environment, and Space, Honolulu, HI, USA, 8–12 November 2004; Tsay, S.C., Yokota, T., Ahn, M.H., Eds.; SPIE: Philadelphia, PA, USA, 2004; Volume 12. [Google Scholar] [CrossRef]
  4. Crisp, D. NASA Orbiting Carbon Observatory: Measuring the column averaged carbon dioxide mole fraction from space. J. Appl. Remote Sens. 2008, 2, 023508. [Google Scholar] [CrossRef]
  5. Taylor, T.E.; Eldering, A.; Merrelli, A.; Kiel, M.; Somkuti, P.; Cheng, C.; Rosenberg, R.; Fisher, B.; Crisp, D.; Basilio, R.; et al. OCO-3 early mission operations and initial (vEarly) XCO2 and SIF retrievals. Remote Sens. Environ. 2020, 251, 112032. [Google Scholar] [CrossRef]
  6. Yang, D.; Liu, Y.; Cai, Z.; Chen, X.; Yao, L.; Lu, D. First Global Carbon Dioxide Maps Produced from TanSat Measurements. Adv. Atmos. Sci. 2018, 35, 621–623. [Google Scholar] [CrossRef]
  7. Liu, Y.; Wang, J.; Yao, L.; Chen, X.; Cai, Z.; Yang, D.; Yin, Z.; Gu, S.; Tian, L.; Lu, N.; et al. The TanSat mission: Preliminary global observations. Sci. Bull. 2018, 63, 1200–1207. [Google Scholar] [CrossRef] [PubMed]
  8. Yang, D.; Boesch, H.; Liu, Y.; Somkuti, P.; Cai, Z.; Chen, X.; Noia, A.D.; Lin, C.; Lu, N.; Lyu, D.; et al. Toward High Precision XCO2 Retrievals From TanSat Observations: Retrieval Improvement and Validation Against TCCON Measurements. J. Geophys. Res. Atmos. 2020, 125, e2020JD032794. [Google Scholar] [CrossRef] [PubMed]
  9. Han, G.; Ma, X.; Liang, A.; Zhang, T.; Zhao, Y.; Zhang, M.; Gong, W. Performance Evaluation for China’s Planned CO2-IPDA. Remote Sens. 2017, 9, 768. [Google Scholar] [CrossRef]
  10. Pascal, V.; Buil, C.; Loesel, J.; Tauziede, L.; Jouglet, D.; Buisson, F. An improved microcarb dispersive instrumental concept for the measurement of greenhouse gases concentration in the atmosphere. In Proceedings of the International Conference on Space Optics—ICSO 2014, Tenerife, Spain, 6–10 October 2014; Cugny, B., Sodnik, Z., Karafolas, N., Eds.; SPIE: Philadelphia, PA, USA, 2017; Volume 11. [Google Scholar] [CrossRef]
  11. Meijer, Y. Copernicus CO2 Monitoring Mission Requirements Document; EOP-SM/3088/YM-ym, Issue 2.0; ESA: Montreal, QC, Canada, 2019; p. 82. [Google Scholar]
  12. Santaren, D.; Broquet, G.; Bréon, F.M.; Chevallier, F.; Siméoni, D.; Zheng, B.; Ciais, P. A local—To national-scale inverse modeling system to assess the potential of spaceborne CO2 measurements for the monitoring of anthropogenic emissions. Atmos. Meas. Tech. 2021, 14, 403–433. [Google Scholar] [CrossRef]
  13. Connor, B.J.; Siskind, D.E.; Tsou, J.J.; Parrish, A.; Remsberg, E.E. Ground-based microwave observations of ozone in the upper stratosphere and mesosphere. J. Geophys. Res. 1994, 99, 16757. [Google Scholar] [CrossRef]
  14. Connor, B.J.; Boesch, H.; Toon, G.; Sen, B.; Miller, C.; Crisp, D. Orbiting Carbon Observatory: Inverse method and prospective error analysis. J. Geophys. Res. Atmos. 2008, 113, D05305. [Google Scholar] [CrossRef]
  15. Dogniaux, M.; Crevoisier, C.; Armante, R.; Capelle, V.; Delahaye, T.; Cassé, V.; De Mazière, M.; Deutscher, N.M.; Feist, D.G.; Garcia, O.E.; et al. The Adaptable 4A Inversion (5AI): Description and first XCO2 retrievals from Orbiting Carbon Observatory-2 (OCO-2) observations. Atmos. Meas. Tech. 2021, 14, 4689–4706. [Google Scholar] [CrossRef]
  16. Buchwitz, M.; Reuter, M.; Bovensmann, H.; Pillai, D.; Heymann, J.; Schneising, O.; Rozanov, V.; Krings, T.; Burrows, J.P.; Boesch, H.; et al. Carbon Monitoring Satellite (CarbonSat): Assessment of atmospheric CO2 and CH4 retrieval errors by error parameterization. Atmos. Meas. Tech. 2013, 6, 3477–3500. [Google Scholar] [CrossRef]
  17. Beirle, S.; Lampel, J.; Lerot, C.; Sihler, H.; Wagner, T. Parameterizing the instrumental spectral response function and its changes by a super-Gaussian and its derivatives. Atmos. Meas. Tech. 2017, 10, 581–598. [Google Scholar] [CrossRef]
  18. Ide, K.; Courtier, P.; Ghil, M.; Lorenc, A.C. Unified Notation for Data Assimilation: Operational, Sequential and Variational (gtSpecial IssueltData Assimilation in Meteology and Oceanography: Theory and Practice). J. Meteorol. Soc. Jpn. Ser. II 1997, 75, 181–189. [Google Scholar] [CrossRef]
  19. Daley, R. Atmospheric Data Analysis; Cambridge Atmospheric and Space Science Series; Cambridge University Press: Cambridge, UK, 1991; p. 457. [Google Scholar]
  20. Rodgers, C.D. Inverse Methods for Atmospheric Sounding; World Scientific: Singapore, 2000. [Google Scholar] [CrossRef]
  21. Scott, N.A.; Chedin, A. A Fast Line-by-Line Method for Atmospheric Absorption Computations: The Automatized Atmospheric Absorption Atlas. J. Appl. Meteorol. Climatol. 1981, 20, 802–812. [Google Scholar] [CrossRef]
  22. Cheruy, F.; Scott, N.; Armante, R.; Tournier, B.; Chedin, A. Contribution to the development of radiative transfer models for high spectral resolution observations in the infrared. J. Quant. Spectrosc. Radiat. Transf. 1995, 53, 597–611. [Google Scholar] [CrossRef]
  23. Jacquinet-Husson, N.; Armante, R.; Scott, N.; Chédin, A.; Crépeau, L.; Boutammine, C.; Bouhdaoui, A.; Crevoisier, C.; Capelle, V.; Boonne, C.; et al. The 2015 edition of the GEISA spectroscopic database. J. Mol. Spectrosc. 2016, 327, 31–72. [Google Scholar] [CrossRef]
  24. Armante, R.; Scott, N.; Crevoisier, C.; Capelle, V.; Crepeau, L.; Jacquinet, N.; Chédin, A. Evaluation of spectroscopic databases through radiative transfer simulations compared to observations. Application to the validation of GEISA 2015 with IASI and TCCON. J. Mol. Spectrosc. 2016, 327, 180–192. [Google Scholar] [CrossRef]
  25. Spurr, R. Simultaneous derivation of intensities and weighting functions in a general pseudo-spherical discrete ordinate radiative transfer treatment. J. Quant. Spectrosc. Radiat. Transf. 2002, 75, 129–175. [Google Scholar] [CrossRef]
  26. Hess, M.; Koepke, P.; Schult, I. Optical Properties of Aerosols and Clouds: The Software Package OPAC. Bull. Am. Meteorol. Soc. 1998, 79, 831–844. [Google Scholar] [CrossRef]
  27. Chevallier, F.; Chédin, A.; Cheruy, F.; Morcrette, J.J. TIGR-like atmospheric-profile databases for accurate radiative-flux computation. Q. J. R. Meteorol. Soc. 2000, 126, 777–785. [Google Scholar] [CrossRef]
  28. Dogniaux, M.; Crevoisier, C.; Gousset, S.; Le Coarer, E.; Ferrec, Y.; Croizé, L.; Wu, L.; Hasekamp, O.; Sic, B.; Brooker, L. The Space Carbon Observatory (SCARBO) concept: Assessment of XCO2 and XCH4 retrieval performance. Atmos. Meas. Tech. 2022, 15, 4835–4858. [Google Scholar] [CrossRef]
  29. Vermote, E.F.; Roger, J.C.; Ray, J.P. MODIS Surface Reflectance User’s Guide; Version 1.4; NASA: Washington, DC, USA, 2015. [Google Scholar]
  30. Levy, R.; Hsu, C.; MODIS Atmosphere Science Team. MOD04_L2 MODIS/Terra Aerosol 5-Min L2 Swath 10 km; NASA Level 1 and Atmosphere Archive and Distribution System Distributed Active Archive Center: Washington, DC, USA, 2015. [Google Scholar] [CrossRef]
  31. Chevallier, F. On the statistical optimality of CO2 atmospheric inversions assimilating CO2 column retrievals. Atmos. Chem. Phys. 2015, 15, 11133–11145. [Google Scholar] [CrossRef]
Figure 1. One-step and two-step procedures.
Remotesensing 16 02452 g001
Figure 2. Flowchart for obtaining random error maps (and AVKs) on XCO 2 retrieved from a satellite mission: classical approach to inverting satellite data (red arrows), with improvements to limit the number of inversions by linear adjustment of the errors (yellow–green arrows), and with direct use of matrix computation to avoid full development of the inverse method (blue arrows). The grey arrows represent the flow of information.
Remotesensing 16 02452 g002
Figure 3. The instrumental spectral response functions in the wavelength domain prescribed for each frequency band: NIR (red line), SWIR1 (black line), and SWIR2 (blue line).
Remotesensing 16 02452 g003
Figure 4. The instrumental noise level (in W/m2/sr/cm−1) for the SWIR1 and SWIR2 bands as a function of the flux received (in the same unit) for the three different options (“Threshold” (red), “Intermediate” (orange), and “Goal” (green)) and for CarbonSat (black) and CO2M (blue).
Remotesensing 16 02452 g004
Figure 5. Radiance spectra for the three bands SWIR2, SWIR1, and NIR. The top line corresponds to SZA = 00°, while the bottom line corresponds to SZA = 70°. The scene observed at the nadir is the TIGR atmosphere representative of the air masses found in the temperate mid-latitudes. The albedo is 0.02 in SWIR and 0.06 in NIR. The black curves correspond to the case without scattering, while the coloured curves correspond to the cases with scattering (AOD = 0.05). The aerosol types are water soluble (WASO) in red, mineral transported (MITR) in blue, and soot (SOOT) in green.
Remotesensing 16 02452 g005
Figure 6. The values of σ o (in W/m2/sr/cm−1) as a function of the wavenumber (in cm 1 ) for the same scene as in Figure 5 (case without scattering). Each curve corresponds to an instrument noise level.
Remotesensing 16 02452 g006
Figure 7. Histogram of the frequency of aerosol optical depths at 0.55 μm over 30 days in 2020.
Remotesensing 16 02452 g007
Figure 8. Maps of sun zenith angle, albedo, and aerosol thickness for all the MODIS paths over Europe during the period from March to May in 2020. The data have been averaged across 0.1° squares.
Remotesensing 16 02452 g008
Figure 9. Different scattering situations: blue—cloud, yellow—MITR aerosol, violet—SOOT aerosol, and orange—WASO aerosol of varying thickness. The y-axis represents the altitude of the scattering layers.
Remotesensing 16 02452 g009
Figure 10. Range of values for solar zenith angle (SZA), albedo (ALB), cloud top high (CTH), cloud optical depth (COD), and aerosol optical depth (AOD) used in the simulations.
Remotesensing 16 02452 g010
Figure 11. Matrix B in ( g / g ) 2 used to compute σ X C O 2 . Layer 19 represents the layer closest to the surface. The white area means that the variance/covariance is zero.
Remotesensing 16 02452 g011
Figure 12. For each of the three noise levels and the two sets of predictors, the score measuring the quality of the fit is plotted on the y-axis against the values of i on the x-axis.
Remotesensing 16 02452 g012
Figure 13. For a given set of atmospheric conditions, presented in Figure 10, the standard deviation of the random errors using the optimal predictor for set 2 of predictors (in red), the actual values (in grey), and the average of the actual values for the parameters not conditioned in the regression (in black).
Remotesensing 16 02452 g013
Figure 14. Values of the five coefficients of set 2 obtained by linear regression with different values of i for the predictant.
Remotesensing 16 02452 g014
Figure 15. The 9 images correspond to different albedos ( 0.3 in column 1, 0.15 in column 2, and 0.02 in column 3) and different angles of solar incidence (zenith in row 1, 50° in row 2, and 70° in row 3). In each image, there are 11 curves corresponding to the clear case and the first 10 scattering cases in Figure 9 (cyan is the clear sky case, green are the cirrus cases, blue are the MITR cases, red are the WASO cases, and black are the soot cases).
Remotesensing 16 02452 g015
Figure 16. Averaging kernels: red dots represent the CAVK values, and blue dots are the predicted values using the linear regression. For each level, a green dot is added as the mean of the CAVK values, and a black star is added as the mean of the predicted values. The magenta line represents the score (Equation (11)), which measures the quality of the fit.
Remotesensing 16 02452 g016
Figure 17. Maps of the standard deviation of XCO 2 simulated for all paths over Europe during the period from March to May in 2020 for the three instrumental noise levels. Each point corresponds to a mean over the period on a square of 0.1°, and its colour is a function of the level of the standard deviation of the expected random error for the estimation of the CO 2 column for the sun zenith angle, reflectance, and aerosol conditions of that location on that day. White areas are regions where there is no clear MODIS data to provide the information for the computations.
Remotesensing 16 02452 g017
Table 1. Specifications for the three frequency bands: band boundaries (in wavelength and wavenumber), the width of the instrument spectral response function (ISRF), assumed to be super-Gaussian with a parameter 2 [17], sampling step, and number of samples.
BandISRF FWHMSampling StepNumber of Samples
(nm)(cm−1)(nm)(nm)
NIR747–77312,936–13,3870.120.04651
SWIR11590–16755970–62890.300.10851
SWIR21990–20954773–50250.350.1166901
Table 2. A and B from Equation (1) for each band and for the three instrumental noise levels.
Luminance inSWIR2SWIR1NIR
Photons/s/cm2/sr/nm
ThresholdA11.010 × 10−89.24 × 10−81.84 × 10−8
B146.78513 × 103134.34701 × 1037.04246 × 103
IntermediateA16.3 × 10−813.70 × 10−82.96 × 10−8
B146.78603 × 103134.34702 × 10310.56227 × 103
GoalA23.7 × 10−819.50 × 10−83.72 × 10−8
B307.04588 × 103283.37915 × 10315.33655 × 103
Table 3. The SNR values for TRACE instrument are compared to those of CarbonSat and CO2M for two reference levels of luminance in each frequency band. The first reference luminance is based on those used in Buchwitz et al. [16], and the second one is based on ESA CO2M MRD Table 4.8 [11].
SNRSWIR2SWIR1NIR
@Reference Luminance in@1.0/@1.8@4.1/@2.1@20.0/@6.4
10 12 Photons/s/cm2/sr/nm
Goal321/498768/492854/473
Intermediate293/442673/443763/424
Threshold217/337528/338601/333
CarbonSat205/—–323/—–334/—–
CO2M—–/400—–/400—–/330
Table 4. Coefficients A 0 to A 5 computed when the predictant is ( σ C O 2 ) 1.7 .
Noise LevelLinear Regression Coefficients
A 0 A 1 A 2 A 3 A 4 A 5
Threshold 7.3399 × 10 3 −2.82101.31416.6354−5.39000.57202
Intermediate 5.0150 × 10 2 −6.64411.126010.720−6.71360.91118
Goal 1.4309 × 10 1 −7.49811.838612.284−7.44140.95628
Disclaimer/Publisher’s Note: The statements, opinions and data contained in all publications are solely those of the individual author(s) and contributor(s) and not of MDPI and/or the editor(s). MDPI and/or the editor(s) disclaim responsibility for any injury to people or property resulting from any ideas, methods, instructions or products referred to in the content.