Abstract
Deep learning is currently the mainstream approach for building extraction tasks in remote-sensing imagery, capable of automatically learning features of buildings in imagery and yielding satisfactory extraction results. However, due to the diverse sizes, irregular layouts, and complex spatial relationships of buildings, extracted buildings often suffer from incompleteness and boundary issues. Gaofen-7 (GF-7), as a high-resolution stereo mapping satellite, provides well-rectified images from its rear-view imagery, which helps mitigate occlusions in highly varied terrain, thereby offering rich information for building extraction. To improve the integrity of the edges of the building extraction results, this paper proposes a dual-task network (Edge-UNet, EUnet) based on UNet, incorporating an edge extraction branch to emphasize edge information while predicting building targets. We evaluate this method using a self-made GF-7 Building Dataset, the Wuhan University (WHU) Building Dataset, and the Massachusetts Buildings Dataset. Comparative analysis with other mainstream semantic segmentation networks reveals significantly higher F1 scores for the extraction results of our method. Our method exhibits superior completeness and accuracy in building edge extraction compared to unmodified algorithms, demonstrating robust performance.
1. Introduction
Accurately and efficiently acquiring building information is crucial for real-time updating of foundational geographic databases, urban development planning, and dynamic monitoring. In recent years, satellite imagery acquired through remote sensing has demonstrated high spatial, spectral, and time resolutions with more detailed building information. These building features vary in scale and have irregular distributions, providing sufficient data support for the large-scale batch extraction of buildings. Additionally, deep-learning methods can automatically learn nonlinear features from images, significantly enhancing building extraction tasks.
Traditional methods for extracting buildings from high-resolution remote-sensing imagery often depend on the distinct features of buildings, such as spectral information [1], spatial information [2,3], texture features [4], and the Morphological Building Index (MBI) [5]. However, the diversity in building structures, spectra, and scales can complicate extraction tasks. Additionally, incomplete buildings extraction result from tree shading in images, which is caused by the shooting angle of remote-sensing satellites. This shading issue impacts the completeness of building extraction and often leads to missing edges.
Deep learning has become the predominant method for building extraction tasks. The convolutional neural network (CNN) model, introduced by Krizhevsky et al. [6], features multi-layer convolutional filter kernels that can automatically learn contextual features in images, demonstrating significant potential in computer vision and remote-sensing image object detection tasks [7,8]. Since 2015, specialized CNN architectures have been extensively developed and applied to semantic segmentation, where each pixel in an image is assigned a category label. These architectures, known as fully convolutional networks (FCNs) [9], differ from traditional CNNs by replacing the fully connected layer with a convolutional layer. This modification enables FCNs to process input images of any size and produce output feature maps of the same dimensions, allowing for pixel-level predictions.
FCNs utilize an encoder–decoder structure. The encoder comprises multiple convolutional and pooling layers that extract features from the input image, but this process compresses image information, potentially leading to a loss of detail. As a result, the building extraction outcomes may exhibit missing edges and unclear contours. To address this issue, the decoder component is essential. It up-samples the feature maps generated by the encoder, restoring them to the original input image size. This process ensures that the semantic segmentation results align with the dimensions of the input image, thereby improving the accuracy of building extraction.
FCNs perform well in building extraction [10,11]. Maggiorie et al. [12] utilized FCNs for building extraction to mitigate the discontinuities caused by block boundaries. Despite this, the back-convolutional upsampling in FCNs led to outputs that were fuzzy and smooth. To address this problem, Cui Weihong et al. [13] proposed replacing the upsampling technique in FCNs with that from the SegNet network, which partially resolved the issue of coarse building extraction results due to the basic anti-convolutional upsampling process. Similarly, Shrestha et al. [14] enhanced the FCN framework by incorporating post-processing conditional random fields (CRFs) to balance high accuracy with network complexity. Furthermore, FCNs have also demonstrated strong performance in building extraction tasks using DSM data sources [15,16].
SegNet [17], DeconvNet [18], UNet [19], and numerous other networks represent advancements built upon the FCN architecture. In the UNet, the decoder connects feature maps from each encoder layer to their corresponding decoder layers through skip connections, which enhances multi-scale feature fusion. This method assists in recovering details and improving segmentation accuracy. Alsabhan et al. [20] achieved better results by using UNet on the Massachusetts Buildings Dataset [21]. Abdollahi et al. [22] enhanced the UNet architecture by incorporating the MultiRes module, which merges features from various data scales, thus adding more spatial information and improving the accuracy of building edge predictions. By integrating the attention gate (AG) [23] module with UNet, Yu et al. [24] were able to suppress noise and emphasize building features, thereby improving the detection of small buildings in images. Qiu et al. [25] enhanced building extraction accuracy by utilizing a refined skip connection scheme, which includes an atrous spatial convolutional pyramid pooling (ASPP) module and several improved depthwise separable convolution (IDSC) modules.
In recent years, the widespread adoption of multi-task deep-learning networks has introduced innovative methods to enhance building edge-detection accuracy. Hui et al. [26] combined multi-task learning with the Xception module [27] in the UNet to effectively extract features from remotely sensed imagery while integrating the structural information of buildings. Yin et al. [28] developed a novel multiscale and multitask deep-learning framework that simultaneously addresses building detection, footprint segmentation, and edge extraction by considering their interdependencies. Hong et al. [29] utilized the Swin Transformer [30] as a shared backbone network with multiple heads for predicting building labels and detecting changes, allowing for the concurrent learning of building extraction and change detection. To improve the integrity of building edge detection, Yang et al. [31] proposed using separate networks for building extraction and edge detection, combining their results for superior outcomes compared to using single networks alone. Yang et al. [32] also added an edge extraction block within the network to achieve precise building outlines. Furthermore, Moghaddes et al. [33] enhanced building segmentation quality by integrating distance map estimation with mask prediction. Shi et al. [34] improved the completeness of shape details by incorporating tasks for boundary prediction and distance estimation into the network.
Deep-learning methods are data-driven, and well-labeled building datasets are essential for achieving accurate target extraction results. Currently, representative publicly available building datasets include the following:
The Massachusetts Buildings Dataset [21], sourced from the OpenStreetMap project, encompasses aerial imagery covering approximately 340 square km of the Boston area. This dataset includes buildings of various sizes and extends from the city to the suburbs. Curated by the International Society for Photogrammetry and Remote Sensing (ISPRS) [35], the datasets cover an area size of 13 square km. Notably, both the training and test sets encompass buildings from the same geographic area. Maggiori et al. [36] developed the Inria Aerial Image Labeling Dataset to assess models’ building extraction generalization abilities. This dataset comprises training and test sets containing images from distinct regions, ensuring diverse evaluation scenarios. In 2019, Ji et al. [37] introduced the WHU Building Dataset, a large-scale, high-precision, multi-data-source building dataset. This publicly available dataset offers comprehensive coverage, facilitating extensive research and evaluation in the field of building extraction.
The GF-7 satellite, a high-resolution observation satellite developed independently by China, boasts global coverage capability and stereoscopic observation capabilities. Orthophoto images derived from processing its stereo image pairs can effectively mitigate tree occlusion, thereby improving the completeness of building detection. Utilizing GF-7 as a data source enables the identification of a suitable deep-learning approach for building extraction, facilitating the subsequent high-precision 3D modeling of buildings [38]. Consequently, the creation of the GF-7 Building Dataset is essential.
Inspired by the work mentioned above, the main contributions of this work are as follows.
- Considering that building extraction for GF-7 can help in the subsequent work of 3D modeling, a building dataset (GF-7 Building Dataset) based on orthophotos from GF-7 stereo images is produced.
- To enhance the perception of edges and improve the accuracy and completeness of building edge extraction, a multi-task network (EUNet) based on the UNet structure is proposed, where an edge extraction module is incorporated into the up-sampling part.
- To verify the superiority of our proposed network, we conducted experiments on the GF-7 dataset, WHU dataset, and Massachusetts Buildings Dataset; our proposed method outperforms existing approaches across all three datasets.
2. Materials and Methods
This section introduces the building extraction datasets used in this paper and the detailed structure of the EUNet we propose, which is based on the UNet network structure with an added edge-detection block.
2.1. Materials
This section introduces the process of conducting self-made GF-7 building and the existing building extraction datasets that are widely used.
2.1.1. Production of GF-7 Dataset
To make the building detection method better applicable to GF-7 remote-sensing images, the GF-7 Building Dataset first needs to be produced.
GF-7 is a stereo mapping satellite at a scale of 1:10,000, with parameters outlined in Table 1. It excels at rapidly acquiring large-area Earth observation data with high spatial, spectral, and temporal resolutions. Equipped with double-line cameras (DLC) capable of generating stereoscopic image pairs, along with a multispectral camera, GF-7 enables the creation of digital surface models (DSM) to represent surface and terrain conditions. With DLC images offering resolutions of 0.65 m (backward) and 0.8 m (forward), as well as 2.6 m resolution multispectral images, GF-7 imagery provides rich three-dimensional and spectral information. Compared to standard satellite images, GF-7 images offer several advantages for building extraction after processing, such as orthorectification and fusion. Firstly, orthophotos derived from DLC images more accurately reproduce building shapes with minimal distortion. Secondly, corrections to the shooting angle partially alleviate the issue of tree shadows obscuring buildings. Lastly, the three-dimensional information embedded in DLC images supports the three-dimensional reconstruction of buildings.

Table 1.
Parameters of GF-7 satellite.
Its images contain rich building information, which is conducive to large-scale batch building extraction. The image used in this paper was taken in February 2021 in Longyan City, Fujian Province, and contains a variety of building types: neatly arranged residential buildings, small self-constructed houses, and medium-to-large irregularly shaped commercial buildings, which are suitable as a training set for building extraction.
The process framework for making the GF-7 dataset is shown in Figure 1. Firstly, the original forward and backward panchromatic images of GF-7 need to be processed into orthophotos by ortho-correction and other steps, and then fused with multispectral images to obtain the fusion image. The regions with relatively dense building targets are selected from the images for the sample set. Then the selected regions are cropped into 512 × 512 pixels each. After the images are well labeled manually, the data enhancement processing, such as rotating and changing the brightness, is used to increase the number and diversity of the dataset, which is finally divided into training, validation, and test sets according to the ratio of 7:2:1, and made into a dataset in VOC format.
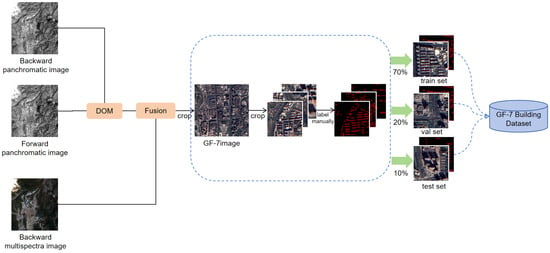
Figure 1.
A description of GF-7 dataset production.
2.1.2. Existing Building Extraction Datasets
The three datasets used in this experiment are the self-made GF-7 dataset, the Massachusetts Buildings Dataset, and the WHU Building Dataset. The comparison of each datasets is shown in Table 2. The Massachusetts Buildings Dataset consists of 151 images of the Boston area with a size of 1500 × 1500 pixels. The aerial images consist of 1m resolution and cover an area of approximately 340 square kilometers. In this experiment, to facilitate the training and exclude the image size on the training results, each image is cropped to 500 × 500 pixels, and some of the wrongly labeled images are removed, resulting in 1072 pieces of data, which are divided into training, validation, and test sets according to the ratio of 7:2:1.

Table 2.
Parameters of the datasets used in this experiment.
The WHU Building Dataset was gathered from cities worldwide and from diverse remote-sensing sources, including QuickBird, Worldview, IKONOS, ZY-3, and others. It comprises 204 images, each sized at 512 × 512 pixels, with resolutions ranging from 0.3 m to 2.5 m. Beyond variations in satellite sensors, the dataset also reflects differences in atmospheric conditions, panchromatic and multispectral fusion algorithms, atmospheric and radiometric corrections, and seasonal variations. These factors render the dataset both suitable and challenging for testing the robustness of building extraction algorithms.
The GF-7 Building Dataset, which was acquired by the GF-7 satellite, consists of 75 images of the Longyan city of Fujian Province with a resolution of 512 × 512 pixels, and we used 52 images as the training set, 15 as the validation set, and the remaining 8 as the test set.
2.2. Methods
This section describes the structure of each part of EUNet with the evaluation metrics of network training results.
2.2.1. Optimization of the UNet Network Structure by Adding Edge-Detection Block
UNet is a network structure proposed by Olaf Ronneberger et al. [19] for the implementation of semantic segmentation in medical images, which is now widely used in building extraction tasks. UNet has a classical encoder–decoder structure, whose encoder extracts features using a convolutional layer and uses maximum pooling and activation functions to obtain the image context and multiscale information, while the decoder obtains the up-sampled feature maps by fusing encoder features at different stages to obtain the up-sampled feature map; the specific structure is shown in Figure 2.
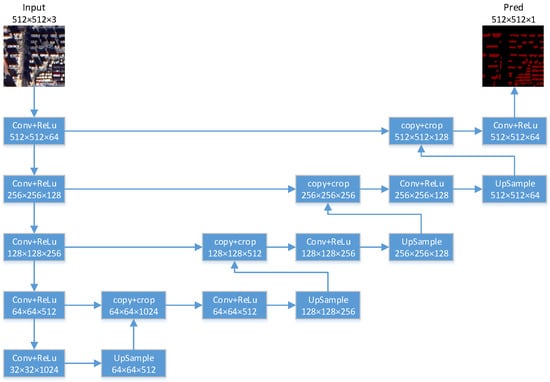
Figure 2.
The structure of UNet, as well as the baseline of our work.
The network structure proposed in this paper, based on the UNet architecture, is depicted in Figure 3. Consistent with UNet, the down-sampling part of the network is utilized for feature extraction, employing VGG [39] features to derive the network structure and obtain feature maps of varying sizes. Subsequently, the up-sampling part involves enlarging the features and integrating them with the down-sampled feature maps. Each feature map obtained from the up-sampling undergoes edge extraction operation (EDB) to detect edges, with a loss function integrated to operate alongside the edge labels.
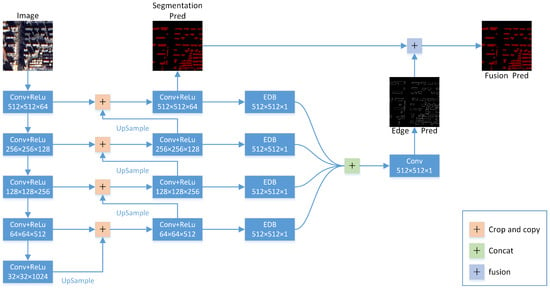
Figure 3.
An outlook of EUNet structure. The output dimensions (H × W × C) of each block are shown in the boxes. The square with “+” represents the connection of the feature maps in the decoder and the encoder. EDB: Edge-Detection Block.
2.2.2. Feature Extraction Block
The method proposed in this paper utilizes the VGG16 architecture in the feature extraction phase as the encoder. As illustrated in Figure 4, the primary components consist of 3 × 3 convolution operations and 2 × 2 maximum pooling operations. The 3 × 3 convolution kernel, characterized by fewer parameters, mitigates the risk of overfitting. Additionally, cascading multiple 3 × 3 convolutions forms a convolution kernel with a larger receptive field, enhancing the network’s feature extraction capabilities without significantly increasing computational load. Moreover, the number of feature layers is increased in the post-pooling operation, minimizing the loss of valuable information in the feature map following downsampling.

Figure 4.
The architecture of the feature extraction block (the encoder part).
2.2.3. Edge-Detection Block
The networks employed for edge detection include HED [40], BDCN [41], and DexiNed [42], among others. DexiNed, which exhibited superior performance according to Yang et al., draws inspiration from both HED and Xception. DexiNed comprises a dense extreme actually network and an upsampling block, aiming to produce fine edges for the enhanced visualization of predicted edge maps.
A key component of DexiNed for edge refinement is the upsampling block (UB), as depicted in Figure 5. Each output from the DexiNed block is directed to the UB, which consists of conditionally stacked sub-blocks. Each sub-block comprises two layers, a convolutional layer and an inverse convolutional layer, producing a feature map of the same size as the label. Two types of block are utilized: one is employed when the ratio between the feature map and the ground truth map is 2, while the other iterates until this ratio reaches 2.
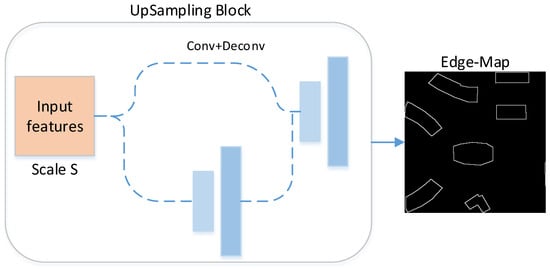
Figure 5.
The structure of the UB in DexiNed.
The UB receives features extracted from each primary block. These features are then processed through a series of learned convolutional and transposed convolutional filters to generate an intermediate edge map. Inspired by the UB of DexiNed, the structure of the proposed feature extraction edge-detection block (EDB) is depicted in Figure 6. It consists of a convolutional layer, an upsampling layer, a transposed convolutional layer, and an activation function. The convolutional and transposed convolutional layers are used to extract the intermediate edge map in DexiNed. Therefore, the two layers are also used in EDB. An upsampling layer is employed to generate edge-detection results that maintain the same label size as the input images.

Figure 6.
Detail of the EDB in Figure 3, which is made up of a convolution layer, an UpSample layer, and a transposed convolution layer. The output of this block is an edge feature map with the same size as the input image.
The edge-detection results generated by EDB undergo a loss value operation with the edge labels, which are derived from the building labels. Given that the building label image is binary, extracting the edge labels involves determining the presence of unlabeled pixels within the 8-neighborhood of the labeled pixel point. Specifically, when the building label pixel value is 1, if there is an unlabeled pixel point within its 8-neighborhood, the corresponding edge label pixel value is set to 1. The formula is as follows:
where the q(i,j) represents the pixel label in the original building label images and p(i,j) denotes the corresponding pixel label in the edge label image. The resulting edge labels produced by this method are illustrated in Figure 7.
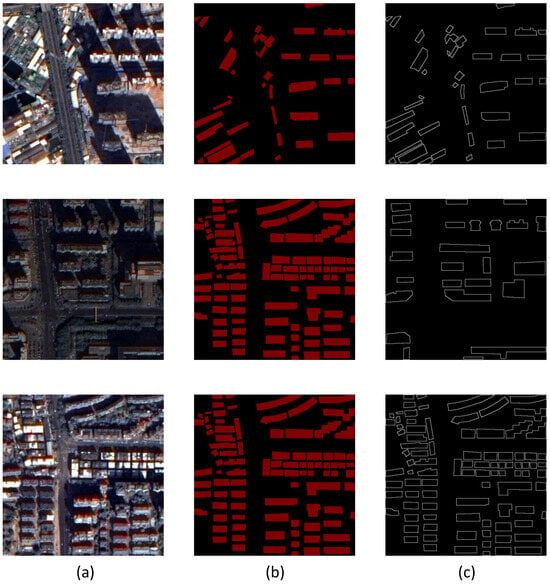
Figure 7.
The edge images from labels. (a) Images. (b) Labels. (c) Edge images. These labels are applicable in the computation of edge extraction loss values during the training process.
Since there are four images in the edge detection result obtained by the EDB, in order to reduce the amount of computation a convolutional layer is used to merge the four images into one edge-detection image with one channel, and then the loss function is computed with the obtained edge labels.
The loss function chosen here is Dice loss, a loss function commonly used in image segmentation tasks, based on Dice coefficients to predict the ratio between the intersection of the segmentation results and the true labels and their concatenation to measure the accuracy of the segmentation. It has better results in dealing with category imbalance and boundary details with the following formula:
where Prediction is the result obtained from the network prediction and Ground True (GT) is the true value, i.e., the labeled value.
2.2.4. Evaluation Metrics
This paper adopts four precision evaluation metrics for pixel-based evaluation, which are widely used as evaluation criteria for semantic segmentation and building extraction: intersection over union (IoU), Precision, Recall, and F1 score. TP is the number of pixels correctly classified as buildings, the number of pixels incorrectly classified as buildings is FP, the number of pixels correctly classified as background is TN, and the number of pixels incorrectly classified as background is FN. The above four precision evaluation metrics are calculated as follows:
- IoU is used to describe the degree of overlap of two sets, which is equal to the number of items contained in the intersection set of the two sets divided by the total number of elements contained in their concatenated set. When used as an index for judging the accuracy of the semantic segmentation, the formula is as follows:
- Precision is used to describe the proportion of pixels classified as positive samples that are true positive samples and the formula as follows:
- Recall: the recall rate is used to describe the proportion of correctly classified pixels that are correctly classified as positive samples, and the formula is given by:
- The F1 score is a comprehensive assessment of the performance of a binary classifier that takes into account both the Precision and Recall of the classifier. Precision measures how many of the samples predicted by the classifier to be in the positive category are true positive examples, while Recall measures the ability of the classifier to correctly identify all true positive examples. The F1 score is the reconciled mean of precision and recall and can be expressed by the following equation:
3. Experiment and Result
The environment for this experiment is PyTorch 2.2.1 and Cuda12.2 implementation. In order to verify the correctness of the proposed network and its effectiveness on the GF-7 dataset, three datasets are used in this experiment for building extraction experiments, and the results are compared with other semantic segmentation networks. This section focuses on the basic information of the datasets used for the experiments, the evaluation criteria of the experimental accuracy, and the comparison and analysis of the experimental results.
3.1. Experiment
For the effectiveness of the method proposed in this experiment, classical algorithms commonly used for semantic segmentation were used for comparison, namely FCN8s [9], PSPNet [43], Deeplabv3-plus [44], UNet [19], Attention UNet [23], and Swin-UNet [45]. All experiments were trained on an NVIDIA GeForce RTX 4090 with 200 epochs of 4 batch-size training.
3.2. Result
To thoroughly assess the building extraction quality of our proposed model, we conducted a series of experiments utilizing the well-established Massachusetts Buildings Dataset. This dataset is widely recognized in the field for its comprehensive and challenging nature, making it an ideal benchmark for evaluating the performance of building extraction algorithms. The results of our experiments, which are summarized in Table 3, clearly illustrate the superior performance of our method when compared to existing approaches.

Table 3.
Accuracy of building extraction on Massachusetts Buildings Dataset. The best scores are highlighted in bold.
Our model achieved an impressive F1 score of 92.0%, which is approximately 3% higher than that of Attention UNet, a well-regarded baseline in this domain. This significant improvement highlights the effectiveness of our approach in accurately identifying and delineating building structures.
Furthermore, the extraction results of this experiment shown in Figure 8 reveal that our method excels in maintaining the completeness and smoothness of building edges. This is a critical aspect of building extraction as it directly impacts the usability and accuracy of the extracted data for further applications. Our approach also demonstrates a notable reduction in the misclassification of other features as buildings, thereby enhancing the overall precision of the extraction process.
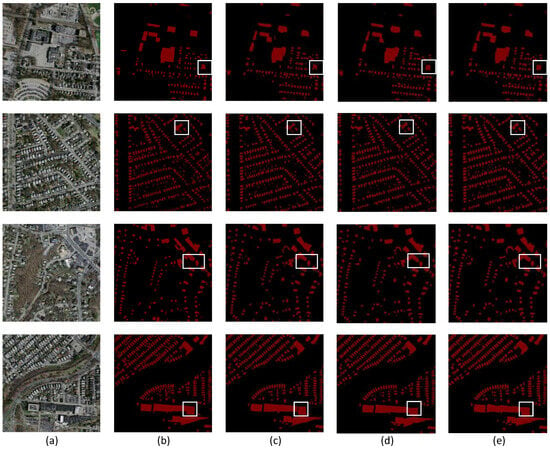
Figure 8.
Results for the three best-performing building extraction methods on the Massachusetts Buildings Dataset. (a) Images. (b) Labels. (c) UNet. (d) Attention UNet. (e) EUNet.
Derived from a diverse array of satellites operating under various conditions and covering different geographical regions, the WHU Building Dataset presents significant challenges for validating the robustness of building extraction methods. Its complexity is pivotal in providing a comprehensive evaluation of these methods. As illustrated in Table 4, the experimental results of different networks trained on this dataset demonstrate that the network proposed in this paper achieves the highest performance metrics. Specifically, our proposed network achieves an impressive F1 score of 88.3%, indicating high precision and recall in building extraction tasks. Additionally, our network achieves a Precision value of 89.6%, surpassing the performance of other evaluated networks. This superior performance underscores the efficacy and robustness of our proposed method in accurately extracting building features from diverse satellite imagery. Figure 9 depicts the results of building extraction from the WHU Building Dataset using the three best-performing networks, highlighting that the buildings extracted from EUNet exhibit more complete and fluent edges.

Table 4.
Accuracy of building extraction on WHU Building Dataset. The best scores are highlighted in bold.
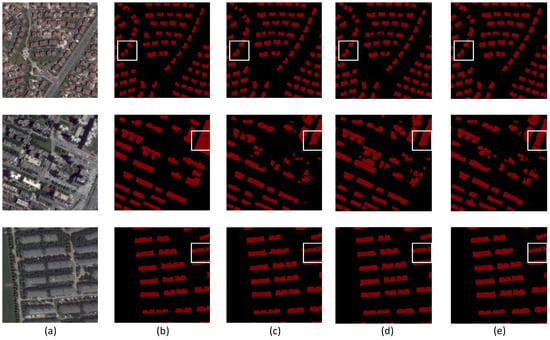
Figure 9.
Results for the three best-performing building extraction methods on the WHU Building Dataset. (a) Images. (b) Labels. (c) UNet. (d) Attention UNet. (e) EUNet.
Table 5 offers a comprehensive analysis of the performance of the five networks when evaluated using the GF-7 Building Dataset, thereby reaffirming the effectiveness of our model. Of particular significance is the exceptional performance exhibited by our proposed network, achieving a Precision of 94.9% and an F1 score of 93.6%. These results underscore the remarkable precision of our proposed network in accurately extracting buildings from the GF-7 dataset. The first set of images in Figure 10 demonstrates that EUNet’s buildings exhibit a lower leakage rate, while the second and third sets of images illustrate EUNet’s ability to accurately identify irregular buildings, maintaining their integrity both internally and at their edges.

Table 5.
Accuracy of building extraction on GF-7 Building Dataset. The best scores are highlighted in bold.
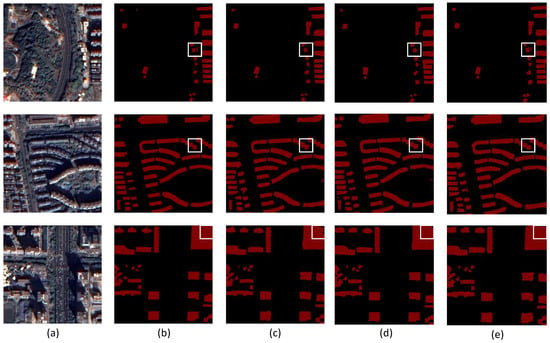
Figure 10.
Results for the three best-performing building extraction methods on the GF-7 Building Dataset. (a) Images. (b) Labels. (c) UNet. (d) Attention UNet. (e) EUNet.
4. Discussion
This section will first discuss the impact of the EUNet on the building extraction results, and then discuss the limitations of the method and the outlook of future work.
4.1. Regarding the Result of the Comparison Experiments
The results from our comprehensive analysis reveal that our proposed network outperforms other models across three datasets, including the custom GF-7 dataset. Notably, the network demonstrates a significant improvement in the F1 score, achieving increases of approximately 2%, respectively, compared to the second-best performing network. This performance highlights the superior ability of our network to extract building edges more completely and accurately.
A critical factor contributing to this enhanced performance is the inclusion of an edge information extraction module within the network. This module significantly aids in precisely extracting building edges, ensuring that the boundaries are well-defined and intact. By incorporating edge detection as a fundamental component of the network’s architecture, we address common edge blurring and incompleteness issues that typically plague building extraction tasks in remote-sensing imagery.
The improved edge-detection capability is particularly evident in the results from the GF-7 dataset, where buildings often have complex and irregular shapes. Our network’s ability to maintain the integrity of these edges demonstrates its robustness and precision, providing more accurate and reliable building extraction outcomes. This advancement underscores the effectiveness of our approach in enhancing the completeness and clarity of building edges, thereby setting a new benchmark for building extraction in high-resolution remote-sensing imagery.
4.2. Regarding the Proposed EUNet Framework
From the mentioned work [26,28,31,32], it is clear that adding an edge extraction task to a traditional semantic segmentation network helps to improve the accuracy of building detection, and some scholars have combined the edge extraction task with an edge extraction network. Therefore, in this paper we propose a DexiNed-inspired edge extraction module added to the UNet to improve the detection accuracy. To verify the validity of the proposed EDB, an ablation experiment is conducted. We proposed another EDB structure (Dexi-EDB) closer to the origin UB in DexiNed, which is shown in Figure 11. This Dexi-EDB replaces the origin convolution layers with upsampling layers. The block2 is used to iterate until the ratio between the feature map and the ground truth is equal to 2, which is allowed to input to block1. The difference between the two blocks is the number of filters, with 16 of block2 and 1 of block1.

Figure 11.
The structure of Dexi-EDB. When the ratio of the input to the original image is greater than 2, input block2, iterate until the ratio is equal to 2, input block1, and finally the output image is of the same size as the original image.
Through comparison with the original UNet network, the UNet with Dexi-EDB, and the EUNet we proposed, we can tell that the EDB of the network better helps the network to complete the building extraction task, extract the complete edge information, and improve all the accuracy evaluation indexes.
The training results of the network with EDB added to the Massachusetts Buildings Dataset are shown in Table 6. the F1 score is improved by 2.93% compared with the origin network, and from the segmentation results (Figure 12), the improved network performs better. We can see from the first set of images that the buildings extracted by EUNet are more complete, while the results extracted by the UNet with Dexi-EDB are less complete and those of UNet are the worst. The last two sets of images show that EUNet extracts the most complete building edges, UNet with Dexi-EDB extracts the second most complete, and the original UNet is the poorest.

Table 6.
Comparison of building extraction results between the origin and improved network on Massachusetts Buildings Dataset.
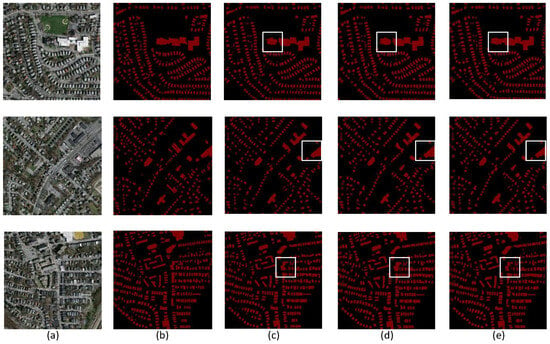
Figure 12.
Results for the origin and the improved building extraction methods on the Massachusetts Buildings Dataset. (a) Images. (b) Labels. (c) Origin Network (UNet). (d) UNet with Dexi-EDB. (e) EUNet, Unet with EDB.
The training results of the network with EDB added onto the WHU Building Dataset are shown in Table 7. The IoU and F1 scores are improved by 0.43% and 1.58%, respectively, compared with the origin network, and from the segmentation results (Figure 13), the improved network performs better. Analysis of the initial image set reveals that EUNet provides the most complete building extractions, whereas UNet with Dexi-EDB yields less complete results, and the original UNet performs the worst. Similarly, the subsequent image sets demonstrate that EUNet excels in extracting complete building edges, followed by UNet with Dexi-EDB, with the original UNet lagging behind. This evidence supports the conclusion that incorporating an edge extraction task enhances building detection accuracy and validates the effectiveness of the proposed EDB in this experiment.

Table 7.
Comparison of building extraction results between the origin and improved network on WHU Building Dataset.
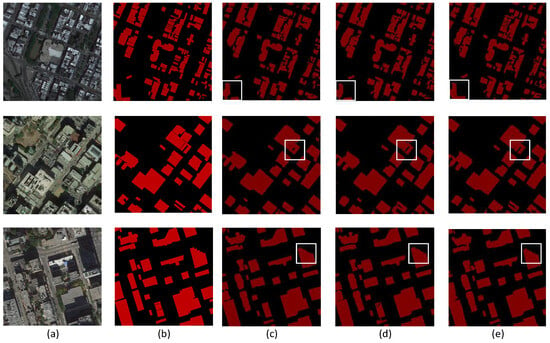
Figure 13.
Results for the origin and the improved building extraction methods on the WHU Building Dataset. (a) Images. (b) Labels. (c) Origin Network (UNet). (d) UNet with Dexi-EDB. (e) EUNet, Unet with EDB.
The training results of the network with EDB added to the GF-7 Building Dataset are shown in Table 8. The IoU and F1 scores are improved by 0.49% and 2.54%, respectively, compared with the origin network, and from the segmentation results (Figure 14), the improved network performs better. Examination of the first series of images indicates that EUNet achieves the highest level of completeness in building extraction, compared to the less complete results obtained by UNet with Dexi-EDB, and the least complete by the original UNet. Furthermore, the final two image sets illustrate that EUNet is superior in extracting comprehensive building edges, with UNet with Dexi-EDB performing moderately well, and the original UNet showing the poorest performance. These findings confirm that integrating an edge extraction task significantly improves building detection accuracy and demonstrates the efficacy of the EDB introduced in this study.

Table 8.
Comparison of building extraction results between the origin and improved network on GF-7 Building Dataset.
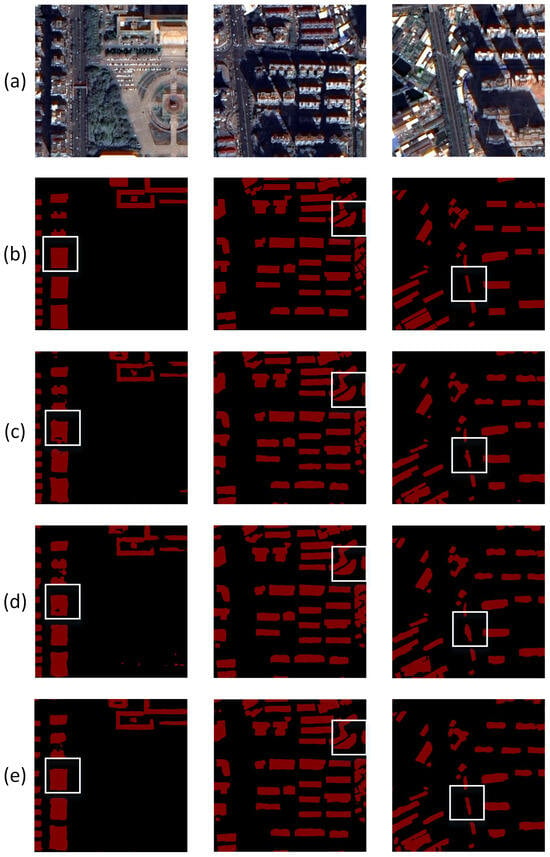
Figure 14.
Results for the origin and the improved building extraction methods on the GF-7 Building Dataset. (a) Images. (b) Labels. (c) Origin Network (UNet). (d) UNet with Dexi-EDB. (e) EUNet, Unet with EDB.
4.3. Regarding the GF-7 Building Dataset
The data sources for the building extraction task are varied. Most of the works use RGB images, but also combine DSM [15,16,46,47] and near-infrared band data [48,49]. The three datasets utilized in this experiment all include RGB information. However, the orthophoto images from GF-7, derived from stereo image pairs, have a distinct advantage. These images can mitigate shadows and occlusions caused by the shooting angle, providing perspective-corrected representations of buildings. This correction significantly aids in accurate building extraction.
Meanwhile, the accuracy of the labeling in the GF-7 and WHU datasets is superior to that in the MB dataset, which contains a higher number of labeling errors. As illustrated in Figure 15, the WHU Building Dataset offers images from various locations obtained through different remote-sensing sources, resulting in a richer diversity of resolutions and building styles. In contrast, the GF-7 dataset, derived from a single satellite, covers only one specific area of acquisition.
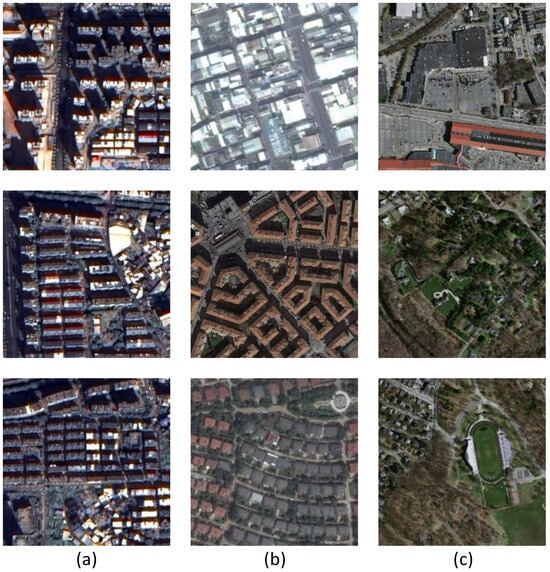
Figure 15.
The comparison of three building datasets. (a) GF-7. (b) WHU. (c) Massachusetts. The GF-7 and Massachusetts Buildings Datasets each contain images from a single region and with a single resolution: Longyan Province at a 0.65 m resolution and Massachusetts at a 1 m resolution, respectively. In contrast, the WHU Building Dataset includes images from multiple areas—Taiwan, Milan, and Wuhan—providing a broader range of locations, as illustrated in column (b).
The results of comparing the F1 scores obtained from different networks trained on the three datasets, as shown in Figure 16, reveal that most networks, including Deeplabv3+, Swin-UNet, UNet, Attention UNet, and EUNet, perform well on the GF-7 dataset. In contrast, the FCN8s and PSPNet networks show better performance on the WHU dataset. This indicates the higher quality of these two datasets. Notably, EUNet achieves the best performance on the GF-7 dataset, suggesting that this network is particularly effective for extracting buildings from GF-7 images. This effectiveness holds promise for subsequent work on accurate 3D building modeling [50] using GF-7 data.
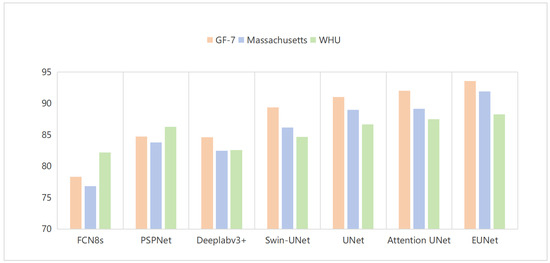
Figure 16.
The comparison of the performances of the seven semantic segmentation networks on the three building datasets. The horizontal coordinates represent the neural networks and the vertical coordinates represent the F1 score obtained by training each network on the three datasets.
4.4. Methodological Limitations and Perspectives for Future Work
The EUNet demonstrates strong performance in the building extraction task using GF-7 images. However, the scope of this experiment is limited due to the small number of GF-7 data samples and the relatively homogeneous nature of the covered area. This limitation hinders the ability to validate the network’s effectiveness across diverse regions comprehensively. Additionally, the network’s accuracy decreases when extracting densely packed small buildings. This issue may stem from errors in the manually labeled dataset.
To address these limitations, future work will focus on creating a more accurately labeled and extensive GF-7 Building Dataset. This improved dataset will provide a robust foundation for training and enable more reliable assessments of the network’s performance across various geographic areas. Furthermore, considering the unique characteristics of GF-7 data, future research will explore incorporating additional data types into the network’s training process, such as elevation information [48]. Incorporating such supplementary data could enhance the network’s ability to accurately extract buildings, particularly in complex urban environments.
In conclusion, while EUNet shows promising results, the limitations identified in this study highlight the need for a more comprehensive dataset and the integration of additional data sources. These advancements will potentially lead to significant improvements in the network’s accuracy and robustness, making it better suited for diverse and complex building extraction tasks in future applications.
5. Conclusions
In this paper, the proposed EUNet based on UNet emphasizes edge information and aims to solve the problem of incomplete building extraction and edges in building extraction tasks. By adding EDB at the decoder stage, which can extract edge information from the fusion feature map, and updating the EDB parameters by loss function calculation with the building edge labels, which improves the perception of edge information, the edge information can be better extracted. Based on the comparison experiments with four classical semantic segmentation networks on two open-source datasets and one self-made dataset, it is shown that the network proposed in this paper outperforms other networks and can extract more complete buildings. However, the EUNet performs comparatively poorly in extracting small and dense building regions of GF-7 images, and there are still some non-building pixels that are misclassified. The reasons for this may be due to errors in manual labeling and insufficient data volume. How to improve the quality and quantity of the dataset and integrate the elevation information for building extraction merits further study.
Author Contributions
Methodology, R.H.; Validation, R.H.; Resources, X.F. and J.L.; Writing—original draft, R.H.; Writing—review & editing, J.L.; Supervision, X.F. and J.L. All authors have read and agreed to the published version of the manuscript.
Funding
This research is sponsored by National Key R&D Program of China (No. 2022YFC3800704).
Data Availability Statement
The original contributions presented in the study are included in the article, further inquiries can be directed to the corresponding author.
Conflicts of Interest
The authors declare no conflict of interest.
References
- Zakharov, A.; Tuzhilkin, A.; Zhiznyakov, A. Automatic Building Detection from Satellite Images Using Spectral Graph Theory. In Proceedings of the 2015 International Conference on Mechanical Engineering, Automation and Control Systems (MEACS), Tomsk, Russia, 1–4 December 2015; pp. 1–5. [Google Scholar]
- Chen, L.-C.; Huang, C.-Y.; Teo, T.-A. Multi-Type Change Detection of Building Models by Integrating Spatial and Spectral Information. Int. J. Remote Sens. 2012, 33, 1655–1681. [Google Scholar] [CrossRef]
- Zhang, Y. Optimisation of Building Detection in Satellite Images by Combining Multispectral Classification and Texture Filtering. ISPRS J. Photogramm. Remote. Sens. 1999, 54, 50–60. [Google Scholar] [CrossRef]
- Awrangjeb, M.; Zhang, C.; Fraser, C.S. Improved building detection using texture information. Int. Arch. Photogramm. Remote. Sens. Spat. Inf. Sci. 2013, XXXVIII-3/W22, 143–148. [Google Scholar] [CrossRef]
- Ding, Z.; Wang, X.Q.; Li, Y.L.; Zhang, S.S. Study on building extraction from high-resolution images using MBI. Int. Arch. Photogramm. Remote. Sens. Spat. Inf. Sci. 2018, XLII-3, 283–287. [Google Scholar] [CrossRef]
- Krizhevsky, A.; Sutskever, I.; Hinton, G.E. ImageNet Classification with Deep Convolutional Neural Networks. Commun. ACM 2017, 60, 84–90. [Google Scholar] [CrossRef]
- Song, J.; Gao, S.; Zhu, Y.; Ma, C. A Survey of Remote Sensing Image Classification Based on CNNs. Big Earth Data 2019, 3, 232–254. [Google Scholar] [CrossRef]
- Zhang, F.; Du, B.; Zhang, L.; Xu, M. Weakly Supervised Learning Based on Coupled Convolutional Neural Networks for Aircraft Detection. IEEE Trans. Geosci. Remote Sens. 2016, 54, 5553–5563. [Google Scholar] [CrossRef]
- Shelhamer, E.; Long, J.; Darrell, T. Fully Convolutional Networks for Semantic Segmentation. IEEE Trans. Pattern Anal. Mach. Intell. 2017, 39, 640–651. [Google Scholar] [CrossRef] [PubMed]
- Li, Y.; He, B.; Long, T.; Bai, X. Evaluation the Performance of Fully Convolutional Networks for Building Extraction Compared with Shallow Models. In Proceedings of the 2017 IEEE International Geoscience and Remote Sensing Symposium (IGARSS), Fort Worth, TX, USA, 23–28 July 2017; pp. 850–853. [Google Scholar]
- Sariturk, B.; Bayram, B.; Duran, Z.; Seker, D.Z. Feature Extraction from Satellite Images Using Segnet and Fully Convolutional Networks (FCN). Int. J. Eng. Geosci. 2020, 5, 138–143. [Google Scholar] [CrossRef]
- Maggiori, E.; Tarabalka, Y.; Charpiat, G.; Alliez, P. Convolutional Neural Networks for Large-Scale Remote-Sensing Image Classification. IEEE Trans. Geosci. Remote Sens. 2017, 55, 645–657. [Google Scholar] [CrossRef]
- Cui, W.; Xiong, B.; Zhang, L. Multi-scale fully convolutional neural network for building extraction. Acta Geod. Cartogr. Sin. 2019, 48, 597–608. [Google Scholar]
- Shrestha, S.; Vanneschi, L. Improved Fully Convolutional Network with Conditional Random Fields for Building Extraction. Remote Sens. 2018, 10, 1135. [Google Scholar] [CrossRef]
- Bittner, K.; Cui, S.; Reinartz, P. Building extraction from remote-sensing data using fully convolutional networks. Int. Arch. Photogramm. Remote. Sens. Spat. Inf. Sci. 2017, XLII-1/W1, 481–486. [Google Scholar] [CrossRef]
- Bittner, K.; Adam, F.; Cui, S.; Körner, M.; Reinartz, P. Building Footprint Extraction From VHR Remote Sensing Images Combined With Normalized DSMs Using Fused Fully Convolutional Networks. IEEE J. Sel. Top. Appl. Earth Obs. Remote Sens. 2018, 11, 2615–2629. [Google Scholar] [CrossRef]
- Badrinarayanan, V.; Kendall, A.; Cipolla, R. SegNet: A Deep Convolutional Encoder-Decoder Architecture for Image Segmentation. IEEE Trans. Pattern Anal. Mach. Intell. 2017, 39, 2481–2495. [Google Scholar] [CrossRef] [PubMed]
- Noh, H.; Hong, S.; Han, B. Learning Deconvolution Network for Semantic Segmentation. In Proceedings of the IEEE International Conference on Computer Vision (ICCV), Santiago, Chile, 7–13 December 2015; pp. 1520–1528. [Google Scholar]
- Ronneberger, O.; Fischer, P.; Brox, T. U-Net: Convolutional Networks for Biomedical Image Segmentation. In Medical Image Computing and Computer-Assisted Intervention—MICCAI 2015; Springer: Cham, Switzerland, 2015; pp. 234–241. [Google Scholar]
- Alsabhan, W.; Alotaiby, T. Automatic Building Extraction on Satellite Images Using Unet and ResNet50. Comput. Intell. Neurosci. 2022, 2022, e5008854. [Google Scholar] [CrossRef] [PubMed]
- Hinton, G.E.; Mnih, V. Machine Learning for Aerial Image Labeling. Ph.D. Thesis, University of Toronto, Toronto, ON, Canada, 2013. [Google Scholar]
- Abdollahi, A.; Pradhan, B. Integrating Semantic Edges and Segmentation Information for Building Extraction from Aerial Images Using UNet. Mach. Learn. Appl. 2021, 6, 100194. [Google Scholar] [CrossRef]
- Oktay, O.; Schlemper, J.; Folgoc, L.L.; Lee, M.J.; Heinrich, M.; Misawa, K.; Mori, K.; McDonagh, S.G.; Hammerla, N.Y.; Kainz, B.; et al. Attention U-Net: Learning Where to Look for the Pancreas. arXiv 2018, arXiv:1804.03999. [Google Scholar]
- Yu, M.; Chen, X.; Zhang, W.; Liu, Y. AGs-Unet: Building Extraction Model for High Resolution Remote Sensing Images Based on Attention Gates U Network. Sensors 2022, 22, 2932. [Google Scholar] [CrossRef]
- Qiu, W.; Gu, L.; Gao, F.; Jiang, T. Building Extraction From Very High-Resolution Remote Sensing Images Using Refine-UNet. IEEE Geosci. Remote Sens. Lett. 2023, 20, 6002905. [Google Scholar] [CrossRef]
- Hui, J.; Du, M.; Ye, X.; Qin, Q.; Sui, J. Effective Building Extraction From High-Resolution Remote Sensing Images With Multitask Driven Deep Neural Network. IEEE Geosci. Remote Sens. Lett. 2019, 16, 786–790. [Google Scholar] [CrossRef]
- Chollet, F. Xception: Deep Learning with Depthwise Separable Convolutions. In Proceedings of the 2017 IEEE Conference on Computer Vision and Pattern Recognition (CVPR), Honolulu, HI, USA, 21–26 July 2017; pp. 1800–1807. [Google Scholar]
- Yin, J.; Wu, F.; Qiu, Y.; Li, A.; Liu, C.; Gong, X. A Multiscale and Multitask Deep Learning Framework for Automatic Building Extraction. Remote Sens. 2022, 14, 4744. [Google Scholar] [CrossRef]
- Hong, D.; Qiu, C.; Yu, A.; Quan, Y.; Liu, B.; Chen, X. Multi-Task Learning for Building Extraction and Change Detection from Remote Sensing Images. Appl. Sci. 2023, 13, 1037. [Google Scholar] [CrossRef]
- Liu, Z.; Lin, Y.; Cao, Y.; Hu, H.; Wei, Y.; Zhang, Z.; Lin, S.; Guo, B. Swin Transformer: Hierarchical Vision Transformer Using Shifted Windows. In Proceedings of the 2021 IEEE/CVF International Conference on Computer Vision (ICCV), Montreal, QC, Canada, 10–17 October 2021; pp. 9992–10002. [Google Scholar]
- Yang, H.; Xu, M.; Chen, Y.; Wu, W.; Dong, W. A Postprocessing Method Based on Regions and Boundaries Using Convolutional Neural Networks and a New Dataset for Building Extraction. Remote Sens. 2022, 14, 647. [Google Scholar] [CrossRef]
- Yang, G.; Zhang, Q.; Zhang, G. EANet: Edge-Aware Network for the Extraction of Buildings from Aerial Images. Remote Sens. 2020, 12, 2161. [Google Scholar] [CrossRef]
- Moghalles, K.; Li, H.-C.; Al-Huda, Z.; Hezzam, E.A. Multi-Task Deep Network for Semantic Segmentation of Building in Very High Resolution Imagery. In Proceedings of the 2021 International Conference of Technology, Science and Administration (ICTSA), Taiz, Yemen, 22–24 March 2021; pp. 1–6. [Google Scholar]
- Shi, F.; Zhang, T. A Multi-Task Network with Distance–Mask–Boundary Consistency Constraints for Building Extraction from Aerial Images. Remote Sens. 2021, 13, 2656. [Google Scholar] [CrossRef]
- 2D Semantic Labeling. Available online: https://www.isprs.org/education/benchmarks/UrbanSemLab/semantic-labeling.aspx (accessed on 23 April 2024).
- Maggiori, E.; Tarabalka, Y.; Charpiat, G.; Alliez, P. Can Semantic Labeling Methods Generalize to Any City? The Inria Aerial Image Labeling Benchmark. In Proceedings of the 2017 IEEE International Geoscience and Remote Sensing Symposium (IGARSS), Fort Worth, TX, USA, 23–28 July 2017; pp. 3226–3229. [Google Scholar]
- Ji, S.; Wei, S.; Lu, M. Fully Convolutional Networks for Multisource Building Extraction From an Open Aerial and Satellite Imagery Data Set. IEEE Trans. Geosci. Remote Sens. 2019, 57, 574–586. [Google Scholar] [CrossRef]
- Wang, J.; Hu, X.; Meng, Q.; Zhang, L.; Wang, C.; Liu, X.; Zhao, M. Developing a Method to Extract Building 3D Information from GF-7 Data. Remote Sens. 2021, 13, 4532. [Google Scholar] [CrossRef]
- Simonyan, K.; Zisserman, A. Very Deep Convolutional Networks for Large-Scale Image Recognition. arXiv 2014, arXiv:1409.1556. [Google Scholar]
- Xie, S.; Tu, Z. Holistically-Nested Edge Detection. In Proceedings of the 2015 IEEE International Conference on Computer Vision (ICCV), Santiago, Chile, 7–13 December 2015; pp. 1395–1403. [Google Scholar]
- He, J.; Zhang, S.; Yang, M.; Shan, Y.; Huang, T. BDCN: Bi-Directional Cascade Network for Perceptual Edge Detection. IEEE Trans. Pattern Anal. Mach. Intell. 2022, 44, 100–113. [Google Scholar] [CrossRef]
- Soria, X.; Riba, E.; Sappa, A. Dense Extreme Inception Network: Towards a Robust CNN Model for Edge Detection. In Proceedings of the 2020 IEEE Winter Conference on Applications of Computer Vision (WACV), Snowmass Village, CO, USA, 1–5 March 2020; pp. 1912–1921. [Google Scholar]
- Zhao, H.; Shi, J.; Qi, X.; Wang, X.; Jia, J. Pyramid Scene Parsing Network. In Proceedings of the 2017 IEEE Conference on Computer Vision and Pattern Recognition (CVPR), Honolulu, HI, USA, 21–26 July 2017; pp. 6230–6239. [Google Scholar]
- Chen, L.-C.; Zhu, Y.; Papandreou, G.; Schroff, F.; Adam, H. Encoder-Decoder with Atrous Separable Convolution for Semantic Image Segmentation. In Computer Vision—ECCV 2018; Ferrari, V., Hebert, M., Sminchisescu, C., Weiss, Y., Eds.; Springer International Publishing: Cham, Switzerland, 2018; pp. 833–851. [Google Scholar]
- Cao, H.; Wang, Y.; Chen, J.; Jiang, D.; Zhang, X.; Tian, Q.; Wang, M. Swin-Unet: Unet-Like Pure Transformer for Medical Image Segmentation. In Computer Vision—ECCV 2022 Workshops; Karlinsky, L., Michaeli, T., Nishino, K., Eds.; Springer Nature: Cham, Switzerland, 2023; pp. 205–218. [Google Scholar]
- Chen, S.; Zhang, Y.; Nie, K.; Li, X.; Wang, W. Extracting Building Areas from Photogrammetric DSM and DOM by Automatically Selecting Training Samples from Historical DLG Data. ISPRS Int. J. Geo-Inf. 2020, 9, 18. [Google Scholar] [CrossRef]
- Liu, W.; Yang, M.; Xie, M.; Guo, Z.; Li, E.; Zhang, L.; Pei, T.; Wang, D. Accurate Building Extraction from Fused DSM and UAV Images Using a Chain Fully Convolutional Neural Network. Remote Sens. 2019, 11, 2912. [Google Scholar] [CrossRef]
- Li, P.; Sun, Z.; Duan, G.; Wang, D.; Meng, Q.; Sun, Y. DMU-Net: A Dual-Stream Multi-Scale U-Net Network Using Multi-Dimensional Spatial Information for Urban Building Extraction. Sensors 2023, 23, 1991. [Google Scholar] [CrossRef] [PubMed]
- Yan, Y.; Tan, Z.; Su, N.; Zhao, C. Building Extraction Based on an Optimized Stacked Sparse Autoencoder of Structure and Training Samples Using LIDAR DSM and Optical Images. Sensors 2017, 17, 1957. [Google Scholar] [CrossRef]
- Luo, H.; He, B.; Guo, R.; Wang, W.; Kuai, X.; Xia, B.; Wan, Y.; Ma, D.; Xie, L. Urban Building Extraction and Modeling Using GF-7 DLC and MUX Images. Remote Sens. 2021, 13, 3414. [Google Scholar] [CrossRef]
Disclaimer/Publisher’s Note: The statements, opinions and data contained in all publications are solely those of the individual author(s) and contributor(s) and not of MDPI and/or the editor(s). MDPI and/or the editor(s) disclaim responsibility for any injury to people or property resulting from any ideas, methods, instructions or products referred to in the content. |
© 2024 by the authors. Licensee MDPI, Basel, Switzerland. This article is an open access article distributed under the terms and conditions of the Creative Commons Attribution (CC BY) license (https://creativecommons.org/licenses/by/4.0/).