Article

Lake and Atmospheric Heatwaves Caused by Extreme Dust Intrusion in Freshwater Lake Kinneret in the Eastern Mediterranean

1
Department of Geophysics, Tel Aviv University, Tel Aviv 69978, Israel
2
Kinneret Limnological Laboratory, Israel Oceanographic and Limnological Research, Migdal 1495000, Israel
*
Author to whom correspondence should be addressed.
Remote Sens. 2024, 16(13), 2314; https://doi.org/10.3390/rs16132314
Submission received: 23 April 2024 / Revised: 18 June 2024 / Accepted: 21 June 2024 / Published: 25 June 2024
(This article belongs to the Section Biogeosciences Remote Sensing)

Abstract

:
The role of dust intrusions in the formation of lake heatwaves has not yet been discussed in previous publications. We investigated a lake heatwave (LHW) and an atmospheric heatwave (AHW) in the freshwater Lake Kinneret in the Eastern Mediterranean: these were caused by an extreme dust intrusion that lasted for a 10-day period (7–17 September 2015). The AHW and LHW were defined as periods of abnormally high air temperature (Tair) and lake surface water temperature (SWT) compared to their 90th percentile thresholds in September. In the daytime, the maximal intensities of AHW and LHW reached 3 °C and 2 °C, respectively. This was despite the pronounced drop in solar radiation due to the dust radiative effect. The satellite SWT retrievals were incapable of representing the abnormally high SWT in the presence of the extreme dust intrusion. Both METEOSAT and MODIS-Terra showed a sharp decrease in the SWT compared to the actual SWT: up to 10 °C in the daytime and up to 15 °C in the nighttime. Such a significant underestimation of the actual SWT in the presence of a dust intrusion should be considered when using satellite data to analyze heatwaves. In the absence of moisture advection, the AHW and LHW were accompanied by an increase of up to 30% in absolute humidity (ρv) over the lake. Being a powerful greenhouse gas, water vapor (characterized by an increased ρv) absorbed most of both the upwelling and downwelling longwave thermal radiation, heating the near-ground atmospheric layer (which is in direct contact with the lake water surface), in the daytime and nighttime. In the nighttime, the maximal intensity of the AHW and LHW reached 4 °C and 3 °C, respectively. Because of the observed steadily increasing dust pollution over the Eastern Mediterranean during the past several decades, we anticipate that dust-related lake heatwaves will intensify adverse effects on aquatic ecosystems such as reducing fishery resources and increasing harmful cyanobacteria blooms.

1. Introduction

During the last several decades, the Eastern Mediterranean has been identified as one of the most prominent climate change hotspots suffering from extreme atmospheric heatwaves, severe droughts, and steadily increasing desert dust pollution, as described by Zittis et al. [1], Hochman et al. [2], Tsikerdekis et al. [3], Shaheen et al. [4], and Yu et al. [5]. In the Eastern Mediterranean, atmospheric heatwaves and dust pollution are predicted to significantly increase, in both frequency and intensity, in the coming decades, accompanied by global warming [4,6,7]. Moreover, since the beginning of the 21st century, the increasing warming trend of the Mediterranean Sea surface temperature (SST) (Figure 1a updated from Pisano et al. [8]) has been associated with a strong increase in marine heatwaves [9,10]. A marine heatwave (MHW) is a marked warming of sea surface water that lasts from a few days to a few weeks when SST exceeds the normal conditions based on reference climatology [11,12,13]. During the last two decades, Mediterranean MHWs have caused mass-mortality events in various marine species and losses for associated industries [11]. In 2022–2023, marine heatwaves in the Mediterranean Sea reached record-breaking persistence, and one can expect that they will become more intense, longer, and more frequent [10,13].
Little is known about lake heatwaves during global warming, which are defined as prolonged periods of abnormally warm lake surface water temperature (SWT) compared to a local and seasonally varying 90th percentile threshold [14,15]. Using satellite observations of lake SWT and model data, Woolway et al. [14] investigated changes in lake heatwave properties for hundreds of lakes worldwide for the 200-year period from 1901 to 2099. They showed that lake heatwaves will become hotter and longer by the end of the twenty-first century. This is in line with the results obtained by Wang et al. [16], who applied a similar approach (based on the integration of satellite and lake model data) to explore heatwaves in Chinese lakes during the period from 1980 to 2100. Their analysis showed that increases in longwave radiation, specific humidity, and air temperature across China from 1980 to 2021 were the main factors contributing to the formation of heatwave events [16]. Analyzing lake heatwaves in the Great Lakes, Woolway et al. [15] found that the spatial extent of lake heat waves increased at a rate of 7.3% per decade. Woolway et al. [17] ran model simulations for all lakes across Europe to investigate the influence of the 2018 European heatwave on lake SWT. They found that, during May–October 2018, the mean and maximum SWTs were 1.5 and 2.4 °C higher than the base-period average (1981–2010). As for the adverse effects on aquatic ecosystems, lake heatwaves could cause significant disasters for lake ecosystems by reducing fishery resources and contributing to harmful cyanobacteria blooms [18,19]. The above-mentioned studies provided, however, no specific information on lakes located in the Eastern Mediterranean. Given the high vulnerability of Eastern Mediterranean lakes to the observed thermal extremes, the lack of knowledge prevents us from taking effective measures against future risks.
The freshwater Lake Kinneret, which supplies water to both Jordan and Israel, is within the northern section of the Jordan Rift Valley in Israel. With respect to this lake, Rimmer et al. [20] predicted an increase in evaporation and a decrease in precipitation by the year of 2060 for this lake using a combination of high-resolution regional climate models together with a lake evaporation model. Similarly, ensemble model predictions by La Fuente et al. [21] showed an increase in evaporation and a decrease in precipitation: these will result in a decline in the water availability of Lake Kinneret by the end of the 21st century. In accordance with the above predictions of decreasing precipitation and increasing evaporation, Lake Kinneret could disappear by the end of the 21st century. Lake Kinneret’s surface water temperature (SWT) is one of the main factors determining evaporation. However, the above-mentioned climate model predictions did not consider the effect of steadily increasing dust pollution over the Eastern Mediterranean on Lake Kinneret’s SWT. The above-mentioned model predictions could be improved by considering this effect.
Kishcha et al. [22] analyzed the impact of an extreme dust intrusion on the diurnal behavior of SWT in Lake Kinneret, which appeared in September 2015. Their study showed that the extreme dust intrusion noticeably influenced Lake Kinneret’s SWT: in situ measurements of water temperature at a depth of 20 cm showed an increase of ~1 °C in the daytime and in the nighttime. Regarding the increase in desert dust pollution over the Eastern Mediterranean during the last several decades, their findings raised the following essential question: could dust intrusions cause an intense persistent lake heatwave in the freshwater Lake Kinneret? However, the role of dust intrusions in the formation of lake heatwaves has not yet been discussed in previous publications. A comprehensive investigation of this point has become vital.
In the current study, we addressed this critical gap in our knowledge by investigating a lake heatwave in Lake Kinneret caused by an extreme dust intrusion that occurred in September 2015. This was carried out using in-situ meteorological and lake water temperature measurements together with satellite SWT observations.

2. Materials and Methods

2.1. Study Area

As mentioned above, freshwater Lake Kinneret (also known as the Sea of Galilee) is in the Eastern Mediterranean, in Israel (Figure 1). This lake is within the northern section of the Jordan Rift Valley, at a depth of 210 m below sea level (b.s.l.): its surface area is ~166 km2 and the maximal depth is ~40 m. Atmospheric low-pressure systems, known as Cyprus Lows, are the main cause of rainfall of ~400 mm per year over Lake Kinneret during the rainy season [23]; these low-pressure systems are also instrumental in the cooling of surface and subsurface water in the lake, according to Kishcha et al. [24]. Satellite MODIS data on Kinneret SWT during the last two decades (measured in the skin layer of 10–20 microns) revealed the absence of SWT trends in the summer months despite the presence of increasing atmospheric warming: this was explained by the influence of increasing evaporation on Kinneret SWT [25]. Desert dust intrusions are accompanied by deposition of dust particles, in accordance with Kishcha et al. [26]. They found an increase in dust dry deposition over northern Israel (including Lake Kinneret) in autumn months during the last two decades due to increasing dust penetration from Syria [26].

2.2. September 2015 Extreme Dust Event in the Study Area

A dust storm, which struck the Eastern Mediterranean (and Israel in particular) in September 2015, was one of the most extreme dust storms on record, in accordance with Uzan et al. [27,28] and Gasch et al. [29]. They discussed the fact that dust transport from desert regions in northern Syria was responsible for the severe dust intrusion over Israel: dust plumes penetrated Israel from northeast to southwest. MODIS-Terra satellite imagery had started showing the presence of some amounts of dust pollution over the Jordan Rift valley on September 7 at 10:30 local time (LT) and significant amounts of dust pollution on September 8 and 9 [22]. Using ICON-ART model data, Gasch et al. [29] showed that on dusty 8 September 2015, dust aerosol optical depth (AOD) reached 1.5 over the Zemah station near Lake Kinneret.

2.3. Method

The dust intrusion in September 2015 caused significant changes in various parameters such as air temperature (Tair), surface water temperature (SWT), bulk water temperature, longwave radiation, and atmospheric humidity. We used a similar approach to investigate the impact of the dust intrusion on each of the above-mentioned parameters. Our approach is explained below with an example of daily maximum Tair (Tair-MAX). Our approach is based on the comparison between day-to-day variations in Tair-MAX in September 2015 and the 90th percentile threshold for Tair-MAX in September during the reference period. The exceedance of Tair-MAX in September 2015 over the 90th percentile threshold for at least five days in a row (separated by no more than one day) was defined as an atmospheric heatwave. Accordingly, the exceedance of SWT-MAX in September 2015 over the 90th percentile threshold (for SWT-MAX in September) for at least five days was defined as a lake heatwave.
In-situ measurements of Tair, bulk water temperature, and atmospheric humidity for September during the period (2011–2023) were used to represent the main reference period (with the exception of September 2015 and September 2020). September 2015 was under investigation in this study, while September 2020 was excluded due to the presence of extreme heat over the Middle East [1]. As in-situ measurements of both upwelling and downwelling longwave radiation in September were available only during the five-year period (2013–2017), this period was used as the reference period for those parameters (with the exception of September 2015).
The above-mentioned definition for heatwaves was used in previous studies on lake and marine heatwaves [11,14,15]. Note, however, that for the investigation of marine heatwaves (MHWs), Hobday et al. [11] used a seasonally varying 90th percentile threshold calculating for each day of the year. This approach was used because the duration of MHWs varied from several days to several months. In this study, we focused on investigating the relatively short LHW and AHW in Lake Kinneret, which lasted for only 10 days in the middle of September (7–17 September 2015). For these days, the fixed 90th percentile threshold in September was close to the seasonally varying 90th percentile threshold calculated for each day of the year. This justifies our use of the fixed 90th percentile threshold in September, based on limited amounts of available in-situ measurements during the specified reference period.

2.4. Data

To characterize the dust intrusion, we used satellite measurements of daily aerosol optical depth (AOD) complemented by ground based 10 min PM10 measurements at the Afula monitoring station (32.59°N; 35.27°E). The PM10 measurements were conducted using a Thermo Scientific FH 62 C14 Continuous Particulate Monitor. The specifications of FH 62 C14 are available online at https://assets.thermofisher.com/TFS-Assets/LSG/Specification-Sheets/D19629~.pdf (accessed on 26 May 2024). The Afula site is located at a distance of 40 km southwest of Lake Kinneret (Figure 1b). We used the Deep Blue AOD product of the Moderate-Resolution Imaging Spectroradiometer (MODIS-Terra) collection 6.1 (MOD08_D3): daily AOD data with horizontal resolution of 1° × 1° [30]. Daily AOD data were analyzed over the North Israel region including Lake Kinneret (32°N–33°N, 35°E–36°E) from 1 to 30 September 2015.
To study the radiative effects of dust on solar radiation (SR), we used 10 min pyranometer measurements of solar radiation (SR) at the Zemah meteorological station (32.70°N, 35.58°E), located in the vicinity of Lake Kinneret (Figure 1). SR (0.285–2.880 µm) was measured by a Kipp & Zonen CMP-11 pyranometer. The specifications of CMP-11 are available online at https://s.campbellsci.com/documents/eu/product-brochures/b_cmp11-l.pdf (accessed on 26 May 2024).
The 10 min measurements of air temperature (Tair) and relative humidity (RH) were taken at the following four meteorological stations (Sts.): St. A (32.82°N, 35.60°E), located in the middle of the lake; and the three land stations Ayyellet Hashahar (33.02°N, 35.57°E), Deir Hanna (32.86°N, 35.37°E), and Avne Etan station (32.81°N, 35.76°E), located ~15 km away from the lake in different directions (Figure 1). In the text below, these land stations are designated as stations B, C, and D for Ayyellet Hashahar, Deir Hanna, and Avne Etan, respectively.
In addition, we used the following two datasets of in-situ 10 min measurements taken at St. A:
(1) Water temperature at a depth of 20 cm (WT-20cm), which was taken by a Campbell 107-L temperature probe (its specifications are available online at https://www.campbellsci.asia/107-l, accessed on 26 May 2024). According to the specifications, the tolerance of in-situ measurements of WT-20cm was ± 0.2 °C for the temperature interval from 0 °C to 50 °C.
(2) Upwelling and downwelling longwave (LW) radiation (4.5 to 42 µm) by a CNR4 Net Radiometer (specifications are available online at https://www.kippzonen.com/Product/85/CNR4-Net-Radiometer#.Y3XHy3ZByUk, accessed on 26 May 2024). According to the specification, its no-stability is <1%, and its non-linearity is <1% (sensitivity change per year). At St. A, 10 min measurements of WS, Tair, RH, and upwelling and downwelling longwave radiation were taken 2–3 m above the lake surface.
In-situ radiometer measurements of upwelling longwave radiation (ULWR) were used to obtain actual SWT by the Stefan–Boltzmann formula:
H W = ε · σ · T 0 4
where HW is the flux of ULWR emitted from the lake surface (W/m2); ε is the emissivity of lake water, which is close to 1; σ = 5.6703 × 10⁻⁸ kg s−3 K−4 is the Stefan–Boltzmann constant; and T0 is SWT (°K) [31,32]. SWT values, obtained using Formula (1), were quite accurate: their uncertainty was comparable with the uncertainty of meteorological temperature measurements of 0.1 degrees (see Section 3.4).
The following approach by David et al. [33] was used to convert relative humidity to absolute atmospheric humidity (ρV) in g/m3:
ρ V = 1324.45 × R H 100 % × exp ( 17.67   ×   T T   +   243.5 ) T + 273.15
where R H stands for relative humidity (%), and T stands for air temperature (°C).
The water vapor mixing ratio ( M I X R ) in g/kg was obtained using the following expressions [34]:
M I X R = 622 · R H 100   · e s p e s ·   R H 100
e s = 6.112   · E X P 17.67 · T T + 243.5
where e s stands for saturated water vapor pressure (hPa), p is barometric pressure (hPa), R H is relative humidity (%), and T stands for air temperature (°C).
To investigate the presence of temperature inversion during the dust intrusion under study, we analyzed vertical temperature profiles from radiosonde soundings at St. Bet Dagan (located in central Israel) in September 2015. We used these radiosonde data (being the only ones available in Israel) because the dust intrusion under study was a large-scale phenomenon: dust was more or less evenly distributed over Israel.
Furthermore, to study surface lake heatwaves created in Lake Kinneret by the dust intrusion, we used hourly METEOSAT land surface temperature (LST) retrievals together with their estimated uncertainty. These LST retrievals were derived from the Spinning Enhanced Visible and Infra-Red Imager (SEVIRI) onboard the geostationary METEOSAT second-generation satellites [35]. The METEOSAT product of land surface temperature (physical model) is available at https://wui.cmsaf.eu/safira/action/viewProduktHome (accessed on 26 May 2024). This product is presented on a 0.05° × 0.05° grid. The hourly METEOSAT LST data contains LST retrievals and their estimated uncertainty, which can be used as quality indicators [35,36]. Note that St. A is located near the boundary between the two METEOSAT pixels (Figure 1). Therefore, in this study, we compared in-situ radiometer measurements of SWT with METEOSAT SWT averaged over the two pixels, within the Lake Kinneret water area (32.775°N–32.875°N; 35.575°E–35.625°E).
In this study, satellite SWT retrievals were used not only from geostationary METEOSAT satellites but also from the orbital MODIS-Terra satellite. We used Collection-6 (C6) of the Moderate-Resolution Imaging Spectroradiometer (MODIS) Land Surface Temperature (LST) MOD11A1 product [37]. The MOD11A1 C6 product provides daily per-pixel MODIS LST Level-3 data from the Terra satellite at 1 × 1 km2 spatial resolution in the daytime at approximately 10:30 LT and in the nighttime at 22:30 LT. For consistency, we compared in-situ radiometer measurements of SWT with MODIS SWT averaged over the same Lake Kinneret water area (32.775°N–32.875°N; 35.575°E–35.625°E). Note that in-situ radiometers, as well as those on board the satellites, measure Lake Kinneret SWT in the surface layer of 10–20 µm [38].
For consistency with hourly METEOSAT SWT, the time series of all in-situ 10 min data were processed as hourly means: to this end, they were smoothed by using one-hour running mean.

3. Results

3.1. PM10 and AOD Day-to-Day Variations

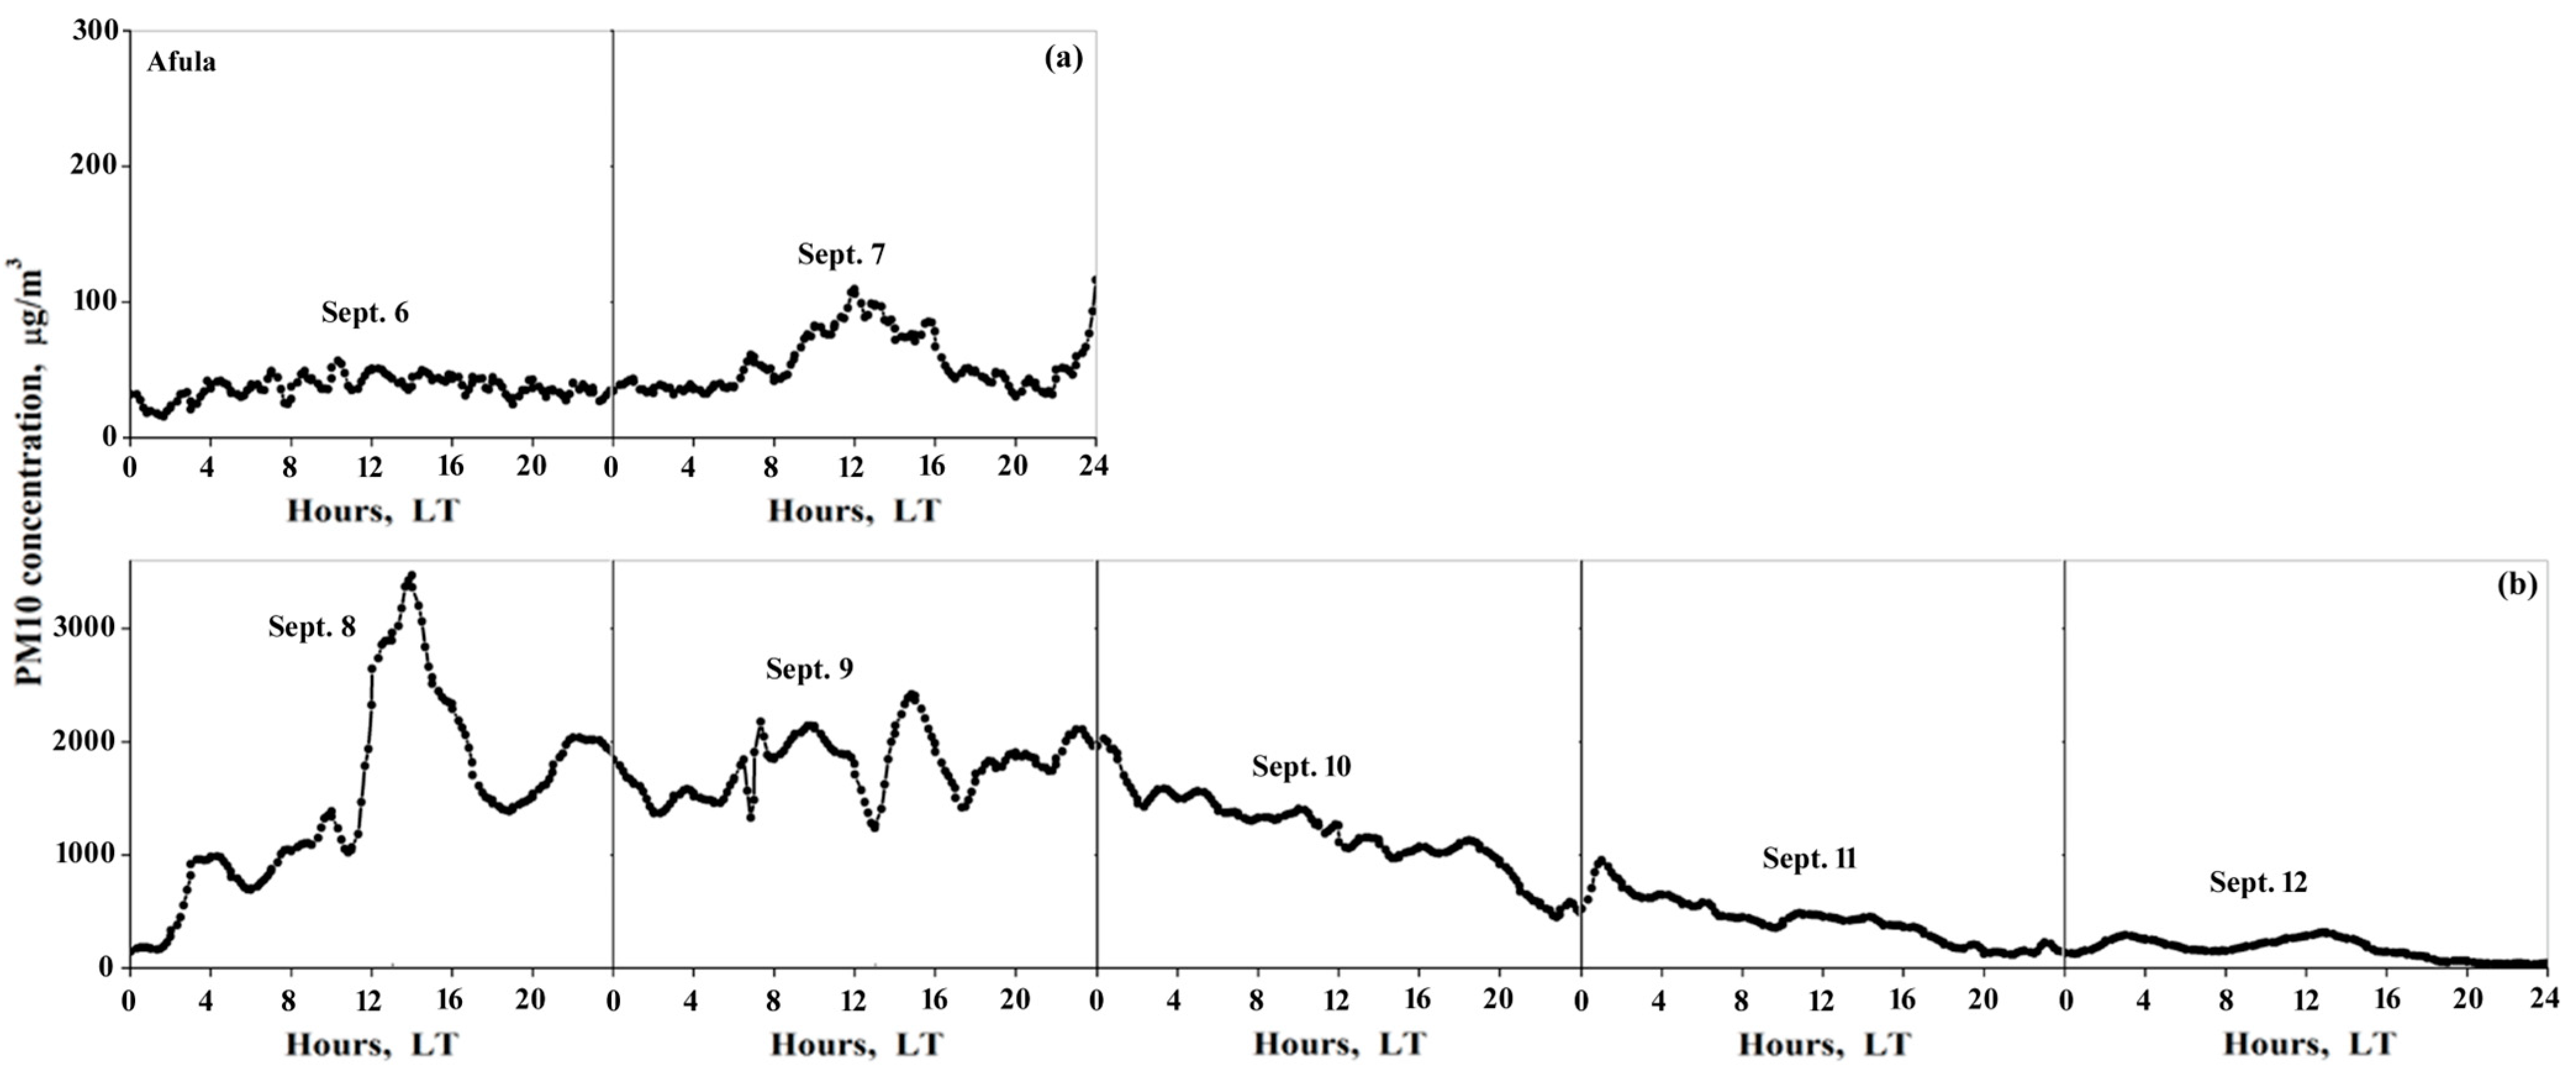
As for the surface dust concentration during the dust intrusion, the Afula monitoring site (32.59°N; 35.27°E) showed increasing PM10 concentrations during the period from 7 to 12 September 2015 (Figure 2a,b). PM10 stands for particulate matter with an aerodynamic diameter of less than 10 μm. The dust intrusion was characterized by an extreme PM10 concentration of up to 3400 µg m−3 on September 8 compared to the PM10 concentration less than 100 µg m−3 on clear-sky September 6 (Figure 2a,b). Only by the end of 12 September did the PM10 concentration return to its clear-sky level on September 6.
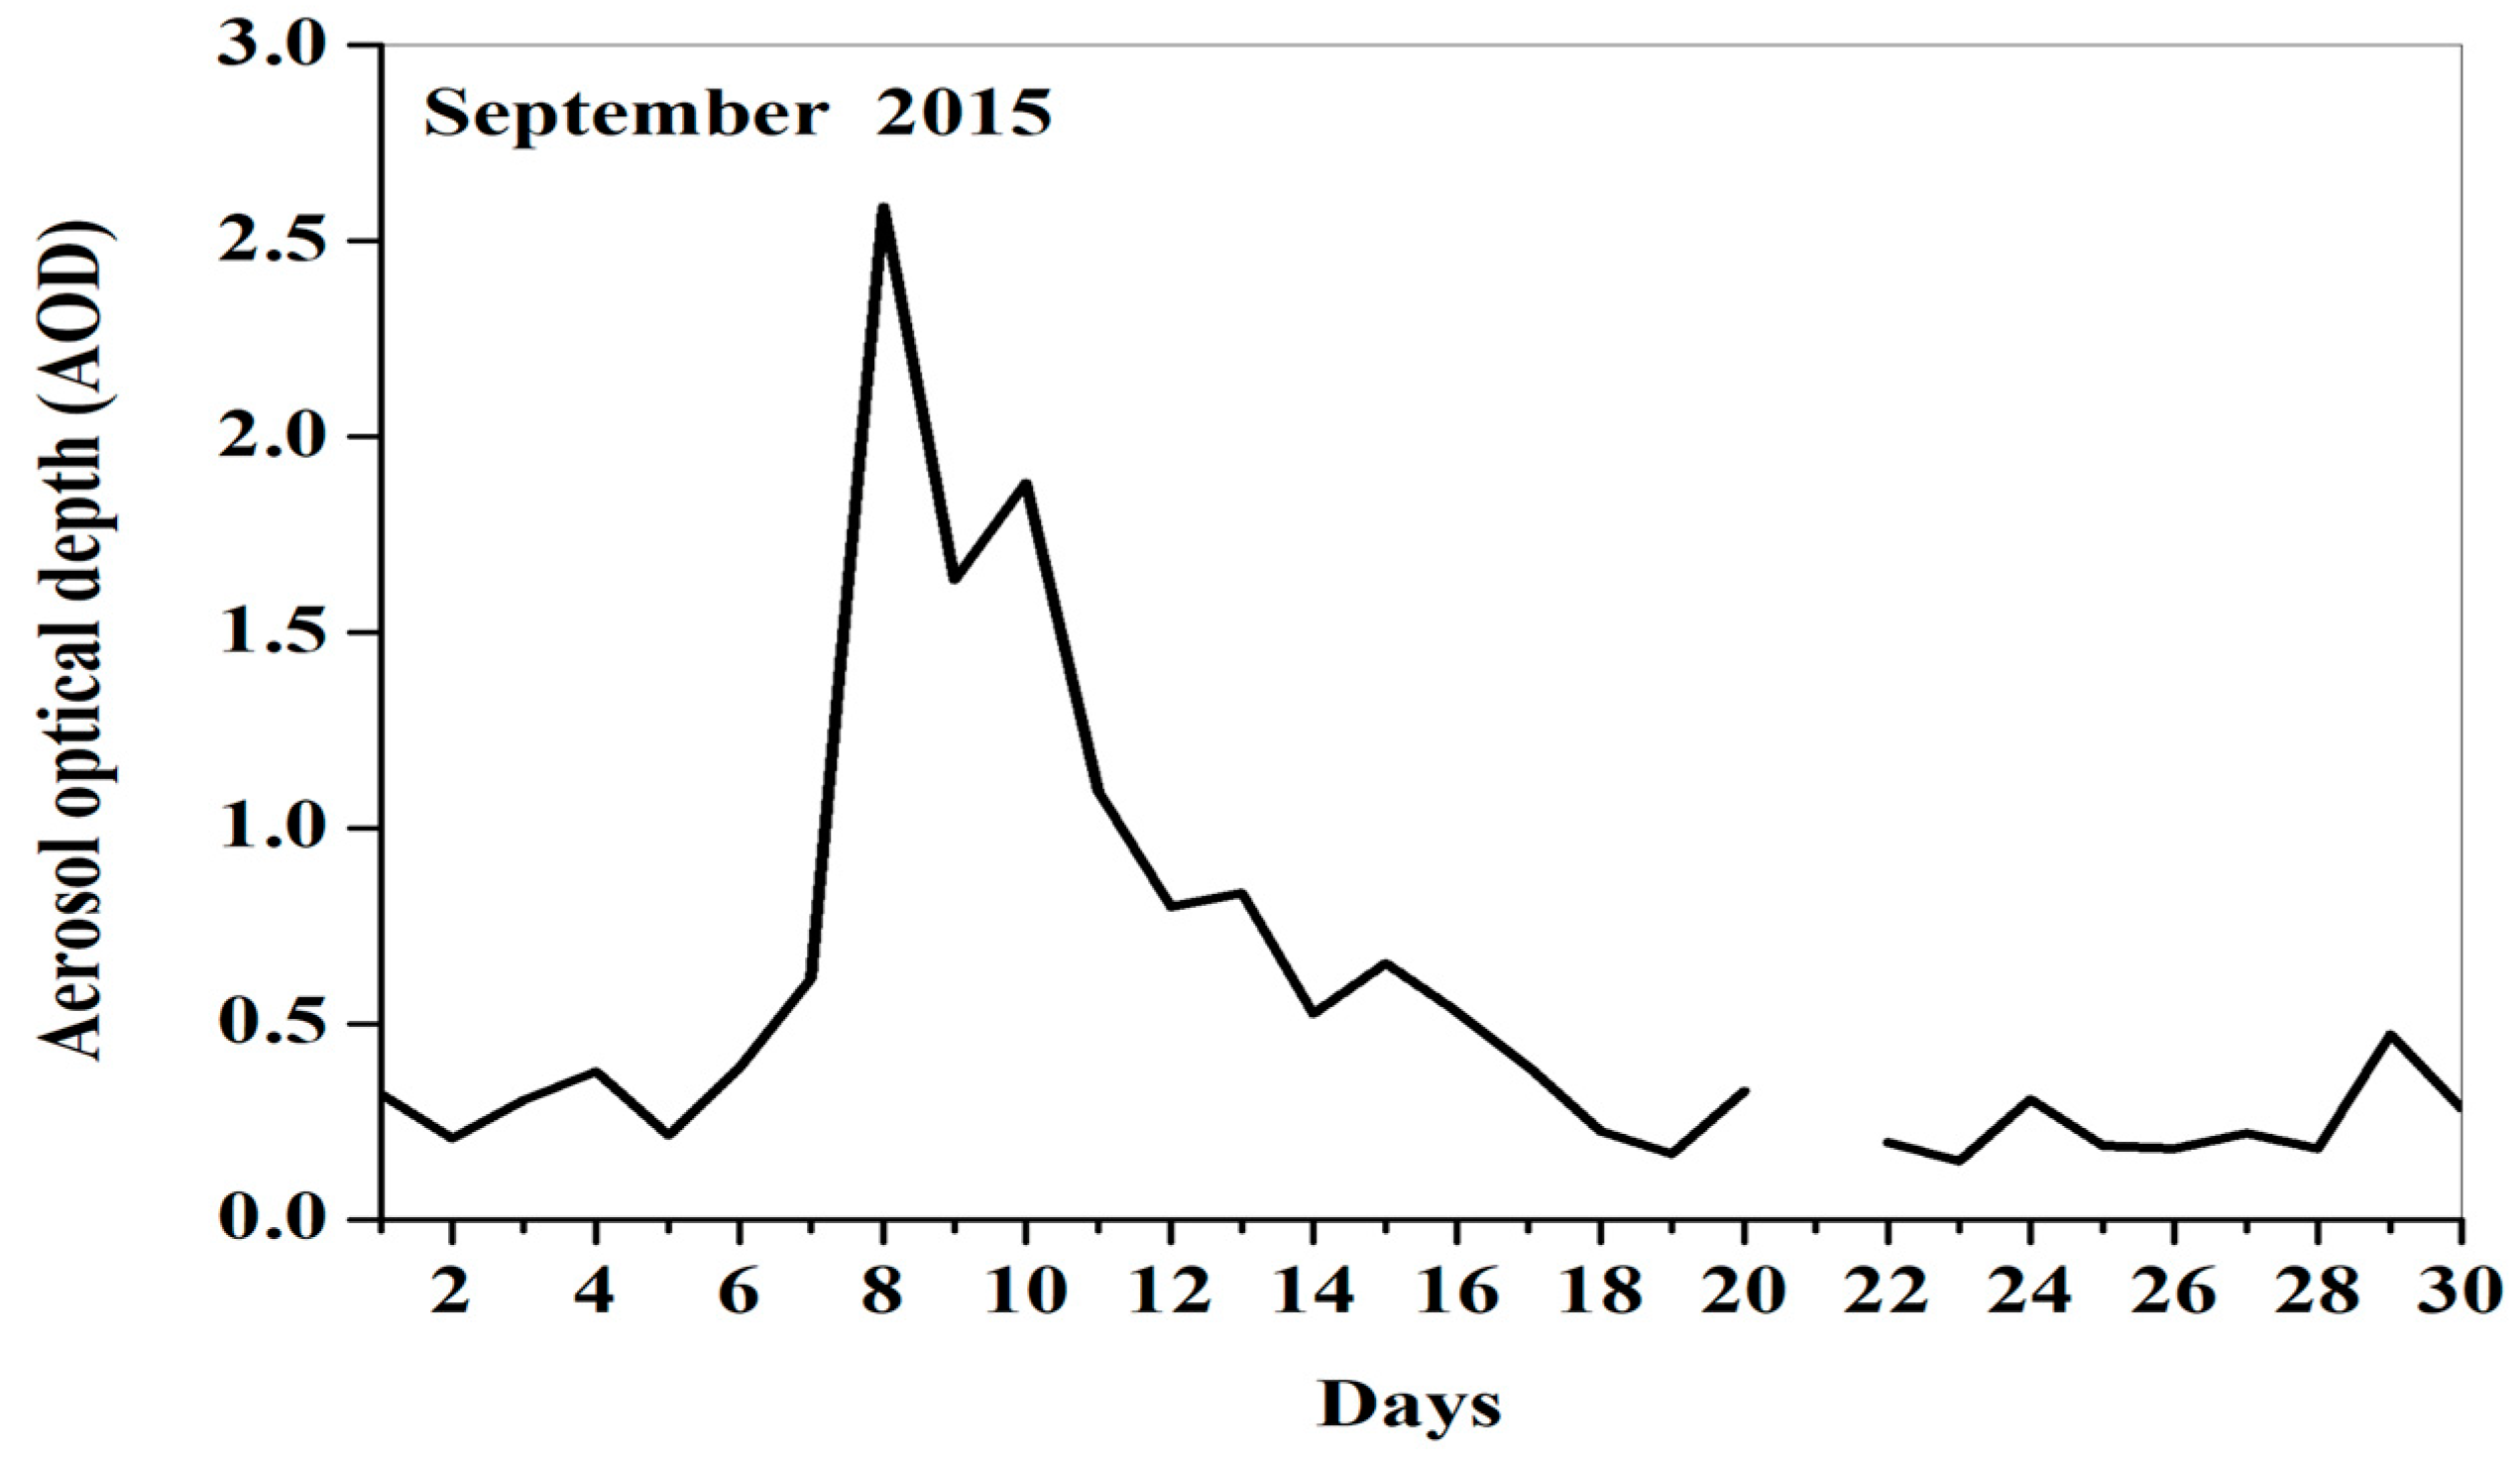
As mentioned, we used the Deep Blue AOD product of the MODIS-Terra collection 6.1 to study day-to-day variations in the AOD over North Israel (including Lake Kinneret) from 1 to 30 September 2015 (Figure 3). MODIS showed that during this period, AOD ranged from 0.15 and 2.60. Such significant variability in the AOD points to highly irregular and sometimes extreme dust intrusions. The AOD peaked on 8 September (2.60), indicating the presence of extreme dust pollution on that day. Then, the AOD sharply decreased on 9–10 September, followed by a gradual decrease until 19 September. Therefore, the AOD exceeded 0.3 during the period from 7 to 19 September 2015. This period was longer than the period of the observed increased PM10 concentrations exceeding 100 µg/m3 at the Afula site (Figure 2b). This is because the AOD is sensitive not only to dust particles near the surface but also to dust particles that are distant from the surface. As described below, the dust intrusion in September 2015 influenced the solar and thermal radiation over Lake Kinneret.

3.2. Day-to-Day Variations in Solar and Thermal Radiation

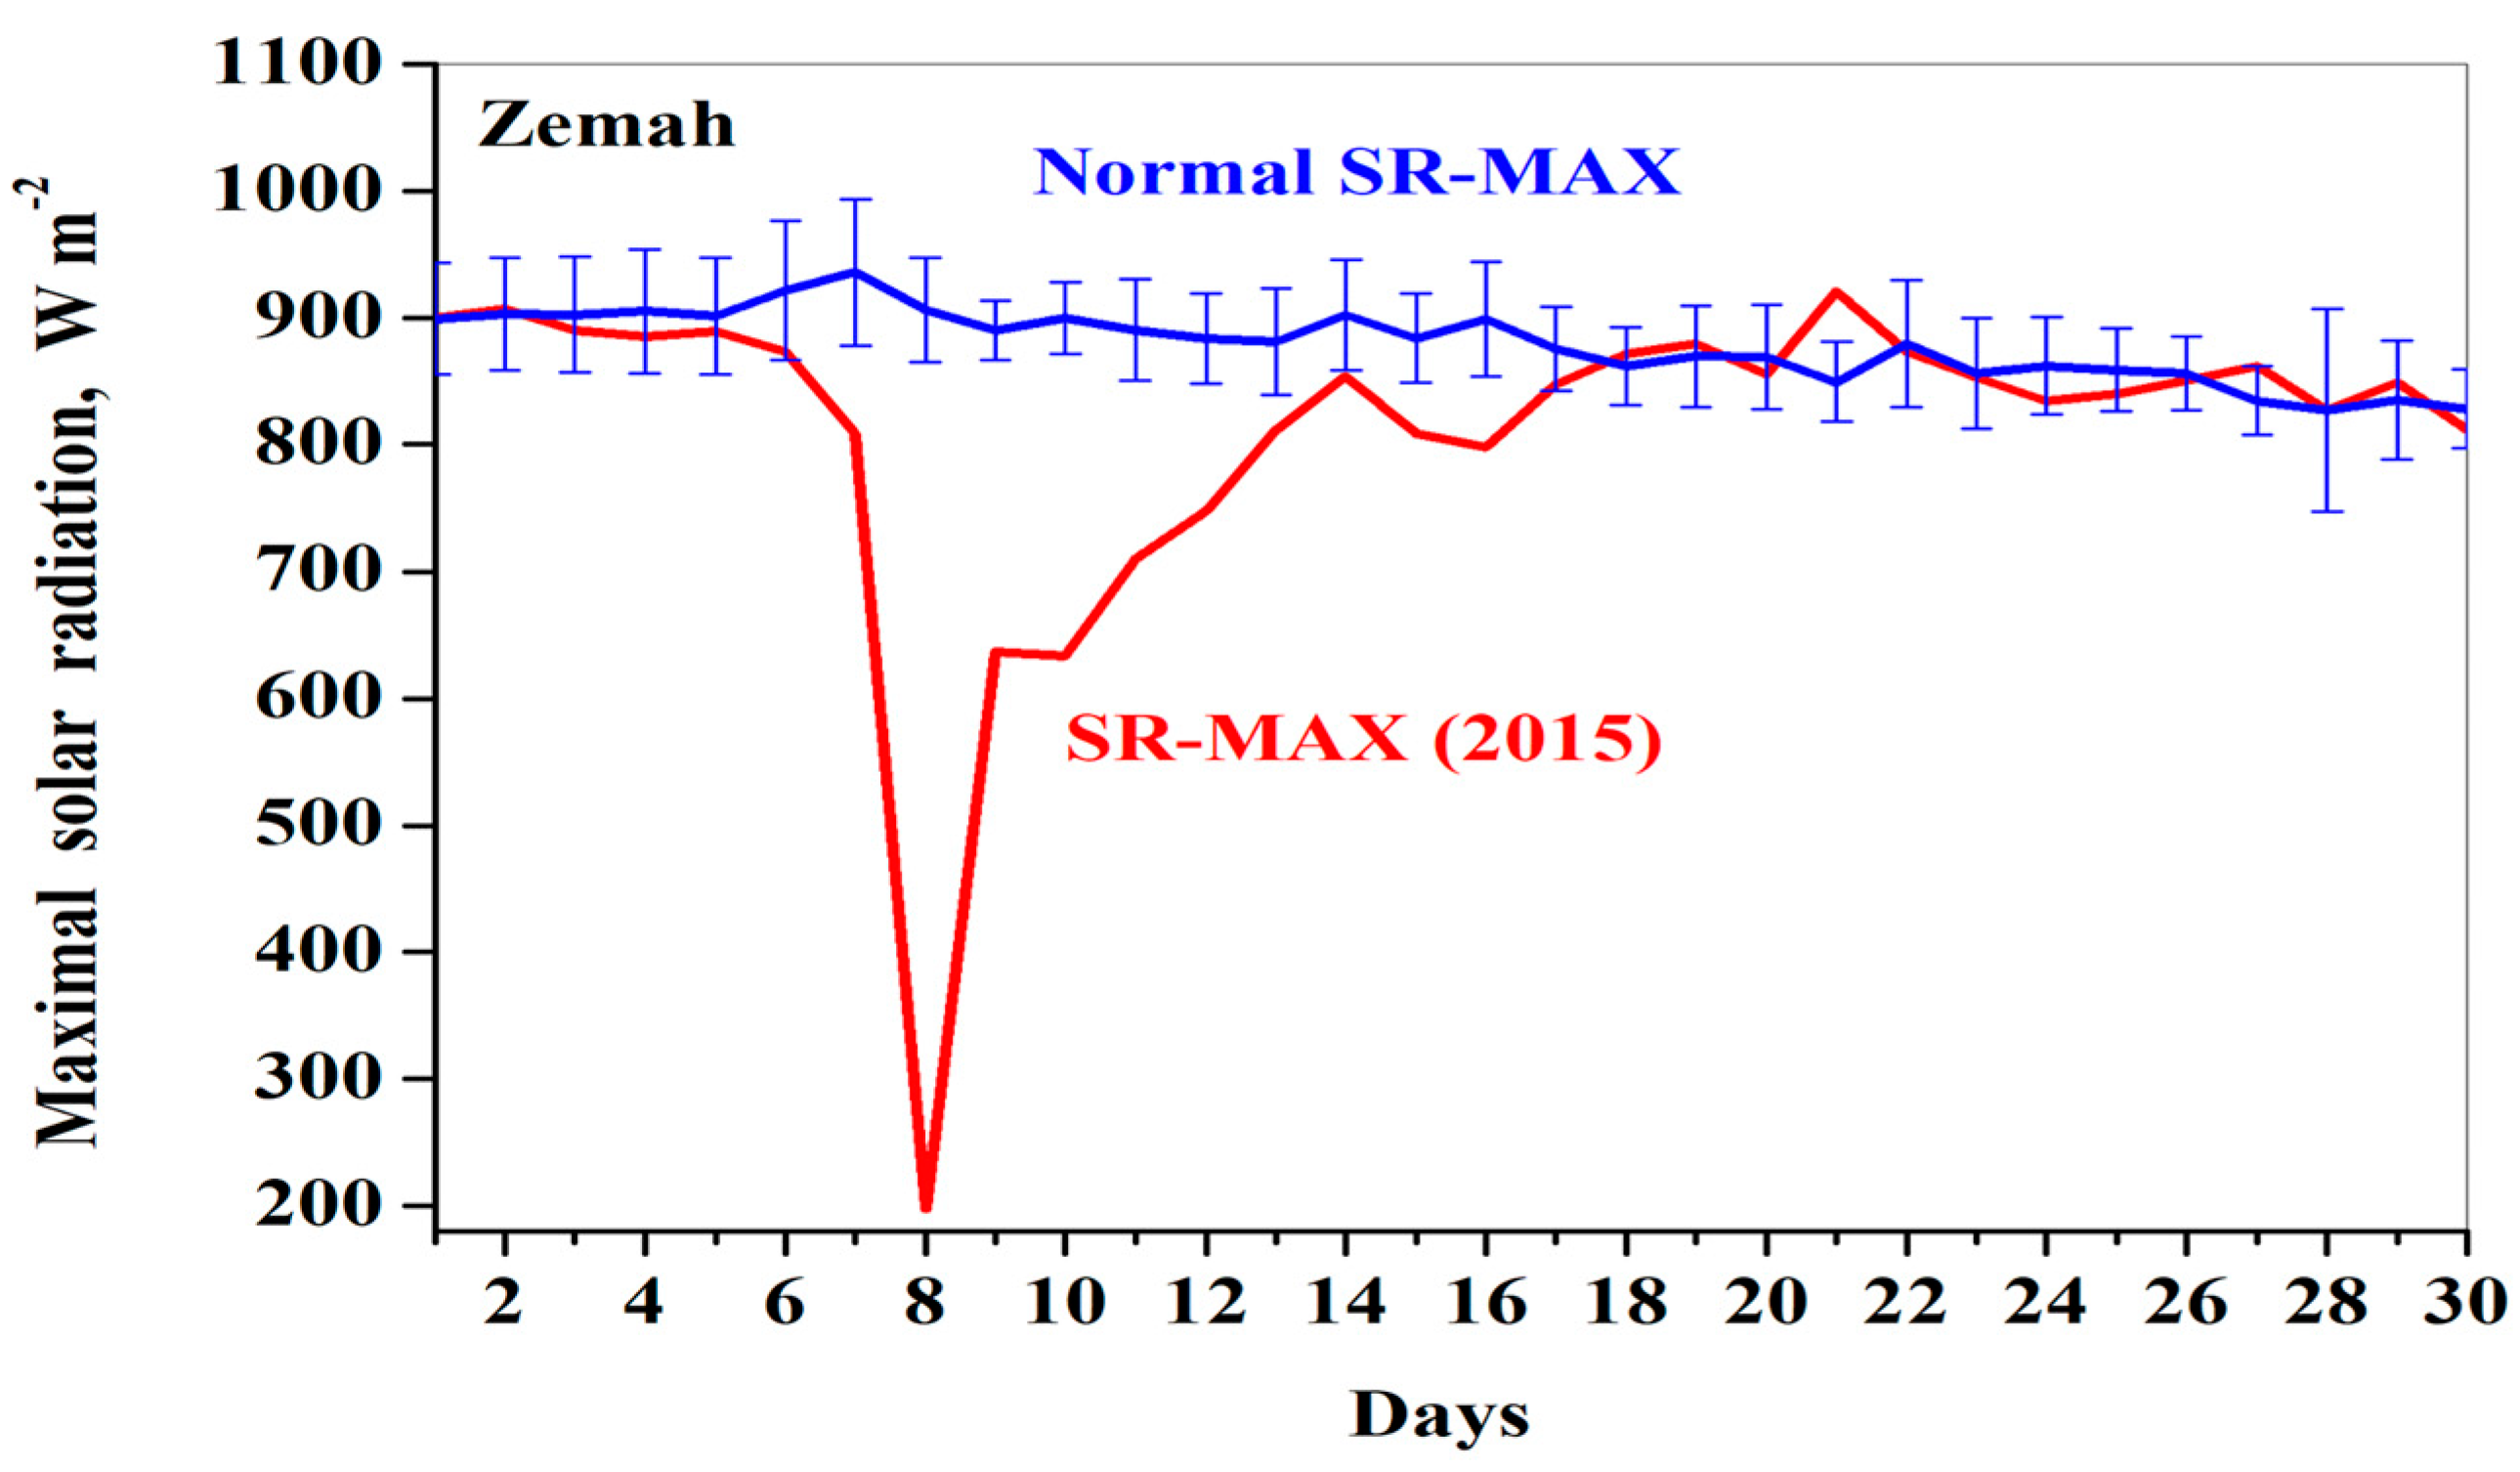
The extreme dust intrusion caused a pronounced drop in surface solar radiation over the lake during the same period due to the radiative effect of the dust. This was analyzed by comparing day-to-day variations in the maximal solar radiation (SR-MAX) with the normal SR-MAX in September during the reference period (2011–2023). This was carried out in order to estimate the drop in SR-MAX.
A decrease in SR-MAX started after 6 September 2015 (Figure 4). On 8 September 2015, in the presence of maximal dust pollution, SR-MAX reached its minimum of ~200 W m−2 compared to the normal SR-MAX of ~890 W m−2 on the corresponding day (Figure 4). From 9 to 11 September 2015, the SR-MAX sharply increased, in accordance with a sharp decrease in the AOD. From 11 to 14 September, the SR-MAX gradually increased, until it appeared within the uncertainty interval of the normal SR-MAX (Figure 4). Consequently, based on the above-mentioned day-to-day variations in the SR-MAX, the dusty period lasted for 10 days (7–17 September 2015), where the SR-MAX appeared outside of the uncertainty interval of the normal SR-MAX.
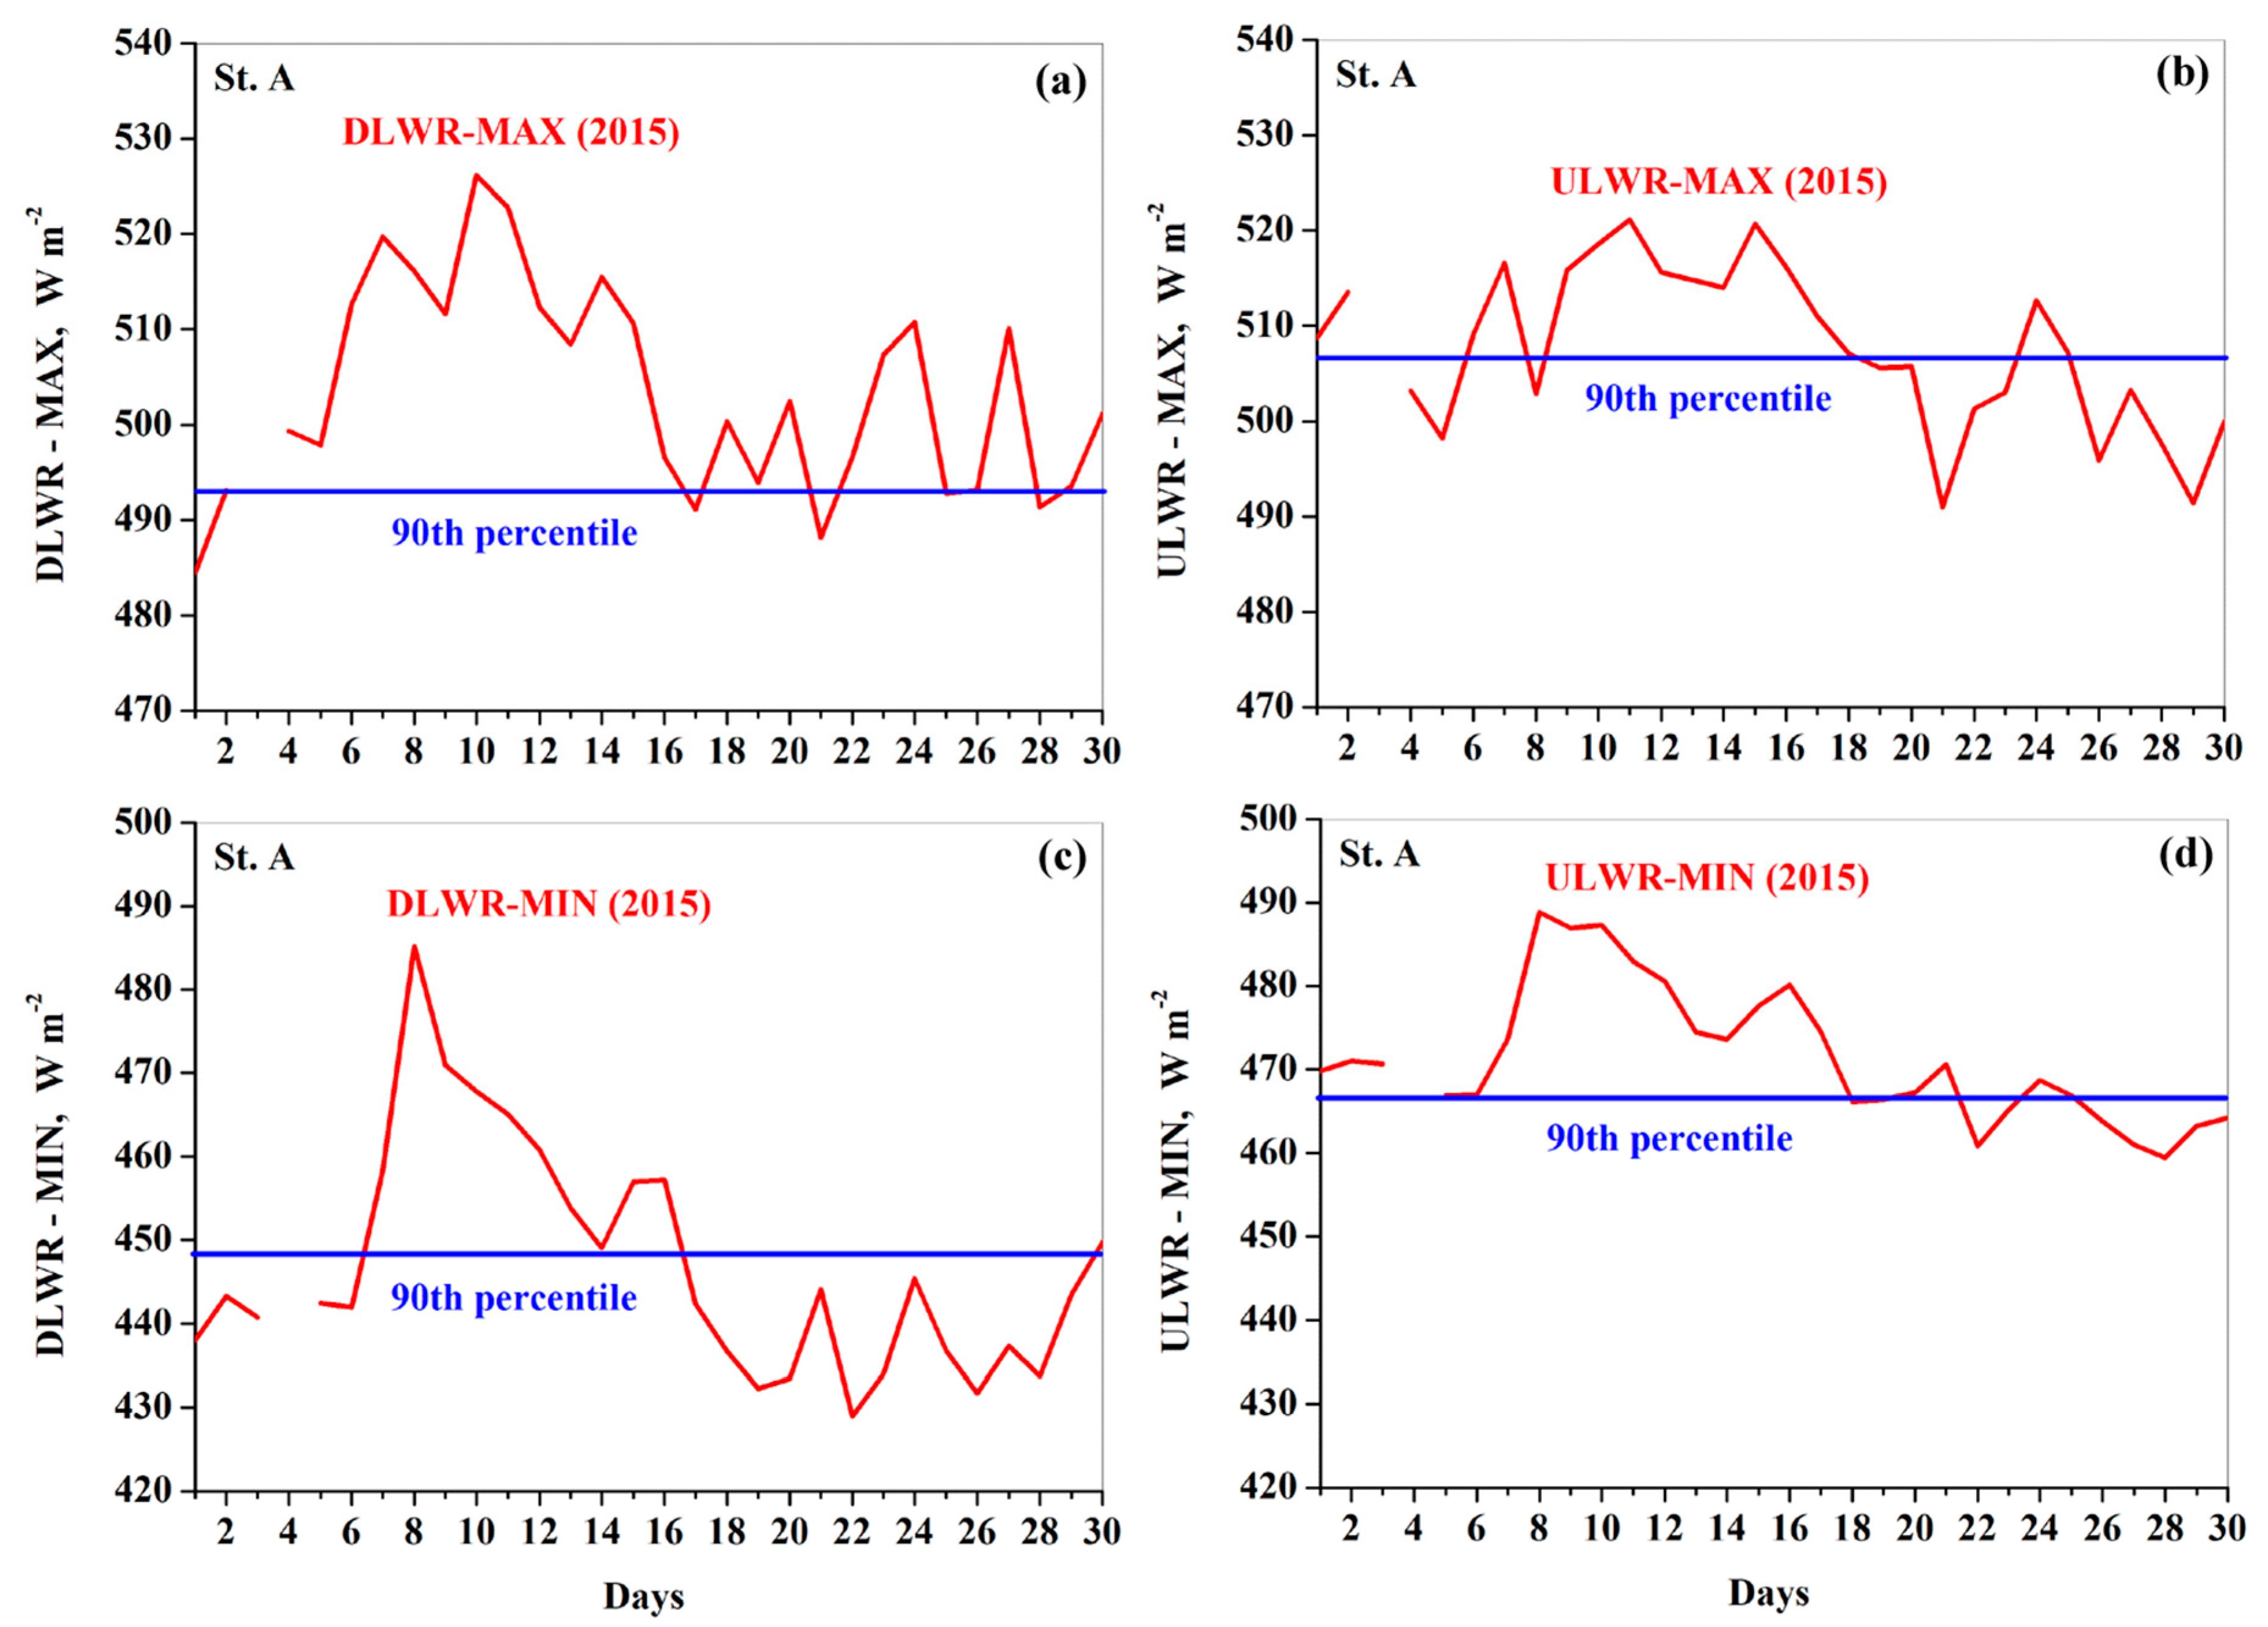
Radiometer measurements showed that the dust intrusion under study influenced both downwelling and upwelling longwave radiation (4.5–42 µm) over the lake surface. In particular, the measurements showed a prolonged period of abnormally high daily maximal downwelling longwave radiation (DLWR-MAX) and daily minimal downwelling longwave radiation (DLWR-MIN), which lasted for 10 days (7–17 September 2015) (Figure 5a,c). During this period, the DLWR-MAX (observed in the daytime) and DLWR-MIN (observed in the nighttime) exceeded the 90th percentile threshold for DLWR-MAX and DLWR-MIN in September by up to 35 W m−2 and 40 W m−2, respectively.
Moreover, the same 10-day period (7–17 September 2015) was accompanied by abnormally high daily maximal upwelling longwave radiation (ULWR-MAX) and daily minimal upwelling longwave radiation (DLWR-MIN) (Figure 5b,d). During this period, the ULWR-MAX (observed in the daytime) and ULWR-MIN (observed in the nighttime) exceeded the 90th percentile threshold for ULWR-MAX and ULWR-MIN in September by up to 15 W m−2 and 20 W m−2, respectively.
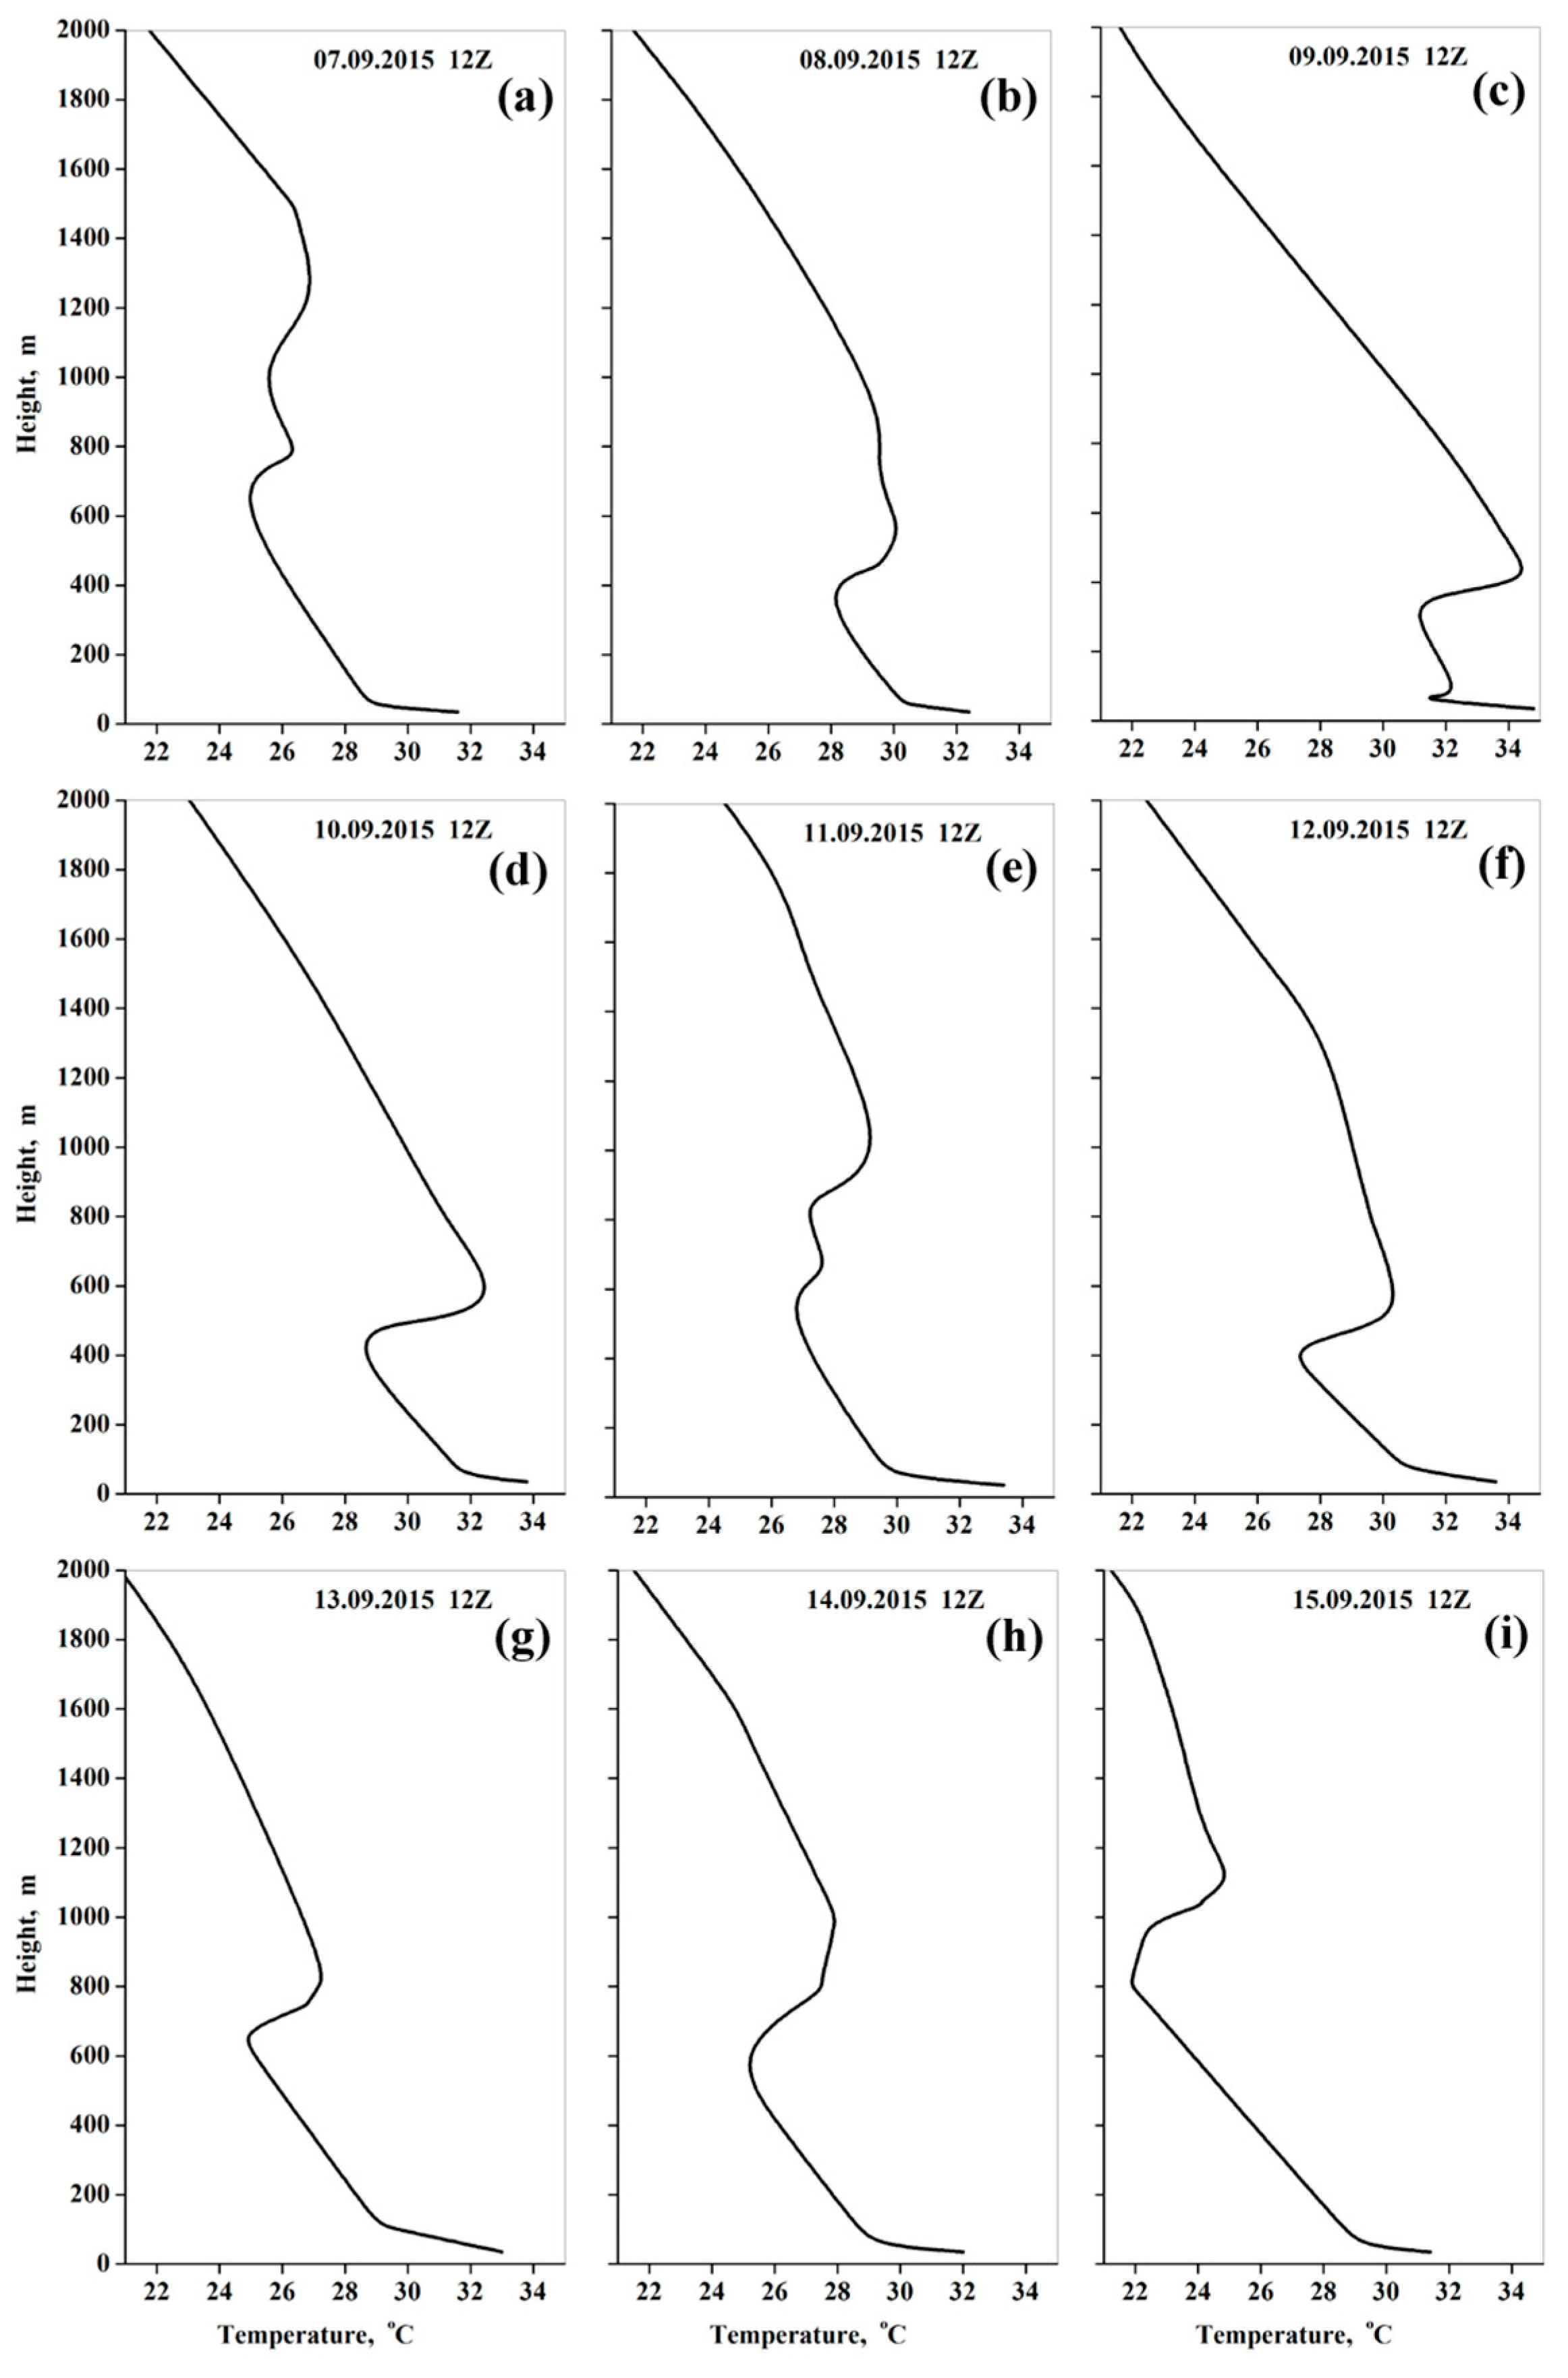
As known, low-level temperature inversion is often created below the dust layer (e.g., Kishcha et al. [39]). We investigated the presence of temperature inversion during the dust intrusion under study using vertical temperature profiles from the radiosonde soundings at St. Bet Dagan (located in central Israel) in September 2015. Our analysis showed the formation of low-level temperature inversion on each day from 7 to 15 September 2015 (Figure 6). One can see that the lowest height of temperature inversion (400–500 m) was observed in the presence of severe dust pollution from 8 to 10 September 2015. Note that low-level temperature inversion is an effective barrier to reducing the upwelling movement of water vapor. This could have caused the accumulation of water vapor over the lake during the dust intrusion. Water vapor is a powerful greenhouse gas. Therefore, the large amount of water vapor over the lake could have absorbed most of both the upwelling and downwelling longwave thermal radiation, heating the near-ground atmospheric layer (which is in direct contact with the lake water surface) (Section 4).

3.3. Atmospheric Heatwave

Dust particles absorb solar radiation and contribute to atmospheric warming over a lake and its surrounding land areas. This creates an atmospheric heatwave (AHW) characterized by a prolonged period of increased air temperature (Tair).
To estimate the duration and intensity of AHW over the lake in the daytime, we compared day-to-day variations in daily maximal air temperature (Tair-MAX) at St. A (observed between 13LT–17LT) in September 2015 with the 90th percentile threshold for Tair-MAX in September. It was found out that the AHW appeared over Lake Kinneret during a period of 12 days (7–19 September 2015). During the above-mentioned period, Tair-MAX was higher than the 90th percentile threshold for Tair-MAX, except for on 8 September 2015. On that day (8 September), Tair-MAX decreased and appeared ~1 °C below the 90th percentile threshold (Figure 7). The aforementioned decrease in Tair-MAX on 8 September 2015 can be explained by the dramatic drop in solar radiation due to the dust radiative effect in presence of extreme dust pollution (Figure 4).
The maximal intensity of the AHW in the daytime was characterized by a peak in the Tair-MAX observed on 10 September 2015. On that day, Tair-MAX exceeded (by 3 °C) the 90th percentile threshold for Tair-MAX (Figure 7).
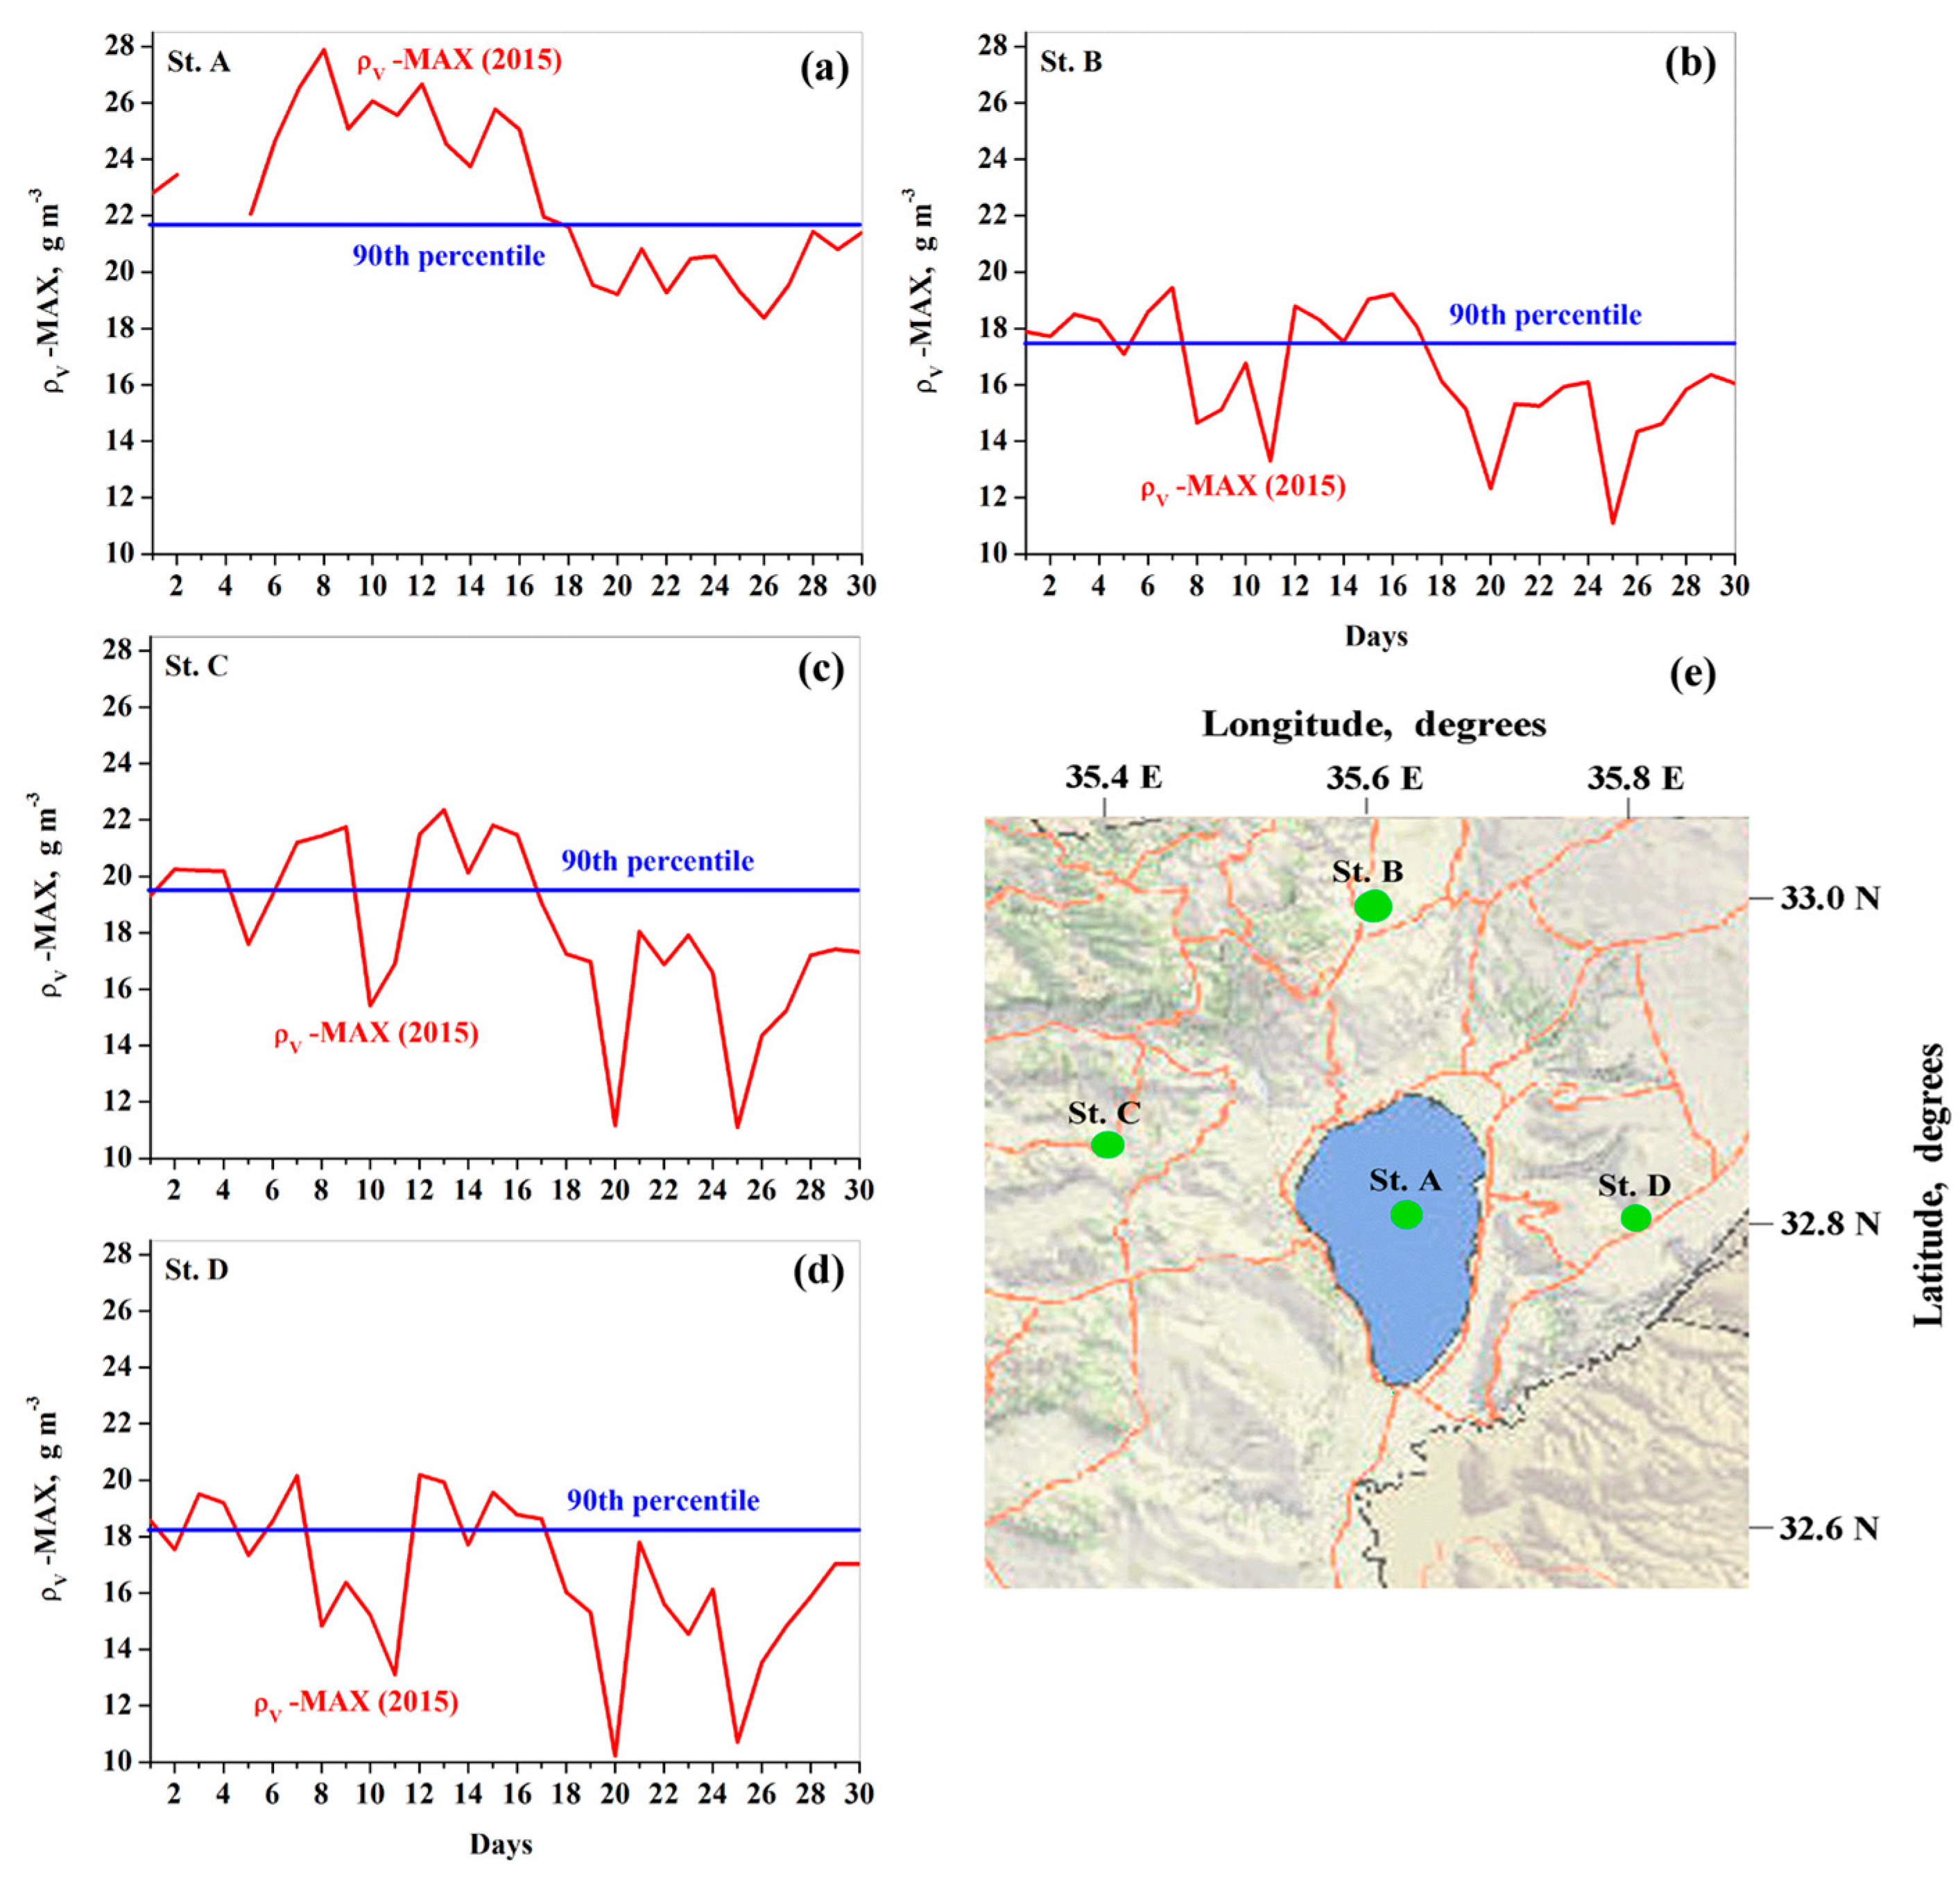
Similar analyses of Tair-MAX at three land meteorological stations B, C, and D (located ~15 km from the lake in different directions) also showed the presence of an AHW in September 2015, which was characterized by an abnormally high Tair-MAX. The intensity of the AHW over each of the land stations was even stronger than that over St. A in the lake: Tair-MAX exceeded (by up to 4 °C) the 90th percentile threshold for Tair-MAX (Figure A1). However, the duration of the AHW (≤8 days) over the land stations B, C, and D was noticeably shorter than the duration of the AHW over St. A.
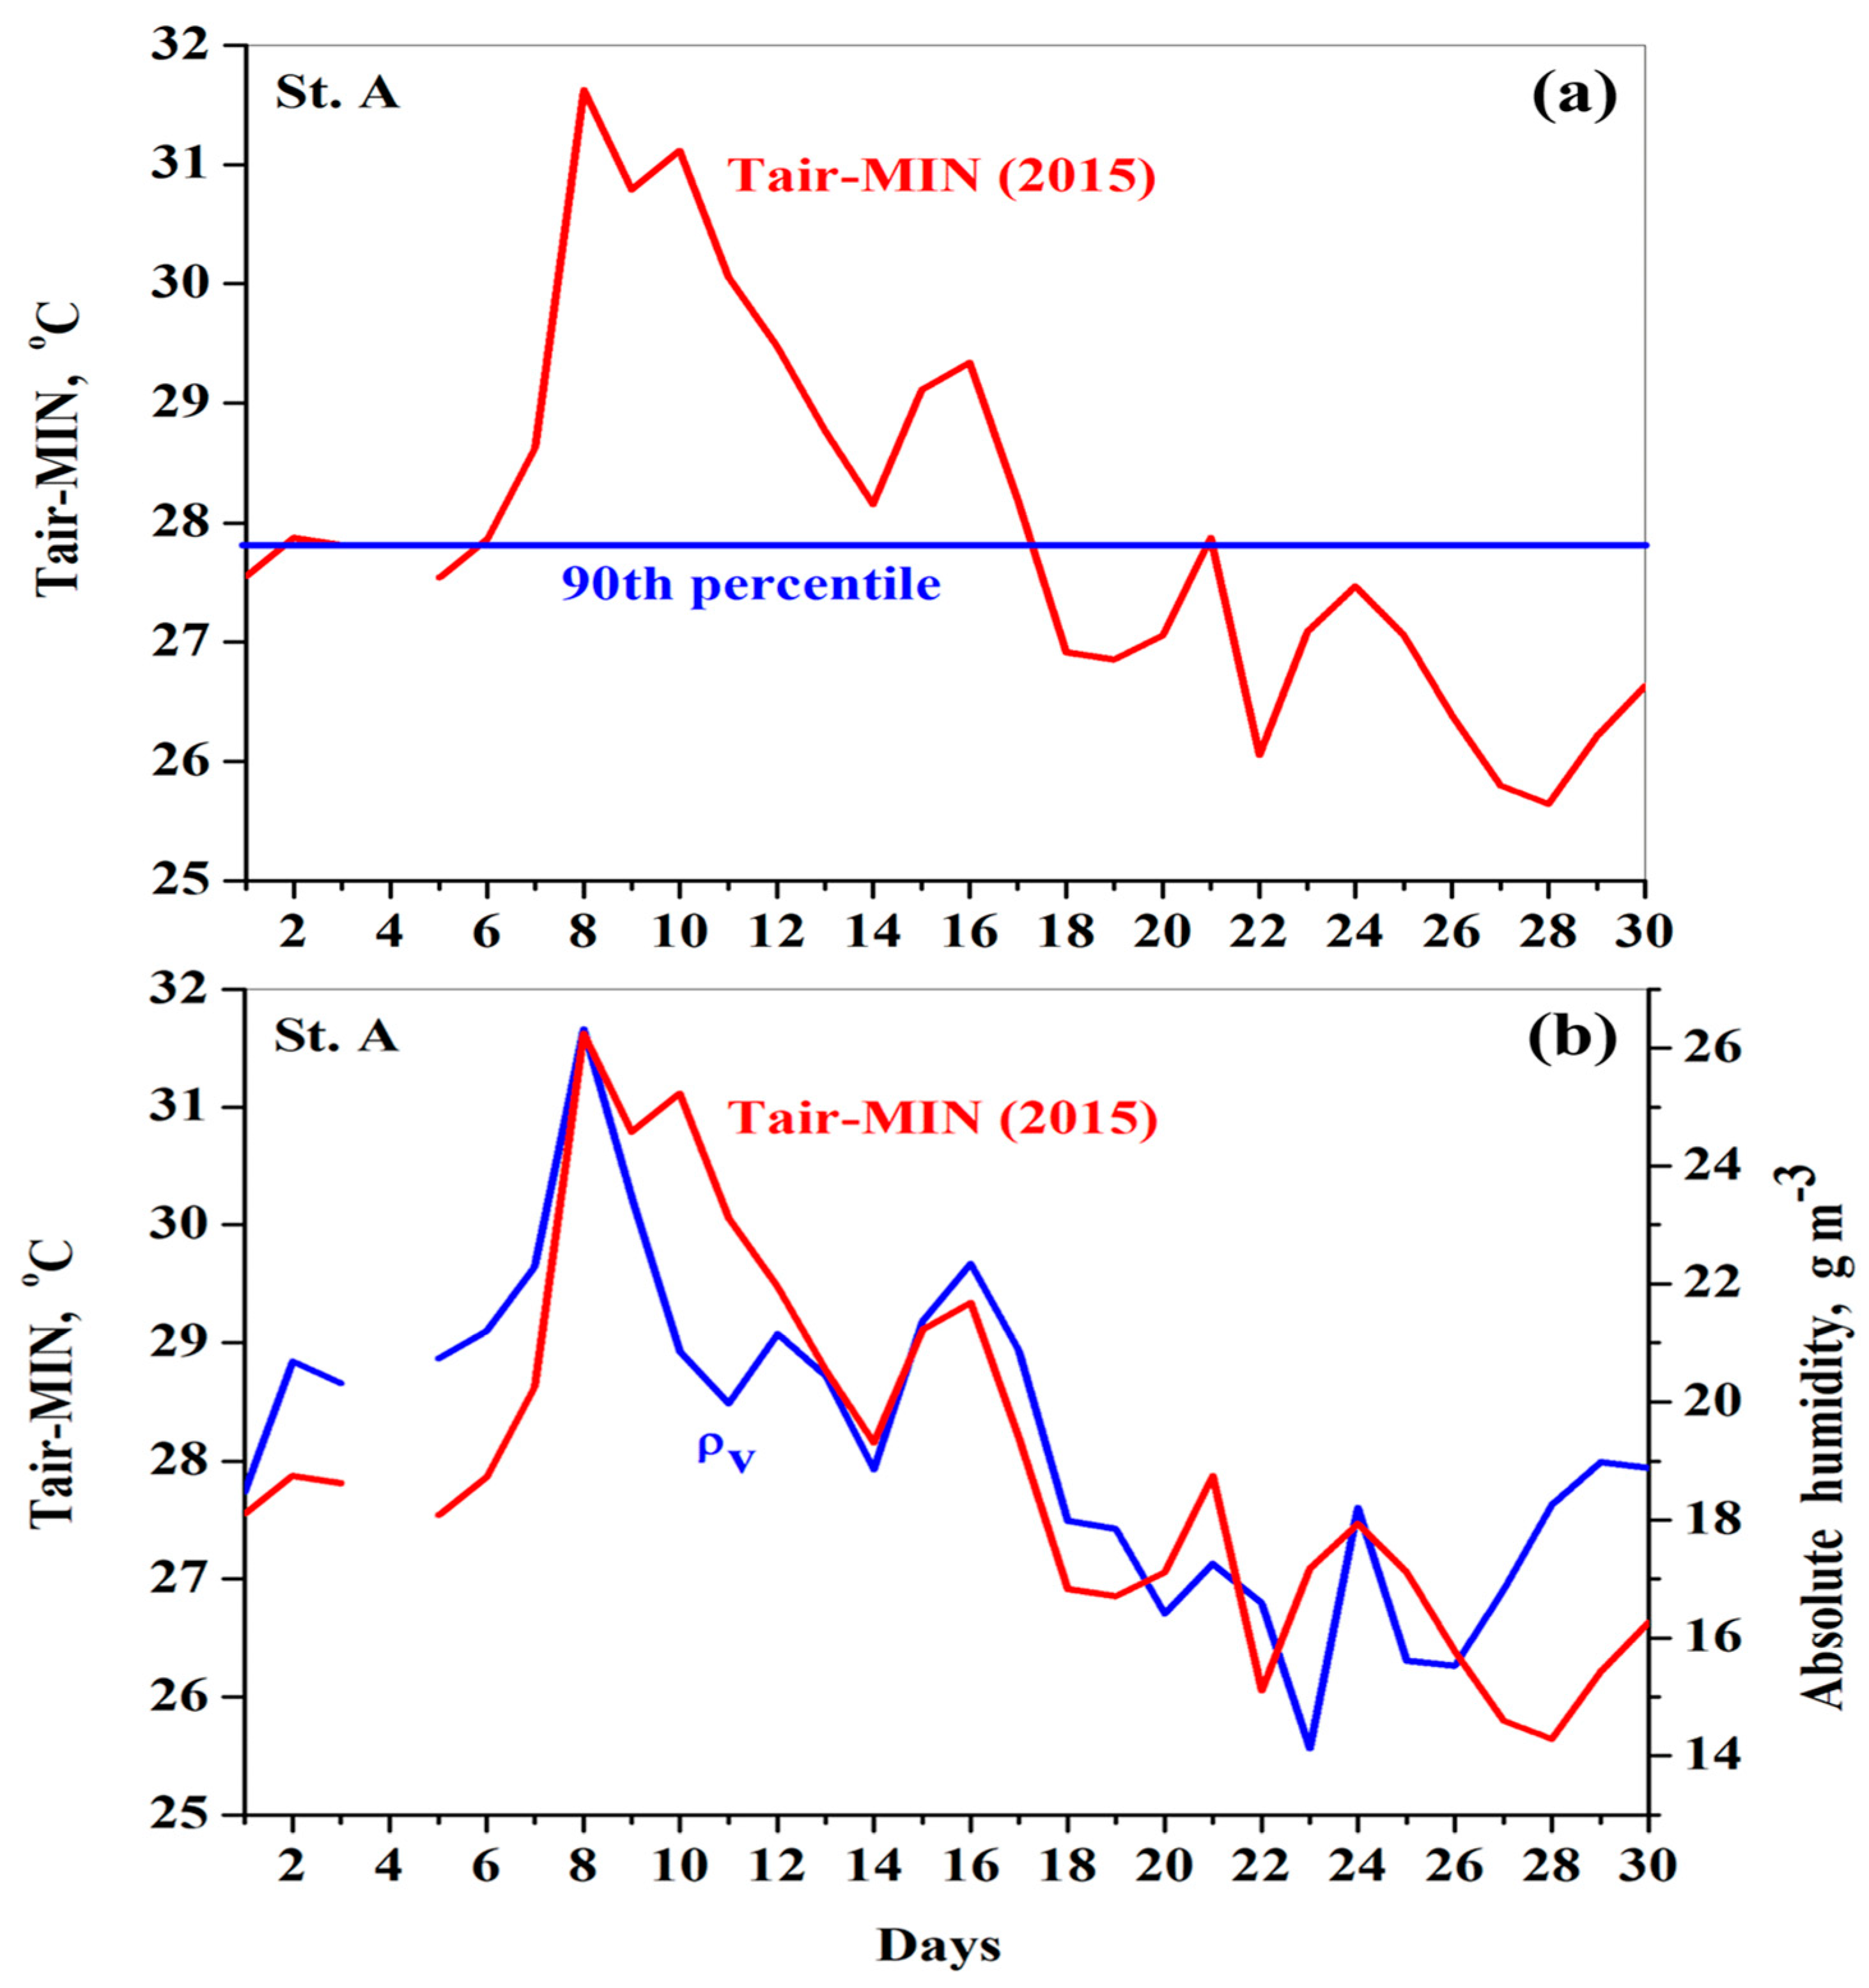
To investigate the presence of the AHW over the lake in the nighttime, we compared the day-to-day variations in the daily minimal air temperature (Tair-MIN) at St. A (observed in predawn hours) in September 2015 with the 90th percentile threshold for Tair-MIN (Figure 8a). We found a prolonged period of abnormally warm Tair-MIN compared to the 90th percentile threshold for Tair-MIN lasting for 10 days (7–17 September 2015). The maximal intensity of this AHW in the nighttime was observed on 8 September 2015, when Tair-MIN exceeded the 90th percentile threshold for Tair-MIN by 4 °C (Figure 8a). Note that the peak in Tair-MIN on that day (8 September) was observed in the presence of the maximal AOD and PM10 (Figure 2 and Figure 3).
Similar analyses of Tair-MIN at three land meteorological stations B, C, and D (located ~15 km from the lake in different directions) also showed the presence of an AHW in September 2015, which was characterized by an abnormally high Tair-MIN. The intensity of the AHW over each of the land stations was stronger than that over St. A for the lake: Tair-MIN exceeded (by up to 5 °C) the 90th percentile threshold for Tair-MIN (compared to only 4 °C at St. A) (Figure A2). Similar to the Tair-MIN peak over St. A for the lake, narrow peaks in the Tair-MIN over the land meteorological stations were observed on 8 September 2015, in the presence of maximal dust pollution. However, over the land, this peak was followed by a sharp decrease in the Tair-MIN at stations B and D.
A high correlation (r = 0.8 ± 0.1) was found between the day-to-day variations in Tair-MIN and absolute atmospheric humidity (ρv) measured at the same time (Figure 8b). This is because, at nighttime, the water vapor absorbed most of both the upwelling and downwelling longwave thermal radiation (4.5–42 µm) and, consequently, heated the atmosphere: the larger the water vapor amount, the higher the Tair-MIN (see Section 4).

3.4. Lake Heatwave

Regarding the presence of the AHW over Lake Kinneret in September 2015, one could expect the presence of a lake heatwave (LHW), which is defined as a prolonged period of abnormally high SWT measured in the 10–20 µm lake surface layer. To investigate such an LHW, we analyzed the day-to-day variations in the SWT in September 2015 using both in-situ radiometer SWT measurements (at St. A on the lake) and satellite-based (METEOSAT and MODIS-Terra) SWT retrievals.

3.4.1. In Situ SWT

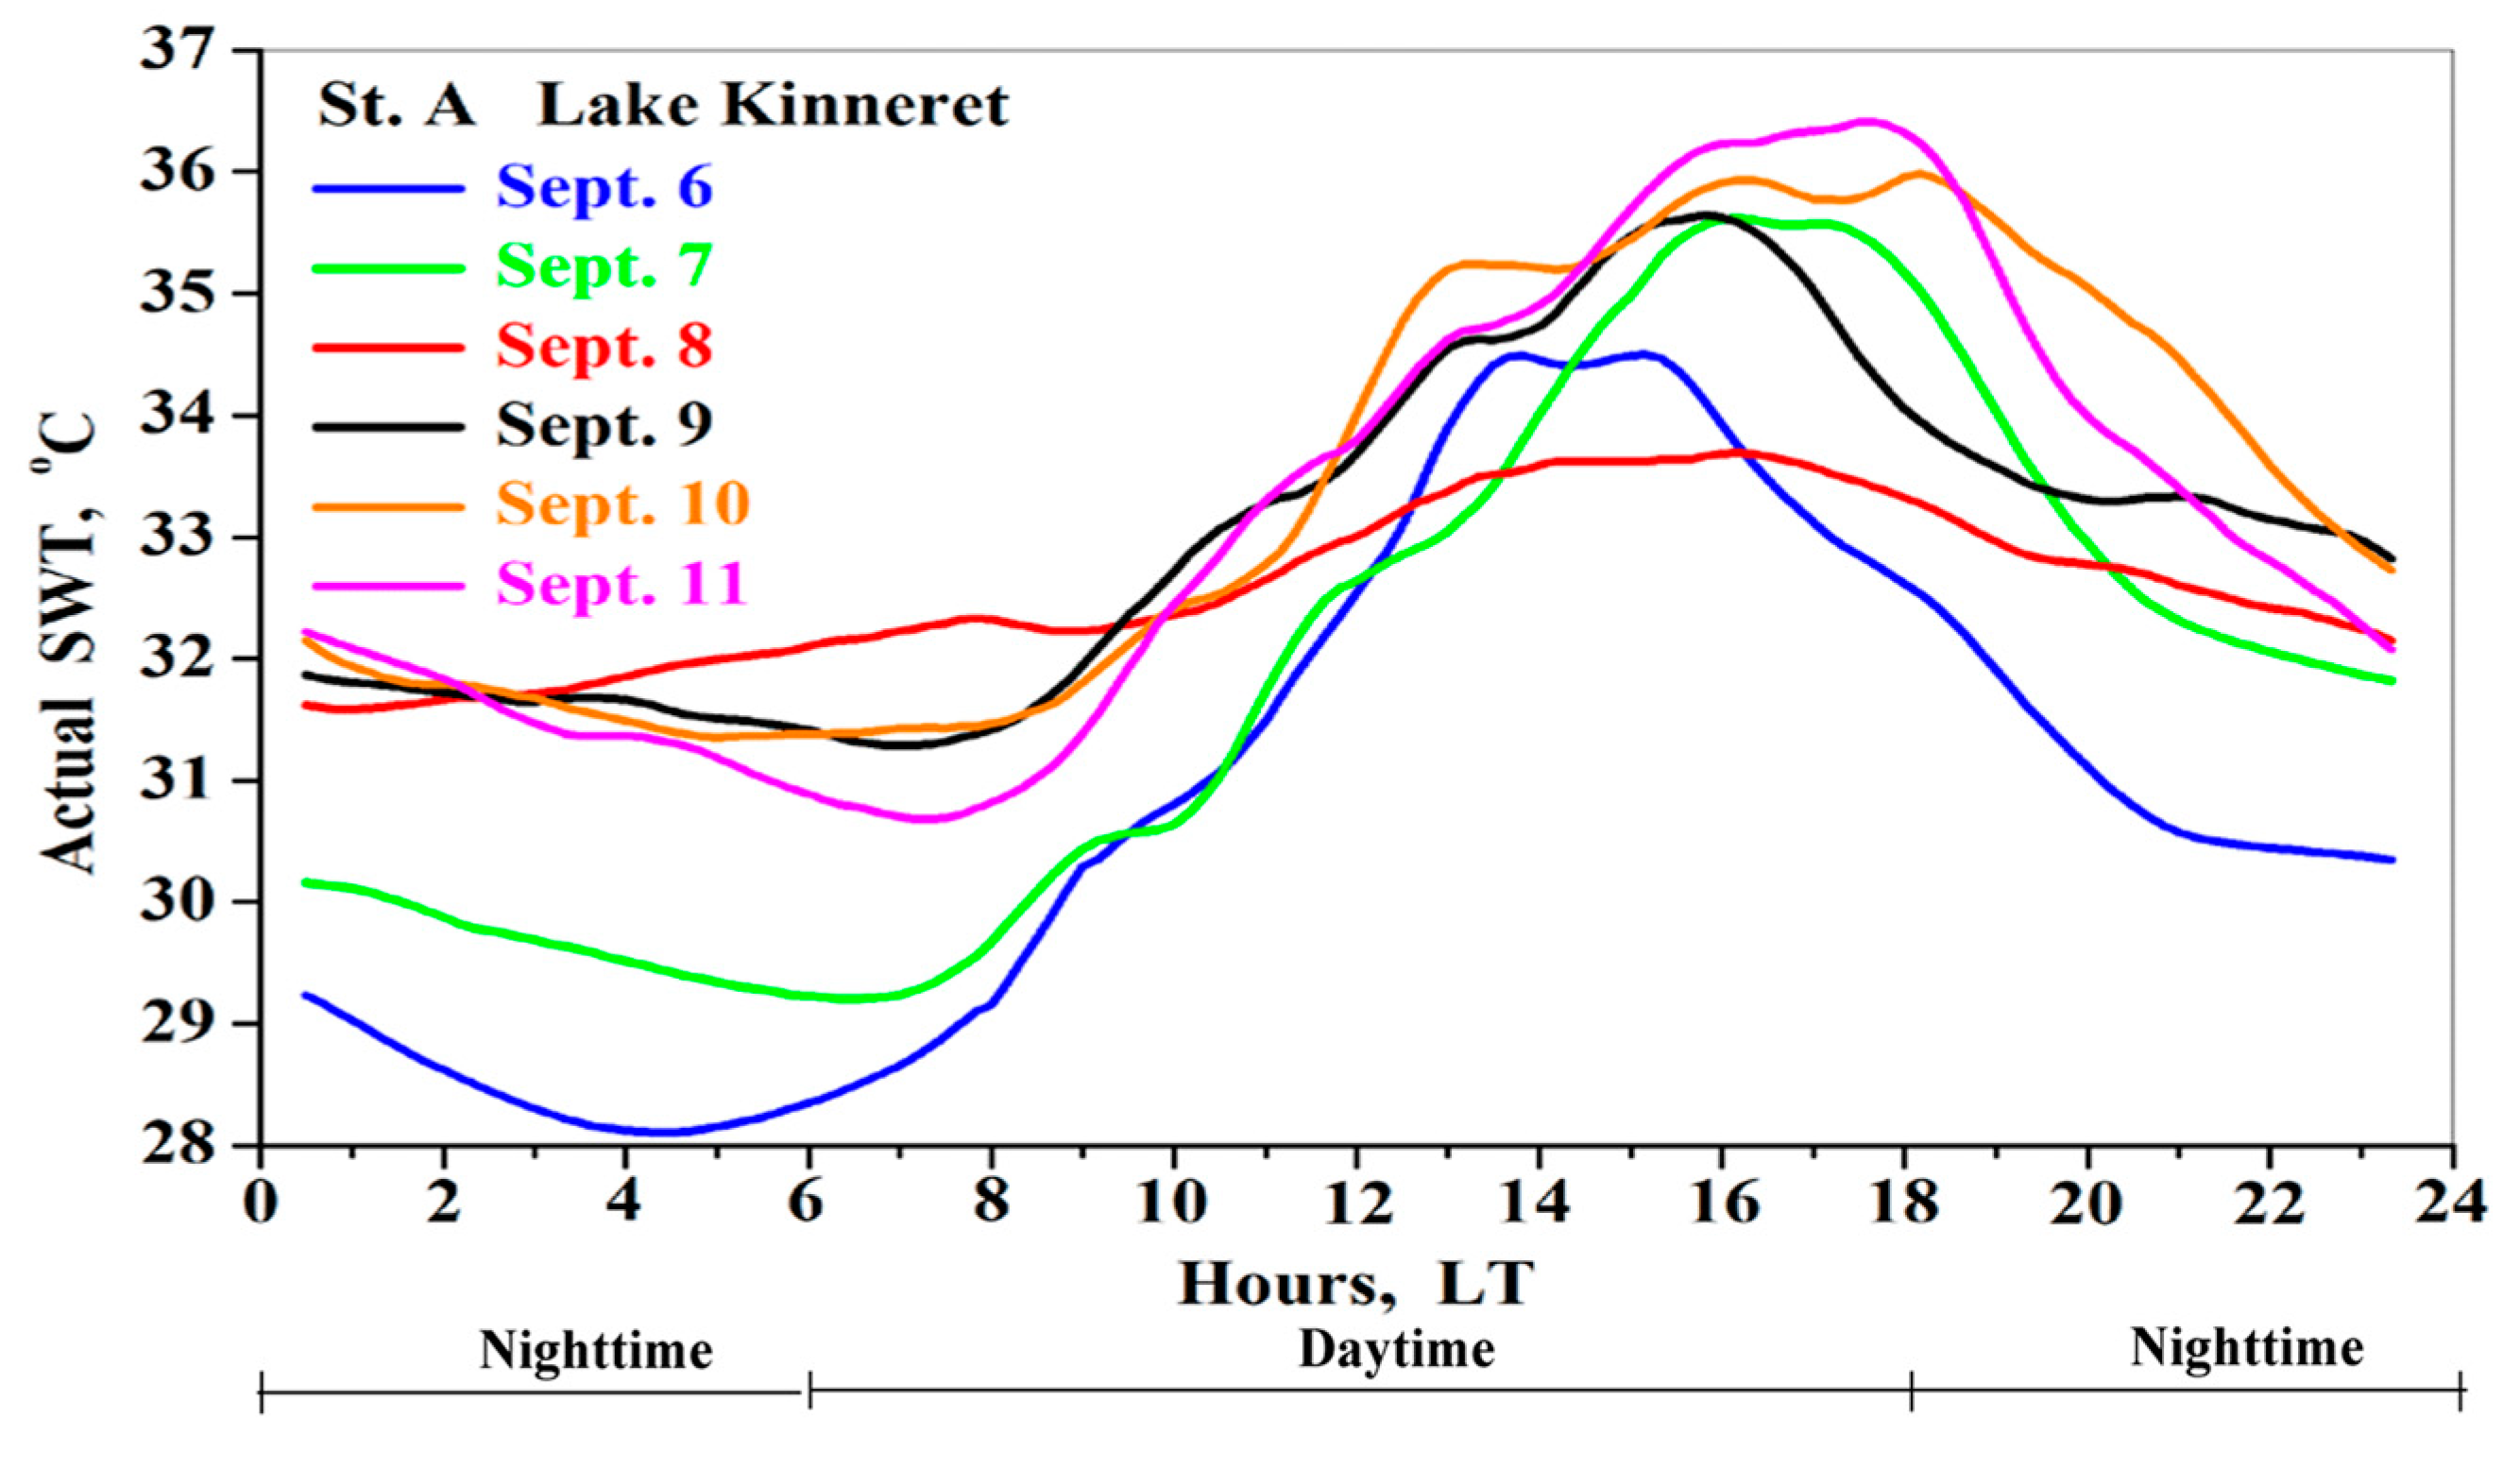
In-situ radiometer measurements of upwelling longwave radiation (ULWR) at St. A were used to estimate the diurnal variations in the actual SWT in the lake skin layer, in accordance with Formula (1). To illustrate, diurnal variations in the in-situ SWT are presented in Figure 9 for both a clear-sky day (6 September) and five dusty days (7–11 September 2015). One can see that on all dusty days, the nighttime SWT was higher by up to 4 °C than the SWT on the clear-sky day, 6 September 2015. This was because large amounts of water vapor absorbed most of both the upwelling and downwelling longwave thermal radiation (4.5–42 µm), heating the near-ground atmospheric layer and the lake water surface (which are in direct contact) (see Section 4).
It is worth noting that in the nighttime on the clear-sky day 6 September and on all dusty days except 8 September 2015, the SWT decreased until sunrise (Figure 9). This is a normal process of surface water cooling via upwelling longwave radiation. However, on 8 September, unexpectedly, a gradual increase in nighttime SWT was observed (Figure 9). This SWT increase was accompanied by a gradual increase in the measured PM10 concentration, indicating an increase in the dust intrusion (Figure 2). The dust pollution emitted downwelling longwave radiation (DLWR), contributing to surface water heating of the lake: DLWR-MIN even peaked on that day (8 September) (Figure 5c). On the following dusty days, when the PM10 concentration decreased, a delay in the time of the daily minimum SWT was observed compared to the time of the daily minimum SWT on clear-sky 6 September 2015 (Figure 9). The delay could be explained by the increased DLWR in the nighttime due to the dust intrusion. Moreover, in the daytime on 8 September (when the SR dramatically dropped to ~200 W/m2 (Figure 4)), flattening was observed in the diurnal cycle of the SWT (Figure 9). As a result of this flattening, the daily temperature range (i.e., the temperature difference between SWT-MAX (33.7 °C) and SWT-MIN (31.6 °C)) was essentially lower (2.1 °C) on 8 September than that on clear-sky 6 September 2015 (6.4 °C). The above three phenomena (the nighttime increase in the SWT; the delay in the nighttime minimum SWT; the flattening in the diurnal cycle of the SWT) are characteristic features of the impact of an extreme dust intrusion on Lake Kinneret’s SWT. These characteristic features were not discussed in previous publications.
In the daytime, the impact of the dust intrusion on the SWT was determined by the interaction among the following three factors: (a) shortwave dust radiative effect, contributing to cooling in the near-ground atmospheric layer and in the lake water surface; (b) settling dust particles; and (c) upwelling and downwelling longwave radiation absorbed by water vapor. The latter two factors contributed to heating of the near-ground atmospheric layer (which is in contact with the lake water surface) (see Section 4). On 8 September 2015, in the presence of maximal dust pollution, the SWT decreased by 1 °C. This indicates that on that day, the dust radiative effect dominated surface water heating. On 7, 9, and 10 September, SWT exceeded SWT on clear-sky 6 September 2015. This indicates that, on those days, surface water heating dominated the cooling by the dust radiative effect (Figure 9). Therefore, in the daytime, in the presence of dust pollution, both shortwave solar radiation and longwave thermal radiation influenced the SWT in the lake. The above-mentioned results are in line with the findings by Kishcha et al. [22] based on in-situ measurements of water temperature at a depth of 20 cm.
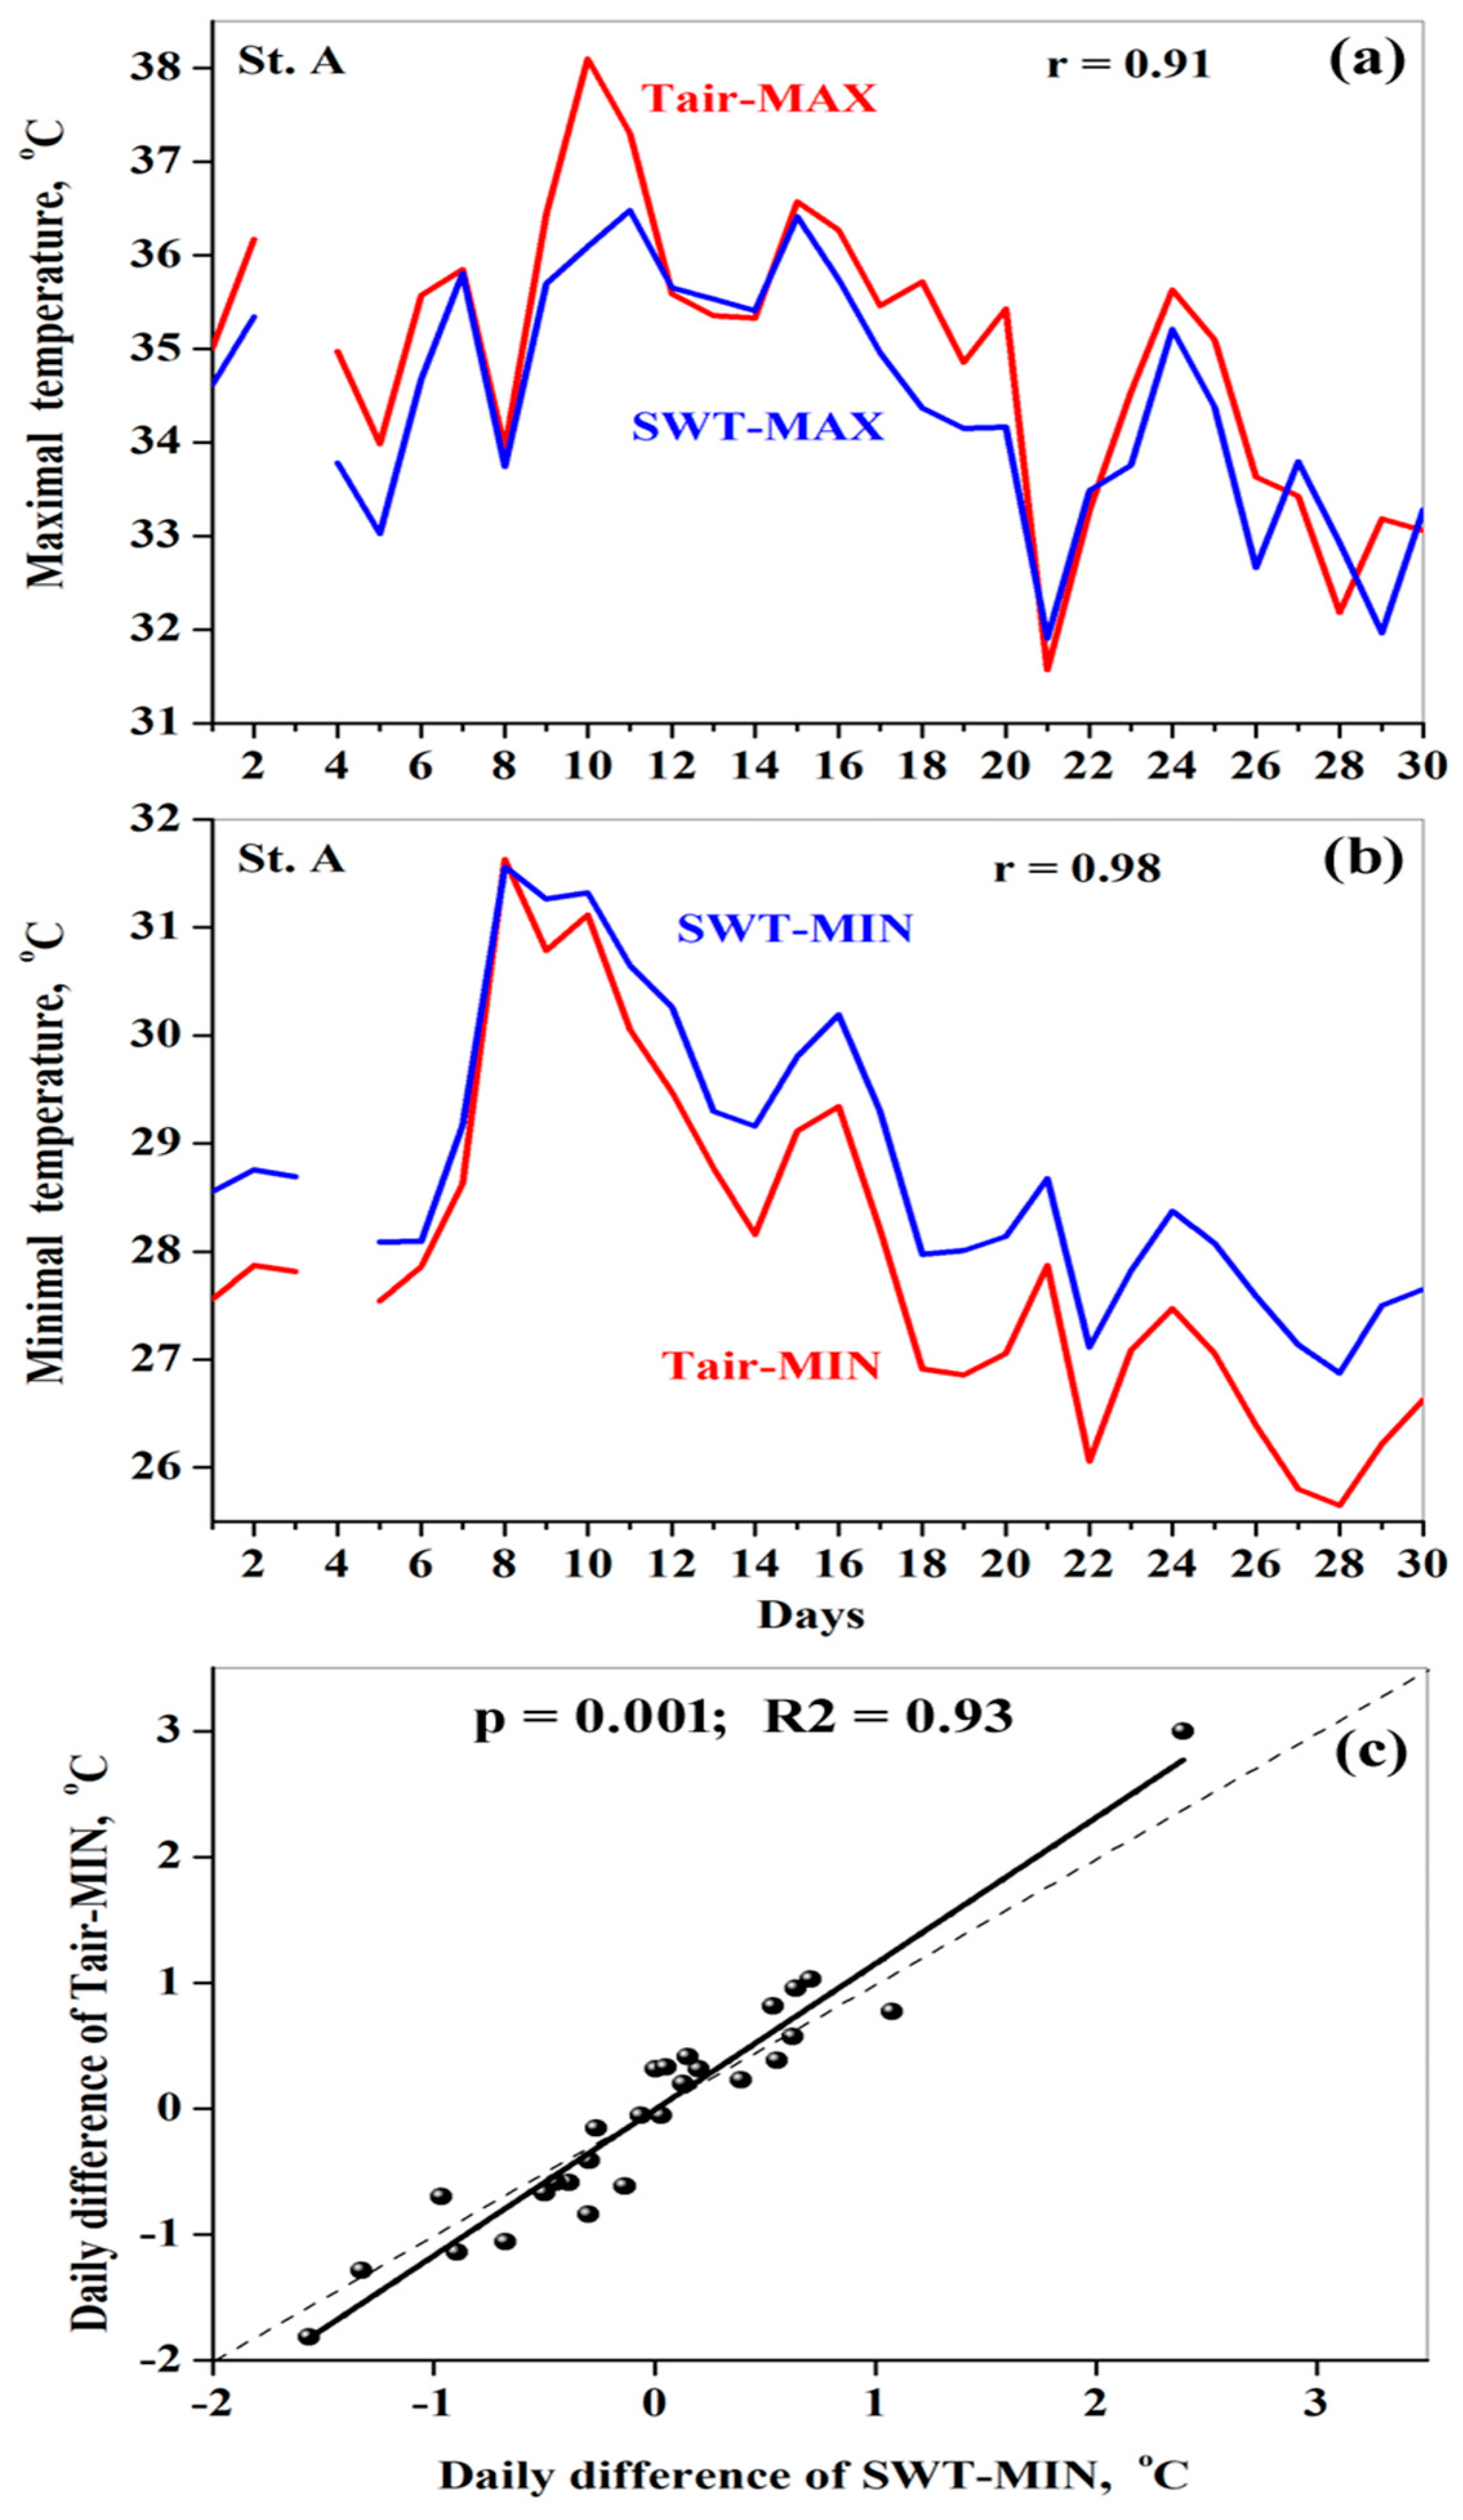
We examined the day-to-day variations in the daily maximal SWT (SWT-MAX) and minimal SWT (SWT-MIN) in September 2015. Our comparison between the day-to-day variations in the daily maximal Tair (Tair-MAX) and those of the SWT-MAX showed that they were highly correlated (correlation coefficient r = 0.91 ±   0.04 ) and almost coincided with each other (Figure 10a). It is worth adding that the Tair-MAX and SWT-MAX simultaneously decreased on 8 September 2015 (Figure 10a). This decrease was caused by the dramatic drop in the surface solar radiation on that day due to the dust radiative effect in the presence of maximal dust pollution (Figure 4).
Furthermore, the day-to-day variations in the daily minimal Tair (Tair-MIN) and those of the SWT-MIN were also highly correlated (r = 0.98 ±   0.03 ) (Figure 10b). We compared the uncertainty of the meteorological temperature measurements with the uncertainty of the SWT values (based on in-situ radiometer measurements of the ULWR). This was carried out by comparing the daily temperature difference in the Tair-MIN for every pair of consecutive days in September 2015 with the daily temperature difference in the SWT-MIN for every pair of consecutive days. We used these daily temperature differences because they were free from any systematic biases. The scatterplot between these daily temperature differences in the Tair-MIN and those in the SWT-MIN showed that all points are located along a linear fit (Figure 10c). The obtained p values (p = 0.001) and coefficient of determination (R2 = 0.93) showed that the regression line accurately approximated the actual spread of the points at the 95% confidence level. Moreover, this linear fit is located in close vicinity to the bisector (Figure 10c), indicating a high correspondence between the daily temperature differences in the Tair-MIN and those in the SWT-MIN. This is evidence that the SWT values (based on the in-situ radiometer measurements of the ULWR) were quite accurate: their uncertainty was comparable with the uncertainty of the meteorological temperature measurements, at 0.1 degrees. If the uncertainty of the SWT values were larger than the uncertainty of the Tair, this would lead to a greater spread of points in the scatterplot.
One can see that the day-to-day variations in the SWT-MIN were slightly higher than those of the Tair-MIN, whereas the day-to-day variations in the SWT-MAX were slightly lower than those of the Tair-MAX (Figure 10a,b). We would like to emphasize that the above-mentioned good correspondence between the Tair and in-situ SWT was obtained despite the fact that the Tair and SWT were measured by instruments with different accuracies, such as the standard meteorological equipment and in-situ radiometer at St. A on the lake. This finding has important methodological significance: in the absence of in-situ measurements of the actual SWT (based on radiometer measurements), day-to-day variations in Tair-MAX and Tair-MIN can be used as proxies for day-to-day variations in SWT-MAX and SWT-MIN.
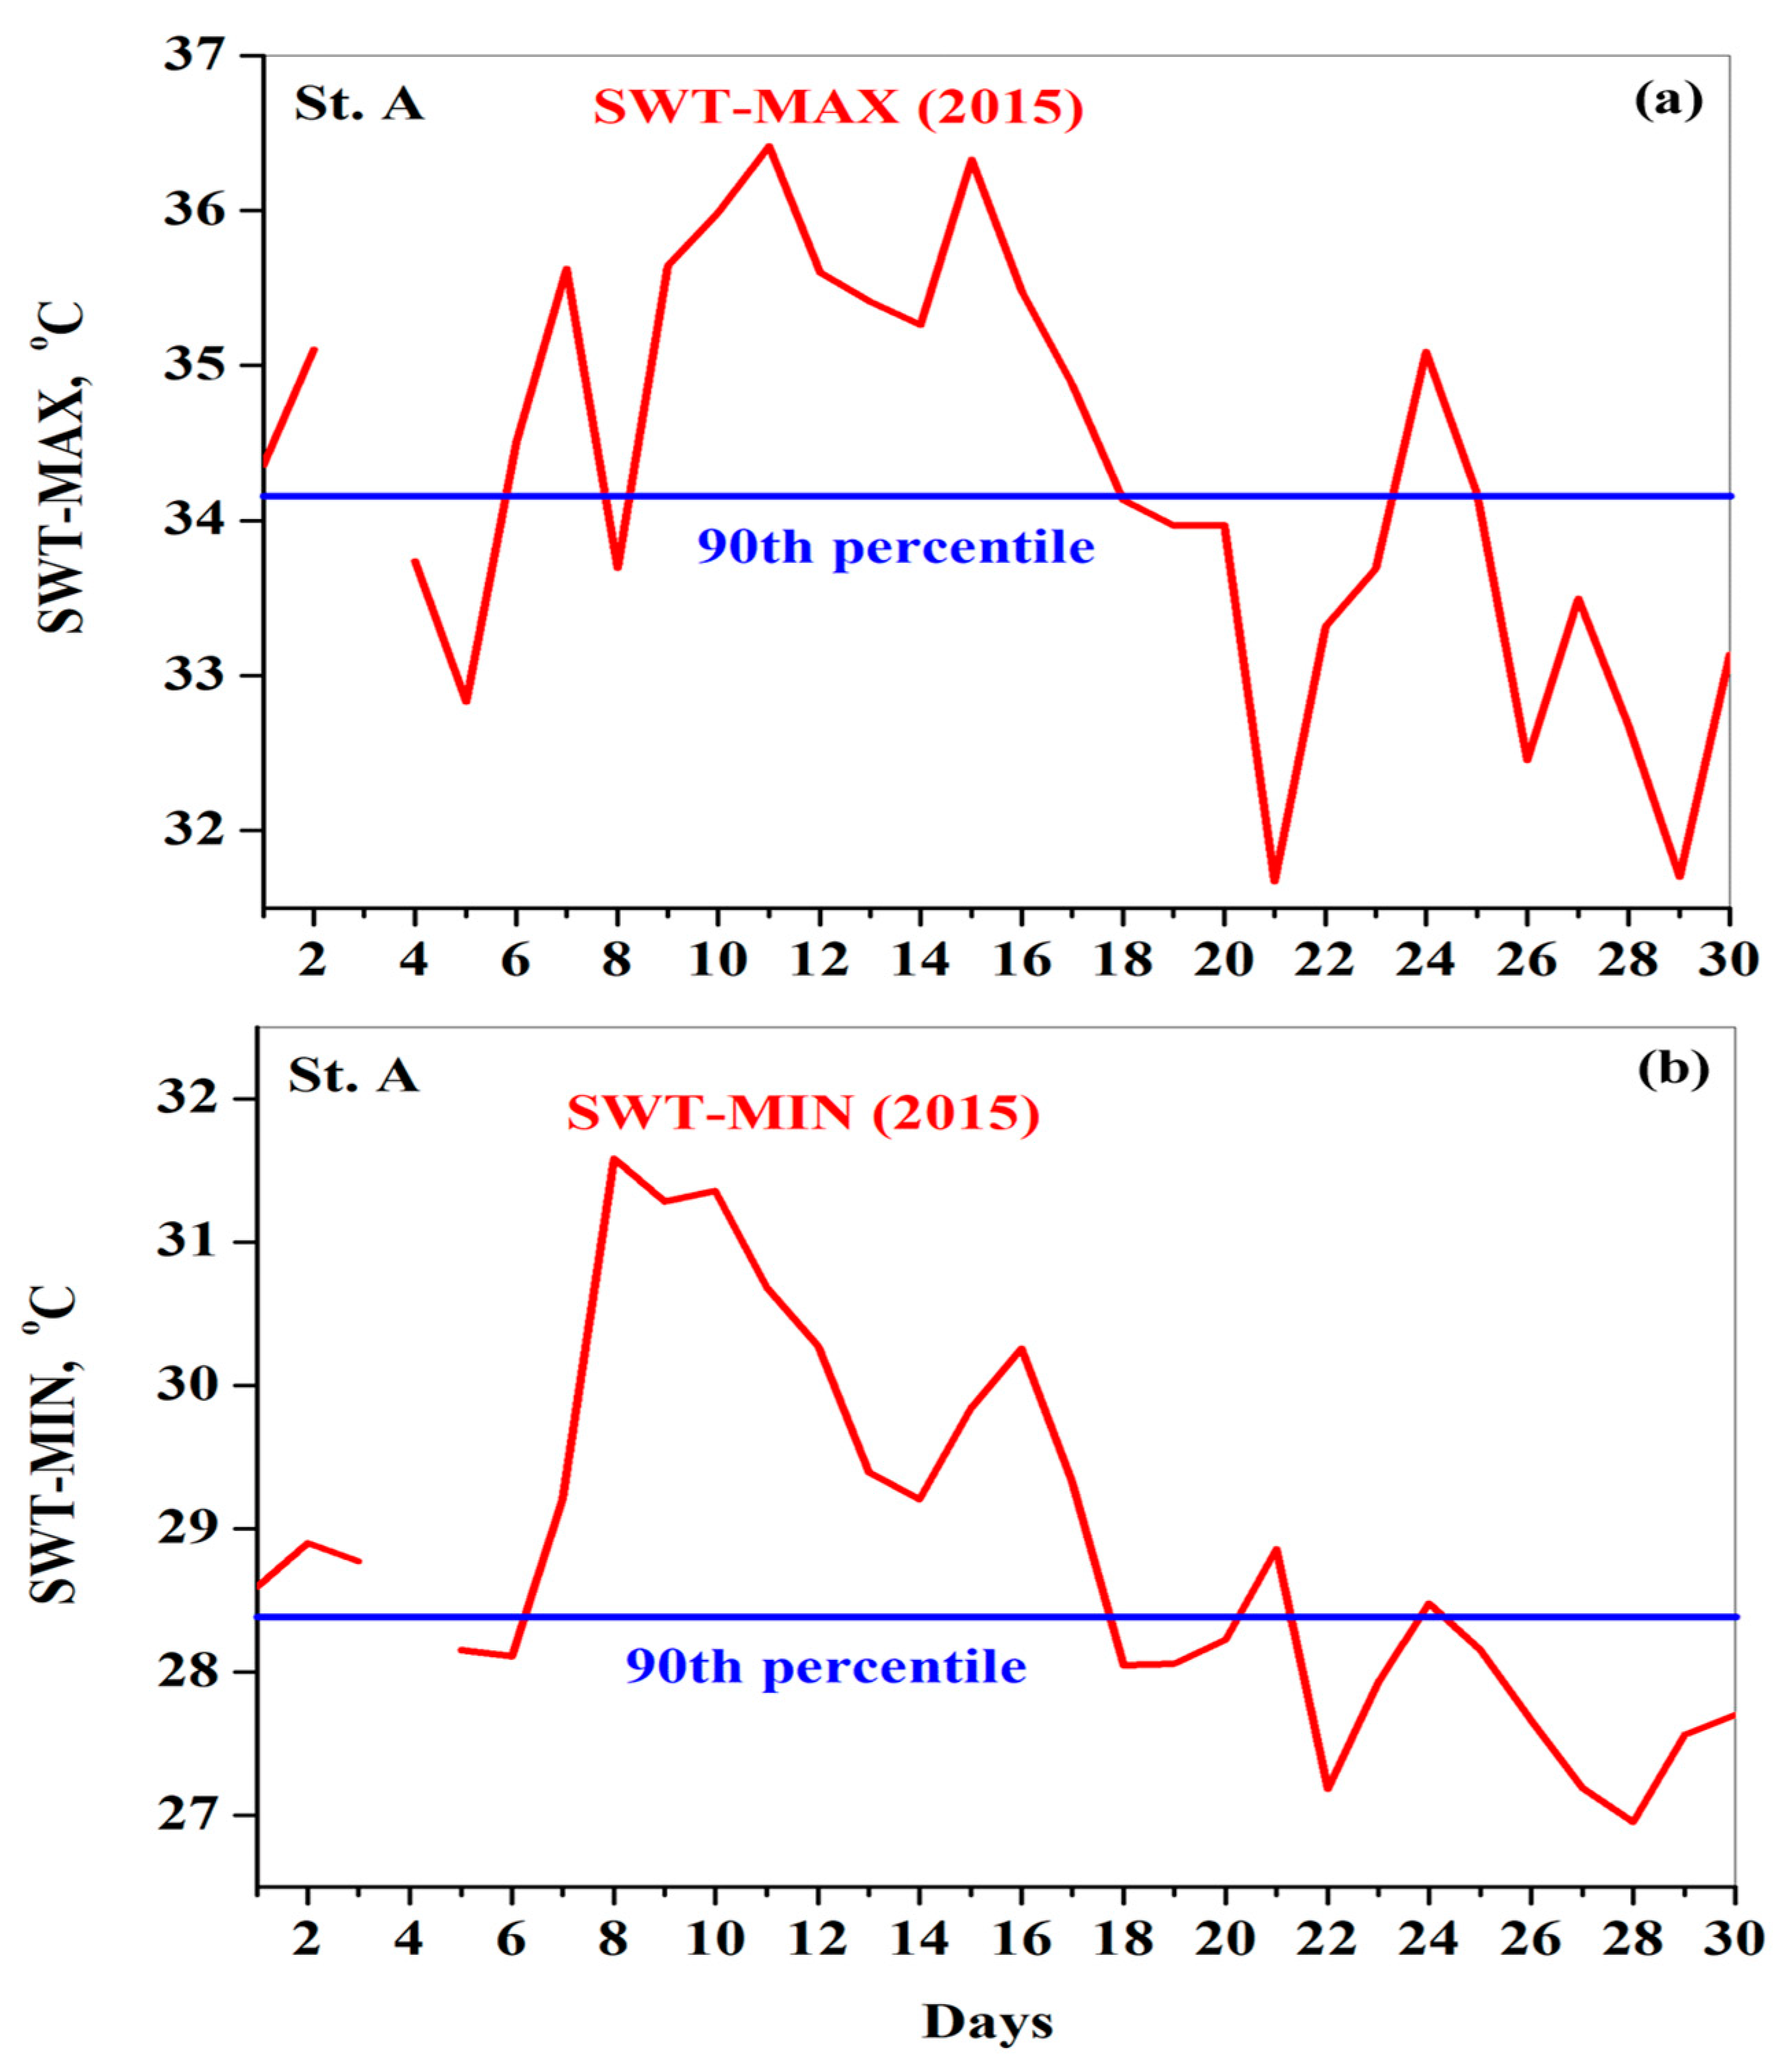
To estimate the duration and intensity of the lake heatwave (LHW) in the daytime, we compared the day-to-day variations in the daily maximal SWT (SWT-MAX) at St. A (observed between 13LT and 18LT) in the dusty September 2015 with the 90th percentile threshold for SWT-MAX (Figure 11a). It was found that, similar to the AHW, the LHW over Lake Kinneret lasted 11 days (7–18 September 2015). During the above-mentioned period, SWT-MAX was higher than the 90th percentile threshold, except for on 8 September 2015. The maximal intensity of the LHW in the daytime, characterized by the peak in SWT-MAX, was observed on 11 September 2015, when SWT-MAX exceeded (by up to 2 °C) the 90th percentile threshold for the SWT-MAX in September (Figure 11a).
To investigate the presence of an LHW for the lake in the nighttime, we compared the day-to-day variations in the daily minimal SWT (SWT-MIN) at St. A (observed in pre-dawn hours) in September 2015 with the 90th percentile threshold for the SWT-MIN. We found a prolonged period of abnormally high SWT-MIN, which lasted 11 days (7–18 September 2015) (Figure 11b). This period was characterized by a peak in SWT-MIN on 8 September, followed by a gradual decrease in the SWT-MIN. This peak in SWT-MIN on 8 September (when SWT-MIN exceeded the 90th percentile threshold by up to 3 °C) represents the maximal intensity of the nighttime LHW (Figure 11b). During the dust intrusion, the observed abnormally high SWT-MIN, accompanied by the abnormally high Tair-MIN, could be explained by the nighttime processes, when large amounts of water vapor absorbed most of both the upwelling and downwelling longwave thermal radiation (4.5–42 µm), heating the near-ground atmospheric layer (which is in contact with the lake water surface) (Section 4).

3.4.2. Satellite-Based SWT

As mentioned, in addition to the in-situ radiometer measurements of SWT, we used satellite-based SWT retrievals to investigate the LHW caused by the dust intrusion under study. To this end, SWT retrievals were used from both geostationary (METEOSAT) and orbital (MODIS-Terra) satellites. On 8 September 2015, when solar radiation reached its minimum of ~200 W m−2 in the presence of extreme dust pollution, satellite SWT retrievals were unavailable from either METEOSAT or MODIS-Terra satellites. On other days in September 2015, however, SWT retrievals were available from both satellites. As mentioned, we focused on the Lake Kinneret water area (32.775°N–32.875°N; 35.575°E–35.625°E): this area consists of two METEOSAT pixels on a 0.05° × 0.05° grid that were not contaminated by land (Figure 1c).
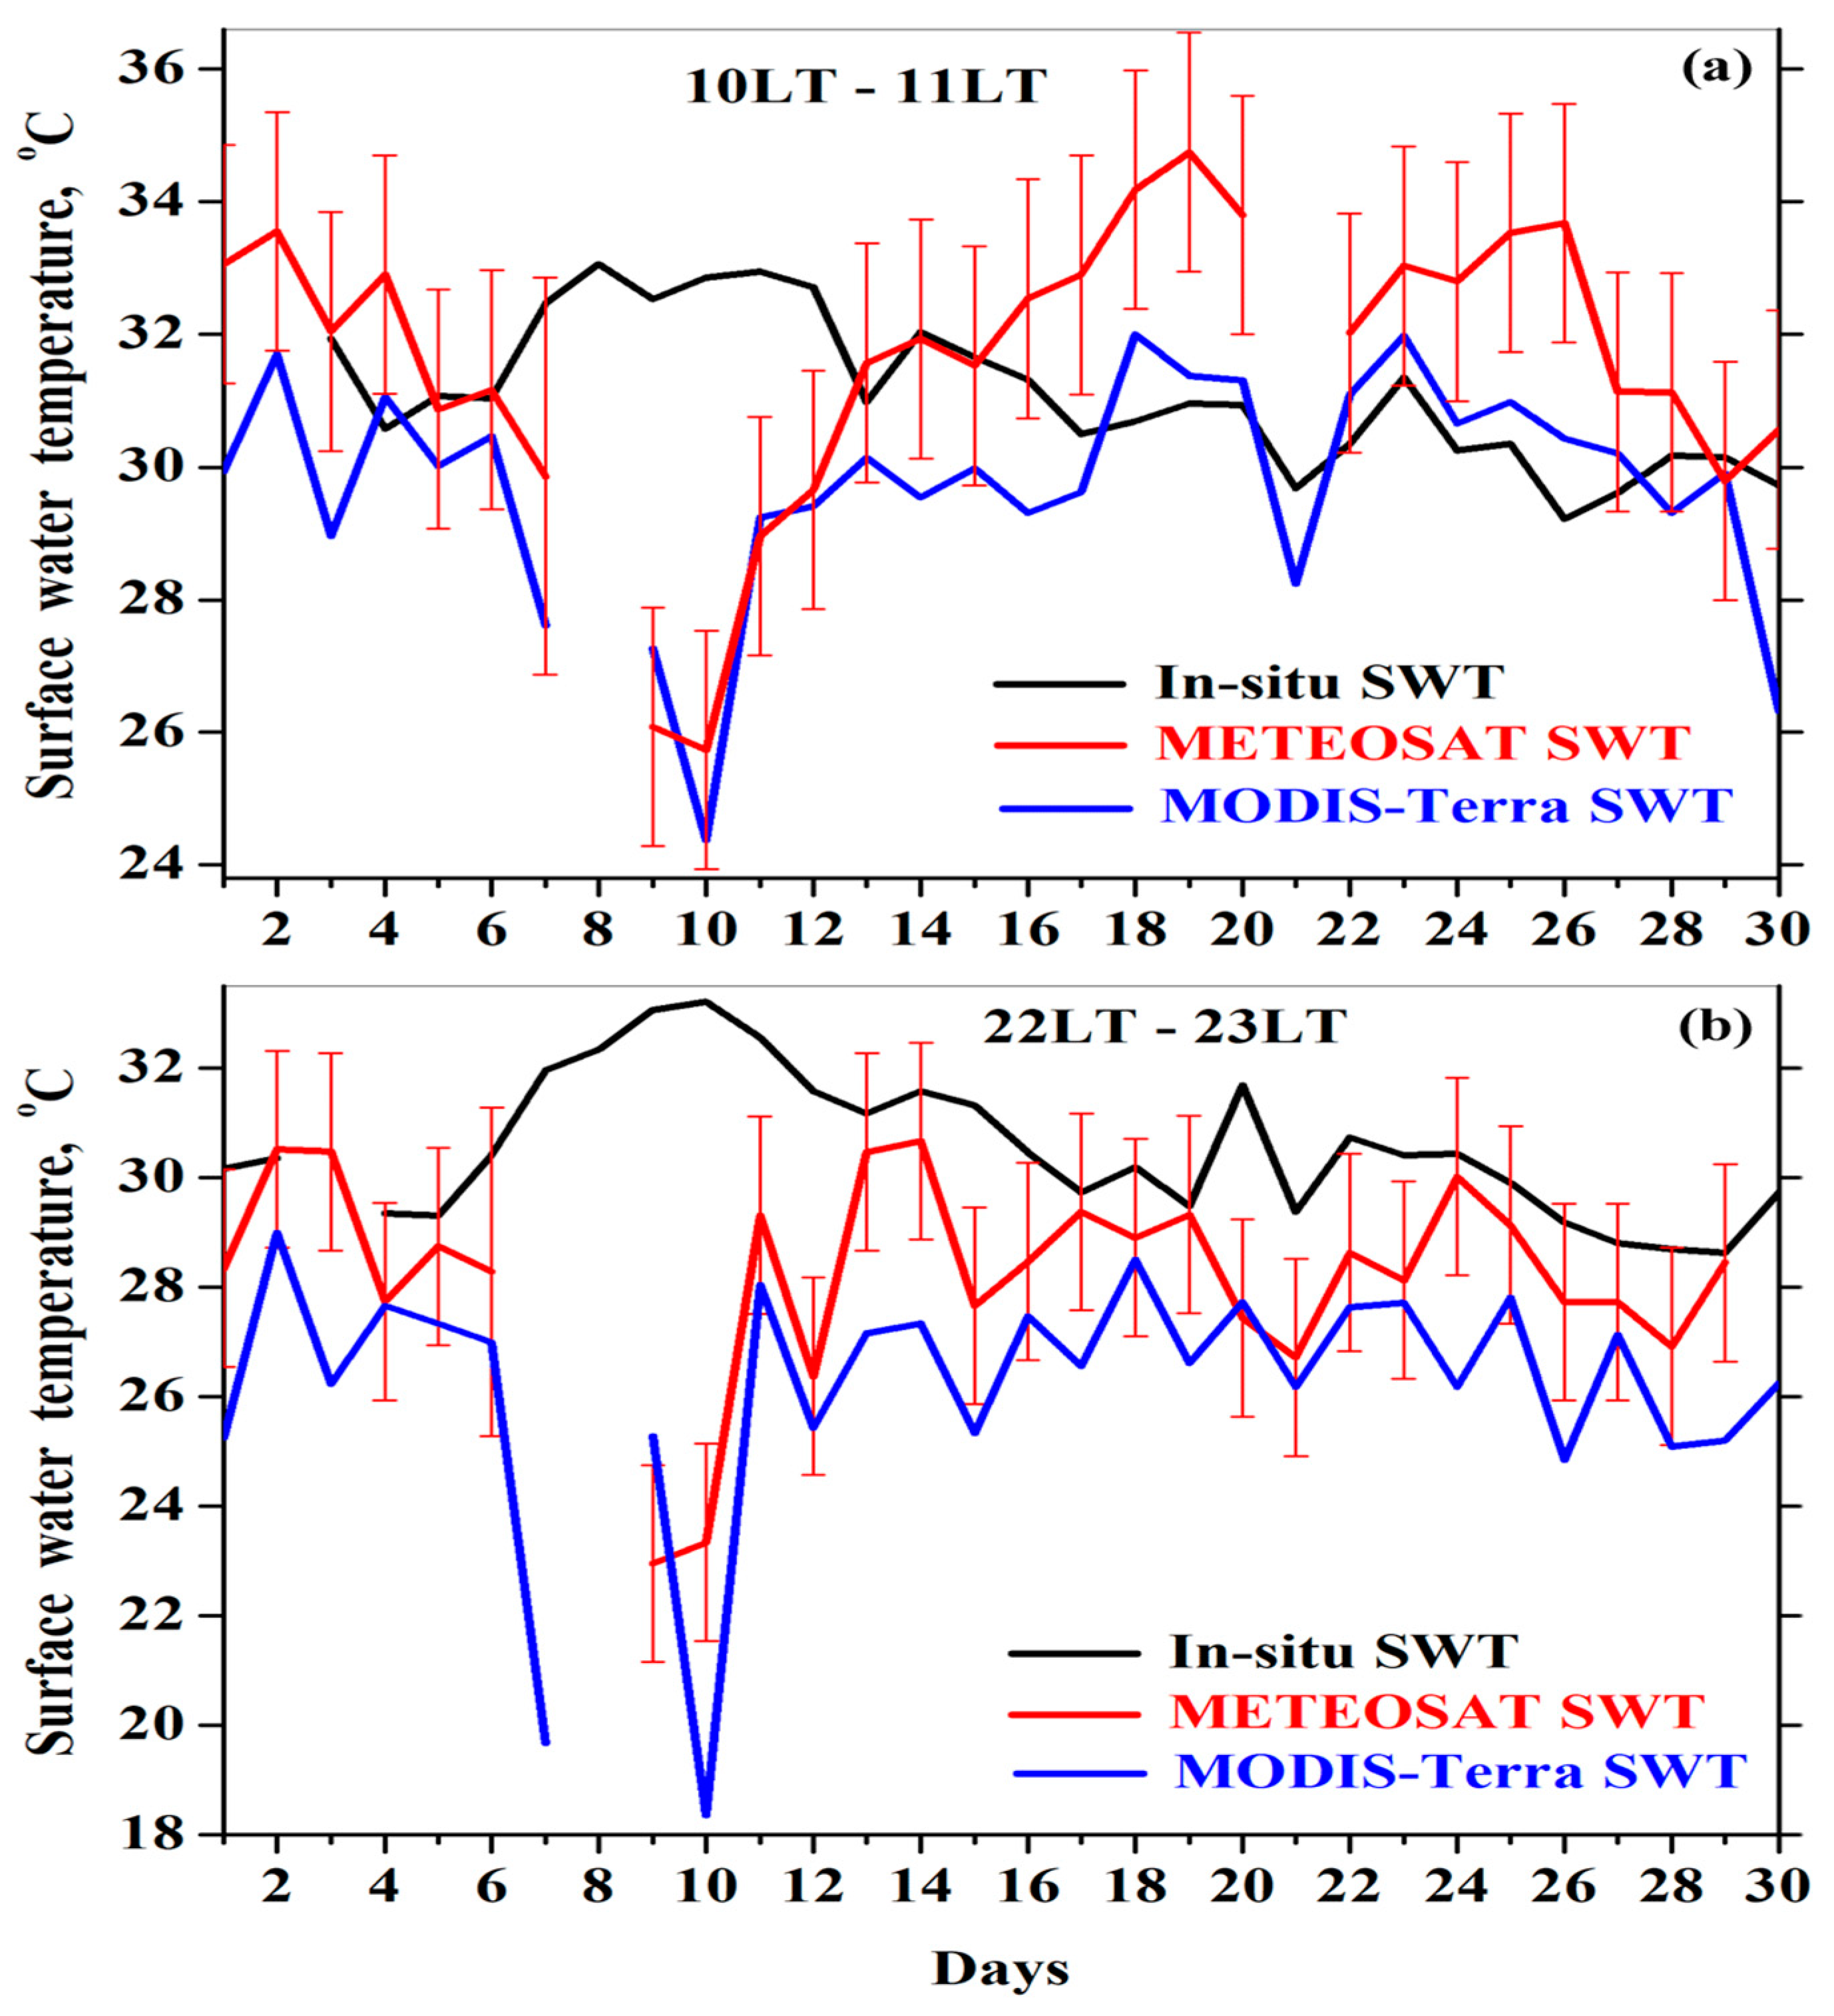
METEOSAT provided us with hourly SWT data (together with their uncertainty). As for the orbital MODIS-Terra satellite, it provided us with only two Lake Kinneret SWT retrievals per day: in the daytime (~10:30 LT) and in the nighttime (~22:30 LT). To investigate the impact of the dust intrusion on the satellite-based SWT in September 2015, two comparative analyses were conducted: 1) day-to-day variations in daytime satellite-based SWT (from MODIS-Terra and METEOSAT) were compared with the day-to-day variations in the in-situ SWT averaged from 10 LT to 11 LT, and 2) day-to-day variations in the nighttime satellite-based SWT (from MODIS-Terra and METEOSAT) were compared with the day-to-day variations in the in-situ SWT averaged from 22 to 23 LT (Figure 12a,b). We found that from 7 to 13 September 2015, in the presence of large amounts of dust, both METEOSAT and MODIS-Terra data showed a noticeable decrease in the satellite-based SWT along with increasing dust pollution, both in the daytime and in the nighttime (Figure 12a,b). This contrasted the day-to-day variations in the in-situ SWT, showing an increase in SWT along with increasing dust pollution. On 10 September 2015, the maximal SWT difference of up to 7 °C between the MODIS-Terra SWT and in-situ SWT was observed in the daytime (10LT–11LT) and of up to 11 °C in the nighttime (22LT–23LT) (Figure 12a,b). Similarly, on that day (10 September 2015), an SWT difference of up to 9 °C between METEOSAT SWT and in-situ SWT was observed in the daytime (10LT–11LT) and of up to 15 °C in the nighttime (22LT–23 LT) (Figure 12a,b). Given that in-situ radiometer measurements represent the actual SWT, our comparative analyses led us to the conclusion that from 8 to 11 September 2015 in the presence of significant dust intrusion, neither METEOSAT nor MODIS-Terra SWT retrievals could reproduce the day-to-day variations in the actual Lake Kinneret SWT. Such a significant underestimation of the actual SWT by satellite SWT retrievals in the presence of dust intrusion can be explained by the impact of dust-caused infrared (IR) perturbations on satellite IR measurements (see Section 4).
However, from 13 to 30 September 2015 in the presence of low dust pollution, our analyses showed no dramatic differences between the day-to-day variations in the in-situ SWT and satellite-based SWT observations: they were compatible with each other (Figure 12a,b).

3.5. Subsurface LHW

Both the in-situ and satellite radiometer measurements provided us with the SWT in the 10–20 µm water surface layer. Over a few centimeters below the surface, in the epilimnion layer of the lake, water temperature is commonly referred to as the bulk water temperature [40]. One can expect that due to water mixing in Lake Kinneret, the surface LHW contributed to the water heating in the layers below the surface, creating a subsurface LHW. In order to examine the presence of a subsurface LHW, we analyzed the day-to-day variations in the bulk water temperature in the upper epilimnion layer of the lake. This was carried out using the in-situ measurements of water temperature at a depth of 20 cm (WT-20 cm) at St. A on the lake.
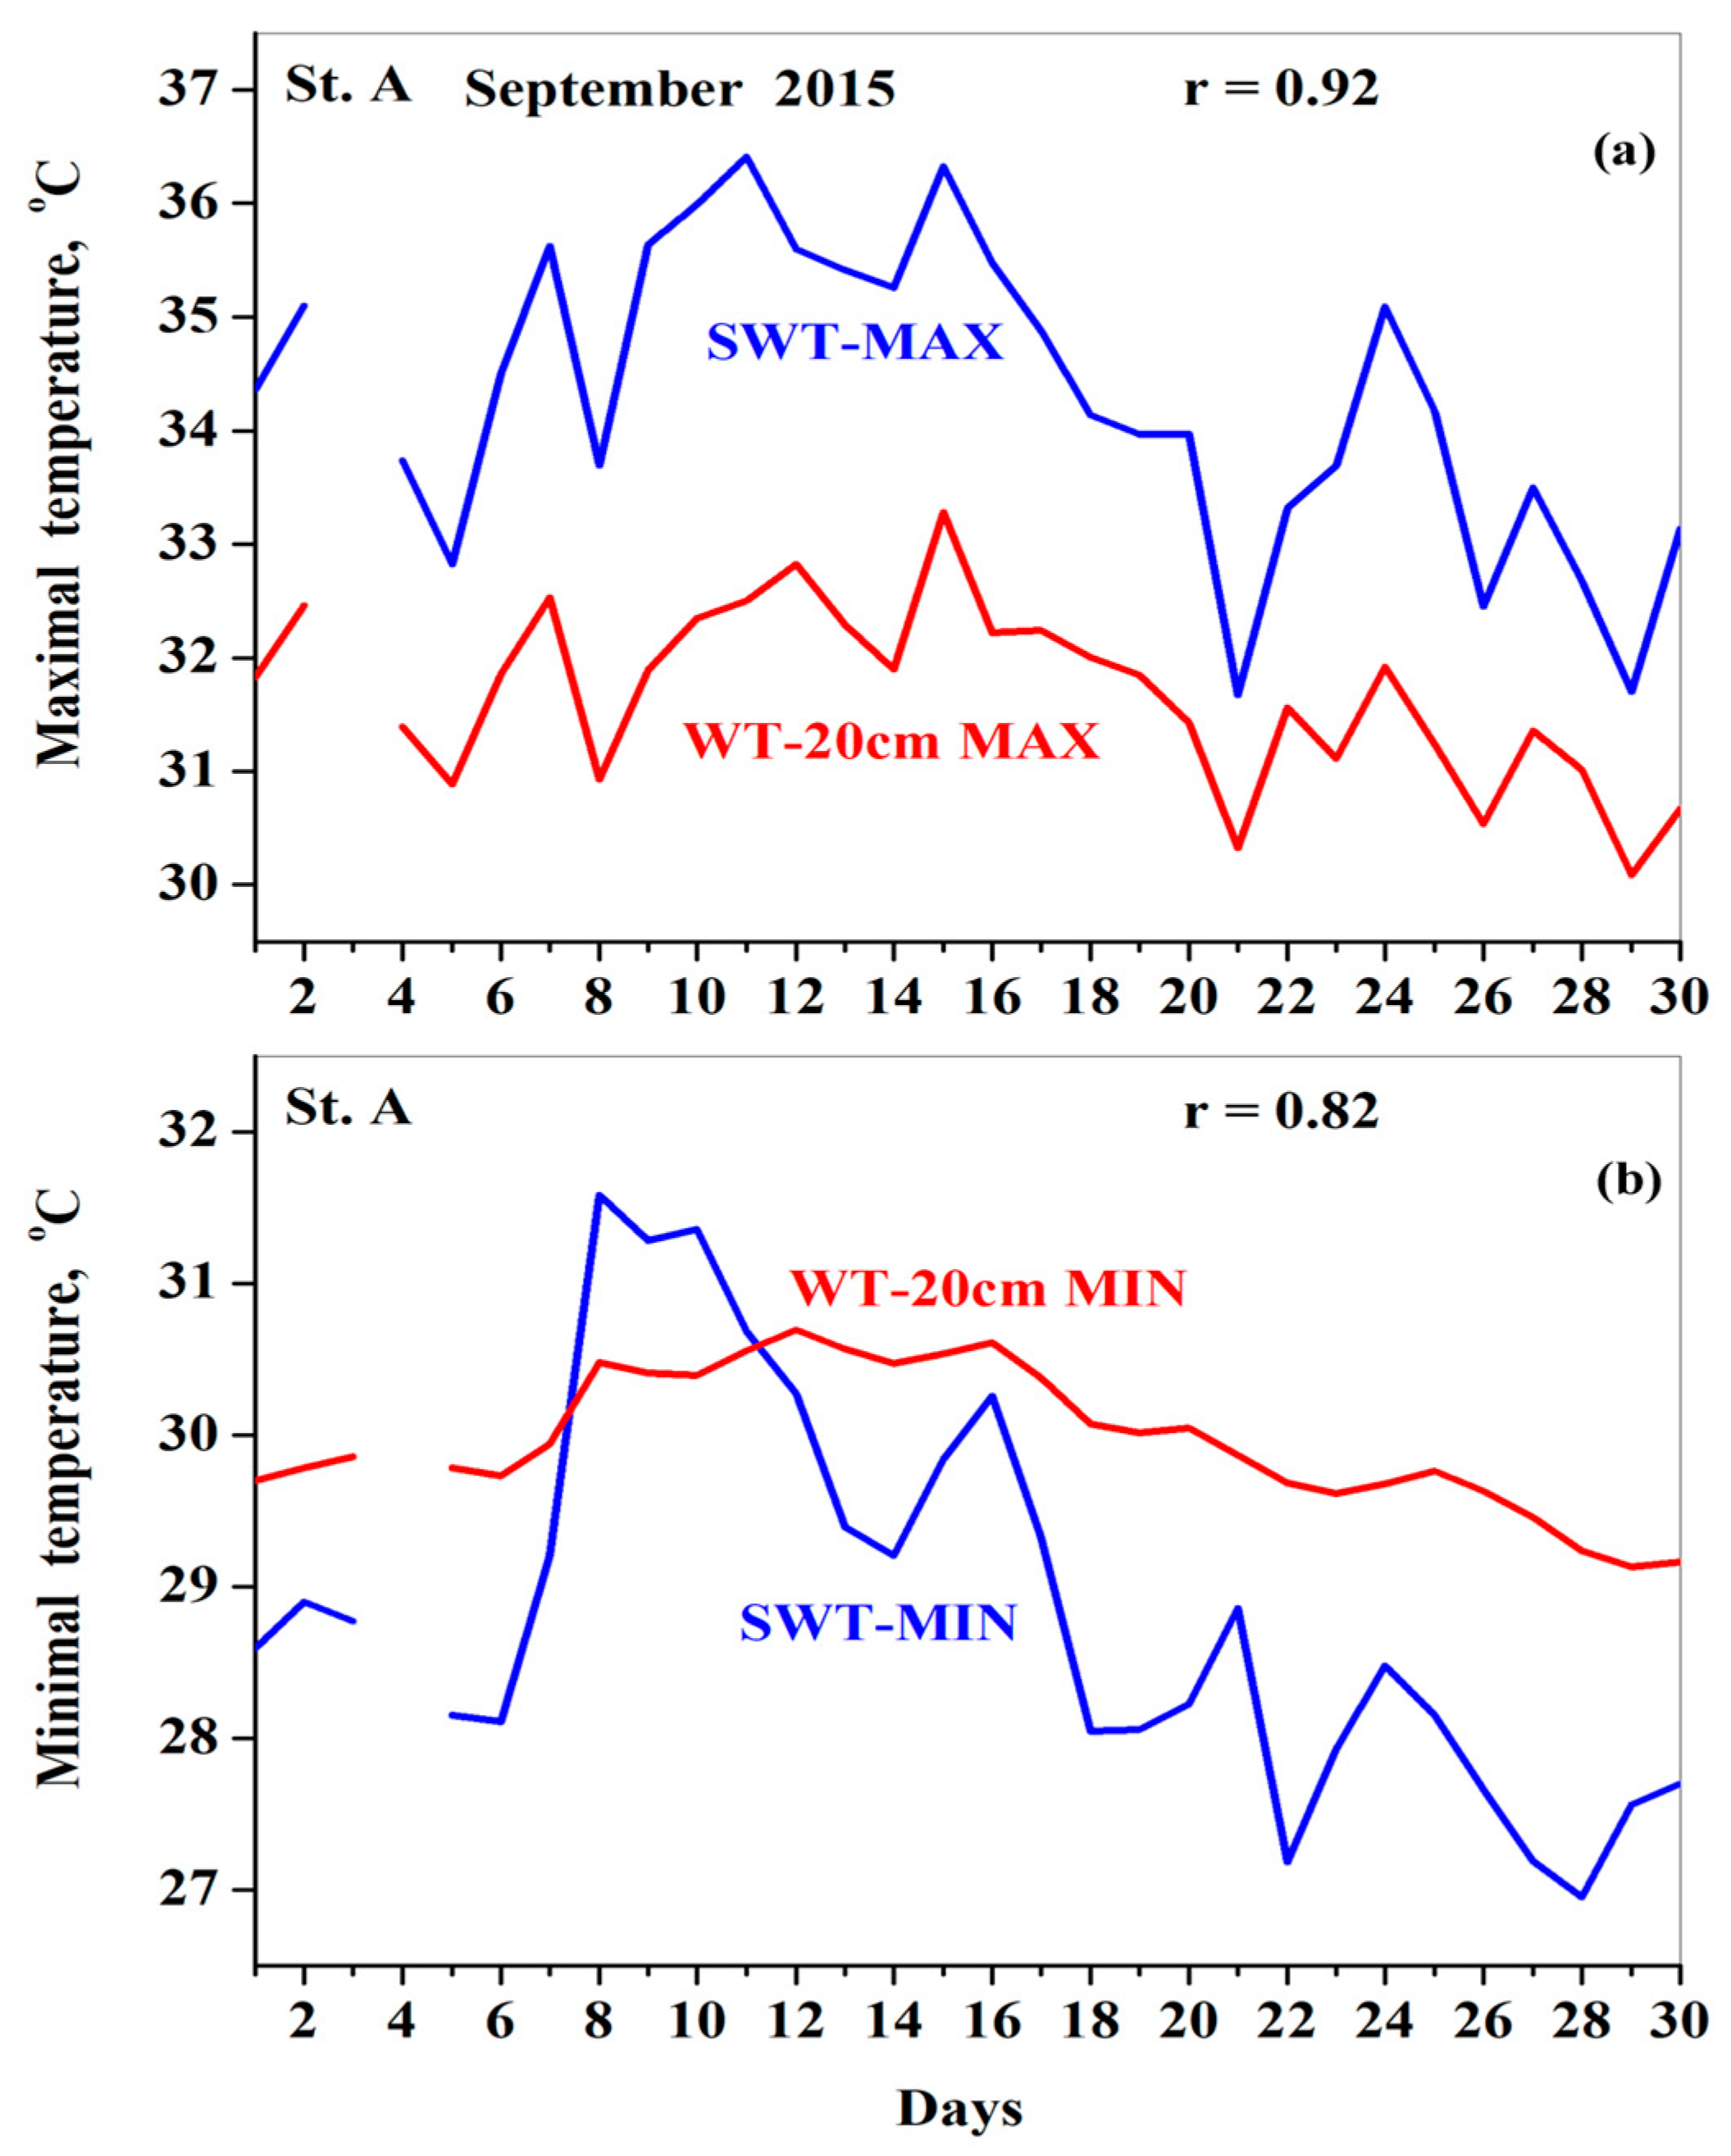
We compared the day-to-day variations in both the in-situ daily maximal SWT (SWT-MAX) and WT-20 cm (WT-20cm-MAX) in September 2015. Our comparison showed that they were highly correlated, in accordance with the correlation coefficient r = 0.92 ± 0.07 (Figure 13a). In particular, similar to SWT-MAX, an increase in WT-20cm-MAX was observed after 6 Sept. 2015 in the presence of the dust intrusion under study.
Furthermore, we compared day-to-day variations in both daily minimal SWT (SWT-MIN) and WT-20 cm (WT-20cm-MIN) in September 2015. It was found out that they were correlated in accordance with the correlation coefficient r = 0.82 ± 0.11 (Figure 13b).
In the daytime, the day-to-day variations in the SWT-MAX exceeded those of the WT-20cm-MAX throughout September 2015. This indicated that, in the daytime, the surface water heating was stronger than the water heating below the surface. In the nighttime, the day-to-day variations in the WT-20cm-MIN were much more stable than the day-to-day variations in the SWT-MIN, with very little fluctuations around 30 °C (Figure 13b). In the absence of extreme dust pollution, the WT-20cm-MIN exceeded the SWT-MIN due to surface water cooling by the escape of the upwelling longwave thermal radiation. However, in the presence of extreme dust pollution (7–9 September 2015), the SWT-MIN exceeded (by up to 1 °C) the WT-20cm-MIN (Figure 13b). This was because large amounts of water vapor absorbed most of both the upwelling and downwelling longwave thermal radiation (4.5–42 µm), heating the near-ground atmospheric layer (which is in direct contact with the lake surface water) (Section 4).
To investigate the impact of the dust intrusion on the subsurface LHW, we compared the day-to-day variations in the daily WT-20cm-MAX in September 2015 with the 90th percentile threshold for the WT-20cm-MAX in September from 2011 to 2023 (Figure 14a). We found an abnormally high WT-20cm-MAX compared to the 90th percentile threshold for the WT-20cm-MAX: a number of peaks were observed on 7, 11–13, and 14–16 September 2015 (Figure 14a). The main peak in WT-20cm-MAX was observed on 15 September 2015, when WT-20cm-MAX exceeded (by up to 1.5 °C) the 90th percentile threshold for WT-20cm-MAX.
The measurements showed a wide maximum for WT-20cm-MIN (observed in the nighttime) from 7 to 18 September 2015, which reflected the maximum WT-20cm-MAX (observed in the daytime) (Figure 14a,b). This indicates that a significant part of the heat obtained by the bulk water in the daytime remained in the nighttime. As such, the WT-20cm-MIN was lower than the WT-20cm-MAX. The main peak in the WT-20cm-MIN was observed on 12 September 2015, when WT-20cm-MIN exceeded (by up to 0.6 °C) the 90th percentile threshold for WT-20cm-MIN.
The 11-day period (7–18 September 2015) of abnormally high WT-20cm-MAX and WT-20cm-MIN compared to the 90th percentile threshold for WT-20cm-MAX and WT-20cm-MIN in September months is evidence of the presence of a subsurface LHW.

3.6. Day-to-Day Variations in Absolute Humidity

Kishcha et al. [22] found increasing absolute humidity (ρv) above Lake Kinneret on three dusty days from 7 to 9 September 2015. In this study, we analyzed the day-to-day variations in the daily maximal absolute humidity (ρv-MAX) at St. A on the lake during the observed LHW and AHW in September 2015.
First, we proved that day-to-day variations in ρv-MAX were determined by the changes in rthe water vapor over the lake. This was carried out by comparing the day-to-day variations in ρv-MAX with the day-to-day variations in the daily maximal mixing ration (MIXR-MAX). As known, ρv is a measure of the amount of water vapor per unit volume of air (g/m3), while MIXR is the amount of water vapor in 1 kg of dry air (g/kg). To estimate ρv, we used the approach by David et al. (2009), in accordance with Formula (2). MIXR was estimated using Formulas (3) and (4). Our comparative analysis between the day-to-day variations in the ρv-MAX and MIXR-MAX in September 2015 over Lake Kinneret showed that these day-to-day variations were highly correlated (Figure 15). MIXR is invariant to temperature and pressure changes; its day-to-day variations are determined by changes in water vapor. Consequently, for the given set of conditions (temperature and pressure) over Lake Kinneret in September 2015, the obtained day-to-day variations in ρv-MAX were also determined by the changes in the water vapor over the lake. This fact was taken into account while we conducted the following analysis of the day-to-day variations in ρv-MAX.
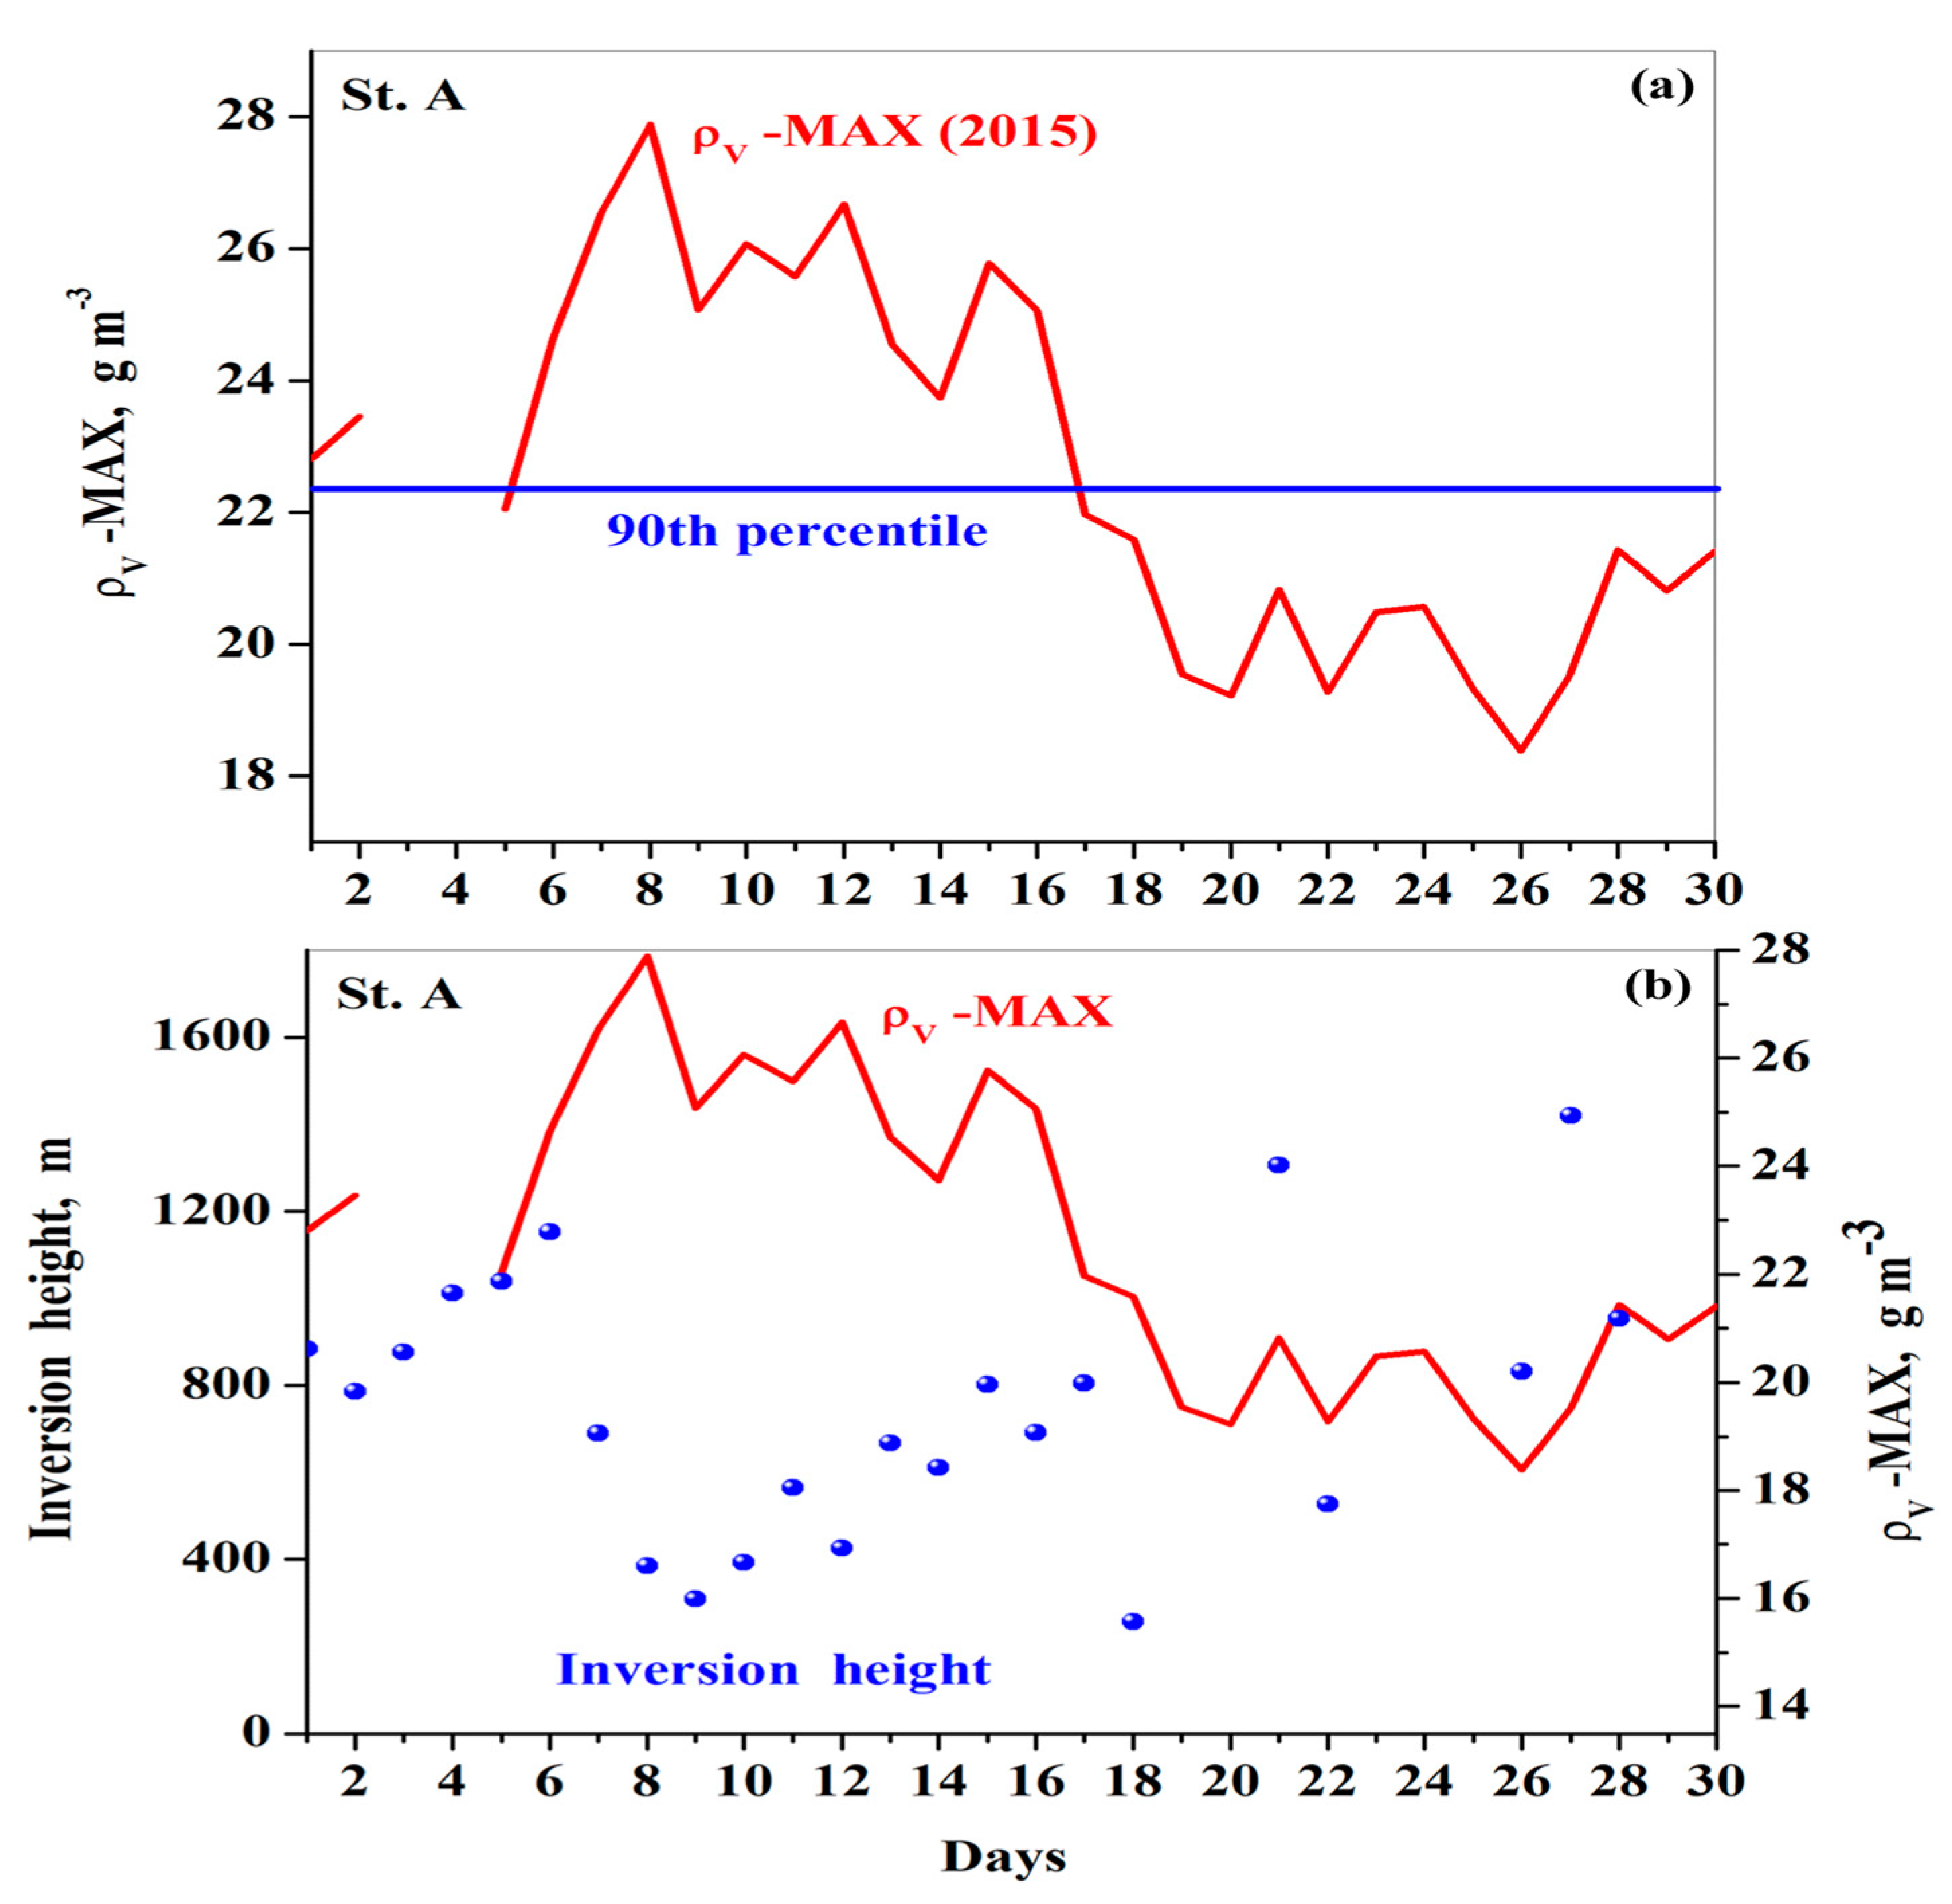
Our analysis showed that the period of abnormally high ρv-MAX lasted 10 days (7–17 September 2015) when ρv-MAX exceeded the 90th percentile threshold for ρv-MAX (Figure 16a). ρv-MAX peaked on 8 September, in the presence of maximal dust pollution. The peak value of ρv-MAX (28 g m−3) was 30% higher than the 90th percentile threshold for ρv-MAX, indicating the presence of large amounts of water vapor (Figure 16a).
As mentioned, the vertical temperature profiles from radiosonde soundings at Bet Dagan showed the formation of a low-level temperature inversion below the dust layer, during the period from 7 to 17 September 2015 (Figure 6). The presence of low-level temperature inversion on 8 September 2015 was an effective barrier to reducing the upwelling movements of water vapor. This contributed to the accumulation of water vapor over the lake characterized by the above-mentioned peak in ρv-MAX on that day (Figure 16a). We found that during the period from 7 to 17 September 2015, the gradual decrease in day-to-day variations in ρv-MAX was associated with a gradual increase in the day-to-day variations in the inversion height (Figure 16b). This inverse relationship was characterized by a correlation coefficient r = −0.61 ± 0.14.
Our analyses of the day-to-day variations in the ρv-MAX at the three other meteorological stations (B, C, and D), located on land areas (~15 km from the lake in different directions), showed a different picture. Specifically, in the presence of extreme dust pollution in September 2015, at each of the aforementioned stations, there was no prolonged period when ρv-MAX was higher than the 90th percentile threshold (Figure 17). Instead, from 8 to 11 September 2015, in the presence of significant dust pollution, a sharp decrease in ρv-MAX was observed (Figure 17b–d). Moreover, we found that in September 2015, the ρv-MAX at all of the land stations (B, C, and D) was noticeably lower than the ρv-MAX at St. A on the lake (Figure 17). This is evidence that the observed prolonged period of abnormally high ρv-MAX at St. A in the presence of the dust intrusion (7–17 September 2015) was not caused by the advection of moist air from the surrounding areas.
Note that from 12 to the 17 September 2015, ρv-MAX at meteorological stations B, C, and D, located on land, slightly increased and even exceeded the 90th percentile threshold (Figure 17b–d). This increase can be explained by water vapor diffusion from the lake toward the surrounding land areas.

4. Discussion

The in-situ measurements showed that the dust intrusion caused an atmospheric heatwave (AHW) and a lake heatwave (LHW) in Lake Kinneret in September 2015. The AHW and LHW were defined by a 10-day period of abnormally high Tair and SWT compared to their 90th percentile thresholds in September. The maximal intensity of the AHW and LHW in the daytime (characterized by a peak in the Tair-MAX and in SWT-MAX) reached 3 °C and 2 °C, respectively. This was despite the pronounced drop in the daily maximum solar radiation caused by the dust radiative effect.
In the daytime, the formation of the AHW and LHW was determined by the following factors: (a) shortwave dust radiative effect contributing to cooling in the near-ground atmospheric layer (which is in contact with the lake water surface); (b) settling dust particles (heated by the absorption of solar radiation); and (c) the upwelling and downwelling longwave radiation absorbed by water vapor. The latter two factors contributed to heating the near-ground atmospheric layer and the lake water surface. On dusty days during the period of the AHW and LHW (except for 8 September), the Tair-MAX and SWT-MAX were higher than their 90th percentile thresholds in September. On those dusty days, cooling by the shortwave dust radiative effect was dominated by heating due to both settling dust particles and longwave radiation (absorbed by water vapor). Therefore, in the daytime, in the presence of dust pollution, both shortwave solar radiation and longwave thermal radiation influenced the SWT of the lake. In contrast, on 8 September 2015, in the presence of the maximal dust pollution, both Tair-MAX and SWT-MAX were lower than their 90th percentile thresholds by 1 °C and 0.5 °C, respectively (Figure 7 and Figure 11a). On that day (8 September), cooling by the dust radiative effect dominated heating by both settling dust particles and water vapor.
We found that in the absence of moisture advection, the AHW and LHW were accompanied by an increase of up to 30% in absolute humidity (ρv) over the lake. Being a powerful greenhouse gas, water vapor (characterized by an increased ρv) absorbed most of both the upwelling and downwelling longwave thermal radiation (4.5–42 µm), heating the near-ground atmospheric layer (which is in direct contact with the lake water surface), in the daytime and in the nighttime. In the nighttime, the maximal intensity of both AHW and LHW (characterized by the peak in Tair-MIN and in SWT-MIN) reached 4 °C and 3 °C respectively (Figure 8a and Figure 11b).
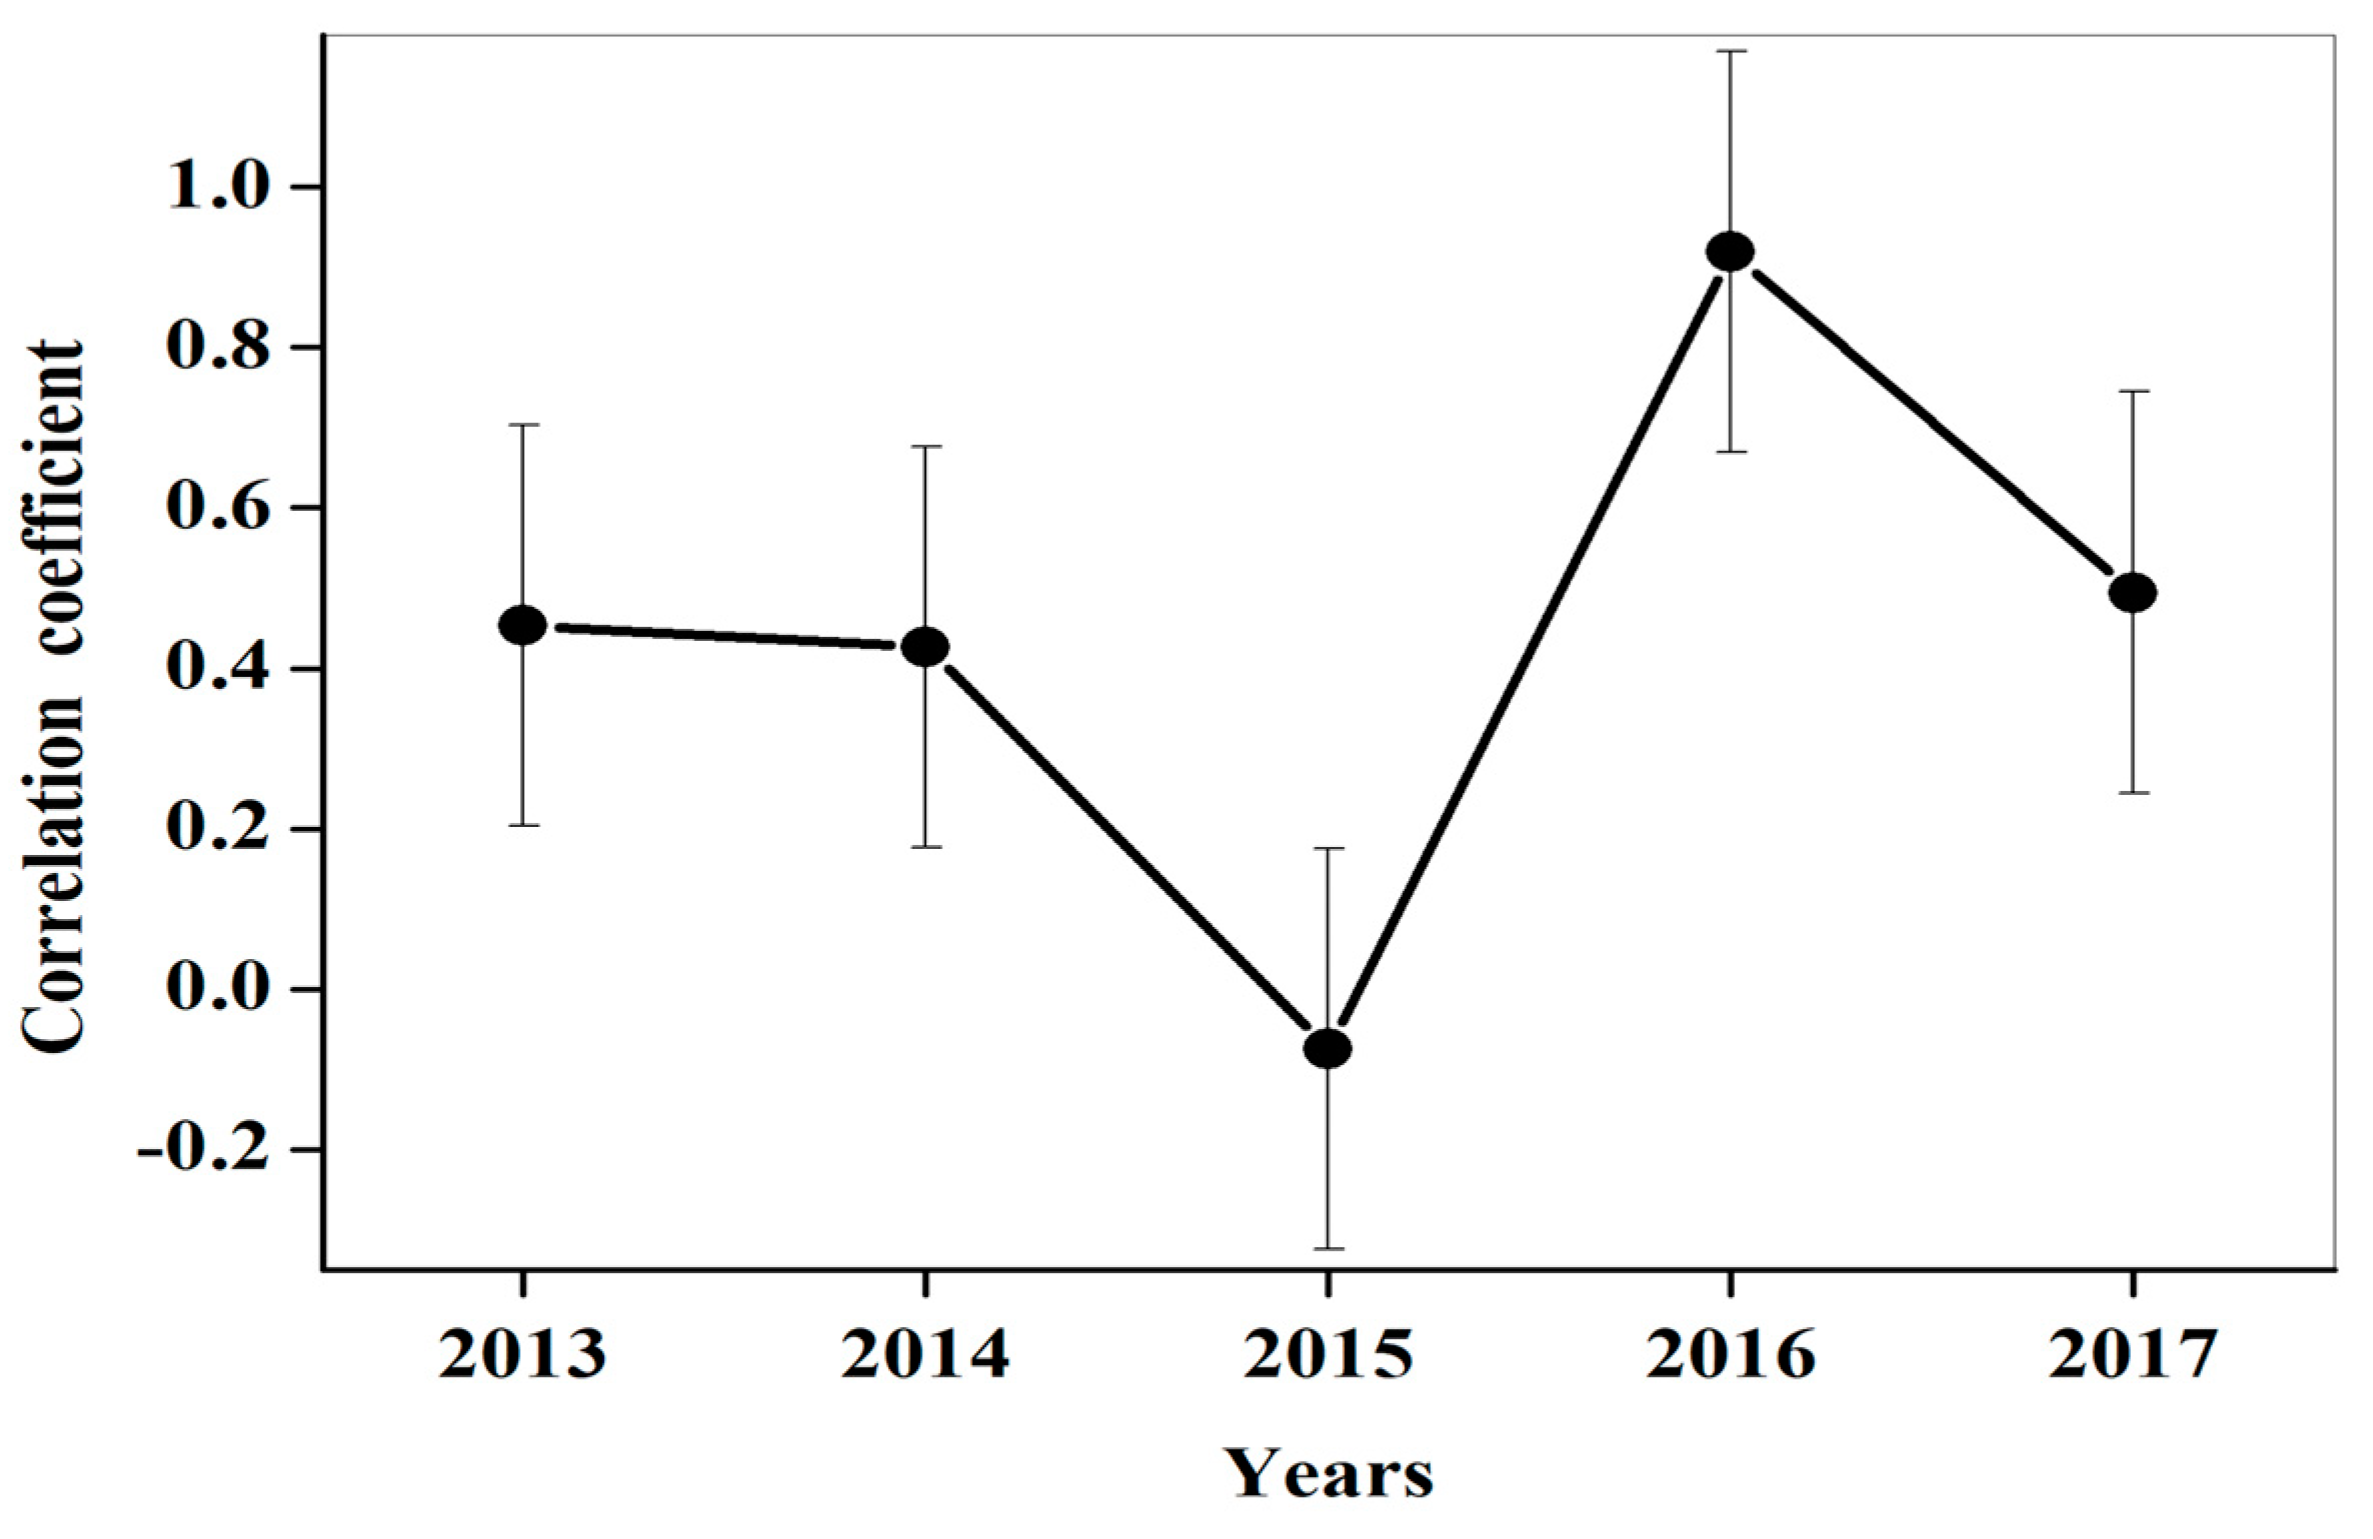
A possible explanation for the aforementioned prolonged period of abnormally high ρv is an increase in evaporation due to the abnormally high Lake Kinneret SWT (Figure 11a,b). However, the peak in ρv-MAX on 8 September 2015 (Figure 16a) cannot be explained by the increase in evaporation. This peak in ρv-MAX was observed under the following set of meteorological conditions on 8 September: (a) SWT-MAX was the lowest (33.7 °C) during the whole LHW period (Figure 11a,b) in the presence of very weak winds (less than 2 m/s) ([22], their Figure 8). Such conditions should have led to a decrease in evaporation. Therefore, those conditions could not explain the peak in the ρv-MAX on 8 September 2015. Furthermore, during the observed LHW (7–17 September 2015), we found an absence of a correlation between the SWT-MAX and ρv-MAX (Figure 18). Note that on the same September days in other years (2013, 2014, 2016, and 2017), there was a noticeably high correlation between SWT-MAX and ρv-MAX (Figure 18). The fact that there was no correlation between ρv-MAX and SWT-MAX during the observed LHW in September 2015 indicates that the observed increase in absolute humidity over the lake was not caused by an increase in evaporation due to the abnormally high SWT.
Our analysis of vertical temperature profiles from the radiosonde soundings at St. Bet Dagan showed the formation of a low-level temperature inversion below the bottom of the dust layer during the period from 7 to 17 September 2015 (Figure 6). The presence of low-level temperature inversion could have effectively reduced the upwelling movements of water vapor, contributing to the accumulation of water vapor over the lake. This is supported by the inverse relationship between the observed gradual decrease in day-to-day variations in ρv-MAX and the gradual increase in day-to-day variations in the inversion height during the period from 7 to 17 September 2015 (Figure 16b). This inverse relationship from 7 to 17 September was characterized by a correlation coefficient of −0.61 ± 0.14.
We found that during the same 10-day period, the aforementioned LHW contributed to the formation of a subsurface LHW. The measurements of bulk water temperature at a depth of 20 cm (WT-20cm) reflected the subsurface LHW. The subsurface LHW was defined as a 10-day period of abnormally high -20cm-MAX and WT-20cm-MIN compared to their 90th percentile thresholds (Figure 14a,b). The maximal intensity of this subsurface LHW reached 1.5 °C in the daytime and 0.6 °C in the nighttime.
To investigate the observed LHW, we used satellite-based SWT retrievals in addition to in-situ radiometer measurements of Lake Kinneret’s SWT. This was carried out using SWT retrievals from both geostationary (METEOSAT) and orbital (MODIS-Terra) satellites. On 8 September 2015, when solar radiation reached its minimum of ~200 W m−2, satellite SWT retrievals were unavailable due to the absence of data, either from METEOSAT or from MODIS-Terra. On other days in September 2015, satellite SWT retrievals were available from both satellites, together with their uncertainty (METEOSAT) (Figure 12a,b). On dusty days from 7 to 11 September 2015, both METEOSAT and MODIS-Terra showed a noticeable decrease in the SWT along with increasing dust pollution in the daytime and in the nighttime: this contrasted with the day-to-day variations in the abnormally high in-situ measured SWT (Figure 12a,b). This led us to the conclusion that in the presence of the dust intrusion, the satellite SWT retrievals were incapable of representing the observed LHW phenomenon. This finding was in line with that of our previous study [22]: it highlightsed an important point that the previous studies on lake heatwaves, which were based on satellite SWT retrievals, may not have taken into account the LHW phenomena caused by dust intrusions.
Note that atmospheric desert dust is capable of perturbing the infrared (IR) radiative field over the lake. In the presence of dust during the 10-day period (7–17 September 2015), in-situ radiometer measurements at Lake Kinneret showed abnormally high daily maximal and minimal longwave radiation (Figure 5). The obtained significant disagreement between the satellite-derived SWT and the SWT derived from in-situ radiometer measurements can be explained by the impact of the dust-caused IR perturbations on satellite IR measurements. As a result, on 10 September 2015, the maximal SWT difference of up to 7 °C between MODIS-Terra SWT and in-situ SWT was observed in the daytime (10LT–11LT) and of up to 11 °C in the nighttime (22LT–23 LT) (Figure 12a,b). Similarly, on that day (10 September 2015), the SWT difference of up to 9 °C between METEOSAT SWT and in-situ SWT was observed in the daytime (10LT–11LT) and of up to 15 °C in the nighttime (22LT–23 LT) (Figure 12a,b). The above discrepancies show that the impact of dust on satellite IR measurements should be considered when using satellite data to analyze heatwaves.
We found a good correspondence between the day-to-day variations in Tair and those of the actual SWT (obtained from in-situ radiometer measurements). The day-to-day variations in Tair-MAX and those of SWT-MAX were shown to be highly correlated (r = 0.91 ±   0.04 ) , and, similarly, the day-to-day variations in Tair-MIN and those of SWT-MIN were also highly correlated (r = 0.98 ±   0.03 ) (Figure 10a,b) This finding has important practical significance: in the absence of in-situ measurements of the actual SWT (based on radiometer measurements), the day-to-day variations in Tair-MAX and Tair-MIN can be used as proxies for day-to-day variations in the SWT-MAX and SWT-MIN.
Finally, it is worth noting the following characteristic features of the impact of the extreme dust intrusion on the diurnal cycle of Lake Kinneret’s SWT: (1) the nighttime increase in SWT along with the increase in dust polution; (2) the delay in the nighttime minimum SWT; (3) the flattening in the diurnal cycle of the SWT (Figure 9). These characteristic features can be used as indicators of the presence of extreme dust intrusions over the lake. These characteristic features were not discussed in previous publications.

5. Conclusions

The role of dust intrusions in the formation of lake heatwaves was not discussed in previous publications. In the current study, we analyzed lake (LHW) and atmospheric (AHW) heatwaves in the freshwater Lake Kinneret in the Eastern Mediterranean, as caused by an extreme dust intrusion in September 2015. This dust intrusion (characterized by a PM10 of up to 3400 µg m−3 and an AOD of up to 2.6) caused an AHW and a LHW, both lasting for a 10-day period (7–17 September 2015). The AHW and LHW were defined as periods of abnormally high air temperature (Tair) and lake surface water temperature (SWT) compared to the 90th percentile threshold for Tair and SWT in September. In the daytime, the maximal intensity of both AHW and LHW (characterized by peaks in Tair-MAX and SWT-MAX) reached 3 °C and 2 °C, respectively. This was despite the pronounced drop in the daily maximum solar radiation caused by the dust radiative effect. The AHW and LHW were accompanied by increased absolute humidity (ρv) (up to 30%) over the lake, in the absence of moisture advection. Being a powerful greenhouse gas, water vapor (shown by the increased ρv) absorbed most of both the upwelling and downwelling longwave thermal radiation (4.5–42 µm), heating the near-ground atmospheric layer (which is in contact with the lake surface water). As a result, the maximal intensity of both the AHW and LHW in the nighttime (shown by the peaks in Tair-MIN and SWT-MIN) reached 4 °C and 3 °C, respectively.
Satellite SWT retrievals were incapable of representing the abnormally high SWT in the presence of the extreme dust intrusion. Both METEOSAT and MODIS-Terra showed a sharp decrease in the Lake Kinneret SWT compared to the actual SWT: up to 10 °C in the daytime and up to 15 °C in the nighttime. Such a significant underestimation of the actual SWT by satellite SWT retrievals in the presence of dust intrusion can be explained by the impact of dust-caused infrared (IR) perturbations on satellite IR measurements. The underestimation of the actual SWT in the presence of a dust intrusion should be considered when using satellite data to analyze heatwaves.
Moreover, we found that during the same 10-day period, the aforementioned LHW contributed to the formation of a subsurface LHW. The measurements of the bulk water temperature at a depth of 20 cm (WT-20cm) reflected the subsurface LHW, which was defined as a 10-day period of abnormally high WT-20cm compared to the 90th percentile threshold in September. The maximal intensity of this subsurface LHW reached 1.5 °C in the daytime and 0.6 °C in the nighttime.
The measurements showed a good correspondence between the day-to-day variations in the Tair (obtained from in-situ meteorological measurements) and those of the actual Lake Kinneret SWT (obtained from in-situ radiometer measurements). This finding has important practical significance: in the absence of in-situ radiometer measurements of SWT, day-to-day variations in Tair-MAX and Tair-MIN can be used as proxies for day-to-day variations in SWT-MAX and SWT-MIN.
The characteristic features of the impact of the extreme dust intrusion on the diurnal cycle of Lake Kinneret’s SWT (such as the nighttime increase in SWT along with the increase in dust pollution, the delay in the nighttime minimum SWT, and the flattening in the diurnal cycle of SWT) can be used as indicators of the presence of extreme dust intrusions over the lake.
Lake heatwaves can cause significant disasters for lake ecosystems by reducing fishery resources and increasing harmful cyanobacteria blooms [18,19]. Because of the observed steadily increasing dust pollution over the Eastern Mediterranean during the past several decades, we anticipate that the adverse effects of dust-related lake heatwaves on lake aquatic ecosystems will intensify in the future.

Author Contributions

All coauthors equally contributed to the writing of the current research article: P.K., Y.L. and B.S.; in-situ measurements of water temperature, longwave radiation, and meteorological parameters for Lake Kinneret: Y.L. All authors have read and agreed to the published version of the manuscript.

Funding

This research received no external funding.

Data Availability Statement

The METEOSAT product of land surface temperature (physical model) is available at https://wui.cmsaf.eu/safira/action/viewProduktHome (accessed on 26 May 2024). The MOD11A1.006 product is publicly available [37]. In-situ radiometer measurements of longwave radiation, water temperature at a depth of 20 cm, and meteorological parameters at site A are available from the Zenodo repository at https://doi.org/10.5281/zenodo.11001685 (accessed on 26 May 2024). PM10 measurements at the Afula station are available at https://www.gov.il/en/departments/ministry_of_environmental_protection/govil-landing-page (accessed on 26 May 2024). Pyranometer data of solar radiation taken at the meteorological stations Zemah are available from https://ims.gov.il/en/data_gov (accessed on 26 May 2024). Measurements of 2 m air temperature and relative humidity at meteorological stations located in North Israel are available at https://ims.gov.il/en/data_gov (accessed on 26 May 2023). Radiosonde profiles at Bet Dagan are available at: http://weather.uwyo.edu/upperair/sounding.html (accessed on 26 May 2024).

Acknowledgments

We thank the Satellite Application Facility on Climate Monitoring (CM SAF) team for METEOSAT LST records. We thank the NASA/MODIS teams for MOD11A1 LST records. We thank the Israel Meteorological Service for the 10 min meteorological and pyranometer measurements used in this study. In-situ measurements of water temperature, longwave radiation, and meteorological parameters at site A on Lake Kinneret are associated with the Kinneret Limnological Laboratory, Israel Oceanographic and Limnological Research (https://www.ocean.org.il/kinneret-limnological-laboratory-center/, accessed on 26 May 2024).

Conflicts of Interest

The authors declare no conflicts of interest.

Appendix A

Comparison between day-to-day variations in air temperature at St. A on Lake Kinneret and day-to-day variations in air temperature at three stations over land areas surrounding the lakes.
Figure A1. Comparison between day-to-day variations in Tair-MAX in September 2015 and the 90th percentile threshold for Tair-MAX, at four meteorological stations: (a) St. A located on the lake (32.82°N, 35.60°E); (b) St. B represents the Ayyellet Hashahar station (33.02°N, 35.57°E); (c) St. C is the Deir Hanna station (32.86°N, 35.37°E); and (d) St. D is the Avne Etan station (32.81°N, 35.76°E). (e) a map of the Lake Kinneret region with the location of meteorological stations.
Remotesensing 16 02314 g0a1
Figure A2. Comparison between day-to-day variations in Tair-MIN in September 2015 and the 90th percentile threshold for Tair-MIN at four meteorological stations: (a) St. A located in the lake (32.82°N, 35.60°E); (b) St. B represents the Ayyellet Hashahar station (33.02°N, 35.57°E); (c) St. C is the Deir Hanna station (32.86°N, 35.37°E); and (d) St. D is the Avne Etan station (32.81°N, 35.76°E). (e) a map of the Lake Kinneret region with the location of meteorological stations.
Remotesensing 16 02314 g0a2

References

  1. Zittis, G.; Almazroui, M.; Alpert, P.; Ciais, P.; Cramer, W.; Dahdal, Y.; Fnais, M.; Francis, D.; Hadjinicolaou, P.; Howari, F.; et al. Climate change and weather extremes in the Eastern Mediterranean and Middle East. Rev. Geophys. 2022, 60, e2021RG000762. [Google Scholar] [CrossRef]
  2. Hochman, A.; Marra, F.; Messori, G.; Pinto, J.G.; Raveh-Rubin, S.; Yosef, Y.; Zittis, G. Extreme weather and societal impacts in the eastern Mediterranean. Earth Syst. Dyn. 2022, 13, 749–777. [Google Scholar] [CrossRef]
  3. Tsikerdekis, A.; Zanis, P.; Georgoulias, A.K.; Alexandri, G.; Katragkou, E.; Karacostas, T.; Solmon, F. Direct and semi-direct radiative effect of North African dust in present and future regional climate simulations. Clim. Dyn. 2019, 53, 4311–4336. [Google Scholar] [CrossRef]
  4. Shaheen, A.; Wu, R.; Lelieveld, J.; Yousefi, R.; Aldabash, M. Winter AOD trend changes over the Eastern Mediterranean and Middle East region. Int. J. Climatol. 2021, 41, 5516–5535. [Google Scholar] [CrossRef]
  5. Yu, Y.; Kalashnikova, O.V.; Garay, M.J.; Lee, H.; Notaro, M. Identification and characterization of dust source regions across North Africa and the Middle East using MISR satellite observations. Geophys. Res. Lett. 2018, 45, 6690–6701. [Google Scholar] [CrossRef]
  6. Lelieveld, J.; Hadjinicolaou, P.; Kostopoulou, E.; Chenoweth, J.; El Maayar, M.; Giannakopoulos, C.; Hannides, C.; Lange, M.A.; Tanarhte, M.; Tyrlis, E.; et al. Climate change and impacts in the Eastern Mediterranean and the Middle East. Clim. Chang. 2012, 114, 667–687. [Google Scholar] [CrossRef] [PubMed]
  7. Samuels, R.; Hochman, A.; Baharad, A.; Givati, A.; Levi, Y.; Yosef, Y.; Saaroni, H.; Ziv, B.; Harpaz, H.; Alpert, P. Evaluation and projection of extreme precipitation indices in the eastern Mediterranean based on CMIP5 multi-model ensemble. Int. J. Climatol. 2018, 38, 2280–2297. [Google Scholar] [CrossRef]
  8. Pisano, A.; Marullo, S.; Artale, V.; Falcini, F.; Yang, C.; Leonelli, F.E.; Santoleri, R.; Buongiorno Nardelli, B. New Evidence of Mediterranean Climate Change and Variability from Sea Surface Temperature Observations. Remote Sens. 2020, 12, 132. [Google Scholar] [CrossRef]
  9. Darmaraki, S.; Somot, S.; Sevault, F.; Nabat, P. Past variability of Mediterranean Sea marine heatwaves. Geophys. Res. Lett. 2019, 46, 9813–9823. [Google Scholar] [CrossRef]
  10. Dayan, H.; McAdam, R.; Juza, M.; Masina, S.; Speich, S. Marine heat waves in the Mediterranean Sea: An assessment from the surface to the subsurface to meet national needs. Front. Mar. Sci. 2023, 10, 1045138. [Google Scholar] [CrossRef]
  11. Hobday, A.J.; Alexander, L.V.; Perkins, S.E.; Smale, D.A.; Straub, S.C.; Oliver, E.C.J.; Benthuysen, J.A.; Burrows, M.T.; Donat, M.G.; Peng, M.; et al. A hierarchical approach to defining marine heatwaves. Prog. Oceanogr. 2016, 141, 227–238. [Google Scholar] [CrossRef]
  12. Holbrook, N.J.; Sen Gupta, A.; Oliver, E.; Hobday, A.; Benthuysen, J.; Scannell, H.; Smal, D.; Wernberg, T. Keeping pace with marine heatwaves. Nat. Rev. Earth Environ. 2020, 1, 482–493. [Google Scholar] [CrossRef]
  13. Marullo, S.; Serva, F.; Iacono, R.; Napolitano, E.; di Sarra, A.; Meloni, D.; Monteleone, F.; Sferlazzo, D.; De Silvestri, L.; de Toma, V.; et al. Record-breaking persistence of the 2022/23 marine heatwave in the Mediterranean Sea. Environ. Res. Lett. 2023, 18, 114041. [Google Scholar] [CrossRef]
  14. Woolway, I.; Jennings, E.; Shatwell, T.; Golub, M.; Pierson, D.C.; Maberly, S.C. Lake heatwaves under climate change. Nature 2021, 589, 402–407. [Google Scholar] [CrossRef] [PubMed]
  15. Woolway, I.; Anderson, E.; Albergel, C. Rapidly expanding lake heatwaves under climate change. Environ. Res. Lett. 2021, 16, 094013. [Google Scholar] [CrossRef]
  16. Wang, X.; Shi, K.; Zhang, Y.; Qin, B.; Zhang, Y.; Wang, W.; Woolway, R.I.; Piao, S.; Jeppesen, E. Zhang Climate change drives rapid warming and increasing heatwaves of lakes. Sci. Bull. 2023, 68, 1574–1584. [Google Scholar] [CrossRef] [PubMed]
  17. Woolway, I.; Eleanor Jennings, E.; Carrea, L. Impact of the 2018 European heatwave on lake surface water temperature. Inland Waters 2020, 10, 322–332. [Google Scholar] [CrossRef]
  18. Li, N.; Zhang, Y.; Zhang, Y.; Shi, K.; Qian, H.; Yang, H.; Niu, Y.; Qin, B.; Zhu, G.; Woolway, R.I.; et al. The unprecedented 2022 extreme summer heatwaves increased harmful cyanobacteria blooms. Sci. Total Environ. 2023, 896, 165312. [Google Scholar] [CrossRef] [PubMed]
  19. Duan, Z.; Gao, W.; Cheng, G.; Zhang, Y.; Chang, X. Warming surface and Lake heatwaves as key drivers to harmful algal Blooms: A case study of Lake Dianchi, China. J. Hydrol. 2024, 632, 130971. [Google Scholar] [CrossRef]
  20. Rimmer, A.; Givati, A.; Samuels, R.; Alpert, P. Using ensemble of climate models to evaluate future water and solutes budgets in Lake Kinneret, Israel. J. Hydrol. 2011, 410, 248–259. [Google Scholar] [CrossRef]
  21. La Fuente, S.; Jennings, E.; Gal, G.; Kirillin, G.; Shatwell, T.; Ladwig, R.; Moore, T.; Couture, R.-M.; Côté, M.; Love Råman Vinnå, C.; et al. Multi-model projections of future evaporation in a sub-tropical lake. J. Hydrol. 2022, 615, 128729. [Google Scholar] [CrossRef]
  22. Kishcha, P.; Lechinsky, Y.; Starobinets, B. Impact of a Severe Dust Event on Diurnal Behavior of Surface Water Temperature in Subtropical Lake Kinneret. Remote Sens. 2023, 15, 5297. [Google Scholar] [CrossRef]
  23. Ziv, B.; Shilo, E.; Lechinsky, Y.; Rimmer, A. Meteorology. In Lake Kinneret—Ecology and Management; Zohary, T., Sukenik, A., Berman, T., Nishri, A., Eds.; Springer: Dordrecht, The Netherlands, 2014; pp. 81–96. [Google Scholar]
  24. Kishcha, P.; Lechinsky, Y.; Starobinets, B. Cooling by Cyprus Lows of Surface and Epilimnion Water in Subtropical Lake Kinneret in Rainy Seasons. Remote Sens. 2022, 14, 4709. [Google Scholar] [CrossRef]
  25. Kishcha, P.; Starobinets, B.; Lechinsky, Y.; Alpert, P. Absence of surface water temperature trends in Lake Kinneret despite present atmospheric warming: Comparisons with Dead Sea trends. Remote Sens. 2021, 13, 3461. [Google Scholar] [CrossRef]
  26. Kishcha, P.; Volpov, E.; Starobinets, B.; Alpert, P.; Nickovic, S. Dust Dry Deposition over Israel. Atmosphere 2020, 11, 197. [Google Scholar] [CrossRef]
  27. Uzan, L.; Egert, S.; Alpert, P. Ceilometer evaluation of the eastern Mediterranean summer boundary layer height—First study of two Israeli sites. Atmos. Meas. Tech. 2016, 9, 4387–4398. [Google Scholar] [CrossRef]
  28. Uzan, L.; Egert, S.; Alpert, P. New insights into the vertical structure of the September 2015 dust storm employing eight ceilometers and auxiliary measurements over Israel. Atmos. Chem. Phys. 2018, 18, 3203–3221. [Google Scholar] [CrossRef]
  29. Gasch, P.; Rieger, D.; Walter, C.; Khain, P.; Levi, Y.; Knippertz, P.; Vogel, B. Revealing the meteorological drivers of the September 2015 severe dust event in the Eastern Mediterranean. Atmos. Chem. Phys. 2017, 17, 13573–13604. [Google Scholar] [CrossRef]
  30. Platnick, S.; Hubanks, P.; Meyer, K.; King, M.D. MODIS Atmosphere L3 Monthly Product; NASA MODIS Adaptive Processing System, Goddard Space Flight Center: Greenbelt, MD, USA, 2015; Available online: https://doi.org/10.5067/MODIS/MOD08_M3.006 (accessed on 2 April 2024).
  31. Schmid, M.; Read, J. Heat budget of lakes. In Encyclopedia of Inland Waters 2022, 2nd ed.; Elsevier: Amsterdam, The Netherlands, 2022; Volume 1, pp. 467–473. [Google Scholar] [CrossRef]
  32. Okwen, R.; Pu, R.; Cunningham, J. Remote sensing of temperature variations around major power plants as point sources of heat. Int. J. Remote Sens. 2011, 32, 3791–3805. [Google Scholar] [CrossRef]
  33. David, N.; Alpert, P.; Messer, H. Technical note: Novel method for water vapor monitoring using wireless communication networks measurements. Atmos. Chem. Phys. 2009, 9, 2413–2418. [Google Scholar] [CrossRef]
  34. Bolton, D. The computation of equivalent potential temperature. Mon. Weather Rev. 1980, 108, 1046–1053. [Google Scholar] [CrossRef]
  35. Duguay-Tetzlaff, A.; Bento, V.A.; Göttsche, F.-M.; Stöckli, R.; Martins, J.P.A.; Trigo, I.; Olesen, F.-S.; Bojanowski, J.S.; Dacamara, C.C.; Kunz, H. Meteosat Land Surface Temperature Climate Data Record: Achievable Accuracy and Potential Uncertainties. Remote Sens. 2015, 7, 13139–13156. [Google Scholar] [CrossRef]
  36. Product User Manual (PUM) Meteosat Land Surface Temperature. 2017. Available online: https://www.cmsaf.eu/SharedDocs/Literatur/document/2017/saf_cm_meteoswiss_pum_met_lst_1_1_pdf.pdf?__blob=publicationFile (accessed on 2 February 2024).
  37. LP DAAC Land Processes Distributed Active Archive Center: MOD11A1.006 MODIS/Terra Land Surface Temperature/Emissivity Daily L3 Global 1 km V006. Available online: https://e4ftl01.cr.usgs.gov/MOLT/MOD11A1.061/ (accessed on 26 May 2024).
  38. Emery, W.J.; Castro, S.; Wick, G.A.; Schluessel, P.; Donlon, C. Estimating sea surface temperature from infrared satellite and in situ temperature data. Bull. Am. Meteorol. Soc. 2001, 82, 2773–2785. [Google Scholar] [CrossRef]
  39. Kishcha, P.; Da Silva, A.; Starobinets, B.; Long, C.; Kalashnikova, O.; Alpert, P. Saharan dust as a causal factor of hemispheric asymmetry in aerosols and cloud cover over the tropical Atlantic Ocean. Int. J. Remote Sens. 2015, 36, 3423–3445. [Google Scholar] [CrossRef]
  40. Hondzo, M.; You, J.; Taylor, J.; Bartlet, G.; Voller, V.R. Measurement and scaling of lake surface skin temperatures. Geophys. Res. Lett. 2022, 49, e2021GL093226. [Google Scholar] [CrossRef]
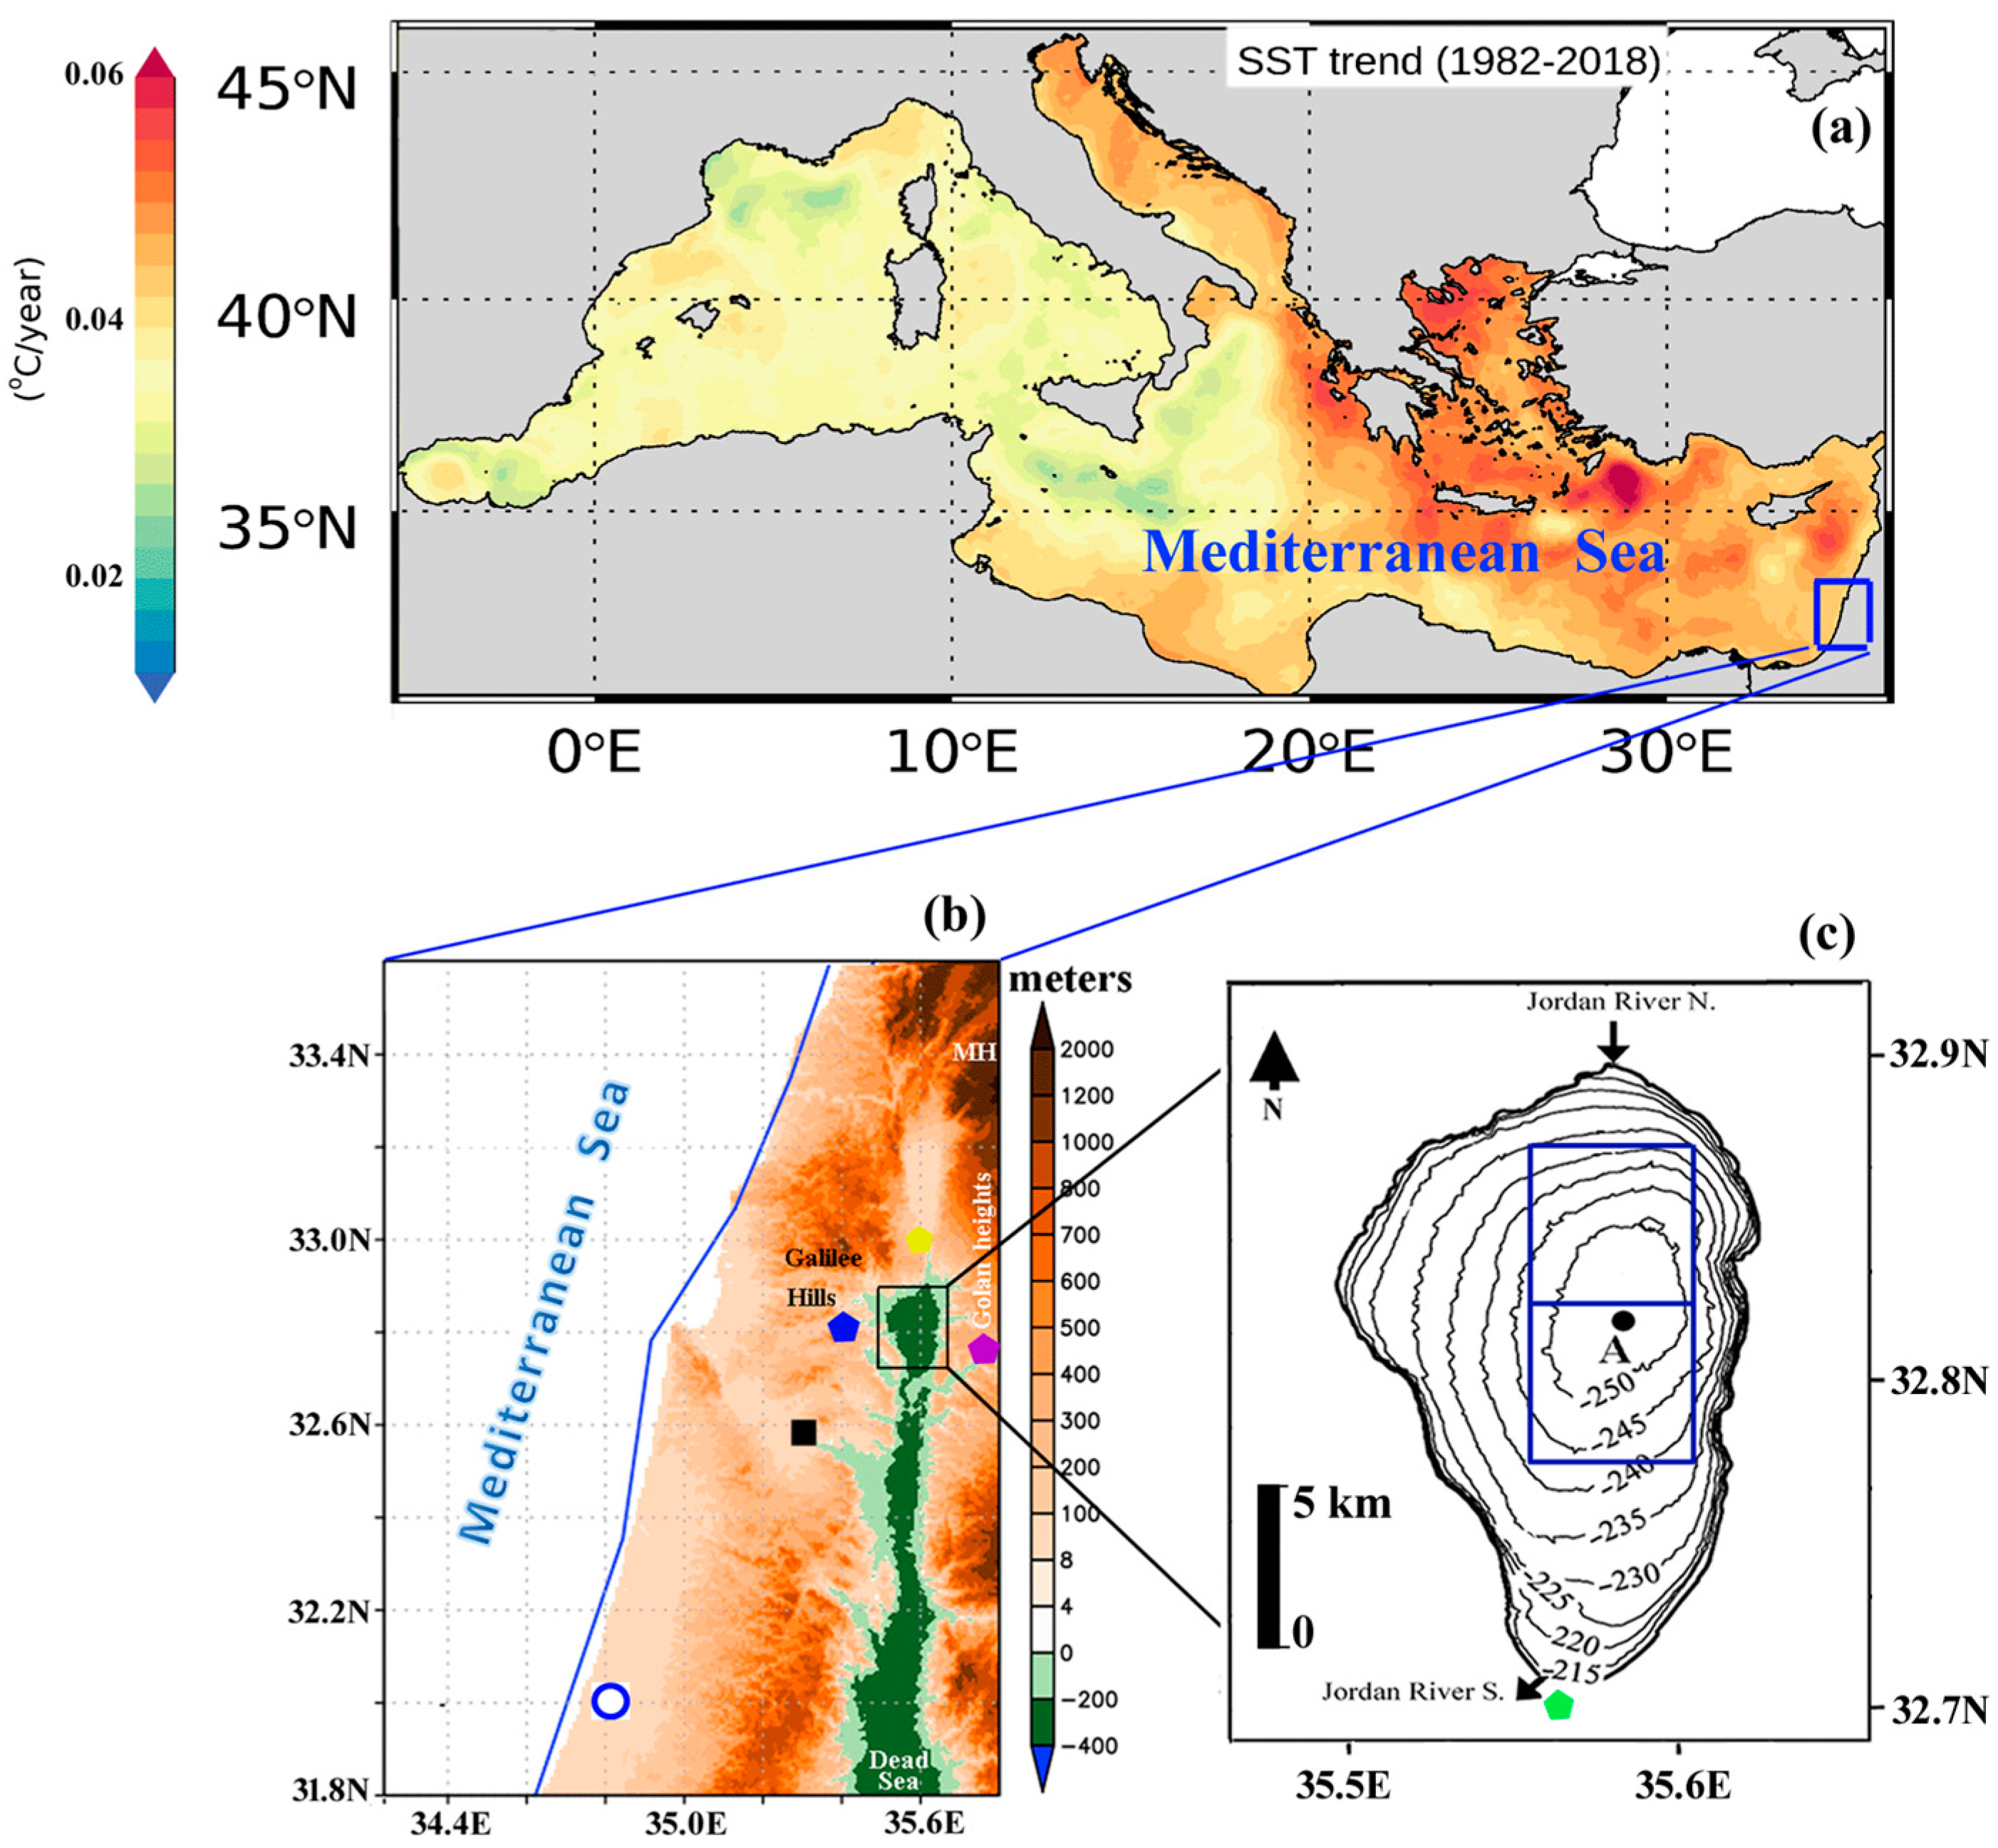
Figure 1. (a) Map of Mediterranean SST trends (updated from Pisano et al. [8]). (b) Topography of the southeast Mediterranean region (31.8°N–33.6°N; 34.2°E–35.8°E) with Lake Kinneret, (c) bathymetric map of Lake Kinneret (−215 to −250 m a.s.l.). The green, blue, yellow, and purple pentagons designate the location of the following stations: Zemah (32.70°N, 35.58°E), Deir Hanna (32.86°N, 35.37°E), Ayyellet Hashahar (33.02°N, 35.57°E), and Avne Etan (32.81°N, 35.76°E), respectively. The black square shows the location of the Afula PM10 monitoring site (32.59°N, 35.27°E). The open circle shows the location of the Bet Dagan (32.00°N, 34.81°E) station. MH designates Mount Hermon, while A (32.82°N, 35.60°E, 40 m depth) designates the location of the monitoring station conducting measurements of water temperature and meteorological parameters in the lake. The blue rectangles designate two pixels on the 0.05° × 0.05° METEOSAT grid: they represent the water area in the lake (32.775°N–32.875°N; 35.575°E–35.625°E) where METEOSAT SWT was analyzed.
Remotesensing 16 02314 g001
Figure 2. Time series of 10 min PM10 concentration measurements taken at the Afula monitoring site: (a) during the period from 6 to 7 September and (b) during the period from 8 to 12 September 2015.
Remotesensing 16 02314 g002
Figure 3. Day-to-day variations in MODIS Deep Blue AOD averaged over North Israel (including Lake Kinneret) (32°N–33°N, 35°E–36°E) in September 2015. The absence of AOD measurements on 21 September 2015 can be explained by the presence of clouds over North Israel, which prevented MODIS from conducting AOD measurements.
Remotesensing 16 02314 g003
Figure 4. Comparison between day-to-day variations in maximal solar radiation (SR-MAX) in September 2015 and those of normal SR-MAX. The latter was defined as the average SR-MAX over the reference Septembers from 2011 to 2023 (excluding September 2015 and 2020). The short vertical lines designate the standard deviation of normal SR.
Remotesensing 16 02314 g004
Figure 5. Comparison between day-to-day variations in (a) DLWR-MAX and the 90th percentile threshold for DLWR-MAX; (b) ULWR-MAX and the 90th percentile threshold for ULWR-MAX; (c) DLWR-MIN and the 90th percentile threshold for DLWR-MIN; and (d) ULWR-MIN and the 90th percentile threshold for ULWR-MIN, based on in-situ radiometer measurements at St. A at Lake Kinneret in September 2015.
Remotesensing 16 02314 g005
Figure 6. Vertical temperature profiles from radiosonde soundings at St. Bet Dagan at 12 UTC on (a) 7 September, (b) 8 September, (c) 9 September, (d) 10 September, (e) 11 September, (f) 12 September, (g) 13 September, (h) 14 September, and (i) 15 September 2015.
Remotesensing 16 02314 g006
Figure 7. Comparison between day-to-day variations in daily maximal air temperature (Tair-MAX) in September 2015 and the 90th percentile threshold for Tair-MAX based on in-situ measurements at St. A in Lake Kinneret. On 3 September 2015, there were no in-situ Tair measurements in the daytime due to technical reasons.
Remotesensing 16 02314 g007
Figure 8. (a) Comparison between day-to-day variations in minimal air temperature (Tair-MIN) in September 2015 and the 90th percentile threshold for Tair-MIN, based on in-situ measurements at St. A in Lake Kinneret. (b) Comparison between day-to-day variations in Tair-MIN and its corresponding absolute humidity (ρv) in September 2015 at St. A.
Remotesensing 16 02314 g008
Figure 9. Diurnal variations in the in-situ measured Lake Kinneret SWT from 6 to 11 September 2015.
Remotesensing 16 02314 g009
Figure 10. Comparison between day-to-day variations in (a) maximal Tair (Tair-MAX) and maximal SWT (SWT-MAX), and (b) minimal Tair (Tair-MIN) and minimal SWT (SWT-MIN) in September 2015. (c) Scatterplot between the daily temperature differences for every pair of consecutive days of Tair-MIN in September 2015 and those of SWT-MIN. R2 designates the coefficient of determination, and p designates the significance level of the linear fit.
Remotesensing 16 02314 g010
Figure 11. (a) Comparison between day-to-day variations in in-situ SWT-MAX in September 2015 and the 90th percentile threshold for SWT-MAX, based on in-situ measurements at St. A on Lake Kinneret. (b) Comparison between day-to-day variations in in-situ SWT-MIN in September 2015 and the 90th percentile threshold for SWT-MIN, based on in-situ measurements at St. A.
Remotesensing 16 02314 g011
Figure 12. Day-to-day variations in in-situ SWT, satellite-based MODIS-Terra SWT, and METEOSAT SWT: (a) in the daytime (10 LT–11 LT) and (b) in the nighttime (22 LT–23 LT) in September 2015. The vertical lines designate the uncertainty of METEOSAT SWT.
Remotesensing 16 02314 g012
Figure 13. Comparison between day-to-day variations in (a) daily maximal SWT (SWT-MAX) and daily maximal WT-20 cm (WT-20cm-MAX), and (b) daily minimal SWT (SWT-MIN) and daily minimal WT-20 cm (WT-20cm-MIN), in September 2015.
Remotesensing 16 02314 g013
Figure 14. Comparison between day-to-day variations in (a) daily maximal water temperature at a depth of 20 cm (WT-20cm-MAX) and the 90th percentile threshold for WT-20cm-MAX, and (b) daily minimum water temperature at a depth of 20 cm (WT-20cm-MIN) and the 90th percentile threshold for WT-20cm-MIN, based on in-situ measurements in September 2015, at St. A on Lake Kinneret.
Remotesensing 16 02314 g014
Figure 15. Comparison between day-to-day variations in daily maximal absolute humidity (ρv-MAX) and daily maximal mixing ratio (MIXR-MAX) in September 2015.
Remotesensing 16 02314 g015
Figure 16. (a) Comparison between day-to-day variations in daily maximal absolute humidity (ρv-MAX) in September 2015 and 90th percentile for ρv-MAX, based on in-situ measurements at St. A on Lake Kinneret. (b) Comparison between day-to-day variations in daily ρv-MAX measured at St. A on Lake Kinneret and day-to-day variations in temperature inversion height (based on radiosonde soundings) in September 2015.
Remotesensing 16 02314 g016
Figure 17. Comparison between day-to-day variations in daily maximal absolute humidity (ρv-MAX) in September 2015 and the 90th percentile threshold for ρv-MAX at four meteorological stations: (a) St. A located on the lake (32.82°N, 35.60°E); (b) St. B represents the Ayyellet Hashahar station (33.02°N, 35.57°E); (c) St. C is the Deir Hanna station (32.86°N, 35.37°E); and (d) St. D is the Avne Etan station (32.81°N, 35.76°E). (e) Lake Kinneret region map with the location of meteorological stations.
Remotesensing 16 02314 g017
Figure 18. Correlation coefficients between SWT-MAX and ρv-MAX during the period of 7 to 17 September in 2013, 2014, 2015, 2016, and 2017. The vertical lines designate the standard error of the correlation coefficient. One can detect the absence of a correlation between SWT-MAX and ρv-MAX in September 2015.
Remotesensing 16 02314 g018
Disclaimer/Publisher’s Note: The statements, opinions and data contained in all publications are solely those of the individual author(s) and contributor(s) and not of MDPI and/or the editor(s). MDPI and/or the editor(s) disclaim responsibility for any injury to people or property resulting from any ideas, methods, instructions or products referred to in the content.