Article

Land-Use Composition, Distribution Patterns, and Influencing Factors of Villages in the Hehuang Valley, Qinghai, China, Based on UAV Photogrammetry

by
Xiaoyu Li
1,2 and
Zhongbao Xin
1,2,*
1
School of Soil and Water Conservation, Beijing Forestry University, Beijing 100083, China
2
Jixian National Forest Ecosystem Observation and Research Station, CNERN, School of Soil and Water Conservation, Beijing Forestry University, Beijing 100083, China
*
Author to whom correspondence should be addressed.
Remote Sens. 2024, 16(12), 2213; https://doi.org/10.3390/rs16122213
Submission received: 18 April 2024 / Revised: 31 May 2024 / Accepted: 15 June 2024 / Published: 18 June 2024

Abstract

:
Rapid changes in land use have rendered existing data for land-use classification insufficient to meet the current data requirements for rural revitalization and improvements in the living environment. Therefore, we used unmanned aerial vehicle (UAV) remote sensing imagery and an object-based human-assisted approach to obtain ultra-high-resolution land-use data for 55 villages and accurately analyzed village land-use composition and distribution patterns. The highest proportion of land use in the villages is built-up land (33.01% ± 8.89%), and the proportion of road land is 17.76% ± 6.92%. The proportions for forest land and grassland are 16.41% ± 7.80% and 6.51% ± 4.93%, respectively. The average size of the villages is 25.85± 17.93 hm2, which is below the national average. The villages have a relatively scattered distribution, mostly concentrated on both sides of the main roads. The correlation analysis indicates that mean annual temperature (MAT) and annual precipitation (AP) are the primary factors influencing the land-use composition of villages, with contribution rates of 50.56% and 12.51%, respectively. The use of UAV remote sensing imagery to acquire ultra-high-resolution land-use data will provide a scientific basis for the planning of the living environment in the villages of the Hehuang Valley.

1. Introduction

The Nineteenth National Congress of the Communist Party proposed the strategy of “rejuvenation of villages” [1], which is defined as “prioritizing rural development, and advancing rural modernization in line with the overall requirements of thriving industries, livable ecology, rural civility, effective governance, and prosperous livelihoods” [2]. It is a significant task that will be historical in achieving a moderately prosperous society and building all aspects of a modernized socialist country [3]. In response to the national call for rural revitalization, Qinghai Province launched a three-year action plan to improve the environment of rural human settlements in 2018 and rolled out a five-year action plan for further enhancement by the end of 2021. Strong village planning guidance enables rural construction to continuously improve the environment of human settlements and accelerates the development of beautiful countryside on the plateau [4].
Continuously improving rural living environments is a long-term task for rural revitalization in Qinghai Province. The Hehuang Valley, located in the northeastern part of Qinghai Province, is a key area for these improvements because it is a relatively low-elevation human settlement and a major agricultural production area [5]. With the rapid pace of Hehuang Valley construction, significant changes in the underlying surface have been observed. To fully understand the local ecology, resources, environment, and agricultural production, and hence formulate relevant macro policies, it is necessary to clarify the characteristics of land use in the Hehuang Valley given its rapid economic and social development [6,7]. Monitoring land use at ultra-high resolution using remote sensing is a critical strategy for protecting resources and sustainable regional development [8,9].
Understanding the accurate spatial distribution of land use is the foundation of modern land resource management [10]. Therefore, precise land-use classification is a key research topic in territorial resource remote sensing [11]. Currently, multispectral satellite images are commonly used as the data source for extracting land-use information [12,13]. Brown [14] used deep learning on 10 m Sentinel-2 imagery to enable global high-resolution, near-real-time (NRT) land-use and land-cover classification, eliminating the lag times between image processing and dataset release. Thanh [15] conducted land-use classification research on Landsat 8 surface reflectance (L8 sr) data using the random forest algorithm on the GEE platform, achieving an accuracy of 84.31%. Hossein [16] utilized Landsat-8 multi-temporal data to generate a 30 m LULC map of the Tigris–Euphrates Basin (TEB) based on object-based classification and the SNIC algorithm on the GEE platform. However, because of limitations such as data acquisition costs, spatial resolution, and revisit periods, commonly used satellite data cannot identify detailed surface features at a fine scale [17], and the data acquisition is highly dependent on the weather conditions during satellite overpasses, which limits both real-time availability and accuracy [18].
In recent years, low-elevation unmanned aerial vehicle (UAV) remote sensing technology has rapidly developed, offering advantages such as high flexibility, simple operation, high spatial resolution, and the ability to operate below cloud cover [19]. This technology has thus overcome the practical limitations of traditional satellite remote sensing and become the primary means of obtaining remote sensing data for small-area land use [20]. When drone images are used for land-use classification, compared with medium- and low-resolution remote sensing images, high-resolution drone images contain richer information such as textures, shapes, and contextual relationships, which can be used to construct classification features for visible light images [21,22]. Yan [23] built a multi-angle hyperspectral remote sensing system using drones and employed object-based classification methods to classify vegetation at a high resolution from high-resolution drone images. Ealmin [24] used a multi-sensor data fusion model based on UAVs that utilizes deep convolutional neural networks to provide accurate land-cover classification results at low cost. Taposh [25] used the KNN machine learning algorithm to perform object-based land-use classification on multispectral UAV images of farmland, achieving an accuracy of up to 94.9%. However, most current research on using UAV remote sensing to obtain the composition of land use focuses on moderate scales (at the county or township level) or at very small scales (e.g., communities of parks). There is little research that utilizes ultra-high-resolution data at the village scale to specifically analyze the land-use composition of villages. In addition, previous studies have had a small sample size, lacking representativeness, and cannot ascertain the rules of village land-use composition across the entire region. Lastly, past research has been limited, only focusing on either the analysis of land-use composition and the influencing factors of land use by using low-precision land-use data, without fully leveraging ultra-high-precision land-use data to conduct in-depth and comprehensive analyses.
This study conducted investigations on 55 scattered villages in the Hehuang Valley of Qinghai Province to address the shortcomings of a focus on single villages and concentrated distributions in previous research. The objective of this study is to acquire an ultra-high-resolution dataset on the land use of villages, enabling a quantitative analysis. This analysis aims to precisely identify the land-use composition of villages, and their distribution patterns, and explore the primary factors influencing land-use composition. Based on these findings, scientific recommendations can be provided for village planning and improving living environments. To the best of our knowledge, this is the first time that a large sample of high-precision land-use data for villages has been obtained in western China, analyzing the land-use composition, distribution patterns, and influencing factors of villages in densely populated plateaus. The results of this study are expected to contribute to optimizing village land use and provide data support for village living environment assessment and improvement. This will effectively support the implementation of the rural revitalization strategy.

2. Study Area and Data Source

2.1. Study Area

The Hehuang Valley, located in the northeast of the Tibetan Plateau in China at middle latitudes, has a total area of 4.15 × 10⁴ km2 and an average elevation of 3100 m [26]. Nearly 60% of the arable land and more than 70% of the population in Qinghai Province are located in the Hehuang Valley, which is a suitable environment for humans and an economically intensive area in Qinghai Province [27] (Figure 1). The administrative region includes 16 counties and districts, including Xining City, Haidong City, and Hainan Tibetan Autonomous Prefecture. The topography in Hehuang Valley is varied and includes hills, plateaus, basins, and plains. It is a typical plateau continental climate with obvious seasonal differences [28]. The natural resources are diverse and consist mainly of alpine meadows and forest shrubland scattered along the sides of the valley, whereas cropland and cities are concentrated in the flat regions.
Based on the division of natural areas in the Hehuang Valley, we selected 55 representative villages with relatively well-developed economic and cultural centers from the northern, central, and southern regions for research. The chosen villages extend from the outskirts of cities outward, with equidistant spacing within the same region. These villages encompass human settlements with different development levels, including county seats, townships, and rural areas. They are situated in different types of terrain such as valleys, mountainous regions, and plains. Through comprehensive design and considerations, the selected villages exhibit excellent representativeness. They can reflect the overall situation of villages in the Hehuang Valley and ensure the objectivity and scientific integrity of the data sources.

2.2. Data Source

2.2.1. UAV Remote Sensing Data

The dataset used in the study was the 2022 Hehuang Valley Land-use Remote Sensing Monitoring Database. This dataset was collected using a Dajiang Mavic2pro (Dajiang, China) equipped with a Hasu L1D-20c camera for UAV imaging. The images were collected from July to August 2022. The images have three bands of red, green, and blue, with a resolution of 0.05 m. The field flight plan was determined based on the area, working time, and required data accuracy. The orthophoto images were synthesized using Agisft PhotoScan 1.25, and the spatial resolution was 0.05 m.

2.2.2. Satellite Remote Sensing Data

Based on satellite remote sensing data, we obtained mean annual temperature (MAT), annual precipitation (AP), elevation, and nighttime light index of 55 villages in 2022 as influential factors. Specifically, this research utilizes the 30 m resolution Digital Elevation Model (DEM) provided by the National Aeronautics and Space Administration (NASA) of the United States (https://earthdata.nasa.gov/esds/competitive-programs/measures, accessed on 2 April 2024). The MAT and AP data are processed, based on monthly dataset with a 1 km resolution released by Peng in National Tibetan Plateau/Third Pole Environment Data Center [29,30]. The nighttime light data are obtained from NPP-VIIRS-like Nighttime Light dataset published by Chen with a resolution of 500 m [31].

2.2.3. Statistical Data

Our team conducted field investigations in 55 typical villages in the Hehuang valley of Qinghai Province from 5 July to 10 August 2022. By visiting local governments, we obtained precise village population and per capita income data. This solves the issue of statistical data in plateau areas only being precise up to the county level, lacking population and per capita income data at the village level.

2.3. Data Processing Methodology

Multiresolution segmentation was used to segment the UAV remote sensing images with three spectra. Different land-use types with different features were selected as training samples to extract their spectral, texture, and spatial features. Based on different combinations of spectral, texture, and spatial feature indicators, land use was classified using the k-nearest neighbors (KNN) classifiers. Finally, using visual interpretation by researchers, the classification results were corrected to improve classification accuracy. The study process is shown in Figure 2.

2.3.1. Classification System

By referring to the land-use distribution in China [32] and comprehensively understanding the landscape features of the study area, the land-use types were classified into seven categories: forest land, grassland, cropland, water, bare areas, road land, and built-up land, which was based on the overall distribution of land use and the separability of remote sensing images. This classification system is similar to that of China Land Cover Dataset (CLCD) [33].

2.3.2. Image Segmentation

The core of the object-based human-assisted approach is to use “objects” as the basic element for the feature extraction and analysis. Therefore, the primary task of this research was image segmentation, which is directly related to the accuracy of subsequent feature extraction. Multiresolution segmentation is the process of establishing rules for classification based on spectral, texture, and shape features. Images are segmented into many homogeneous pixels composing image objects. The multiscale segmentation process is a bottom-up, loop region merging technique that starts with pixels as the basic units. The new information generated during each cutting process of the loop is used for the next cutting. During the loop process, which is a continuous optimization process, smaller objects are merged into larger objects, and after multiple merges, homogeneous objects with similar properties are synthesized. The attributes and features within the image segmentation object have a high degree of homogeneity, while there is a high degree of heterogeneity between adjacent objects and other objects. This study used the estimation of scale parameters (ESP) to determine the optimal segmentation scale for features by calculating the rate of change in local variance (ROC-LV) curve derived from the local variance (LV) of the object. The initial segmentation scale was defined based on the spectrum, shape, and background, and then the method iterated through the segmentation scale 1, 10, 100, and bottom-up calculations were performed using multiscale segmentation algorithms.

2.3.3. Feature Extraction

Texture, which is an important feature in high-resolution remote sensing images, was described using the grayscale cooccurrence matrix (GLCM). The GLCM extracts texture features using the feature values of image statistics to describe texture features. It not only describes the grayscale distribution characteristics of the image, but also considers the position distribution characteristics between pixels with similar grayscale levels. Therefore, GLCM can be applied to simulate the spectral and spatial contextual features of pixels in images, revealing the internal spatial distribution characteristics of objects.

2.3.4. Classifier Selection

Common classifiers include k-nearest neighbors (KNN), support vector machines (SVM), classification and regression trees (CART), and random trees (RT). While CART offers faster classification speed but lower accuracy. RT is well-suited for classifying large sample sizes. Both KNN and SVM are effective for small sample sizes, but KNN has several advantages over SVM. KNN’s principles are mature and easy to understand; it enables fast model training, and it requires fewer parameter adjustments. Consequently, KNN is particularly suitable for classification tasks involving a large number of samples with smaller individual sizes. Therefore, this study selected the KNN classifier for classification [34]. Specifically, KNN is an important technique in the field of data mining, which discovers classification models from a set of known training samples. The basic idea of KNN is to use a majority voting strategy based on Euclidean distance and determine the category of unknown samples by calculating the average of the variables closest to the unknown samples from among the K adjacent training samples. The closer in feature space an image object is to the sample of a class, the higher its membership of that class, and the best classification result is the one with the highest membership value.
After multiscale segmentation, samples including forest land, grassland, cropland, water, bare areas, road land, and built-up land were manually delineated. The different land-type features of the training samples were statistically analyzed, and a multi-dimensional feature space was constructed based on these features. The distance in feature space between each unclassified object and the nearest sample object was calculated, and this was used as the membership degree of the unclassified object to that category, Finally, it was determined whether the object belonged to the same category as the training sample.

2.3.5. Rural Land Classification

Using the GLCM, eight texture features were generated, and the variance, contrast, angular second moment, and correlation texture features were selected as input layers based on the Pearson correlation coefficient. The peak value of the ESP local variance change rate was used as the optimal segmentation scale reference value, and multiple peak values were obtained. The multiscale segmentation method only needs a unique scale parameter before verification. The color and shape factors were determined by controlling a single variable for experimentation, constant verification, and parameter determination. Finally, the segmentation parameters were set to 60, the band weights were 1:1:1, and the color and shape factors were set to 0.5 and 0.4, respectively. The land-use classification result was obtained based on the RGB bands of the UAV and nearest neighbor classifier.
However, this classification result may have some minor flaws, and we can correct them through manual visual interpretation. Specifically, it involves comparing the classification result with the original image and manually editing the incorrectly classified objects to the correct categories. In these ways, we can obtain a relatively accurate ultra-high-precision land-use classification result.

2.3.6. Evaluation of the Accuracy

Image classification accuracy mainly refers to the degree of match between the result and actual surface conditions. A confusion matrix represents the percentage of correctly classified pixels to total pixels. From the confusion matrix, the misclassification and omission errors of each category can be intuitively obtained, and the user accuracy (UA), producer accuracy (PA), and overall accuracy (OA) can be calculated. This method is currently the most widely used classification accuracy evaluation.

2.4. Analytical Methods

2.4.1. Redundancy Analysis

Redundancy analysis (RDA) is a PCA analysis of the fitted values matrix from the multiple linear regression between the response variable matrix and explanatory variable matrix. It can visually describe the impact of different factors on the land-use composition. The contribution rate reflects the importance of each factor on the land-use composition, enabling a quantitative analysis of the impact of different factors on the land-use composition and clarifying the extent of influence of each factor on the land-use composition [35].

2.4.2. Shape Index

The shape index is a geometrically derived value to distinguish similar and dissimilar objects from a morphological aspect. It measures the deviation in area between a polygon and its equal-perimeter circle. A circle is used because it is generally assumed to be the most compact shape.
C I = A A E P C
In this equation, CI represents the circularity index, A represents the area of the villages (m2), and AEPC represents the area of the equal-perimeter circle (m2). A larger CI value indicates a more compact village distribution.

3. Results

3.1. Assessment of Classification Accuracy

In representative villages in the Hehuang Valley area, a large number of ultra-high-resolution images, investigation records, and real-scene photos were obtained based on original images taken by drones and inspections. Stratified random sampling was conducted based on the types and quantities of land-use classification results. A total of 1050 sampling points were extracted within different land-use types in 55 villages in the Hehuang Valley. A comparison analysis was performed between the types classified based on the sampling data and the validated ground truth data to assess the accuracy of remote sensing interpretation. The accuracy of the data was quantitatively evaluated using the confusion matrix method, with main indicators including UA, PA, OA, and Kappa coefficient. The closer the indicators are to one, the higher the accuracy. Sample verification accuracy for the 55 villages in the Hehuang Valley area is shown in Table 1.
The accuracy evaluation indicates that the OA of land-use classification mapping for the 55 villages in the Hehuang Valley is 96.86%, with a Kappa coefficient of 0.95. The UA of Built-up Land, Road Land, and Bare Area is above 96%. The UA for other land-use types reaches above 94%. Therefore, it can be concluded that the ultra-high-precision land-use dataset for the 55 villages in the Hehuang Valley area is able to meet accuracy requirements.

3.2. Rural Land-Use Composition

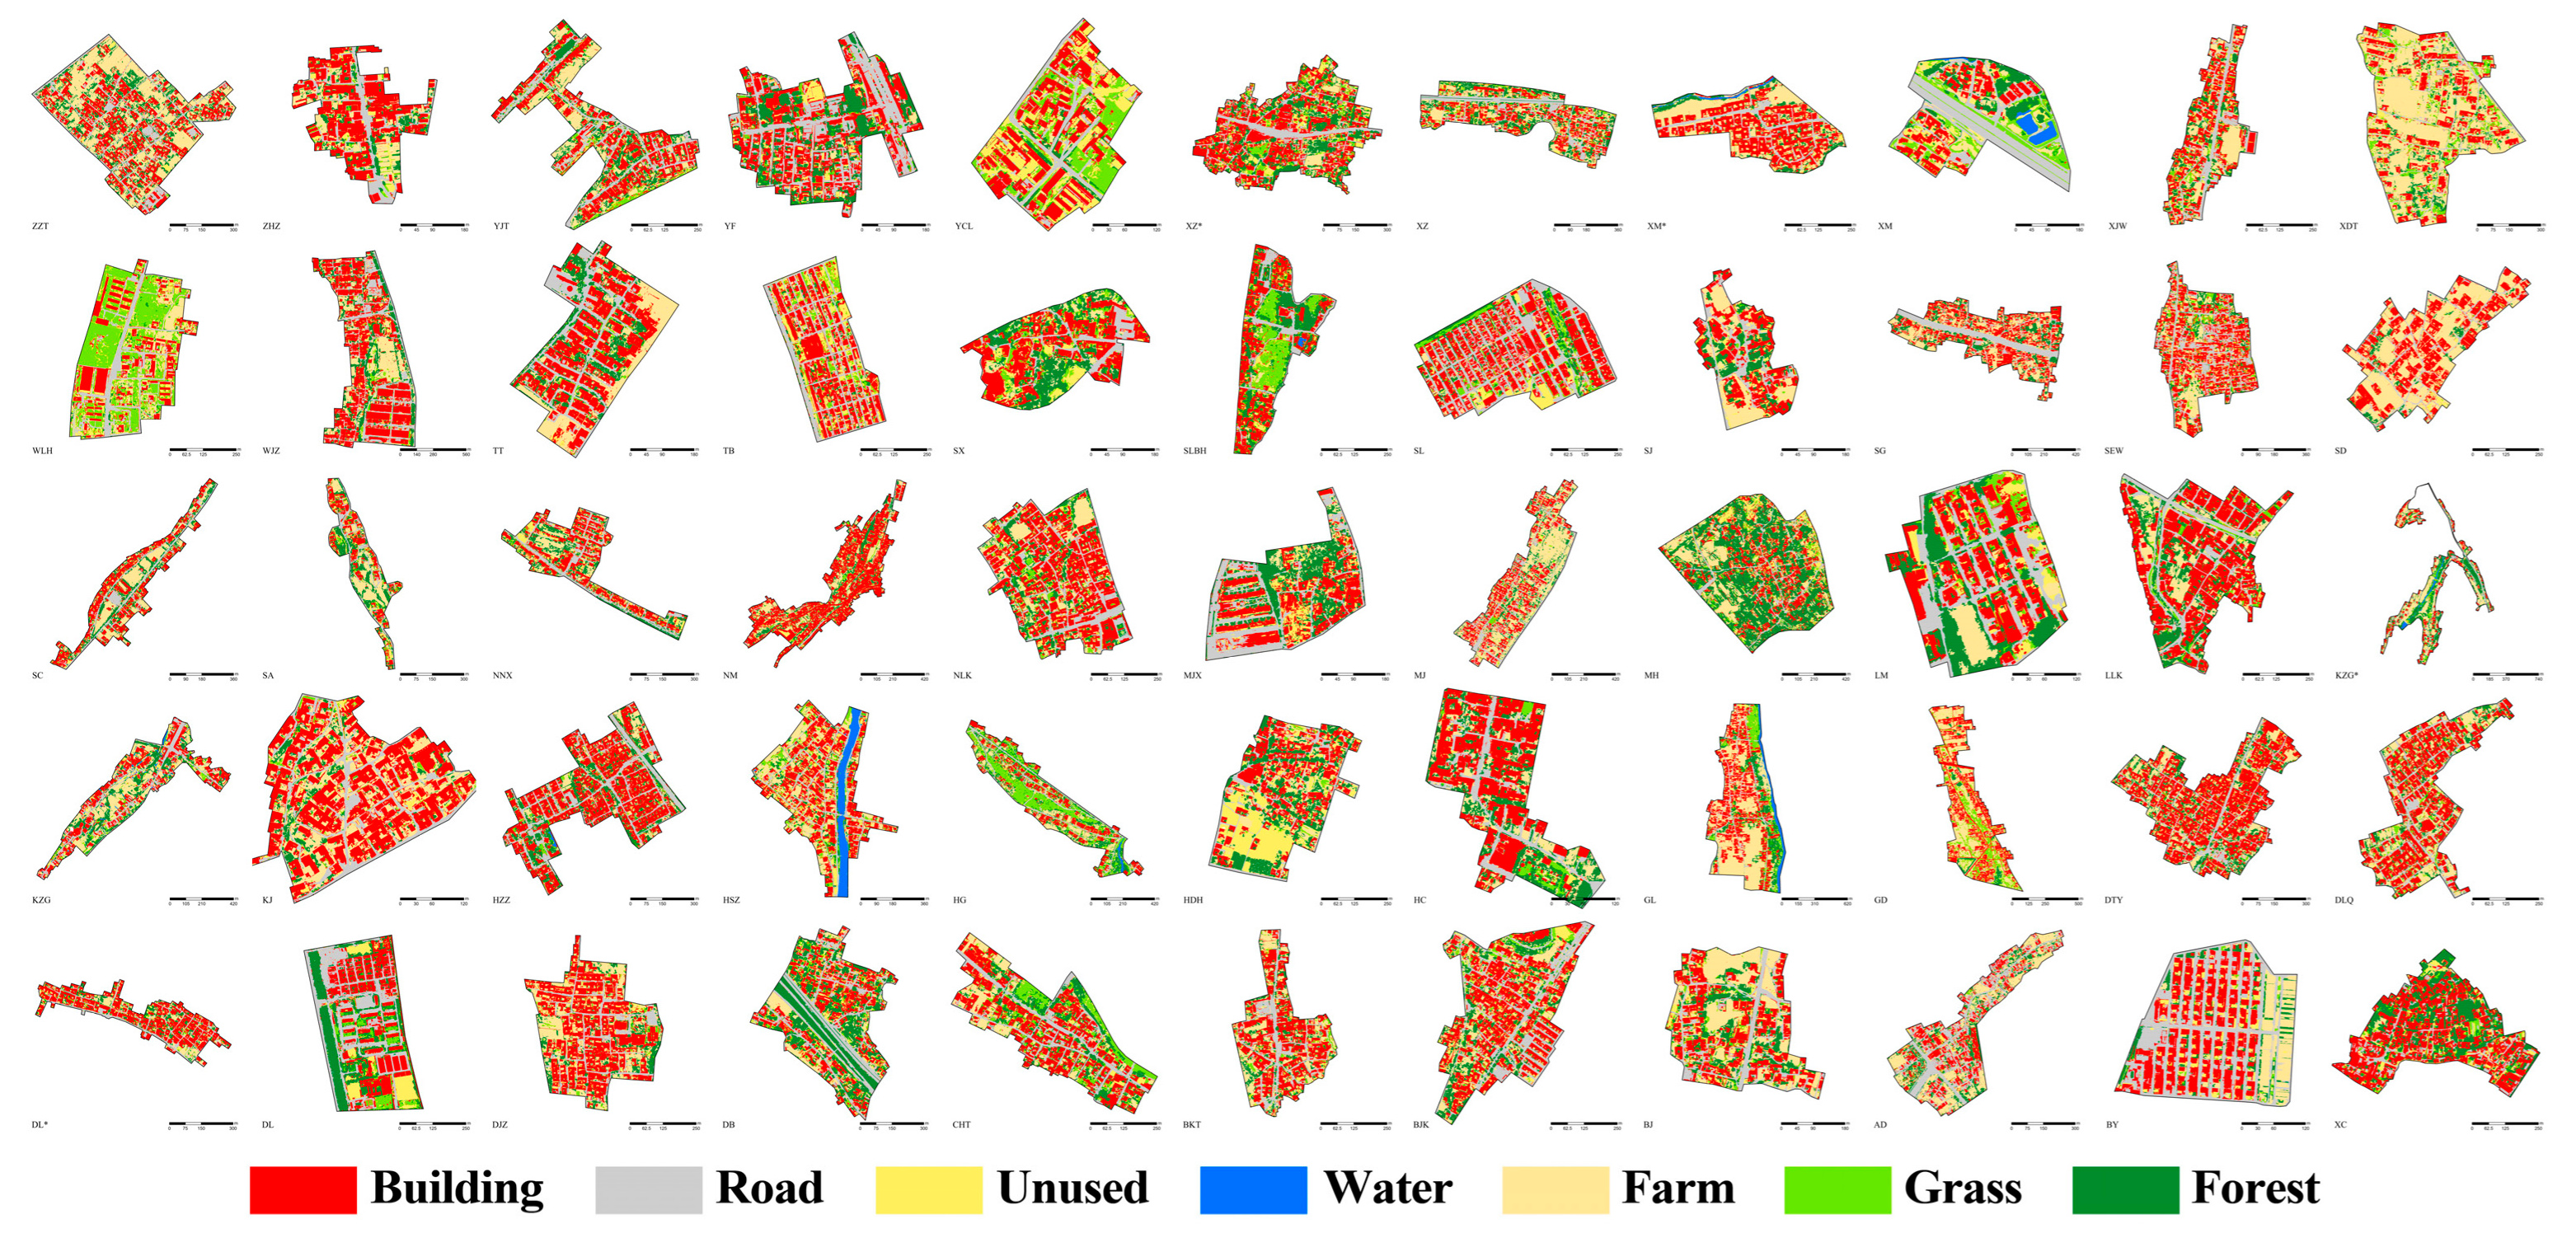
The 55 representative villages in the Hehuang Valley are similar in scale, with an average area of 25.85 ± 17.93 hm2, which is below the national average. The largest village area is 90.75 hm2, whereas the smallest is 6.63 hm2. Analysis reveals that the primary land-use types in the villages are forest land, grassland, cropland, road land, water, bare area, and built-up land (Figure 3). In impermeable layers, built-up land occupies the highest proportion (33.01% ± 8.89%), followed by roads (17.76% ± 6.92%), and bare area occupies the lowest proportion (only 6.51% ± 4.93%). In the representative villages of the Hehuang Valley, the vegetation cover (the sum of forest land, grassland, and cropland) exceeds 40%; the proportion of forest land is 16.41% ± 7.80%, followed by grassland at 6.19% ± 6.48% (Table 2).
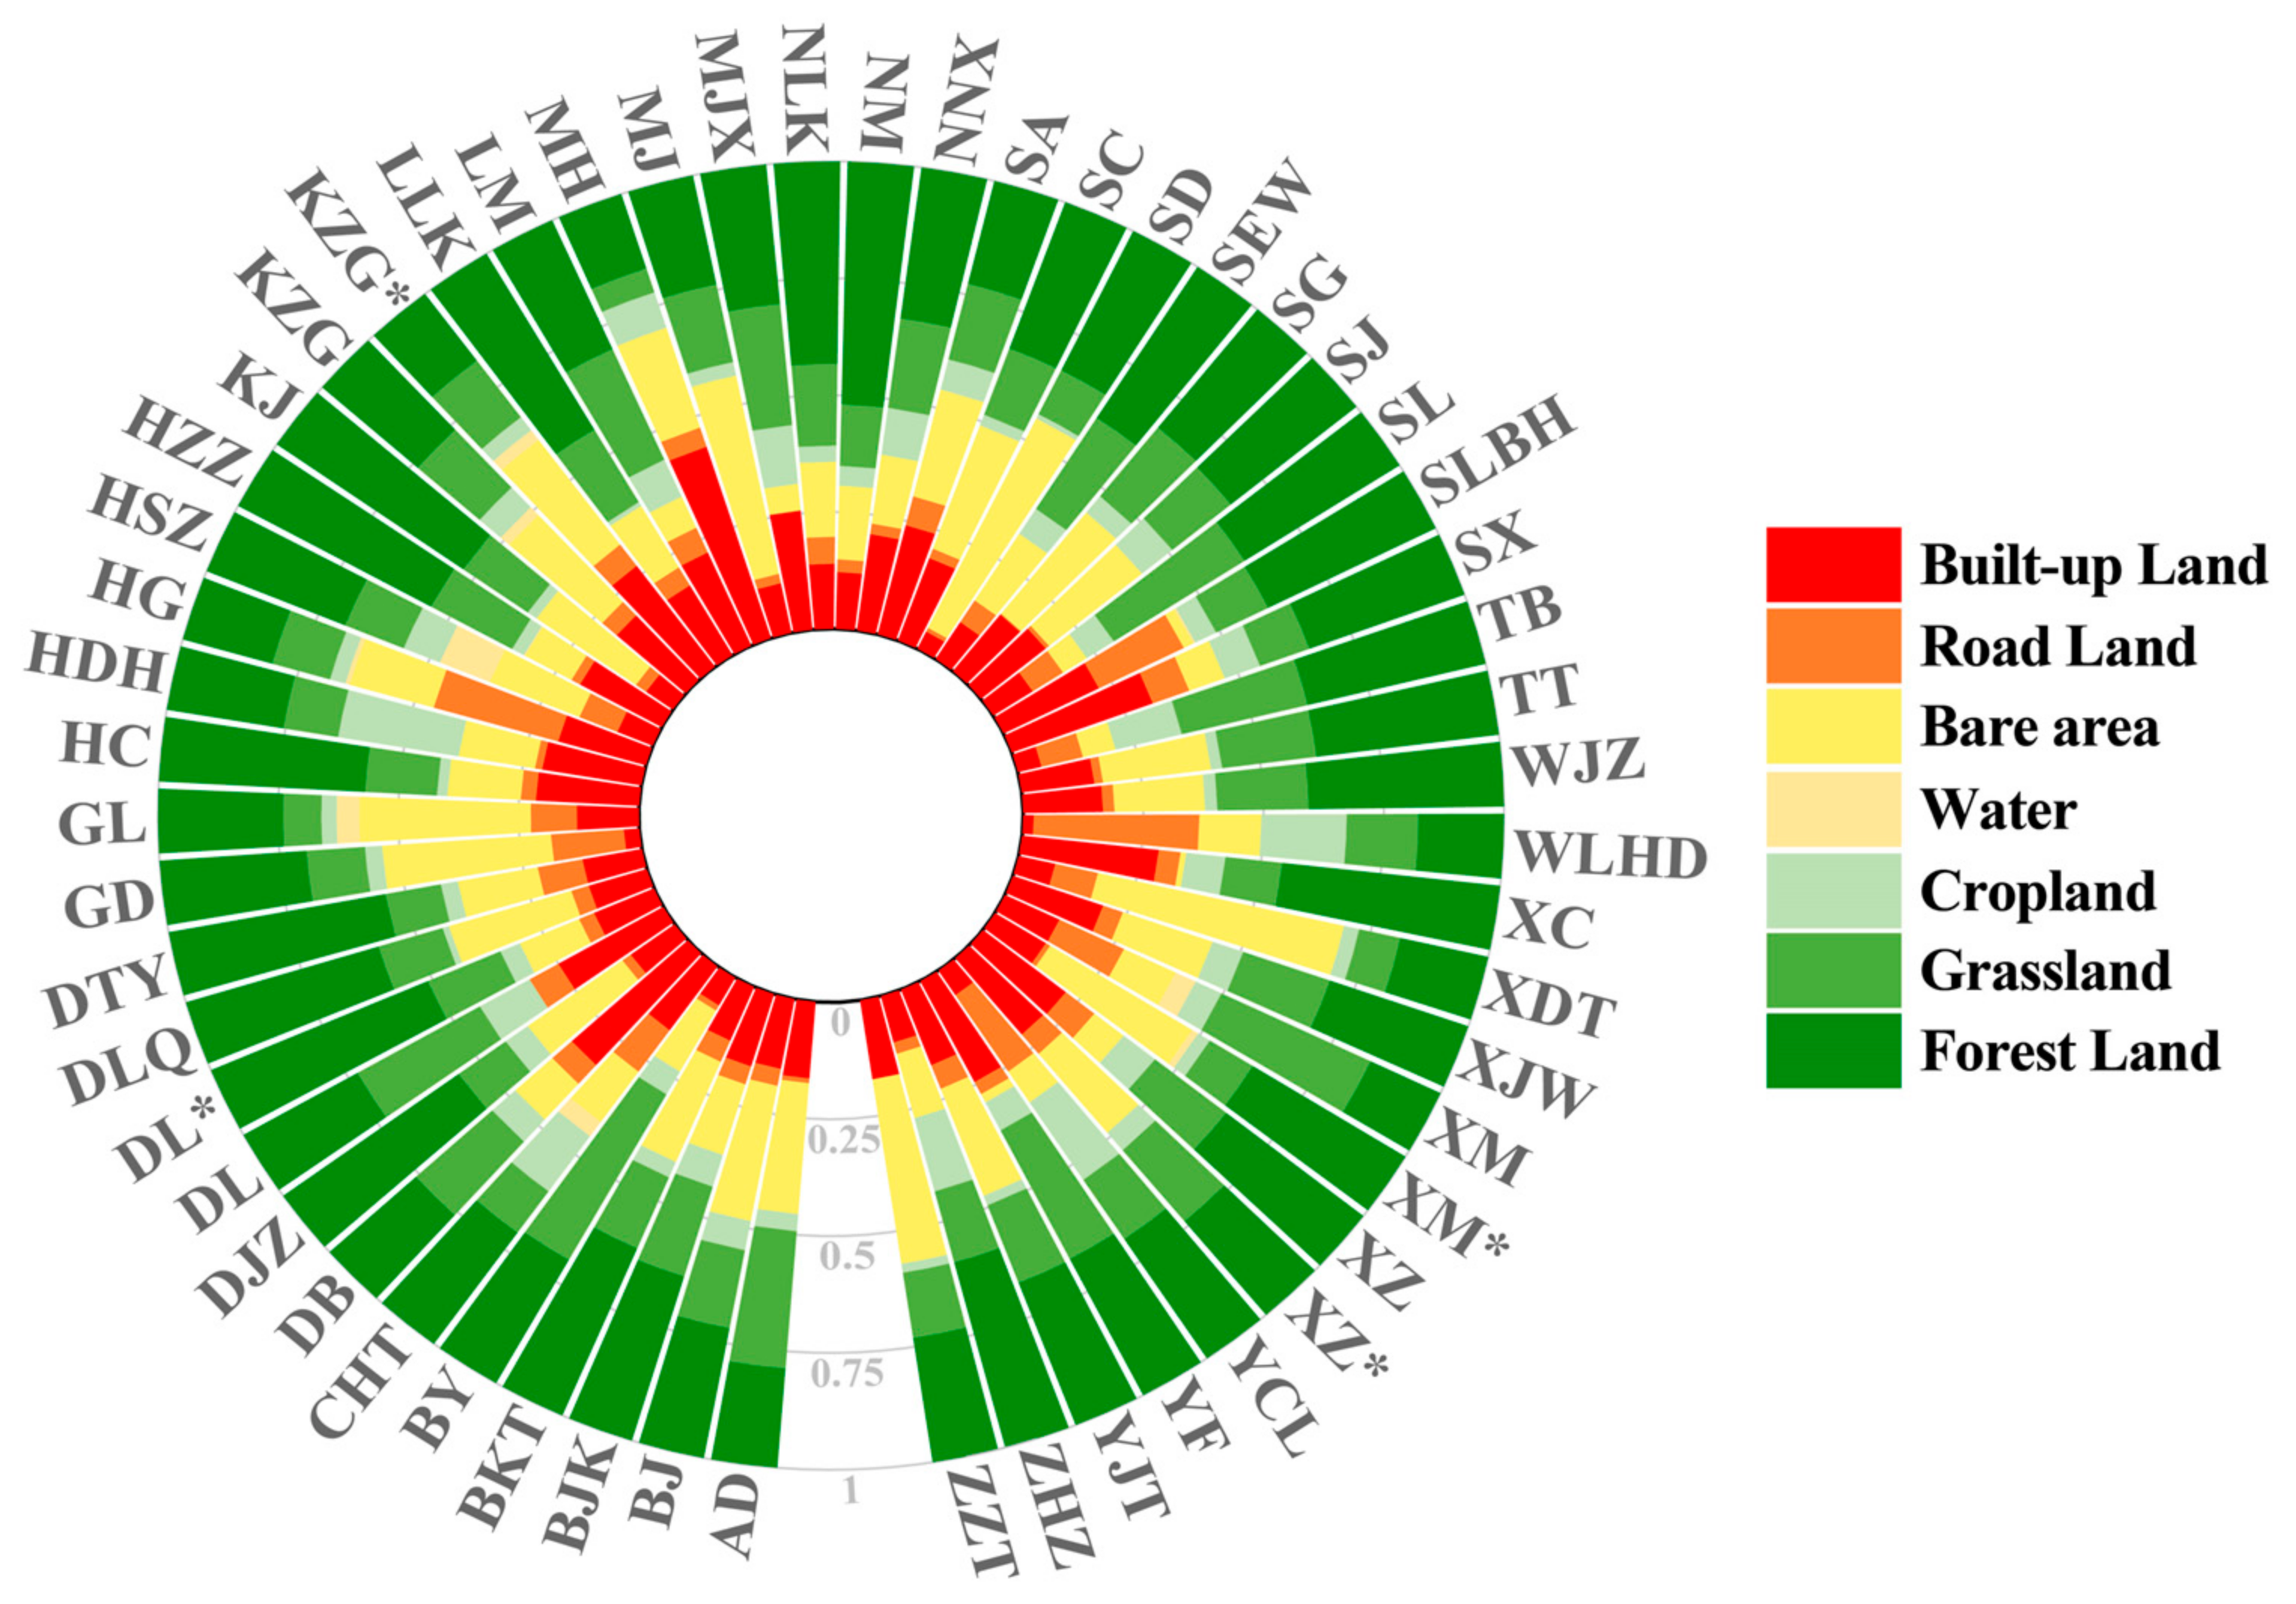
Specifically, most villages with a high proportion of forest land are distributed in the southern area of the Hehuang Valley (43.05%), which is closely related to the higher local AP (Table 2). Villages with a high proportion of cropland and grassland are mainly distributed in the central and northern parts of the Hehuang Valley, mainly because of the flat terrain, which facilitates the development of agriculture and animal husbandry. Areas with a high proportion of built-up land and roads are mainly distributed in the central part of the Hehuang Valley, mainly because of the lower elevation, convenient transportation, high population density, and concentrated distribution of village houses. Bare areas do not exhibit any concentrated distributions, and their spatial differentiation is not significant (Figure 4).

3.3. Village Distribution Patterns

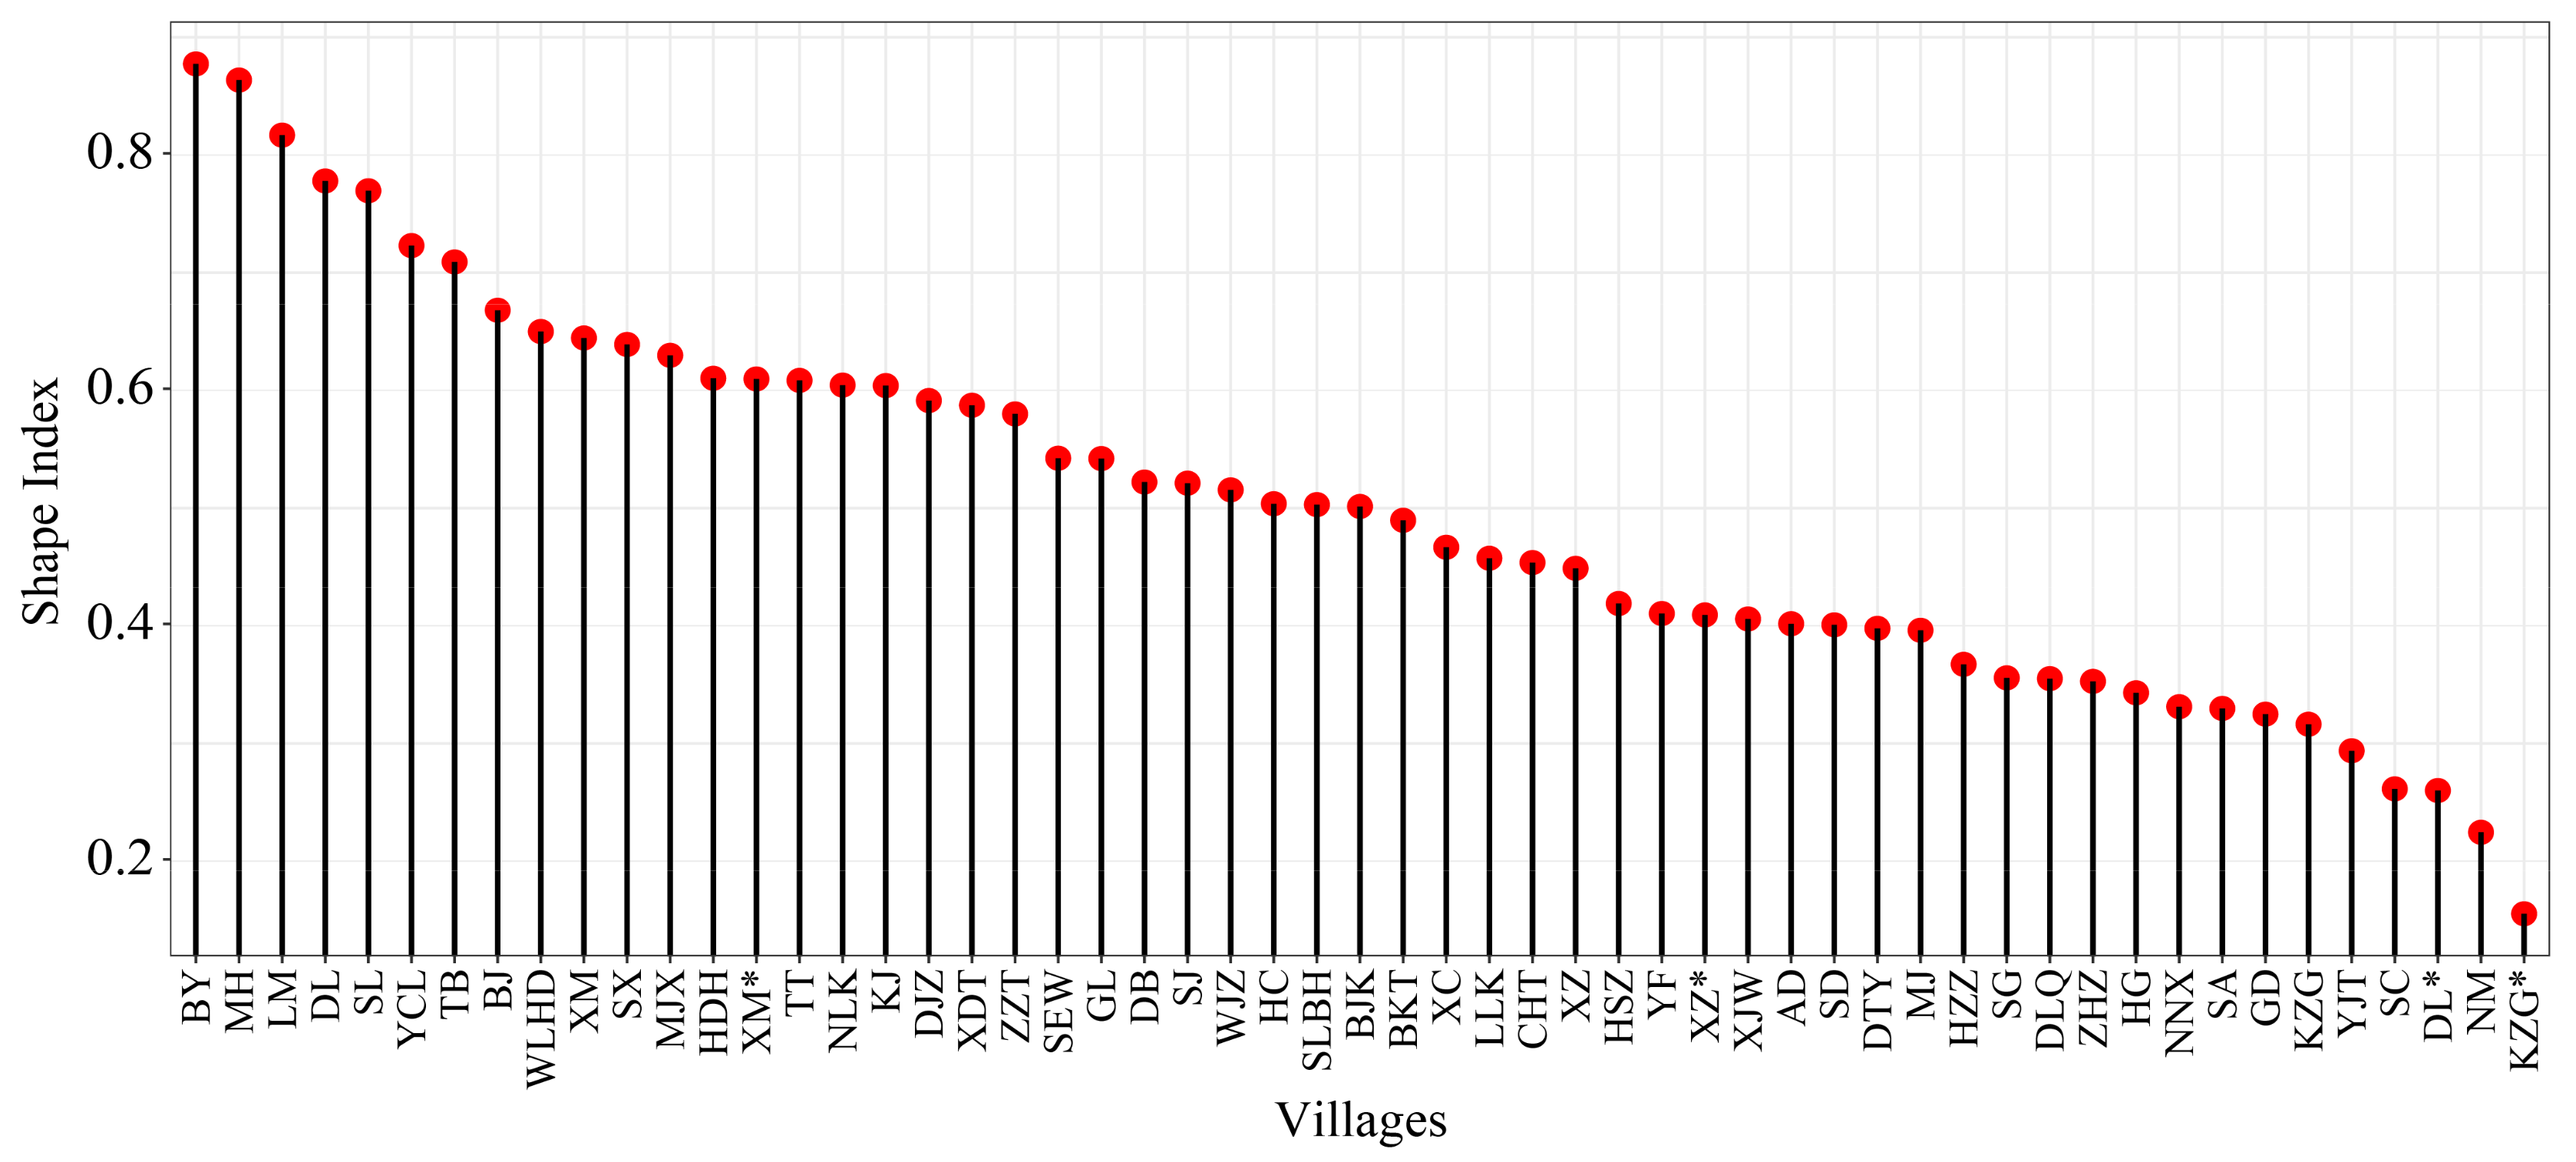
The morphological index for each village was calculated to clarify its specific compactness. The study found that the spatial form of villages is influenced by factors such as terrain, environment, transportation, and industry, with an average CI of 0.4, which is generally somewhat dispersed. Most villages are distributed on both sides of a major road, with good accessibility, and there are relatively few villages with rivers running through them (Figure 5). This result provides a data source and scientific basis for the classification of village spatial forms, composition, and layouts.

3.3.1. Distribution Characteristics

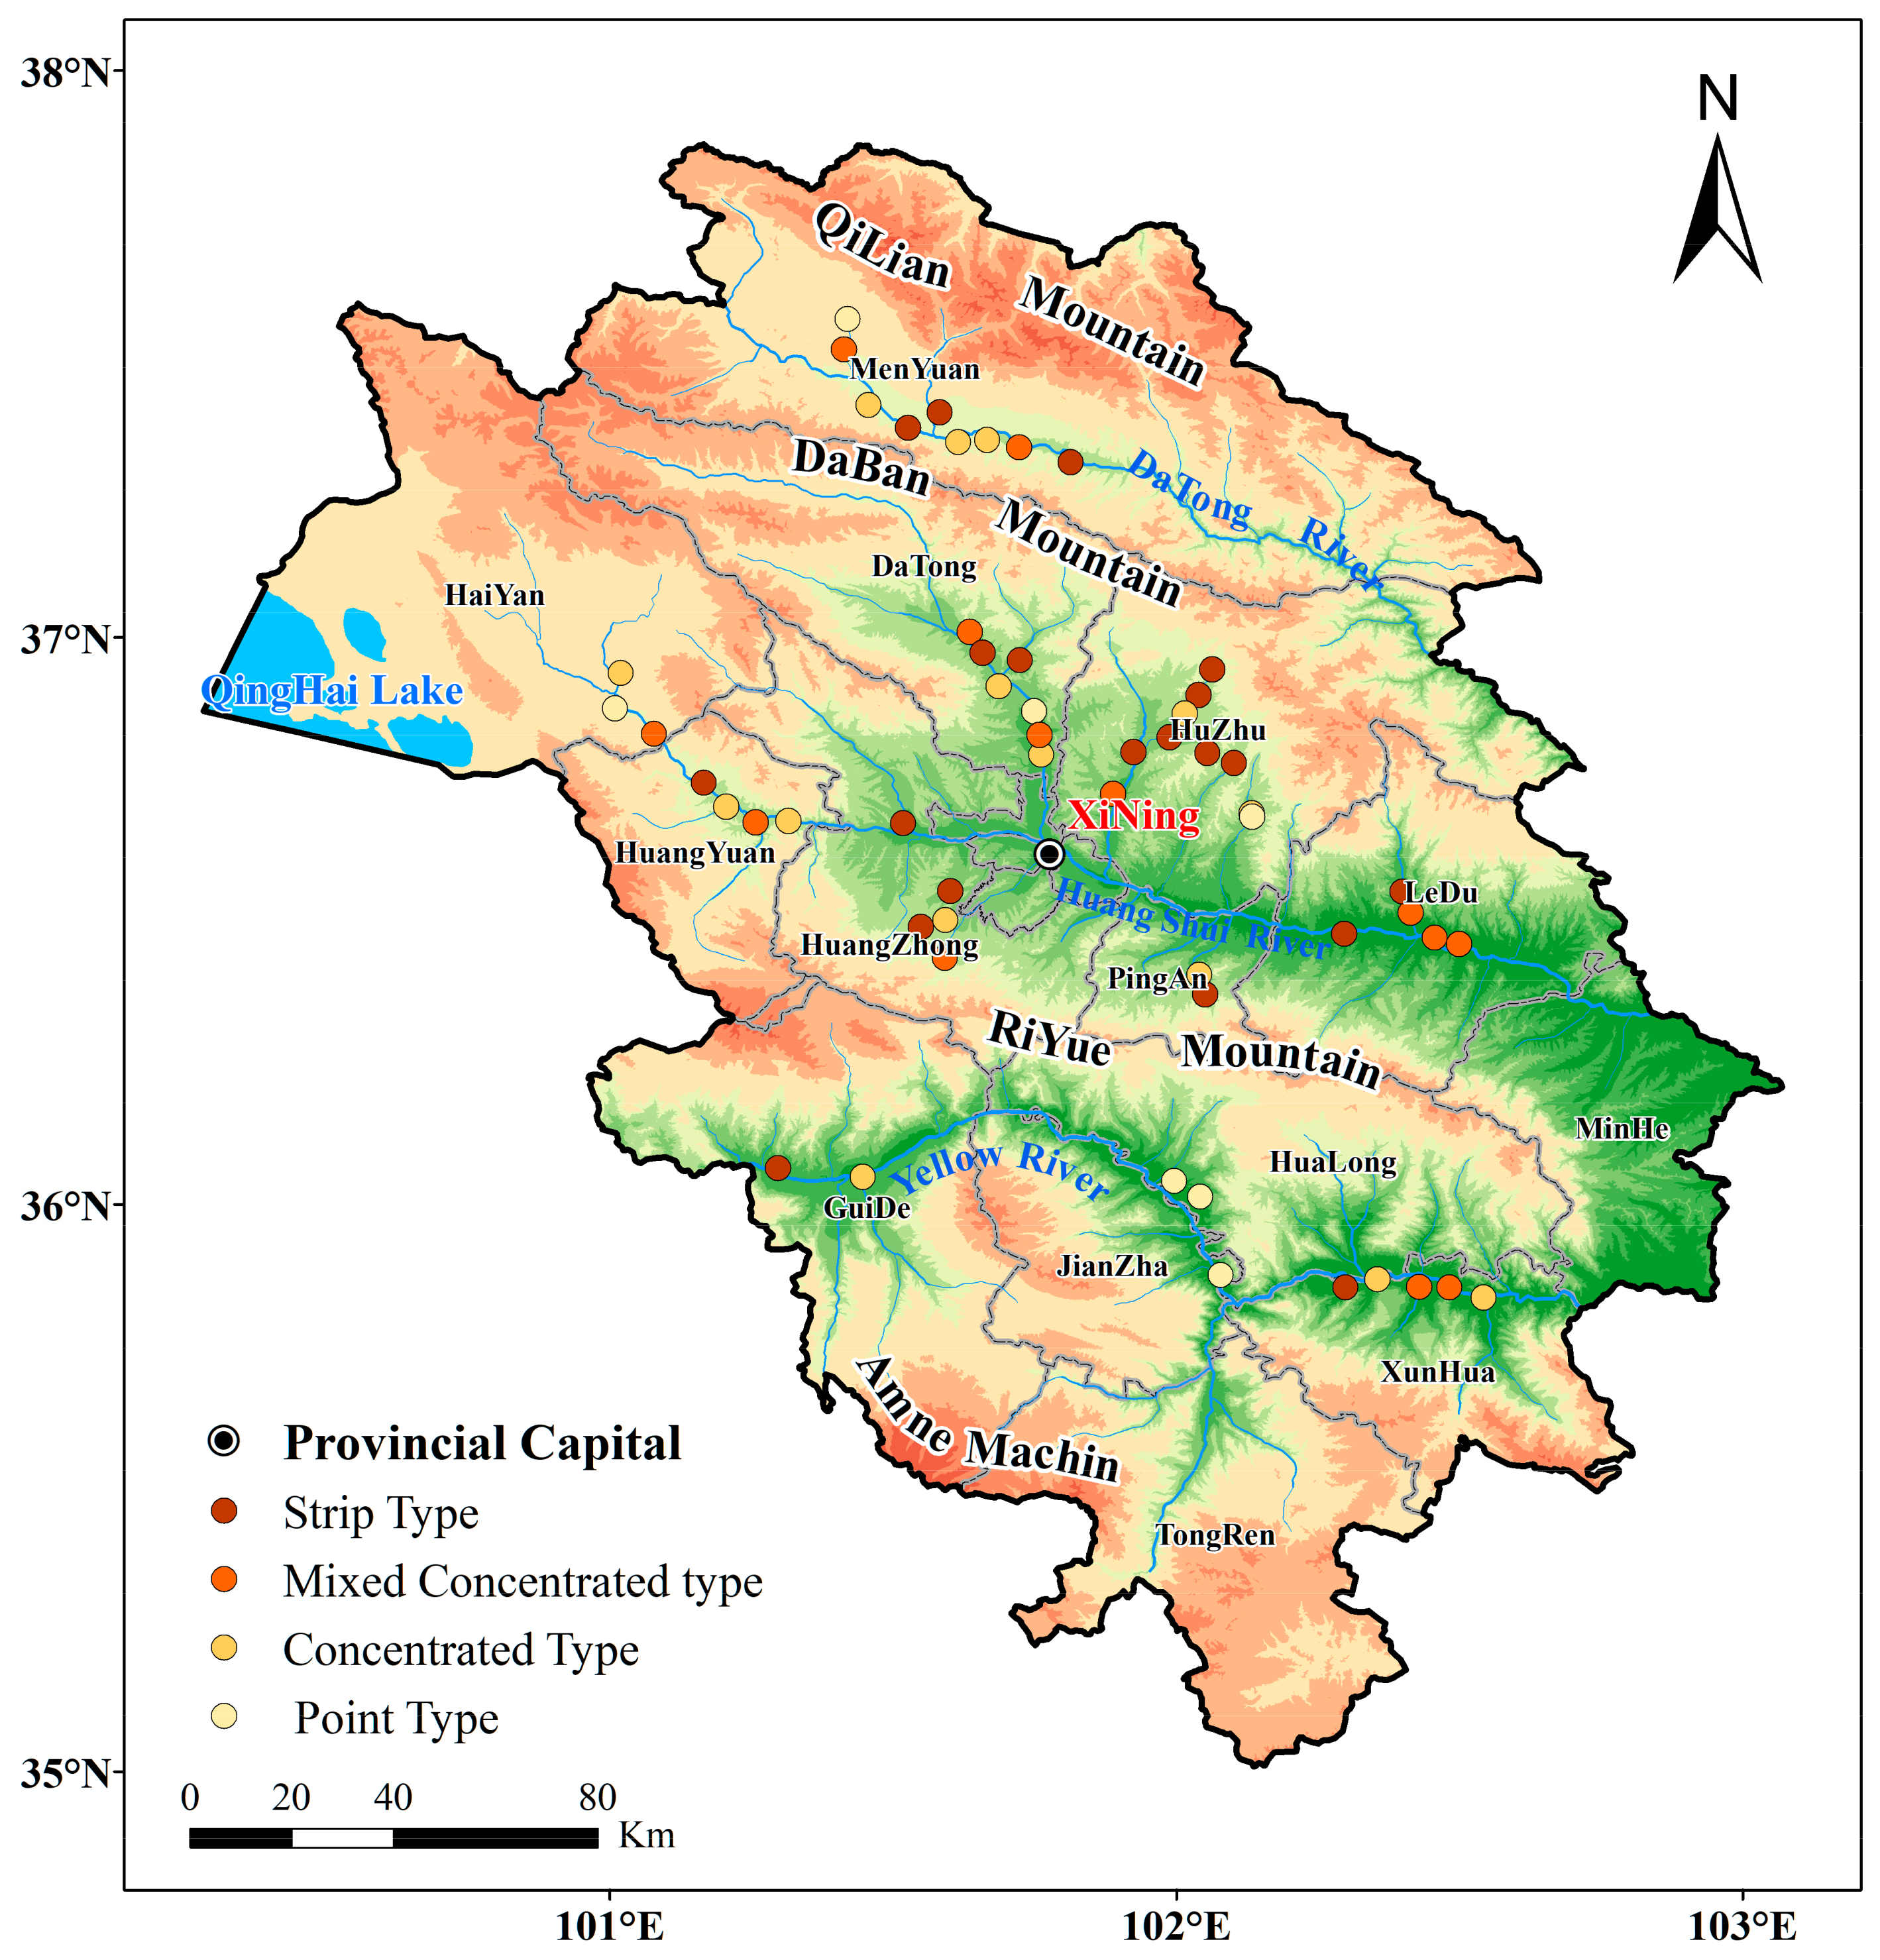
The distribution patterns of villages at the edges of the Hehuang Valley can be divided into four types: strip, mixed-concentrated, concentrated, and point (Figure 6). The distribution patterns of the strip-shaped villages are mainly constrained by transportation or rivers, and these villages are distributed among them. The distribution patterns of mixed-concentrated villages are mixed-centralized layouts due to diverse industrial functions and hindered development space. Concentrated villages are affected by industrial development, with a clear and single industrial function and clear spatial boundaries. The distribution patterns of point-shaped villages are constrained by terrain and have the characteristics of a flexible layout, dispersion, and good environmental coordination.

3.3.2. Diverse Structure of Pattern

Research has found that the distribution patterns of villages in the Hehuang Valley have diverse structural patterns. According to the influencing factors of village distribution patterns, their structures can be divided into green space or residential space (Table 3). The distribution patterns of green spaces mainly refer to road green spaces, water green spaces, and protective green spaces in villages, which have a significant impact on the layout of the village’s distribution patterns. The layout of green space directly reflects the degree of correlation between the village and its surrounding environment, constrains the ecological and healthy development of the village, and is the ecological structure of the village’s distribution patterns. The distribution patterns of residential buildings are a concentrated reflection of the main residential buildings in a village. A reasonably arranged distribution pattern of residential buildings is an important requirement for the quality of life of villagers and determines the external structure of the village’s distribution patterns.

3.4. Analysis of Influencing Factors

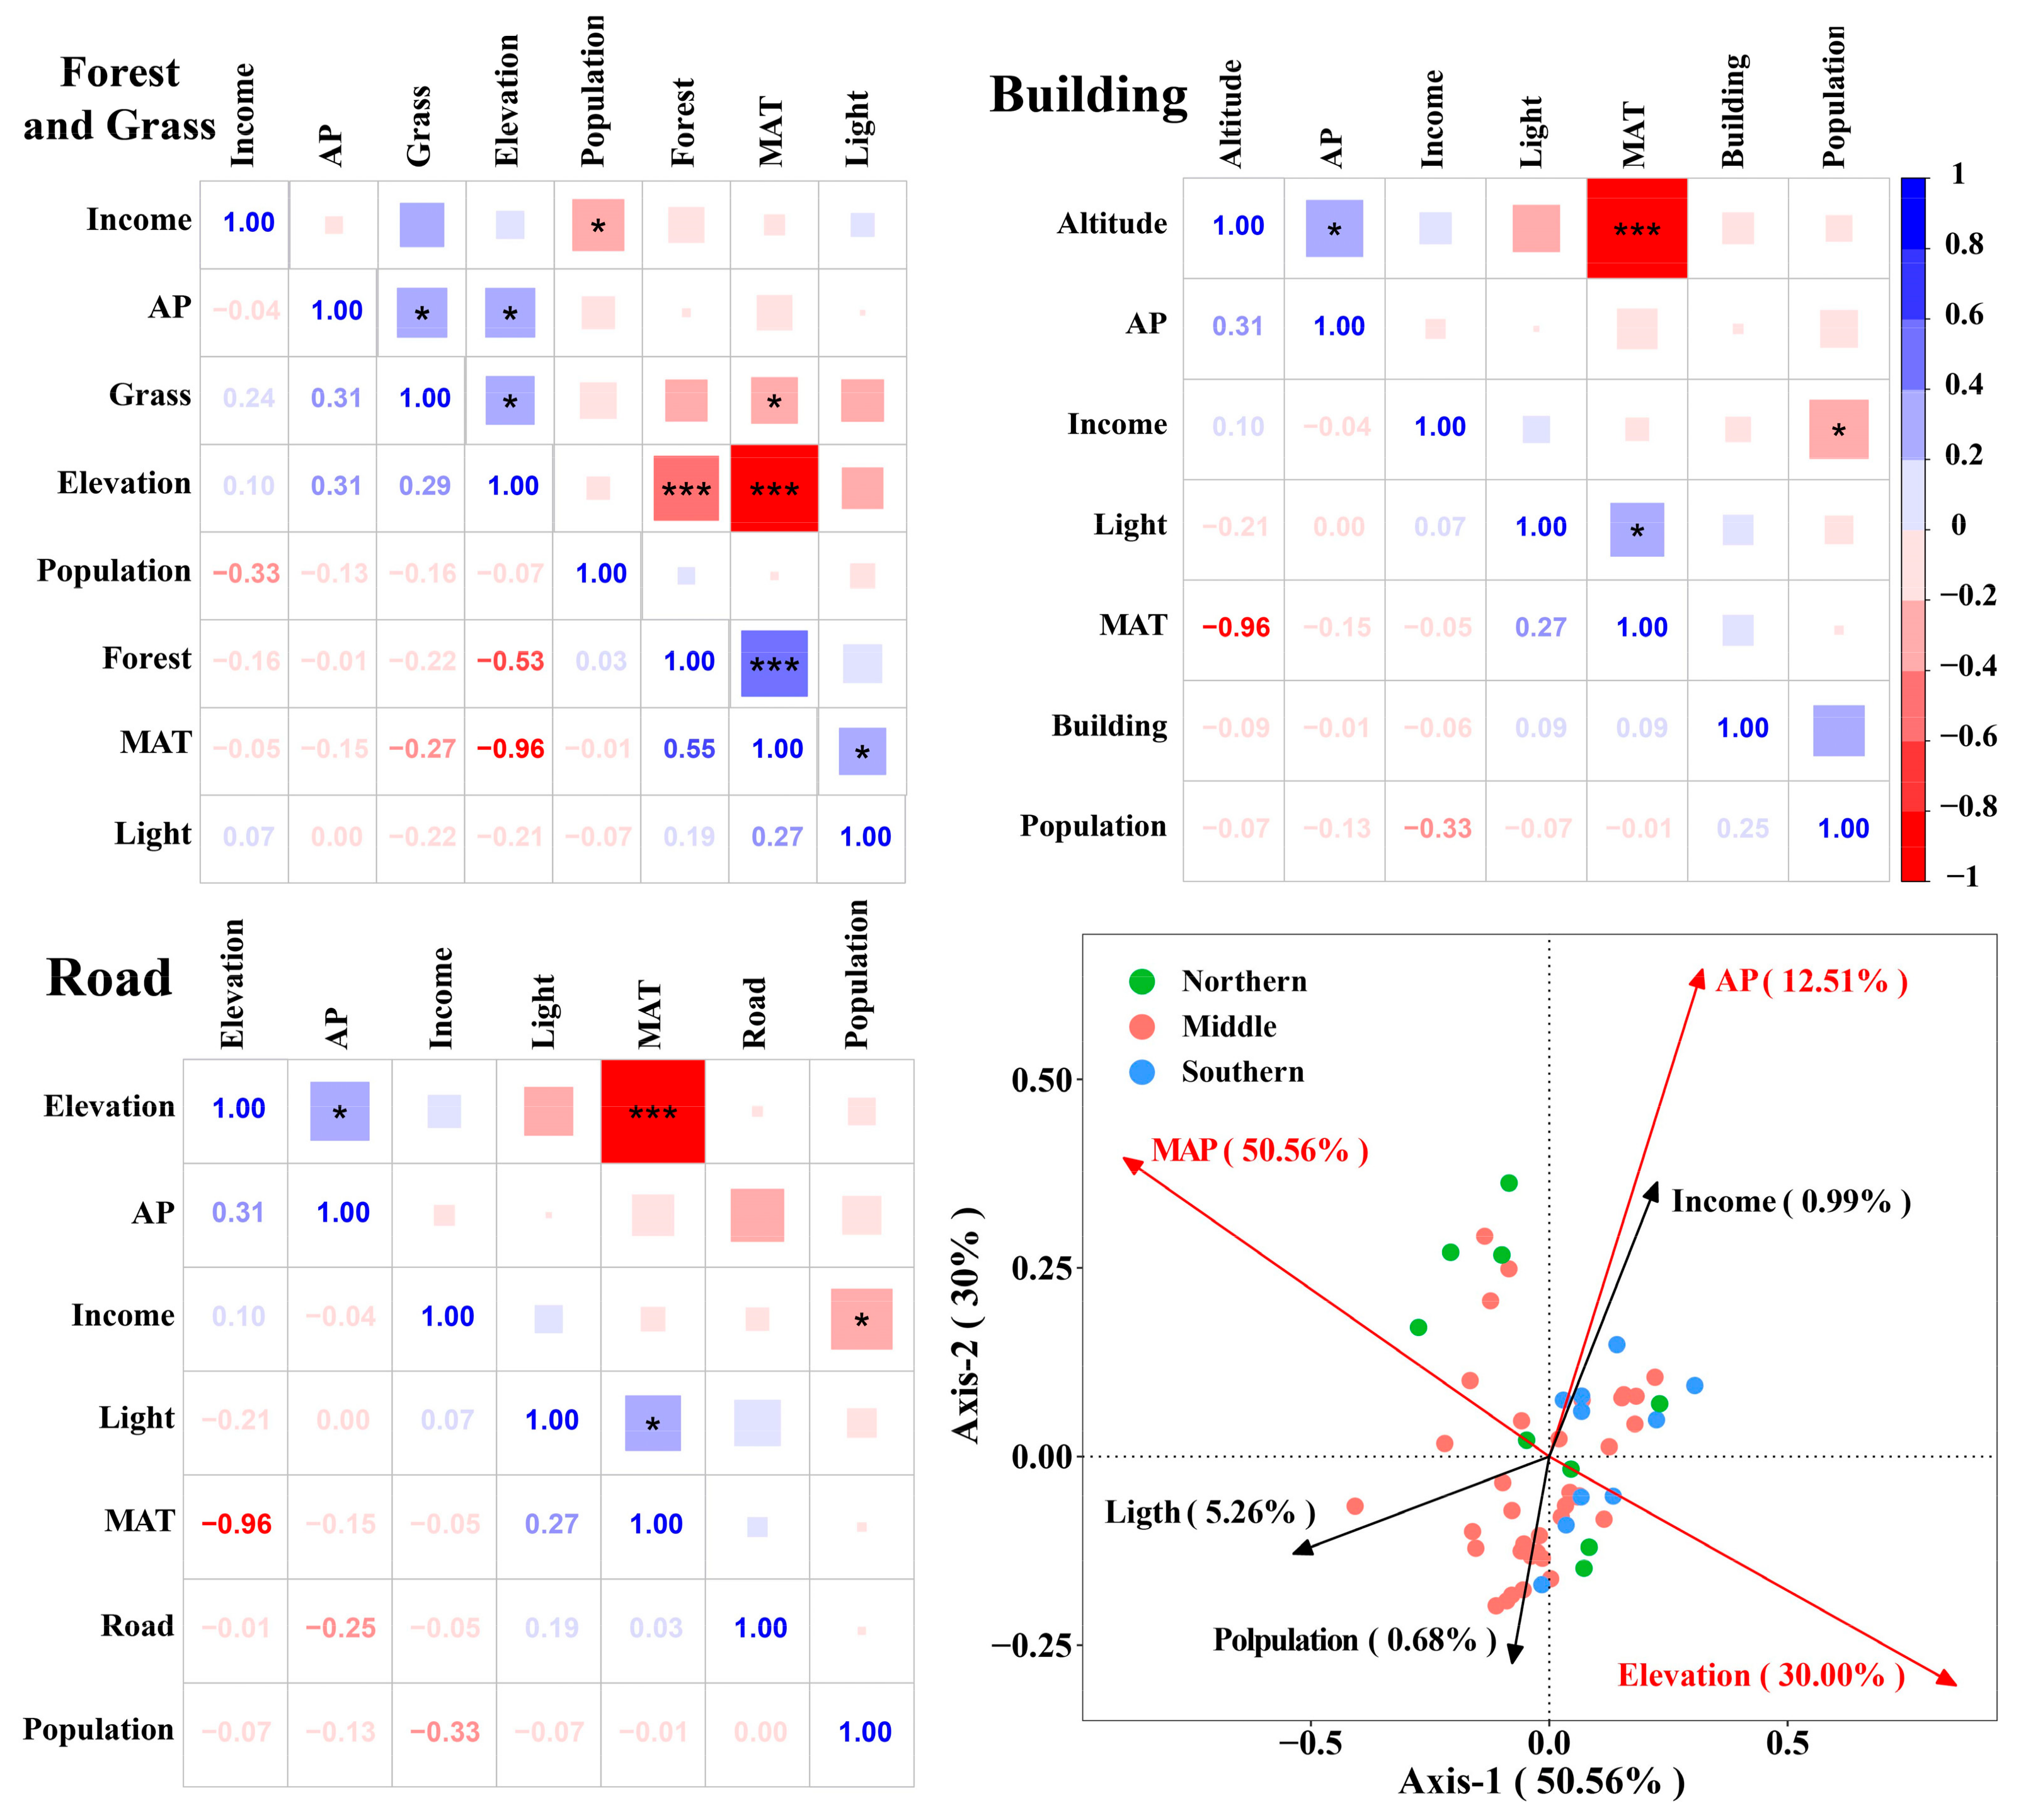
By combining multiple regression analysis with correspondence analysis, the RDA analysis method quantifies the specific contributions of different influencing factors to land-use composition, providing a scientific basis for targeted recommendations. The analysis revealed that MAT, elevation, and AP contributed 50.56%, 30.00%, and 12.5%, respectively, to village land-use composition, with a cumulative contribution of 93.07%. This indicates that natural factors are the primary influencing factors.
In this study, MAT, AP, and elevation were selected as the natural factors, and nighttime light, population, and per capita income were selected as the social and economic factors. Correlation analysis was used to explore their impact on the composition of village land use (Figure 7). MAT, AP, and altitude are closely linked. There is a highly significant (p < 0.001) trend between MAT and altitude, and there is a significant (p < 0.05) trend between AP and altitude. The analysis revealed that forest land is significantly positively (p < 0.001) correlated with MAT, but significantly negatively (p < 0.001) correlated with elevation, indicating that forest land is mainly distributed in areas with higher MAT and lower elevation. Grassland shows a significantly positive (p < 0.05) correlation with elevation and AP, but a significantly negative (p < 0.05) correlation with MAT, indicating that grassland is mainly distributed in areas with higher elevation, lower MAT, and more abundant AP. Built-up land exhibits a positive correlation with zMAT and nighttime light but a negative correlation with elevation, indicating that built-up land is mainly distributed in areas with lower elevation. Roads show a positive correlation with nighttime light but a negative correlation with AP, suggesting that roads are distributed more in areas with lower AP.

4. Discussion

4.1. Feasibility of Land-Use Classification Techniques

Visual interpretation is the fundamental method of land-use classification, but this method requires rich theoretical knowledge and does not effectively utilize the spatial information of images. Moreover, it is inefficient and cannot meet the needs of contemporary development [36]. Subsequently, pixel-based machine learning algorithms have increasingly been applied to land-use classification [37]. These algorithms mainly use spectral information in different bands to classify pixels into different land-use types [38]. However, the classification results suffer from serious “salt and pepper noise” issues, leading to low classification accuracy [39].
With the development of remote sensing technology, high-resolution remote sensing images generally have fewer imaging bands but contain significantly more spatial detail information [40]. Therefore, an object-based human-assisted approach to land-use classification that addresses the classifier design deficiencies of traditional classification methods; fully utilizes the differences in spectral, texture, and structural information of the objects [41]; and, through multiscale segmentation, forms different object levels, to make the classification results closer to those of human visual interpretation. This effectively improves the accuracy of feature information extraction, significantly reduces costs, and provides an ideal tool for image feature extraction and classification on a small scale [42]. However, in large samples, this method has more errors in interpreting cropland, requiring significant manual correction later. Therefore, although this method can effectively distinguish between different land-use types in ultra-high-resolution images, it still faces the challenge of lower efficiency when applied on a large scale [43].
In the current big data context, deep learning can learn more features from massive data than traditional machine learning methods [44]. Its application in remote sensing image classification mainly includes object recognition in image slices, object-based classification, and end-to-end semantic segmentation [45]. However, these methods involve complex computational processes, and a large number of training samples are needed. When land types that are unrecognizable to the human eye are present, these methods also fail to extract such land types. So, these methods are not suitable for large-scale widespread applications [46].
In recent years, the emergence of high-resolution drone sensors has made precise ground observation possible [47]. Driven by data, some new application scenarios have also emerged [48,49]. This study provides a demonstration of land-use analysis based on high-resolution UAV remote sensing data as a reference for future work. Specifically, drones can quickly acquire high-resolution orthoimages of villages. Using an object-based human-assisted land-use classification approach, we can efficiently analyze drone remote sensing images to obtain village land-use composition and distribution pattern characteristics. This provides objective data and a scientific basis for village planning and improvements in human settlement environments. Moreover, it will assist rural revitalization and local ecological civilization construction with scientific methods.

4.2. Spatial Differentiation of Rural Land-Use Composition

The land-use types in the Hehuang Valley are diverse, with significant differences among different regions and villages. At the regional scale, the northern villages in the Hehuang Valley are mainly dominated by cropland and built-up land, followed by forest land, grassland, and roads, with water accounting for the smallest proportion (Table 2). This is mainly due to the concentration of cropland along the banks of the Datong River, especially in Menyuan County with an area of 33,000 hm2. The northern part of the Hehuang Valley, near the Qilian Mountains, has seen rapid development in animal husbandry, with large-scale man-made grassland. This area is an important production area for beef and mutton in the Hehuang Valley and a major source of local economic income. Therefore, the proportion of grassland in the village is relatively high.
In the central part of the Hehuang Valley, the villages are dominated by built-up land, followed by cropland, road land, and forest land, with less grassland, bare area, and water. This is mainly due to the presence of Xining, the capital of Qinghai Province, in the central part of the Hehuang Valley. Its expansion has optimized and transformed the industrial structure along the valley, with various industrial enterprises distributed in the region, creating many employment opportunities and high population density. Therefore, the main land use in these villages is built-up land, with a relatively low proportion of bare area. Additionally, many vegetable greenhouses are distributed in the central part of the Hehuang Valley, making it an important production base for winter vegetables and organic green vegetables in Qinghai Province, thus leading to a relatively high proportion of cropland in the central part of the Hehuang Valley villages.
The southern part of the Hehuang Valley is located in the upper reaches of the Yellow River. Ecological protection and high-quality development are the core tasks for this region. There is significant differentiation in the various land-use types in the villages. The main land type is built-up land, followed by forest land and roads, with a smaller proportion of grassland, cropland, bare land, and water. Because of the influence of ecological engineering measures such as the Three-North Shelterbelt Project, natural forest protection projects, and projects returning cropland to forest, as well as a relatively high amount of AP, the proportion of forest land in these villages is relatively high. In accordance with the requirements of the Yellow River Basin Ecological Protection and High-Quality Development Master Plan, almost all villages in the southern part of the Hehuang Valley are within the ecological “red line”. This means they prioritize green development with an emphasis on ecological protection, and consequently focus on the cultivation of highland barley and other highland agriculture. Moreover, to actively implement the relevant requirements of the ecological “red line”, there are certain limitations on the industrial layout in the region, with a higher proportion of bare area compared to other areas of the Hehuang Valley.
From the perspective of land-use types, the proportion of rural forest land is as high as 16.41% ± 7.80%, and there are significant differences among different regions (Figure 8). In the southern part of the Hehuang Valley, due to higher AP, the proportion of forest land in villages is higher than in other areas. In terms of grassland proportions, because of the development of animal husbandry in the northern part of the Hehuang Valley, the proportion of grassland in villages is relatively high. The northern and central parts of the Hehuang River Valley are important agricultural production areas in Qinghai Province, with the proportion of arable land accounting for nearly 60% of the entire province [27]. The water resources in the Hehuang Valley are abundant, with most villages distributed along rivers and primarily relying on irrigation canals. Only a small number of villages in the northern part of the Hehuang Valley have rivers running through them. There is a certain gap in the economic development level of different areas in the Hehuang Valley. The southern region is influenced by ecological protection policies and social and economic conditions, resulting in a high proportion of bare area [50]. The difference in road proportion in different areas of the Hehuang Valley is not significant, and the accessibility of transportation is good, which is a solid foundation for the rapid development of the local economy. In terms of built-up land, because of the relatively dense population in the central and southern parts of the Hehuang Valley, the proportion of built-up land is higher than in the northern part of the Hehuang Valley, which is mainly focused on agricultural and animal husbandry development.

4.3. Mechanisms of Influencing Factors

The use of correlation analysis revealed a significant positive correlation between forest land and MAT, but a significant negative correlation between forest land and elevation [51]. The average elevation in the Hehuang Valley is 2800 m, and the landscape is mainly dominated by deciduous broad-leaved forests with a few coniferous forests. The increase in MAT will increase tree metabolic processes, such as photosynthesis and respiration, thereby promoting tree growth [52]. Elevation is closely related to MAT. MAT decreases as elevation rises, making elevation the primary factor influencing forest growth because of MAT [53]. The relationship between grassland and elevation shows a significant positive correlation, mainly because the increase in elevation leads to a substantial reduction in human activities such as grazing, which is favorable for the normal growth of grass [54]. Grassland exhibits a significant positive correlation with AP and a significant negative correlation with MAT. This is primarily because the Hehuang Valley consists of arid and semi-arid areas, and an increase in precipitation can alleviate the stress caused by drought, substantially improving the grass growth environment [55]. However, increasing temperatures lead to increased evaporation and aggravate soil water scarcity, which is unfavorable for grass growth [56]. The negative correlation between land cultivation and temperature is mainly due to the fact that the agricultural production in the Hehuang Valley mainly focuses on cold and drought-resistant cash crops such as rapeseed and highland barley. These crops are suitable for large-scale cultivation in the northern region of the Hehuang Valley, where the elevation is higher and the temperature is lower [57]. The relationship between built-up land and MAT is positively correlated. There also exists an extremely significant negative correlation between elevation and MAT (p < 0.001), and a moderately significant positive correlation between elevation and AP (p < 0.05; Figure 7). Therefore, elevation, MAT, and AP serve as important natural factors with strong mutual correlations. They determine the scope and intensity of human activities, thereby influencing the scale of built-up land and the development pattern of villages. Specifically, as the temperature rises and elevation decreases, the oxygen content increases, the climate becomes more humid, and the population becomes more concentrated, leading to a higher proportion of built-up land [5]. Although the influence of socio-economic factors on the land-use composition of villages is not significant, differences in economic levels between different villages can lead to differentiation in land-use composition.

4.4. Suggestions for Reasonable Planning

The results of this study provide feedback on the status of village land use in response to the social environment and rapid urbanization in Hehuang Valley, with the aim of encouraging and assisting in the formulation of effective policies. In summary, the following points are crucial for the rational planning of villages in the Hehuang Valley.
(1)
Use of ultra-high-resolution UAV remote sensing data. It is also necessary to regularly collect and update data. In this study, the relevant government agencies provided us with publicly accessible sources for infrastructure information around villages. This is an effective way to understand the surrounding natural and socio-economic conditions, facilitating better UAV photography work. On the basis of these high-resolution drone remote sensing images, the analysis and processing of land-use maps help reveal an overall understanding of the land-use composition [58]. This more targeted approach aids in village planning, improving rural living environments effectively. This will support the implementation of rural revitalization strategies in the local region.
(2)
Optimization of green space layout based on climate conditions. Through the analysis, it was found that the three natural factors of MAT, elevation, and AP have a significant impact on the land use of the villages in the Hehuang Valley. Therefore, in the process of village transformation and improvement to increase the proportion of green space planning, enhance the integration of villages with the surrounding ecological environment, and improve overall ecological benefits, it is advisable to use more local tree species adapted to the local climate (in terms of temperature and precipitation) for village greening [59], instead of blindly pursuing aesthetics. In terms of elevation, the corresponding landscape layout positions and patterns should be determined based on different elevation characteristics and the local micro-landforms of the villages. Therefore, in future rural planning and the upgrading of rural living environments, it is crucial to comprehensively consider the specific natural geographical features of the local area. This will help local governments make decisions scientifically, effectively serving the rural revitalization strategy locally.

4.5. Limitations and Future Prospects

For the land-use analysis of villages in high-elevation areas, some goals are still difficult to achieve because of inherent and challenging problems. The main reason for using UAV remote sensing imagery is that conventional drones are more affordable, easier to operate, and easier to promote, but sensors equipped with hyperspectral or LiDAR would improve identification accuracy [60]. The interpretation of building clusters is far less effective than that of cropland and water because of their mixed colors, and a significant amount of time is needed to correct impermeable regions in the image. In future research, deep learning algorithms could be employed for remote-sensing image interpretation to improve the accuracy of the results [61].

5. Conclusions

This study was based on a large amount of data, which were used to obtain an ultra-high-resolution land-use classification dataset of villages. This study conducted an analysis of the composition, distribution patterns, and influencing factors of village land use. These research results will help facilitate the building of beautiful rural areas in the Hehuang Valley, and it is hoped it will provide a scientific basis for better protecting and developing rural plateau areas in the future.
(1)
Using UAV remote sensing images with the object-based human-assisted land-use classification approach enables the land to be classified with a high accuracy of 96.86%.
(2)
In impervious surface areas, the proportions of land for construction and road use are 33.01% ± 8.89% and 17.76% ± 6.92%, respectively, exceeding 50% in total. The sum of forest land, grassland, and cropland area exceeds 40%, of which the proportion of forest land is 16.41% ± 7.80% and that of grassland is 6.19% ± 6.48%.
(3)
The average size of the villages is 25.85 ± 17.93 hm2, which is below the national average. The distribution patterns of the villages are relatively scattered, with most being concentrated on both sides of the main roads.
(4)
The contributions of MAT, elevation, and AP contributing to the land-use composition are 50.56%, 30.00%, and 12.51%, respectively, making them the dominant factors affecting land-use composition. Among them, MAT and AP have particularly significant effects on forest land, grassland, and built-up land.
This study utilized a drone that is easy to carry and can obtain ultra-high-precision images, but it is equipped with only RGB spectral bands. Utilizing drones equipped with hyperspectral, or LiDAR sensors can provide more land-surface information, facilitating more in-depth research. Future research could utilize deep learning, semantic segmentation, and other advanced algorithms to interpret remote sensing, enhancing the efficiency of processing large sample datasets.

Supplementary Materials

The following supporting information can be downloaded at: https://www.mdpi.com/article/10.3390/rs16122213/s1, Figure S1: Land use composition in the representative villages; Table S1: Specific meanings and locations of village names abbreviations.

Author Contributions

Conceptualization, Z.X. and X.L.; methodology, X.L.; software, X.L.; validation, X.L.; formal analysis, X.L.; investigation, X.L. and Z.X.; resources, Z.X.; data curation, X.L.; writing—original draft preparation, Z.X. and X.L.; writing—review and editing, Z.X.; visualization, X.L.; supervision, Z.X.; project administration, Z.X.; funding acquisition, Z.X. All authors have read and agreed to the published version of the manuscript.

Funding

This research was funded by the Second Tibetan Plateau Scientific Expedition and Research Program (STEP) (2019QZKK0608).

Data Availability Statement

Data available are upon request to the authors.

Acknowledgments

We thank our team members for their invaluable assistance during the data collection phase of this research from July to August 2022. We also thank the editor and reviewers for their helpful and professional comments on the manuscript.

Conflicts of Interest

The authors declare no conflict of interest.

References

  1. Shi, J.; Yang, X. Sustainable Development Levels and Influence Factors in Rural China Based on Rural Revitalization Strategy. Sustainability 2022, 14, 8908. [Google Scholar] [CrossRef]
  2. Chen, M.; Zhou, Y.; Huang, X.; Ye, C. The Integration of New-Type Urbanization and Rural Revitalization Strategies in China: Origin, Reality and Future Trends. Land 2021, 10, 207. [Google Scholar] [CrossRef]
  3. Guo, B.; Fang, Y.; Jin, X.; Zhou, Y. Monitoring the Effects of Land Consolidation on the Ecological Environmental Quality Based on Remote Sensing: A Case Study of Chaohu Lake Basin, China. Land Use Policy 2020, 95, 104569. [Google Scholar] [CrossRef]
  4. Luo, X.; Yang, J.; Sun, W.; He, B. Suitability of Human Settlements in Mountainous Areas from the Perspective of Ventilation: A Case Study of the Main Urban Area of Chongqing. J. Clean. Prod. 2021, 310, 127467. [Google Scholar] [CrossRef]
  5. Liu, C.; Li, W.; Zhu, G.; Zhou, H.; Yan, H.; Xue, P. Land Use/Land Cover Changes and Their Driving Factors in the Northeastern Tibetan Plateau Based on Geographical Detectors and Google Earth Engine: A Case Study in Gannan Prefecture. Remote Sens. 2020, 12, 3139. [Google Scholar] [CrossRef]
  6. Radočaj, D.; Obhođaš, J.; Jurišić, M.; Gašparović, M. Global Open Data Remote Sensing Satellite Missions for Land Monitoring and Conservation: A Review. Land 2020, 9, 402. [Google Scholar] [CrossRef]
  7. Wiatkowska, B.; Słodczyk, J.; Stokowska, A. Spatial-Temporal Land Use and Land Cover Changes in Urban Areas Using Remote Sensing Images and GIS Analysis: The Case Study of Opole, Poland. Geosciences 2021, 11, 312. [Google Scholar] [CrossRef]
  8. Yin, J.; Dong, J.; Hamm, N.A.S.; Li, Z.; Wang, J.; Xing, H.; Fu, P. Integrating Remote Sensing and Geospatial Big Data for Urban Land Use Mapping: A Review. Int. J. Appl. Earth Obs. Geoinf. 2021, 103, 102514. [Google Scholar] [CrossRef]
  9. Gong, P.; Li, X.; Zhang, W. 40-Year (1978–2017) Human Settlement Changes in China Reflected by Impervious Surfaces from Satellite Remote Sensing. Sci. Bull. 2019, 64, 756–763. [Google Scholar] [CrossRef]
  10. Pengra, B.W.; Stehman, S.V.; Horton, J.A.; Dockter, D.J.; Schroeder, T.A.; Yang, Z.; Cohen, W.B.; Healey, S.P.; Loveland, T.R. Quality Control and Assessment of Interpreter Consistency of Annual Land Cover Reference Data in an Operational National Monitoring Program. Remote Sens. Environ. 2020, 238, 111261. [Google Scholar] [CrossRef]
  11. Yu, L.; Du, Z.; Dong, R.; Zheng, J.; Tu, Y.; Chen, X.; Hao, P.; Zhong, B.; Peng, D.; Zhao, J.; et al. FROM-GLC Plus: Toward near Real-Time and Multi-Resolution Land Cover Mapping. GISci. Remote Sens. 2022, 59, 1026–1047. [Google Scholar] [CrossRef]
  12. Potapov, P.; Hansen, M.C.; Pickens, A.; Hernandez-Serna, A.; Tyukavina, A.; Turubanova, S.; Zalles, V.; Li, X.; Khan, A.; Stolle, F.; et al. The Global 2000–2020 Land Cover and Land Use Change Dataset Derived From the Landsat Archive: First Results. Front. Remote Sens. 2022, 3, 856903. [Google Scholar] [CrossRef]
  13. Venter, Z.S.; Barton, D.N.; Chakraborty, T.; Simensen, T.; Singh, G. Global 10 m Land Use Land Cover Datasets: A Comparison of Dynamic World, World Cover and Esri Land Cover. Remote Sens. 2022, 14, 4101. [Google Scholar] [CrossRef]
  14. Brown, C.F.; Brumby, S.P.; Guzder-Williams, B.; Birch, T.; Hyde, S.B.; Mazzariello, J.; Czerwinski, W.; Pasquarella, V.J.; Haertel, R.; Ilyushchenko, S.; et al. Dynamic World, Near Real-Time Global 10 m Land Use Land Cover Mapping. Sci. Data 2022, 9, 251. [Google Scholar] [CrossRef]
  15. Phan, T.N.; Kuch, V.; Lehnert, L.W. Land Cover Classification Using Google Earth Engine and Random Forest Classifier—The Role of Image Composition. Remote Sens. 2020, 12, 2411. [Google Scholar] [CrossRef]
  16. Shafizadeh-Moghadam, H.; Khazaei, M.; Alavipanah, S.K.; Weng, Q. Google Earth Engine for Large-Scale Land Use and Land Cover Mapping: An Object-Based Classification Approach Using Spectral, Textural and Topographical Factors. GISci. Remote Sens. 2021, 58, 914–928. [Google Scholar] [CrossRef]
  17. Brown, J.F.; Tollerud, H.J.; Barber, C.P.; Zhou, Q.; Dwyer, J.L.; Vogelmann, J.E.; Loveland, T.R.; Woodcock, C.E.; Stehman, S.V.; Zhu, Z.; et al. Lessons Learned Implementing an Operational Continuous United States National Land Change Monitoring Capability: The Land Change Monitoring, Assessment, and Projection (LCMAP) Approach. Remote Sens. Environ. 2020, 238, 111356. [Google Scholar] [CrossRef]
  18. Lyu, X.; Li, X.; Dang, D.; Dou, H.; Wang, K.; Lou, A. Unmanned Aerial Vehicle (UAV) Remote Sensing in Grassland Ecosystem Monitoring: A Systematic Review. Remote Sens. 2022, 14, 1096. [Google Scholar] [CrossRef]
  19. Zhang, H.; Wang, L.; Tian, T.; Yin, J. A Review of Unmanned Aerial Vehicle Low-Altitude Remote Sensing (UAV-LARS) Use in Agricultural Monitoring in China. Remote Sens. 2021, 13, 1221. [Google Scholar] [CrossRef]
  20. Guimarães, N.; Pádua, L.; Marques, P.; Silva, N.; Peres, E.; Sousa, J.J. Forestry Remote Sensing from Unmanned Aerial Vehicles: A Review Focusing on the Data, Processing and Potentialities. Remote Sens. 2020, 12, 1046. [Google Scholar] [CrossRef]
  21. Zhang, Z.; Zhu, L. A Review on Unmanned Aerial Vehicle Remote Sensing: Platforms, Sensors, Data Processing Methods, and Applications. Drones 2023, 7, 398. [Google Scholar] [CrossRef]
  22. Tmušić, G.; Manfreda, S.; Aasen, H.; James, M.R.; Gonçalves, G.; Ben-Dor, E.; Brook, A.; Polinova, M.; Arranz, J.J.; Mészáros, J.; et al. Current Practices in UAS-Based Environmental Monitoring. Remote Sens. 2020, 12, 1001. [Google Scholar] [CrossRef]
  23. Yan, Y.; Deng, L.; Liu, X.; Zhu, L. Application of UAV-Based Multi-Angle Hyperspectral Remote Sensing in Fine Vegetation Classification. Remote Sens. 2019, 11, 2753. [Google Scholar] [CrossRef]
  24. Elamin, A.; El-Rabbany, A. UAV-Based Multi-Sensor Data Fusion for Urban Land Cover Mapping Using a Deep Convolutional Neural Network. Remote Sens. 2022, 14, 4298. [Google Scholar] [CrossRef]
  25. Mollick, T.; Azam, M.G.; Karim, S. Geospatial-Based Machine Learning Techniques for Land Use and Land Cover Mapping Using a High-Resolution Unmanned Aerial Vehicle Image. Remote Sens. Appl. Soc. Environ. 2023, 29, 100859. [Google Scholar] [CrossRef]
  26. Jia, X.; Lee, H.F.; Cui, M.; Cheng, G.; Zhao, Y.; Ding, H.; Yue, R.P.H.; Lu, H. Differentiations of Geographic Distribution and Subsistence Strategies between Tibetan and Other Major Ethnic Groups Are Determined by the Physical Environment in Hehuang Valley. Sci. China Earth Sci. 2019, 62, 412–422. [Google Scholar] [CrossRef]
  27. Zhang, Y.; Wu, Y.; Yan, J.; Peng, T. How Does Rural Labor Migration Affect Crop Diversification for Adapting to Climate Change in the Hehuang Valley, Tibetan Plateau? Land Use Policy 2022, 113, 105928. [Google Scholar] [CrossRef]
  28. Haixin, Z.; Yimei, H.; Shaoshan, A.; Haohao, L.; Xiaoqian, D.; Pan, W.; Mengyuan, F. Land-Use Patterns Determine the Distribution of Soil Microplastics in Typical Agricultural Areas on the Eastern Qinghai-Tibetan Plateau. J. Hazard. Mater. 2022, 426, 127806. [Google Scholar] [CrossRef]
  29. Peng, S. 1-Km Monthly Precipitation Dataset for China (1901–2022). Natl. Tibet. Plateau/Third Pole Environ. Data Cent. 2020. [Google Scholar] [CrossRef]
  30. Peng, S. 1-Km Monthly Mean Temperature Dataset for China (1901–2022). Natl. Tibet. Plateau/Third Pole Environ. Data Center. 2019. [Google Scholar] [CrossRef]
  31. Chen, Z.; Yu, B.; Yang, C.; Zhou, Y.; Yao, S.; Qian, X.; Wang, C.; Wu, B.; Wu, J. An Extended Time-Series (2000–2023) of Global NPP-VIIRS-like Nighttime Light Data. Earth Syst. Sci. Data Discuss. 2020, 2020, 1–34. [Google Scholar] [CrossRef]
  32. Ning, J.; Liu, J.; Kuang, W.; Xu, X.; Zhang, S.; Yan, C.; Li, R.; Wu, S.; Hu, Y.; Du, G.; et al. Spatiotemporal Patterns and Characteristics of Land-Use Change in China during 2010–2015. J. Geogr. Sci. 2018, 28, 547–562. [Google Scholar] [CrossRef]
  33. Yang, J.; Huang, X. 30 m Annual Land Cover and Its Dynamics in China from 1990 to 2019. Earth Syst. Sci. Data 2021, 13, 3907–3925. [Google Scholar] [CrossRef]
  34. Boateng, E.Y.; Otoo, J.; Abaye, D.A. Basic Tenets of Classification Algorithms K-Nearest-Neighbor, Support Vector Machine, Random Forest and Neural Network: A Review. J. Data Anal. Inf. Process. 2020, 8, 341–357. [Google Scholar] [CrossRef]
  35. Wei, Y.; Sun, S.; Liang, D.; Jia, Z. Spatial–Temporal Variations of NDVI and Its Response to Climate in China from 2001 to 2020. Int. J. Digit. Earth 2022, 15, 1463–1484. [Google Scholar] [CrossRef]
  36. Pan, Z.; Xu, J.; Guo, Y.; Hu, Y.; Wang, G. Deep Learning Segmentation and Classification for Urban Village Using a Worldview Satellite Image Based on U-Net. Remote Sens. 2020, 12, 1574. [Google Scholar] [CrossRef]
  37. Duro, D.C.; Franklin, S.E.; Dubé, M.G. A Comparison of Pixel-Based and Object-Based Image Analysis with Selected Machine Learning Algorithms for the Classification of Agricultural Landscapes Using SPOT-5 HRG Imagery. Remote Sens. Environ. 2012, 118, 259–272. [Google Scholar] [CrossRef]
  38. Sefrin, O.; Riese, F.M.; Keller, S. Deep Learning for Land Cover Change Detection. Remote Sens. 2021, 13, 78. [Google Scholar] [CrossRef]
  39. Zhang, X.; Han, L.; Han, L.; Zhu, L. How Well Do Deep Learning-Based Methods for Land Cover Classification and Object Detection Perform on High Resolution Remote Sensing Imagery? Remote Sens. 2020, 12, 417. [Google Scholar] [CrossRef]
  40. Yao, J.; Wu, J.; Xiao, C.; Zhang, Z.; Li, J. The Classification Method Study of Crops Remote Sensing with Deep Learning, Machine Learning, and Google Earth Engine. Remote Sens. 2022, 14, 2758. [Google Scholar] [CrossRef]
  41. Pashaei, M.; Kamangir, H.; Starek, M.J.; Tissot, P. Review and Evaluation of Deep Learning Architectures for Efficient Land Cover Mapping with UAS Hyper-Spatial Imagery: A Case Study Over a Wetland. Remote Sens. 2020, 12, 959. [Google Scholar] [CrossRef]
  42. Chen, B.; Tu, Y.; Song, Y.; Theobald, D.M.; Zhang, T.; Ren, Z.; Li, X.; Yang, J.; Wang, J.; Wang, X.; et al. Mapping Essential Urban Land Use Categories with Open Big Data: Results for Five Metropolitan Areas in the United States of America. ISPRS J. Photogramm. Remote Sens. 2021, 178, 203–218. [Google Scholar] [CrossRef]
  43. Ma, L.; Li, M.; Ma, X.; Cheng, L.; Du, P.; Liu, Y. A Review of Supervised Object-Based Land-Cover Image Classification. ISPRS J. Photogramm. Remote Sens. 2017, 130, 277–293. [Google Scholar] [CrossRef]
  44. Wang, M.; Zhang, H.; Sun, W.; Li, S.; Wang, F.; Yang, G. A Coarse-to-Fine Deep Learning Based Land Use Change Detection Method for High-Resolution Remote Sensing Images. Remote Sens. 2020, 12, 1933. [Google Scholar] [CrossRef]
  45. Osco, L.P.; Marcato Junior, J.; Marques Ramos, A.P.; de Castro Jorge, L.A.; Fatholahi, S.N.; de Andrade Silva, J.; Matsubara, E.T.; Pistori, H.; Gonçalves, W.N.; Li, J. A Review on Deep Learning in UAV Remote Sensing. Int. J. Appl. Earth Obs. Geoinf. 2021, 102, 102456. [Google Scholar] [CrossRef]
  46. Zhang, C.; Harrison, P.A.; Pan, X.; Li, H.; Sargent, I.; Atkinson, P.M. Scale Sequence Joint Deep Learning (SS-JDL) for Land Use and Land Cover Classification. Remote Sens. Environ. 2020, 237, 111593. [Google Scholar] [CrossRef]
  47. Park, G.; Park, K.; Song, B.; Lee, H. Analyzing Impact of Types of UAV-Derived Images on the Object-Based Classification of Land Cover in an Urban Area. Drones 2022, 6, 71. [Google Scholar] [CrossRef]
  48. Al-Najjar, H.A.H.; Kalantar, B.; Pradhan, B.; Saeidi, V.; Halin, A.A.; Ueda, N.; Mansor, S. Land Cover Classification from Fused DSM and UAV Images Using Convolutional Neural Networks. Remote Sens. 2019, 11, 1461. [Google Scholar] [CrossRef]
  49. Yao, H.; Qin, R.; Chen, X. Unmanned Aerial Vehicle for Remote Sensing Applications—A Review. Remote Sens. 2019, 11, 1443. [Google Scholar] [CrossRef]
  50. Tian, Y.; Jiang, G.; Wu, S.; Zhou, D.; Zhou, T.; Tian, Y.; Chen, T. Cropland-Grassland Use Conversions in the Agro-Pastoral Areas of the Tibetan Plateau: Spatiotemporal Pattern and Driving Mechanisms. Ecol. Indic. 2023, 146, 109819. [Google Scholar] [CrossRef]
  51. Gao, P.; Gao, Y.; Ou, Y.; McJeon, H.; Zhang, X.; Ye, S.; Wang, Y.; Song, C. Fulfilling Global Climate Pledges Can Lead to Major Increase in Forest Land on Tibetan Plateau. iScience 2023, 26, 106364. [Google Scholar] [CrossRef] [PubMed]
  52. Liu, J.; Zou, H.; Bachelot, B.; Dong, T.; Zhu, Z.; Liao, Y.; Plenković-Moraj, A.; Wu, Y. Predicting the Responses of Subalpine Forest Landscape Dynamics to Climate Change on the Eastern Tibetan Plateau. Glob. Chang. Biol. 2021, 27, 4352–4366. [Google Scholar] [CrossRef] [PubMed]
  53. Huang, Y.; Xin, Z.; Dor-ji, T.; Wang, Y. Tibetan Plateau Greening Driven by Warming-wetting Climate Change and Ecological Restoration in the 21st Century. Land Degrad Dev. 2022, 33, 2407–2422. [Google Scholar] [CrossRef]
  54. Wang, S.; Dai, E.; Jia, L.; Wang, Y.; Huang, A.; Liao, L.; Cai, L.; Fan, D. Assessment of Multiple Factors and Interactions Affecting Grassland Degradation on the Tibetan Plateau. Ecol. Indic. 2023, 154, 110509. [Google Scholar] [CrossRef]
  55. Zeng, N.; Ren, X.; He, H.; Zhang, L.; Niu, Z. Precipitation Conditions Constrain the Sensitivity of Aboveground Net Primary Productivity in Tibetan Plateau Grasslands to Climate Change. Remote Sens. 2023, 15, 2591. [Google Scholar] [CrossRef]
  56. Zhou, W.; Wang, T.; Xiao, J.; Wang, K.; Yu, W.; Du, Z.; Huang, L.; Yue, T. Grassland Productivity Increase Was Dominated by Climate in Qinghai-Tibet Plateau from 1982 to 2020. J. Clean. Prod. 2024, 434, 140144. [Google Scholar] [CrossRef]
  57. Li, Y.; Zhou, T.; Jiang, G.; Li, G.; Zhou, D.; Luo, Y. Spatial Pattern and Mechanisms of Farmland Abandonment in Agricultural and Pastoral Areas of Qingzang Plateau. Geogr. Sustain. 2021, 2, 139–150. [Google Scholar] [CrossRef]
  58. Liu, Y. Introduction to Land Use and Rural Sustainability in China. Land Use Policy 2018, 74, 1–4. [Google Scholar] [CrossRef]
  59. Peili, S.; Lili, Z.; Tiancai, Z.; Ge, H.; Guangshuai, Z. Considerations of Forest Distribution and Native Tree Species for Afforestation in the High Altitudes on the Eastern Tibetan Plateau. JORE 2022, 13, 100–106. [Google Scholar] [CrossRef]
  60. Zhou, R.; Yang, C.; Li, E.; Cai, X.; Yang, J.; Xia, Y. Object-Based Wetland Vegetation Classification Using Multi-Feature Selection of Unoccupied Aerial Vehicle RGB Imagery. Remote Sens. 2021, 13, 4910. [Google Scholar] [CrossRef]
  61. Ayhan, B.; Kwan, C. Tree, Shrub, and Grass Classification Using Only RGB Images. Remote Sens. 2020, 12, 1333. [Google Scholar] [CrossRef]
Figure 1. Study area of Hehuang Valley in Qinghai, China. Note: Based on the standard map service network GS (2019) No. 1822 in the Ministry of Natural Resources of the People’s Republic of China, the basemap boundary remains unchanged.
Remotesensing 16 02213 g001
Figure 2. Process for the classification and analysis of village land use.
Remotesensing 16 02213 g002
Figure 3. Land-use composition in the representative villages. Note: Building: built-up land, Road: road land, Unused: bare area, Farm: cropland, Grass: grassland, Forest: forest land, Number: Fractional vegetation coverage in the region. Abbreviations of the villages are established as follows: Xiadatan (XDT), HongGou (HG), TanBei (TB), SanLian (SL). This is primarily to show the overall result. Specific results can be found in Supplementary Figure S1.
Remotesensing 16 02213 g003
Figure 4. The proportion of different land-use types in the villages. Note: Villages with the same abbreviations are marked with *. All abbreviations’ specific meanings and locations are shown in Supplementary Table S1.
Remotesensing 16 02213 g004
Figure 5. Shape indexes of the representative villages. Note: Villages with the same abbreviations are marked with *. All abbreviations’ specific meanings and locations are shown in Supplementary Table S1.
Remotesensing 16 02213 g005
Figure 6. Distribution patterns of different village types. Note: The CI ranges for different types of villages are as follows. Strip type: 0.05–0.26, mixed-concentrated: 0.26–0.42, concentrated: 0.42–0.56, point: 0.56–0.77.
Remotesensing 16 02213 g006
Figure 7. Correlation between influencing factors and land-use types. Note: *** p < 0.001, * p < 0.05. Forest and Grass: forest land and grassland, Building: built-up land, Road: road land. MAT: mean annual temperature, AP: annual precipitation, Population: population density, Income: per capita income, Light: nighttime light index.
Remotesensing 16 02213 g007
Figure 8. Proportion of different land-use types in various regions. Note: Uppercase letters represent the comparison of different land types within the same region, while lowercase letters represent the comparison of different regions within the same land-use type.
Remotesensing 16 02213 g008
Table 1. Confusion matrix of land-use accuracy in typical villages of the Hehuang Valley in 2022.
Land-Use TypeBuilt-Up LandCroplandForest LandGrasslandRoad LandBare AreaWaterUA
Built-up Land44524012098.02%
Cropland21632301194.77%
Forest Land23165101095.93%
Grassland0128100195.29%
Road Land20011330097.79%
Bare Area1001056096.55%
Water0000007100.00%
PA98.45%96.45%95.38%93.10%99.25%93.33%77.78%
OA: 96.86% Kappa: 0.95
Note: UA: user accuracy, PA: producer accuracy, OA: overall accuracy.
Table 2. Proportion of different land-use types in different regions.
RegionMethodBuildingRoadUnusedWaterFarmGrassForest
Northern villagesMean27.81%13.11%7.13%2.54%25.66%11.76%11.99%
SD5.77%3.59%5.82%3.48%12.76%7.35%5.53%
Middle villagesMean34.32%19.02%5.21%0.24%21.01%4.86%15.33%
SD9.38%6.72%3.69%0.87%10.28%5.76%6.26%
Southern villagesMean32.94%17.42%10.62%0.04%8.70%6.00%24.28%
SD7.56%7.98%5.56%0.12%6.64%5.33%9.09%
Total regionMean0.58%6.51%17.76%6.19%16.41%19.54%33.01%
SD1.80%4.93%6.92%6.48%7.80%11.52%8.89%
Note: SD: standard deviation, Building: built-up land, Road: road land, Unused: bare area, Farm: cropland, Grass: grassland, Forest: forest land.
Table 3. Distribution patterns characteristics of the villages.
Distribution Pattern TypesNumberDistribution Patterns and Structure
Green SpaceResidential Space
Strip Type21Village roads, water systems, and protective green spaces are highly impacted by traffic and river flow, with clear linear features.Most of the layout along the road or river has a concentrated and contiguous distribution, with some rural areas experiencing hollowing out and significant damage to residential buildings.
Mixed-Concentrated Type12Village roads, water systems, and protective green spaces are distributed sporadically within the village.The development space is constrained, and the rural compounds are restricted, leading to a hollowing out of the countryside, severe damage to residential buildings, and fragmented distribution of distribution patterns.
Concentrated type15A small number of village roads, water systems, and protective green spaces are scattered throughout the village.The distance to the urban area is relatively small, with a high level of urbanization. Most residential space is characterized by concentrated and contiguous distribution, and some residences have been converted into high-rise buildings.
Point Type7The village roads, water systems, and protective green spaces are highly influenced by the terrain, with high ecological benefits.Rural hollowing out occurs, traditional dwellings remain relatively intact, and the distribution patterns are distributed in a scattered point-like manner.
Disclaimer/Publisher’s Note: The statements, opinions and data contained in all publications are solely those of the individual author(s) and contributor(s) and not of MDPI and/or the editor(s). MDPI and/or the editor(s) disclaim responsibility for any injury to people or property resulting from any ideas, methods, instructions or products referred to in the content.