Article

Dynamic Monitoring and Change Analysis of Lake Area on the Inner-Mongolian Plateau over the Past 22 Years

1
China Aero Geophysical Survey and Remote Sensing Center for Natural Resources, China Geological Survey, Beijing 100083, China
2
Key Laboratory of Aerial Geophysics and Remote Sensing Geology, Ministry of Natural Resources, Beijing 100083, China
*
Author to whom correspondence should be addressed.
Remote Sens. 2024, 16(12), 2210; https://doi.org/10.3390/rs16122210
Submission received: 6 May 2024 / Revised: 6 June 2024 / Accepted: 15 June 2024 / Published: 18 June 2024
(This article belongs to the Section Remote Sensing for Geospatial Science)

Abstract

:
Lakes are essential components of the terrestrial water cycle. Their size and quantity reflect natural climate change and anthropogenic activities in time. Lakes on the Inner-Mongolian Plateau (IMP) have experienced significant changes in recent decades, but the current situation remains elusive. In this study, we conducted multi-decadal intensive monitoring of lake area and performed comprehensive variation analysis on the IMP. The study involved pre-processing, lake area extraction, post-processing, and lake area analysis procedures using multi-source satellite images. The results reveal the detailed variation in the lake from various aspects. The temporal analysis indicates that the lake area has undergone two distinct periods of decline followed by subsequent increase, and the variation pattern from January to December was diverse. The spatial analysis suggests that the lake area expanded slightly in the western and southern parts, while the area shrank in the other two. Variations in lakes of different sizes exhibited spatial heterogeneity. To some extent, effective actions have led to lake rehabilitation, but it has not yet reached or surpassed the level of 2000. This study provides a substantial data basis and technological guidance for conducting lacustrine surveys. The results can play important roles in fostering further analyses of the water cycle and the carbon cycle.

1. Introduction

Lakes are pivotal components of the ecosystem. They play vital roles in irrigation development, river runoff regulation, water resources supplementation, and biodiversity maintenance, and are also considered as “sentinels, integrators, and regulators of climate change” [1,2]. The surface area of lakes can be further used to assess mass balance, volumetric changes, and water loss, which are essential to the water cycle and sustainable development [3,4,5]. The constant monitoring of lakes is essential for understanding the dynamics and functioning of the Earth System. The Inner-Mongolian Plateau is situated in an arid and semi-arid region. The lake area in the Inner-Mongolian Plateau occupies 0.2% of its terrestrial surface. The lake area reflects timely responses to both meteorological events and anthropogenic interventions in the region. Studies have revealed an increase in the total lake area in China, but a rapid loss of lakes on the Inner-Mongolian Plateau in recent decades [6,7]. This loss is more significant in Inner Mongolia of China than in Mongolia, primarily due to the increasing exploitation of underground mineral and groundwater resources [8,9]. This is in contrast to the increasing trend in the adjacent Tibetan Plateau, which is experiencing the opposite regional climate change [10]. The adverse effects of lake shrinkage are evident. The disadvantages have been widely discussed, such as land desertification, reduced evaporation, and impacts on biodiversity. These factors lead to negative effects on the water cycle, carbon cycle, and terrestrial ecosystems [11]. However, lake expansion is also a double-edged sword. The expansion of lakes from the riverbanks could result in the formation of barrier lakes, potentially leading to the loss of cropland and increased flooding. The surface area of lakes on flat terrain varies over time due to the rapid evaporation and precipitation [12,13]. Thus, acquiring accurate lake area data is fundamental for conducting comprehensive studies and analyzing variations in lakes. Despite valuable efforts in lake observation, accurate, continuous, and high-frequency monitoring results in recent years are still lacking.
Extensive research has been conducted on lake dynamics to determine the specific conditions of lake areas and their variations. Due to the remoteness and the vast number of lakes, traditional methods of field observations and investigations can be laborious and time-consuming. Remote sensing has been proven to assist in lake monitoring due to its advantages of high efficiency [14]. The advent and application of continuous observing satellites and sensors such as MODIS and Landsat enable large-scale and intensive monitoring of lake surface area [15,16]. The combination of various spectral indices followed by thresholds can be an efficient method to extract water body surface [17,18,19]. The Modified Normalized Difference Water Index (MNDWI), the Normalized Difference Vegetation Index (NDVI), and the Enhanced Vegetation Index (EVI) have been widely used to delineate water surfaces. Their applications across various terrains have been thoroughly studied [20,21,22,23,24]. Novel spectral indices were also created for water body extraction. The Automated Water Extraction Index (AWEI) was developed to enhance water extraction accuracy in the presence of various types of environmental noise and offers a stable threshold value, the accuracy and robustness of which were evaluated using Landsat images, and it performed well [25]. The Sentinel-2 water index (SWI) was developed based on the red-edge band and shortwave infrared band. The integration of SWI and the Otsu algorithm has been proven to exhibit high overall accuracy [26]. With the extraction results, the variations in surface area and the number of lakes can be further discussed and analyzed [27]. With the vast amount of remote sensing data available, the cloud computing platform Google Earth Engine has become increasingly significant. This is attributed to its high-speed computational capabilities and extensive collection of publicly accessible remote sensing imagery and other products [28,29,30]. The production of the annual mapping of large lakes (greater than 10 km2) on the Tibetan plateau from 1991 to 2018 using the Google Earth Engine exhibited high overall accuracy and demonstrated its capability in calculating lake areas for further analysis [31].
Despite the numerous research studies on changes in lake area, there is still room for improvement in monitoring and analyzing lake dynamics. Existing studies have primarily focused on individual lakes, especially the large ones, during specified observation years or short periods, leading to constraints in lake investigation [32,33,34]. A significant number of ecological programs and protection strategies have been formulated and applied since people realized that the environment was facing great challenges. However, the effects of these efforts have remained elusive. Thus, it is necessary to conduct a long-term, high-frequency census of the lake area using multi-resource satellite data to determine the variation patterns and the current conditions. To address the limitations of the aforementioned issues, we introduce new lake observation findings derived from satellite data using semi-automated extraction methods based on Google Earth Engine. In this study, the objectives are as follows: (1) to establish long-term, high-frequency spatial and temporal monitoring of lake areas, (2) to assess the spatial and temporal changes in lake area on the Inner-Mongolian Plateau from 2000 to 2021, and (3) to conduct comprehensive variation pattern analysis of lake area and temporal, spatial, and size factors and identify key insights.

2. Data and Methods

2.1. Study Area

There are five major lake zones in China, specifically the Tibetan Plateau, Xinjiang and Inner-Mongolian Plateau, Northeast Plain and Mountain, Eastern Plain, and Yunnan-Guizhou Plateau [6,35]. The study area in this paper is located on the Inner-Mongolia Plateau (hereafter referred to as the IMP), spanning from 92°45′E to 126°4′E, and from 31°42′N to 53°19′N, as illustrated in Figure 1. The IMP is part of the Mongolia–Xinjiang Plateau and shares a border with Mongolia to the north, encompassing an area of over 1.96 million square kilometers. There are five provinces in the study area. The majority of the IMP is situated at an elevation below 2000 m, while the southwestern corner of the study area is at a higher elevation.
Three types of lakes are discussed in this study: natural lakes, artificial reservoirs, and artificial lakes. In the study area, occasional puddles and pools form due to the flat terrain and sudden precipitation. The size of these puddles depends on the weather, and they disappear rapidly. The area they inhabit is typically less than 1 km2. Therefore, this section of the lake area is not the focus of research. We divided the study area into three spatial regions based on groundwater resource zones. The sub-regions consist of the western and southern parts, the central and eastern parts, and the northeastern part. Continuous monitoring of lakes larger than 1 km2 on the IMP was conducted annually and monthly from 2000 to 2021.

2.2. Lake Area Extraction

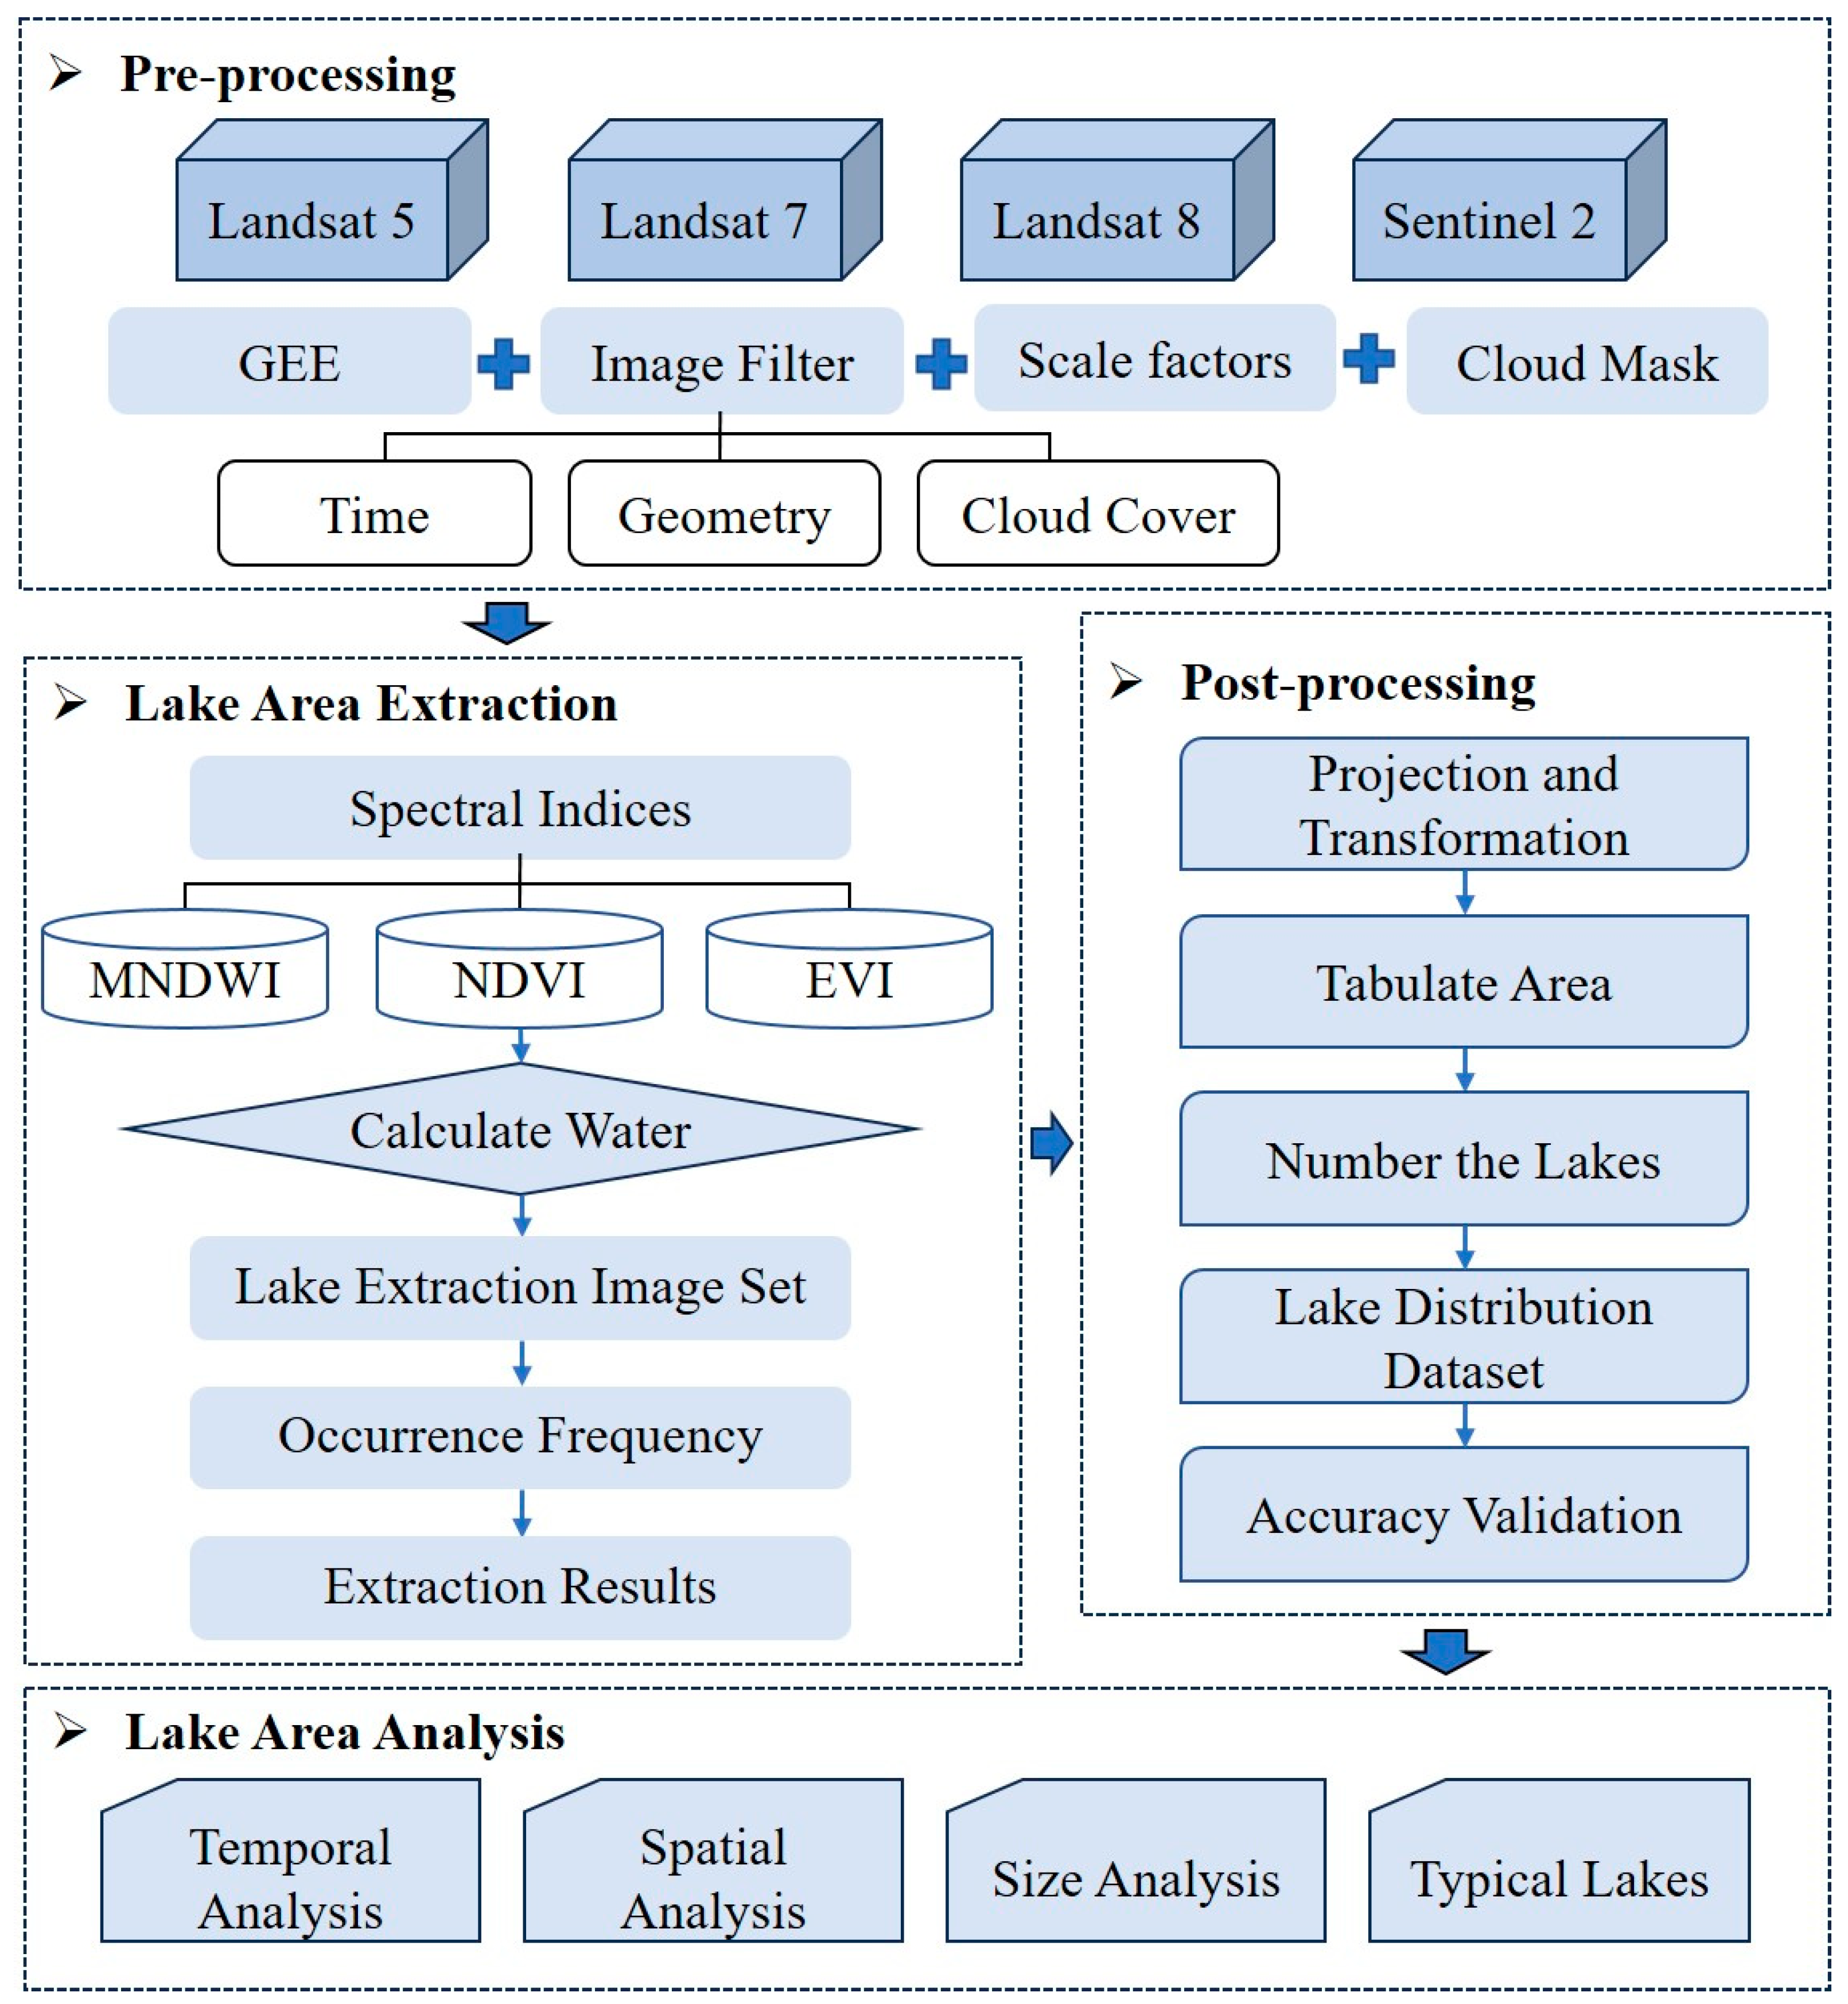
Four stages of lake area extraction, including the pre-processing stage, lake area extraction stage, post-processing stage, and lake area analysis stage, are conducted in this study. The detailed processing is illustrated in Figure 2.
The pre-processing stage filtered out qualified images for the subsequent procedures. Multiple remote sensing datasets, such as Landsat 5, Landsat 7, Landsat 8, and Sentinel-2 multispectral images, are utilized due to their moderate-to-high spatial resolution, extensive data coverage, and temporal continuity for long-term, high-frequency observation of lake areas. To manage the large number of images, Google Earth Engine (https://earthengine.google.com/, accessed on 1 March 2022, hereafter referred to as the GEE platform) plays a crucial role in processing remote sensing images and calculating spectral indices. This cloud-based platform has been widely used for geo-big data applications and planetary-scale monitoring [30,36,37], and its capabilities for big data processing have been demonstrated in studies on crop extraction, global forest cover change, and land change detection [38,39,40]. Similar studies focusing on the detection and monitoring of surface water have also been conducted, demonstrating excellent performance [41,42,43,44,45]. The image filter successfully identified images within the specified time ranges, geological boundaries, and cloud cover conditions. To eliminate atmospheric errors, surface reflectance products were used. All qualified images were used in this study (shown in Table 1). Since there was temporal overlapping coverage caused by Landsat sensors, multiple transit images can be observed in the same study area in a single day. To eliminate the overlapping coverage between 2000 and 2018, we mosaicked the images on the same day based on their averaged pixel values. Scale factors and cloud masks were then applied to the band reflectance.
The lake area extraction stage was conducted using various software and platforms, primarily on Google Earth Engine (referred to as GEE, edited by Earth Engine Code Editor), ArcGIS 10.6 (ESRI, Hong Kong, China), and Python (PyCharm 2022.2.3). Three factors, namely slope (SRTM), spectral indices, and occurrence frequency, are used to extract the lake area. The SRTM data are derived from GEE. The spectral indices in the study include the Normalized Difference Vegetation Index (NDVI), the Modified Normalized Difference Water Index (MNDWI), and the Enhanced Vegetation Index (EVI) due to their reliable performance in extracting open-surface water bodies while considering the influence of complex land use types and vegetation influence [19,46,47]. The equations of the indices are as follows:
N D V I = N I R R N I R + R
M N D W I = G S W I R G + S W I R
E V I = 2.5 × N I R R N I R + 6 × R 7.5 × B + 1
In these equations, NIR stands for near-infrared reflectance, R stands for red reflectance, SWIR stands for short-waved reflectance, G stands for green reflectance, and B stands for blue reflectance. The determining conditions to discriminate water and non-water are as follows: (1) EVI lower than 0.1, (2) MNDWI greater than NDVI, or MNDWI greater than EVI. The determination of the lake boundary also relies on the occurrence frequency. Due to the flat terrain of the IMP, small ponds and puddles can be found everywhere. They fluctuate and disappear rapidly, leading to errors in the evaluation of the lake area. Thus, the frequency of water occurrences is needed and helps to exclude the unqualified lakes. For each pixel extracted as water, we calculated its frequency of water occurrences in the image sets and decided on the pixel with an occurrence frequency larger than 25% as water; otherwise, the pixel was not considered as water. In this study, the definition of lake individuals and their interactions may vary from previous studies. Some lakes remained connected due to the presence of a river, while others separated into smaller lakes as the area narrowed.
In the post-processing stage, the Projected Coordinate System of all images was reprojected to Albers Conical Equal Area for area statistics. After lake extraction binary images were completed in raster format, we mosaicked all images into a single image to obtain the largest extent of all the lakes. We generated a lake boundary shapefile based on the largest extent of lakes with a 50 m buffer to eliminate the error of underestimation. A batch-processing tool via Python was used to tabulate the area for each year/month. After acquiring all lake area data, we ranked the lakes based on their average area and assigned them unique IDs. The attribute table stores the area of each lake and includes additional attributes such as names and the spectral regions they belong to. Thus, a dataset of lake distribution was created.
In the area analysis stage, temporal analysis (annual and monthly), spatial analysis, and lakes of various sizes were conducted. For annual monitoring, images taken from May to October with cloud cover below 20% were used. For monthly monitoring, all images taken during the specific month with low cloud cover were used. For spatial analysis, variations in three regions are discussed. For size analysis, we categorized the lakes into four groups. In this study, we determined that a lake with a smaller area in 2021 compared to 2000 is considered a shrinking lake, and vice versa. Both the annual rate of change and the total lake area change rate were utilized in this study. The equations are as below:
Area = Slope × Year + c
Note: Area is the yearly total lake area (km2), Slope is the average changing rate (km2/a, Year is the target time, and c is the constant.
R A n n u a l = S t 2 S t 1 / t
R C h a n g i n g = S t 2 S t 1 S t 1 × 100 %
Note: S t 1 is the total lake area of the base year, S t 2 is the total lake area of the end year, t is the year interval.
The accuracy assessment was conducted to evaluate lake area extraction. We calculated RMSE, MAE, and R2 values between our dataset and previous lake datasets (see Section 3.4).

3. Results

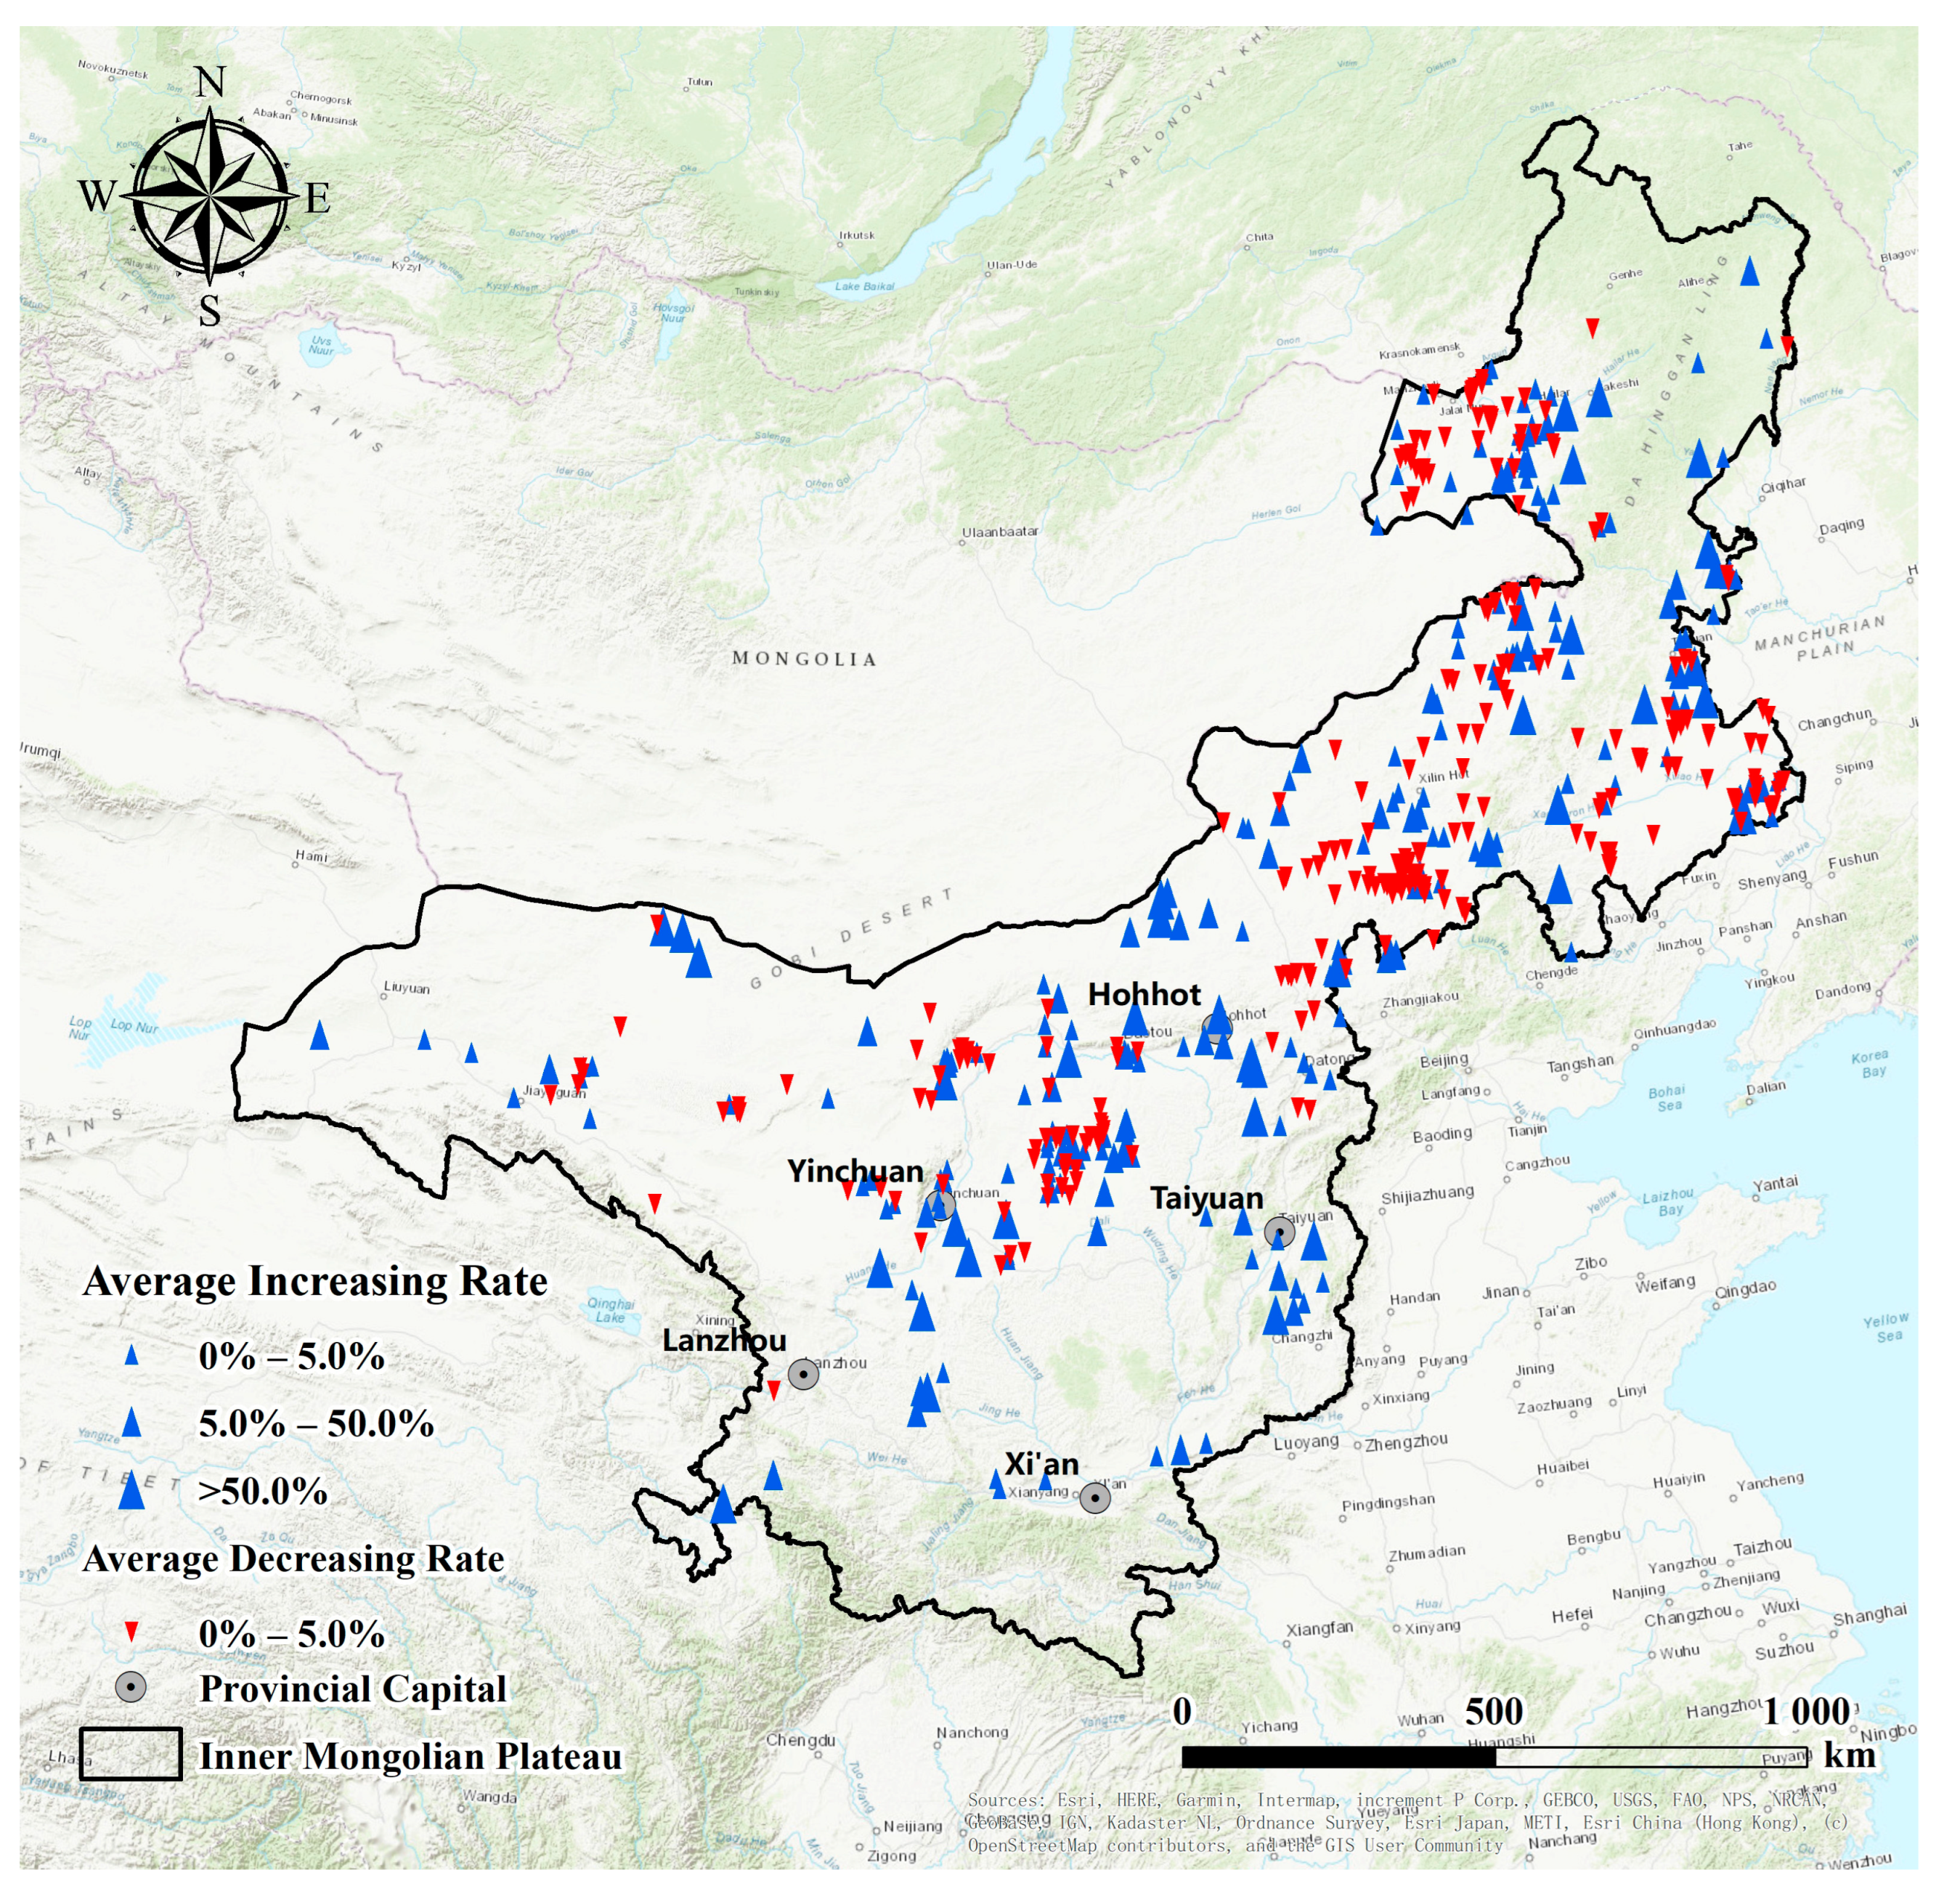
With the area extraction results, the distribution and area variation are depicted in Figure 3. In total, there was a decrease followed by a recovery of lake areas in the IMP. According to the comparison between the starting year (2000) and the ending year (2021), the rehabilitation has not reached the initial level. The results indicate that the total lake area of the IMP has decreased by 225.5 km2. What sets this monitoring report apart from the previous ones is that, although there were more lakes decreasing in size than increasing, the rates of change for the increasing lakes were greater than those for the decreasing lakes. We classified the rates into 0–5.0%, 5.0–50.0%, and greater than 50.0%. The averaging decreasing rates are all below 5.0%, while the increasing rates ranged from 0.0% to greater than 50.0%. As shown in Figure 3, there were more red triangles (representing decreasing lakes) than blue triangles (representing increasing lakes) in the area. However, the blue triangles are larger than the red triangles (the larger triangles represent faster rates). To understand the detailed changing patterns, we conducted further temporal and spatial analyses, as well as variations in lakes of different sizes. Additionally, we examined two typical lakes with contrasting trends in area variation.

3.1. Temporal Analysis

3.1.1. Inter-Annual Changing Rate

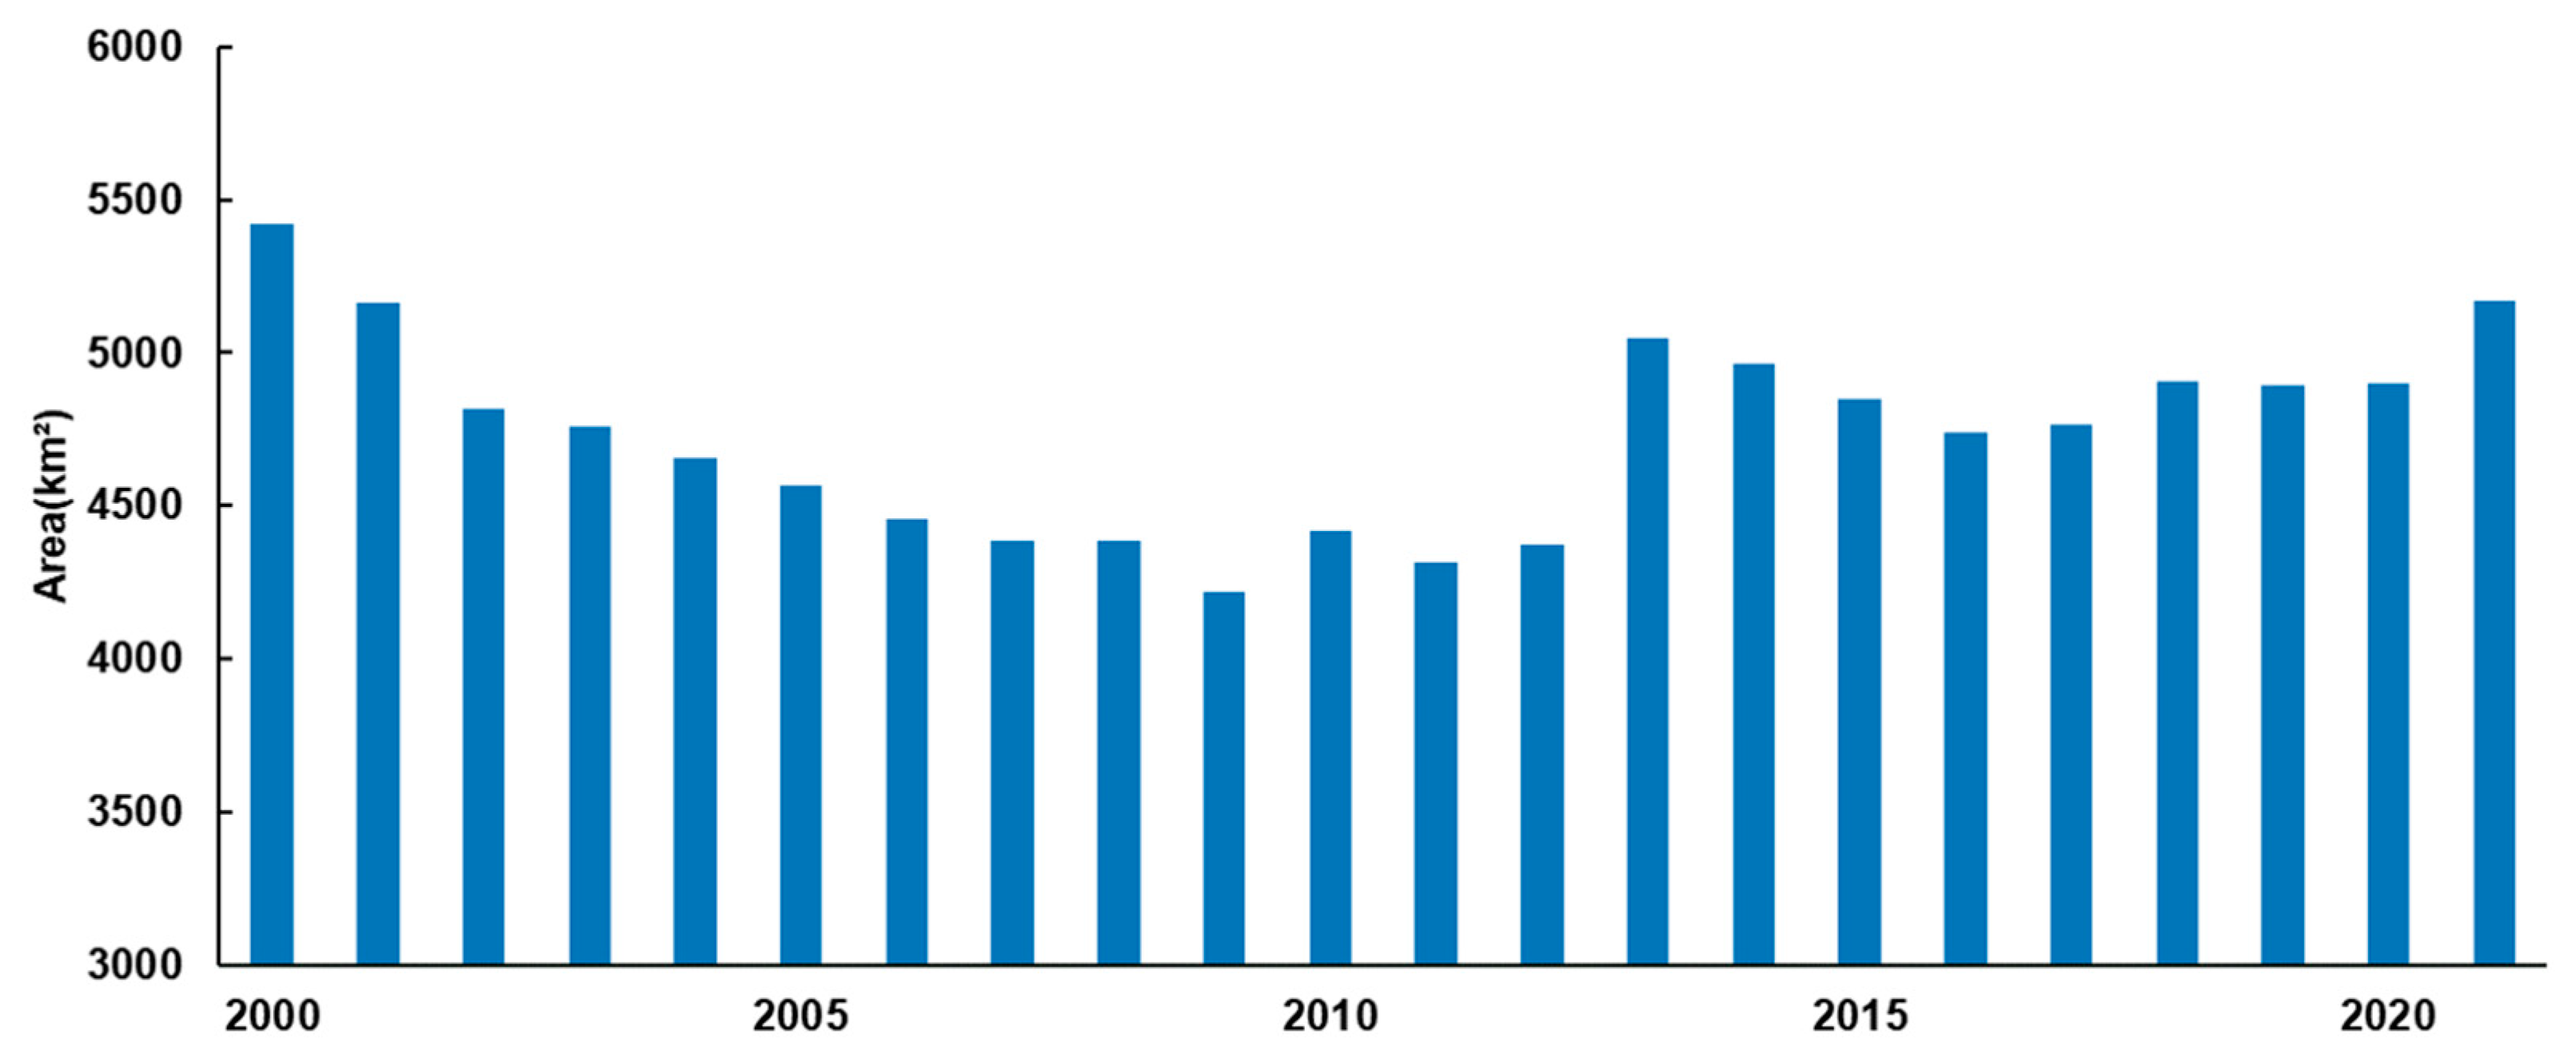
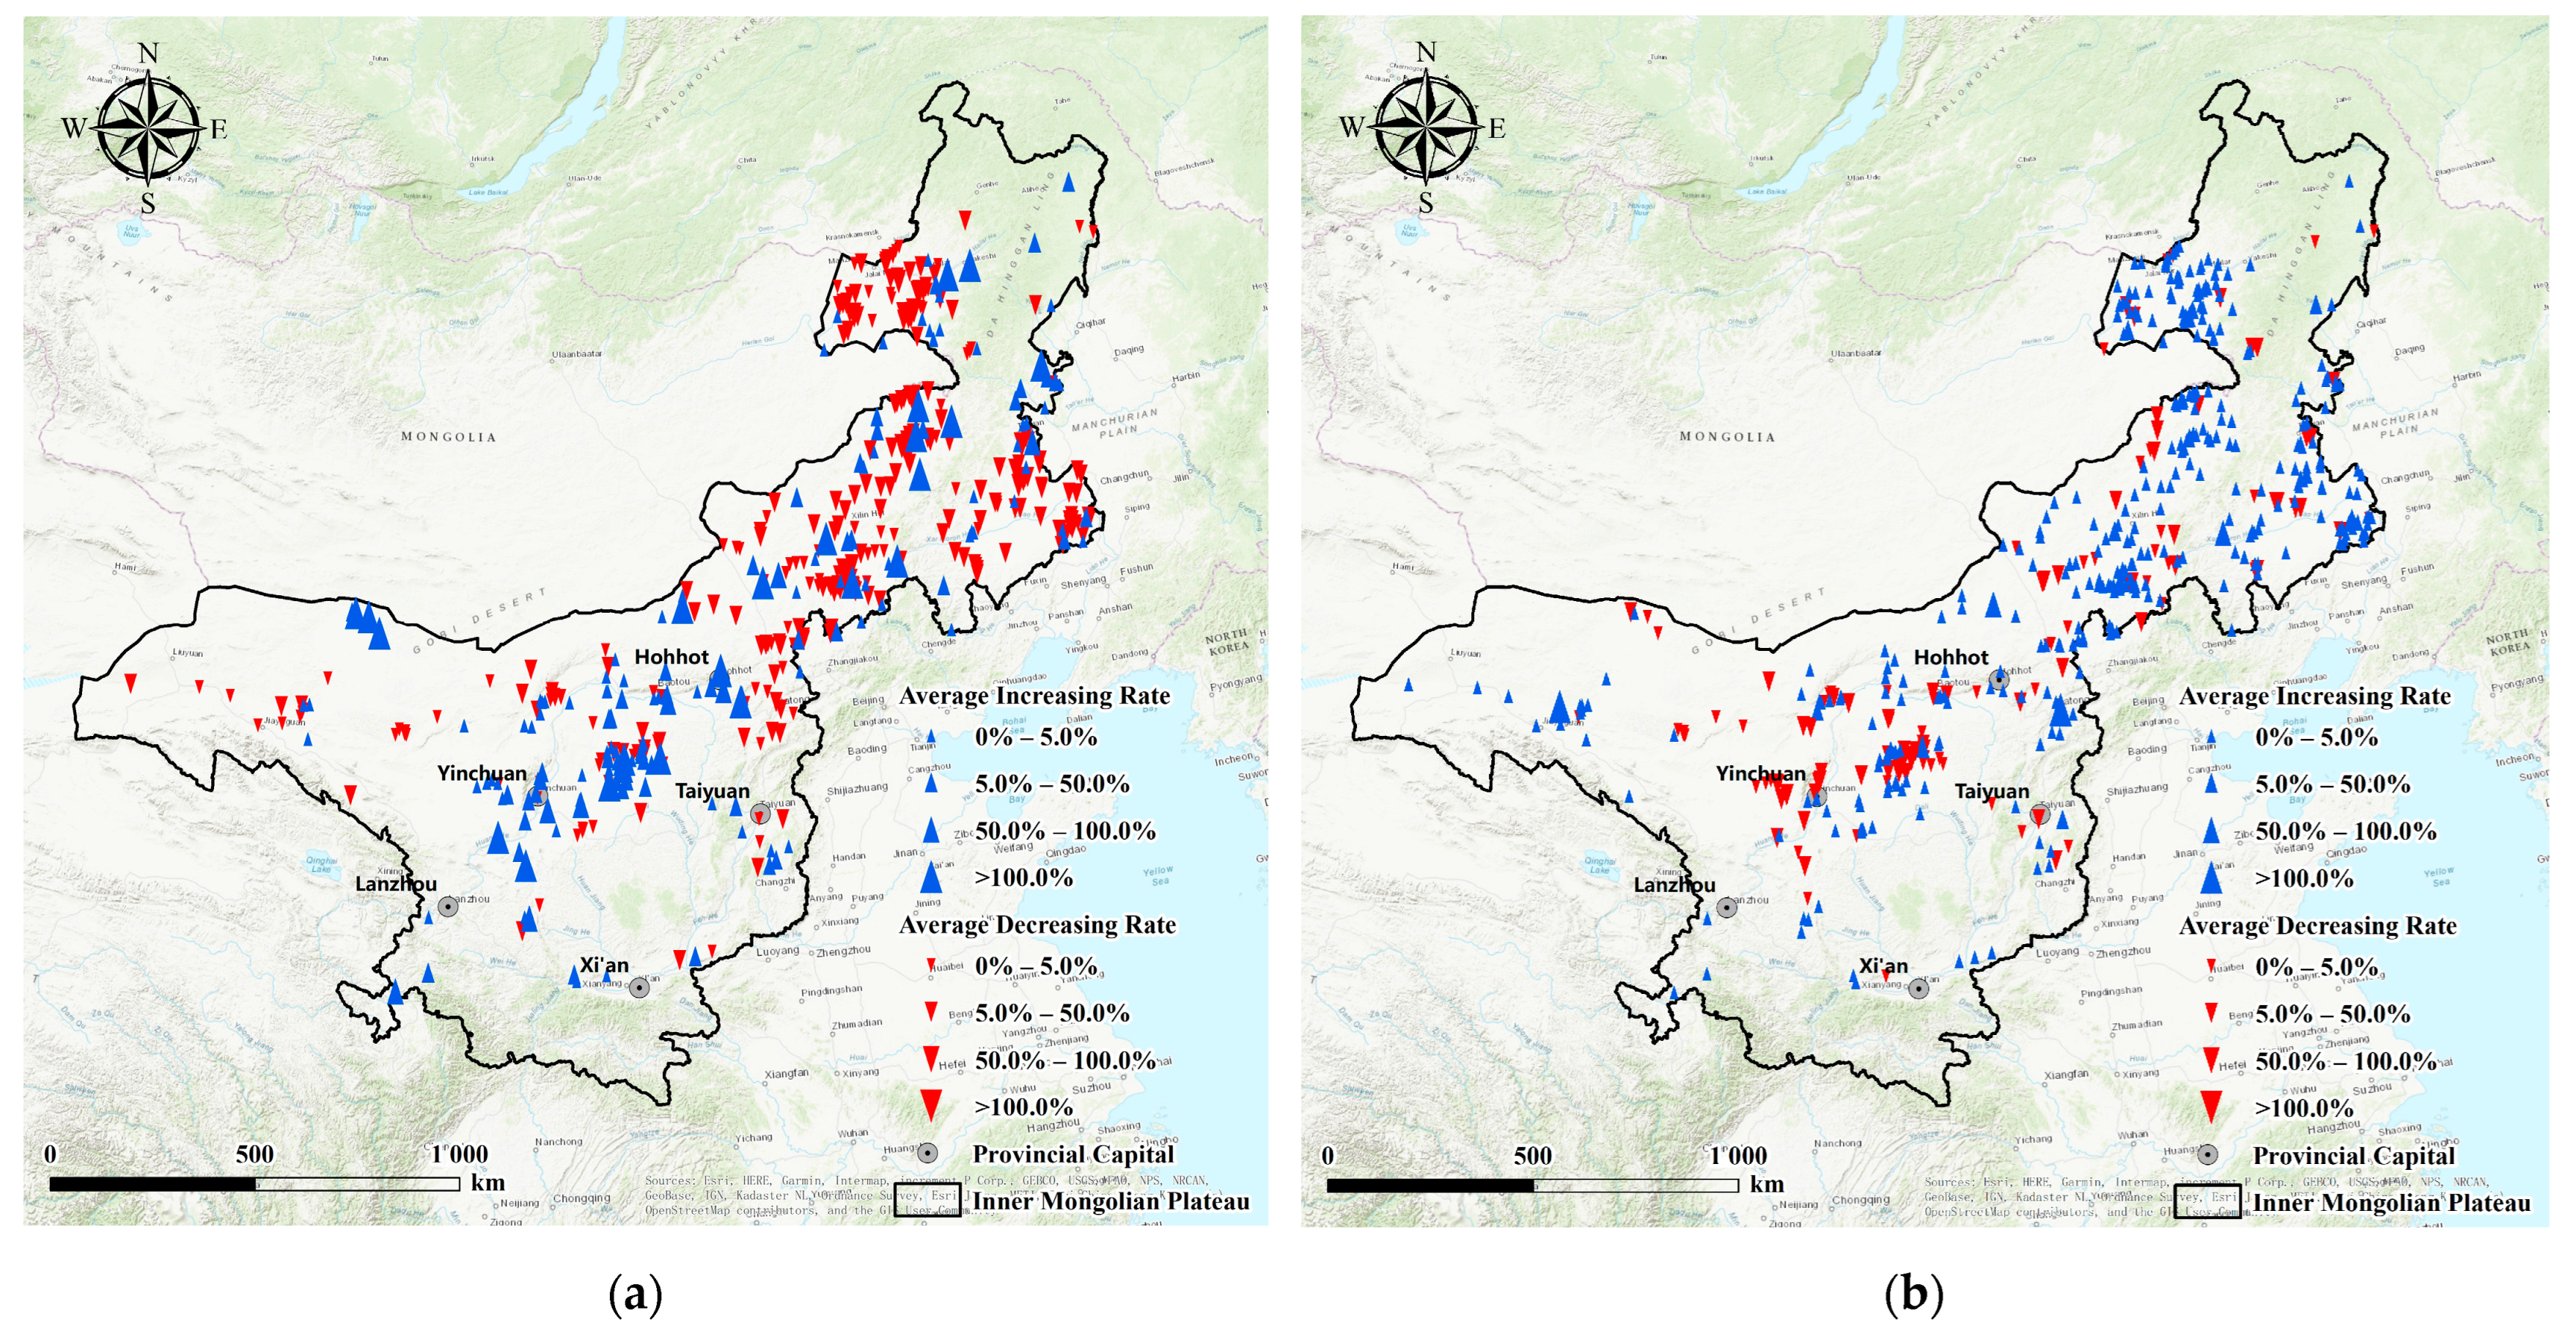
Although the total lake area was similar in 2000 and two decades later, in 2021, significant variability was observed within this time period. Figure 4 illustrates the detailed annual total lake area to provide a better understanding of the area changes in the IMP over the last two decades. The variation process can be divided into two “U”-shaped periods. The first “U” period lasted from 2000 to 2013. The total lake area decreased between 2000 and 2009. The shrinking trend is evident during the first 10 years with the RAnnual of −129.2 km2/a, representing a 21.2% decrease in the area. There was a significant increase from 2009 to 2013 with the RAnnual of 198.9 km2/a, representing an 18.5% growth in the area. The second “U” period lasted from 2013 to 2021. Both the decreasing and increasing rates were lower than those of the first period. The decreasing RAnnual from 2013 to 2016 was −94.7 km2/a, representing a 5.6% reduction in the area. The increasing RAnnual from 2016 to 2021 was 85.2 km2/a, representing an 8.8% growth in the area. The total lake area was increasing at a relatively slow pace. In total, the lake area in the final year is still smaller than it was in the first year. Figure 5 illustrates the area variation rates for four phases: 2000–2009, 2009–2013, 2013–2016, and 2016–2021. In Figure 5a,c the red triangles are more numerous and larger than the blue triangles, indicating decreasing trends in these phases. Conversely, in Figure 5b,d, the opposite situation is observed, indicating increasing trends. However, the blue triangles in Figure 5b are smaller than those in Figure 5d, indicating a slower rate of increase.

3.1.2. Intra-Annual Changing Pattern

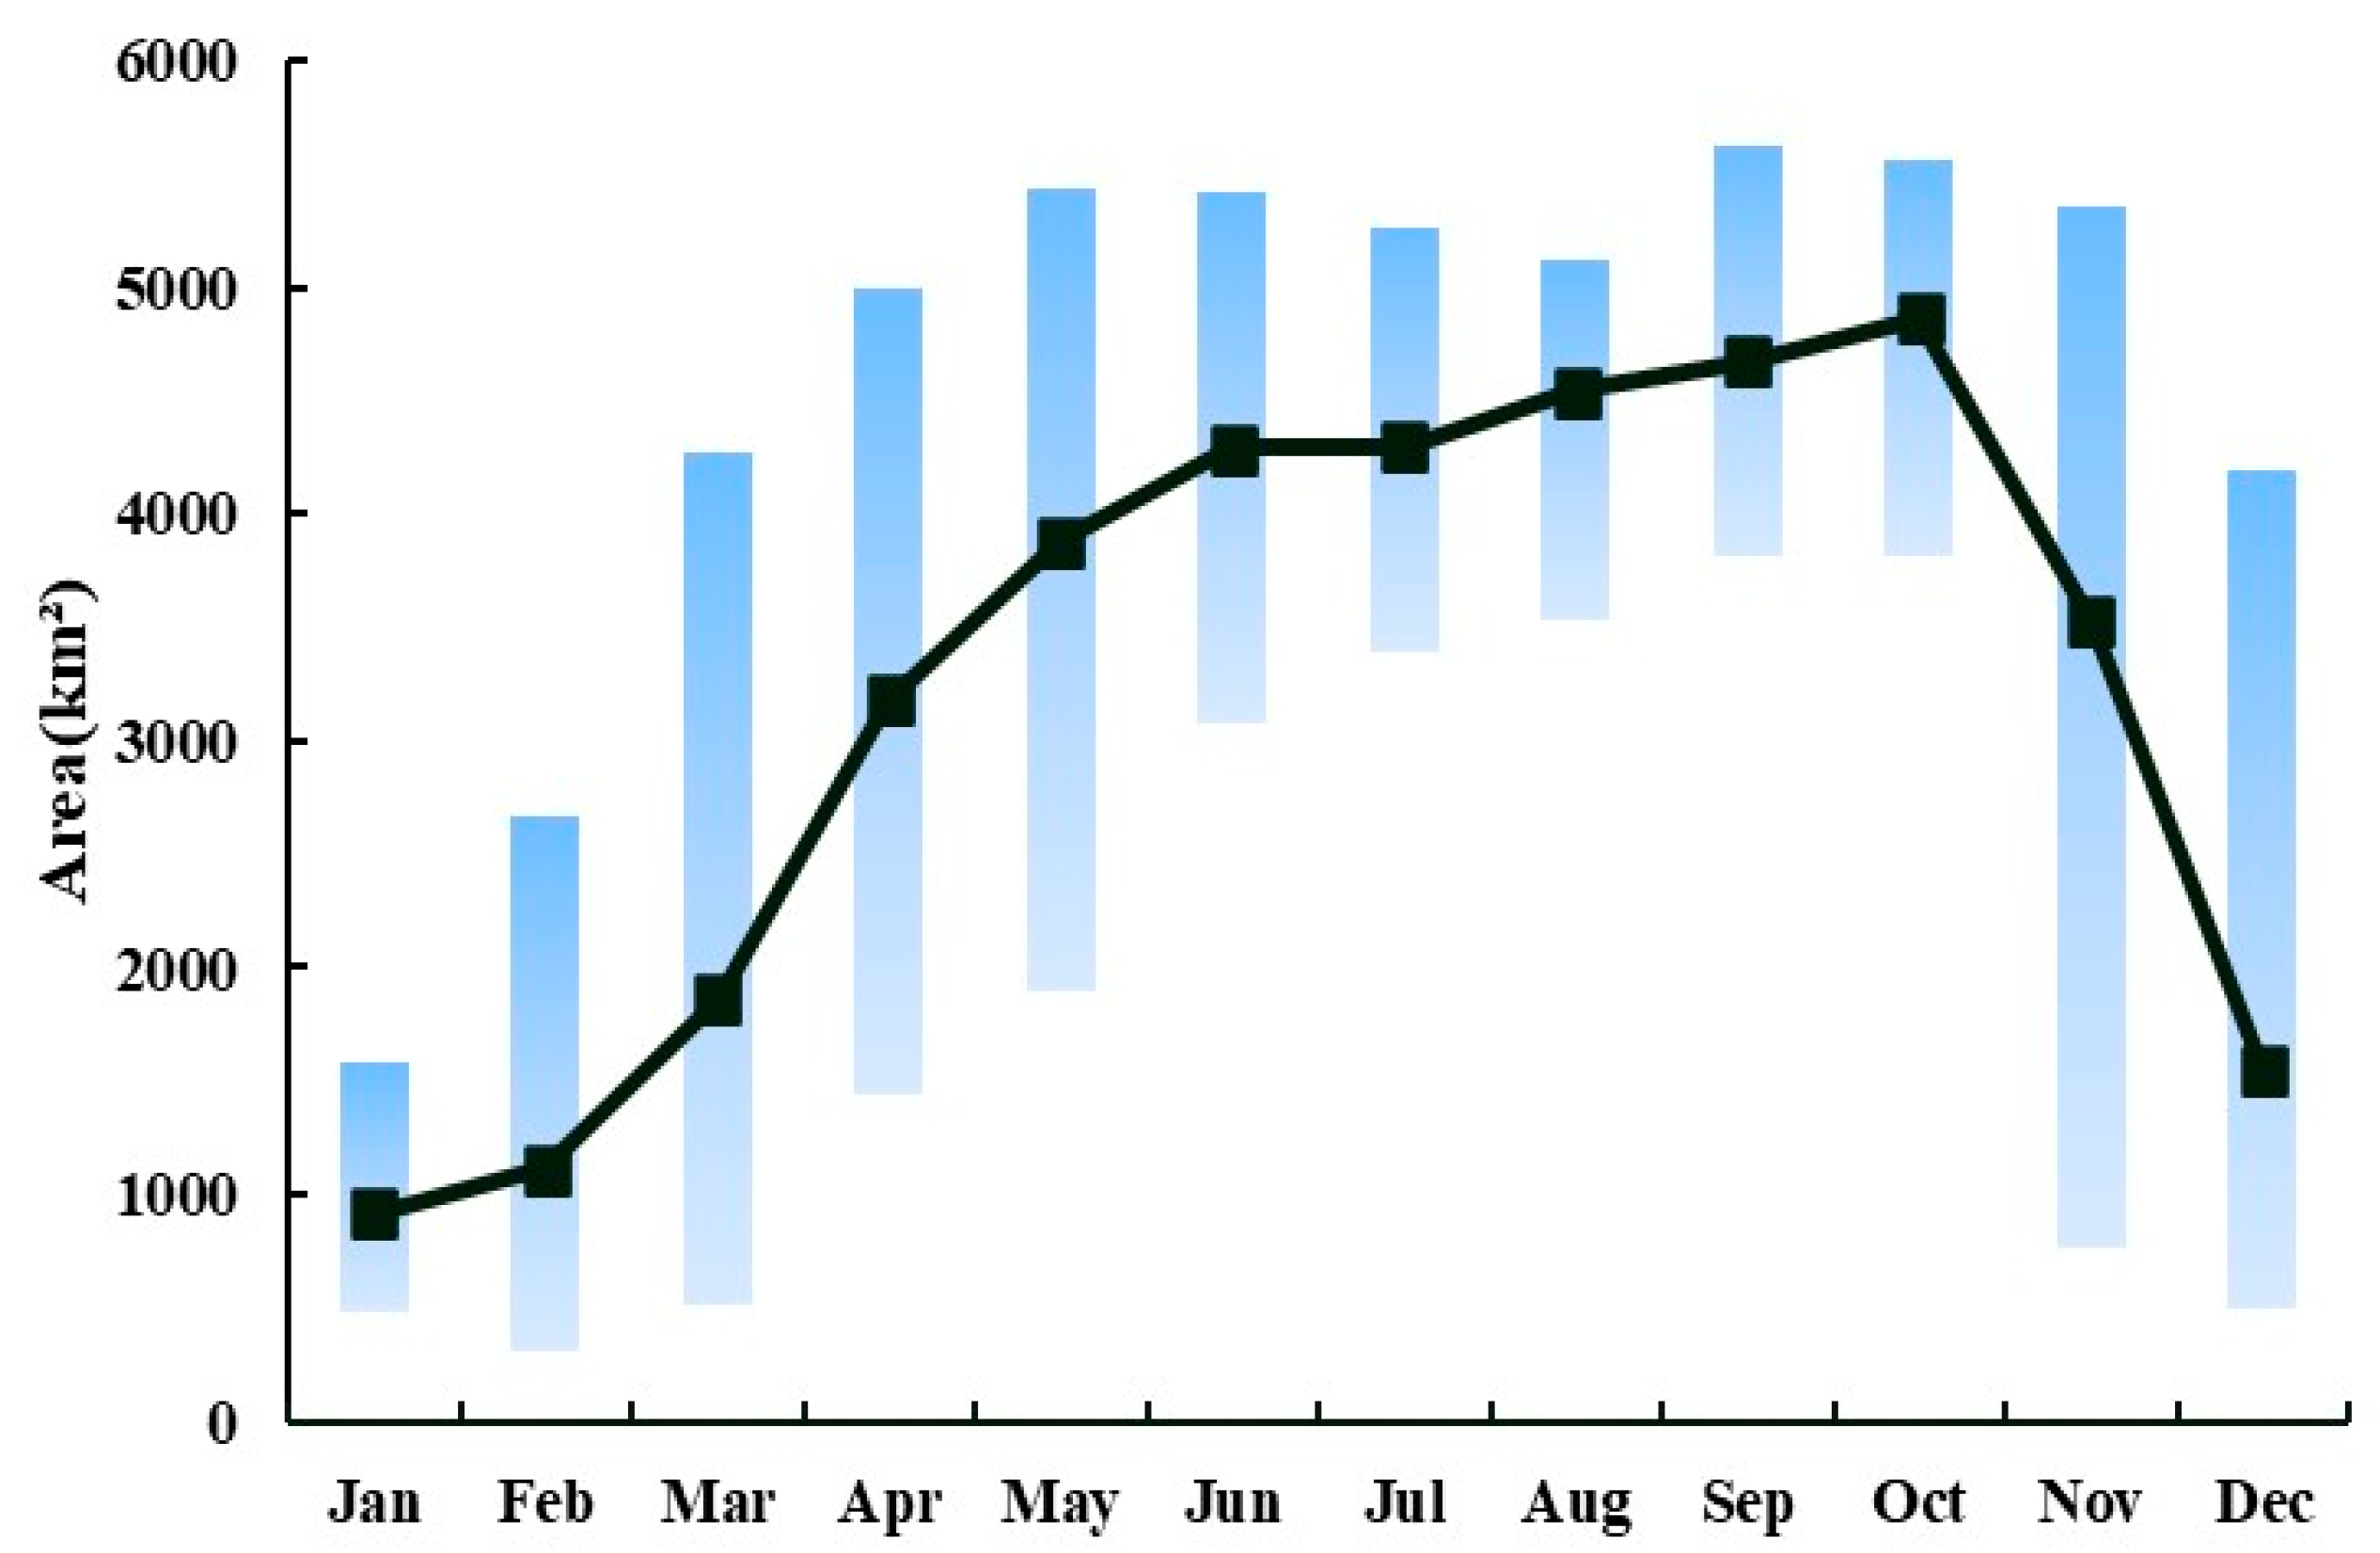
To further analyze the changing patterns of the lake area, the monthly area was extracted from January to December using the monthly period satellite images introduced in Section 2.2. Figure 6 shows the specific monthly area variation curves, indicating the detailed changing patterns. The black line indicates the monthly average lake area, while the blue bar represents the minimum and maximum lake area for each month. Although there was a range of values for the monthly area, the trends in minimum, maximum, and average values were consistent. The intra-annual changing pattern can be divided into three phases based on the variation status.
In phase 1 (January to May), the area increased rapidly from 915.9 km2 to 3879.8 km2, with the RChanging of 323.6%; in phase 2 (May to October), the area increased gently with the RChanging of 25.3%; in phase 3 (October to December), the lake area decreased rapidly with the RChanging of −68.1%. In December, the area decreased to a relatively small size. Most lake areas reached their peak in October. The largest lake area appeared in October.

3.2. Spatial Analysis

Further analysis of lake area variation was conducted for three spatial regions: the western and southern parts, the central and eastern parts, and the northeastern part. As shown in Figure 7, the lake areas have undergone significant changes over the past two decades. Despite experiencing similar climates, the patterns of variation in lake areas in three regions are markedly divergent. The area variation from 2000 to 2021 exhibited spatial differences.

3.2.1. The Western and Southern Parts

As illustrated in Figure 7a, the increasing trend in the lake areas is distinct. In the western and southern parts, the lake areas in 2021 are greater than the areas in 2000. The slope of variation is 0.76 (calculated as Equation (4)). The lake area has increased by 38.5% since 2000 with a RAnnual of 12.5 km2/a.

3.2.2. The Central and Eastern Parts

As illustrated in Figure 7b, the lake area exhibited a noticeable decrease in the central and eastern parts. The decreasing trend was not fixed; there was a surge in 2013. More than one-third of the lakes are located in this region, and the lake area has decreased by 42.5% since 2000 with a RAnnual of −27.4 km2/a. The slope of variation is −28.14.

3.2.3. The Northeastern Part

The northern part plays a dominant role in the IMP due to its vast area. Thus, there was a similarity between variation trends in the northern part and the total IMP. The figure showed two “U”-shaped curves for lake area. The lake area decreased from 2000 to 2008, and then increased from 2009 to 2015. Another decrease occurred from 2015 to 2017, followed by an increase up to 2021. The turning points in time are slightly different from the total lake area on the IMP. Generally, there was a slight increase in area with a RAnnual of 3.51 km2/a, and a RChanging of 2.4% compared to the initial year. The slope of variation is 13.9.

3.3. Lakes of Different Sizes

To further explore the changes in lakes, we investigated the variation in the area of lakes with an average surface area greater than 1 km2. All lakes were categorized into four size categories: small (1–5 km2), medium (5–10 km2), large (10–50 km2), and very large (>50 km2).
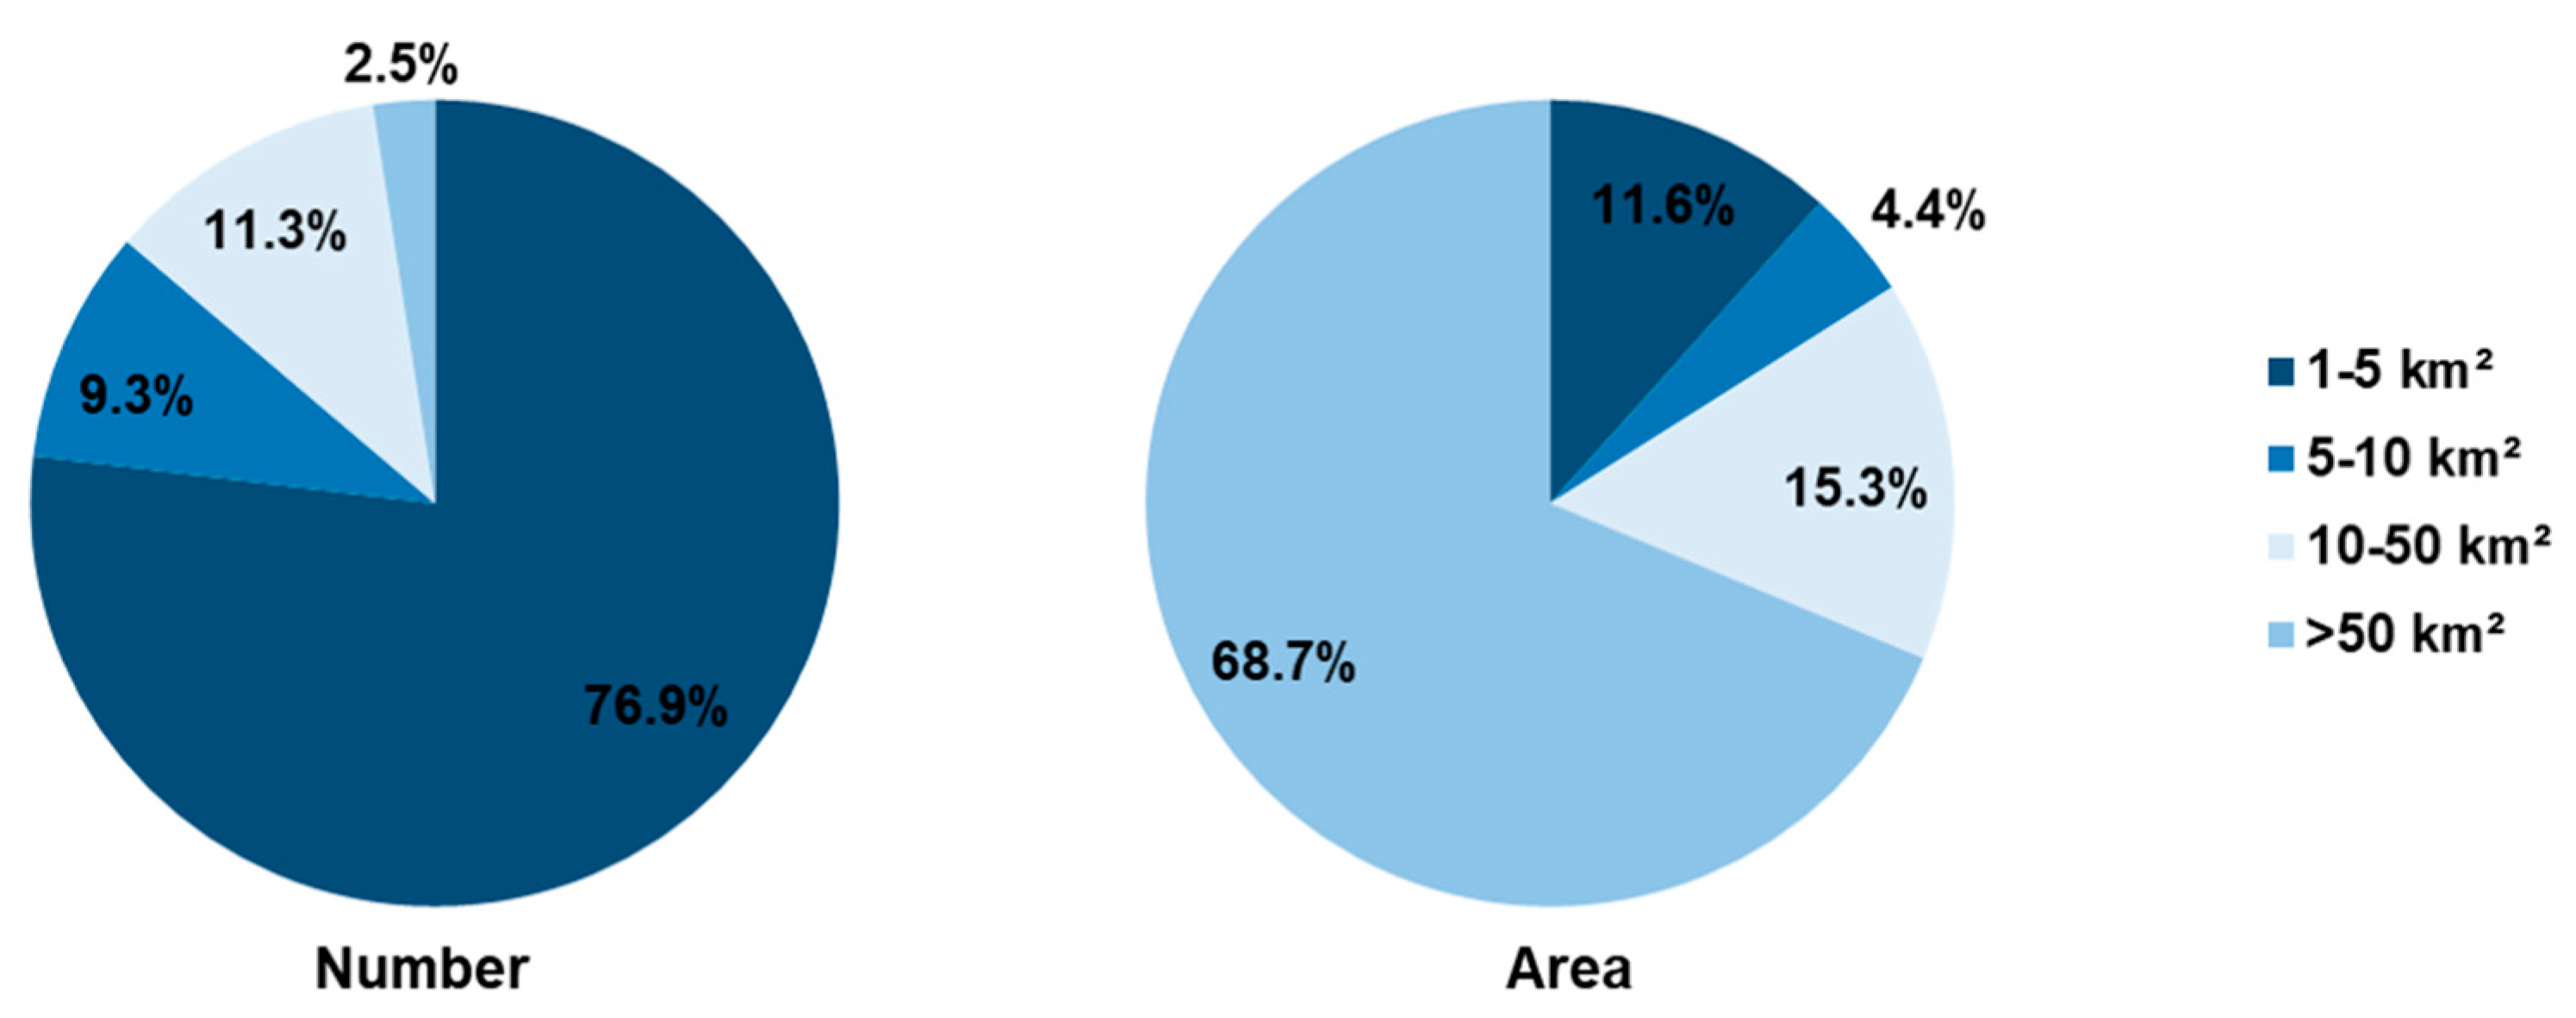
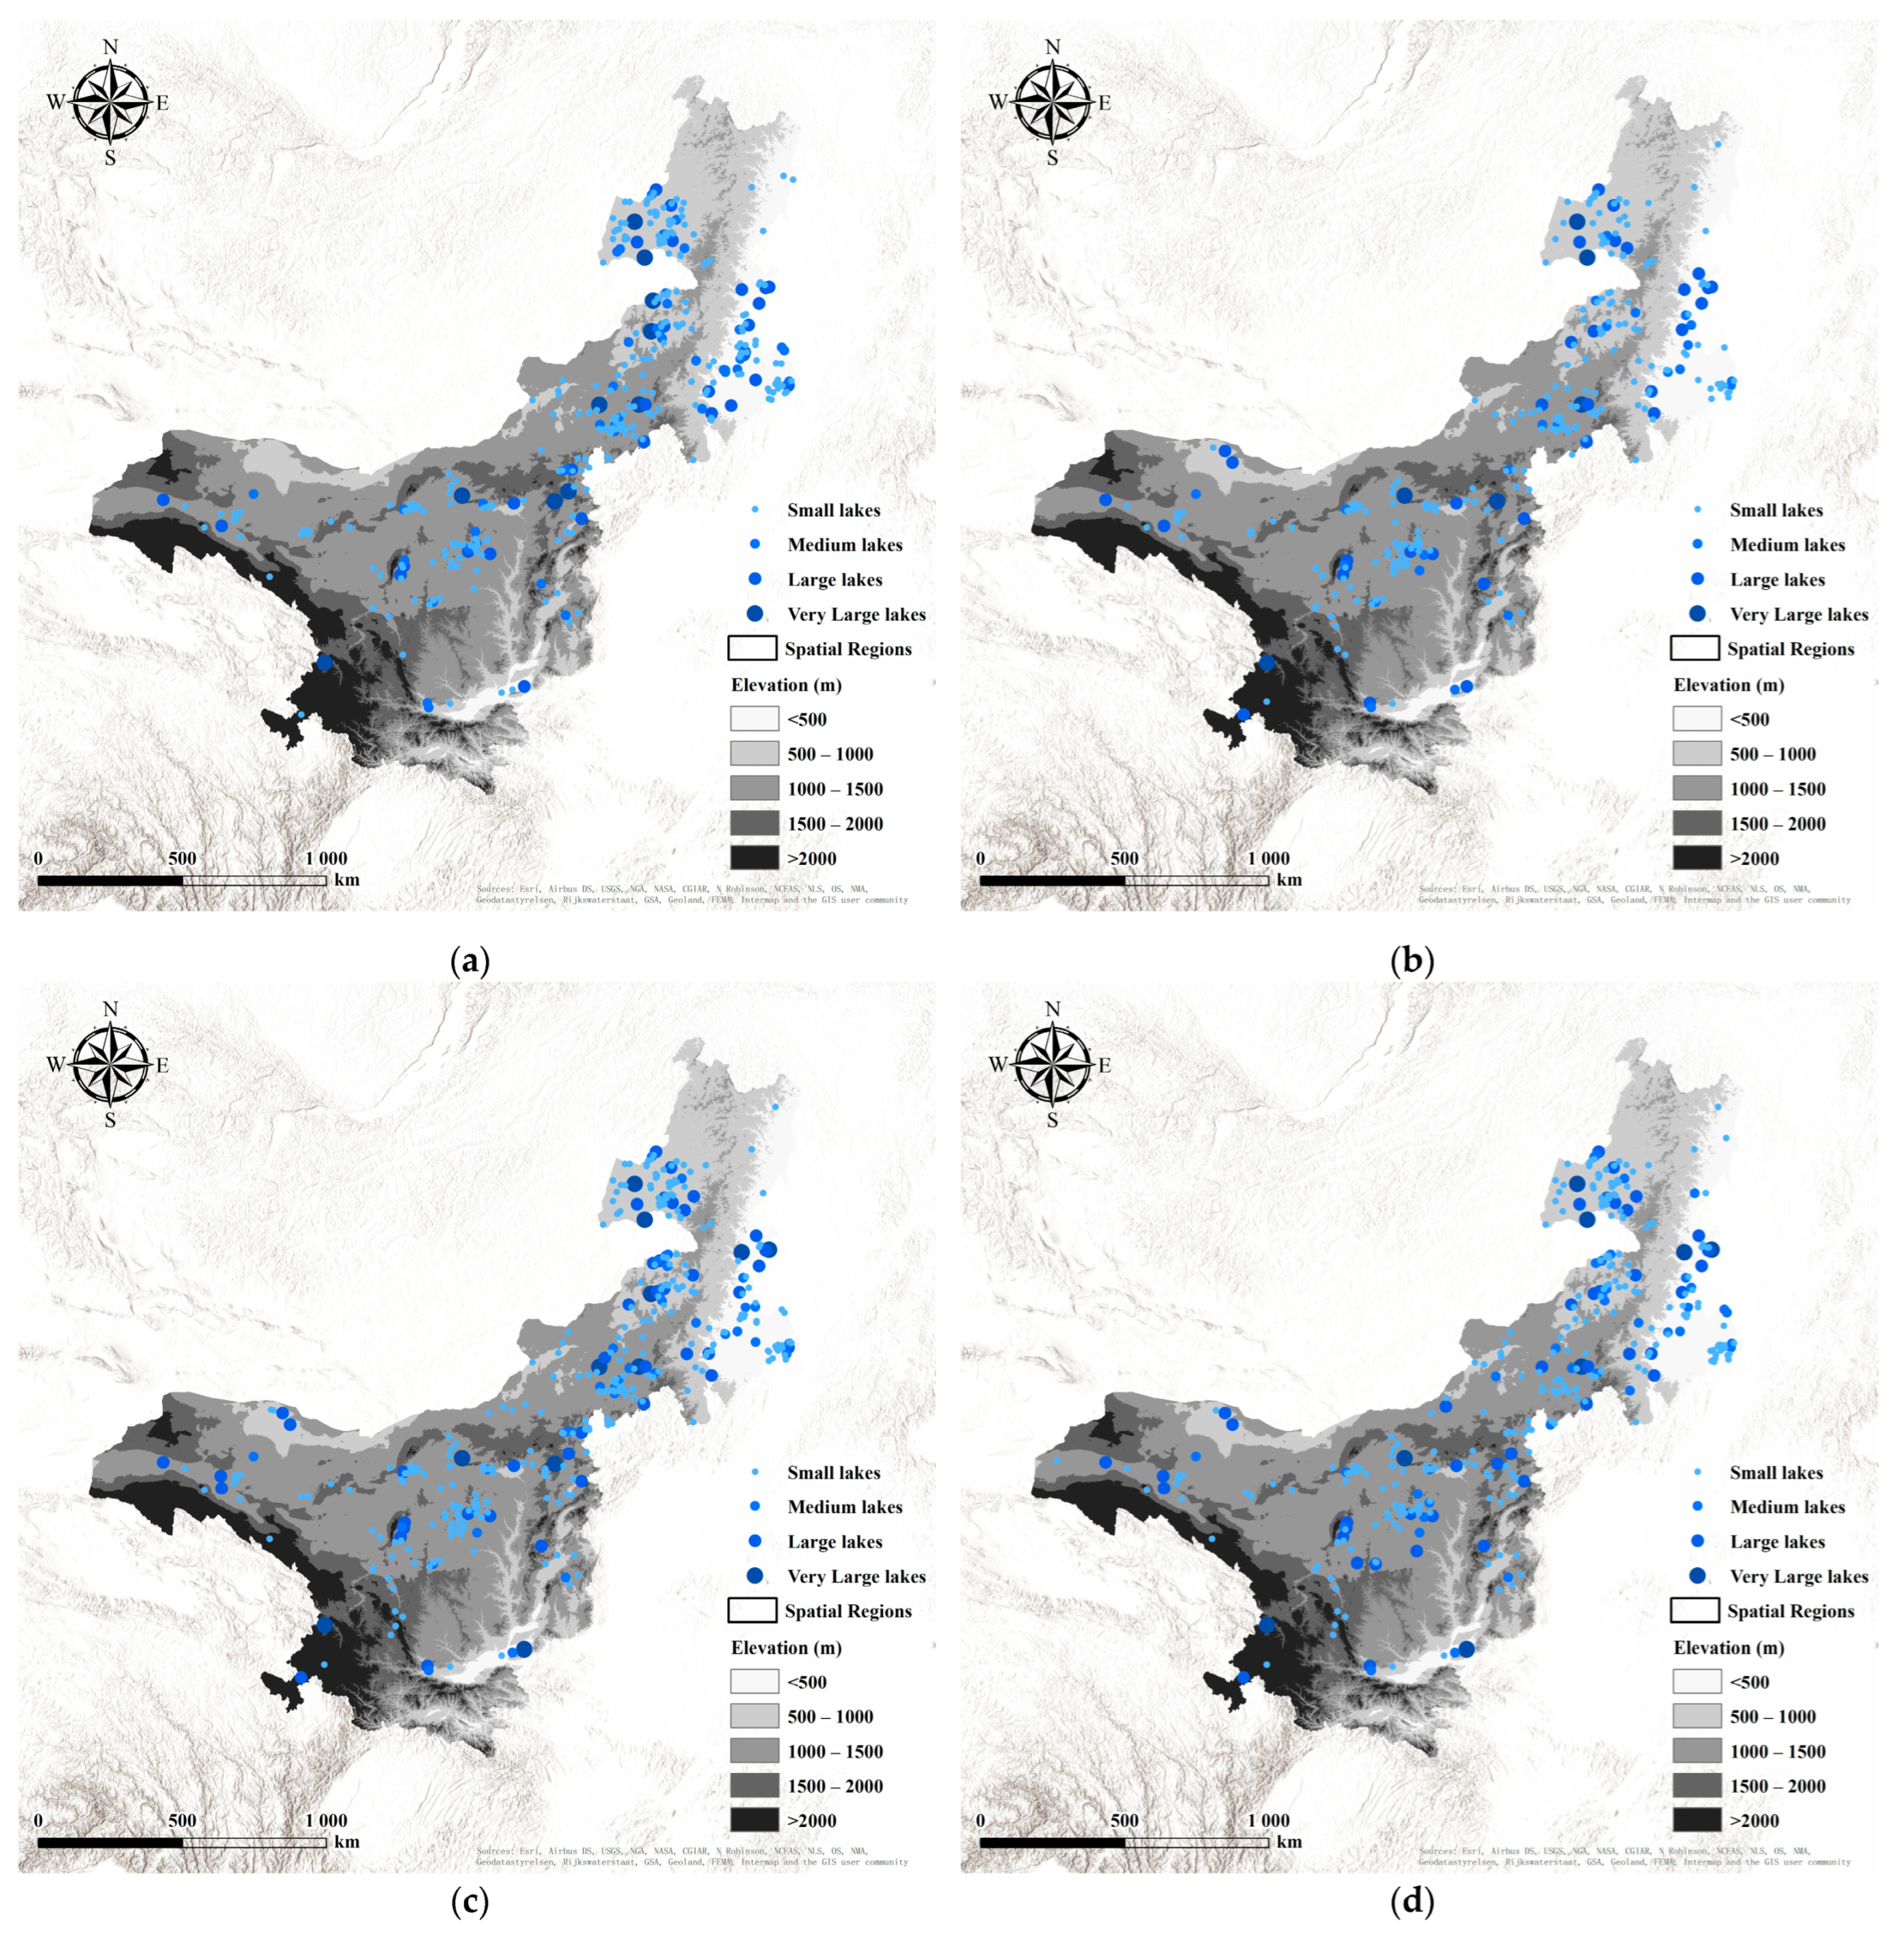
As shown in Figure 8, the percentages of small, medium, large, and very large lakes accounted for 76.9%, 9.3%, 11.3%, and 2.5%, respectively. However, the spatial order of lakes with four sizes is opposite to the numerical order. The area of small, medium, large, and huge lakes accounted for 11.6%, 4.4%, 15.3%, and 68.7%, respectively. Though there are few very large lakes in the IMP, they cover a significant area. According to further analysis, the majority of small lakes are located in the central and eastern parts, and the western and southern parts; medium lakes are mainly found in the central and eastern parts; many large and very large lakes are situated in the western and southern parts. Note that, even though there are several large and very large lakes in the western and southern parts, the vast area of Hunlun Lake in the northeastern part makes the lake area much bigger than in the other two parts.
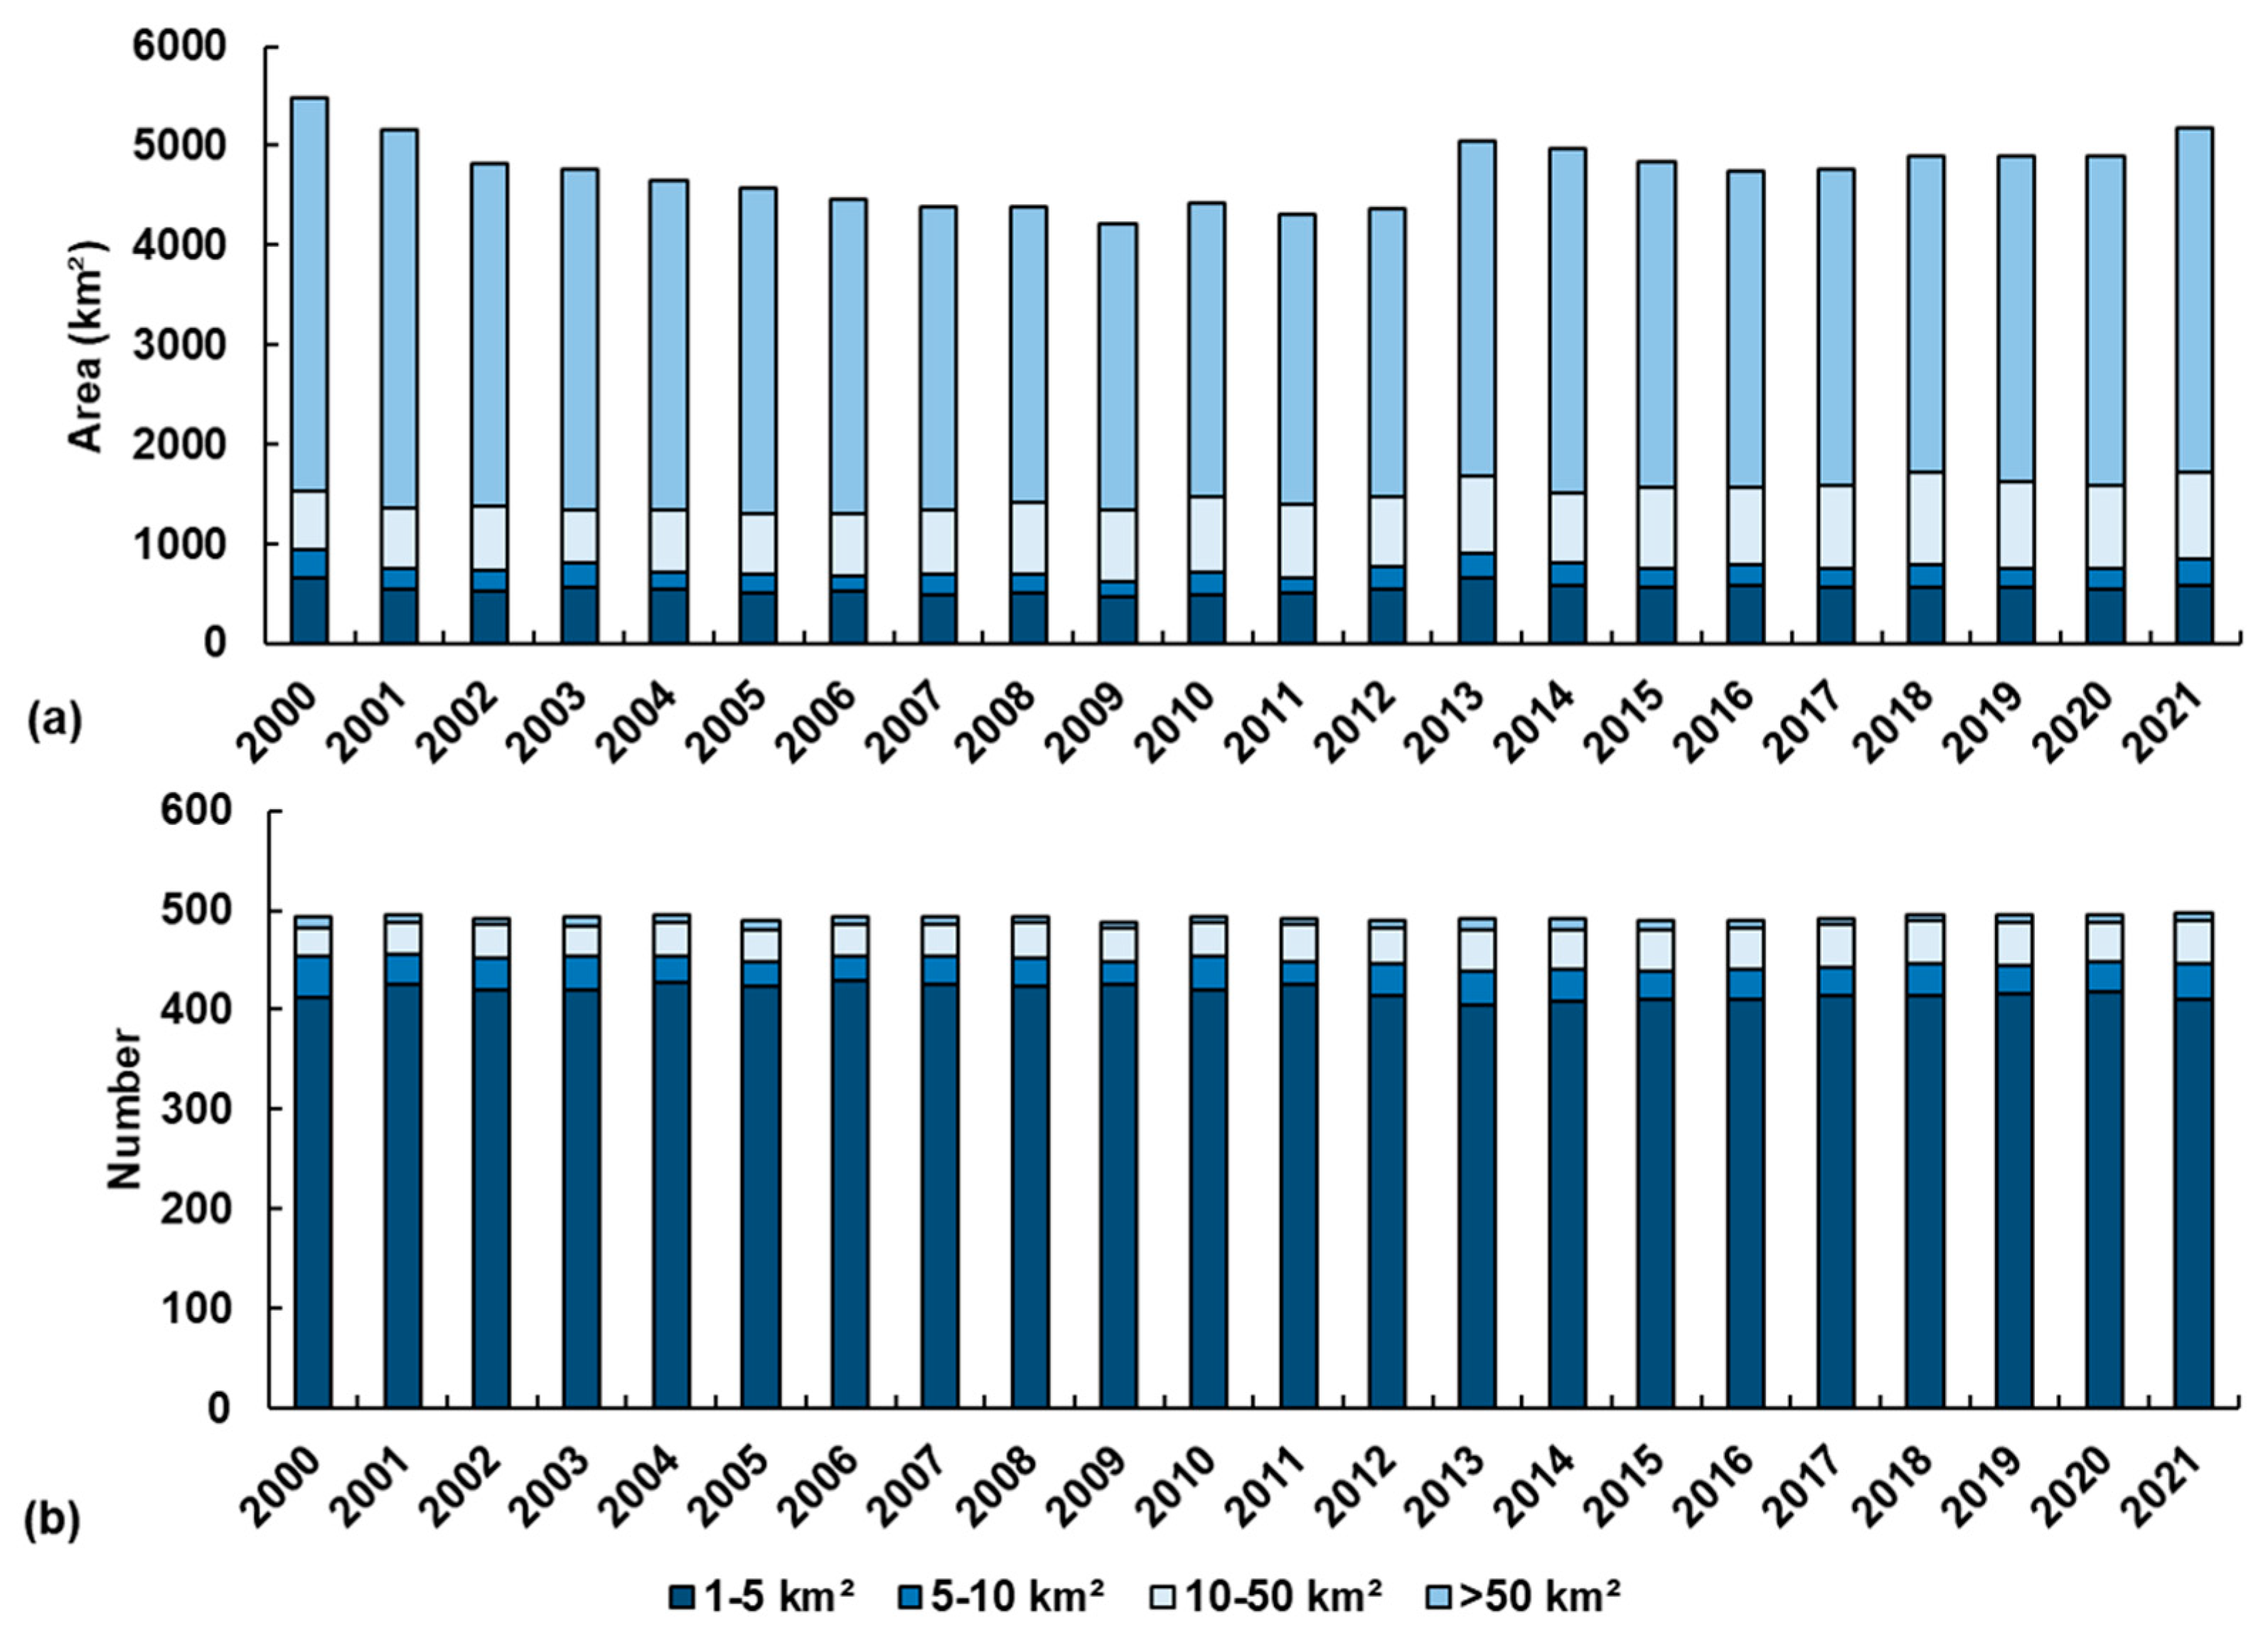
Small, medium, and very large lakes have experienced two “U”-shaped fluctuations in numbers and area (as shown in Figure 9), while the large lakes saw a slight increase. Compared to 2000, the number of small lakes ranged from 404 to 429, and its peak appeared in 2006 with a value of 429 and kept decreasing to 410 in 2021. The total area of small lakes shrank by 66.1 km2. The number of medium lakes ranged from 23 to 41, and their total area shrank by 35.2 km2. The number of very large lakes ranged from 6 to 11, and their total area shrank by 498.7 km2. On the contrary, there was an increase in the large lake number (ranged from 30 to 43), and their total area expanded by 297.3 km2.
We further analyzed the lakes at different elevations: lower than 500 m, 500–1000 m, 1000–1500 m, 1500–2000 m, and higher than 2000 m. The results are shown in Figure 10. More than 66.3% of the water surface is at an elevation of 500–1000 m, 23.0% of the water surface is at an elevation of 1000–1500 m, and 8.0% of the water surface is at an elevation lower than 500 m. There are very few lakes at elevations higher than 2000 m. The area variation mainly occurred at elevations from 500 to 1500 m. At elevations in the range of 500–1000 m, the shrunk area is much larger than the expanded area. This is mostly attributed to the significant decrease in the size of the huge lakes, even though the surface areas of small, medium, and large lakes increased. At elevations of 1000–1500 m, the total shrunk area is close to the expanded area. In detail, large and huge lakes cover 62.6% of the water surface area, and their area has decreased, while the area of small and medium lakes has increased. At elevations below 500 m, the total area increased. In detail, the large and huge lakes increased more than the small and medium lakes.
To summarize, variations in the size of large and huge lakes dominate the variation in lake area on the IMP.

3.4. Accuracy Assessment

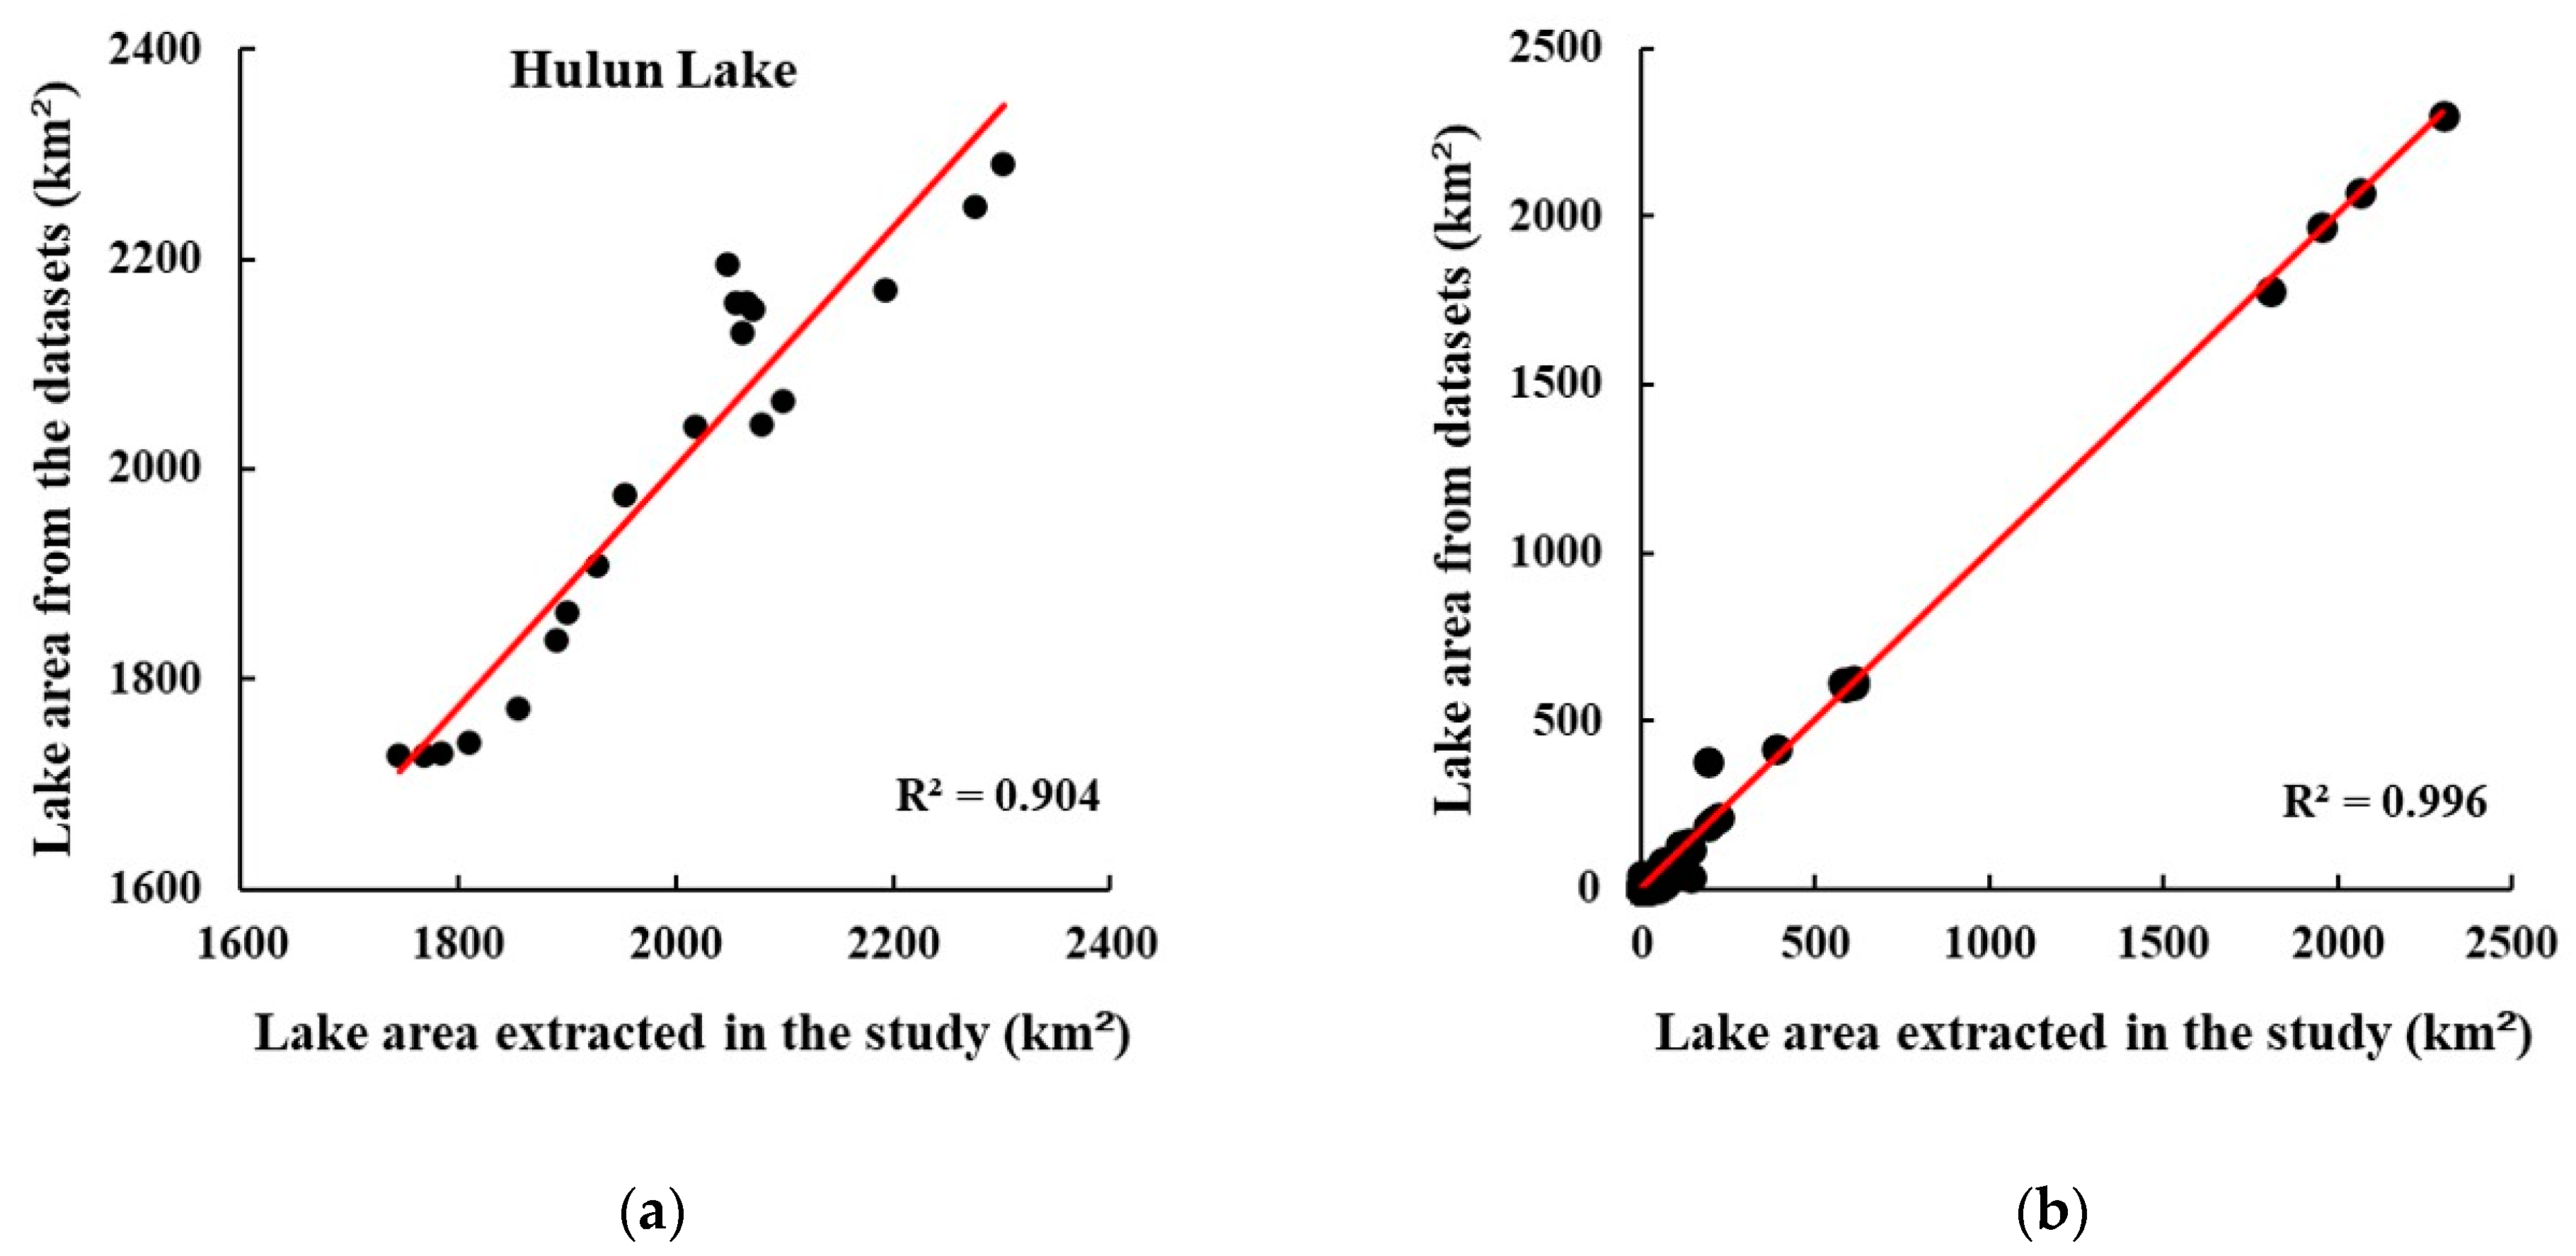
To better evaluate the extraction accuracy, Root Mean Square Error (RMSE), Mean Absolute Error (MAE), and R-squared (R2) values between our dataset and the previous lake datasets (JRC Global Surface Water Mapping Layers, also referred to as GSW [48]; and China lake dataset (1960s–2015) [6]) were calculated. The JRC dataset is highly accurate and contains the temporal distribution of surface water from 1984 to 2021 using 4,716,475 scenes from Landsat images. The China lake dataset examined multi-decadal lake area changes in China from the 1960s to 2015, using historical topographic maps and >3831 Landsat satellite images. These datasets have been widely used as a ground-truth dataset for further hydrological and ecological-related studies over a long time period [4,49,50]. Thus, we evaluated our extraction results with these datasets (as shown in Table 2). The results show that the MAE is 1.71 km2, the RMSE of 2000 is 4.14 km2, the RMSE of 2005 is 4.26 km2, the RMSE of 2010 is 7.40 km2, the RMSE of 2015 is 11.41 km2, and the R2 between lake areas from the datasets and the lake area extracted in this study is 0.996, as shown in Figure 11. The overall accuracy was of 91.7%.

4. Discussion

4.1. The Influencing Factors of Lake Area Variation

The area variations of the lakes on the IMP are significant. The comprehensive analysis of the driving factors can be complicated. Both climatic changes and human actions contribute to the lake area fluctuation [51], and the leading determinant for individual lakes can be diverse [12,13,52,53].

4.1.1. The Impacts of Climate Change

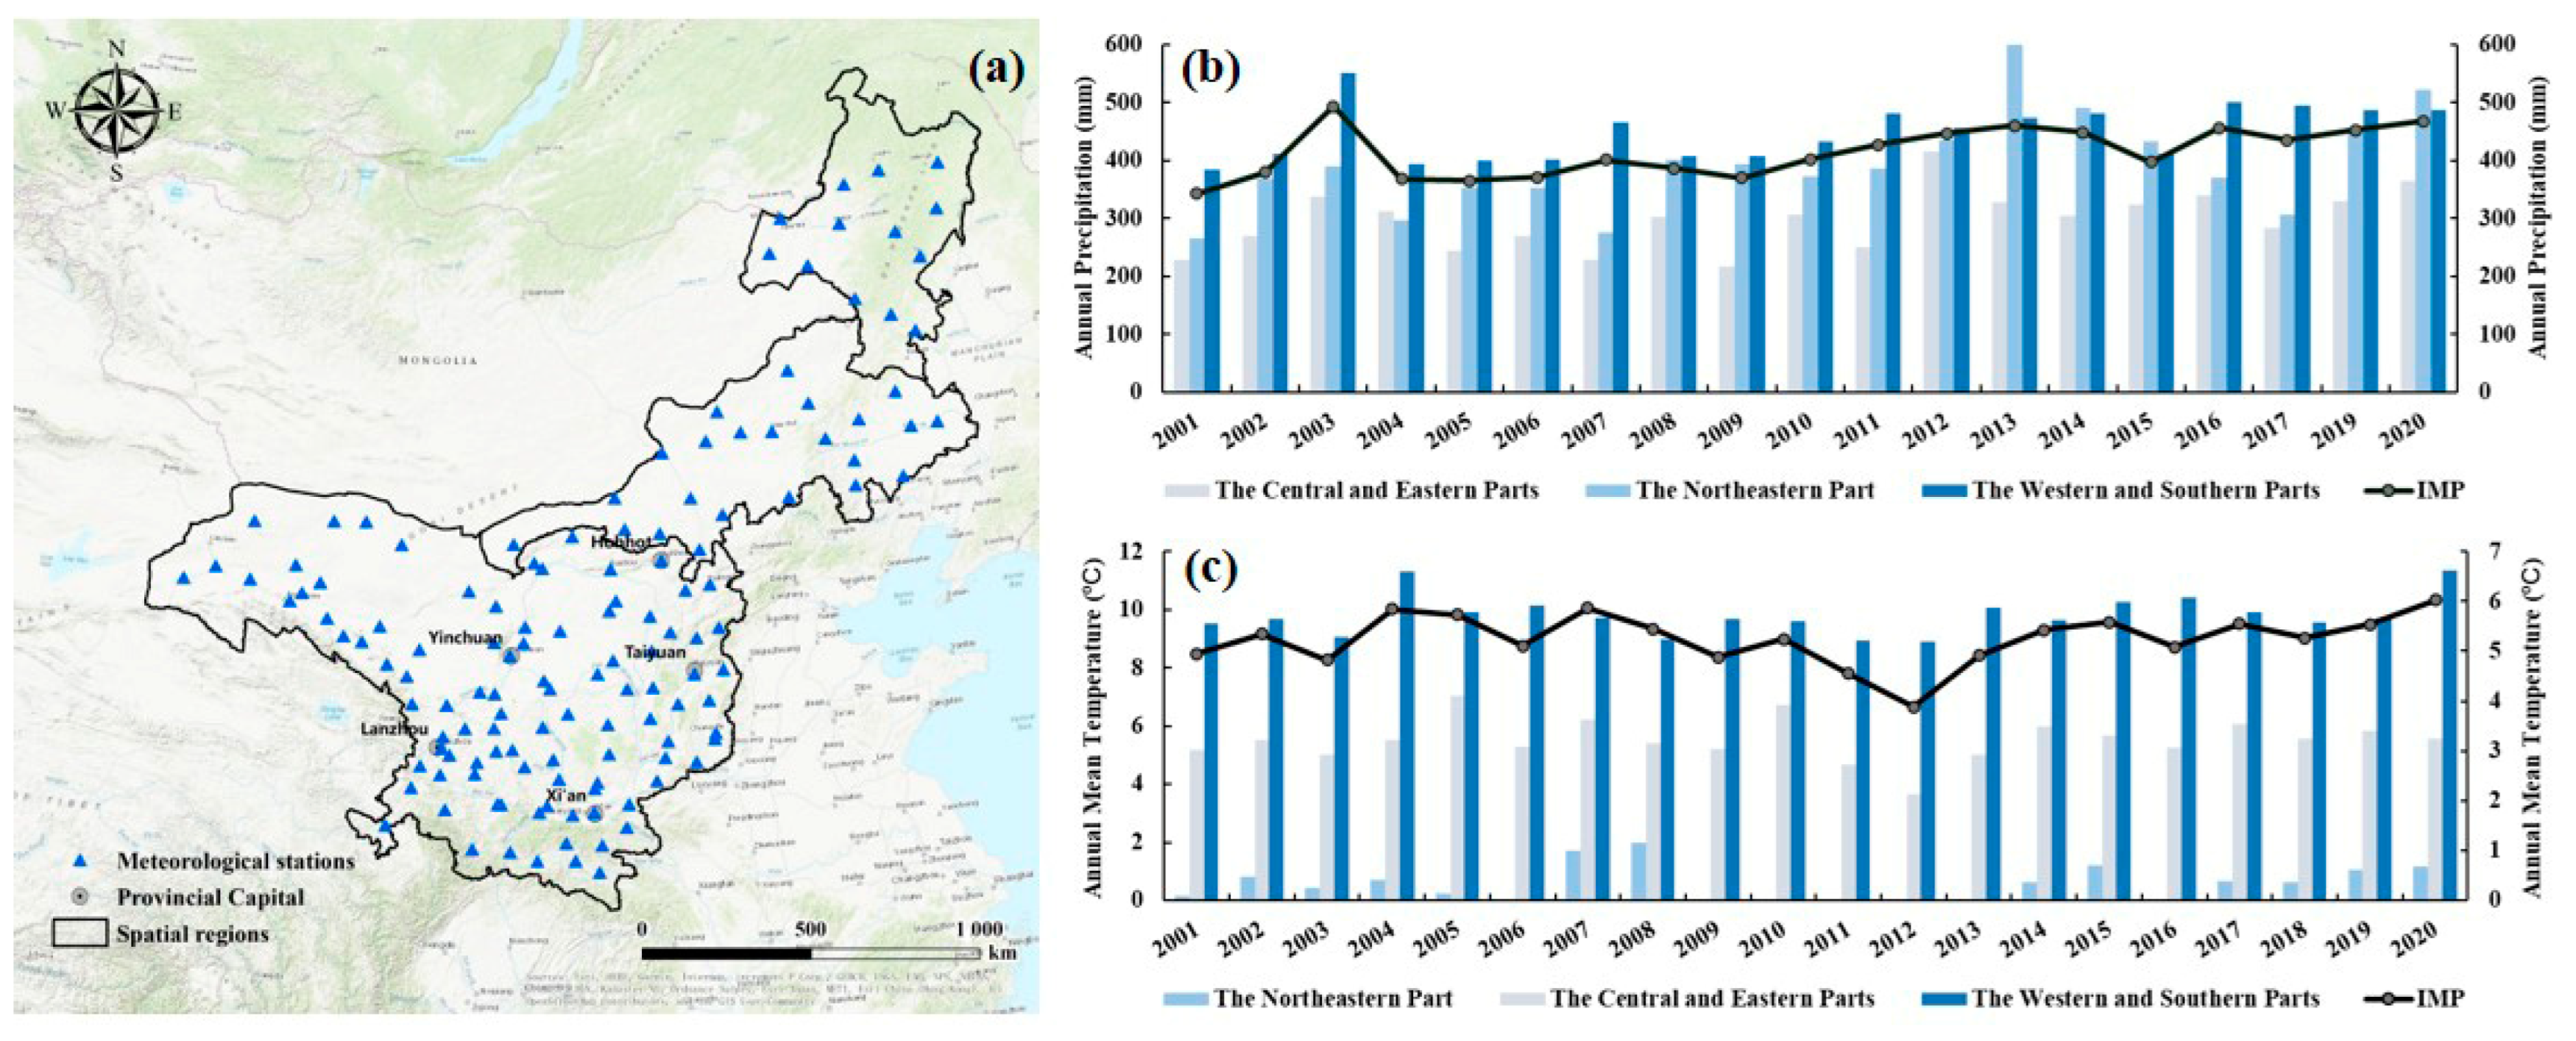
We collected precipitation and temperature data from 136 China Meteorological stations in the past two decades (as shown in Figure 12a), data covering from 2001 to 2020, with missing precipitation data in 2018. Compared to 2001, the annual precipitations of the three regions in 2020 were all greater. The climate inclination rate in the western and southern parts was of 4.02 mm/a, and the precipitation had increased by 102.63 mm; the climate inclination rate in the central and eastern parts was of 5.73 mm/a, and the precipitation had increased by 136.99 mm; the climate inclination rate in the northeastern part was of 9.83 mm/a, and the precipitation had increased by 256.67 mm. There was a fast increase from 2001 to 2003. In this period, the annual precipitation increased in the western and southern parts, the central and eastern Parts, and the northeastern part by 166.56 mm, 109.74 mm, and 122.9 mm, respectively. The precipitation in the last 5 years is consistent with the increasing trend in the lake area variation. From 2001 to 2020, an increasing trend for the IMP was observed (p < 0.01 with t-test).
Previous studies revealed that, from 1975 to 2010, the temperature in China was significantly increasing [8]. In this study, the climate inclination rates of annual temperature were of 0.17 °C/a, 0.18 °C/a, and 0.16 °C/a in the western and southern parts, the central and eastern parts, and the northeastern part, respectively, indicating increases in all regions but only slightly so in the latter two regions. From 2012 to 2020, an increasing trend for the IMP was observed (p < 0.05 with t-test). Compared to 2001, the annual mean temperature had increased by 1.07 °C in 2020. The results indicate that there was a positive correlation (p < 0.05 with t-test) between annual precipitation and lake area in the western and southern parts, and there was a negative correlation (p < 0.01 with t-test) between annual mean temperature and lake area in the central and eastern parts.

4.1.2. The Impacts of Human Actions

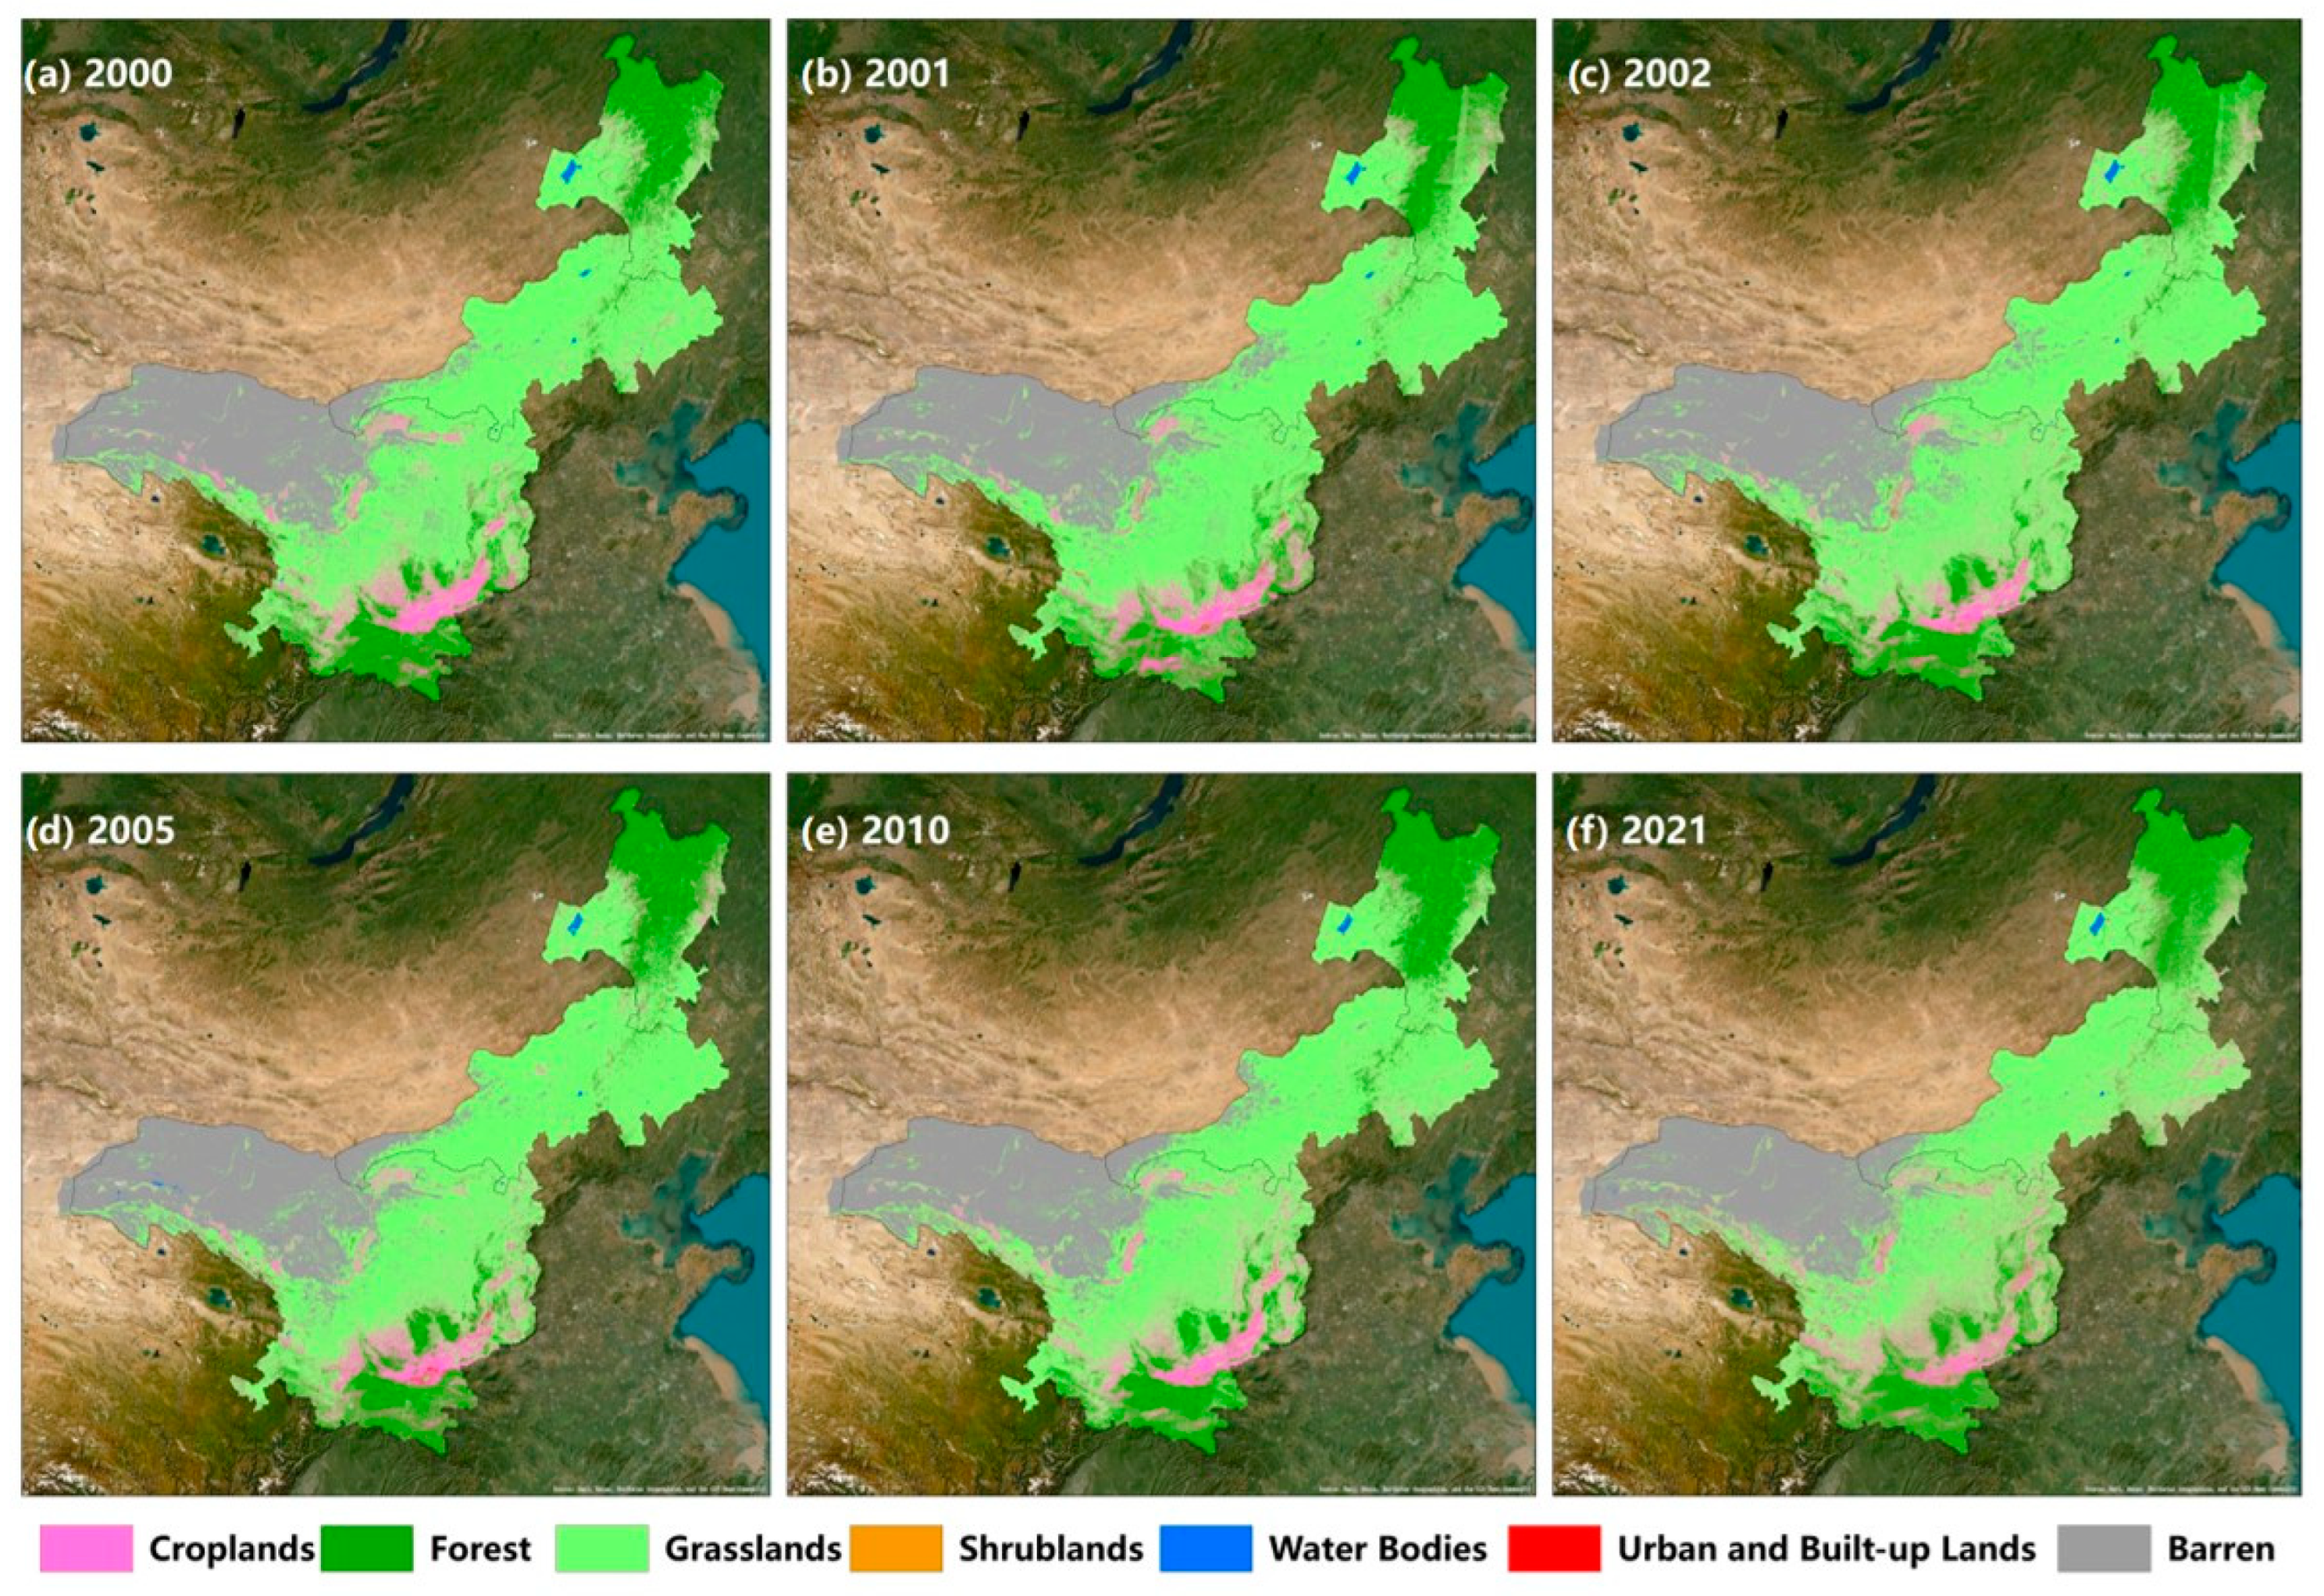
We created the land cover maps of the IMP for 2000, 2001, 2002, 2005, 2010, and 2021 (overall accuracy higher than 0.75, kappa coefficient higher than 0.6), which captured the land usage change during the past two decades. The interpretation of land cover maps was based on Landsat images and coupling random forest method, and validated with ground-truth samples. There was an increase in farmland (Figure 13). The findings are consistent with the third survey of Inner-Mongolian Autonomous Region, which indicated that the cropland had increased 231.43 million hectares since 2009. Of the cropland, 47.95% is irrigated farmland, which exploits the underground water and lake water resources, further affecting lake volume and lake surface area. The increase in water-intensive actions such as coal mining, grazing intensity, the construction of dams and reservoirs aggravated the exploitation of underground water and caused a more significant lake shrinkage in Inner Mongolia than in Mongolia [8].

4.1.3. Typical Lakes

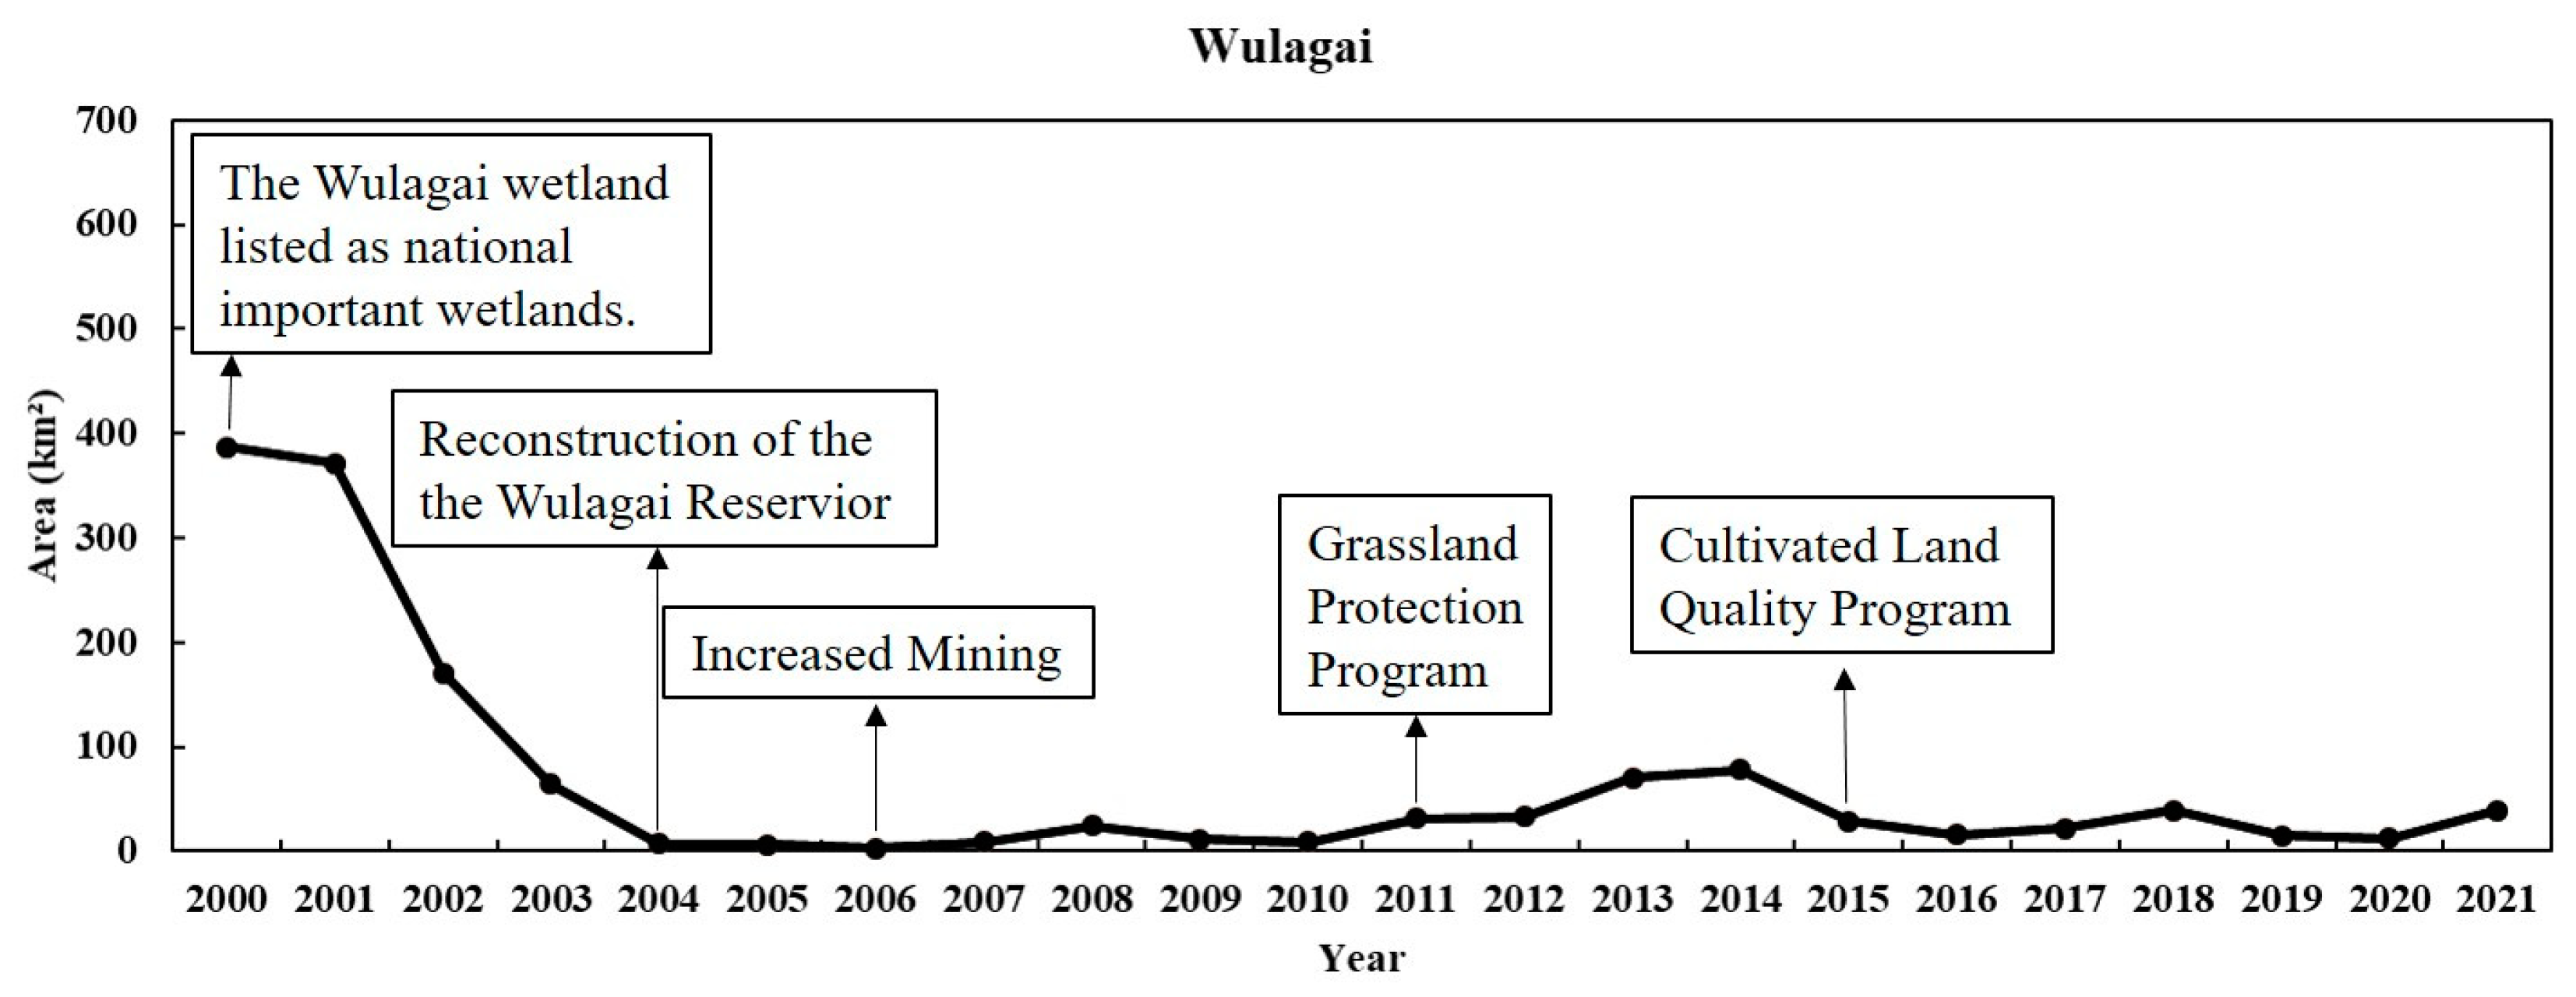
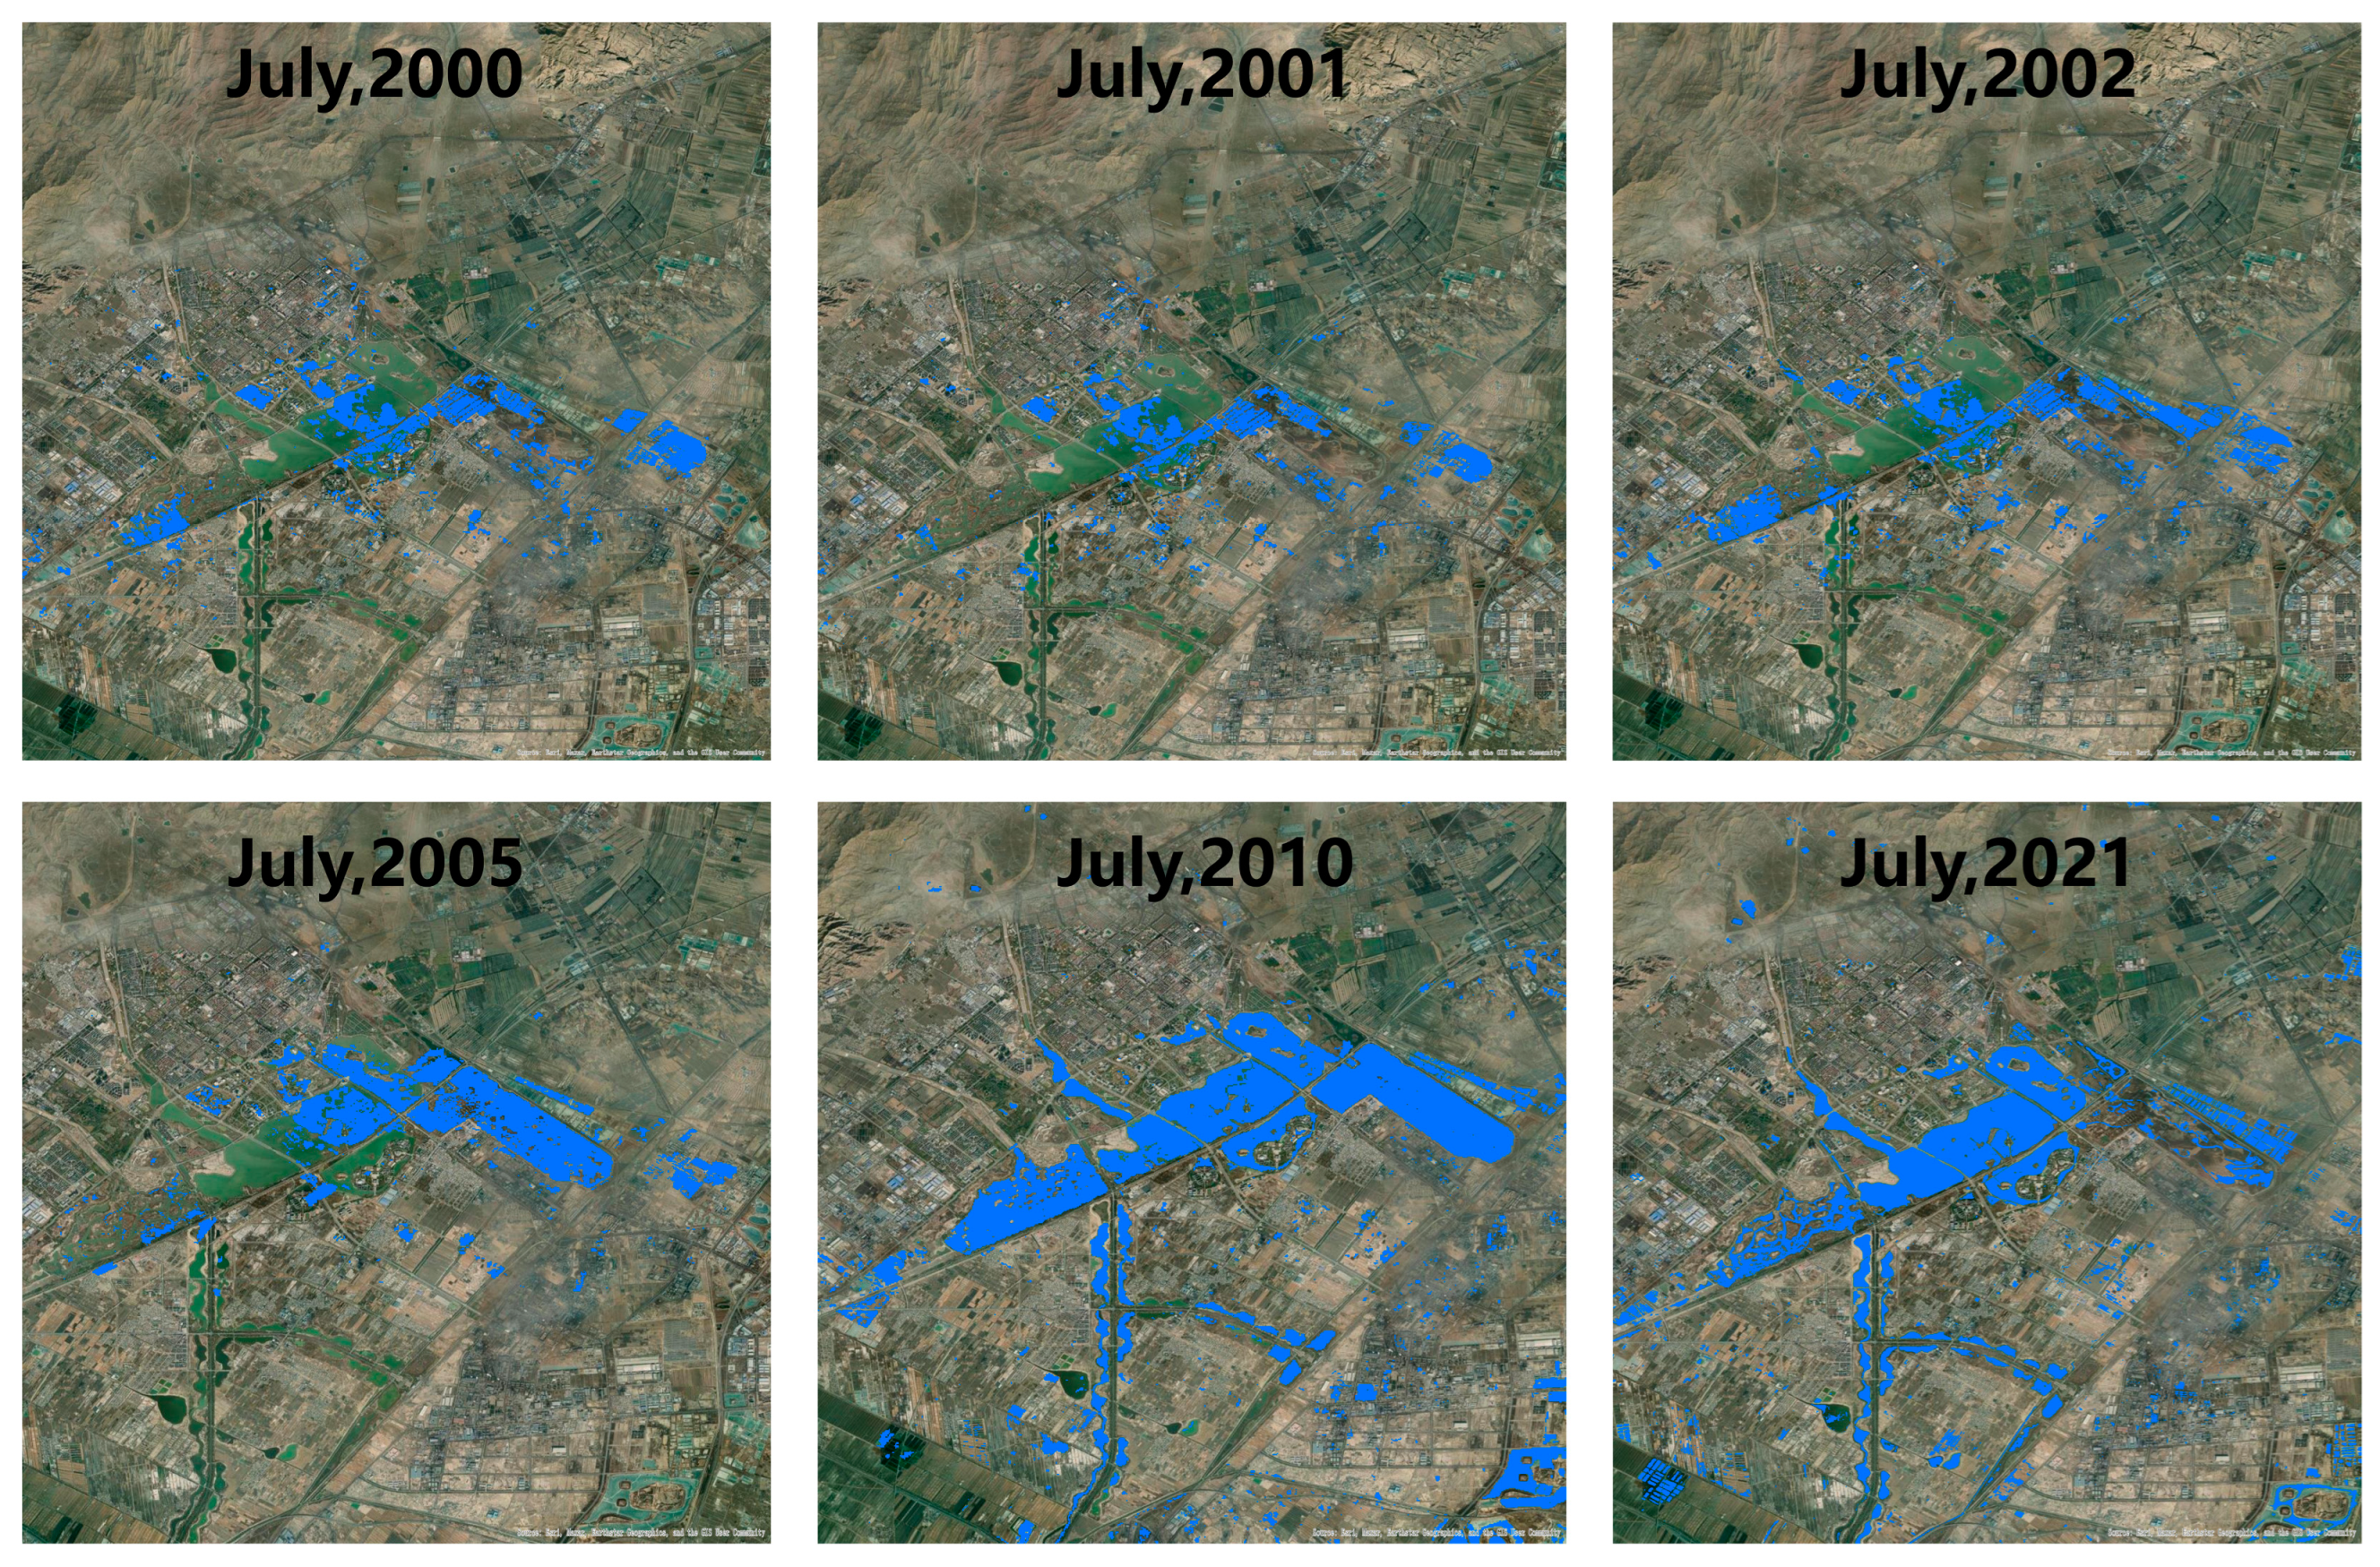
Wulagai Lake is situated in the Wulagai River Basin (WRB) of the central and eastern parts, spanning from 117°25′E to 119°58′E, and from 44°19′N to 46°41′N. It was ranked as the third largest lake among all the lakes in 2000. However, it has undergone significant changes in the past two decades, as illustrated in Figure 14 and Figure 15. The southeastern corner shrank in 2000 and almost disappeared in 2002. The area decreased by approximately 360 km2 over the last two decades. Compared to 2000, the area had decreased by over 89% in 2021. The reasons for its shrinkage are complicated. Anthropogenic interferences, such as damming, mining, and overgrazing, have caused environmental changes in Wulagai Gaobi and its surrounding area [54,55]. Coal mining began in 2000 and continued to grow until 2016. The changes in vegetation types, such as meadow steppe, typical steppe, forests, shrublands, sand lands, and cropland areas, also aggravated the demand for water resources [56].
Xinghai Lake is situated in the western and southern parts of the IMP, spanning from 105°58′E to 106°59′E and 38°22′N to 39°23′N. Unlike most shrinking lakes in this region, Xinghai lake is actually expanding due to ecological protection [57,58]. Xinghai Lake exhibited a significant upward trend, as evidenced by the satellite extraction results (see Figure 16 and Figure 17). However, the variation in the area was not consistent. The lake area climbed up to 24.74 km2 in 2010, which was three times the area in 2000. The increase in surface water area has led to a high evaporation rate, putting significant pressure on its water source, the Yellow River. Low water use efficiency and a fragile ecosystem prompted the government to change its protection strategies, leading to a decline in the following three years. Since 2013, there has been a continuous increase in the lake area, which persisted until 2019.

4.2. Limitations and Prospects

In this study, we utilized the fast-processing capabilities of the cloud computation platform Google Earth Engine and public datasets, such as the China Lake dataset (1960s–2020, available at https://doi.org/10.11888/Hydro.tpdc.270302) and Hydroweb https://www.theia-land.fr/en/hydroweb/). Different spectral indices and geological indicators also play a role in area extraction. The findings are beneficial for the sustainable development of lakes on the Inner-Mongolian Plateau. Yet, there is still room for improvement in existing studies and their results.
Abundant high-quality images are a prerequisite for monthly lake area observation. Cloud cover and its shadow can interfere with the extraction of lake area, particularly in other lake zones like the Tibetan Plateau and Yunnan–Guizhou Plateau. An image filter was used to select high-quality images with minimal cloud coverage and fewer stripes in the pre-processing stage. To ensure accurate data collection, missing images and obscured areas due to clouds or shadows must be accounted for, as they could introduce uncertainties in the statistical analysis of the area during yearly or monthly monitoring. They influence the calculation of the lake area by impacting the index value of a single image and then adjusting the total occurrence frequency. Satellite images from multiple sensors and microwave satellites may offer a solution to this problem.
The determination of waterbody boundaries should also receive more attention. The lake shoreline varies constantly due to the land–lake breeze, tides, and the melting of ice and snow. Distinguishing water from wetlands remains challenging. It is hard to tell the difference between water bodies and wetlands. Some studies combine satellite images taken over a specific timespan into a single image and then proceed with area extraction. However, the resulting image was generated based on image quality rather than the specific characteristics of the lakes. This approach may overlook the details of variations in lake area and result in errors in area calculations. In this study, all eligible images were used to calculate the threshold for water occurrence frequency. Detailed lake dynamics throughout the timespan are considered. Thus, this method helps to determine more specific boundaries.
When discussing the relative contribution of natural and human factors to lake area variation, the temporal delays of meteorological and hydrological elements, external influences, and geophysical differences may affect the dynamic analysis. The time lag of hydrological processes, such as groundwater recharge, surface runoff, and streamflow response to precipitation events, plays a significant role in watershed dynamics. Additionally, the impact of factors originating from outside the watershed, such as upstream land use changes, climate variability, and transboundary water interactions, can also affect the hydrological behavior within the study area. Geophysical differences such as variations in topology, geology, and soil properties may also have effects on lake area variation by changing the Earth’s surface. Our study stated the lake area variation of four size classes. Furthermore, there may be relationships between lake volume change and lake area. These relationships may be affected by climate change and human actions. Determining how the mechanisms work may reveal the interactions between the environment and individual lakes. We plan to address this issue in future studies. With the advent of advanced satellite sensors and computing technologies, research based on remote sensing can be conducted to address the aforementioned drawbacks. Furthermore, human interventions such as agricultural practices and mining activities alter land use types, consequently impacting surface runoff. Further findings will expand our understanding of lake changes and provide a solid foundation for more ecological analysis.

5. Conclusions

We executed contiguous monitoring of the lake area from 2000 to 2021 on an annual and monthly basis. Both spatial and temporal variations indicate that the lake area has experienced significant fluctuations over the last two decades. This study thoroughly analyzed the changes in the area of lakes larger than 1 km2 from 2000 to 2021. From a temporal perspective, the lake area experienced two “U”-shaped periods. The total lake area decreased from 2000 to 2009, followed by a rapid increase from 2009 to 2013, and then experienced fluctuations of decrease and increase until 2021. From the perspective of spatial analysis, geological homogeneity and heterogeneity exert roles in spatial variation trends. The lake area increased in the western and southern parts, while it decreased in the central and eastern parts. The northeastern part has experienced two similar “U”-shaped periods in lake area changes, mirroring the overall trend. When we analyzed lakes of different sizes, we found that most lakes were situated at an elevation of 500–1500 m, and the large lakes (10–50 km2) and huge lakes (>50 km2) played a significant role in the variation of the area.

Author Contributions

Conceptualization, N.X. and F.G.; methodology, B.Y.; software, Y.Z.; validation, N.X.; formal analysis, N.X.; investigation, J.B., Y.G. and R.L.; resources, F.G.; data curation, N.X.; writing—original draft preparation, N.X.; writing—review and editing, N.X.; visualization, N.X.; supervision, F.G.; project administration, N.X.; funding acquisition, F.G. All authors have read and agreed to the published version of the manuscript.

Funding

This research was supported by the Remote Sensing Quantitative Survey and Monitoring of Water Cycle Elements and Natural Resources in River Basin (DD20230417), China Geological Survey.

Data Availability Statement

We provided relative links of public dataset in the manuscript. The other water surface extraction data is available upon request from the corresponding authors.

Acknowledgments

Special thanks to ZHANG Guoqing China lake dataset (1960s–2015) Monitoring & Big Data Center for Three Poles, 2019. Special thanks to JRC Global Surface Water Mapping Layers, v1.4. Special thanks to colleagues from China Aero Geophysical Survey and Remote Sensing Center for Natural Resources who helped with the field experiment in Inner-Mongolia Autonomous Region in 2022.

Conflicts of Interest

The authors declare no conflicts of interest.

References

  1. Williamson, C.E.; Saros, J.E.; Vincent, W.F.; Smol, J.P. Lakes and reservoirs as sentinels, integrators, and regulators of climate change. Limnol. Oceanogr. 2009, 54, 2273–2282. [Google Scholar] [CrossRef]
  2. Purevdorj, Z.; Jargal, N.; Ganbold, O.; Munkhbayar, M.; Purevee, E.; Jargalsaikhan, A.; Paik, I.H.; Paek, W.K.; Lee, J.W. Spatial and Temporal Variations in Waterfowl Assemblage Structures in Mongolian Lakes and the Changes Linked to the Gradient of Lake Surface Areas. Diversity 2023, 15, 334. [Google Scholar] [CrossRef]
  3. Ke, L.; Song, C.; Wang, J.; Sheng, Y.; Ding, X.; Yong, B.; Ma, R.; Liu, K.; Zhan, P.; Luo, S. Constraining the contribution of glacier mass balance to the Tibetan lake growth in the early 21st century. Remote Sens. Environ. 2022, 268, 112779. [Google Scholar] [CrossRef]
  4. Busker, T.; de Roo, A.; Gelati, E.; Schwatke, C.; Adamovic, M.; Bisselink, B.; Pekel, J.F.; Cottam, A. A global lake and reservoir volume analysis using a surface water dataset and satellite altimetry. Hydrol. Earth Syst. Sci. 2019, 23, 669–690. [Google Scholar] [CrossRef]
  5. Crétaux, J.-F.; Abarca-del-Río, R.; Berge-Nguyen, M.; Arsen, A.; Drolon, V.; Clos, G.; Maisongrande, P. Lake volume monitoring from space. Surv. Geophys. 2016, 37, 269–305. [Google Scholar] [CrossRef]
  6. Zhang, G.; Yao, T.; Chen, W.; Zheng, G.; Shum, C.; Yang, K.; Piao, S.; Sheng, Y.; Yi, S.; Li, J. Regional differences of lake evolution across China during 1960s–2015 and its natural and anthropogenic causes. Remote Sens. Environ. 2019, 221, 386–404. [Google Scholar] [CrossRef]
  7. Zhang, J.; Zhou, J.; Zhang, G.; Ji, Y.; Zeng, Y.; Fan, W.; Aikelamu, A. Climate-and human-driven variations in lake area and number in North Xinjiang, China. Int. J. Remote Sens. 2021, 42, 469–485. [Google Scholar] [CrossRef]
  8. Tao, S.; Fang, J.; Zhao, X.; Zhao, S.; Shen, H.; Hu, H.; Tang, Z.; Wang, Z.; Guo, Q. Rapid loss of lakes on the Mongolian Plateau. Proc. Natl. Acad. Sci. USA 2015, 112, 2281–2286. [Google Scholar] [CrossRef] [PubMed]
  9. Liu, Y.; Chen, H.; Zhang, G.; Sun, J.; Li, H.; Wang, H. Changes in Lake Area in the Inner Mongolian Plateau under Climate Change: The Role of the Atlantic Multidecadal Oscillation and Arctic Sea Ice. J. Clim. 2020, 33, 1335–1349. [Google Scholar] [CrossRef]
  10. Zhang, G.Q.; Yao, T.D.; Piao, S.L.; Bolch, T.; Xie, H.J.; Chen, D.L.; Gao, Y.H.; O’Reilly, C.M.; Shum, C.K.; Yang, K.; et al. Extensive and drastically different alpine lake changes on Asia’s high plateaus during the past four decades. Geophys. Res. Lett. 2017, 44, 252–260. [Google Scholar] [CrossRef]
  11. Moss, B. Cogs in the endless machine: Lakes, climate change and nutrient cycles: A review. Sci. Total Environ. 2012, 434, 130–142. [Google Scholar] [CrossRef] [PubMed]
  12. Chun, X.; Su, R.; Liu, J.; Liang, W.; Yong, M.; Ulambadrakh, K. Climatic implications on variations of Qehan Lake in the arid regions of Inner Mongolia during the recent five decades. Environ. Monit. Assess. 2017, 189, 14. [Google Scholar] [CrossRef]
  13. Zhang, Y.; Liang, W.; Liao, Z.; Han, Z.; Xu, X.; Jiao, R.; Liu, H. Effects of climate change on lake area and vegetation cover over the past 55 years in Northeast Inner Mongolia grassland, China. Theor. Appl. Climatol. 2019, 138, 13–25. [Google Scholar] [CrossRef]
  14. Dörnhöfer, K.; Oppelt, N. Remote sensing for lake research and monitoring–Recent advances. Ecol. Indic. 2016, 64, 105–122. [Google Scholar] [CrossRef]
  15. Wan, W.; Li, H.; Xie, H.; Hong, Y.; Long, D.; Zhao, L.; Han, Z.; Cui, Y.; Liu, B.; Wang, C. A comprehensive data set of lake surface water temperature over the Tibetan Plateau derived from MODIS LST products 2001–2015. Sci. Data 2017, 4, 170095. [Google Scholar] [CrossRef]
  16. Guo, A.; Liu, S.; Zhu, Z.; Xu, Z.; Xiao, Q.; Ju, Q.; Zhang, Y.; Yang, X. Impact of lake/reservoir expansion and shrinkage on energy and water vapor fluxes in the surrounding area. J. Geophys. Res. Atmos. 2020, 125, e2020JD032833. [Google Scholar] [CrossRef]
  17. Tulbure, M.G.; Broich, M.; Stehman, S.V.; Kommareddy, A. Surface water extent dynamics from three decades of seasonally continuous Landsat time series at subcontinental scale in a semi-arid region. Remote Sens. Environ. 2016, 178, 142–157. [Google Scholar] [CrossRef]
  18. Wang, C.; Jiang, W.; Deng, Y.; Ling, Z.; Deng, Y. Long time series water extent analysis for SDG 6.6. 1 based on the GEE platform: A case study of Dongting Lake. IEEE J. Sel. Top. Appl. Earth Obs. Remote Sens. 2021, 15, 490–503. [Google Scholar] [CrossRef]
  19. Lu, H.; Zhao, R.; Zhao, L.; Lyu, B.; Wang, J.; Zhang, L. A contrarian growth: The spatiotemporal dynamics of open-surface water bodies on the northern slope of Kunlun Mountains. Ecol. Indic. 2023, 157, 111249. [Google Scholar] [CrossRef]
  20. Kiage, L.M.; Douglas, P. Linkages between land cover change, lake shrinkage, and sublacustrine influence determined from remote sensing of select Rift Valley Lakes in Kenya. Sci. Total Environ. 2020, 709, 136022. [Google Scholar] [CrossRef]
  21. Xu, H. Modification of normalised difference water index (NDWI) to enhance open water features in remotely sensed imagery. Int. J. Remote Sens. 2006, 27, 3025–3033. [Google Scholar] [CrossRef]
  22. Huete, A.; Justice, C.; Van Leeuwen, W. MODIS vegetation index (MOD13). Algorithm Theor. Basis Doc. 1999, 3, 295–309. [Google Scholar]
  23. Yue, H.; Li, Y.; Qian, J.; Liu, Y. A new accuracy evaluation method for water body extraction. Int. J. Remote Sens. 2020, 41, 7311–7342. [Google Scholar] [CrossRef]
  24. Zhang, G.; Li, J.; Zheng, G. Lake-area mapping in the Tibetan Plateau: An evaluation of data and methods. Int. J. Remote Sens. 2017, 38, 742–772. [Google Scholar] [CrossRef]
  25. Feyisa, G.L.; Meilby, H.; Fensholt, R.; Proud, S.R. Automated Water Extraction Index: A new technique for surface water mapping using Landsat imagery. Remote Sens. Environ. 2014, 140, 23–35. [Google Scholar] [CrossRef]
  26. Jiang, W.; Ni, Y.; Pang, Z.; Li, X.; Ju, H.; He, G.; Lv, J.; Yang, K.; Fu, J.; Qin, X. An effective water body extraction method with new water index for sentinel-2 imagery. Water 2021, 13, 1647. [Google Scholar] [CrossRef]
  27. Liu, H.; Yin, Y.; Piao, S.; Zhao, F.; Engels, M.; Ciais, P. Disappearing lakes in semiarid northern China: Drivers and environmental impact. Environ. Sci. Technol. 2013, 47, 12107–12114. [Google Scholar] [CrossRef]
  28. Chen, F.; Zhang, M.; Tian, B.; Li, Z. Extraction of glacial lake outlines in Tibet Plateau using Landsat 8 imagery and Google Earth Engine. IEEE J. Sel. Top. Appl. Earth Obs. Remote Sens. 2017, 10, 4002–4009. [Google Scholar] [CrossRef]
  29. Zhao, Q.; Yu, L.; Li, X.; Peng, D.; Zhang, Y.; Gong, P. Progress and trends in the application of Google Earth and Google Earth Engine. Remote Sens. 2021, 13, 3778. [Google Scholar] [CrossRef]
  30. Tamiminia, H.; Salehi, B.; Mahdianpari, M.; Quackenbush, L.; Adeli, S.; Brisco, B. Google Earth Engine for geo-big data applications: A meta-analysis and systematic review. ISPRS J. Photogramm. Remote Sens. 2020, 164, 152–170. [Google Scholar] [CrossRef]
  31. Zhao, R.; Fu, P.; Zhou, Y.; Xiao, X.; Grebby, S.; Zhang, G.; Dong, J. Annual 30-m big Lake Maps of the Tibetan Plateau in 1991–2018. Sci. Data 2022, 9, 164. [Google Scholar] [CrossRef] [PubMed]
  32. Li, H.; Gao, Y.; Li, Y.; Yan, S.; Xu, Y. Dynamic of Dalinor Lakes in the Inner Mongolian Plateau and Its Driving Factors during 1976–2015. Water 2017, 9, 749. [Google Scholar] [CrossRef]
  33. Bai, M.; Mo, X.G.; Liu, S.X.; Hu, S. Detection and attribution of lake water loss in the semi-arid Mongolian Plateau-A case study in the Lake Dalinor. Ecohydrology 2021, 14, e2251. [Google Scholar] [CrossRef]
  34. Wang, J.; Wang, L.; Li, M.; Zhu, L.; Li, X. Lake volume variation in the endorheic basin of the Tibetan Plateau from 1989 to 2019. Sci. Data 2022, 9, 611. [Google Scholar] [CrossRef] [PubMed]
  35. Shi, C.; Wang, X.; Dou, H.; Zhang, L.; Wang, H. A General Outline of Chinese Lakes; Science Press: Beijing, China, 1989. [Google Scholar]
  36. Gorelick, N.; Hancher, M.; Dixon, M.; Ilyushchenko, S.; Thau, D.; Moore, R. Google Earth Engine: Planetary-scale geospatial analysis for everyone. Remote Sens. Environ. 2017, 202, 18–27. [Google Scholar] [CrossRef]
  37. Amani, M.; Ghorbanian, A.; Ahmadi, S.A.; Kakooei, M.; Moghimi, A.; Mirmazloumi, S.M.; Moghaddam, S.H.A.; Mahdavi, S.; Ghahremanloo, M.; Parsian, S. Google earth engine cloud computing platform for remote sensing big data applications: A comprehensive review. IEEE J. Sel. Top. Appl. Earth Obs. Remote Sens. 2020, 13, 5326–5350. [Google Scholar] [CrossRef]
  38. Dong, J.; Xiao, X.; Menarguez, M.A.; Zhang, G.; Qin, Y.; Thau, D.; Biradar, C.; Moore, B., III. Mapping paddy rice planting area in northeastern Asia with Landsat 8 images, phenology-based algorithm and Google Earth Engine. Remote Sens. Environ. 2016, 185, 142–154. [Google Scholar] [CrossRef]
  39. Wang, L.; Diao, C.; Xian, G.; Yin, D.; Lu, Y.; Zou, S.; Erickson, T.A. A summary of the special issue on remote sensing of land change science with Google earth engine. Remote Sens. Environ. 2020, 248, 112002. [Google Scholar] [CrossRef]
  40. Hansen, M.C.; Potapov, P.V.; Moore, R.; Hancher, M.; Turubanova, S.A.; Tyukavina, A.; Thau, D.; Stehman, S.V.; Goetz, S.J.; Loveland, T.R.; et al. High-Resolution Global Maps of 21st-Century Forest Cover Change. Science 2013, 342, 850–853. [Google Scholar] [CrossRef]
  41. Zhao, Z.; Li, H.; Song, X.; Sun, W. Dynamic Monitoring of Surface Water Bodies and Their Influencing Factors in the Yellow River Basin. Remote Sens. 2023, 15, 5157. [Google Scholar] [CrossRef]
  42. Wu, G.; Chen, C.; Liu, Y.; Fan, X.; Niu, H.; Liu, Y. Developing a High-Resolution Seamless Surface Water Extent Time-Series over Lake Victoria by Integrating MODIS and Landsat Data. Remote Sens. 2023, 15, 3500. [Google Scholar] [CrossRef]
  43. Zhou, Y.; Dong, J.; Xiao, X.; Liu, R.; Zou, Z.; Zhao, G.; Ge, Q. Continuous monitoring of lake dynamics on the Mongolian Plateau using all available Landsat imagery and Google Earth Engine. Sci. Total Environ. 2019, 689, 366–380. [Google Scholar] [CrossRef] [PubMed]
  44. Wang, C.; Jia, M.; Chen, N.; Wang, W. Long-Term Surface Water Dynamics Analysis Based on Landsat Imagery and the Google Earth Engine Platform: A Case Study in the Middle Yangtze River Basin. Remote Sens. 2018, 10, 1635. [Google Scholar] [CrossRef]
  45. Wang, Y.; Li, Z.; Zeng, C.; Xia, G.-S.; Shen, H. An urban water extraction method combining deep learning and Google Earth engine. IEEE J. Sel. Top. Appl. Earth Obs. Remote Sens. 2020, 13, 769–782. [Google Scholar] [CrossRef]
  46. Yang, X.; Zhao, S.; Qin, X.; Zhao, N.; Liang, L. Mapping of Urban Surface Water Bodies from Sentinel-2 MSI Imagery at 10 m Resolution via NDWI-Based Image Sharpening. Remote Sens. 2017, 9, 596. [Google Scholar] [CrossRef]
  47. Chang, L.; Cheng, L.; Huang, C.; Qin, S.; Fu, C.; Li, S. Extracting Urban Water Bodies from Landsat Imagery Based on mNDWI and HSV Transformation. Remote Sens. 2022, 14, 5785. [Google Scholar] [CrossRef]
  48. Pekel, J.-F.; Cottam, A.; Gorelick, N.; Belward, A.S. High-resolution mapping of global surface water and its long-term changes. Nature 2016, 540, 418–422. [Google Scholar] [CrossRef] [PubMed]
  49. Deng, Y.; Jiang, W.; Tang, Z.; Ling, Z.; Wu, Z. Long-Term Changes of Open-Surface Water Bodies in the Yangtze River Basin Based on the Google Earth Engine Cloud Platform. Remote Sens. 2019, 11, 2213. [Google Scholar] [CrossRef]
  50. Wu, L.; Chen, Y.; Zhang, G.; Xu, Y.J.; Tan, Z. Integrating the JRC monthly water history dataset and geostatistical analysis approach to quantify surface hydrological connectivity dynamics in an Ungauged multi-lake system. Water 2021, 13, 497. [Google Scholar] [CrossRef]
  51. Zhang, Y.; Liao, Z.; Xu, X.; Liang, W.; Han, Z.; Ji, G.; Jiao, R. Investigation of lake shrinkage attributed to climate change over the past 33 years in Inner Mongolia, China. Clim. Change 2023, 176, 10. [Google Scholar] [CrossRef]
  52. Xu, Q.; Xiao, J.; Li, Y.; Tian, F.; Nakagawa, T. Pollen-based quantitative reconstruction of Holocene climate changes in the Daihai Lake area, Inner Mongolia, China. J. Clim. 2010, 23, 2856–2868. [Google Scholar] [CrossRef]
  53. Chen, Q.; Wang, S.; Ni, Z.; Guo, Y.; Zhang, H. Dynamic and driving evolution of lake basin pressure in cold and arid regions based on a new method: A case study of three lakes in Inner Mongolia, China. J. Environ. Manag. 2021, 298, 113425. [Google Scholar] [CrossRef] [PubMed]
  54. Shang, C.; Wu, J. A legendary landscape in peril: Land use and land cover change and environmental impacts in the Wulagai River Basin, Inner Mongolia. J. Environ. Manag. 2022, 301, 113816. [Google Scholar] [CrossRef] [PubMed]
  55. Tangud, T.; Nasahara, K.; Borjigin, H.; Bagan, H. Land-cover change in the Wulagai grassland, Inner Mongolia of China between 1986 and 2014 analysed using multi-temporal Landsat images. Geocarto Int. 2019, 34, 1237–1251. [Google Scholar] [CrossRef]
  56. Su, B.; Yi, J.; Chen, J.; Bao, X.; Sa, R. Analysis of vegetation degeneration succession trend in middle and lower reaches of Wulagai wetland of Inner Mongolia. Chin. J. Grassl. 2011, 33, 73–78. [Google Scholar]
  57. Ding, X.; Zhang, H.; Wang, Z.; Shang, G.; Huang, Y.; Li, H. Analysis of the Evolution Pattern and Driving Mechanism of Lakes in the Northern Ningxia Yellow Diversion Irrigation Area. Water 2022, 14, 3658. [Google Scholar] [CrossRef]
  58. Wu, M.; Xu, G.; Niu, X.; Fu, Z.; Liao, X. Study on Water Replacement Characteristics of Xinghai Lake Wetland Based on Landscape Water Quality Objectives. Water 2023, 15, 1374. [Google Scholar] [CrossRef]
Figure 1. The location of Inner-Mongolian Plateau and the distribution of three spatial regions.
Remotesensing 16 02210 g001
Figure 2. The flowchart of area extraction and analysis.
Remotesensing 16 02210 g002
Figure 3. The area variation of all lakes on the IMP.
Remotesensing 16 02210 g003
Figure 4. The variation curve of the total lake area on the IMP. The blue bars indicate the lake area.
Remotesensing 16 02210 g004
Figure 5. The area variation rates in four phases. The four panels indicate: (a) lake area variation from 2000 to 2009; (b) lake area variation from 2009 to 2013; (c) lake area variation from 2013 to 2016; (d) lake area variation from 2016 to 2021.
Remotesensing 16 02210 g005aRemotesensing 16 02210 g005b
Figure 6. Monthly variation in lake area on the Inner-Mongolian Plateau.
Remotesensing 16 02210 g006
Figure 7. Lake area and number changes in three spatial regions: (a) the western and southern parts; (b) the central and eastern parts; (c) the northeastern part. The red dashed lines indicate the linear regressions.
Remotesensing 16 02210 g007
Figure 8. The area and number proportions of lakes with different sizes. Small lakes account for the largest proportion in number, but a small proportion in area.
Remotesensing 16 02210 g008
Figure 9. The variations of different lake sizes: (a) the lake area variations, (b) the number variations.
Remotesensing 16 02210 g009
Figure 10. The distribution of lakes of four sizes at different elevations: small lakes (1–5 km2), medium lakes (5–10 km2), large lakes (10–50 km2), and very large lakes (>50 km2). The four panels indicate: (a) the distribution of the lakes in 2000; (b) the distribution of the lakes in 2009; (c) the distribution of the lakes in 2013; (d) the distribution of the lakes in 2021. As illustrated in the figure, the number of small lakes varied.
Remotesensing 16 02210 g010
Figure 11. Area regression between lake area extracted in this study and the previous datasets. (a) Hulun Lake from 2000 to 2021; (b) all lakes in 2000, 2005, 2010, and 2015. The black circles indicate lake areas, while the red lines indicate the 1:1 lines.
Remotesensing 16 02210 g011
Figure 12. The change in annual precipitation and annual mean temperature in three spatial regions from 2001 to 2020: (a) the distribution of meteorological stations, (b) the change in annual precipitation, (c) the change in annual mean temperature. The left axes are for bar chart while the right axes are for black lines.
Remotesensing 16 02210 g012
Figure 13. The land use coverage of different years.
Remotesensing 16 02210 g013
Figure 14. True color composite satellite images of Wulagai. The surface area of Wulagai has significantly declined from 2000 to 2021.
Remotesensing 16 02210 g014
Figure 15. The area variation and key actions in Wulagai Lake. Part of the key actions are mentioned in the reference [54].
Remotesensing 16 02210 g015
Figure 16. True color composite satellite images of Xinghai Lake. The surface area of Xinghai Lake has considerably expanded from 2000 to 2021.
Remotesensing 16 02210 g016
Figure 17. The area variation and key actions in Xinghai Lake.
Remotesensing 16 02210 g017
Table 1. The list of satellites utilized in this study.
SatelliteSpatial ResolutionAcquisition TimeObservation Time
Landsat 530 m1984–20122000–2012
Landsat 730 m1999-2000–2018
Landsat 830 m2013-2013–2018
Sentinel-2A/2B10 m2017-2019–2021
Table 2. The accuracy assessment of lake area extraction.
YearRMSEMAER2Overall Accuracy
20004.14 km21.71 km20.99691.7%
20054.26 km2
20107.40 km2
201511.41 km2
Disclaimer/Publisher’s Note: The statements, opinions and data contained in all publications are solely those of the individual author(s) and contributor(s) and not of MDPI and/or the editor(s). MDPI and/or the editor(s) disclaim responsibility for any injury to people or property resulting from any ideas, methods, instructions or products referred to in the content.