1. Introduction
The melting, aggregation, and fragmentation of precipitation particles are basic processes within the melting layer (ML) of stratiform clouds that can significantly influence weather and climate systems. Understanding these microphysical interactions is crucial for refining weather forecasting models and improving our ability to predict and manage weather-related disasters. In the early stages of cloud microphysics research, the focus was primarily on gathering basic observational data from ground-based sensors, which provided only indirect insights into the microphysical processes occurring within clouds. As technology advanced, the introduction of airborne platforms equipped with sophisticated sensors marked a significant leap forward. These airborne experiments have enabled direct in situ observations, drastically enhancing our understanding of how precipitation particles evolve through their lifecycle within clouds [
1].
The transition of ice particles through the ML is particularly significant. As these particles begin to melt, they develop a sticky surface that facilitates the aggregation process by allowing them to bind with other particles. This enhanced stickiness can lead to a nearly complete collection efficiency, fundamentally changing the dynamics within the cloud. Additionally, as the particles melt, variability in their falling speeds increases, which in turn heightens the likelihood of collisions and further aggregation [
2]. However, the processes within the ML are complex. In particular, fragmentation plays a crucial role, particularly affecting snowflakes with asymmetric mass distributions [
3,
4,
5]. Recent advancements in measurement technologies, such as those employed in the latest field studies, have facilitated the understanding of fragmentation in the lower ML, which significantly increases the number concentration of ice crystals [
6].
The dynamic interplay between aggregation and fragmentation is influenced by various factors including environmental conditions like turbulence within the ML. Turbulent air motions can cause rapid changes in local conditions, which can trigger or suppress aggregation and fragmentation processes. These processes are further modulated by factors such as relative humidity and particle size distribution, which are critical in determining the rates of other microphysical processes like sublimation, evaporation, and accretion [
7,
8]. Understanding these interactions is essential for accurately modeling the formation and development of precipitation.
In the past few decades, advancements in cloud-resolving models (CRMs) have integrated a suite of intricate microphysical processes that occur within the ML. Despite this progress, the scientific community continues to engage in robust discussions regarding the roles and relative significance of aggregation and fragmentation within the ML [
6,
9,
10,
11]. One of the pressing uncertainties is the frequency and impact of particle fragmentation in the lower ML. Moreover, the exact interplay and quantitative relationship between the aggregation of particles and their subsequent fragmentation are not fully understood or characterized. Consequently, current ML models and the microphysical parameterization schemes embedded within them have yet to comprehensively incorporate such fragmentation processes [
12,
13,
14,
15]. This omission presents a notable limitation and flaw in the models, which in turn impinges upon the predictive precision of numerical weather prediction (NWP) systems.
The Demonstration Project for Precipitation Enhancement and Hail Suppression in the Eastern Side of Taihang Mountain (hereafter PPEHS) provides a unique case study in this context. The region’s complex terrain and variable climate conditions make it a unique setting for such studies. Utilizing the King-air 350 aircraft, equipped with advanced instruments, including a two-dimensional light array probe and a cloud particle imager, this project has contributed significantly to our understanding of microphysical processes. The integration of these high-resolution airborne instruments with S-band operational radar has enabled a comprehensive analysis of the microphysical dynamics within the ML and its numerical prediction.
This paper is organized to systematically present the research and findings from this extensive study. Following this introduction,
Section 2 details the methodology employed, including a description of the instruments used and the data processing techniques.
Section 3 offers an overview of the field experiments and the synoptic conditions that were prevalent during the study period. The macrostructural and microphysical characteristics observed within the ML have also been included in
Section 3. Finally,
Section 4 synthesizes the insights gained from this research, discussing the broader implications for future studies and the potential enhancements to weather and climate prediction models that these findings could support.
3. Results
3.1. Synoptic Overview and Remote Sensing Analysis
Field experiments, supported by the PPEHS [
6,
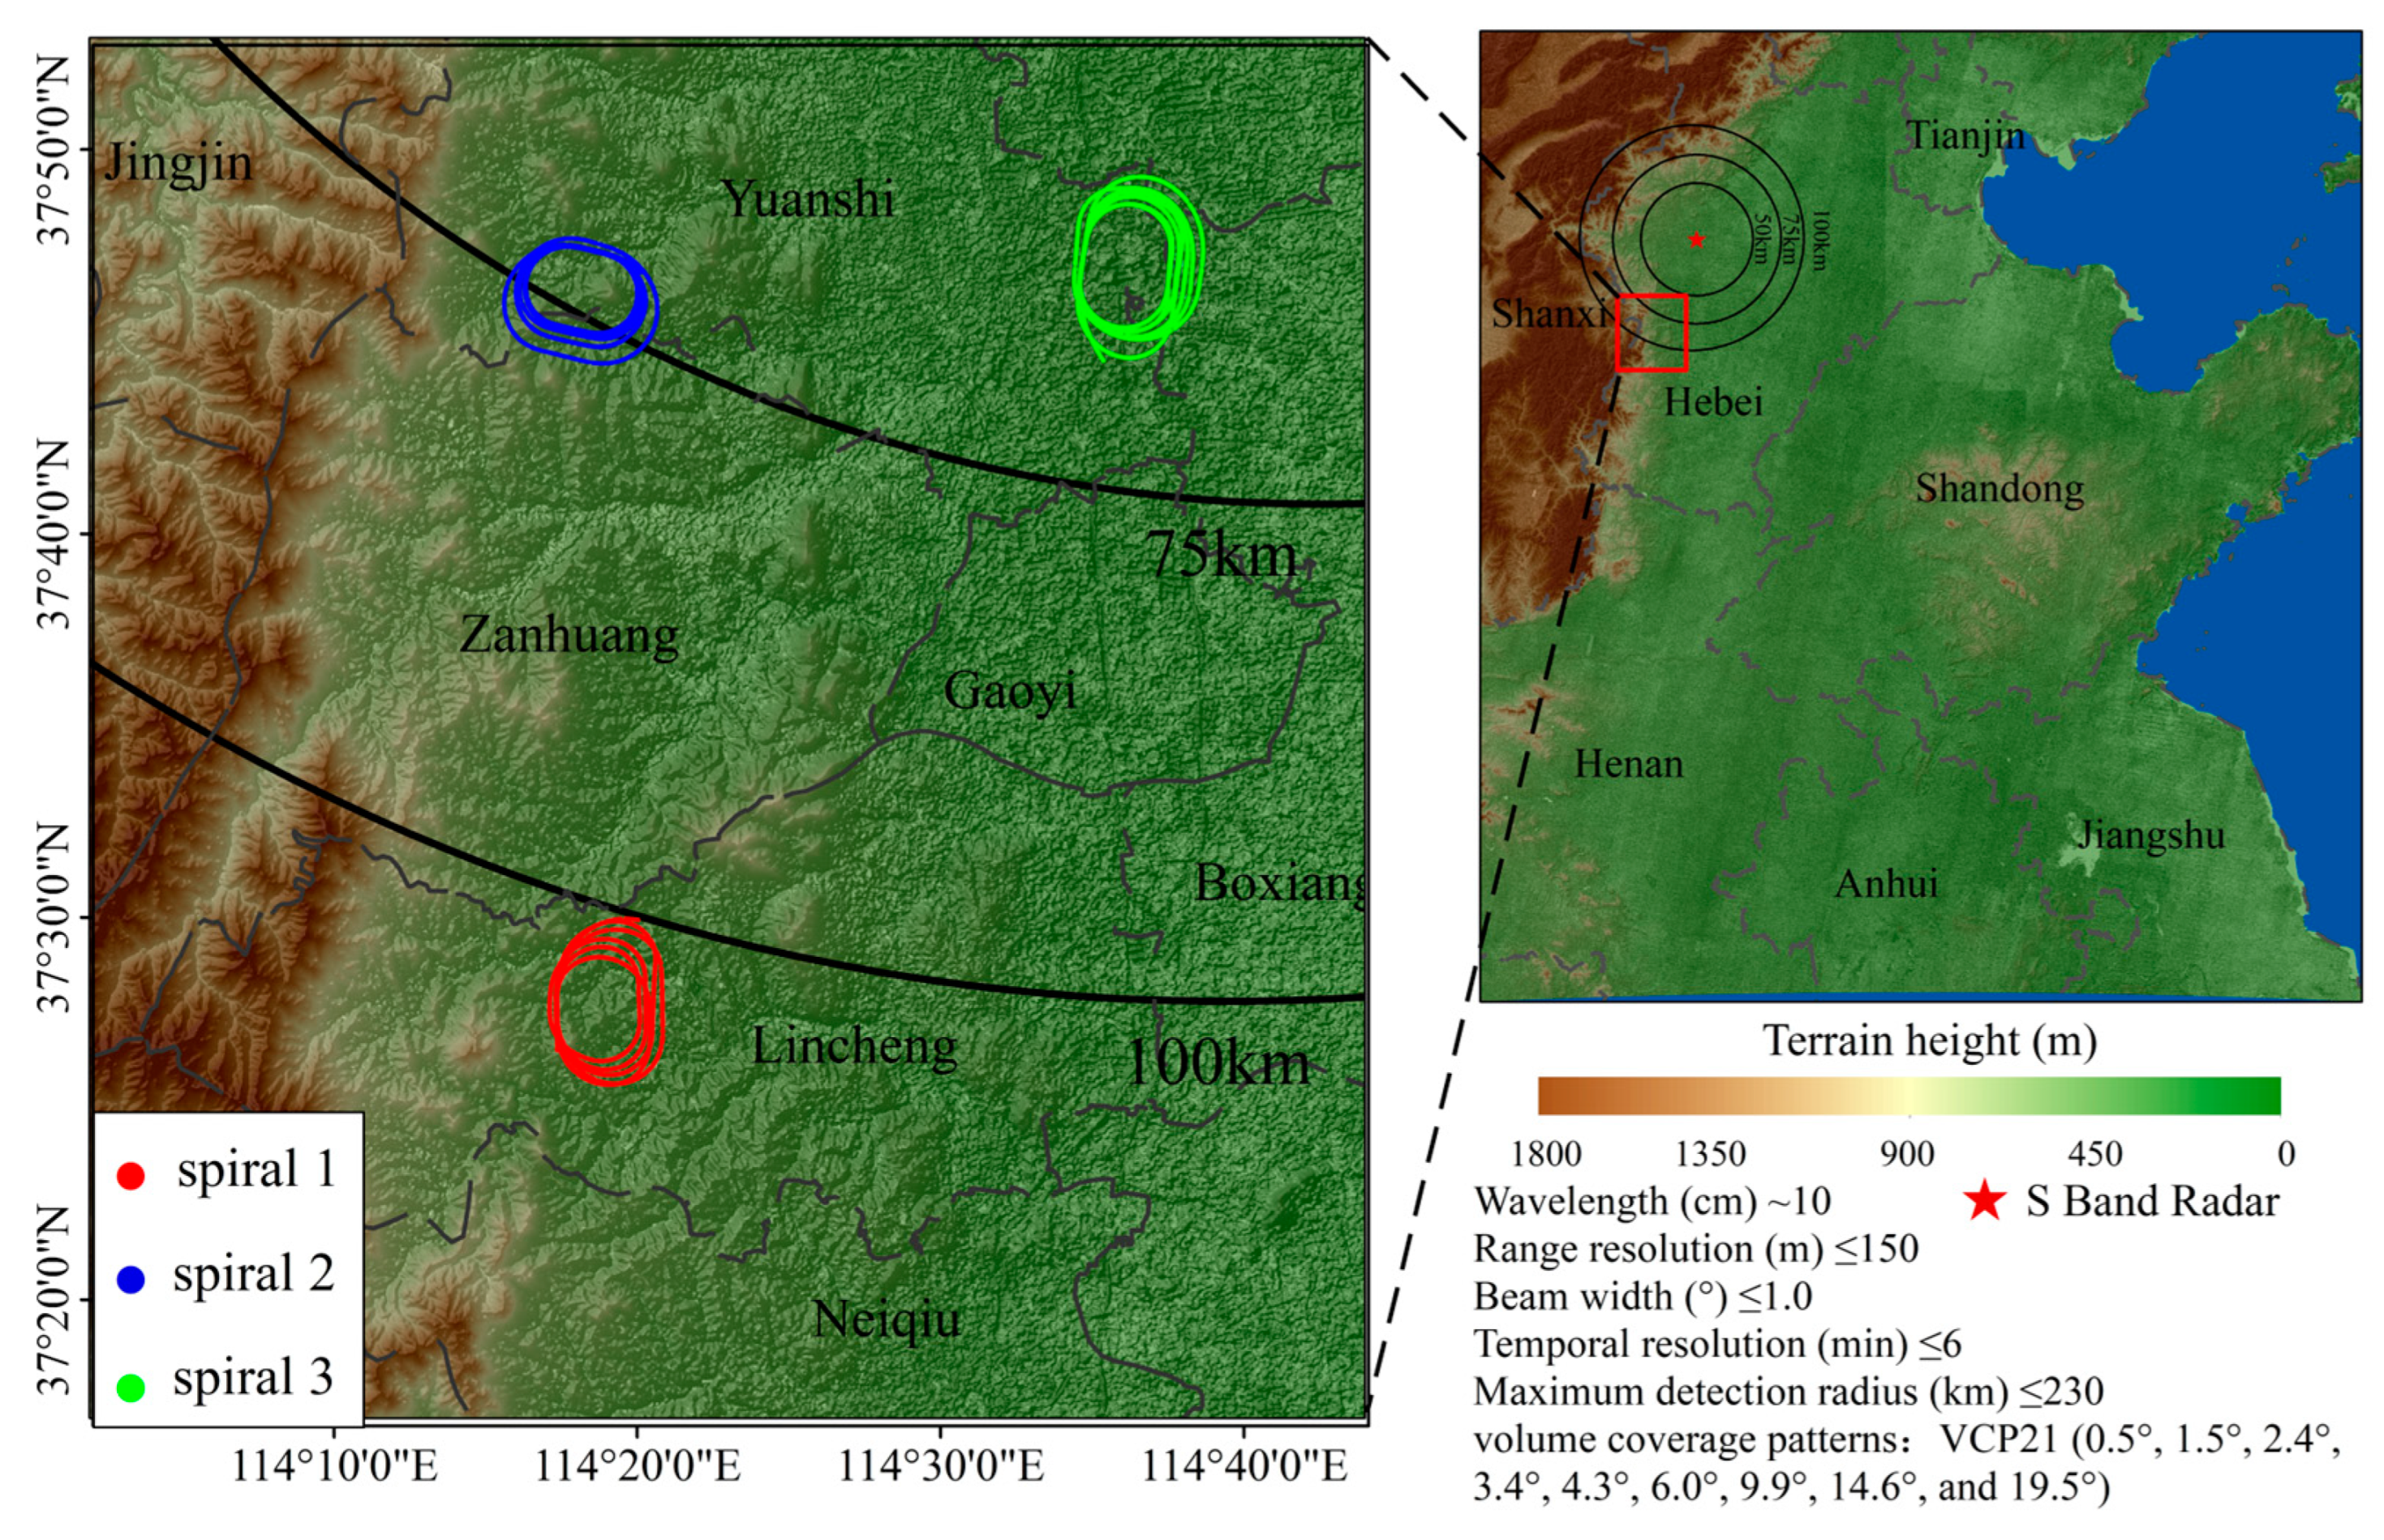
22], were carried out near Yuanshi, Zanhuang, and Lincheng from April to May in 2017–2019, as shown in
Figure 1. In these field experiments, the Hebei King-Air 350 airborne platform, equipped with a suite of thermodynamic and hydrometeorological sensors, was sent for observations to study the microphysical characteristics of ML in the hilly region at the junction of the eastern side of the Taihang Mountains and the North China Plain. During the flights, vertical spiral detections of precipitating stratiform clouds were conducted for finer vertical structures. In this study, three spirals under the influence of similar synoptic systems and topography, referred to as Spiral1 (on 22 May 2017), Spiral2 (on 21 May 2018), and Spiral3 (on 20 April 2019), were selected for further comparison.
Table 1 summarizes the details of three spiral detections through the ML.
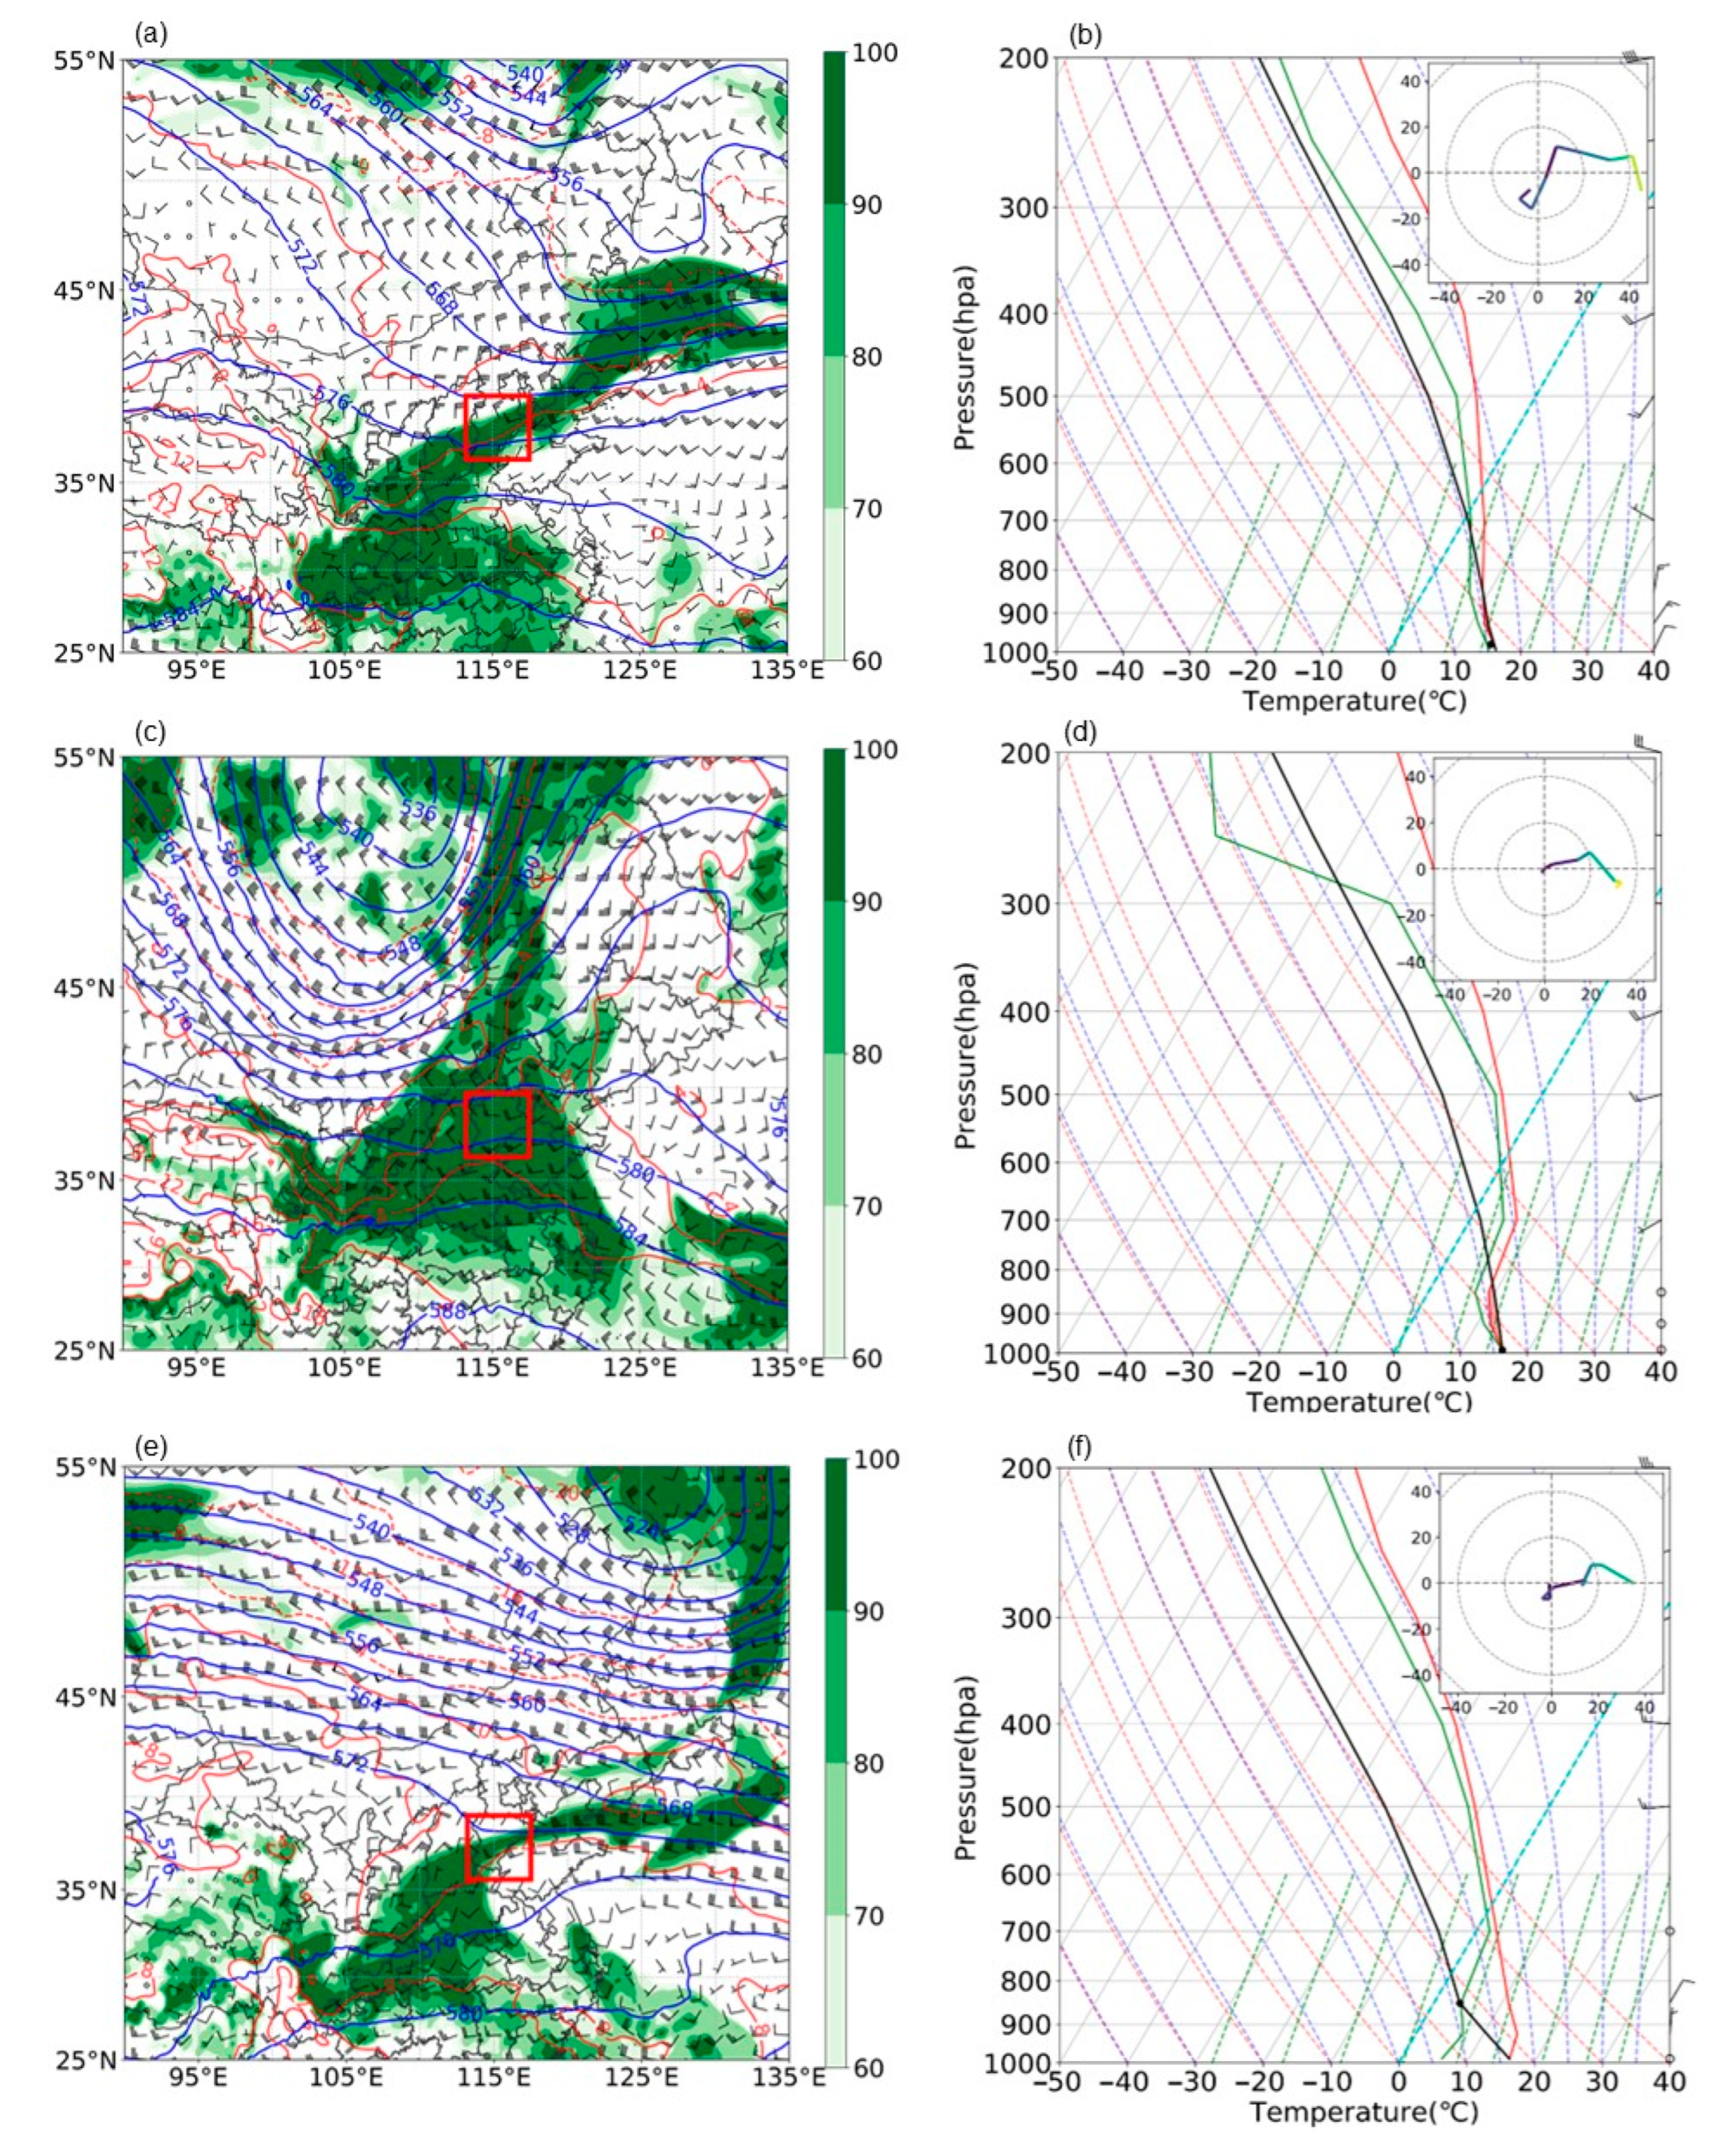
The meteorological analysis using ERA5 hourly data revealed that synoptic-scale upper-level troughs or latitudinally shifted vortices were temporally correlated with the onset of precipitation as discerned on 22 May 2017 and 21 May 2018 (
Figure 2a,c). These events were characterized by a marked convergence and ascending motion, primarily concentrated near the core of negative divergence at the 700 hPa level. In contrast, observations made from 20 April 2019 disclosed a narrower near-saturated band at 850 hPa (
Figure 2e) and showed some low-level temperature inversion (
Figure 2f) within the field experiment region, resulting in a lower potential for strong airlifting and a decrease in the hourly precipitation intensity. This was attributed to the poleward repositioning of the upper-level frigid vortex system in this case. Sounding data acquired from the Xingtai station substantiated the prevalence of homogeneous stratiform cloud configurations during three precipitation cases. These clouds were associated with modest convective available potential energy (CAPE) levels in the range of 7–45 J kg
−1, accompanied by weak convective instability. Relative humidity (RH) below the 500 hPa threshold in the region surpassed 80%, with specific humidity indices ranging between 5 and 9 g kg
−1, indicative of a robustly saturated atmospheric layer. Notably, an abrupt transition in wind directions from a southwesterly to an easterly direction was observed below the 800 hPa altitude, exhibiting velocities between approximately 2 and 12 m s
−1. The easterly ‘return flow’ facilitated a warm and humid air mass advection; concurrently, orographic lifting induced by the terrain to the west fostered the genesis of lower-tropospheric stratiform clouds.
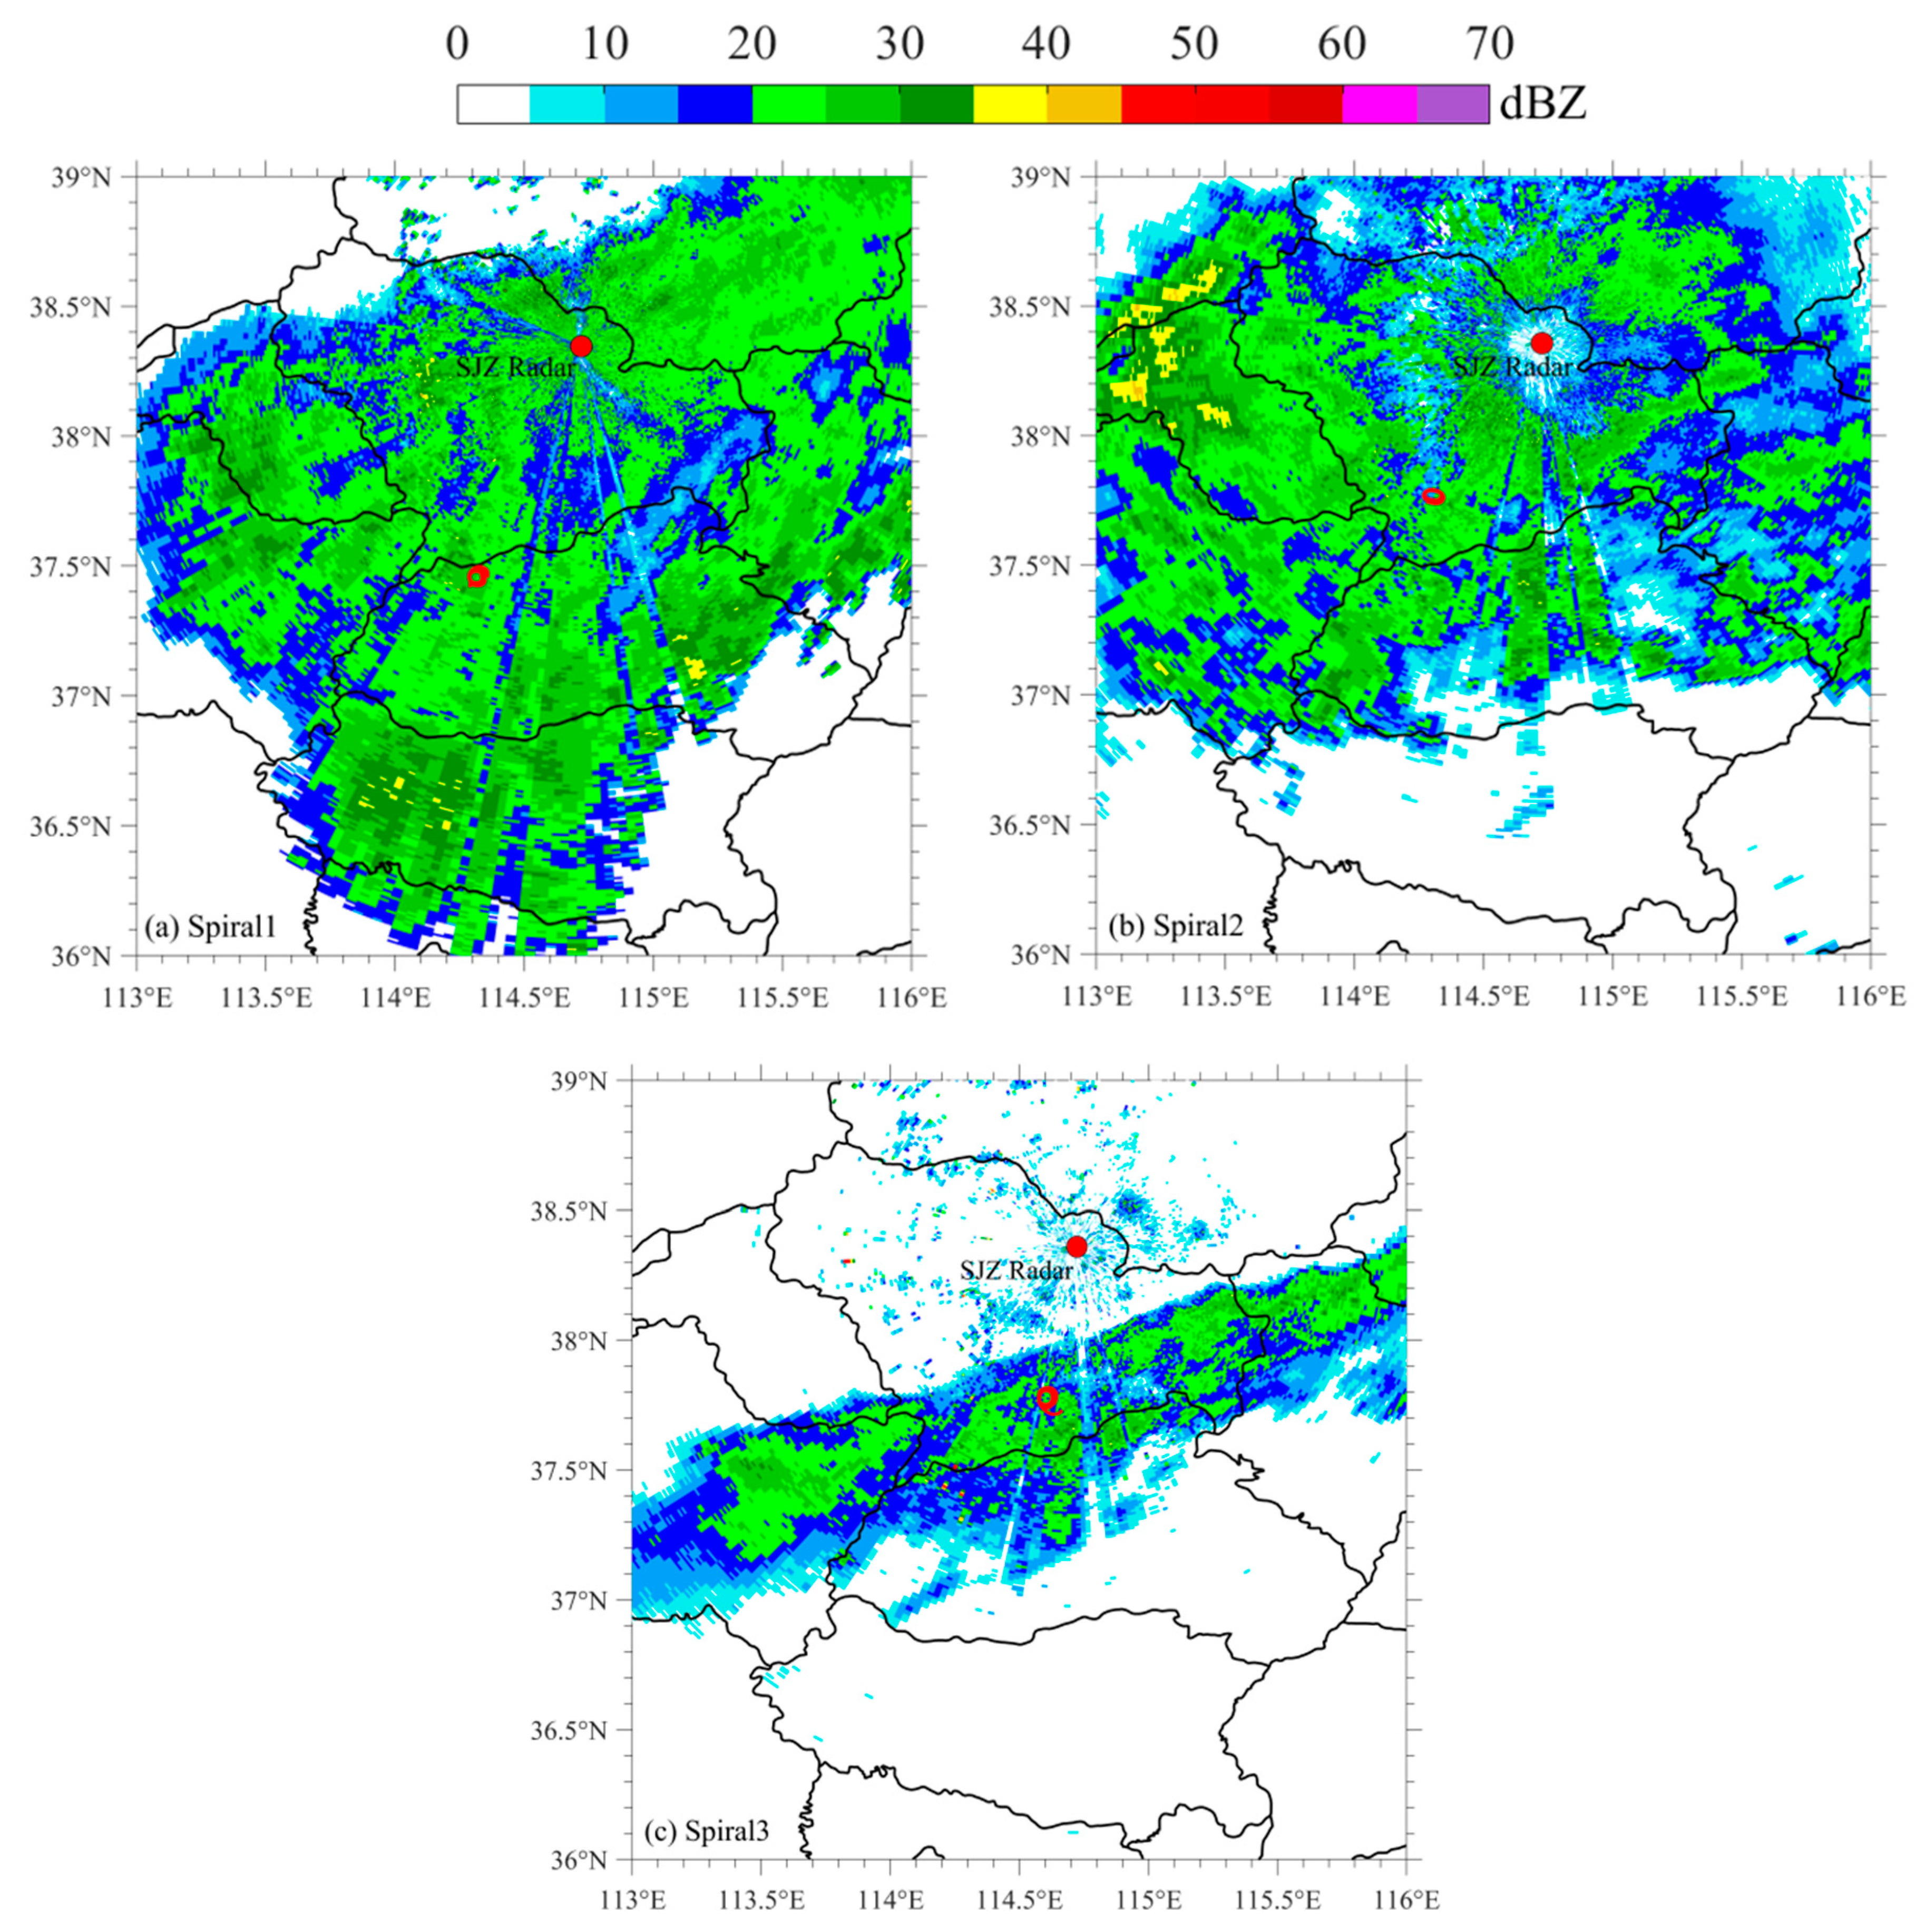
The reflectivity data obtained from the plan position indicator (PPI) scan of the Shijiazhuang S-band operational radar at an elevation angle of 0.5° (indicated by the red pentagram in
Figure 1) revealed that the echo intensities fluctuated between 15 and 30 dBZ on 22 May 2017, 21 May 2018, and 20 April 2019, as shown in
Figure 3. Notably, the spatial extent of stratiform precipitation on 22 May 2017 and 21 May 2018 was broader than that on 20 April 2019, with the latter displaying a distinct east–west band distribution. Synoptic analyses (
Figure 2) coupled with radar data suggest that the stable stratiform precipitation systems were primarily in their dissipating phases during these periods.
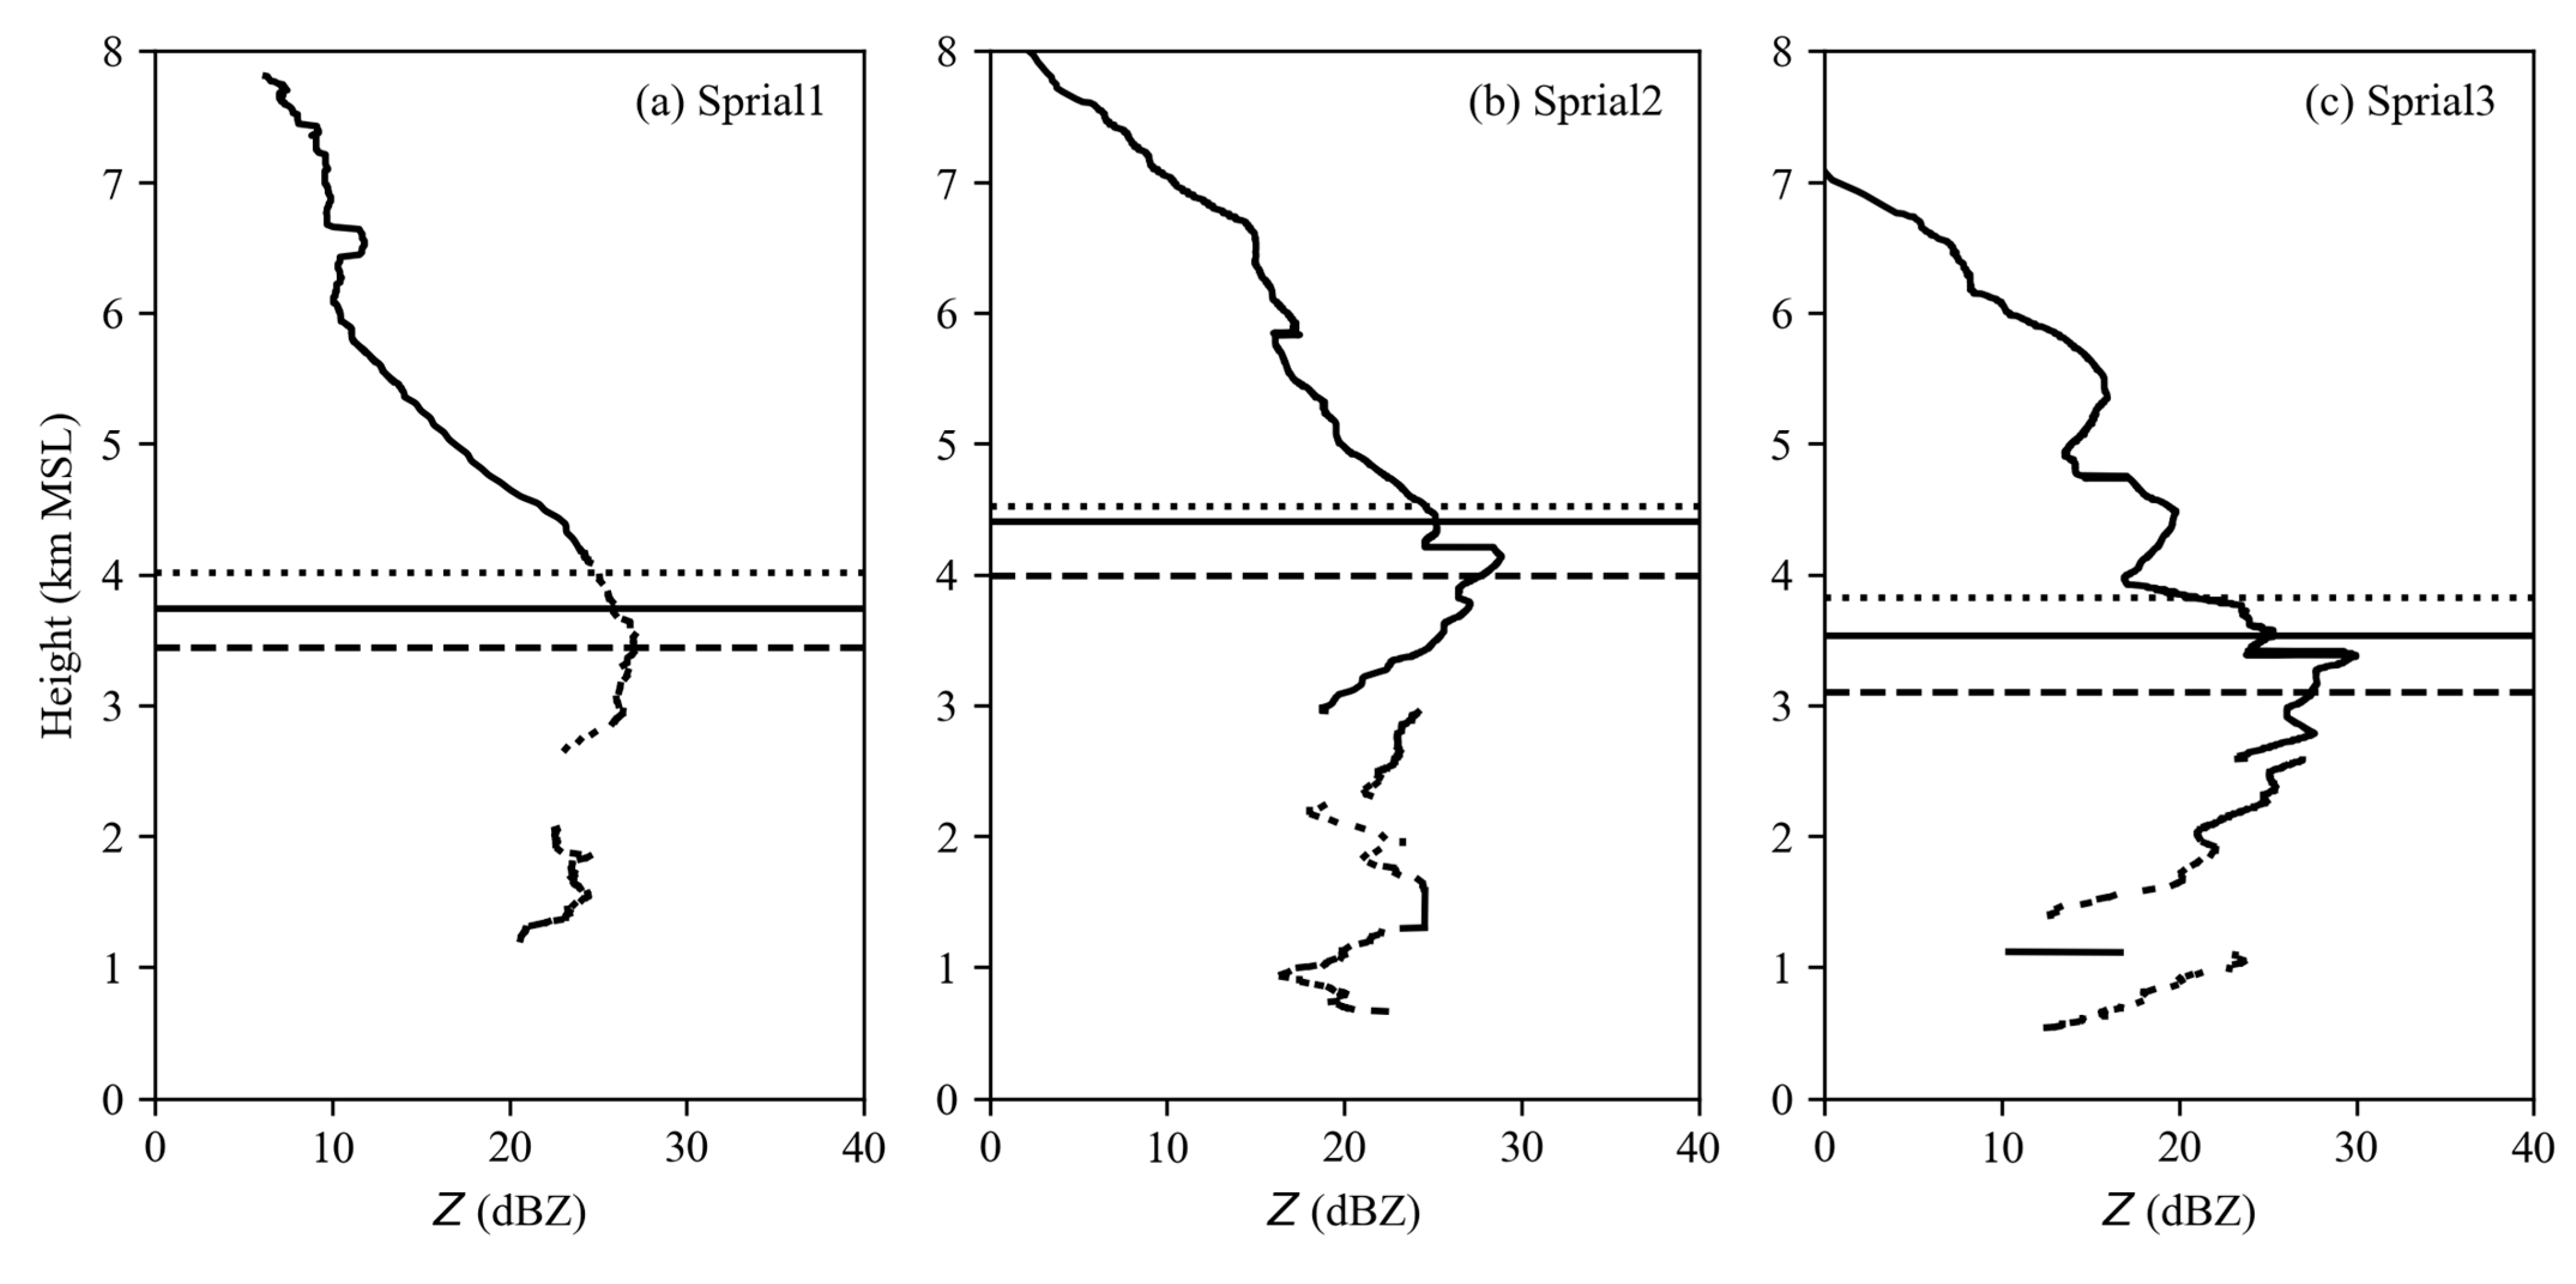
Besides the PPI, the vertical profiles of the reflectivity factor near the locations of three spirals composed using the method of columnar vertical profile (CVP) method [
23] are shown in
Figure 4, which could provide important insights into the microphysical characteristics within the ML. The echo intensity exhibited a pronounced enhancement near the ML, with maximum values approaching 30 dBZ. The reflectivity factor (
Z) of Sprial1 increased with decreasing height until it reached the lower part of the ML. The
Z of Sprial2 rapidly increased in the middle part, reaching a peak in the middle of the layer, and then rapidly decreased in the lower part. The
Z in Sprial3 gradually increased with decreasing height in the upper part, reaching a peak in the middle of the layer, and rapidly decreasing in the lower part. On 20 April 2019, the peak value of the mean
Z reached 30 dBZ, while on 22 May 2017 and 21 May 2018, the mean
Z value was between 20 and 30 dBZ. These substantial differences in reflectivity factors can be attributed to the distinct distribution characteristics of hydrometeors and the varying microphysical processes within the ML, which will be analyzed in detail.
3.2. The Evolution of Particle Habits within the ML
Ice microphysical processes are inherently dependent on a range of environmental parameters, including temperature, relative humidity, the presence of cloud water, aerosol loading, precipitation levels, and cloud dynamics [
24]. These factors interact in complex ways, fundamentally influencing the behaviors and attributes inherent in the field of ice microphysics. This interplay governs the intricate mechanisms that underpin the formation, growth, and evolution of ice within atmospheric clouds. Airborne cloud microphysical probes, like 2DS, CPI, and HVPS, provide direct observations crucial for understanding these phenomena. These instruments measure various properties of ice particles, such as their shapes, phases, sizes, number concentrations, and spectral distribution characteristics. Through the detailed examination of these microphysical attributes, it is possible to infer the key processes occurring within the MLs.
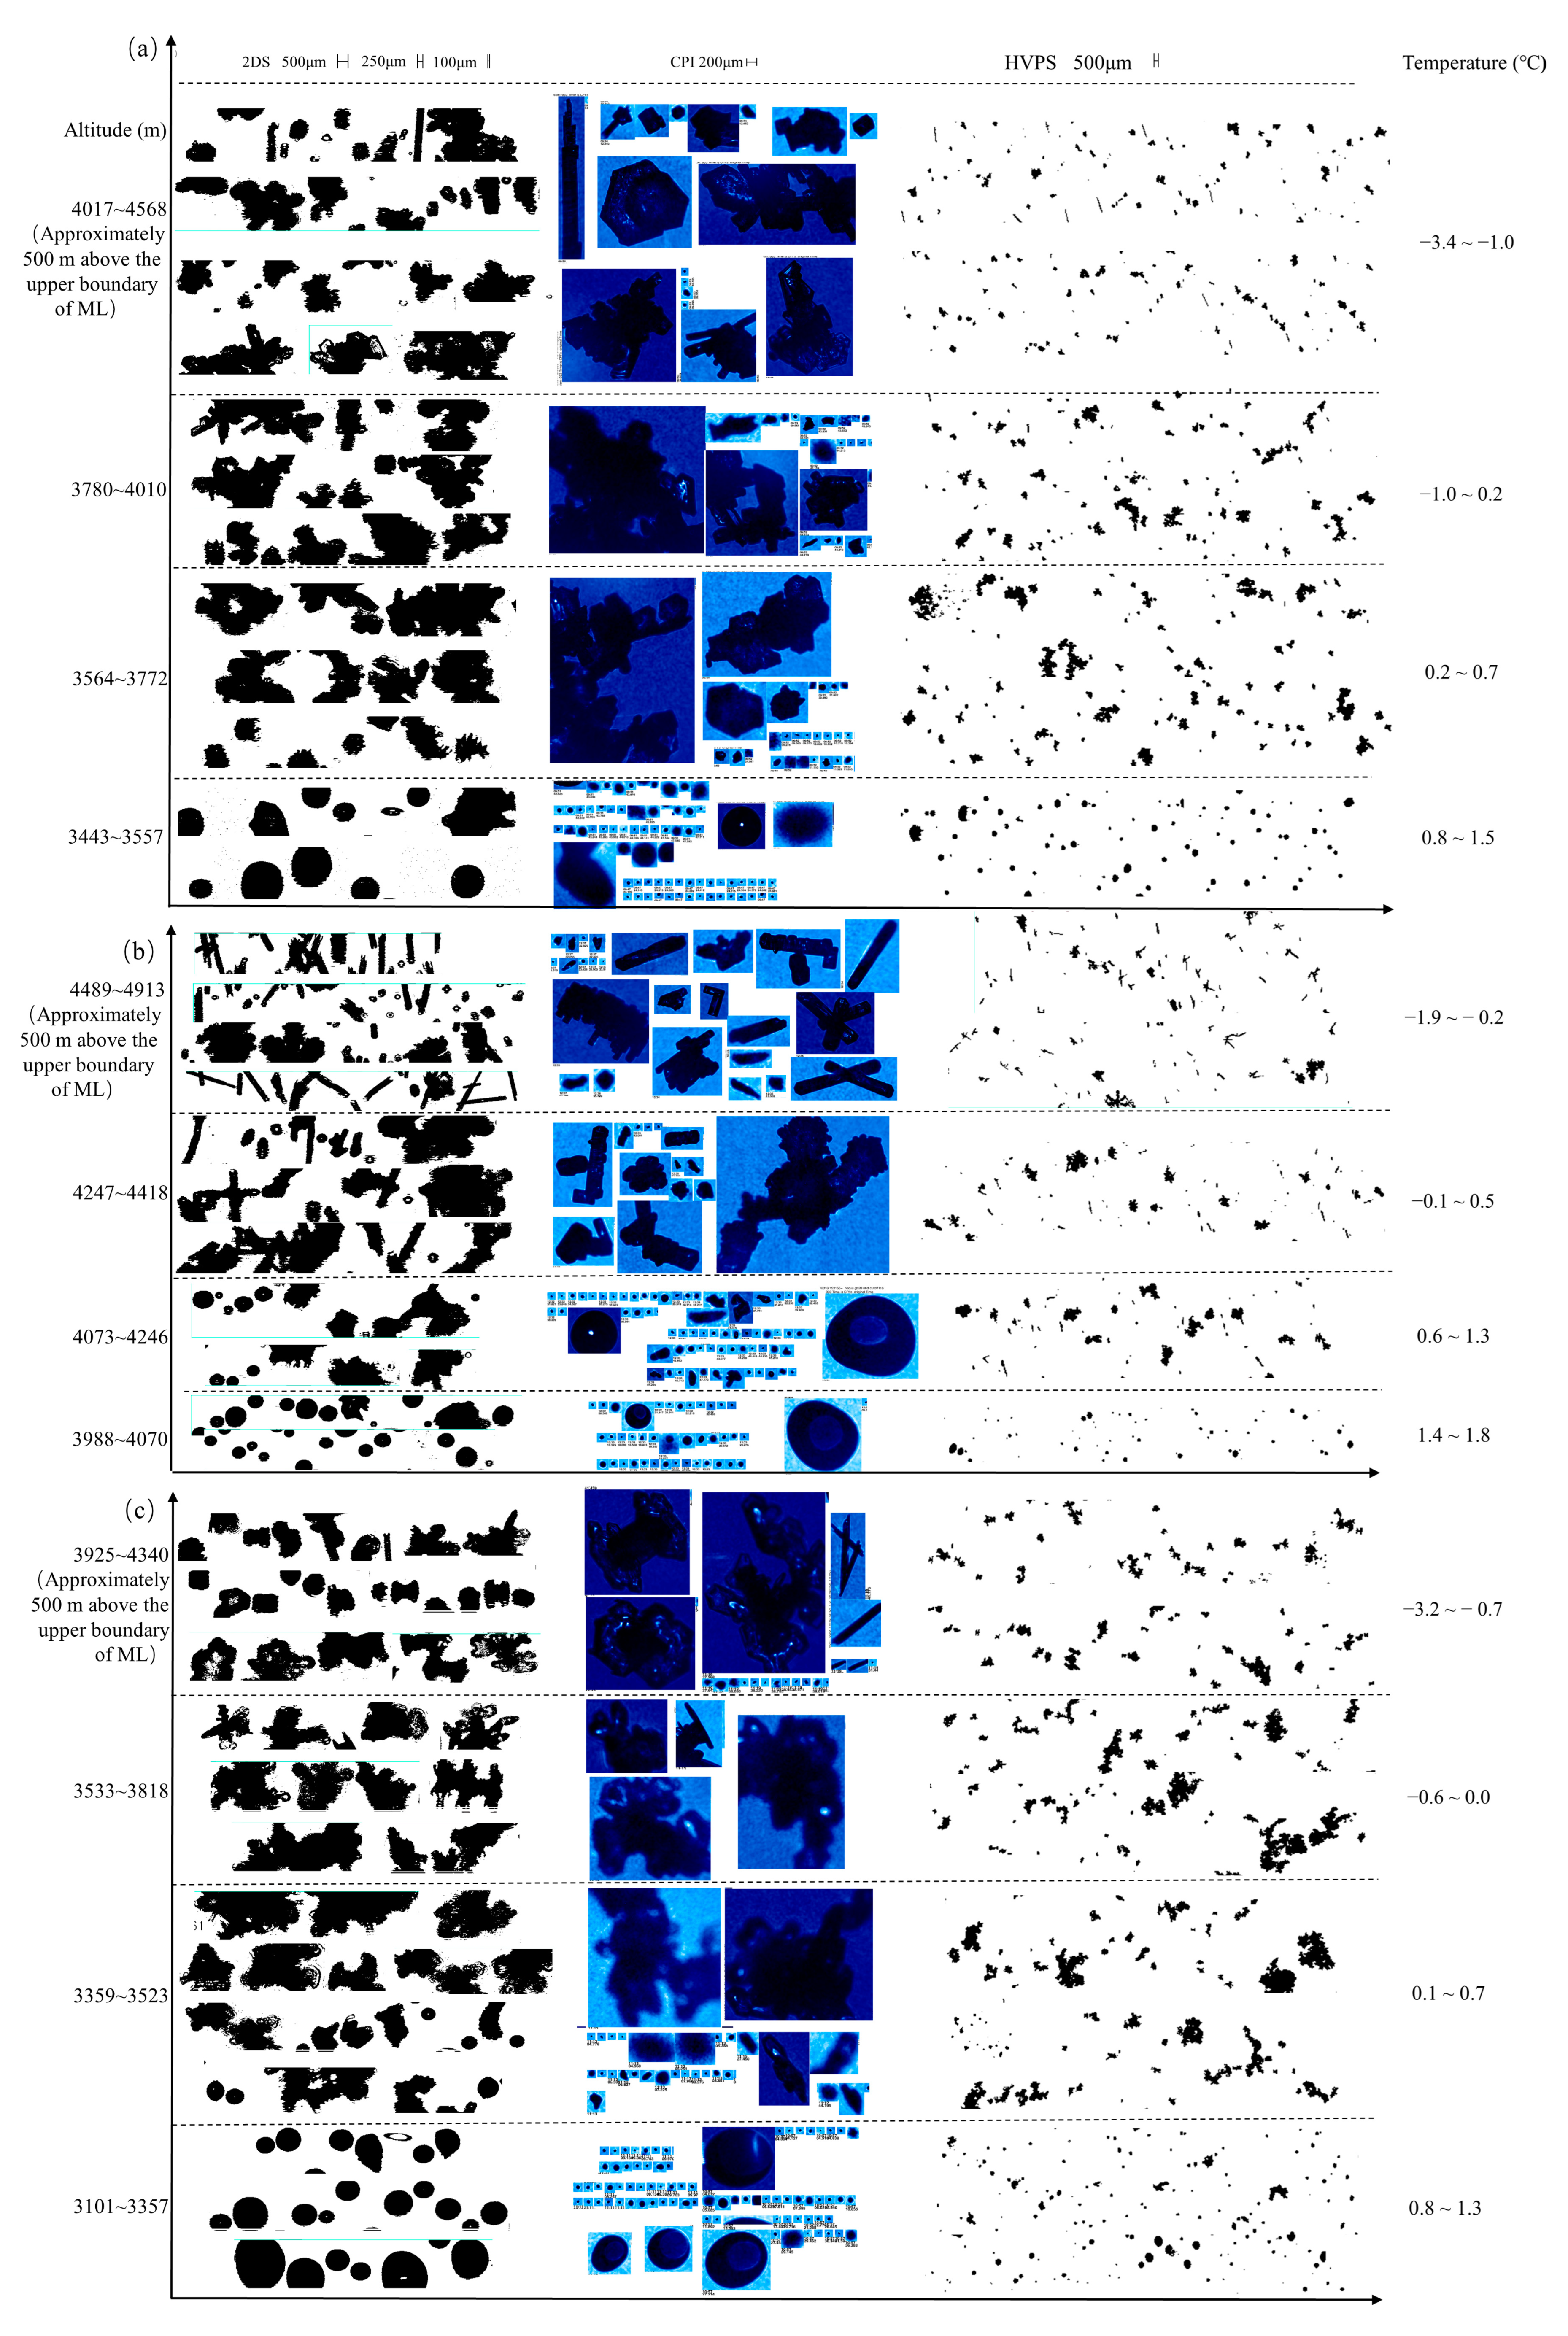
As depicted in
Figure 5a, hydrometeors in Spiral1 primarily consisted of small aggregates with the temperatures observed by the AIMMS-20 system between −1.0 and 0.2 °C, whereas temperatures between 0.2 and 0.7 °C featured a considerable number of larger melting aggregates. Spherical and quasi-spherical liquid droplets were predominant, interspersed with a few irregularly shaped melting ice particles from 0.8 to 1.5 °C. In Spiral2, aggregates composed of columnar ice crystals dominated between the −0.1 and 0.5 °C isotherms. The outlines of most aggregates became blurred, and a few small quasi-spherical liquid droplets appeared between 0.6 and 1.3 °C. With increasing temperature, spherical and ellipsoidal liquid droplets predominated in the range of 1.4 to 1.8 °C. In Spiral3, some aggregates and a few plate-like ice crystals with discernible branches of sector plates were present between −0.1 and 0.1 °C. Subsequently, the outlines of these particles blurred from 0.1 to 0.5 °C due to melting, culminating in rapid melting into small quasi-spherical droplets from 0.5 to 1.3 °C.
Furthermore, the largest aggregates were observed in the top one-third of the ML in all cases. As they descended, the melting process caused the edges of particle images to gradually blur in the middle of the ML, with smaller particles melting faster and transitioning into spherical and quasi-spherical liquid droplets before the larger particles. Comparative analysis reveals that the liquid droplets in Spiral2 were noticeably smaller than those in Spiral1 and Spiral3, potentially due to differences in particle properties such as habits and densities. Above the ML, the images captured by the probes and corresponding
AR values (which will be further analyzed in
Figure 6) indicated that columnar crystals predominated in Spiral2, whereas plate-like crystals were more common in Spiral1 and Spiral3. The disparities observed in the microphysical characteristics within the ML may be partially elucidated by the columnar ice particles’ tendency to coalescence into singular or a few smaller droplets during melting, compared to the aggregates composed of plate-like crystals [
4].
3.3. The Area Ratios in the ML
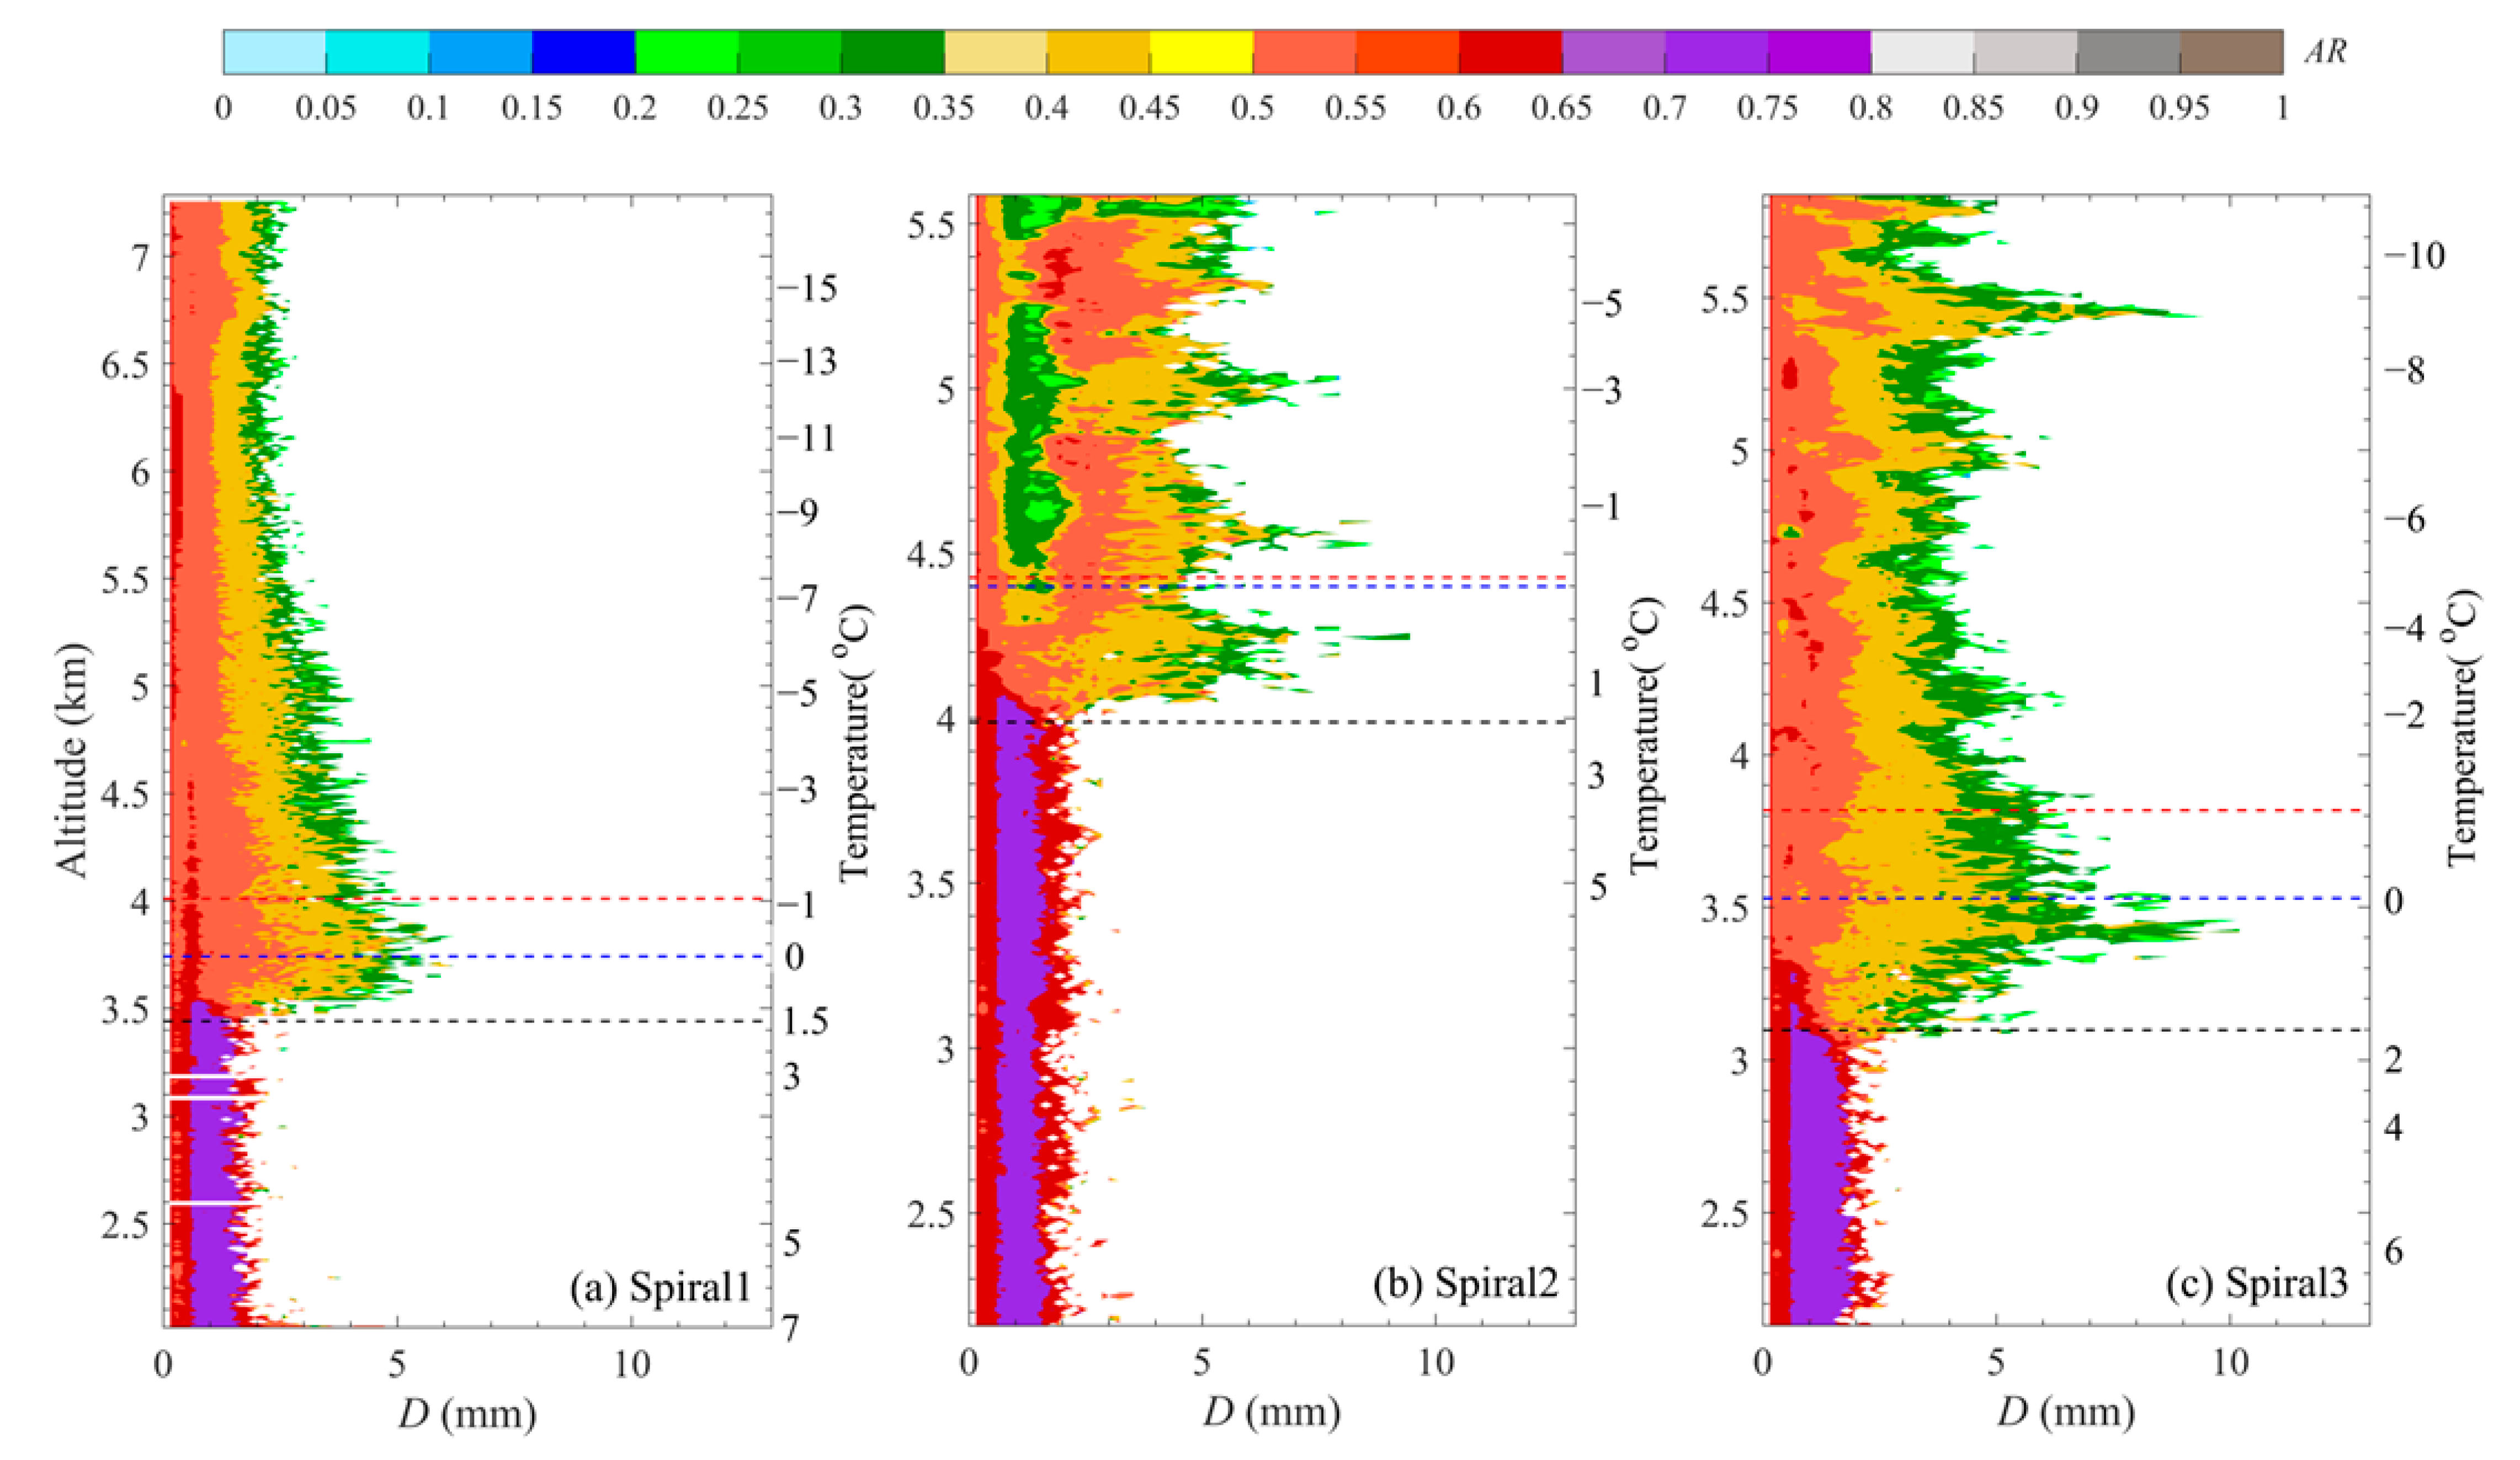
The
AR, defined as the ratio of a particle’s projected area on the probe image to the area of its minimum circumscribed circle, serves as an essential parameter for characterizing particle shape and density, pivotal during the melting process. Typically, a sphere yields an
AR of approximately 0.8, highlighting its near-circular shape in projection [
25]. Comparisons of
AR characteristics within the MLs, depicted between the red and black dashed lines in
Figure 6a–c, revealed both similarities and differences. Similar to those above the ML, the
AR values of particles within the ML generally decreased with increasing particle size. This trend indicated that larger particles exhibited more pronounced irregular shapes or low densities. As particles fell through the ML, their diameter distribution initially widened and subsequently narrowed, suggesting that the maximum particle diameter increased before decreasing. This pattern indicated significant aggregation processes in the upper part of the ML, particularly evident in Spiral2 and 3, where the peak particle diameter approached or exceeded 10 mm, respectively. These large particles, formed through aggregation, displayed an
AR of only about 0.3, located slightly below the 0 °C isotherm (
Figure 6b,c).
Comparing the three Spirals, the increase in maximum particle diameter was more pronounced in Spiral2 and Spiral3, likely due to a higher concentration of large ice particles within these spirals. The greater terminal velocity differences between melting particles enhanced aggregation efficiency. This was consistent with the peak reflectivity factor observed in Spiral2 and 3 (
Figure 4b,c), which was significantly higher than that of Spiral1 (
Figure 4a). Moreover, the presence of larger ice particles in Spiral3 led to a thicker ML (
Figure 6c). In the lower part of the ML, the peak particle diameter decreased, and the
AR of small particles notably increased, while the
AR values of medium and large particles changed minimally in each spiral, correlating with the more rapid melting of smaller particles.
Additionally, as observed in
Figure 6a–c, the average
AR values for particles between 2 and 3 mm in diameter were higher in Spiral2, possibly due to the lower density and faster melting rates of ice particles composed of columnar ice. Conversely, in Spiral3, particles of the same size melted more slowly, and partially melted large particles retained irregular ice cores, resulting in a lower average
AR. Notably, even for small particles after melting,
AR values did not exceed 0.8, which may have been related to the limited resolution of the HVPS instrument, affecting the deformation measurement of small circular particles.
3.4. Microphysical Parameters in the MLs
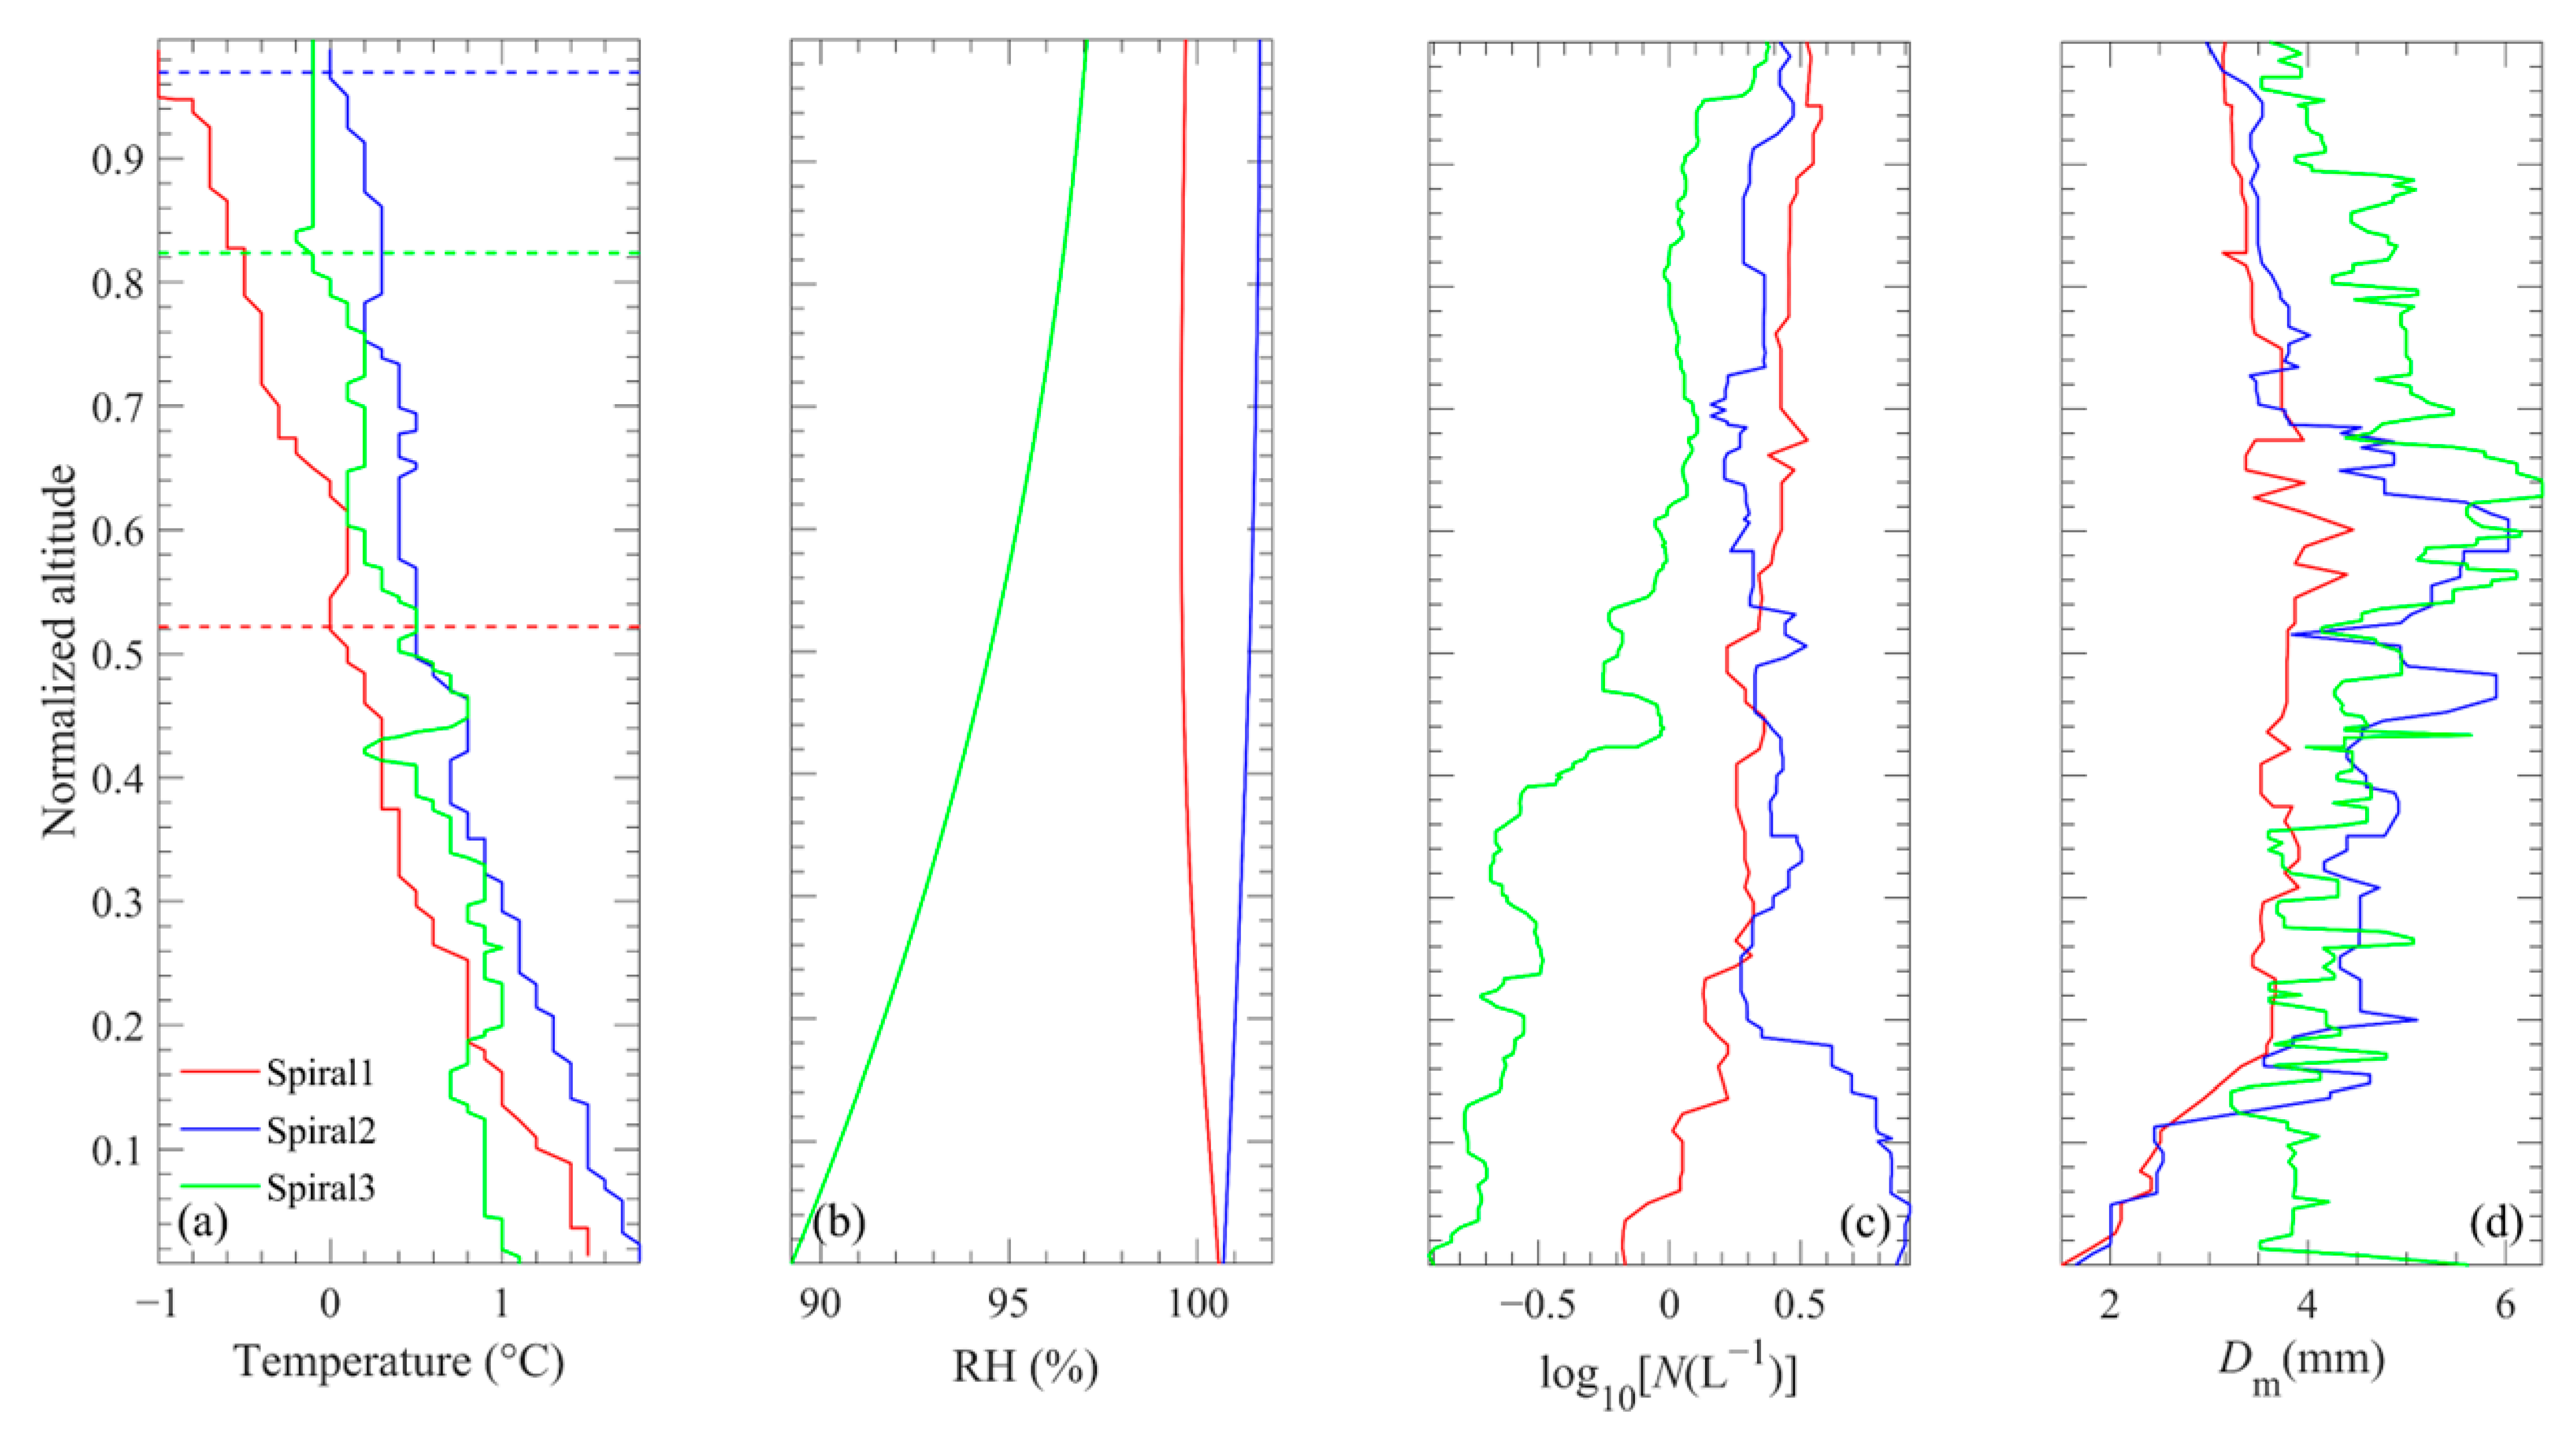
The temperatures in the MLs generally ranged between −1 and 2 °C (
Figure 7a). According to the RH data for three MLs (
Figure 7b), most regions exhibited RH values exceeding 90%. RH in Spiral3 was the lowest among the three, consistent with the narrowest rainband, as shown in
Figure 3c. It was observed that the ice particles began to melt near −1 °C in Spiral1, while in Spiral2 and Spiral3, melting occurred closer to 0 °C. As demonstrated in
Figure 7d, the
Dm increased rapidly with decreasing altitude when the
Znorm was above 0.6, reaching a peak value of approximately 4 mm, which corresponded to dominant aggregation processes in this region. Subsequently,
Dm changed slowly, nearing 3 mm when
Znorm ranged between 0.2 and 0.6, likely indicating a balance between aggregation and melting processes.
Dm sharply decreased due to rapid structural collapse in the final stage of melting when
Znorm was below 0.2 (temperature between 0.8 to 1.5 °C), where numerous quasi-spherical liquid droplets emerged. Correspondingly, the
Nt in Spiral1 generally decreased with decreasing altitude throughout the ML (
Figure 7c) but was influenced by different processes at various stages of melting. Specifically, in the final stage when
Znorm was below 0.2, the decrease in
Nt was attributed to rapid increases in the falling speeds of particles, considering flux conservation.
The changing trend of
Dm in Spiral2 was similar to that in Spiral1, albeit with a significantly larger peak value (reaching 6 mm as shown in
Figure 7d). Therefore, the rate of change in
Dm in Spiral2 was considerably greater, especially when
Znorm exceeded 0.6 (increasing) and was below 0.2 (decreasing), suggesting some unique characteristics of the microphysical processes. This is further evidenced by the vertical profiles of
Nt in the spirals (
Figure 7c). Above
Znorm = 0.2, the
Nt in Spiral2 approximated that in Spiral1, showing a slight decrease when
Znorm was above 0.6 and an increase when
Znorm was between 0.2 and 0.6. However, below
Znorm = 0.2, a rapid increase in
Nt was observed in Spiral2, with the maximum value nearing 10
1 L
−1, distinctly diverging from the decreasing trend observed in Spiral1. This suggests the formation of small ice particles from collisional breakup and rapid melting during aggregate descent, along with the production of a substantial number of liquid droplets [
1], which suppressed the decrease in
Nt caused by increased particle falling speeds. Note that the relative humidity with respect to water in the nearest region of the aircraft spiral is supersaturated or subsaturated (
Figure 7b), which can lead us to infer that they all are in a supersaturated condition with respect to ice. Therefore, the effect of sublimation in the study could be negligible.
In Spiral3, the Nt values decreased with decreasing altitude and were significantly lower than those in Spiral1 and Spiral2 at each altitude level. The Dm in Spiral3 exhibited an increasing trend with a decrease in altitude above Znorm = 0.6 and shifted to a decreasing trend below this level (and above Znorm = 0.2). The peak Dm value also appeared at Znorm = 0.6, i.e., larger than those in Spiral1 and Spiral2 (about 6.5 mm). Additionally, below Znorm = 0.2, Dm changed slightly near 3.8 mm. Given the decreasing Nt in this layer, one might infer a balance between melting and collision –coalescence/aggregation processes at this level.
In comparing the three spirals, it becomes apparent that the particles within the melting layer initially undergo aggregation processes near Znorm = 0.6, achieving maximum diameters before the acceleration of melting leads to structural collapse, reducing Dm. This variation in melting rates, influenced by the initial shape, density, and scale of the ice particles, leads to differences in the thickness of the melting layer and the internal microphysical processes.
3.5. The Particle Size Distributions in MLs
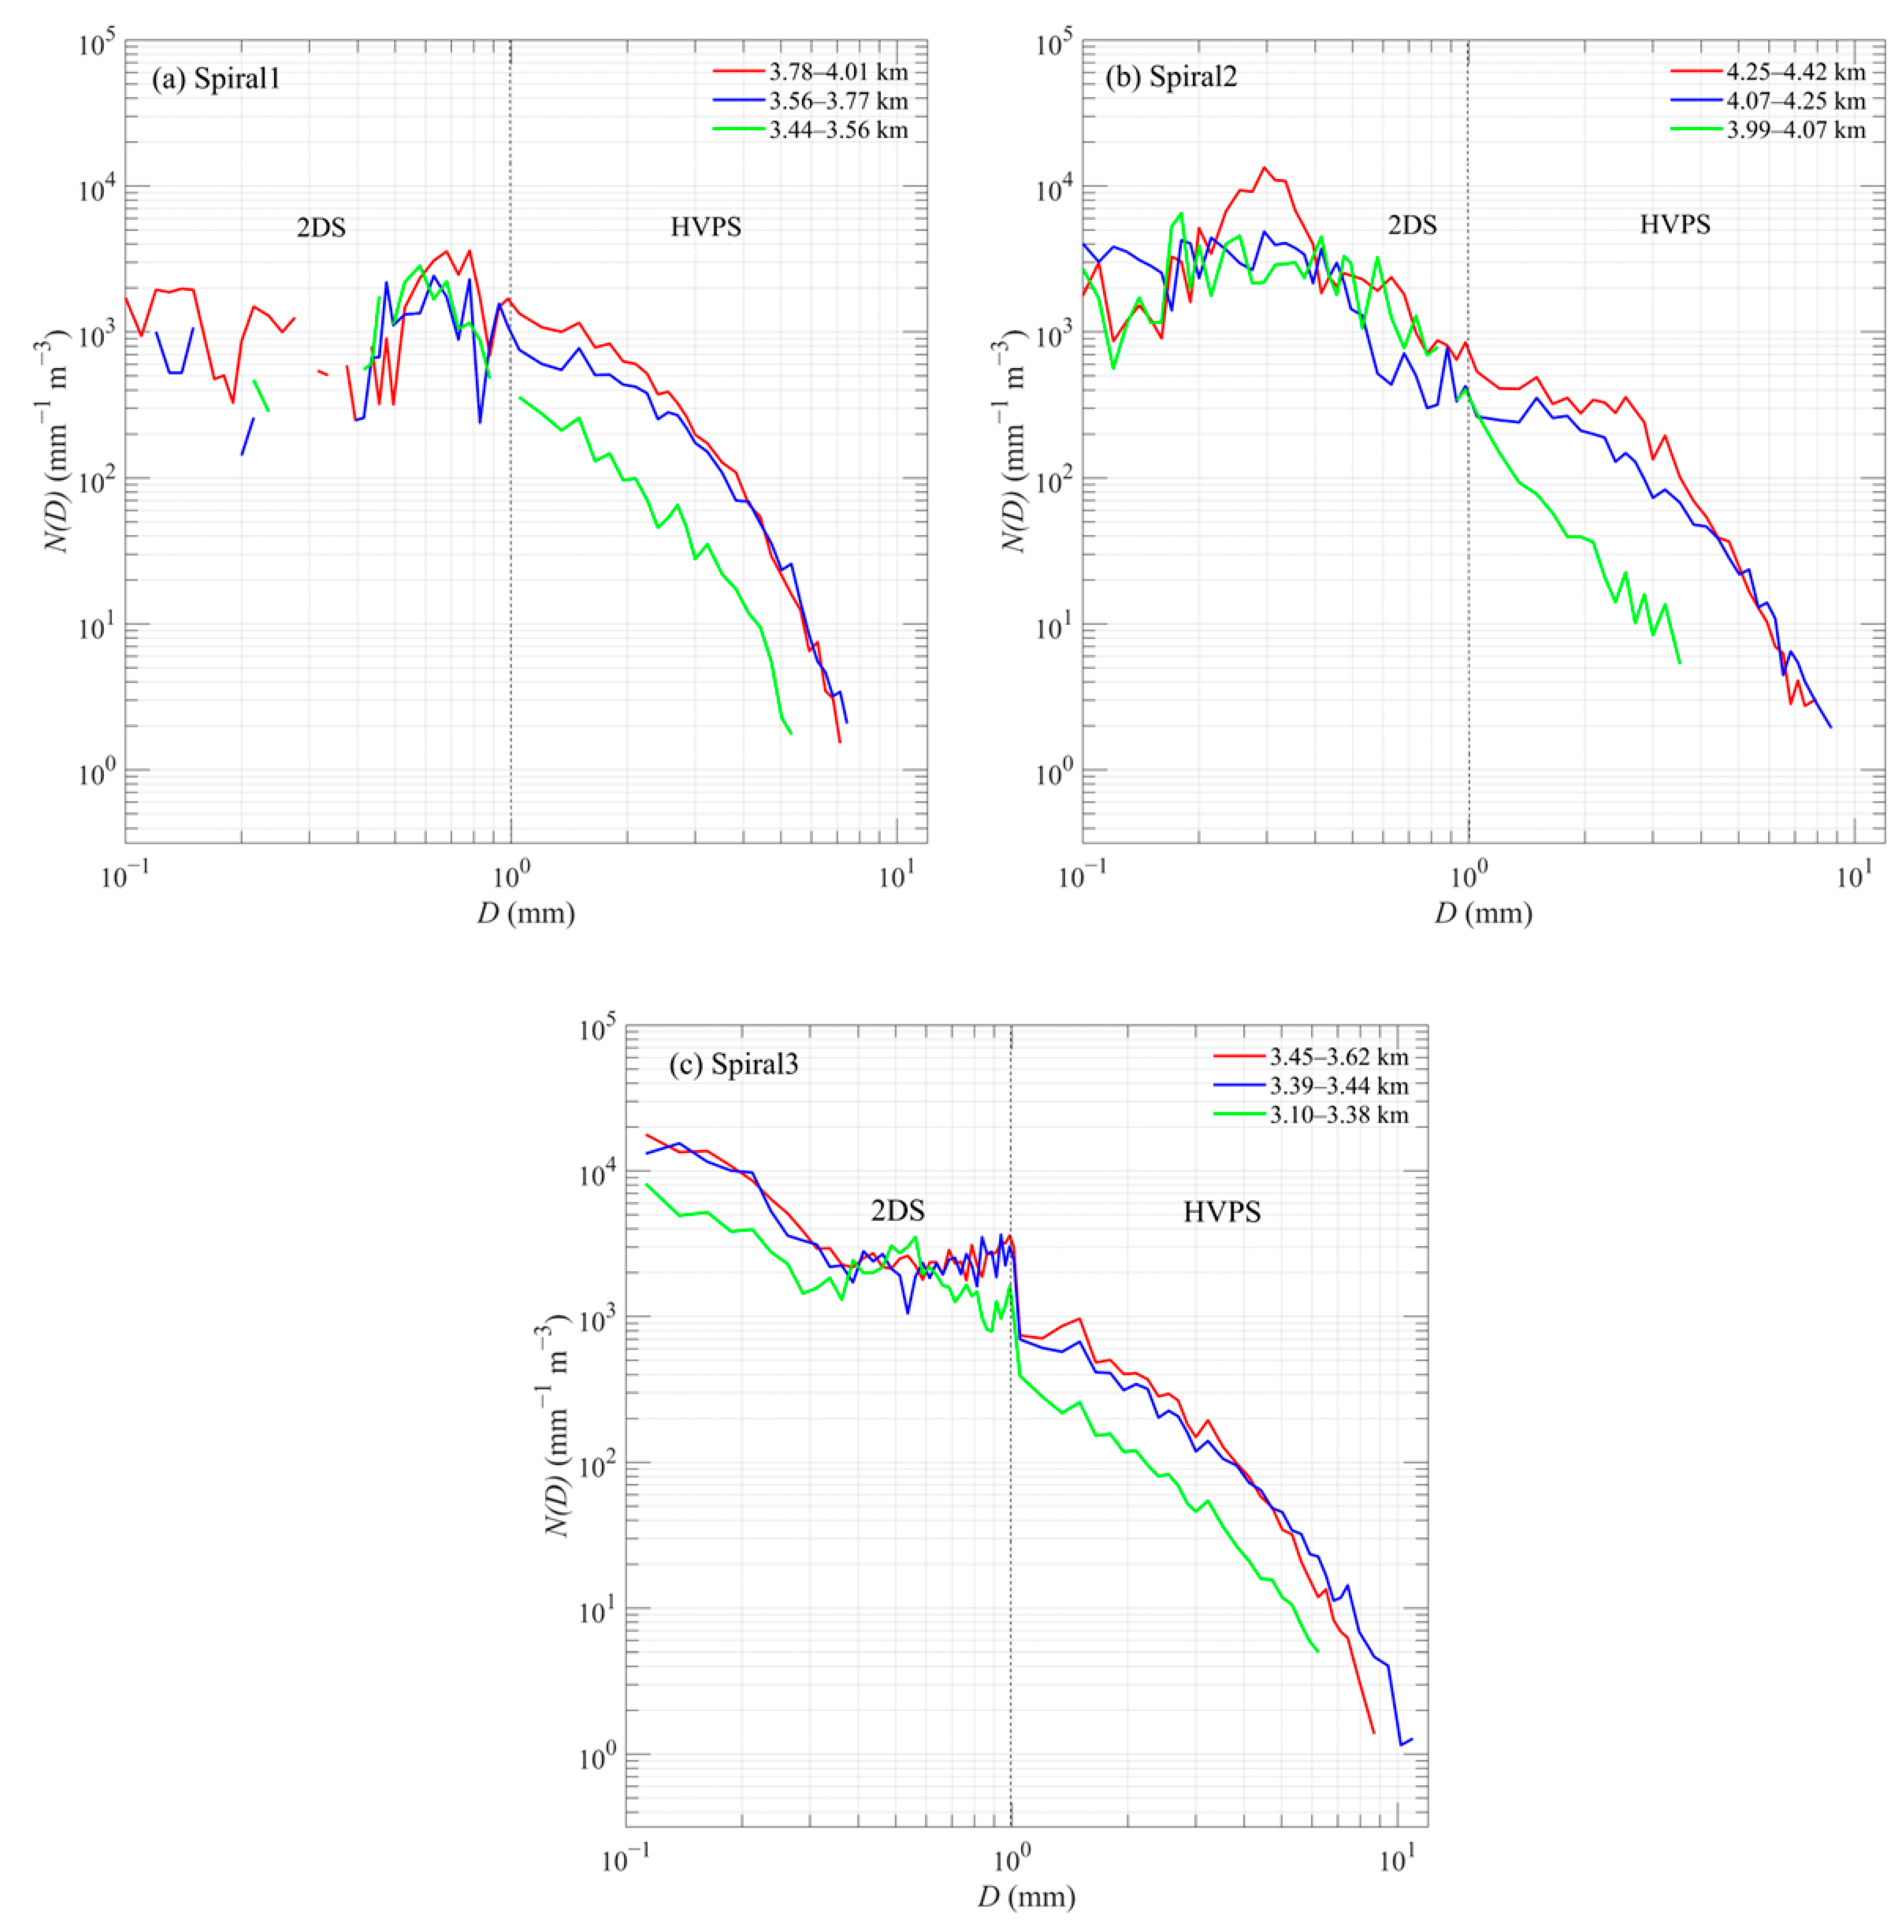
To further explore the evolution of microphysical properties within the MLs,
Figure 8 displays the mean PSDs across different sections of the MLs. As previously detailed, the maximum diameters of particles increased from the upper to the median MLs and subsequently decreased from the median to the lower MLs across all three spiral observations. This pattern results from the interplay of microphysical processes such as melting, aggregation, and particle structure collapse, which occur at varying rates across different stages.
A detailed comparison of the PSDs in the upper and median MLs reveals a decrease in particle number concentration, N(D), for diameters between 1 and 4 mm in all three spirals, primarily indicating a significant melting effect on median-sized particles. It should be noted that the N(D) for a specific diameter in the median layer originates from particles that initially had larger diameters. Among the spirals, the decrease in N(D) for diameters between 1 and 4 mm was smallest in Spiral3 and largest in Spiral2, largely due to the highest aggregate density in Spiral3 and the lowest in Spiral2. Furthermore, needle crystals primarily existed above the ML of Spiral2, which may play a crucial role in forming aggregates and reducing their densities. As noted earlier, particles entering the MLs in Spiral1 also exhibited lower densities compared to those in Spiral3.
For particles with diameters greater than 4 mm, the changes in
N(
D) from the upper to the median MLs in Spiral1 (
Figure 8a) and Spiral2 (
Figure 8b) were minimal, suggesting a balance between the impacts of melting and aggregation processes. However, a significant increase in
N(
D) was observed in Spiral3 (
Figure 8c), indicating more active aggregations among melting particles. Conversely, for particles with diameters less than 4 mm, changes in
N(
D) were not substantial across all three spirals, mainly because smaller crystals had higher densities than larger ones and exhibited less diameter change during melting.
Comparing the PSDs between the median and lower MLs, the predominant particle structure in the final stage of melting led to dramatic decreases in particle diameters. Consequently,
N(
D) decreases with diameter, resulting in significant reductions in
N(
D) across all three spirals. It is noteworthy that
N(
D) for diameters between 0.5 and 1 mm increased from the median to the lower ML, aligning with the active breakup processes during this stage, as previously illustrated in
Figure 7.
4. Conclusions and Discussion
The synthesis of our findings from this comprehensive investigation into the microphysical characteristics of the ML for three stratiform cloud cases in North China offers crucial insights into the complex interplay of melting, aggregation, and fragmentation/break processes within stratiform clouds.
The reflectivity factor, coupled with the volume-weighted diameter (Dm), escalates within the upper and middle sections of the ML across all three cases, suggesting that aggregation, primarily in the top 40% of the ML, significantly enhances the bright band phenomenon. The thickness of the MLs was largely determined by melting rates, which were closely related to the particle habits, densities, and sizes. The aggregates formed by plate-like ice crystals with larger size and density in Spiral1 and Spiral3 had slower melting rates, while the aggregates formed with the combination of needle–like and columnar crystals, with lower densities, usually melted rapidly. Hence, the thickness of ML in Spiral1, which was enriched in plate-like aggregates, was thicker than in Spiral2, which was dominated by aggregates combined by needle and columnar ice crystals.
The largest aggregates with the peak values of
Dm in three MLs were observed near
Znorm = 0.6, where the temperature was about 0 °C. The result is consistent with the conclusion that aggregation depends on temperature, with the maximum size of aggregates occurring near 0 °C [
26]. The maximum dimensions of PSDs in the median MLs reached 7.5~9.5 mm, which was significantly larger than the upper part. The aggregation process dominated in the upper and middle parts of the ML, which was consistent with the conclusion of [
2] that aggregation was more prevalent than breakup in the upper part of the ML. As the particle size increased, the aggregation efficiency of ice particles improved, and the growth process of particles larger than 4 mm was more significant.
The differences of PSDs in the median-sized and large ends were noticeable, while negligible in the small end. The N(D) decreased with height when D was between 1 and 4 mm, because the median-sized particle with relatively small densities melted rapidly, especially for the aggregates mainly composed of the needle crystals in Spiral2. The phenomena might be closely related to the particle properties, e.g., the loose structure of ice particles, and high surface area-to-mass ratio, which indicated that these particles would melt rapidly due to the lower latent heat required for melting. The changes in N(D) (D > 4 mm) from the upper to the median MLs were mainly related to the predominance or balance status of aggregation and melting processes. From the median to lower MLs, both the particle size D and N(D) decreased with height due to the process of melting. It was also found that the active degree of the breakup processes varied in different cases. Spiral2 exhibited the most active breakup processes in the last stage of melting, according to the rapid downward increase in Nt.
We would also like to point out that the quantitative description of the microphysical characteristics within the ML remained insufficient; even until now, there is still a significant debate in some aspects [
13,
27,
28], e.g., the question of the importance of aggregation and breakup, the occurrence frequency and impact of breakup within the ML, whether the aggregation would not enhance or even weaken within the ML due to melting. The complexity and variability observed in the ML calls for ongoing research efforts. Future studies should aim to refine methodologies for detecting ML boundaries by combining particle habits (such as shape and density, represented by axial ratio and area ratio, respectively) with microphysical quantities. This approach will help to accurately describe the transition from half-melted ice particles to liquid water droplets in the lower part, aiding in the identification of the bottom boundary of the ML. The development of more sophisticated airborne probes or the application of novel remote sensing technologies is also important. Given the different measuring size ranges of particles for each instrument, there may be some inconsistencies between the measured quantities from different instruments within the overlapping measuring ranges. The development of modern instruments or methods for the collaborative in situ observations of particles will advance our understanding of cloud microphysics.
Moreover, with the development of the automatic habit recognition algorithms of ice crystal habits’ classification, more long-time periods and more reliable datasets of cloud particles will help us gain a better knowledge of the complicated microphysical processes of the ML model, i.e., the melting rate of different types of particles within the ML. Additionally, longitudinal studies could provide valuable data on the seasonal and interannual variability of microphysical processes within the ML, offering deeper insights into their climatological impacts. This could provide more insights into the microphysical process and observational evidence for improving the relevant microphysical processes in the ML model and microphysical parameterization in the future.
While this study has advanced our understanding of the microphysical processes within the MLs, it also underscores the complexity of these systems and the need for continued, focused research. By building on the detailed empirical data collected, the scientific community can move towards more accurate and reliable models capable of predicting not just the weather, but also providing insights into broader climatic changes. This research not only informs the scientific community, but also serves as a critical resource for policymakers and planners in developing more effective strategies for disaster mitigation and climate adaptation.
