Abstract
Vineyards and olive groves are two of the most important Mediterranean crops, not only for their economic value but also for their cultural and environmental significance, playing a crucial role in global agriculture. This systematic review, based on an adaptation of the 2020 PRISMA statement, focuses on the use of satellite remote sensing tools for the detection of drought in vineyards and olive groves. This methodology follows several key steps, such as defining the approach, selecting keywords and databases, and applying exclusion criteria. The bibliometric analysis revealed that the most frequently used terms included “Google Earth Engine” “remote sensing” “leaf area index” “Sentinel-2”, and “evapotranspiration”. The research included a total of 81 articles published. The temporal distribution shows an increase in scientific production starting in 2018, with a peak in 2021. Geographically, the United States, Italy, Spain, France, Tunisia, Chile, and Portugal lead research in this field. The studies were classified into four categories: aridity and drought monitoring (ADM), agricultural water management (AWM), land use management (LUM), and water stress (WST). Research trends were analysed in each category, highlighting the use of satellite platforms and sensors. Several case studies illustrate applications in vineyards and olive groves, especially in semi-arid regions, focusing on the estimation of evapotranspiration, crop coefficients, and water use efficiency. This article provides a comprehensive overview of the current state of research on the use of satellite remote sensing for drought assessment in grapevines and olive trees, identifying trends, methodological approaches, and opportunities for future research in this field.
1. Introduction
Vineyards (Vitis vinifera L.) and olive groves (Olea europaea L.) are quintessential crops of the Mediterranean region, characterised by their adaptation to the Mediterranean-type climate (i.e., hot dry summers and moderate wet winters, with marked seasonal variability and irregularity and frequent drought episodes), as well as to its soils [1]. Both crops have significant socio-economic, environmental, and cultural importance, serving as vital sources of employment, income, and high-quality products, while also playing a role in the landscape and identity of numerous regions [2]. However, in recent decades, they have faced increasing challenges from the impacts of climate change, threatening their productivity and quality [3,4,5,6].
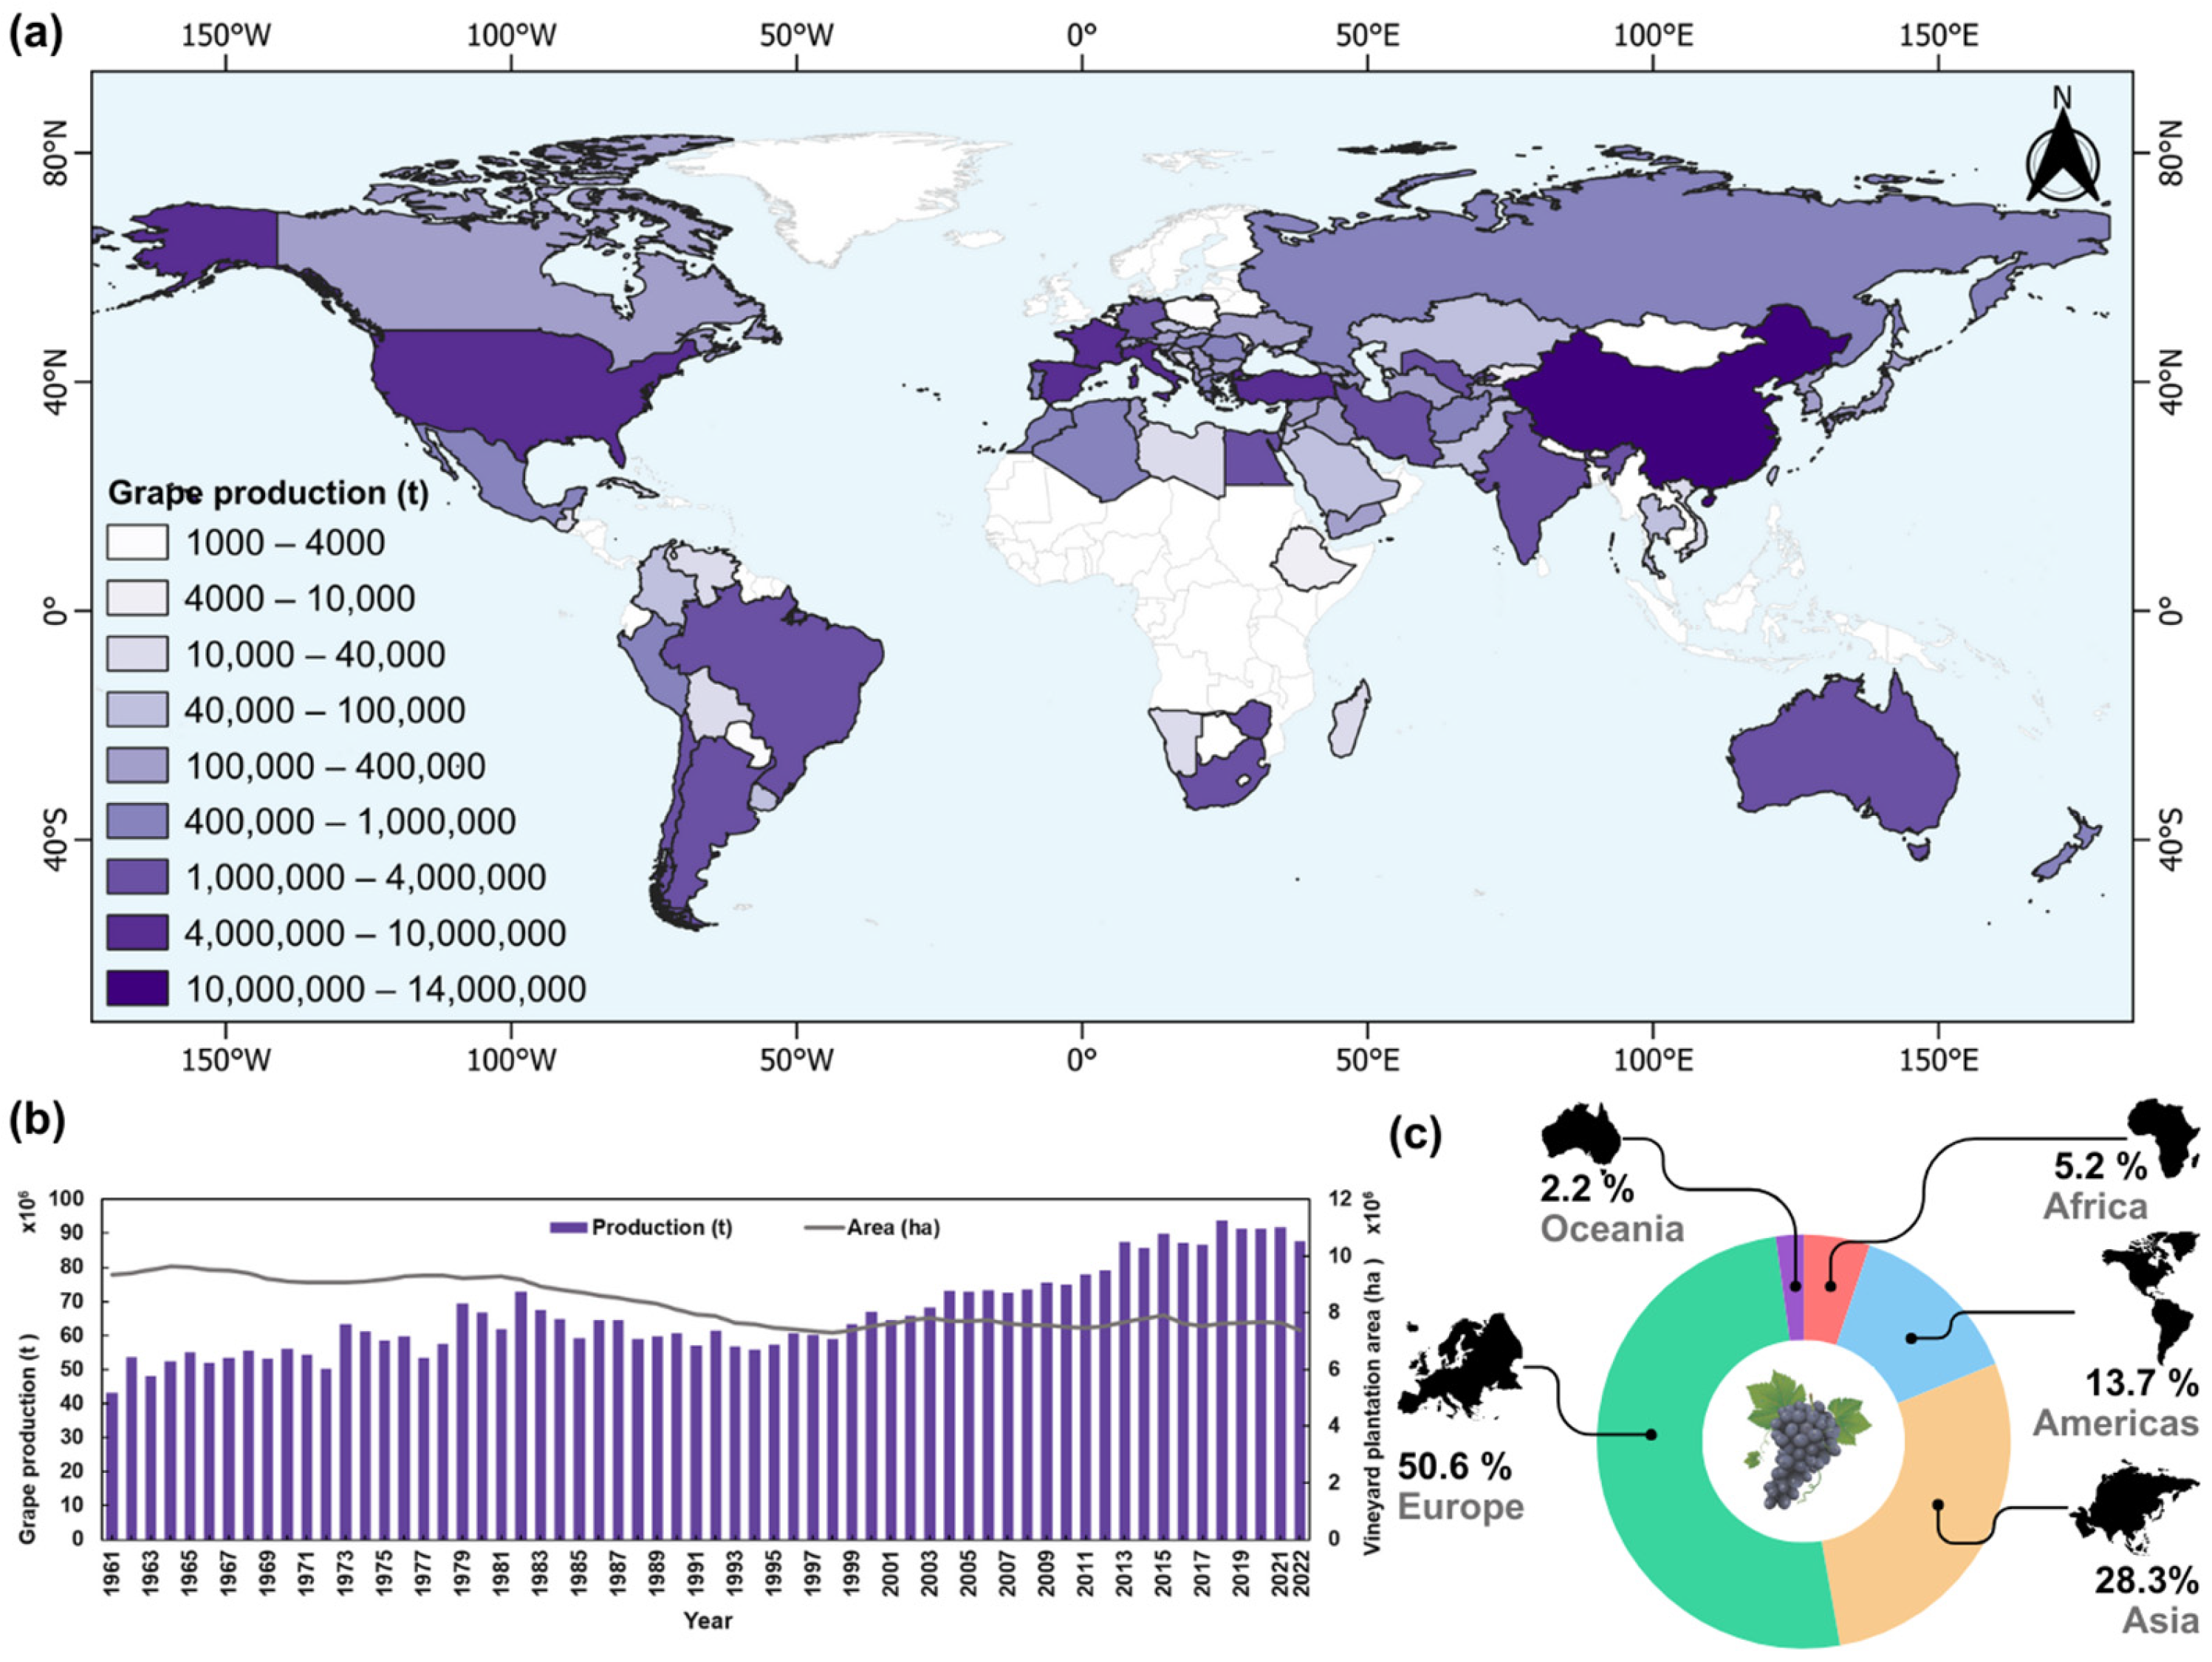
Vitis vinifera L., commonly known as the European grapevine or common grape, is a crop of great global interest both in terms of production and distribution. According to FAOSTAT data [7], in 2022, worldwide grape production was ~88 × 106 t, with a decrease of 4.6% compared with that in the previous year. Figure 1a shows the main grape-producing countries in the world in 2018–2022. The total harvested area reached 7 × 10⁶ ha, with a mean yield of 12.6 t/ha. Europe (50.6%) is the continent with the largest grape growing area, followed by Asia (28.3%), the Americas (13.7%), Africa (5.2%), and Oceania (2.2%) (Figure 1c). Grape production increased with a subtle linear trend of 7.2 × 10⁵ t/yr, whereas the vineyard cultivation area has undergone a decrease of 3.1 × 10⁴ ha/yr (Figure 1b). Average production data for the last five years (2018–2022) show that China is the leading fresh grape grower, followed by Italy, Spain, the United States of America (USA), and France (Figure 1a). Regarding wine grapes, Italy, France, Spain, USA, and Australia are the top wine producers worldwide.
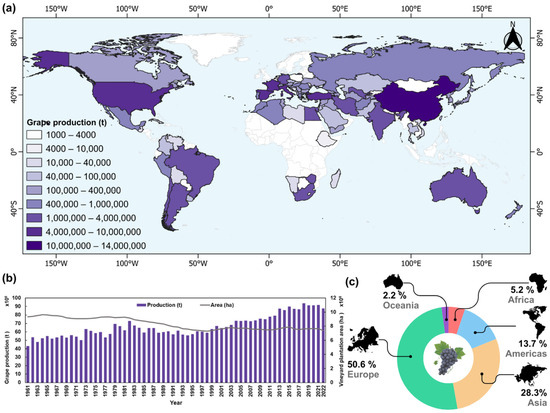
Figure 1.
Average grape production (t) by country between 2018 and 2022 (a); worldwide grape production evolution between 1961 and 2022 (b); and percentage of vineyard plantation area by continent in 2022 (c). Adapted from FAOSTAT.
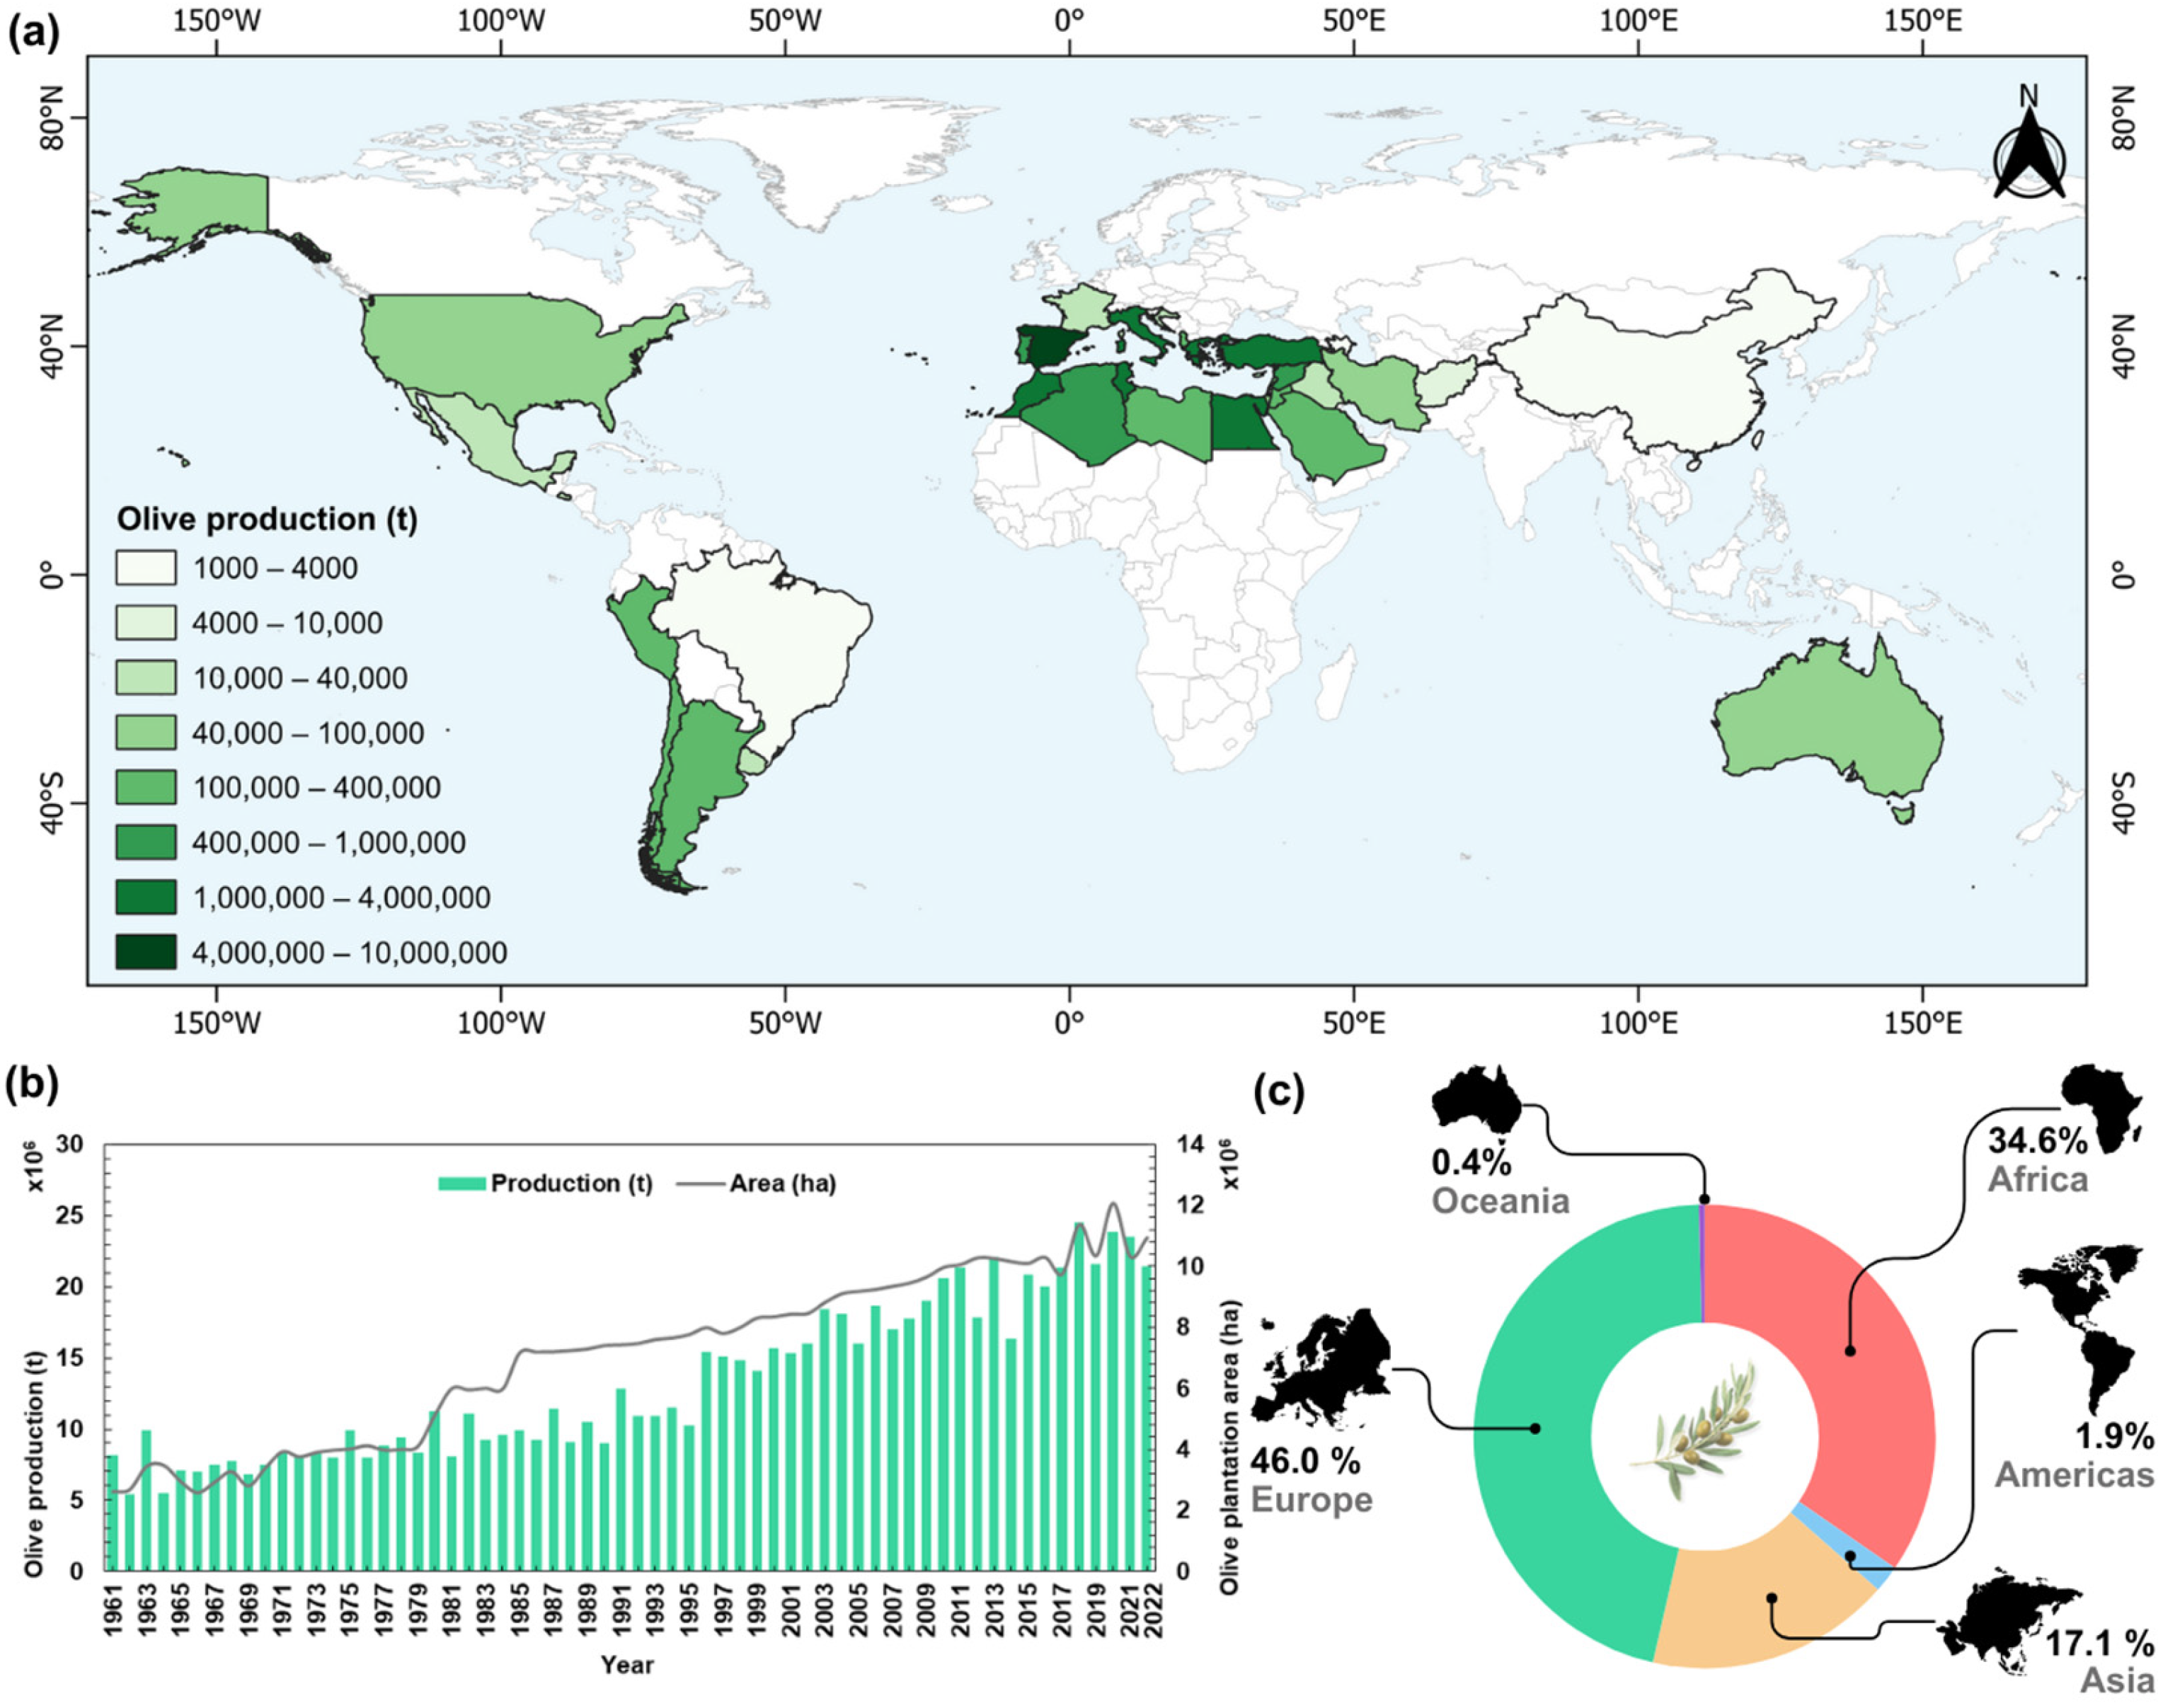
Olea europaea L., commonly known as the olive tree, also holds substantial global significance in terms of both its production and distribution. FAOSTAT 2022 data [7] on olive production, between 2018 and 2022 (Figure 2a), show that Spain is the largest producer, followed by Greece, Italy, the Republic of Türkiye, and Morocco. In 2022, global fresh olive production was approximately 21.4 × 10⁶ t, with a decrease of 8.7% compared with that in the previous year. The 2022 harvest area was 10.9 × 10⁶ ha, with a mean yield of 1.9 t/ha. Also here, Europe (46.0%) has the largest olive growing area, followed by Africa (34.6%), Asia (17.1%), Americas (1.9%), and Oceania (0.4%) (Figure 2c), mainly in areas of Mediterranean-type climates. Olive production increased from 1961 to 2022, with a linear trend of 2.1 × 10⁵ t/yr. In parallel, its cultivation area has experienced an average annual increase of 1.3 × 10⁵ ha/yr (Figure 2b).
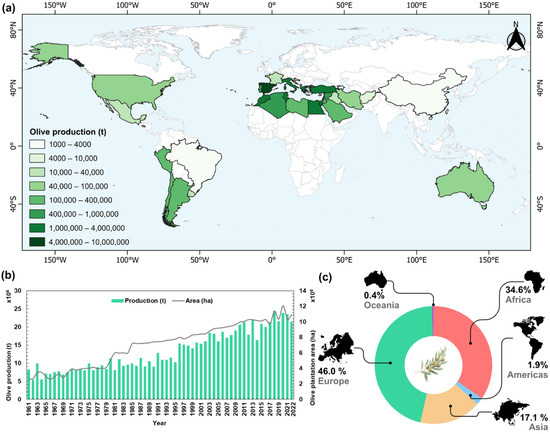
Figure 2.
Average olive production (t) by country between 2018 and 2022 (a); worldwide olive production evolution between 1961 and 2022 (b); and percentage of olive plantation area by continent in 2022 (c). Adapted from FAOSTAT.
Both crops reached their peak production levels in 2018, exceeding 94.0 × 10⁶ t for grapes and 24.5 × 10⁶ t for olives. The difference in these values partially reflects the fact that the distribution of vineyards is much more widespread than that of olive trees, as the latter are more geographically confined to Mediterranean climates, mostly due to their low cold tolerance [8]. As for 2022, vineyards demonstrate much higher productivity, yielding 12.6 t/ha, compared with 1.9 t/ha for olive groves.
Climate change is defined by long-term alterations in the Earth’s climate that are influenced and influence both natural and anthropogenic systems [9]. It is one of the greatest environmental, social, and economic threats in the 21st century [10]. Climate change has various consequences, such as increasing global temperatures, shifting rainfall patterns that can lead to droughts or floods, more frequent and severe extreme weather events (e.g., hurricanes, cyclones, wildfires, and storms), shrinking glaciers and rising sea levels threatening the survival of marine and terrestrial ecosystems, biodiversity losses, forced migration, food insecurity, health hazards, heightened conflicts from resource competition, and a wide range of socioeconomic costs [11]. According to the Sixth Assessment Report from the Intergovernmental Panel on Climate Change (IPCC), the global warming threshold has surpassed 1.1 °C compared with the pre-industrial period. The current climate change projections highlight the urgent need for significant action to reduce greenhouse gas emissions and atmospheric concentrations, thus limiting global warming to avoid the most severe repercussions of climate change [9].
Agriculture is exposed to and particularly vulnerable to the adverse effects of climate change [12,13,14], namely intense climate irregularity that disrupts agricultural planning. Possible changes in phenological timings, such as flowering, harvest seasons [15], quality and yield losses [16], soil degradation and erosion [17], and the proliferation of pests and diseases, are among the biggest threats of climate change [18]. The decline in biological diversity further weakens the resilience of ecosystems [19]. Rising sea levels pose a serious risk to coastal agriculture, endangering vital food production zones [20]. Consequently, a chain of problems arises that can be interconnected and mutually reinforced, leading to compound events. Thus, timely implementation of suitable adaptation and mitigation strategies is critical to avoid an escalation of these problems into a more serious threat.
Drought is a natural phenomenon that arises when there is a prolonged period without precipitation, which can be aggravated by anomalously high temperatures and evapotranspiration, causing soil water deficits, and consequently reducing the amount of available water [21]. In regions characterised by a Mediterranean climate, agricultural productivity can be seriously threatened by drought occurrences, particularly during the wet season. Recent trends indicate an increasing frequency and severity of these drought events, with growing concerns among scientists and farmers [13,22].
Precision agriculture presents solutions to mitigate the impacts of drought in agriculture. It encompasses the use of various methods, such as efficient irrigation systems, crop rotation, and pest and disease control, along with specific technologies, such as global navigation satellite systems (GNSS), sensors, remote sensing, and geographic information systems (GIS) [23]. These strategies aim to optimise agricultural production by managing crop production factors, both spatially and temporally [24]. The primary focus of precision agriculture can be positioned in four areas: the implementation of management strategies, decision-making support, mapping terrain variability, and data acquisition [23]. In this context, remote sensing plays a crucial role in the latter three tasks, enabling data acquisition to analyse spatial patterns to contribute to decision-making processes [24].
Remote sensing technologies serve as tools for observation and data collection on drought conditions within a specific region [25]. It employs different platforms, equipped with sensors designed to capture information from the Earth’s surface. These platforms encompass satellites, unmanned aerial vehicles (UAVs), manned aircraft, and radars [26]. The data obtained vary depending on the type of sensor used and can include optical, microwave, and thermal images, multi/hyperspectral data, and radar data [27]. The use of remote sensing data by farmers can lead to the optimisation of their resources, a reduction in their environmental impact, and an increase in their productivity and resilience [28]. In the context of drought events, remote sensing provides growers with near-real-time monitoring capabilities, enabling them to assess the risks and the impacts of these events on the crops.
The employment of satellite remote sensing data for monitoring environmental phenomena, such as droughts, represents a significant advancement in remote sensing technology. Satellite imagery, with extensive coverage and observational capabilities, enables an accurate assessment of the impact and evolution of droughts [29]. Data obtained from satellite platforms, including Sentinel, Landsat, and the Moderate Resolution Imaging Spectroradiometer (MODIS) [30], which are equipped with optical and thermal sensors [31], provide a vast resource for the computation of drought-related indices. Together with advanced models and indices, such as the Vegetation Condition Index (VCI) and the Normalized Difference Vegetation Index (NDVI), these datasets allow for the monitoring and analysis of drought dynamics [32]. This information is crucial for evaluating vegetation health, soil moisture levels, and other relevant parameters, thereby enabling an accurate characterisation of drought severity and its spatial extent [30].
The main objective of this article is to analyse the existing literature on satellite remote sensing tools for drought assessment, focusing especially on vineyards and olive trees. This systematic review intends to provide a perspective on the methodologies, indicators, and applications of satellite remote sensing in the monitoring and evaluation of droughts affecting these two crops. The ultimate goal is to identify knowledge gaps and potential research opportunities for forthcoming studies aiming to quantify drought conditions using satellite remote sensing data.
2. Materials and Methods
2.1. Research Methods
The methodology employed in this systematic review is based on an adaptation of the Preferred Reporting Items for Systematic Reviews and Meta-Analyses (PRISMA) statement from 2020 [33], which was further refined from its 2009 version [34]. As suggested in this type of methodology, an initial protocol was created to consolidate the guidelines and workflows that would be carried out throughout this study and to obtain consistent and rigorous results.
The protocol followed for this systematic review relied on several steps. The first step consisted of the determination of the primary focus of this review, which led to the definition of the title “Satellite Remote sensing tools for drought assessment in vineyard and olive orchards: a systematic review”.
The second step was the identification of principal keywords, grouped into three categories. The first category was related to platform type, remote sensing, satellite, and sensor, and included keywords such as “remote sensing”, “satel*”, “sentinel”, “landsat” and “modis”. The second category focused on crop types and included keywords like “viti*”, “vineyard”, “*grape*”, “olive*”, and “olea”. The third category focused on the climate–environment–agriculture nexus, with keywords such as “drought”, “dry*”, “arid*”, “water”, and “irrigation”.
The third step involved the selection of datasets. Online platforms that offer access to academic databases and search engines for scientific research were used. The chosen databases were the Web of Science (WoS) and Scopus platforms. These platforms allow the extraction of files in CSV format, which facilitates the performance of customised bibliometric analyses, the generation of graphs, and the execution of more detailed bibliographic studies. Other platforms such as Google Scholar were also consulted, but studies from these were categorised as other studies.
The fourth step, initial screening, involved applying exclusion criteria to articles based on their title and abstract. This step is crucial as it helps to narrow down the number of studies considered for in-depth review. By evaluating the relevance of the title and abstract, articles that did not meet the study’s predefined criteria could be excluded, ensuring a focused and relevant body of literature for further analysis.
The fifth and final step was the final screening. In this step, articles not excluded based on either title or abstract underwent a detailed reading for further evaluation. This approach ensures a thorough and systematic review of the literature on the use of satellite remote sensing for drought assessment in vineyards and olive orchards.
2.2. Bibliographic Source Assay
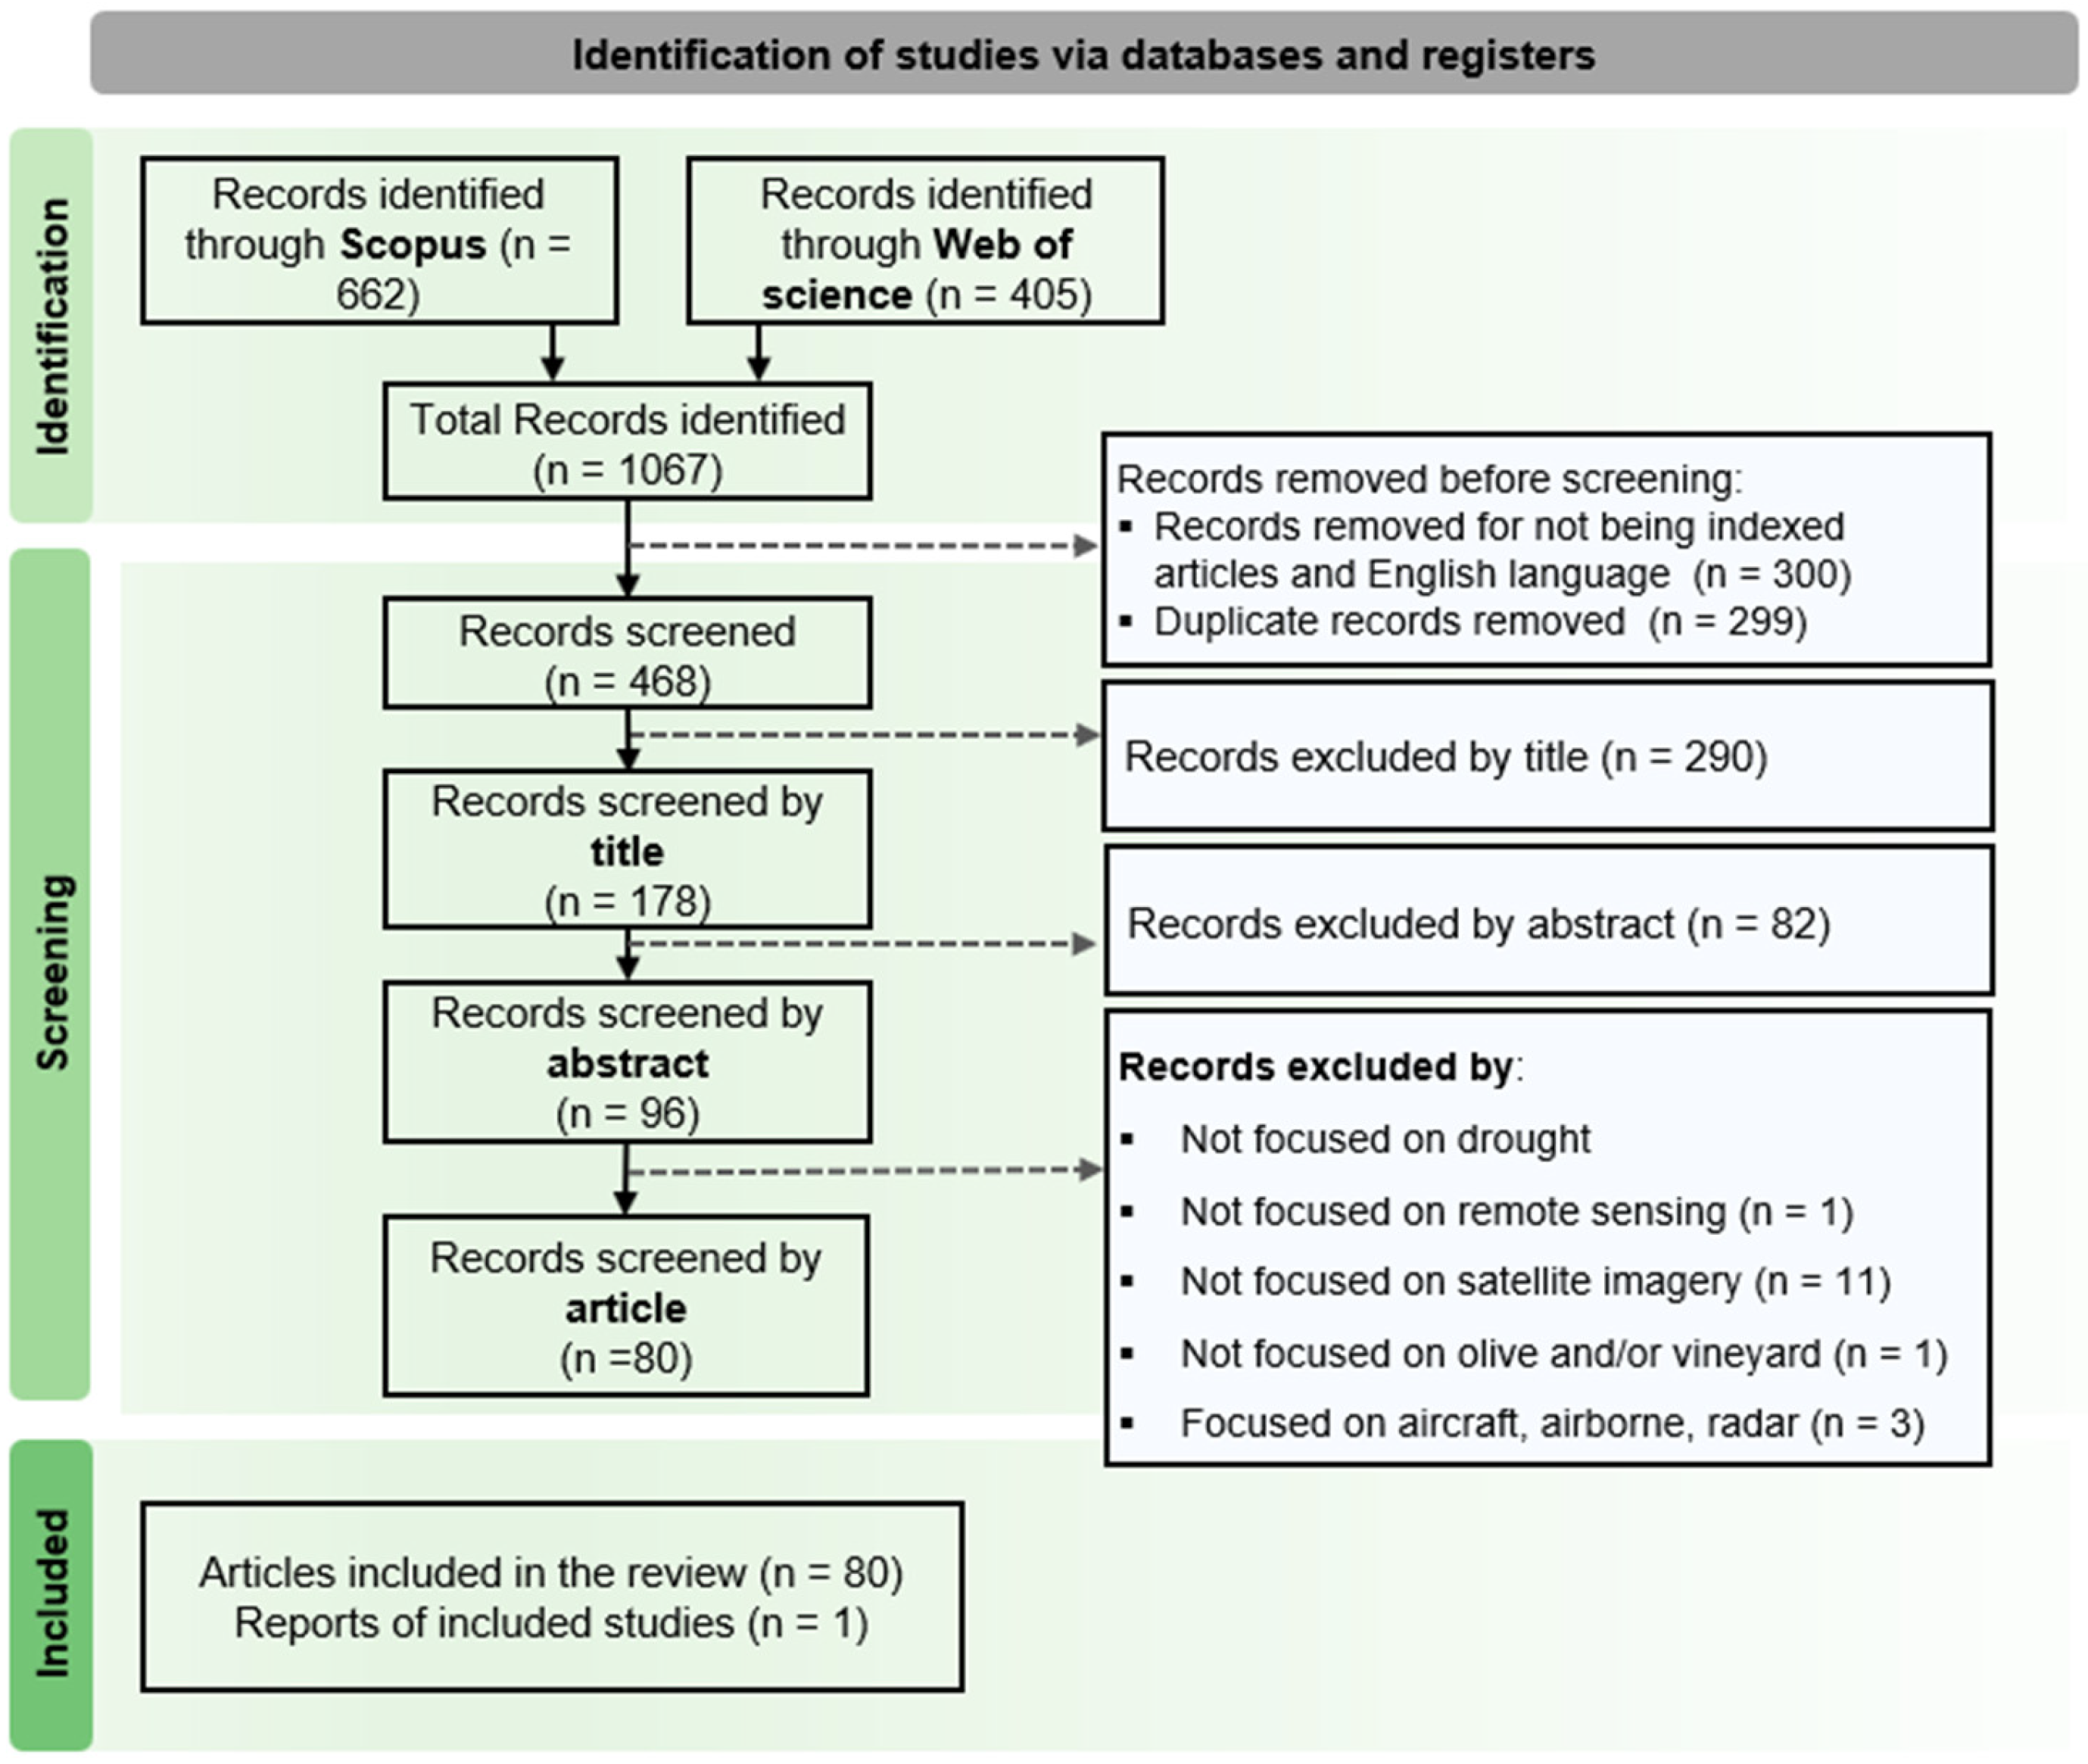
The literature search involves a rigorous process to identify and select records in accordance with the protocol described in Section 2.1. The search queries were last carried out on 30 December 2023, using the Scopus and WoS databases (Table 1 and Figure 3). The final dataset consisted of 1067 publications, with 662 obtained from Scopus and 405 from WoS. Before the initial screening, 300 records that were not classified as articles (such as reports or conference communications) or were not in English were excluded. Additionally, 299 duplicates were removed. A supplementary search conducted on Google Scholar resulted in an additional article. This approach resulted in 468 records for screening.

Table 1.
Databases and queries used to define the parameters of this systematic review.
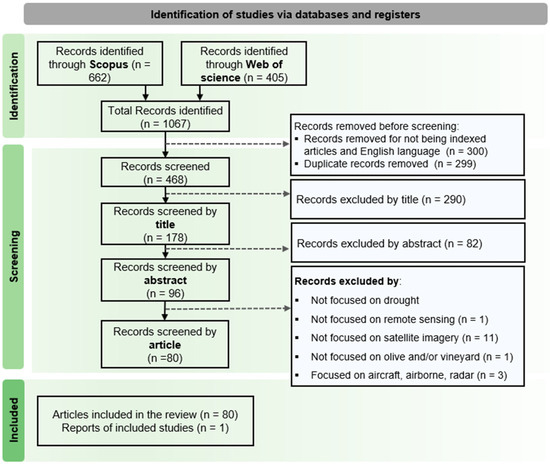
Figure 3.
PRISMA flow diagram of the systematic literature review search adapted from Moher et al. [34].
2.2.1. Group Article Classification
Based on the screening of the articles, these were classified into four groups with distinct focuses: aridity and drought monitoring (ADM), agricultural water management (AWM), land-use management (LUM), and water stress (WST).
Articles classified in ADM primarily focus on satellite remote sensing for monitoring and tracking drought conditions, either in specific regions or on a global scale. This group contains eight articles. AWM articles mainly focus on irrigation planning, development, distribution, and the conservation of water resources for vineyards and/or olive grove irrigation. This group contains 22 articles. The LUM group includes five articles with a focus on drought risks associated with land use, including issues such as soil degradation, loss of biodiversity, and soil and water pollution. The WS group is the largest with 46 articles. These articles primarily focus on the use of satellite remote sensing data, as well as plant or soil datasets, and other relevant data sources. They address the negative impacts of insufficient water availability or excessive water demand on the growth, development, and productivity of grapevines and olive trees.
2.2.2. Bibliometric Analysis
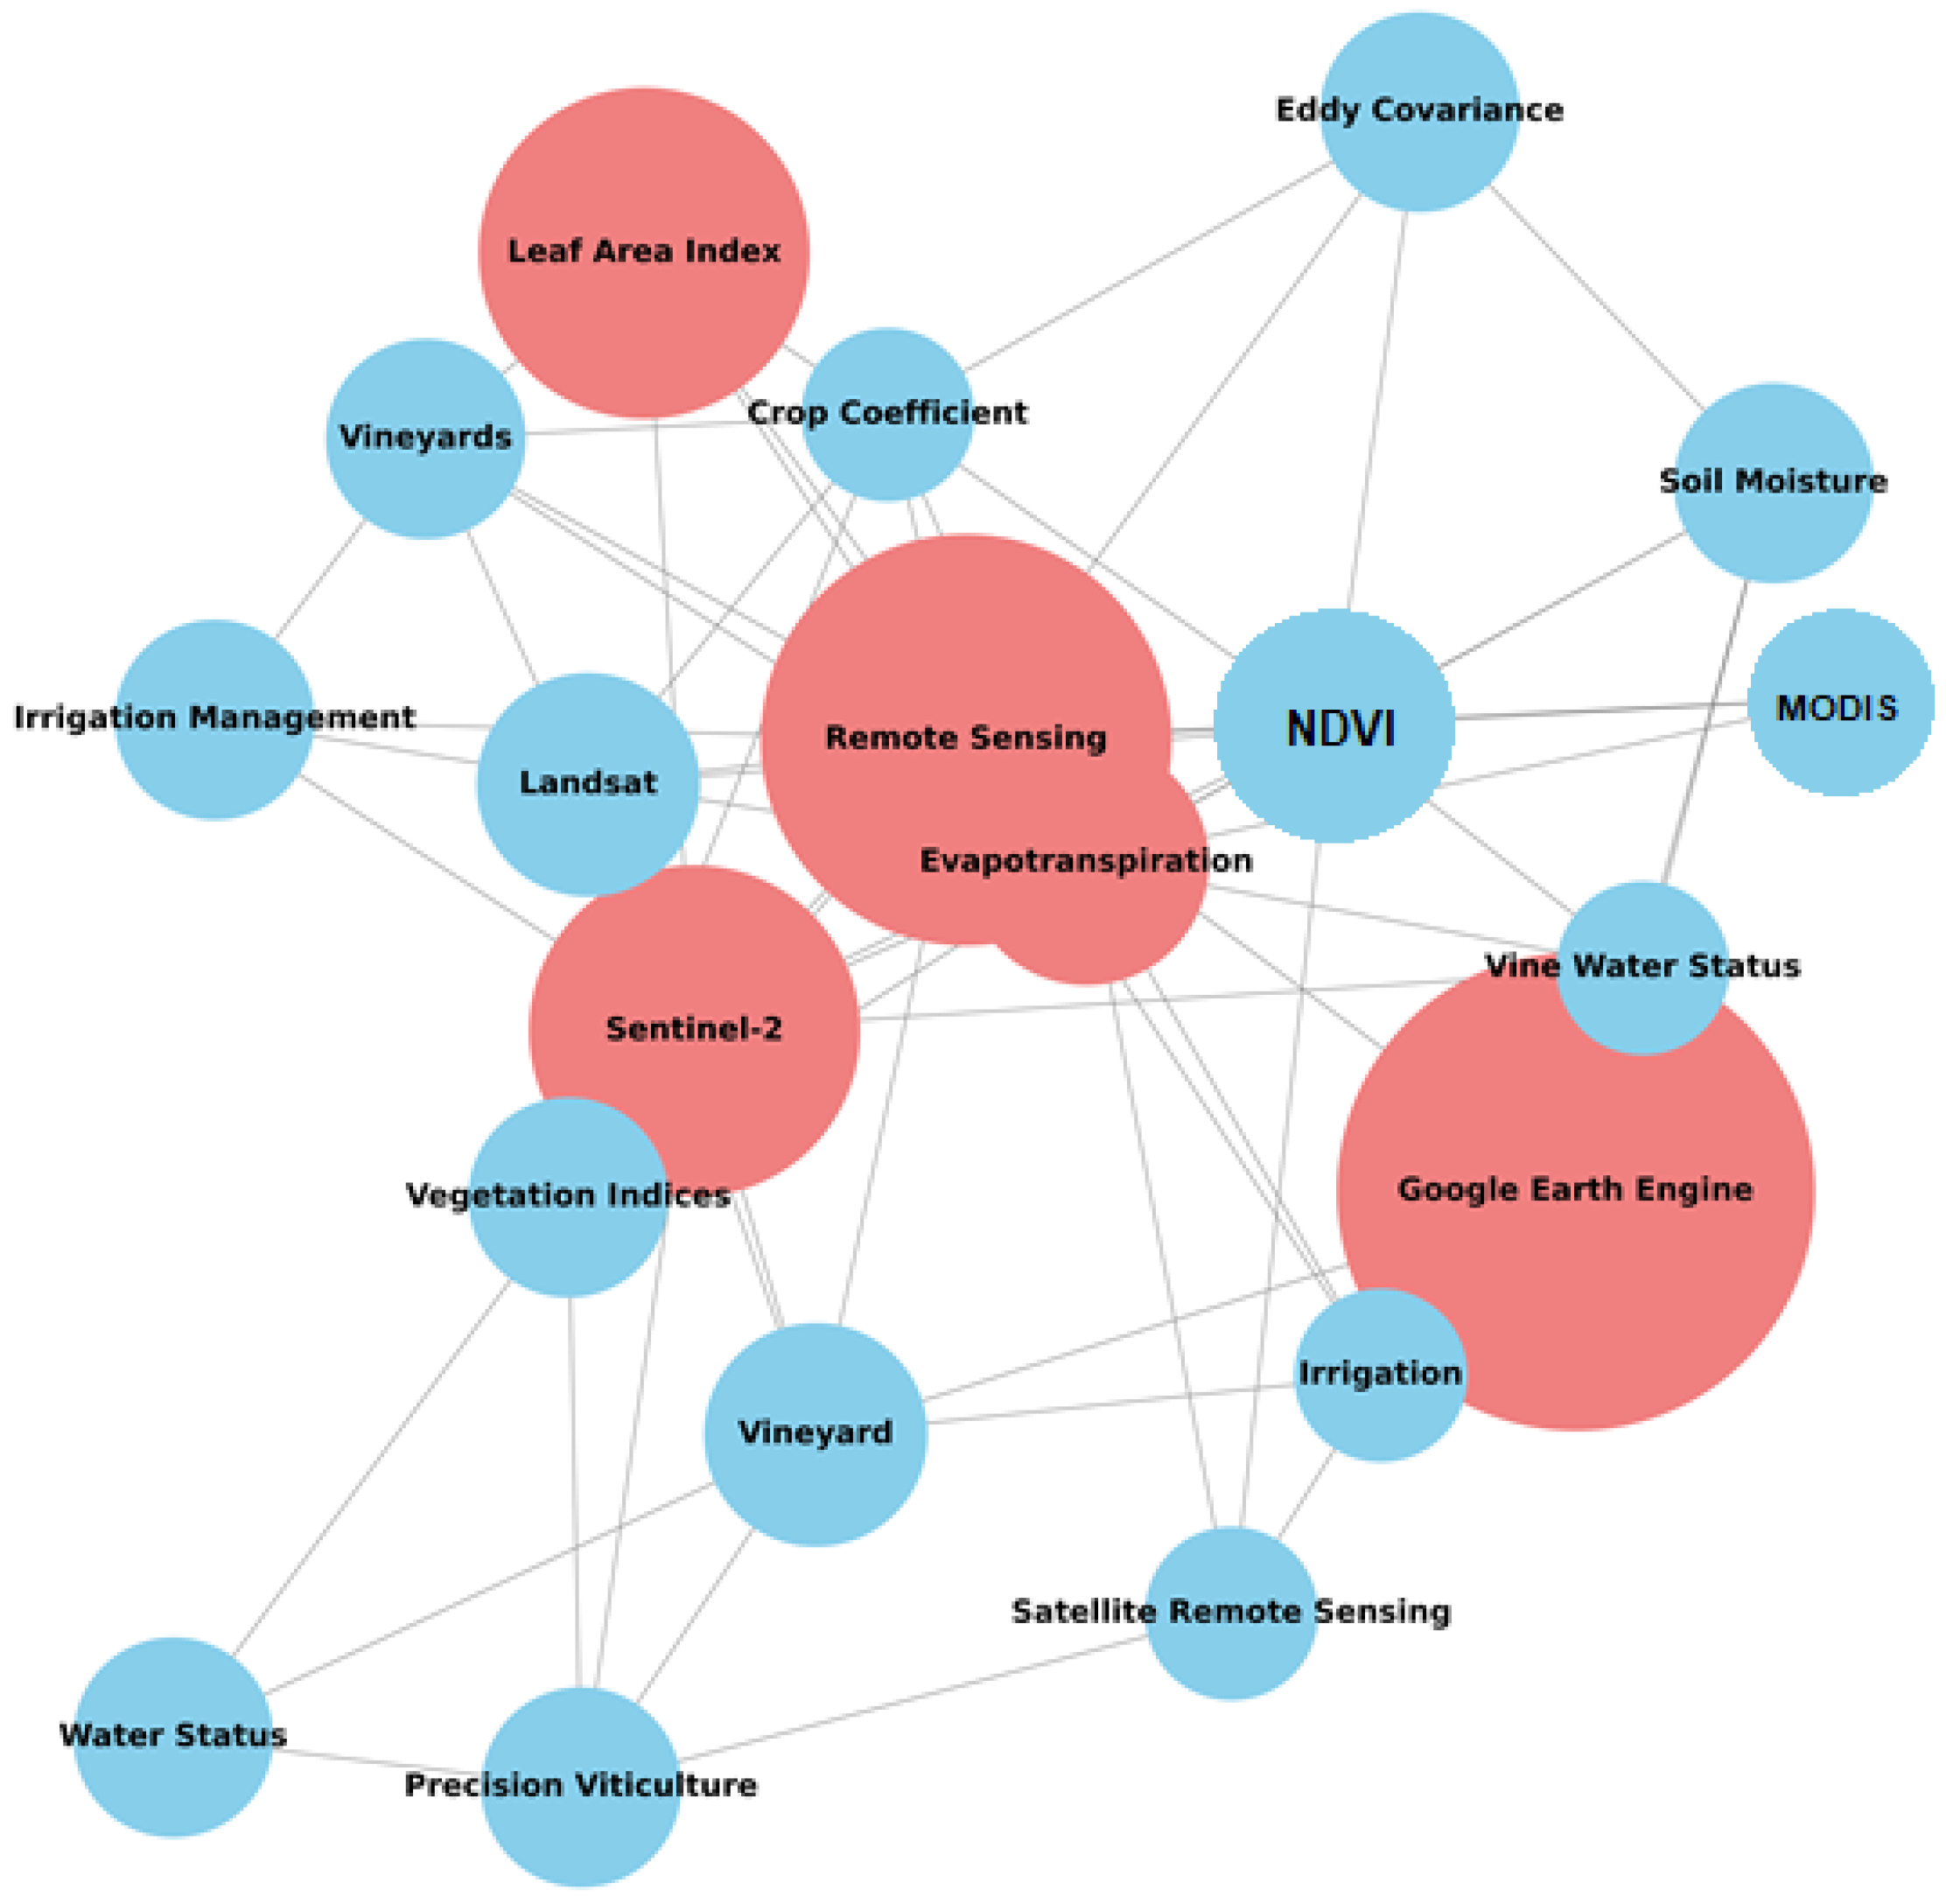
A bibliometric analysis (keyword connections) was performed using NetworkX Python Library (v3.2.1) to evaluate the most frequently used keywords in the selected studies. The analysis presented in Figure 4 reveals the 20 most used keywords, with the red circles representing the 5 most used keywords. These include “Google Earth Engine”, “Remote Sensing”, “Leaf Area Index”, “Sentinel-2”, and “grapevine”. The circle size indicates the frequency of a keyword, i.e., bigger circles indicate that the keyword is used more often. The proximity between circles, indicated by line length, represents that the keywords are more often combined or used together. It should be noted that this analysis is based only on keywords selected by the authors of the studies.
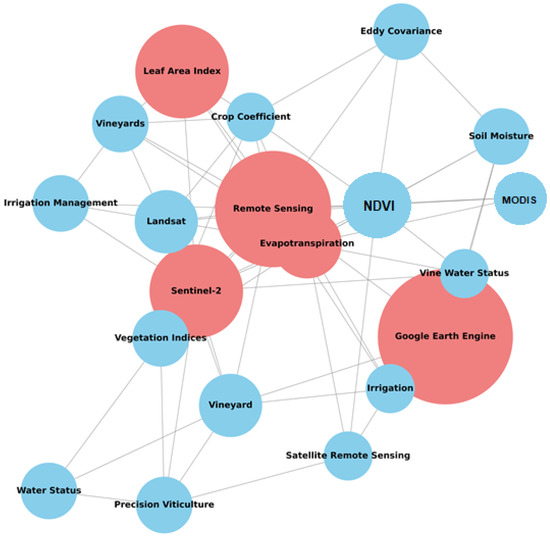
Figure 4.
Network connection graph between the top 20 most frequently used keywords in the selected studies. The size of each circle corresponds to the frequency of a keyword’s usage, with larger circles indicating higher usage. The top 5 most used keywords are distinguished in red. The proximity between circles, connected by lines, identifies the degree of connection between the corresponding keywords.
The most used keyword in these studies is “Google Earth Engine”, which highlights the widespread use of this platform for processing and analysing satellite data. This keyword is closely associated with “Vine Water Status”, “Irrigation”, “Remote sensing”, and “Soil moisture”. At the centre of this network connection graph is the critical role of “Remote sensing”, which is linked to “Sentinel-2”, “Evapotranspiration”, and “Landsat”. This connection underlines the importance of using data from Sentinel-2 to study vineyards, suggesting a concentrated approach to analysing satellite data on vineyard crops. Lastly, “Leaf Area Index” emerges as a significant term in this context, indicating the considerable focus on studying the structure and state of vegetation. This is a key aspect for understanding ecohydrological processes and the interaction between vegetation and climate. Overall, this examination of the network relationship between the most popular terms highlights the interdisciplinary nature and interdependence of various fields of study, indicating a solid foundation for future research.
3. Results
3.1. Analysis of Research Trends and Geographical Distribution
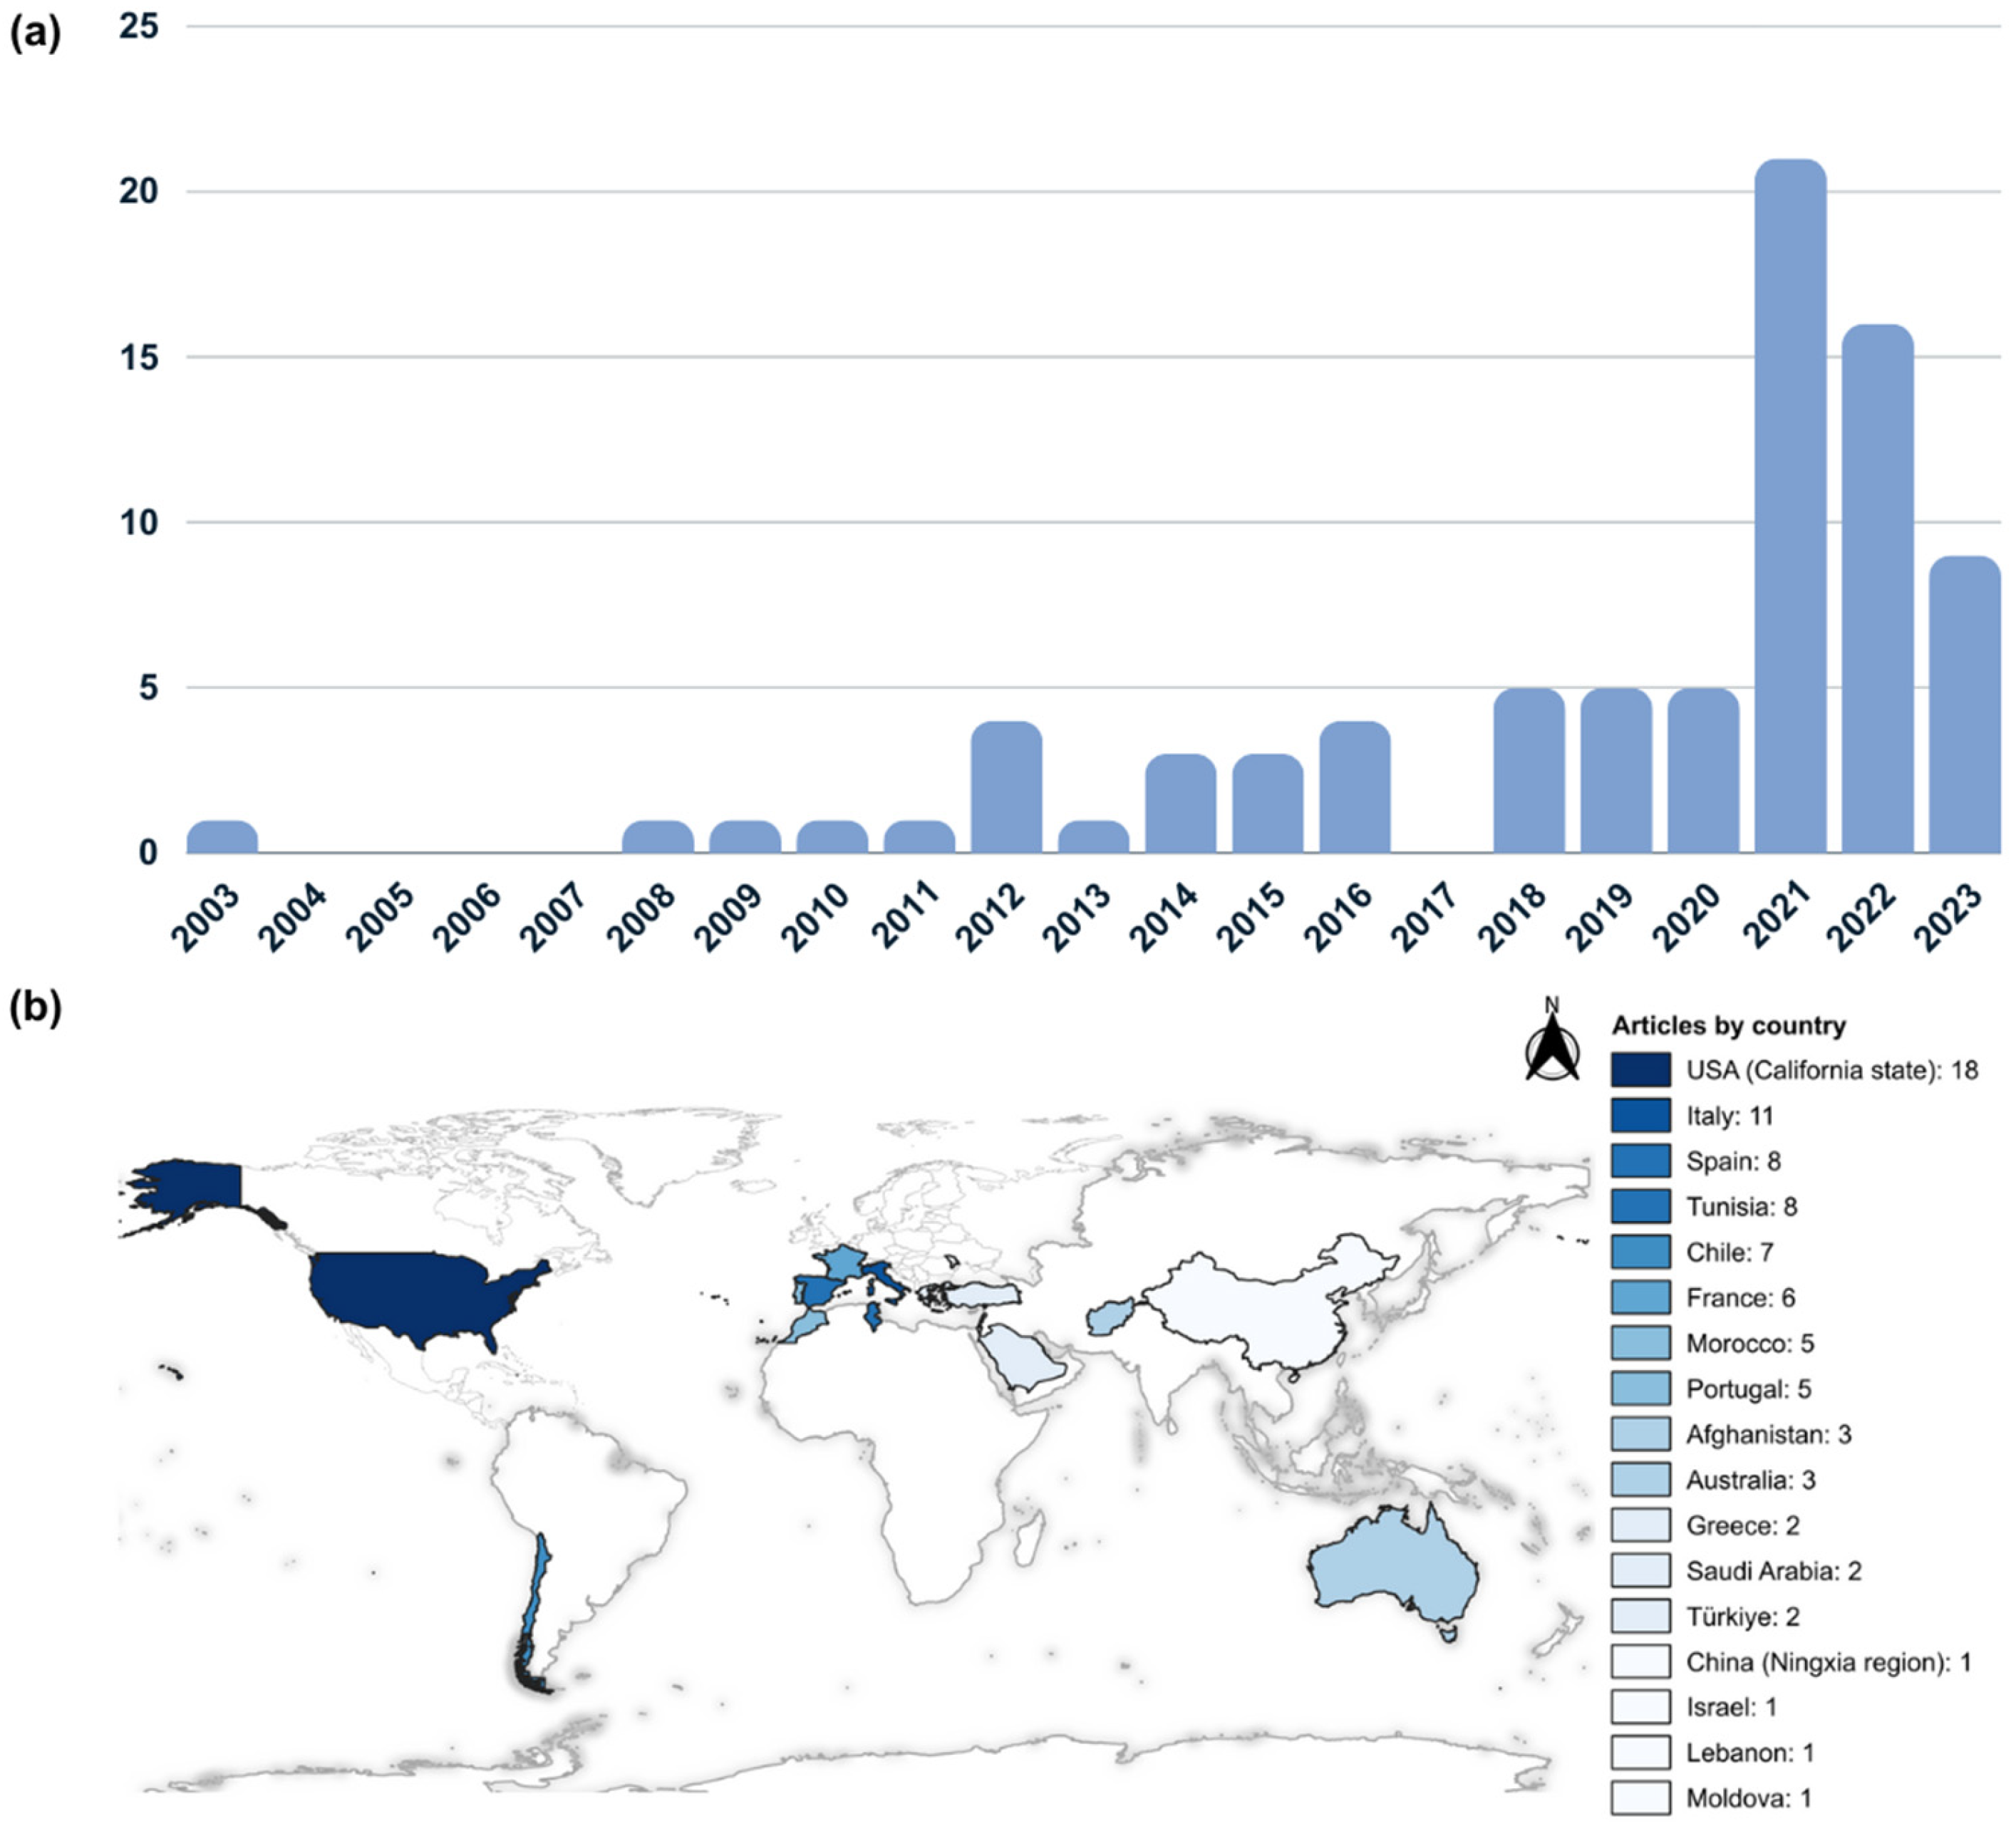
The articles analysed in this study cover a period from 2003 to 2023 (Figure 5a); for this period, a significant variation is observed in the number of articles published per year. Between 2004 and 2007, as well as in 2017, no articles were recorded for inclusion, suggesting a possible lack of relevance or availability of research during those specific years. From 2008 to 2011 and in 2013, a single study was included per year, indicating relative stability in the production of relevant research in those periods. However, this changed drastically in subsequent years, with an increase in the number of articles per year considered in this review, especially starting in 2018. The most notable year in terms of the scientific production of relevant articles was 2021, with a total of 21 publications considered relevant to the study. This amount of research studies may indicate a growing interest in the topic or a significant advance in the understanding of the area of study during this specific period.
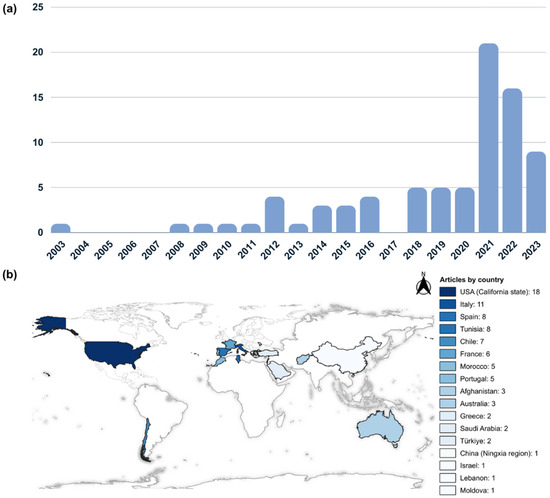
Figure 5.
Temporal distribution of articles included in the systematic review by publication year (a) and the spatial distribution by country (b).
The spatial distribution of articles by country, presented in Figure 5b, provides insights into the geographical diversity of knowledge production and research. At the top of the list is the United States of America, specifically the State of California, with a contribution of 18 articles. This highlights the country’s significance regarding this subject. Following closely are Italy with 11 articles, Spain with 8 articles, and France and Portugal with 6 and 5 articles, respectively. These numbers of articles from European countries underscore the contribution of Europe to academic article production. Tunisia and Chile also stood out with eight and seven articles, respectively. The remaining countries, although to a lesser extent, also contribute to the research and knowledge landscape internationally.
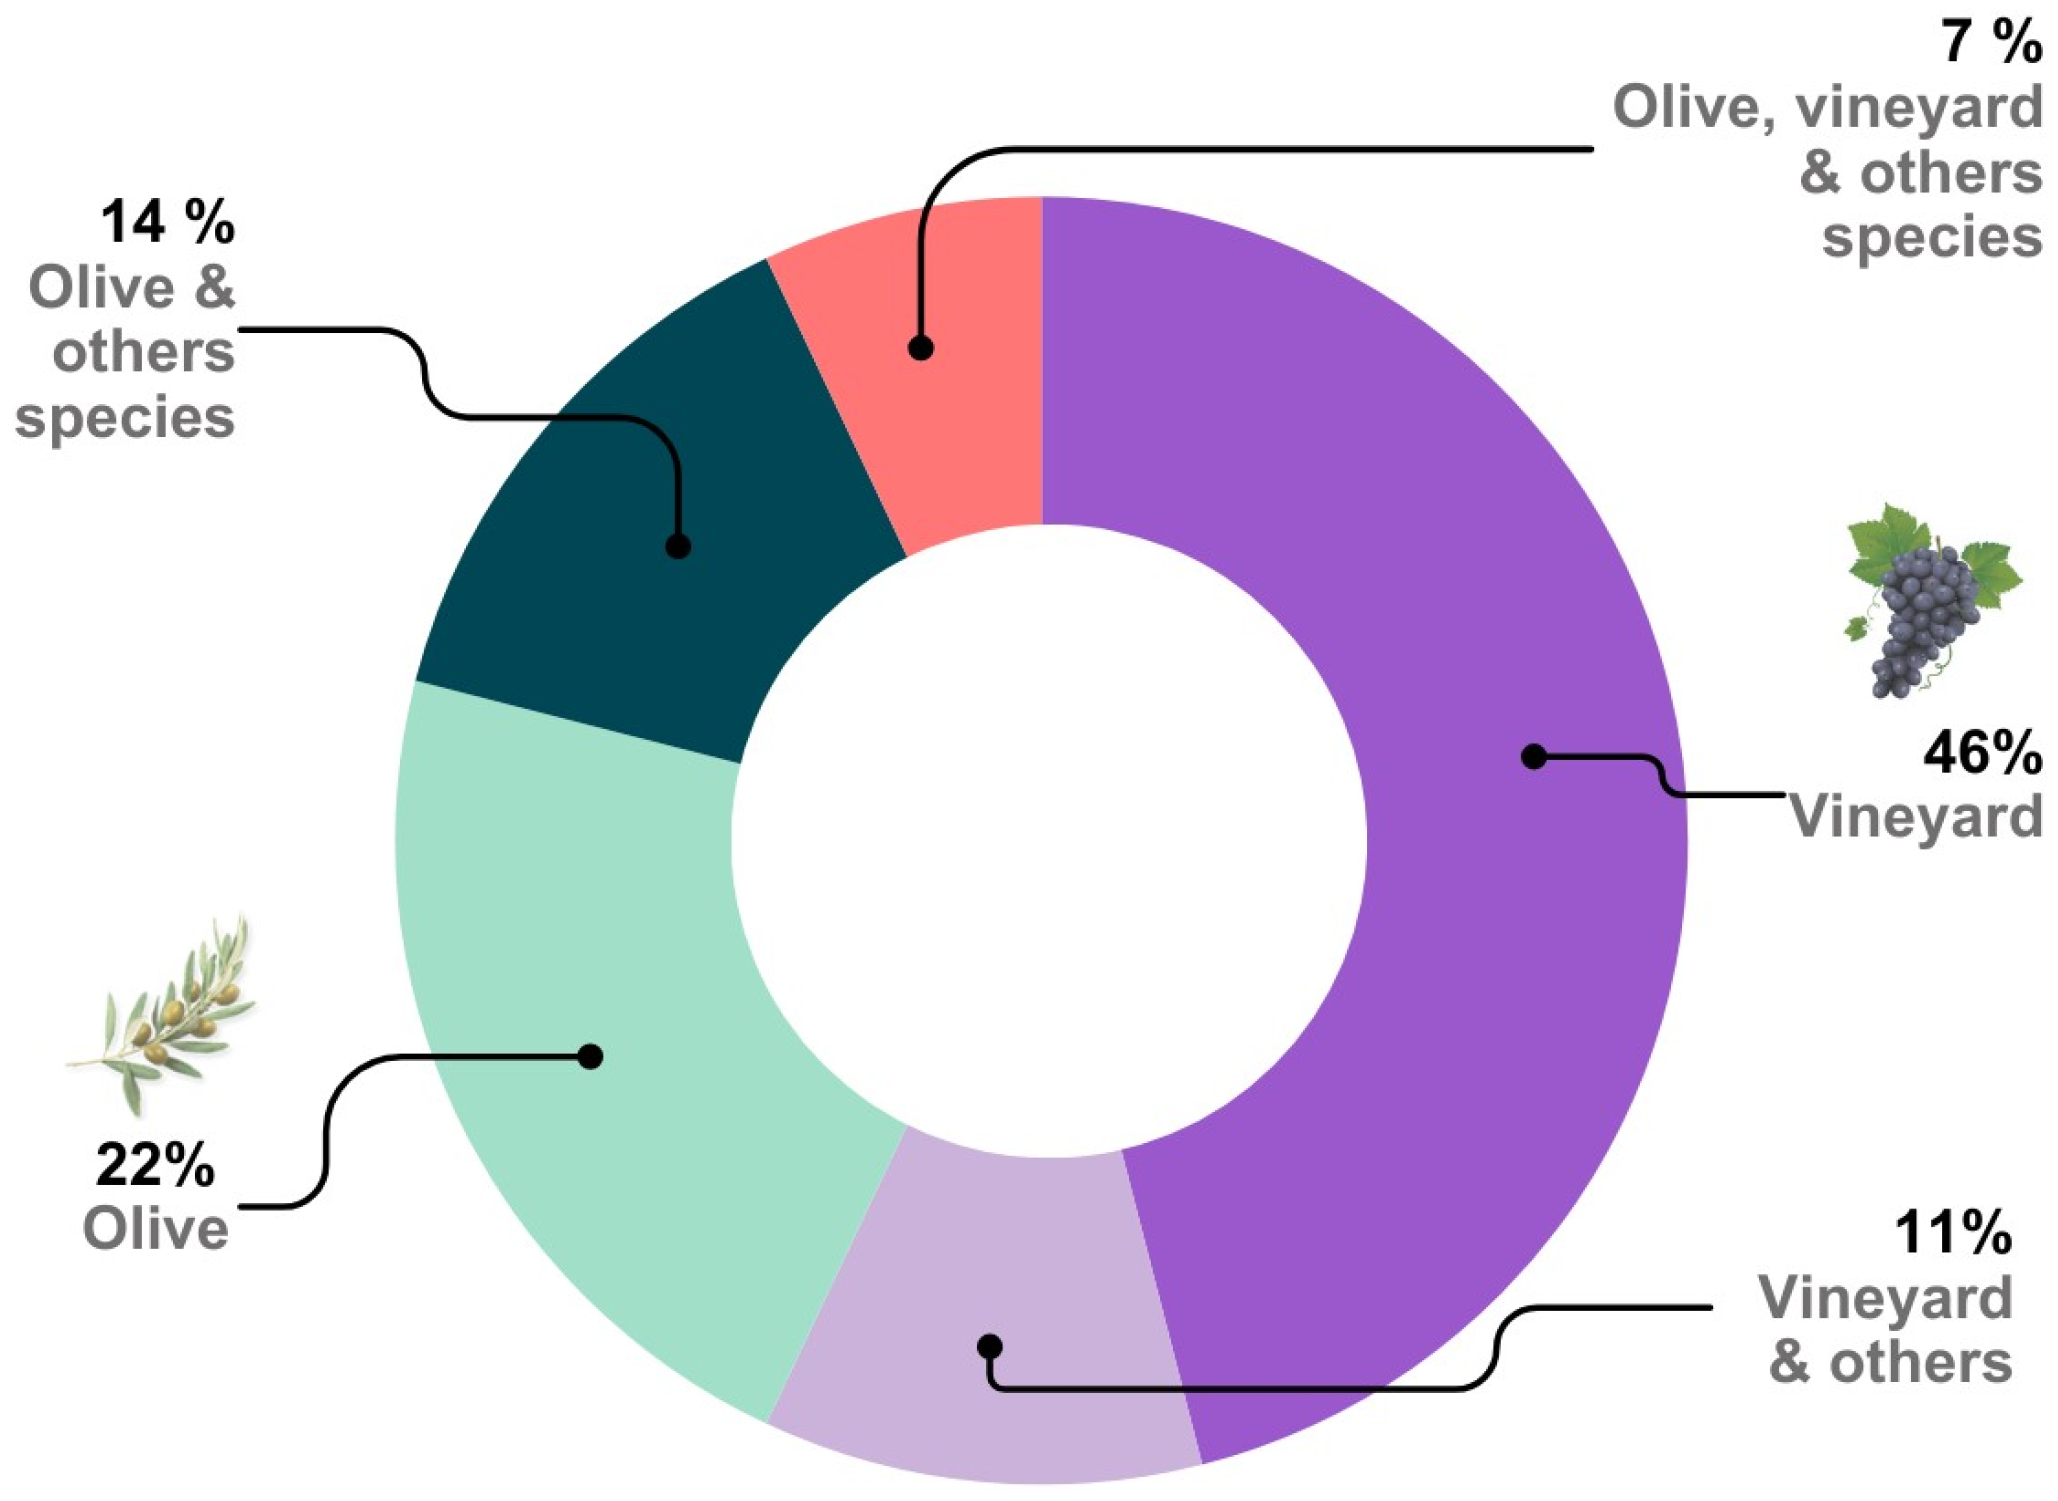
Through the analysis of the distribution of articles according to the primary crop (Figure 6), it is found that grapevine-related studies represent 46% of studies. This is followed by olive growing studies, with 22% of the articles. The remaining articles integrate these species with other crops, all of which are cultivated in the same research area. It is important to note that vineyards are addressed in over 60% of the studies. This observation aligns with the broader global distribution of vineyard cultivation (Figure 1a) and its larger plantation area (Figure 1b).
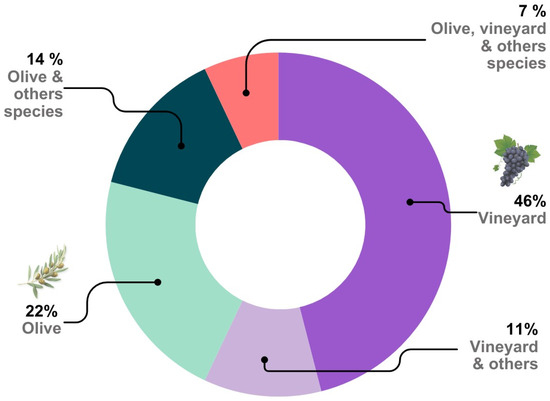
Figure 6.
Distribution of studies expressed as a percentage, categorised by crop type.
3.2. Analysis of Research Trends by Categorical Classification
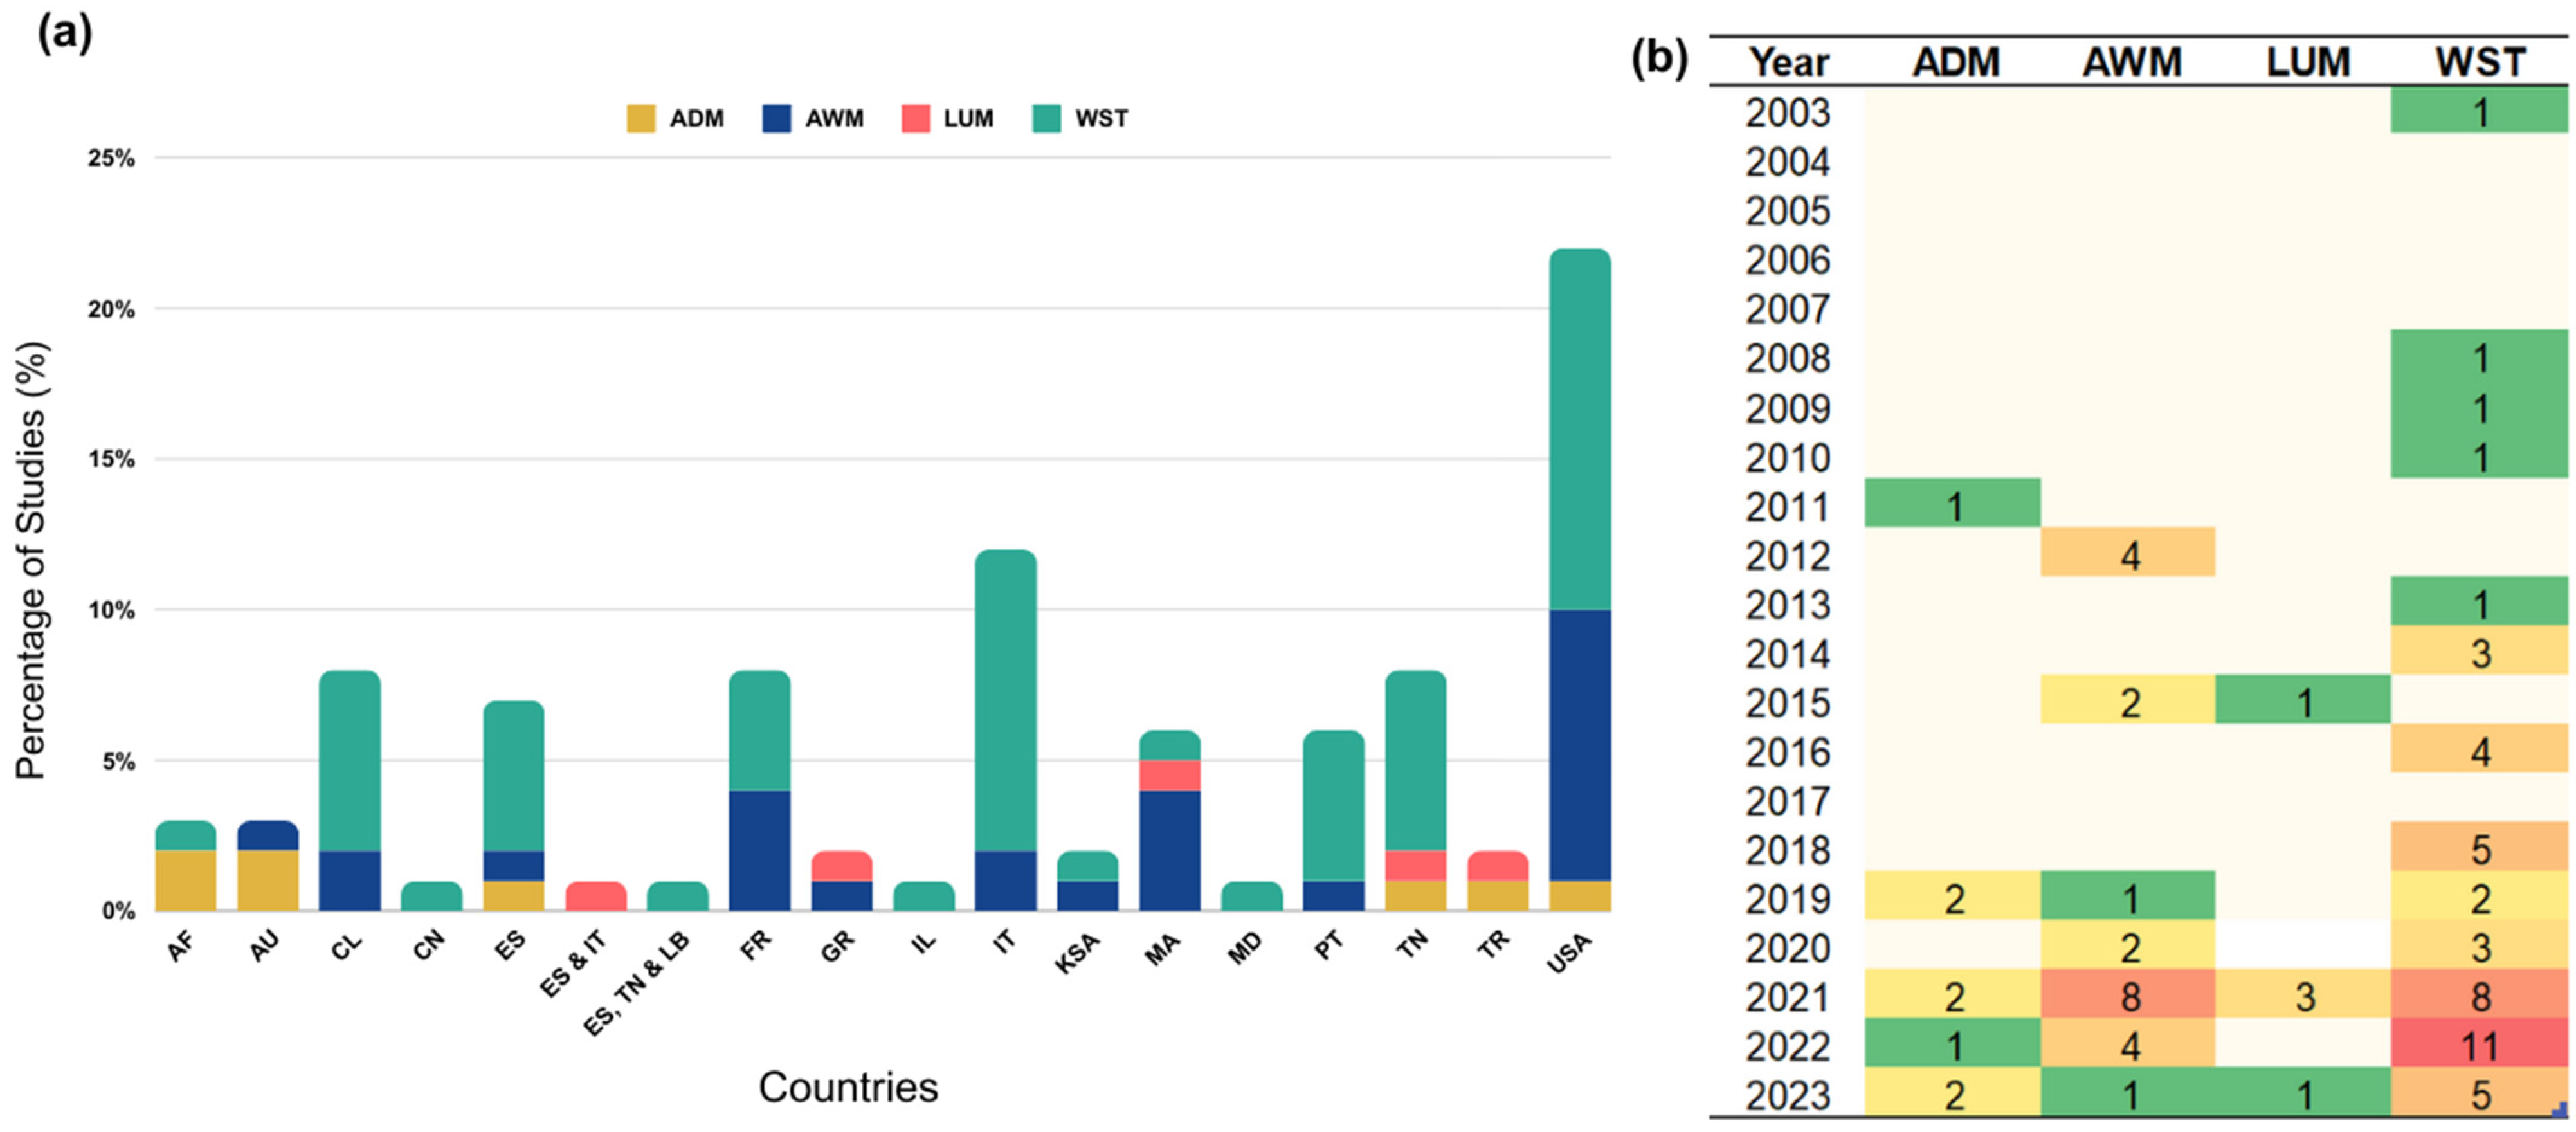
The percentage of studies observed by categorical classification is presented in Figure 7a, demonstrating a balanced distribution of research across all countries based on their total publication count. The WST category broadly addressed across all countries, followed closely by the AWM category. None of the countries included in this study conduct research in all four categories simultaneously. Figure 7a illustrates, for example, that the USA holds the largest share, representing 22% of the publications. This concentration spans three categories: ADM at 1%, AWM at 9%, and WST at 12%. Italy, on the other hand, contributes to three categories with 1% in LUM, 2% in AWM, and 10% in WST.
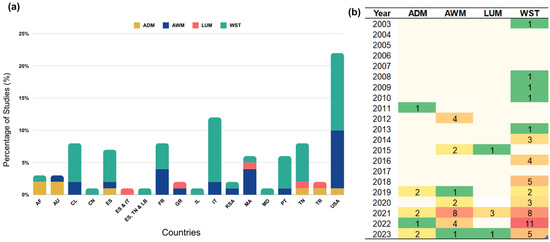
Figure 7.
Percentage of publications between 1 January 2003 and 30 December 2023, according to categorical classification by country (a) and by year (b). ADM: aridity and drought monitoring; AWM: agricultural water management; LUM: land use management; and WST: water stress. AF: Afghanistan; AU: Australia; CL: Chile; CN: China; FR: France; GR: Greece; IT: Italy; LB: Lebanon; MD: Moldova; MA: Morocco; PT: Portugal; KSA: Saudi Arabia (Kingdom of); ES: Spain; TN: Tunisia; TR: Türkiye; USA: United States of America.
Figure 7b provides a year-by-year comparison of publications by category. The distribution of studies across the four categories is more uniform and balanced in the 2018–2023 period. However, the WST category, which has the highest number of studies, shows a broader distribution throughout the entire study period from 2003 to 2023. The year 2022 accounted for 14% of WST publications, followed by 2021 with 10%. Additionally, the AWM category reached its peak in 2021, with 10% of published studies.
3.3. Satellite Platforms and Sensors Used for Drought Monitoring
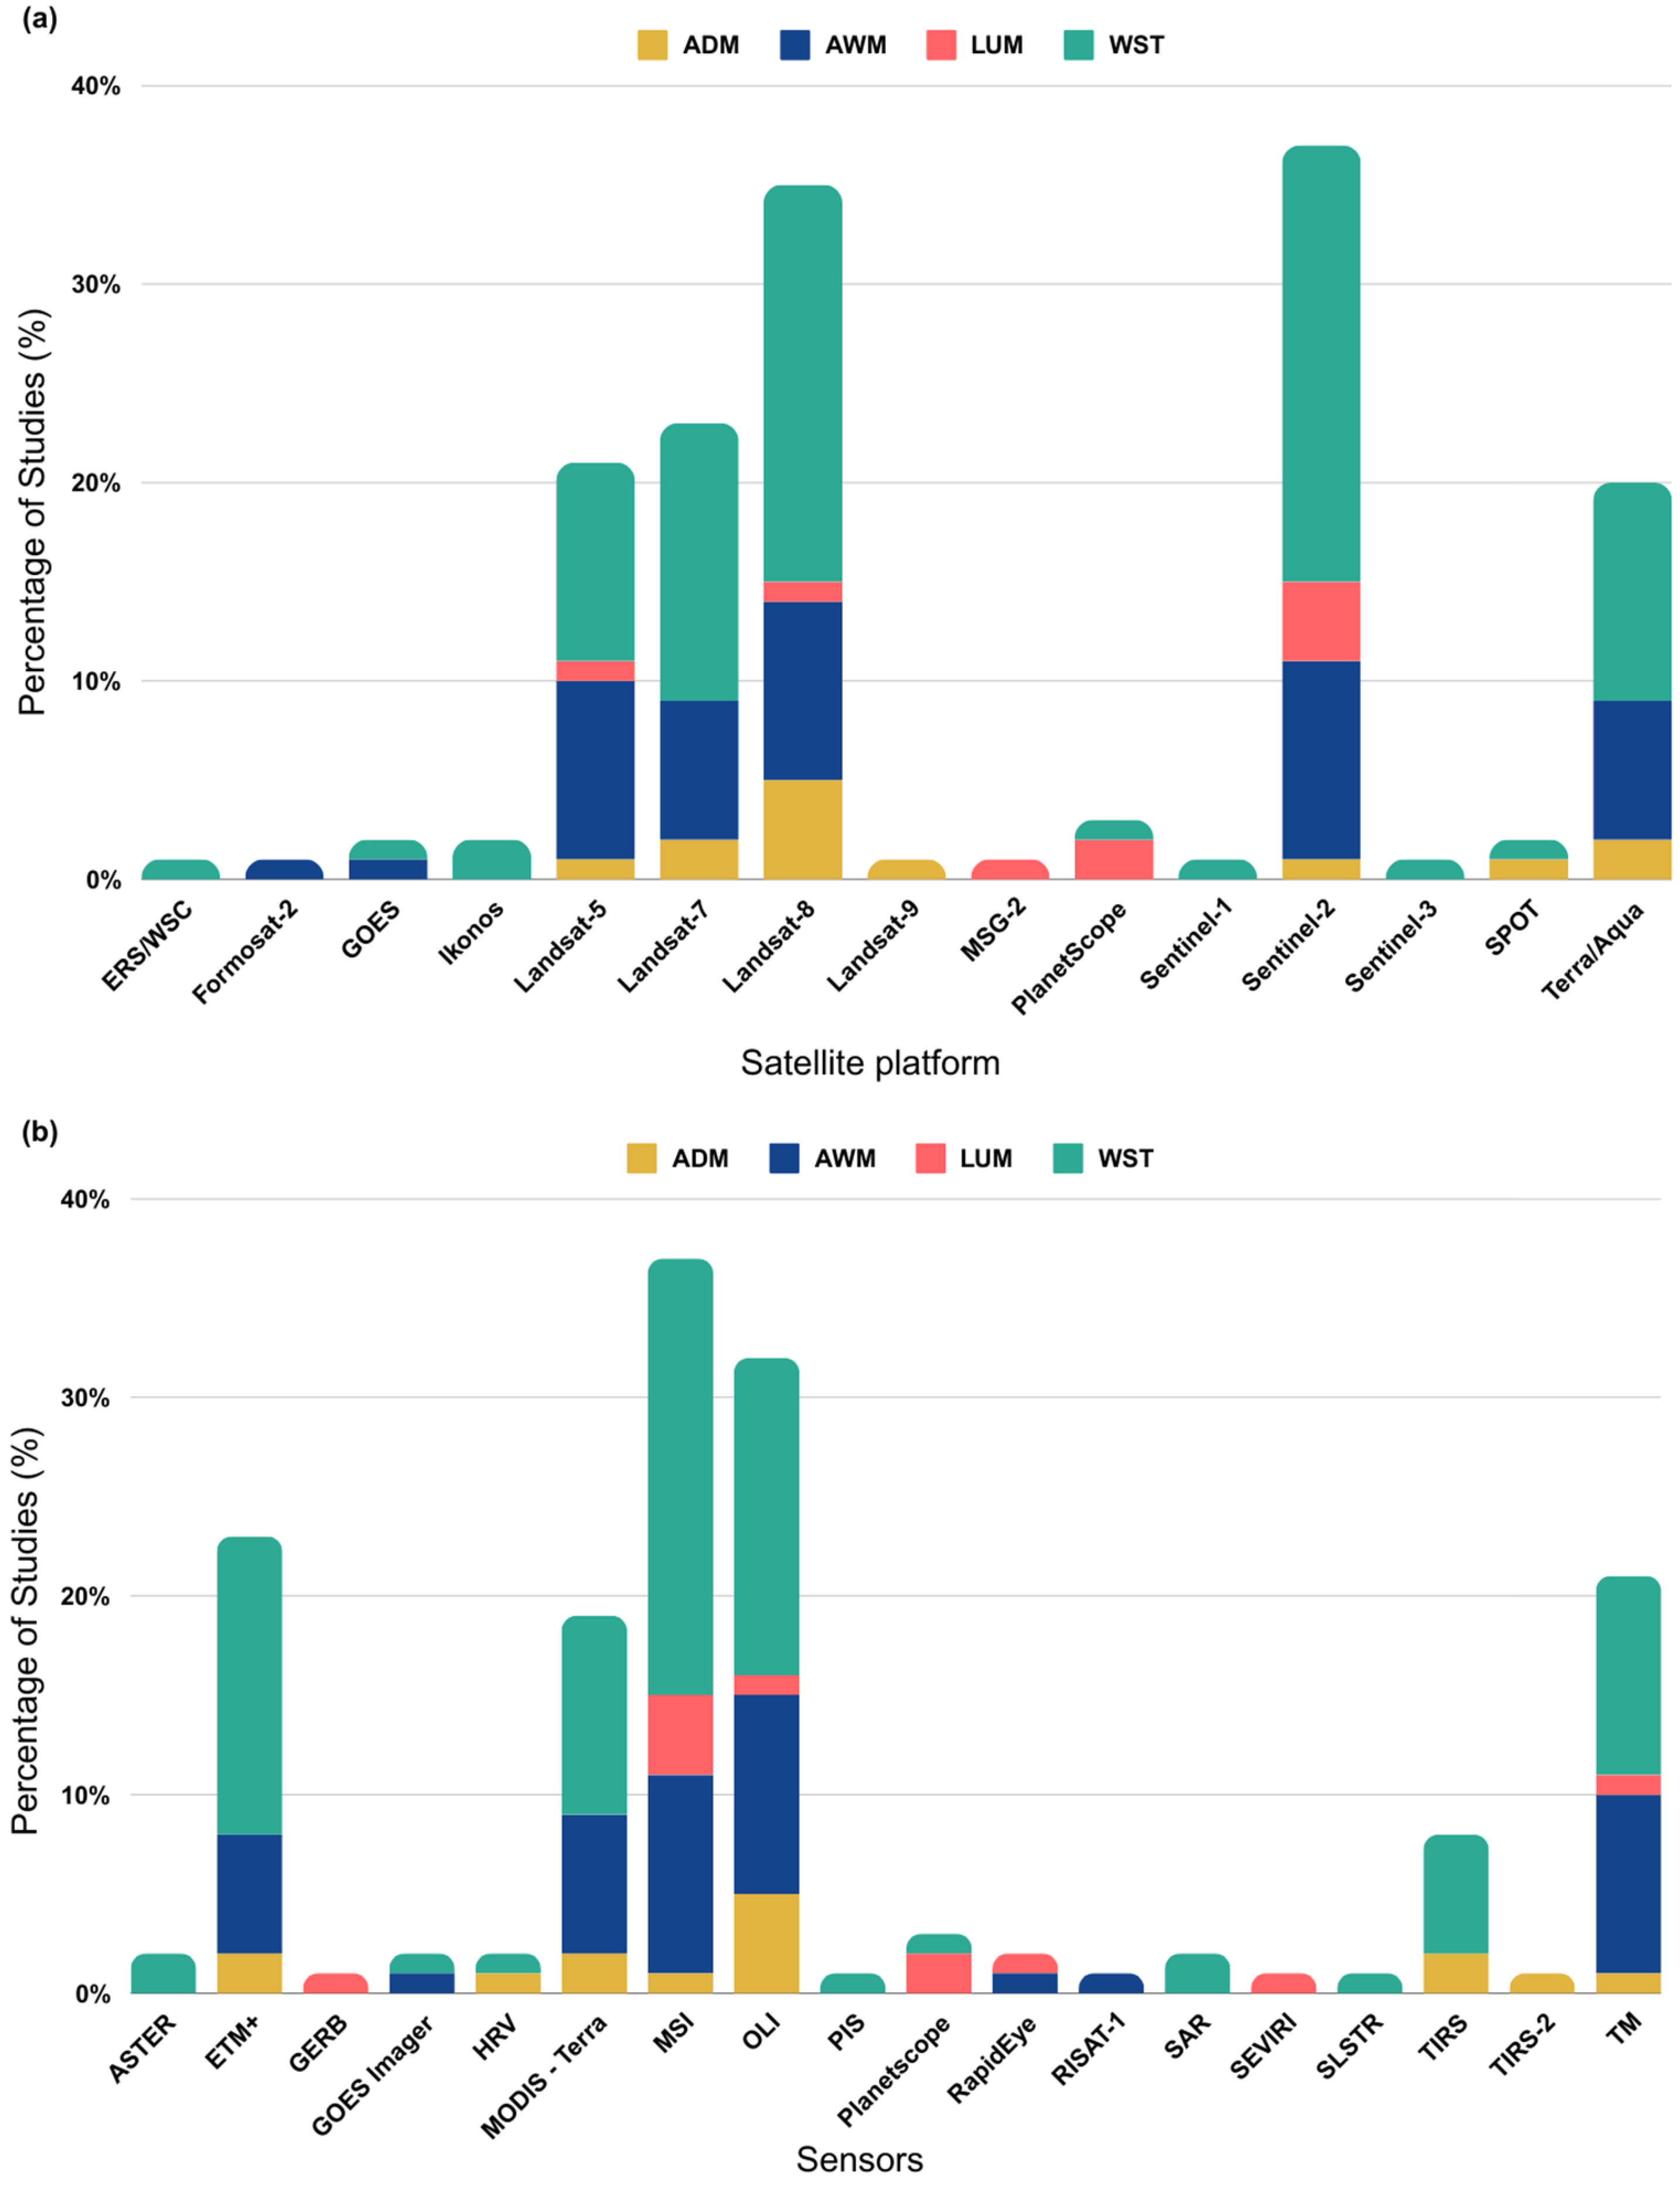
The studies analysed in this systematic review are partially or entirely based on data obtained through satellite remote sensing (Table 2). Figure 8a presents the satellite platforms most frequently used in the analysed articles. Data from Sentinel-2 are used in 37% of the studies followed, by Landsat-8 in 35%. Landsat-7 data are used in 23% of the studies, while Terra/Aqua and Landsat-5 satellites are each present in 21%. All these platforms, except Landsat-7 and Terra/Aqua, were used across the four discussed categories.
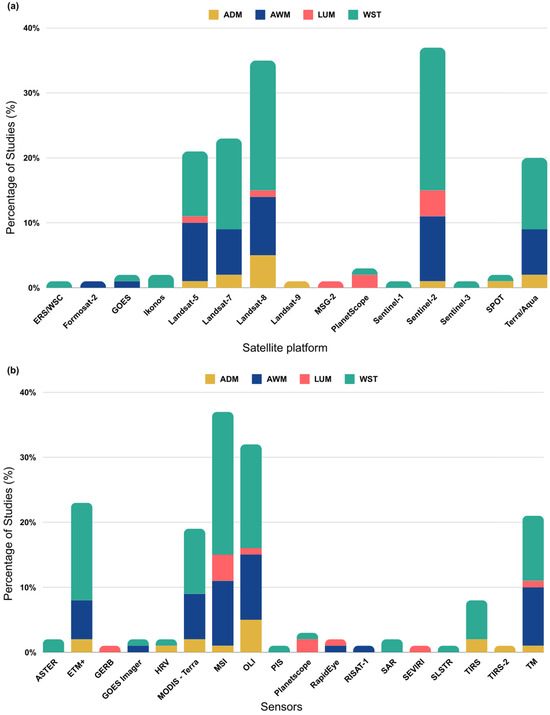
Figure 8.
Percentage distribution of studies by satellite platform (a) and by sensor (b) based on their respective categorical classification. ADM: aridity and drought monitoring; AWM: agricultural water management; LUM: land use management; and WST: water stress. Note that one study can appear several times, as it may include more than one index.
The choice of remote sensing satellite platform and/or sensor (Figure 8b) depends on various factors such as the type of data needed, the data acquisition period in certain areas, and the spatial resolution. The Sentinel-2 satellites (Sentinel-2A and Sentinel-2B) use a Multispectral Instrument (MSI) sensor, which captures multiple Earth images of various spectral bands, thus obtaining various wavelengths with different spatial resolutions. This sensor is the most used (37%), across all four classified categories. The Landsat-8 satellite, one of the most used, is equipped with two sensors: the Operational Land Imager (OLI), used in 32% of the studies, and the Thermal Infrared Sensor (TIRS), less commonly used in the analysed studies, which is present in only 9% of them. The Terra/Aqua satellite’s primary sensing instrument is the Moderate Resolution Imaging Spectroradiometer (MODIS), which provides data on the Earth’s land surface, atmosphere, and oceans with a wide range of spectral bands and resolutions. It was the third most used remote sensing satellite, being present in 20% of the studies. The rest of the satellites and sensors were used for more specific studies and areas. Two studies involved the use of synthetic aperture radar (SAR), using European Remote Sensing satellite (ERS) [35] and Sentinel-1 [36].

Table 2.
Satellite platforms and sensors used to acquire optical imagery in the research in the systematic review.
Table 2.
Satellite platforms and sensors used to acquire optical imagery in the research in the systematic review.
| Satellite Platform | Launch Year | Sensor | No. of Bands | Spectral Range (μm) | Spatial Resolution (m) | No. of Studies | Study References |
|---|---|---|---|---|---|---|---|
| Landsat-5 | 1984 | Thematic Mapper (TM) | 7 | 0.45–12.5 | 30 and 120 | 17 | [37,38,39,40,41,42,43,44,45,46,47,48,49,50,51,52,53] |
| Ikonos | 1999 | Multispectral imagery; Panchromatic imagery | 5 | 0.45–0.85; 0.53–0.93 | 4; 1 | 2 | [54,55] |
| Landsat-7 | 1999 | Enhanced Thematic Mapper Plus (ETM+) | 8 | 0.45–12.5 | 15, 30, 60 | 19 | [37,40,41,42,43,44,45,46,51,56,57,58,59,60,61,62,63,64,65] |
| Terra/Aqua | 1999 | Moderate Resolution Imaging Spectroradiometer (MODIS) | 36 | 0.405–14.385 | 250, 500, 1000 | 17 | [41,54,63,66,67,68,69,70,71,72,73,74,75,76,77,78,79] |
| Formosat-2 | 2004 | Remote Sensing Instrument (RSI) | 5 | 0.45–0.90 | 2 and 8 | 1 | [40] |
| MSG-2 | 2005 | Spinning Enhanced Visible and Infra-Red Imager (SEVIRI) | 12 | 0.4–1.6; 3.9–13.4 | 0.63–13.3 | 1 | [80] |
| GOES-15 | 2010 | GOES Imager | 20 | 0.55–13.35 | 1000, 4000 | 2 | [75,78] |
| Landsat-8 | 2013 | Operational Land Imager (OLI) | 9 | 0.433–2.294 | 15, 30 | 28 | [12,14,21,37,39,41,42,47,54,58,59,61,63,67,69,73,74,75,78,81,82,83,84,85,86,87,88,89] |
| Thermal Infrared Sensor (TIRS) | 2 | 10.60–12.51 | 100 | ||||
| SPOT-7 | 2014 | New Astrosat Optical Modular Instrument (NAOMI) | 5 | 0.455–0.890 | 1.5–6 | 2 | [35,90] |
| Sentinel-2 | 2015 | MultiSpectral Instrument (MSI) | 13 | 0.443–2.202 | 10, 20, 60 | 30 | [36,37,59,61,63,69,83,84,85,91,92,93,94,95,96,97,98,99,100,101,102,103,104,105,106,107,108,109,110,111] |
| PlanetScope | 2016 | Dove-C | 8 | 0.431–0.885 | 3–4.1 | 3 | [91,103,112] |
| Sentinel-3 | 2016 | Sea and Land Surface Temperature Radiometer (SLSTR) | 11 | 0.55–2.25; 3.74–12 | 500; 1000 | 1 | [109] |
| Landsat-9 | 2021 | Thermal Infrared Sensor 2 (TIRS-2) | 2 | 10.6–12.51 | 100 | 1 | [67] |
3.4. Models and Indices
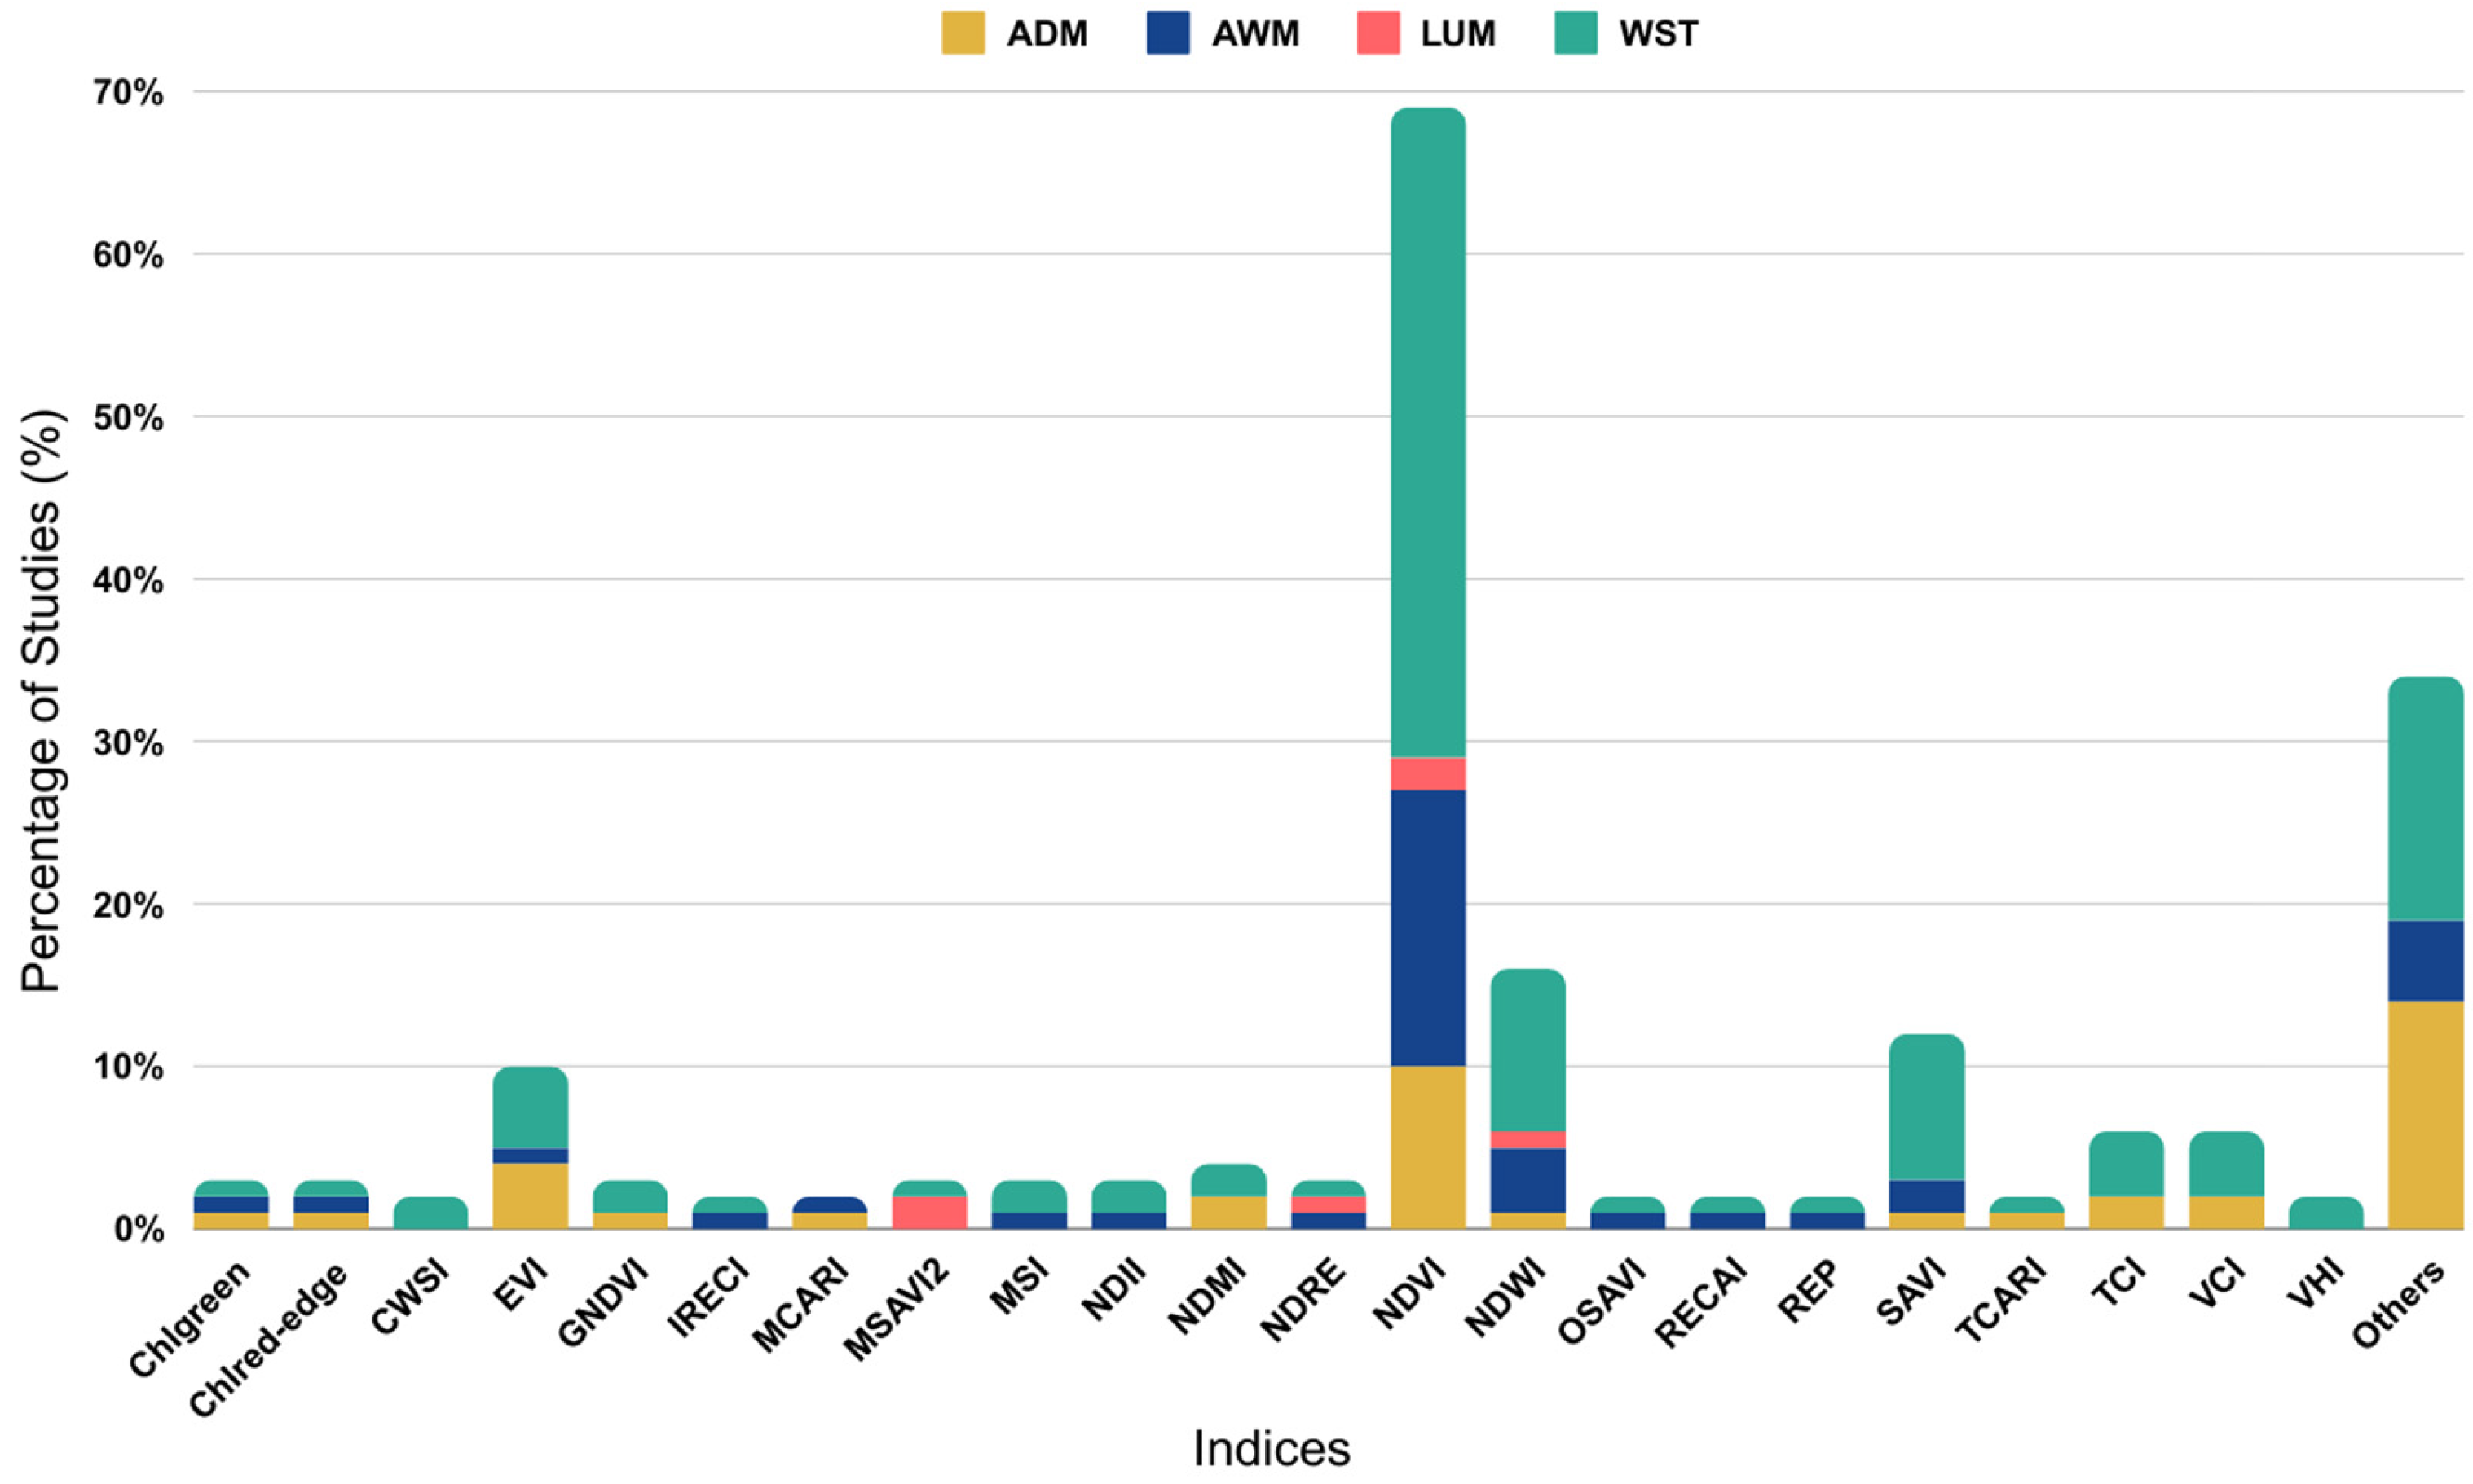
Regarding the indices used in the studies included in this systematic review (Table 3 and Figure 9), different indices computed using satellite imagery were used. The Normalized Difference Vegetation Index (NDVI) [91] appears as a key indicator in most of the studies, with a usage rate of 69%. It is a primary metric for closely examining remote sensing data and evaluating vegetation health and density. Following the NDVI, many studies (31%) also estimate crop-related parameters such as the Leaf Area Index (LAI), based on the NDVI (or other spectral bands), by implementing empirical approaches [55], providing additional information into the structure of plant canopies.

Table 3.
Indices that are more frequently used in research in the systematic review. Note: One study can appear several times, as it may include more than one index. C1, C2: atmospheric resistance coefficients.
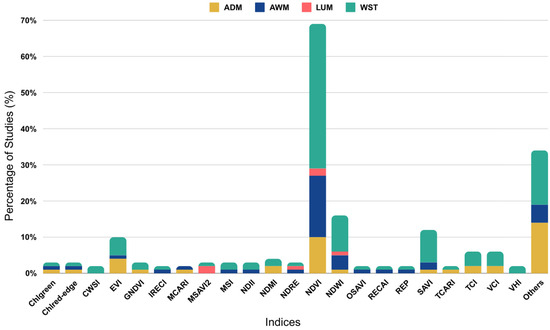
Figure 9.
The distribution of studies by the use of indices according to their respective categorical classifications. ADM: aridity and drought monitoring; AWM: agricultural water management; LUM: land use management; and WST: water stress. Others correspond to the sum of vegetation indices that have been used only once. Note that one study can appear several times, as it may include more than one index.
Other indices, such as the Normalized Difference Water Index (NDWI) [66] and the Soil-Adjusted Vegetation Index (SAVI) [57], are used less frequently, in 16% and 12% of the studies, respectively. These indices are used for monitoring water content and to compensate for ground reflectance. In addition, the Enhanced Vegetation Index (EVI), the Thermal Condition Index (ICT), and the Vegetation Condition Index (VCI) were employed, but in a smaller proportion of studies. These indices highlight the diverse methodologies used in the vegetation analysis. Each index offers unique insights into environmental conditions, reflecting the inherent complexity and variability in ecosystem monitoring.
As for the models most frequently used in the analysed studies, the Disaggregated Atmosphere Land Exchange Inverse (ALEXI/DisALEXI) model [63] was used in six studies—one in the ADM category, two in the AWM category, and three in the WST category. This model is a multi-sensor Thermal InfraRed (TIR) approach used for evapotranspiration (ET) mapping, designed to provide insights into the exchange of energy and water between the atmosphere and the land surface, particularly focusing on ET mapping. The Two-Source Energy Balance (TSEB) model was used in five studies [109], one focused on AWM, and the remaining four on WST. This is a widely used model in remote sensing and hydrology. It is primarily employed to estimate evapotranspiration (ET) from satellite imagery. The model operates on the principle of energy balance, accounting for the energy fluxes between the land surface and the atmosphere. The FAO-56 model was used in nine studies, primarily focusing on the AWM category. This model, developed by the Food and Agriculture Organization of the United Nations (FAO), is a widely used empirical model for estimating reference evapotranspiration, based on meteorological data such as temperature, humidity, wind speed, and solar radiation, based on the Penman–Monteith equation, which is a comprehensive model that considers the energy balance at the land surface. Finally, the Mapping Evapotranspiration at High Resolution with Internalized Calibration (METRIC) model [45] was used in two studies in the AWM category and in three studies addressing WST. This model is a remote-sensing-based approach used to estimate evapotranspiration (ET) at high spatial and temporal resolutions, and uses thermal infrared (TIR) imagery from satellite sensors, such as Landsat, to estimate ET by analysing the surface temperature of the Earth’s features.
4. Discussion
In this section, the different findings are categorised under ADM, AWM, LUM, and WS and structured according to the main two main crops analysed. In each subsection, a summary is presented highlighting several parameters from each study, namely the crop(s) analysed, the satellite platform(s) used, and some of the processing tools used. Moreover, the scale of each study is differentiated in terms of the following: local scale (small land plots or farms); regional scale; national scale; and global scale.
4.1. Aridity and Drought Monitoring
This category includes an exploration of studies aiming to address drought monitoring, assess production losses, and assess vegetation behaviour in different regions and crops (Table 4). These studies commonly use remote sensed vegetation indices to estimate crop-relevant parameters. Arab et al. [21], and Arab and Ahamed [81] highlight the importance of real-time drought monitoring for winery production in South Asia, and how climate change affects its economy. Arab et al. [21] focus on the yield loss assessment of table grapes using a Composite Drought Index (CDI) derived from Landsat OLI and TIRS sensors. The authors combined the VCI, TCI, NDVI DEV, Normalized Difference Moisture Index (NDMI), and Precipitation Condition Index (PCI) and used a Bayesian algorithm (BRANNs) to model the relationship between CDI and the Standardized Precipitation Index (SPI), to estimate yield variation in vineyards. The results showed high spatial and temporal correlations between the yield and CDI in 2016 and 2018 under severe drought conditions (r = 0.87 and r = 0.94, respectively) and under moderate drought conditions (r = 0.85 and r = 0.80, respectively). In Arab and Ahamed [81], the SPI and Standard Vegetation Index (SVI) were used, from Landsat and Climate Hazards Group InfraRed Precipitation with Station data (CHIRPS) datasets, to identify drought-affected vineyards in specific years. Yildirim et al. [60] also employed similar methodologies, monitoring drought impacts in from the Seferihisar-Kavakdere region in western Turkey, underlining the need for different vegetation indices to detect drought in various crops and climatic conditions, and showing that grapevines and olive trees were more severely impacted than citrus, due to insufficient irrigation during dry years.

Table 4.
Summary of crops studied, the scale, processing platforms/tools used, and the remote sensing indices and products employed in aridity and drought monitoring studies.
Carreño-Conde et al. [71] presented a forecasting model for crop dynamics using the NDVI to enhance water management in olive orchards in Spain. Knipper et al. [67] focus on the importance of accurate ET estimation in water management during the dry season, highlighting the significance of reduced latency in Landsat-derived Land Surface Temperature (LST) products for near-real-time ET estimation in Californian vineyards. Cogato et al. [110] assessed the impact of heat waves on irrigated vineyards using Sentinel-2 MSI imagery to improve remotely sensed ET information for water management, using vegetation indices like the NDVI and EVI to analyse plant health. Bretreger et al. [42] focused on monitoring irrigation water use at the farm scale, using climate data and Landsat observations, focusing on efficient water resource management. Amri et al. [90] analysed the vegetation behaviour in olive orchards in a semi-arid region of North Africa, showcasing the utility of vegetation indices, such as the NDVI, in understanding environmental conditions and plant health.
4.2. Agricultural Water Management
AWM is crucial for the sustainability of vineyards and olive groves, requiring a balanced approach to irrigation (Table 5). By prioritisation efficient water use, farmers can maintain the productivity of their crops, mitigate environmental impacts, and preserve water resources. Within the context of AWM applications, 22 articles in total were examined, with an emphasis on 7 studies carried out in California. Among these, five studies [59,73,74,75,84] were affiliated with the GRAPEX (Grape Remote Sensing Atmospheric Profile and Evapotranspiration eXperiment) project, which aimed at enhancing water management practices in Californian vineyards through remote sensing technologies. These studies explore various methodologies for estimating the LAI [84] and ET [59,73,74,75], employing techniques such as vegetation indices, LST, and energy balance.

Table 5.
Summary of crops studied, the scale area, processing platforms/tools used, and remote sensing indices and products employed in agricultural water management studies.
Abubakar et al. [92] used Sentinel-2 satellite data to monitor canopy development and inter-row management in grapevine fields, using an analytical model to characterise the grapevine canopy LAI. Vanino et al. [88] focused on estimating ET and crop coefficients, for understanding water consumption in vineyards. They used multi-sensor remote sensing data (from Landsat-8 OLI and RapidEye), providing a comprehensive view of water dynamics in pergola vineyards, a traditional vine training system in Italy. Consoli and Barbagallo [49] also underline the importance of remote sensing satellite-based methodologies for determining water requirements in Mediterranean vineyards. Sánchez et al. [50], adopted a different approach by simulating soil water content using biogeochemical and remote sensing models, with Sentinel-1 and Sentinel-2 data at the core of the analysis in Spanish vineyards. The validation of these models with ground measurements confirms the reliability of remote sensing in estimating soil moisture levels. Kourgialas et al. [96], presented a web-based GIS platform in Crete (Greece), representing an innovative step in irrigation management, using satellite data. This platform could cover vineyards and olive trees (among other crops), aiming to improve agricultural sustainability by integrating technology with traditional farming practices. Carrasco-Benavides et al. [51] focused on the specific needs of a drip-irrigated Merlot vineyard in Chile, using multispectral images from Landsat 5 (TM) and Landsat 7 (+ETM) to evaluate the METRIC model to estimate the real evapotranspiration (ETa) and crop coefficient (Kc) during growing seasons. Bretreger et al. [37] provided insights into the broader application of remote sensing, focusing on quantifying irrigation water use through satellite multispectral data combined with soil water deficit modelling.
Regarding olive trees, the studies by Hafyani et al. [105], Moumen et al. [72], and Kharrou et al. [40] also offer valuable insights into the assessment of agricultural water requirements, irrigation practices, and water use efficiency in semi-arid regions, particularly in Morocco. Hafyani et al. [105] highlighted the importance of evaluating agricultural water requirements for various crops (including olive trees) by considering reference ET, crop coefficients, and crop ET, providing crucial insights into water management strategies. Kharrou et al. [40] used remote-sensing-based soil–water balance in olive groves, which enabled the monitoring and management of irrigation practices to optimise water use efficiency. Similarly, Moumen et al. [72] evaluated the efficiency of deficit irrigation practices in the Middle Sebou and Innaouene downstream regions, for assessing the impact of deficit irrigation on water usage and olive productivity.
Alshammari et al. [68] used GIS software to model climatic variables, aiming to identify new lands suitable for olive cultivation, by comparing soil and climate conditions to those of existing farms in Aljouf, Saudi Arabia. Meanwhile, Ortega-Salazar et al. [62] evaluated the performance of the METRIC model for its effectiveness in mapping actual ET in super-intensive drip-irrigated olive orchards in Chile, contributing to enhance water management practices. Pôças et al. [44] also focused on using remote sensing techniques to estimate actual crop coefficients with the help of vegetation indices and soil–water balance data in Portugal.
4.3. Land Use Management
LUM is a critical aspect of environmental sustainability, particularly mitigating drought risks (Table 6). LUM refers to the planning, regulation, and control of land use to achieve specific social, economic, and environmental objectives. The studies included in this category present several similarities, including the use of remote sensing with high-resolution satellite images (e.g., as Sentinel-2) [101,103,122] and remote sensing products such as the operational ET product SEVIRI (Spinning Enhanced Visible and Infrared Imager), [80], which provides information on ET rates over extensive land areas from the Meteosat 9 (MSG-2) satellite. Each study focuses on agriculture and land use, whether this the intensification of olive trees in Morocco [122], spatial variability in vineyards [101], olive’s dynamics in Turkey [39], or changes in land use over decades [39]. Navarro et al. [122] addresses a decade-long view of the intensification of olive groves in Morocco’s Saïss Plain, using high-resolution satellite imagery from Planetscope, RapidEye, along with Sentinel-2. They used machine learning algorithms to combine vegetation indices, such as the NDVI or Modified Soil Adjustment Vegetation Index 2 (MSAVI-2) and Near-Infrared (NIR) bands, enhancing the precision of land use classification, distinguishing between traditional, intensive, and super-intensive olive orchards with high accuracy (>0.9). This study exemplifies the methodologies that can be used to monitor and assess the ecological impacts of agricultural practices, offering valuable insights for policymakers and stakeholders. Abdelmoula et al. [103], using Sentinel-2 time series, developed a Bayesian model to estimate various plant parameters like LAI, chlorophyll content, water content, and mesophyll structure, aiming to anticipate drought risks in olive orchards.

Table 6.
Summary of crops studied, the scale area, processing platforms/tools used, and remote sensing indices and products employed in land-use management studies.
Darra et al. [101] compared and evaluated data obtained from Sentinel-2 and an active canopy sensor (Crop Circle ACS-470) at various grapevine phenological stages. Analysis has been conducted using vegetation indices such as the NDVI, Normalized Difference Red-Edge (NDRE), Modified Soil Adjustment Vegetation Index (MSAVI), and NDWI, along with biophysical variables such as fractional vegetation cover (FVC) and the fraction of absorbed photosynthetically active radiation (FAPAR) across different growth stages, to understand photosynthetic efficiency and vegetation cover and potentially understand grape productivity. Tunc et al. [39] analysed the spatial and temporal changes in agricultural land use in the Araban District (Turkey), between 1984 and 2019, using Landsat-TM and Landsat-TIRS/OLI data. The analysis revealed a significant decrease in dryland agriculture, while irrigated agriculture increased. Petropoulos et al. [80] discuss the performance of the operational ET product derived from the SEVIRI sensor in different Mediterranean ecosystems, showing good agreement between satellite ET estimates and ground-based measurements.
4.4. Water Stress
The exploration of water stress in agriculture and viticulture (Table 7), particularly in California’s vineyards, has been advanced by several studies including those conducted by Knipper et al. [63] and Safre et al. [99]. Knipper et al. [63] demonstrated the potential of high-resolution satellite data and advanced modelling to improve water management in vineyards. The authors integrated the ALEXI/DisALEXI model with a data fusion method with the goal to provide precise daily ET estimates, which are crucial for sustainable irrigation practices. Safre et al. [99] evaluated the Sentinel-2 Surface Energy Balance Algorithm for Land (SAFER) model to estimate grapevine water consumption in the Central Valley of California. The study focused on estimating actual daily and seasonal evapotranspiration (ETa) using Sentinel-2 images. Following internal calibration, the SAFER model demonstrated a root mean square error (RMSE) in daily ETa ranging between 0.64 and 0.75 mm/day. Spatial patterns of ETa revealed variability across sites and different farmer management practices.

Table 7.
Summary of crops studied, the scale area, processing platforms/tools used, and remote sensing indices and products employed in water stress studies.
The integration of satellite imagery and advanced crop models is also revolutionisation viticulture in France, offering a sophisticated approach to managing water stress and the broader implications of climate change in vineyards. The research by Lopez-Fornieles et al. [95] is particularly notable for its use of Sentinel-2 satellite imagery to assess the impact of heatwaves on grapevines in the Languedoc-Roussillon region, a major concern given the increasing frequency of extreme weather events [123]. Their methodology, which employs partial least squares regression (N-PLS), provides predictive insight into potential yield losses, which is invaluable for vineyard management and planning. Similarly, the work by Alkassem et al. [56] underscores the potential of remote sensing to enhance soil moisture assessments. They applied the STICS crop model [124], in conjunction with the GLUE algorithm, to estimate Soil Available Water Capacity (SAWC) from Landsat 7 ETM+ imagery and ground measurements.
The concern regarding water stress in Italy, particularly in agricultural areas such as olive groves and vineyards, is indeed significant. Studies such as those by Battista et al. [54,93] and Pieri et al. [41], which utilise ground-based and remotely sensed weather datasets play a crucial role in assessing water stress conditions, particularly in central regions like Tuscany. Battista et al. [54] discuss the integration of ground and multi-resolution satellite data for predicting the water balance of a Mediterranean two-layer agroecosystem. On the other hand, Pieri et al. [41] focus on estimating actual ET in fragmented Mediterranean areas; by employing a spatio-temporal fusion of NDVI data, they evaluate the water consumption of vegetation and soil in these regions. Additionally, Battista et al. [93] explore how the impact of water scarcity on olive trees can be estimated through a combination of meteorological data and data from the Sentinel-2 satellite.
These collective studies advance our understanding of water stress and its management, which is vital for sustainable agriculture in regions like Tuscany, where such challenges are particularly critical. Borgogno-Mondino et al. [87] investigated the spatial and temporal variability of vines and soil in a Moscato Reale vineyard in Apulia, southern Italy, utilisation the NDVI and NDWI from the Landsat 8 OLI, to explore vine and soil vigour and water content. In Spain, Bellvert et al. [109] and Aguirre-García et al. [108] explored the integration of remote sensing data with the TSEB model to improve agricultural water management. Bellvert et al. [109] focused on improving vineyard water status assessment by using low-resolution thermal imagery and employing data enhancement techniques to analyse ET components. The enhanced LST data used in this study allowed the authors to understand the crop water stress index (CWSI) for grapevine water potential. On the other hand, Aguirre-García et al. [108] applied the TSEB model to olive groves to estimate actual daily evapotranspiration (ETd) under varying ground cover conditions, validating the model’s estimates against in-situ measurements for the improvement of water management strategies. Similar work was conducted in a study area located in Portugal by Häusler et al. [43], using remote sensing data fusion with the STSEB model to estimate ETd and its partitioning into evaporation and transpiration in an intensive olive grove. The results obtained showed accurate estimates of ETd and its partitioning, demonstrating a better agreement for net radiation (Rn) and soil heat flux (G), and similar results for sensible (H) and latent (λE) heat fluxes, as well as ETd. Furthermore, Mendes et al. [36] applied a precision viticulture methodology for mapping soil moisture (SMC) in Portuguese vineyards, using remote sensing data from Sentinel-1 and Sentinel-2 and incorporated field measurements of SMC, the Standardized Precipitation Evapotranspiration Index (SPEI) as an agricultural drought index, supervised classification algorithms, and feature selection techniques to classify SMC probabilities into high or low classes, crucial for efficient irrigation management and soil salinisation prevention.
Potopová et al. [79] performed a study in the Republic of Moldova, and used remote sensing techniques, agricultural census, and agrometeorological observations to analyse drought-related yield losses in vineyards. The enhanced vegetation index (EVI2), soil water index (SWI), and SPEI were combined, and multiple linear regression (MLR) and Bayesian neural network (BNN) models were applied for yield prediction. The study demonstrated a strong correlation between remote sensing indices and crop yield, with BNN slightly outperforming MLR in yield prediction. Sghaier et al. [97] employed the HidroMORE model to assess water balance in arid environments with a case study in olive groves in Tunisia. The authors used ET0 from FAO56 and NDVI from Sentinel-2. The model showed a correlation coefficient (R2) of 0.72 and an Index of Agreement (IA) of 0.76 when compared with ground-truth measurements). Arab et al. [12] aimed to predict table grape yield using satellite remote sensing and machine learning in the Shakardara District, Kabul, Afghanistan. Landsat 8 images were used to calculate vegetation indices (the NDVI, LAI, and NDWI) in vineyards from 2017 to 2019. Regression analysis and artificial neural network (ANN) models were employed, showing that the NDVI had the highest accuracy in predicting yields (r2 = 0.79), demonstrating the potential of satellite remote sensing and machine learning models to enable grape yield prediction.
Helman et al. [112] monitored grapevine stem water potential (Ψstem) using daily high-resolution satellite imagery from Planet nano-satellites, and the Google Earth Engine platform. The authors developed a remote sensing tool that used vegetation indices to predict Ψstem’s spatial and temporal variability during the growth season, in Israel. The creation of a ‘global scale’ model, which requires minimal vegetation indices variables, offers a potential improvement in the efficiency of vineyard-level Ψstem monitoring, particularly beneficial for Mediterranean vineyards where precise water potential assessment can lead to better irrigation management.
Finally, Tao et al. [66] focused on soil moisture recovery in grape growing areas using a multi-feature and stacking-based ensemble learning model. The study integrates MODIS remote sensing data with topographical information, deriving features related to ET, LST, and spectral reflection (SR). In the context of vineyard irrigation management, this approach could be used to obtain spatially distributed grapevine water stress indices, which may complement irrigation scheduling to improve vineyard water and yield management. The study demonstrates that TSEB can be of great utility to vineyard irrigation management, especially to improve T/ET estimations and quantify the contribution of the cover crop to ET. Improved knowledge of T/ET can enhance grapevine water stress detection to support irrigation and water resource management. In addition to the mentioned studies, other research articles and resources are available that discuss the application of remote sensing satellite data for drought assessment in vineyard and olive orchards (Table 2).
5. Conclusions
The temporal distribution of the analysed studies reveals an increase in scientific production since 2018, reaching its peak in 2021. This trend reflects a growing interest in the use of satellite remote sensing for drought assessment/monitoring in vineyards and olive plantations. In terms of geographical distribution, USA, Italy, Spain, France, Chile, Tunisia, and Portugal are the main countries leading this research field. Sentinel and Landsat emerge as the primary sources for satellite remote sensing information. Their respective sensors, such as MSI, OLI, or TIRS, provide valuable and freely accessible data for a variety of research purposes. These platforms are extensively utilised to monitor drought conditions and evaluate water requirements in vineyards and olive groves across diverse regions. The availability of multiple remote sensing satellite platforms enhances data accessibility and improves temporal resolution, despite potential disparities in spatial resolution. This allows for a greater volume of data covering periods unaffected by cloud coverage. Simultaneously, the presence of various sensors and spectral bands in different wavelengths provides an enhancement of studies on drought-prone areas. In fact, all these recent technological advances in remote sensing promote continuous research, which is in line with the global agricultural policies for the enhanced sustainability of the sector [124].
The integration of satellite data with advanced modelling tools, such as METRIC and TSEB, enables more accurate estimation of actual evapotranspiration, crop coefficients, and soil moisture levels, which are critical for optimisation agricultural water management. Analysing the spatial and temporal variability of vegetation and soil in vineyards and olive groves using satellite spectral indices such as the NDVI and NDWI provides valuable insights for sustainable management. Furthermore, these studies also address the importance of innovative web-based GIS platforms that leverage satellite data to improve irrigation management and enhance agricultural sustainability in regions like the Mediterranean, where water scarcity is a significant challenge. These tools have demonstrated the potential of remote sensing techniques to assess the impact of extreme weather events, such as heatwaves, on grapevine productivity, providing valuable insights for vineyard management and climate change adaptation. Overall, remote sensing and satellite imagery can be used to improve drought monitoring and assessment, water use and ET estimation, irrigation management, and sustainable agriculture in semi-arid and Mediterranean regions.
Author Contributions
Conceptualisation, N.C., L.P., J.A.S. and H.F.; methodology, N.C.; software, H.F.; validation, L.P., J.A.S. and H.F.; formal analysis, N.C.; investigation, N.C.; resources, J.A.S. and H.F.; data curation, N.C.; writing—original draft preparation, N.C.; writing—review and editing, L.P., J.A.S. and H.F.; visualisation, N.C. and H.F.; supervision, L.P., J.A.S. and H.F.; project administration, J.A.S. and H.F.; funding acquisition, J.A.S. and H.F. All authors have read and agreed to the published version of the manuscript.
Funding
The authors acknowledge the support of the Portuguese Foundation for Science and Technology (FCT), for project UIDB/04033/2020 (https://doi.org/10.54499/UIDB/04033/2020), project LA/P/0126/2020 (https://doi.org/10.54499/LA/P/0126/2020), project PTDC/AGR-AAM/04553/2022 (https://doi.org/10.54499/2022.04553.PTDC), and project 2022.02317.CEECIND (https://doi.org/10.54499/2022.02317.CEECIND/CP1749/CT0002). This research activity was supported by the Vine&Wine Portugal Project, co-financed by the RRP—Recovery and Resilience Plan—and the European NextGeneration EU Funds, within the scope of the Mobilizing Agendas for Reindustrialization, under ref. C644866286–00000011.
Data Availability Statement
All data used to elaborate this study are publicly available.
Conflicts of Interest
The authors declare no conflicts of interest. The funders had no role in the design of the study; in the collection, analyses, or interpretation of data; in the writing of the manuscript; or in the decision to publish the results.
References
- Costa, J.M.; Egipto, R.; Aguiar, F.C.; Marques, P.; Nogales, A.; Madeira, M. The Role of Soil Temperature in Mediterranean Vineyards in a Climate Change Context. Front. Plant Sci. 2023, 14, 1145137. [Google Scholar] [CrossRef] [PubMed]
- Fraga, H.; Guimarães, N.; Freitas, T.R.; Malheiro, A.C.; Santos, J.A. Future Scenarios for Olive Tree and Grapevine Potential Yields in the World Heritage Côa Region, Portugal. Agronomy 2022, 12, 350. [Google Scholar] [CrossRef]
- Costa, J.M.; Vaz, M.; Escalona, J.; Egipto, R.; Lopes, C.; Medrano, H.; Chaves, M.M. Modern Viticulture in Southern Europe: Vulnerabilities and Strategies for Adaptation to Water Scarcity. Agric. Water Manag. 2016, 164, 5–18. [Google Scholar] [CrossRef]
- Orlandi, F.; Fornaciari, M. Impact of Climate Change on Olive Crop Production in Italy. Atmosphere 2020, 11, 595. [Google Scholar] [CrossRef]
- Fraga, H.; Freitas, T.R.; Fonseca, A.; Fernandes, A.; Santos, J.A. Climate Change Implications on the Viticulture Geography. In Advances in Botanical Research; Academic Press: Cambridge, MA, USA, 2024. [Google Scholar]
- Fraga, H.; Pinto, J.G.; Santos, J.A. Olive Tree Irrigation as a Climate Change Adaptation Measure in Alentejo, Portugal. Agric. Water Manag. 2020, 237, 106193. [Google Scholar] [CrossRef]
- FAOSTAT. FAOSTAT Statistical Database. Available online: https://www.fao.org/faostat/en/#data/QCL (accessed on 28 February 2024).
- Ozturk, M.; Altay, V.; Gönenç, T.M.; Unal, B.T.; Efe, R.; Akçiçek, E.; Bukhari, A. An Overview of Olive Cultivation in Turkey: Botanical Features, Eco-Physiology and Phytochemical Aspects. Agronomy 2021, 11, 295. [Google Scholar] [CrossRef]
- Calvin, K.; Dasgupta, D.; Krinner, G.; Mukherji, A.; Thorne, P.W.; Trisos, C.; Romero, J.; Aldunce, P.; Barrett, K.; Blanco, G.; et al. IPCC, 2023: Climate Change 2023: Synthesis Report. Contribution of Working Groups I, II and III to the Sixth Assessment Report of the Intergovernmental Panel on Climate Change; Core Writing Team, Lee, H., Romero, J., Eds.; Intergovernmental Panel on Climate Change (IPCC): Geneva, Switzerland, 2023. [Google Scholar]
- Ebi, K.L.; Vanos, J.; Baldwin, J.W.; Bell, J.E.; Hondula, D.M.; Errett, N.A.; Hayes, K.; Reid, C.E.; Saha, S.; Spector, J.; et al. Extreme Weather and Climate Change: Population Health and Health System Implications. Annu. Rev. Public Health 2021, 42, 293–315. [Google Scholar] [CrossRef] [PubMed]
- FAO. The Impact of Disasters and Crises on Agriculture and Food Security: 2021; FAO: Rome, Italy, 2021; ISBN 978-92-5-134071-4. [Google Scholar]
- Arab, S.; Noguchi, R.; Matsushita, S.; Ahamed, T. Prediction of Grape Yields from Time-Series Vegetation Indices Using Satellite Remote Sensing and a Machine-Learning Approach. Remote Sens. Appl.—Soc. Environ. 2021, 22, 100485. [Google Scholar] [CrossRef]
- Claro, A.M.; Fonseca, A.; Fraga, H.; Santos, J.A. Susceptibility of Iberia to Extreme Precipitation and Aridity: A New High-Resolution Analysis over an Extended Historical Period. Water 2023, 15, 3840. [Google Scholar] [CrossRef]
- Kefi, M.; Pham, T.D.; Kashiwagi, K.; Yoshino, K. Identification of Irrigated Olive Growing Farms Using Remote Sensing Techniques. Euro-Mediterr. J. Environ. Integr. 2016, 1, 3. [Google Scholar] [CrossRef]
- Hatfield, J.L.; Boote, K.J.; Kimball, B.A.; Ziska, L.H.; Izaurralde, R.C.; Ort, D.; Thomson, A.M.; Wolfe, D. Climate Impacts on Agriculture: Implications for Crop Production. Agron. J. 2011, 103, 351–370. [Google Scholar] [CrossRef]
- Wing, I.S.; De Cian, E.; Mistry, M.N. Global Vulnerability of Crop Yields to Climate Change. J. Environ. Econ. Manag. 2021, 109, 102462. [Google Scholar] [CrossRef]
- Montgomery, D.R. Soil Erosion and Agricultural Sustainability. Proc. Natl. Acad. Sci. USA 2007, 104, 13268–13272. [Google Scholar] [CrossRef] [PubMed]
- Gregory, P.J.; Johnson, S.N.; Newton, A.C.; Ingram, J.S.I. Integrating Pests and Pathogens into the Climate Change/Food Security Debate. J. Exp. Bot. 2009, 60, 2827–2838. [Google Scholar] [CrossRef] [PubMed]
- Hooper, D.U.; Adair, E.C.; Cardinale, B.J.; Byrnes, J.E.K.; Hungate, B.A.; Matulich, K.L.; Gonzalez, A.; Duffy, J.E.; Gamfeldt, L.; O’Connor, M.I. A Global Synthesis Reveals Biodiversity Loss as a Major Driver of Ecosystem Change. Nature 2012, 486, 105–108. [Google Scholar] [CrossRef] [PubMed]
- Nicholls, R.J.; Cazenave, A. Sea-Level Rise and Its Impact on Coastal Zones. Science 2010, 328, 1517–1520. [Google Scholar] [CrossRef] [PubMed]
- Arab, S.T.; Noguchi, R.; Ahamed, T. Yield Loss Assessment of Grapes Using Composite Drought Index Derived from Landsat OLI and TIRS Datasets. Remote Sens. Appl. Soc. Environ. 2022, 26, 100727. [Google Scholar] [CrossRef]
- Savelli, E.; Rusca, M.; Cloke, H.; Di Baldassarre, G. Drought and Society: Scientific Progress, Blind Spots, and Future Prospects. WIREs Clim. Change 2022, 13, e761. [Google Scholar] [CrossRef] [PubMed]
- Zhang, C.; Kovacs, J.M. The Application of Small Unmanned Aerial Systems for Precision Agriculture: A Review. Precis. Agric. 2012, 13, 693–712. [Google Scholar] [CrossRef]
- Lan, Y.; Thomson, S.J.; Huang, Y.; Hoffmann, W.C.; Zhang, H. Current Status and Future Directions of Precision Aerial Application for Site-Specific Crop Management in the USA. Comput. Electron. Agric. 2010, 74, 34–38. [Google Scholar] [CrossRef]
- Toth, C.; Jóźków, G. Remote Sensing Platforms and Sensors: A Survey. ISPRS J. Photogramm. Remote Sens. 2016, 115, 22–36. [Google Scholar] [CrossRef]
- Wang, D.; Shao, Q.; Yue, H. Surveying Wild Animals from Satellites, Manned Aircraft and Unmanned Aerial Systems (UASs): A Review. Remote Sens. 2019, 11, 1308. [Google Scholar] [CrossRef]
- Guo, H.; Goodchild, M.F.; Annoni, A. (Eds.) Manual of Digital Earth; Springer: Singapore, 2020; ISBN 978-981-329-914-6. [Google Scholar]
- Triantafyllou, A.; Sarigiannidis, P.; Bibi, S. Precision Agriculture: A Remote Sensing Monitoring System Architecture. Information 2019, 10, 348. [Google Scholar] [CrossRef]
- Szewczak, K.; Łoś, H.; Pudełko, R.; Doroszewski, A.; Gluba, Ł.; Łukowski, M.; Rafalska-Przysucha, A.; Słomiński, J.; Usowicz, B. Agricultural Drought Monitoring by MODIS Potential Evapotranspiration Remote Sensing Data Application. Remote Sens. 2020, 12, 3411. [Google Scholar] [CrossRef]
- Mullapudi, A.; Vibhute, A.D.; Mali, S.; Patil, C.H. A Review of Agricultural Drought Assessment with Remote Sensing Data: Methods, Issues, Challenges and Opportunities. Appl. Geomat. 2023, 15, 1–13. [Google Scholar] [CrossRef]
- Qin, Q.; Wu, Z.; Zhang, T.; Sagan, V.; Zhang, Z.; Zhang, Y.; Zhang, C.; Ren, H.; Sun, Y.; Xu, W.; et al. Optical and Thermal Remote Sensing for Monitoring Agricultural Drought. Remote Sens. 2021, 13, 5092. [Google Scholar] [CrossRef]
- Dikici, M. Drought Analysis for the Seyhan Basin with Vegetation Indices and Comparison with Meteorological Different Indices. Sustainability 2022, 14, 4464. [Google Scholar] [CrossRef]
- Page, M.J.; McKenzie, J.E.; Bossuyt, P.M.; Boutron, I.; Hoffmann, T.C.; Mulrow, C.D.; Shamseer, L.; Tetzlaff, J.M.; Akl, E.A.; Brennan, S.E.; et al. The PRISMA 2020 Statement: An Updated Guideline for Reporting Systematic Reviews. BMJ 2021, 372, n71. [Google Scholar] [CrossRef] [PubMed]
- Moher, D.; Liberati, A.; Tetzlaff, J.; Altman, D.G.; The PRISMA Group. Preferred Reporting Items for Systematic Reviews and Meta-Analyses: The PRISMA Statement. BMJ 2009, 339, b2535. [Google Scholar] [CrossRef]
- Amri, R.; Zribi, M.; Lili-Chabaane, Z.; Szczypta, C.; Calvet, J.C.; Boulet, G. FAO-56 Dual Model Combined with Multi-Sensor Remote Sensing for Regional Evapotranspiration Estimations. Remote Sens. 2014, 6, 5387–5406. [Google Scholar] [CrossRef]
- Mendes, M.P.; Matias, M.; Gomes, R.C.; Falcão, A.P. Delimitation of Low Topsoil Moisture Content Areas in a Vineyard Using Remote Sensing Imagery (Sentinel-1 and Sentinel-2) in a Mediterranean-Climate Region. Soil Water Res. 2021, 16, 85–94. [Google Scholar] [CrossRef]
- Bretreger, D.; Yeo, I.-Y.; Hancock, G. Quantifying Irrigation Water Use with Remote Sensing: Soil Water Deficit Modelling with Uncertain Soil Parameters. Agric. Water Manag. 2022, 260, 107299. [Google Scholar] [CrossRef]
- Awada, H.; Di Prima, S.; Sirca, C.; Giadrossich, F.; Marras, S.; Spano, D.; Pirastru, M. A Remote Sensing and Modeling Integrated Approach for Constructing Continuous Time Series of Daily Actual Evapotranspiration. Agric. Water Manag. 2022, 260, 107320. [Google Scholar] [CrossRef]
- Tunc, E.; Tsegai, A.T.; Çelik, S. Analysis of Spatial-Temporal Changes of Agricultural Land Use during the Last Three Decades in the Araban District of Turkey Using Remote Sensing. Geomat. Environ. Eng. 2021, 15, 111–123. [Google Scholar] [CrossRef]
- Kharrou, M.; Simonneaux, V.; Er-Raki, S.; Le Page, M.; Khabba, S.; Chehbouni, A. Assessing Irrigation Water Use with Remote Sensing-Based Soil Water Balance at an Irrigation Scheme Level in a Semi-Arid Region of Morocco. Remote Sens. 2021, 13, 1133. [Google Scholar] [CrossRef]
- Pieri, M.; Cantini, C.; Giovannelli, A.; Maselli, F.; Chiesi, M.; Battista, P.; Fibbi, L.; Gardin, L.; Rapi, B.; Romani, M.; et al. Estimation of Actual Evapotranspiration in Fragmented Mediterranean Areas by the Spatio-Temporal Fusion of Ndvi Data. IEEE J. Sel. Top. Appl. Earth Obs. Remote Sens. 2019, 12, 5108–5117. [Google Scholar] [CrossRef]
- Bretreger, D.; Yeo, I.-Y.; Quijano, J.; Awad, J.; Hancock, G.; Willgoose, G. Monitoring Irrigation Water Use over Paddock Scales Using Climate Data and Landsat Observations. Agric. Water Manag. 2019, 221, 175–191. [Google Scholar] [CrossRef]
- Häusler, M.; Conceição, N.; Tezza, L.; Sánchez, J.M.; Campagnolo, M.L.; Häusler, A.J.; Silva, J.M.N.; Warneke, T.; Heygster, G.; Ferreira, M.I. Estimation and Partitioning of Actual Daily Evapotranspiration at an Intensive Olive Grove Using the STSEB Model Based on Remote Sensing. Agric. Water Manag. 2018, 201, 188–198. [Google Scholar] [CrossRef]
- Pôças, I.; Paço, T.A.; Paredes, P.; Cunha, M.; Pereira, L.S. Estimation of Actual Crop Coefficients Using Remotely Sensed Vegetation Indices and Soil Water Balance Modelled Data. Remote Sens. 2015, 7, 2373–2400. [Google Scholar] [CrossRef]
- Ortega-Farías, S.; Ortega-Salazar, S.; Aguilar, R.; De La Fuente, D.; Fuentes, F. Evaluation of a Model to Estimate Net Radiation over a Drip-Irrigated Olive Orchard Using Landsat Satellite Images. Acta Hortic. 2014, 1057, 309–314. [Google Scholar] [CrossRef]
- PÔças, I.; Paço, T.A.; Cunha, M.; Andrade, J.A.; Silvestre, J.; Sousa, A.; Santos, F.L.; Pereira, L.S.; Allen, R.G. Satellite-Based Evapotranspiration of a Super-Intensive Olive Orchard: Application of METRIC Algorithms. Biosyst. Eng. 2014, 128, 69–81. [Google Scholar] [CrossRef]
- Mateos, L.; González-Dugo, M.; Testi, L.; Villalobos, F. Monitoring Evapotranspiration of Irrigated Crops Using Crop Coefficients Derived from Time Series of Satellite Images. I. Method Validation. Agric. Water Manag. 2013, 125, 81–91. [Google Scholar] [CrossRef]
- Johnson, L.; Trout, T. Satellite NDVI Assisted Monitoring of Vegetable Crop Evapotranspiration in California’s San Joaquin Valley. Remote Sens. 2012, 4, 439–455. [Google Scholar] [CrossRef]
- Consoli, S.; Barbagallo, S. Estimating Water Requirements of an Irrigated Mediterranean Vineyard Using a Satellite-Based Approach. J. Irrig. Drain. Eng. 2012, 138, 896–904. [Google Scholar] [CrossRef]
- Sánchez, N.; Martínez-Fernández, J.; Rodríguez-Ruiz, M.; Torres, E.; Calera, A. A Simulation of Soil Water Content Based on Remote Sensing in a Semi-Arid Mediterranean Agricultural Landscape. Span. J. Agric. Res. 2012, 10, 521–531. [Google Scholar] [CrossRef]
- Carrasco-Benavides, M.; Ortega-Farías, S.; Lagos, L.O.; Kleissl, J.; Morales, L.; Poblete-Echeverría, C.; Allen, R.G. Crop Coefficients and Actual Evapotranspiration of a Drip-Irrigated Merlot Vineyard Using Multispectral Satellite Images. Irrig. Sci. 2012, 30, 485–497. [Google Scholar] [CrossRef]
- Campos, I.; Neale, C.; Calera, A.; Balbontín, C.; González-Piqueras, J. Assessing Satellite-Based Basal Crop Coefficients for Irrigated Grapes (Vitis vinifera L). Agric. Water Manag. 2010, 98, 45–54. [Google Scholar] [CrossRef]
- Gentile, A.; Zhang, G.; Pierce, L.; Ciraolo, G.; La Loggia, G. Analysis of the energetic flows through the sebal application to the assensment of the actual evapotraspiration in a napa valley vineyard California (USA). In Proceedings of the 12th National Agrometeorology Conference, Sassari, Italy, 15–17 June 2009. [Google Scholar] [CrossRef]
- Battista, P.; Chiesi, M.; Rapi, B.; Romani, M.; Cantini, C.; Giovannelli, A.; Cocozza, C.; Tognetti, R.; Maselli, F. Integration of Ground and Multi-Resolution Satellite Data for Predicting the Water Balance of a Mediterranean Two-Layer Agro-Ecosystem. Remote Sens. 2016, 8, 731. [Google Scholar] [CrossRef]
- Johnson, L.; Roczen, D.; Youkhana, S.; Nemani, R.; Bosch, D. Mapping Vineyard Leaf Area with Multispectral Satellite Imagery. Comput. Electron. Agric. 2003, 38, 33–44. [Google Scholar] [CrossRef]
- Alkassem, M.; Buis, S.; Coulouma, G.; Jacob, F.; Lagacherie, P.; Prévot, L. Estimating Soil Available Water Capacity within a Mediterranean Vineyard Watershed Using Satellite Imagery and Crop Model Inversion. Geoderma 2022, 425, 116081. [Google Scholar] [CrossRef]
- Carrasco-Benavides, M.; Ortega-Farías, S.; Gil, P.M.; Knopp, D.; Morales-Salinas, L.; Lagos, L.O.; de la Fuente, D.; López-Olivari, R.; Fuentes, S. Assessment of the Vineyard Water Footprint by Using Ancillary Data and EEFlux Satellite Images. Examples in the Chilean Central Zone. Sci. Total Environ. 2022, 811, 152452. [Google Scholar] [CrossRef] [PubMed]
- Kisekka, I.; Peddinti, S.; Kustas, W.; McElrone, A.; Bambach-Ortiz, N.; McKee, L.; Bastiaanssen, W. Spatial-Temporal Modeling of Root Zone Soil Moisture Dynamics in a Vineyard Using Machine Learning and Remote Sensing. Irrig. Sci. 2022, 40, 761–777. [Google Scholar] [CrossRef]
- D’Urso, G.; Bolognesi, S.; Kustas, W.; Knipper, K.; Anderson, M.; Alsina, M.; Hain, C.; Alfieri, J.; Prueger, J.; Gao, F.; et al. Determining Evapotranspiration by Using Combination Equation Models with Sentinel-2 Data and Comparison with Thermal-Based Energy Balance in a California Irrigated Vineyard. Remote Sens. 2021, 13, 3720. [Google Scholar] [CrossRef]
- Yildirim, T.; Zhou, Y.; Flynn, K.C.; Gowda, P.H.; Ma, S.; Moriasi, D.N. Evaluating the Sensitivity of Vegetation and Water Indices to Monitor Drought for Three Mediterranean Crops. Agron. J. 2021, 113, 123–134. [Google Scholar] [CrossRef]
- García-Gutiérrez, V.; Stöckle, C.; Gil, P.; Meza, F. Evaluation of Penman-Monteith Model Based on Sentinel-2 Data for the Estimation of Actual Evapotranspiration in Vineyards. Remote Sens. 2021, 13, 478. [Google Scholar] [CrossRef]
- Ortega-Salazar, S.; Ortega-Farías, S.; Kilic, A.; Allen, R. Performance of the METRIC Model for Mapping Energy Balance Components and Actual Evapotranspiration over a Superintensive Drip-Irrigated Olive Orchard. Agric. Water Manag. 2021, 251, 106861. [Google Scholar] [CrossRef]
- Knipper, K.R.; Kustas, W.P.; Anderson, M.C.; Nieto, H.; Alfieri, J.G.; Prueger, J.H.; Hain, C.R.; Gao, F.; McKee, L.G.; Alsina, M.M.; et al. Using High-Spatiotemporal Thermal Satellite ET Retrievals to Monitor Water Use over California Vineyards of Different Climate, Vine Variety and Trellis Design. Agric. Water Manag. 2020, 241, 106361. [Google Scholar] [CrossRef]
- Castelli, G.; Oliveira, L.A.A.; Abdelli, F.; Dhaou, H.; Bresci, E.; Ouessar, M. Effect of Traditional Check Dams (Jessour) on Soil and Olive Trees Water Status in Tunisia. Sci. Total Environ. 2019, 690, 226–236. [Google Scholar] [CrossRef]
- Fuentes-Peñailillo, F.; Ortega-Farías, S.; Acevedo-Opazo, C.; Fonseca-Luengo, D. Implementation of a Two-Source Model for Estimating the Spatial Variability of Olive Evapotranspiration Using Satellite Images and Ground-Based Climate Data. Water 2018, 10, 339. [Google Scholar] [CrossRef]
- Tao, S.; Zhang, X.; Feng, R.; Qi, W.; Wang, Y.; Shrestha, B. Retrieving Soil Moisture from Grape Growing Areas Using Multi-Feature and Stacking-Based Ensemble Learning Modeling. Comput. Electron. Agric. 2023, 204, 107537. [Google Scholar] [CrossRef]
- Knipper, K.; Yang, Y.; Anderson, M.; Bambach, N.; Kustas, W.; McElrone, A.; Gao, F.; Alsina, M.M. Decreased Latency in Landsat-Derived Land Surface Temperature Products: A Case for near-Real-Time Evapotranspiration Estimation in California. Agric. Water Manag. 2023, 283, 108316. [Google Scholar] [CrossRef]
- Alshammari, H.H.; Altaieb, M.O.; Boukrara, A.; Gasmi, K.; A.elmoniem, M. Expansion of the Olive Crop Based on Modeling Climatic Variables Using Geographic Information System (GIS) in Aljouf Region KSA. Comput. Electron. Agric. 2022, 202, 107280. [Google Scholar] [CrossRef]
- Ohana-Levi, N.; Gao, F.; Knipper, K.; Kustas, W.; Anderson, M.; Alsina, M.; Sanchez, L.; Karnieli, A. Time-Series Clustering of Remote Sensing Retrievals for Defining Management Zones in a Vineyard. Irrig. Sci. 2022, 40, 801–815. [Google Scholar] [CrossRef]
- Paul, M.; Rajib, A.; Negahban-Azar, M.; Shirmohammadi, A.; Srivastava, P. Improved Agricultural Water Management in Data-Scarce Semi-Arid Watersheds: Value of Integrating Remotely Sensed Leaf Area Index in Hydrological Modeling. Sci. Total Environ. 2021, 791, 148177. [Google Scholar] [CrossRef] [PubMed]
- Carreño-Conde, F.; Sipols, A.E.; Simón, C.; Mostaza-Colado, D. A Forecast Model Applied to Monitor Crops Dynamics Using Vegetation Indices (NDVI). Appl. Sci. 2021, 11, 1859. [Google Scholar] [CrossRef]
- Moumen, Z.; Elhassnaoui, I.; Khaddi, W.; Wahba, M.A.S.; Lahrach, A. Assessment of Deficit Irrigation Efficiency. Case Study: Middle Sebou and Innaouene Downstream. Open Agric. 2021, 6, 102–114. [Google Scholar] [CrossRef]
- Wilson, T.G.; Kustas, W.P.; Alfieri, J.G.; Anderson, M.C.; Gao, F.; Prueger, J.H.; McKee, L.G.; Alsina, M.M.; Sanchez, L.A.; Alstad, K.P. Relationships between Soil Water Content, Evapotranspiration, and Irrigation Measurements in a California Drip-Irrigated Pinot Noir Vineyard. Agric. Water Manag. 2020, 237, 106186. [Google Scholar] [CrossRef]
- Ohana-Levi, N.; Knipper, K.; Kustas, W.P.; Anderson, M.C.; Netzer, Y.; Gao, F.; Alsina, M.M.; Sanchez, L.A.; Karnieli, A. Using Satellite Thermal-Based Evapotranspiration Time Series for Defining Management Zones and Spatial Association to Local Attributes in a Vineyard. Remote Sens. 2020, 12, 2436. [Google Scholar] [CrossRef]
- Knipper, K.R.; Kustas, W.P.; Anderson, M.C.; Alfieri, J.G.; Prueger, J.H.; Hain, C.R.; Gao, F.; Yang, Y.; McKee, L.G.; Nieto, H.; et al. Evapotranspiration Estimates Derived Using Thermal-Based Satellite Remote Sensing and Data Fusion for Irrigation Management in California Vineyards. Irrig. Sci. 2019, 37, 431–449. [Google Scholar] [CrossRef]
- Autovino, D.; Minacapilli, M.; Provenzano, G. Modelling Bulk Surface Resistance by MODIS Data and Assessment of MOD16A2 Evapotranspiration Product in an Irrigation District of Southern Italy. Agric. Water Manag. 2016, 167, 86–94. [Google Scholar] [CrossRef]
- Hoedjes, J.C.B.; Chehbouni, A.; Jacob, F.; Ezzahar, J.; Boulet, G. Deriving Daily Evapotranspiration from Remotely Sensed Instantaneous Evaporative Fraction over Olive Orchard in Semi-Arid Morocco. J. Hydrol. 2008, 354, 53–64. [Google Scholar] [CrossRef]
- Semmens, K.; Anderson, M.; Kustas, W.; Gao, F.; Alfieri, J.; McKee, L.; Prueger, J.; Hain, C.; Cammalleri, C.; Yang, Y.; et al. Monitoring Daily Evapotranspiration over Two California Vineyards Using Landsat 8 in a Multi-Sensor Data Fusion Approach. Remote Sens. Environ. 2016, 185, 155–170. [Google Scholar] [CrossRef]
- Potopová, V.; Trnka, M.; Hamouz, P.; Soukup, J.; Castravet, T. Statistical Modelling of Drought-Related Yield Losses Using Soil Moisture-Vegetation Remote Sensing and Multiscalar Indices in the South-Eastern Europe. Agric. Water Manag. 2020, 236, 106168. [Google Scholar] [CrossRef]
- Petropoulos, G.P.; Ireland, G.; Cass, A.; Srivastava, P.K. Performance Assessment of the SEVIRI Evapotranspiration Operational Product: Results over Diverse Mediterranean Ecosystems. IEEE Sensors J. 2015, 15, 3412–3423. [Google Scholar] [CrossRef]
- Arab, S.T.; Ahamed, T. Near-Real-Time Drought Monitoring and Assessment for Vineyard Production on a Regional Scale with Standard Precipitation and Vegetation Indices Using Landsat and CHIRPS Datasets. Asia-Pac. J. Reg. Sci. 2023, 7, 591–614. [Google Scholar] [CrossRef]
- Bambach, N.; Kustas, W.; Alfieri, J.; Gao, F.; Prueger, J.; Hipps, L.; McKee, L.; Castro, S.J.; Alsina, M.M.; McElrone, A.J. Inter-Annual Variability of Land Surface Fluxes across Vineyards: The Role of Climate, Phenology, and Irrigation Management. Irrig. Sci. 2022, 40, 463–480. [Google Scholar] [CrossRef] [PubMed]
- Doherty, C.T.; Johnson, L.F.; Volk, J.; Mauter, M.S.; Bambach, N.; McElrone, A.J.; Alfieri, J.G.; Hipps, L.E.; Prueger, J.H.; Castro, S.J.; et al. Effects of Meteorological and Land Surface Modeling Uncertainty on Errors in Winegrape ET Calculated with SIMS. Irrig. Sci. 2022, 40, 515–530. [Google Scholar] [CrossRef] [PubMed]
- Kang, Y.; Gao, F.; Anderson, M.; Kustas, W.; Nieto, H.; Knipper, K.; Yang, Y.; White, W.; Alfieri, J.; Torres-Rua, A.; et al. Evaluation of Satellite Leaf Area Index in California Vineyards for Improving Water Use Estimation. Irrig. Sci. 2022, 40, 531–551. [Google Scholar] [CrossRef]
- Reyes Rojas, L.A.; Moletto-Lobos, I.; Corradini, F.; Mattar, C.; Fuster, R.; Escobar-Avaria, C. Determining Actual Evapotranspiration Based on Machine Learning and Sinusoidal Approaches Applied to Thermal High-Resolution Remote Sensing Imagery in a Semi-Arid Ecosystem. Remote Sens. 2021, 13, 4105. [Google Scholar] [CrossRef]
- Borgogno-Mondino, E.; Novello, V.; Lessio, A.; Tarricone, L.; De Palma, L. Intra-Vineyard Variability Description through Satellite-Derived Spectral Indices as Related to Soil and Vine Water Status. Acta Hortic. 2018, 1197, 59–68. [Google Scholar] [CrossRef]
- Borgogno-Mondino, E.; Novello, V.; Lessioa, A.; de Palma, L. Describing the Spatio-Temporal Variability of Vines and Soil by Satellite-Based Spectral Indices: A Case Study in Apulia (South Italy). Int. J. Appl. Earth Obs. Geoinf. 2018, 68, 42–50. [Google Scholar] [CrossRef]
- Vanino, S.; Pulighe, G.; Nino, P.; de Michele, C.; Bolognesi, S.F.; D’Urso, G. Estimation of Evapotranspiration and Crop Coefficients of Tendone Vineyards Using Multi-Sensor Remote Sensing Data in a Mediterranean Environment. Remote Sens. 2015, 7, 14708–14730. [Google Scholar] [CrossRef]
- Faraslis, I.; Dalezios, N.; Alpanakis, N.; Tziatzios, G.; Spiliotopoulos, M.; Sakellariou, S.; Sidiropoulos, P.; Dercas, N.; Domínguez, A.; Martínez-López, J.; et al. Remotely Sensed Agroclimatic Classification and Zoning in Water-Limited Mediterranean Areas towards Sustainable Agriculture. Remote Sens. 2023, 15, 5720. [Google Scholar] [CrossRef]
- Amri, R.; Zribi, M.; Lili-Chabaane, Z.; Duchemin, B.; Gruhier, C.; Chehbouni, A. Analysis of Vegetation Behavior in a North African Semi-Arid Region, Using SPOT-VEGETATION NDVI Data. Remote Sens. 2011, 3, 2568–2590. [Google Scholar] [CrossRef]
- Navarro, R.; Wirkus, L.; Dubovyk, O. Spatio-Temporal Assessment of Olive Orchard Intensification in the Saiss Plain (Morocco) Using k-Means and High-Resolution Satellite Data. Remote Sens. 2023, 15, 50. [Google Scholar] [CrossRef]
- Abubakar, M.A.; Chanzy, A.; Fabrice, F.; Courault, D. Characterisation of Grapevine Canopy Leaf Area and Inter-Row Management Using Sentinel-2 Time Series. OENO One 2023, 57. [Google Scholar] [CrossRef]
- Battista, P.; Bellini, E.; Chiesi, M.; Costafreda-Aumedes, S.; Fibbi, L.; Leolini, L.; Moriondo, M.; Rapi, B.; Rossi, R.; Sabatini, F.; et al. Estimating the Effect of Water Shortage on Olive Trees by the Combination of Meteorological and Sentinel-2 Data. European J. Remote Sens. 2023, 56, 2194553. [Google Scholar] [CrossRef]
- Elfarkh, J.; Johansen, K.; El Hajj, M.M.; Almashharawi, S.K.; McCabe, M.F. Evapotranspiration, Gross Primary Productivity and Water Use Efficiency over a High-Density Olive Orchard Using Ground and Satellite Based Data. Agric. Water Manag. 2023, 287, 108423. [Google Scholar] [CrossRef]
- Lopez-Fornieles, E.; Brunel, G.; Devaux, N.; Roger, J.-M.; Tisseyre, B. Is It Possible to Assess Heatwave Impact on Grapevines at the Regional Level with Time Series of Satellite Images? Agronomy 2022, 12, 563. [Google Scholar] [CrossRef]
- Kourgialas, N.N.; Hliaoutakis, A.; Argyriou, A.V.; Morianou, G.; Voulgarakis, A.E.; Kokinou, E.; Daliakopoulos, I.N.; Kalderis, D.; Tzerakis, K.; Psarras, G.; et al. A Web-Based GIS Platform Supporting Innovative Irrigation Management Techniques at Farm-Scale for the Mediterranean Island of Crete. Sci. Total Environ. 2022, 842, 156918. [Google Scholar] [CrossRef]
- Sghaier, A.; Dhaou, H.; Jarray, L.; Abaab, Z.; Sekrafi, A.; Ouessar, M. Assessment of Drought Stress in Arid Olive Groves Using HidroMORE Model. J. Agric. Eng. 2022, 53. [Google Scholar] [CrossRef]
- Bhattarai, N.; D’Urso, G.; Kustas, W.P.; Bambach-Ortiz, N.; Anderson, M.; McElrone, A.J.; Knipper, K.R.; Gao, F.; Alsina, M.M.; Aboutalebi, M.; et al. Influence of Modeling Domain and Meteorological Forcing Data on Daily Evapotranspiration Estimates from a Shuttleworth–Wallace Model Using Sentinel-2 Surface Reflectance Data. Irrig. Sci. 2022, 40, 497–513. [Google Scholar] [CrossRef]
- Safre, A.L.S.; Nassar, A.; Torres-Rua, A.; Aboutalebi, M.; Saad, J.C.C.; Manzione, R.L.; de Castro Teixeira, A.H.; Prueger, J.H.; McKee, L.G.; Alfieri, J.G.; et al. Performance of Sentinel-2 SAFER ET Model for Daily and Seasonal Estimation of Grapevine Water Consumption. Irrig. Sci. 2022, 40, 635–654. [Google Scholar] [CrossRef]
- Pinel, E.L.; Duthoit, S.; Costard, A.D.; Rousseau, J.; Hourdel, J.; Vidal-Vigneron, M.; Cheret, V.; Clenet, H. Monitoring Vineyard Water Status Using Sentinel-2 Images: Qualitative Survey on Five Wine Estates in the South of France. OENO One 2021, 55, 115–127. [Google Scholar] [CrossRef]
- Darra, N.; Psomiadis, E.; Kasimati, A.; Anastasiou, A.; Anastasiou, E.; Fountas, S. Remote and Proximal Sensing-Derived Spectral Indices and Biophysical Variables for Spatial Variation Determination in Vineyards. Agronomy 2021, 11, 741. [Google Scholar] [CrossRef]
- Ramos, T.B.; Simionesei, L.; Oliveira, A.R.; Neves, R.; Darouich, H. Exploring the Use of Vegetation Indices for Validating Crop Transpiration Fluxes Computed with the MOHID-Land Model. Application to Vineyard. Agronomy 2021, 11, 1228. [Google Scholar] [CrossRef]
- Abdelmoula, H.; Kallel, A.; Roujean, J.-L.; Gastellu-Etchegorry, J.-P. Dynamic Retrieval of Olive Tree Properties Using Bayesian Model and Sentinel-2 Images. IEEE J. Sel. Top. Appl. Earth Obs. Remote Sens. 2021, 14, 9267–9286. [Google Scholar] [CrossRef]
- Laroche-Pinel, E.; Duthoit, S.; Albughdadi, M.; Costard, A.D.; Rousseau, J.; Chéret, V.; Clenet, H. Towards Vine Water Status Monitoring on a Large Scale Using Sentinel-2 Images. Remote Sens. 2021, 13, 1837. [Google Scholar] [CrossRef]
- Hafyani, M.E.; Essahlaoui, A.; Fung-Loy, K.; Hubbart, J.A.; Van Rompaey, A. Assessment of Agricultural Water Requirements for Semi-Arid Areas: A Case Study of the Boufakrane River Watershed (Morocco). Appl. Sci. 2021, 11, 10379. [Google Scholar] [CrossRef]
- Makhloufi, A.; Kallel, A.; Chaker, R.; Gastellu-Etchegorry, J.-P. Retrieval of Olive Tree Biophysical Properties from Sentinel-2 Time Series Based on Physical Modelling and Machine Learning Technique. Int. J. Remote Sens. 2021, 42, 8542–8571. [Google Scholar] [CrossRef]
- Laroche-Pinel, E.; Albughdadi, M.; Duthoit, S.; Chéret, V.; Rousseau, J.; Clenet, H. Understanding Vine Hyperspectral Signature through Different Irrigation Plans: A First Step to Monitor Vineyard Water Status. Remote Sens. 2021, 13, 536. [Google Scholar] [CrossRef]
- Aguirre-García, S.-D.; Aranda-Barranco, S.; Nieto, H.; Serrano-Ortiz, P.; Sánchez-Cañete, E.-P.; Guerrero-Rascado, J.-L. Modelling Actual Evapotranspiration Using a Two Source Energy Balance Model with Sentinel Imagery in Herbaceous-Free and Herbaceous-Cover Mediterranean Olive Orchards. Agric. For. Meterol. 2021, 311, 108692. [Google Scholar] [CrossRef]
- Bellvert, J.; Jofre-Ĉekalović, C.; Pelechá, A.; Mata, M.; Nieto, H. Feasibility of Using the Two-Source Energy Balance Model (TSEB) with Sentinel-2 and Sentinel-3 Images to Analyze the Spatio-Temporal Variability of Vine Water Status in a Vineyard. Remote Sens. 2020, 12, 2299. [Google Scholar] [CrossRef]
- Cogato, A.; Pagay, V.; Marinello, F.; Meggio, F.; Grace, P.; Migliorati, M.D.A. Assessing the Feasibility of Using Sentinel-2 Imagery to Quantify the Impact of Heatwaves on Irrigated Vineyards. Remote Sens. 2019, 11, 2869. [Google Scholar] [CrossRef]
- Vanella, D.; Consoli, S.; Continella, A.; Chinnici, G.; Milani, M.; Cirelli, G.; D’Amico, M.; Maesano, G.; Gentile, A.; La Spada, P.; et al. Environmental and Agro-Economic Sustainability of Olive Orchards Irrigated with Reclaimed Water under Deficit Irrigation. Sustainability 2023, 15, 15101. [Google Scholar] [CrossRef]
- Helman, D.; Bahat, I.; Netzer, Y.; Ben-Gal, A.; Alchanatis, V.; Peeters, A.; Cohen, Y. Using Time Series of High-Resolution Planet Satellite Images to Monitor Grapevine Stem Water Potential in Commercial Vineyards. Remote Sens. 2018, 10, 1615. [Google Scholar] [CrossRef]
- Huete, A.; Justice, C.; van Leeuwen, W. Algorithm Theoretical Basis Document. 1999. Available online: https://modis.gsfc.nasa.gov/data/atbd/atbd_mod13.pdf (accessed on 30 April 2024).
- Huete, A.; Didan, K.; Miura, T.; Rodriguez, E.P.; Gao, X.; Ferreira, L.G. Overview of the Radiometric and Biophysical Performance of the MODIS Vegetation Indices. Remote Sens. Environ. 2002, 83, 195–213. [Google Scholar] [CrossRef]
- Rouse, J.W.; Haas, R.H.; Deering, D.W.; Schell, J.A.; Harlan, J.C. Monitoring the Vernal Advancement and Retrogradation (Green Wave Effect) of Natural Vegetation. [Great Plains Corridor]; NASA: Washington, DC, USA, 1973. [Google Scholar]
- Gao, B. NDWI—A Normalized Difference Water Index for Remote Sensing of Vegetation Liquid Water from Space. Remote Sens. Environ. 1996, 58, 257–266. [Google Scholar] [CrossRef]
- Huete, A.R. A Soil-Adjusted Vegetation Index (SAVI). Remote Sens. Environ. 1988, 25, 295–309. [Google Scholar] [CrossRef]
- Kogan, F.N. Application of Vegetation Index and Brightness Temperature for Drought Detection. Adv. Space Res. 1995, 15, 91–100. [Google Scholar] [CrossRef]
- Bento, V.; Trigo, I.; Gouveia, C.; DaCamara, C. Contribution of Land Surface Temperature (TCI) to Vegetation Health Index: A Comparative Study Using Clear Sky and All-Weather Climate Data Records. Remote Sens. 2018, 10, 1324. [Google Scholar] [CrossRef]
- Kogan, F.N. Global Drought Watch from Space. Bull. Amer. Meteor. Soc. 1997, 78, 621–636. [Google Scholar] [CrossRef]
- Kamble, D.B.; Gautam, S.; Bisht, H.; Rawat, S.; Kundu, A. Drought Assessment for Kharif Rice Using Standardized Precipitation Index (SPI) and Vegetation Condition Index (VCI). J. Agrometeorol. 2019, 21, 182–187. [Google Scholar] [CrossRef]
- Fraga, H.; Molitor, D.; Leolini, L.; Santos, J.A. What Is the Impact of Heatwaves on European Viticulture? A Modelling Assessment. Appl. Sci. 2020, 10, 3030. [Google Scholar] [CrossRef]
- Brisson, N.; Gary, C.; Justes, E.; Roche, R.; Mary, B.; Ripoche, D.; Zimmer, D.; Sierra, J.; Bertuzzi, P.; Burger, P.; et al. An Overview of the Crop Model Stics. Eur. J. Agron. 2003, 18, 309–332. [Google Scholar] [CrossRef]
- OECD. Policies for the Future of Farming and Food in the European Union; OECD Agriculture and Food Policy Reviews; OECD: Paris, France, 2023; ISBN 978-92-64-36877-4. [Google Scholar]
Disclaimer/Publisher’s Note: The statements, opinions and data contained in all publications are solely those of the individual author(s) and contributor(s) and not of MDPI and/or the editor(s). MDPI and/or the editor(s) disclaim responsibility for any injury to people or property resulting from any ideas, methods, instructions or products referred to in the content. |
© 2024 by the authors. Licensee MDPI, Basel, Switzerland. This article is an open access article distributed under the terms and conditions of the Creative Commons Attribution (CC BY) license (https://creativecommons.org/licenses/by/4.0/).

