Abstract
Regions densely populated with archaeological monuments pose significant challenges for construction investors and archaeologists during the planning stages of major construction projects. Recognising the archaeological potential of these areas is crucial for planning effective rescue excavations, which have become a standard procedure in construction. This study explores the utility of non-invasive prospection techniques, including artefact field surveys, multispectral imaging, and magnetic surveys, in assessing the area chosen for the I/16 Slaný–Velvary road construction. We specifically focused on the contributions these methods make towards understanding the archaeological context of the proposed construction site. The findings from the magnetic survey were compared with the results of actual archaeological excavations. Through manual visual analysis and statistical spatial correlation, we assessed the effectiveness of the magnetic survey. The ability of magnetic survey to locate different types of archaeological objects proved to be dependent on various factors. The variability of the environmental setting, particularly pedological and geological conditions, is essential. However, the modern anthropogenic impact and the very nature of individual archaeological objects, especially their dimensions, also play an essential role.
1. Introduction
In the past, non-destructive archaeological methods were often considered a mere supplement to archaeological excavations. Over the last 20 years, these methods have crystallised into a stand-alone discipline, archaeological prospection, which uses a wide range of methods and resources. Thus, the claim that non-destructive prospection can reveal “little about a large area” is no longer valid. Archaeological prospection is particularly useful in rescue archaeology, which accounts for most of the archaeological fieldwork undertaken today. Tight schedules, limited human resources, and, not least, limited budgets are usually the main characteristics of these projects. Thus, archaeological prospection methods have become necessary in planning large-scale construction.
The estimation of the time required and the financial cost of archaeological excavation is usually the first reason for exploring the available sources (literature, historical maps, satellite imagery, lidar) and using non-destructive prospecting methods (aerial photography, surface collections, detector surveys). Combined with GIS analyses, these established approaches significantly increase the chances of appropriate construction work schedules and cost estimation for archaeological investigations. However, despite their undeniable advantages, the picture provided by these traditional methods is often limited and time-consuming. Particularly in the case of artefact field surveys, due to the changing seasonality and variations in the growing vegetation, it is usually impossible to systematically cover the entire project area. Thus, some of the areas remain unrecognised. As the rescue archaeological research is generally obliged to investigate the whole area of the future construction, these areas represent a potential risk both from the point of view of the investor and from the point of view of the protection of the archaeological and cultural heritage. In this respect, archaeogeophysical prospection offers considerable advantages. Particularly for large-scale construction projects in an open landscape, modern motorised magnetometry systems provide a rapid method of surveying large areas over a significant part of the year. However, how effective this method is and how reliable its results are remain unclear. In this paper, we present the results of geophysical measurements and compare the interpretation of the magnetic survey with the results of field excavations in a construction project on the I/16 Slaný–Velvary road (Figure 1). The aim is to understand the relevance of geophysical prospection and to determine its benefits and limitations for rescue archaeological research.
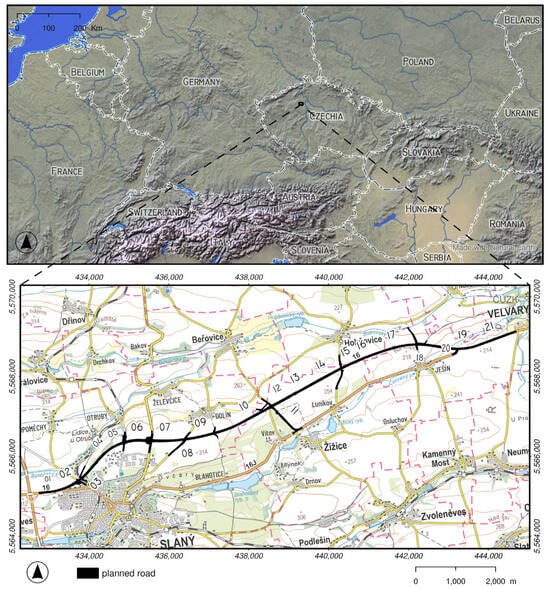
Figure 1.
Location of the project area of the planned road I/16 Slaný–Velvary in central Bohemia, approximately 30 km NW of Prague (bottom), and division of the construction into sectors (01–21) on ZTM100 (ČÚZK).
2. Geophysical Survey and Its Use in Rescue Archaeological Research
A geophysical survey is a vital tool in archaeological prospection. It is used in a wide range of research projects to provide supporting data for archaeological excavation and to address questions regarding the extent, nature, and preservation of past anthropogenic activity in the landscape [1,2,3,4]. Despite numerous surveys and scientific publications presenting the results of large-scale geophysical prospection across Europe, only a few studies have critically evaluated the contributions of geophysical prospection to the protection of archaeological cultural heritage [5]. Studies comparing the results of geophysical prospection and rescue archaeological investigations within commercial projects are exceptional [6,7]. Comprehensive evaluation of geophysical data compared to archaeological excavation within large construction projects is entirely absent.
A review of the published data shows that magnetometry has been the primary method used in the majority of projects. Since the late 1950s, magnetometry has been one of the most widely used geophysical methods for detecting and mapping archaeological sites [8,9]. Magnetic prospection is based on monitoring local changes in the Earth’s magnetic field. It maps inhomogeneities (magnetic anomalies) caused by varying proportions of ferromagnetic materials in the environment under study [10,11,12]. These inhomogeneities are almost always associated with the presence of subsurface structures. These structures can be of various types but are mainly of geological, pedological, or anthropogenic origin. Human activity has caused either the magnetisation of material or the accumulation of foreign material in the environment, creating an anomalous contrast in the magnetic data. This can then be interpreted in an archaeological context. We can locate all types of archaeological objects with a certain degree of certainty depending on the soil conditions and the state of preservation of the finds. The practical realisation of the expected results is highly dependent on the changing environmental conditions. The quality of the expected results can be predicted based on pedological and geological maps and modern anthropogenic influences. However, within large construction projects, especially linear infrastructures, conditions may vary locally, and the result of the measurements may have a different and unpredictable character [13,14]. This also applies to the survey of the future road I/16 Slaný–Velvary (Figure 1).
3. Environment of the Study Area
In terms of the geomorphological division of the Czech Republic, the route of the road I/16 Slaný–Velvary crosses through two geomorphological units—the Středolabská table (VIB-3) and the Pražská plateau (VA-2)—and within them, the sub-units Kladno table (VA-2B) and Řipská table (VIB-1B). The area of the northern part of the Kladno table, occupied by the Slanská tabula subdivision, includes only a short eastern section of the structure from the town of Slaný to the village of Vítov. The remaining road route falls within the southern part of the Řipská tabula—the Perucká tabula district [15,16]. The prevailing parts of the relief besides the construction have a tabular (plateau) character determined by the structure of the geological substrate. The difference between the highest and lowest altitudes is about 120 m above sea level (about 310 m above sea level in the plain area between the northern surroundings of Slaný and the section south of Dolín and 190 m above sea level in the valley of the Červený potok west of Velvary). Overall, the relief of the route and the broader surroundings can be characterised as not significantly elevation graded, with a gradual rise in the terrain towards the west. Only at the western edge of the bypass road near Slany does the surface slope more significantly towards the valley of the Byseňský potok (stream). The geological subsoil consists of clastic sediments of different grain size, composition, and age. During the Lower Turonian period, deposits with a significant proportion of carbonates (argillaceous limestones, siltstones, quartz limestones) were formed here. The cover is composed of eluvial, slope, fluvial deposits, and weathered sediments. The most common type of Quaternary cover here is sediments of aeolian origin—loess and weathered sands. In places, the strength of the loess soils is reflected in horizontal positions and lenses of fine silty sands [16]. The soil types represented here are chernozems, calcic leptosols, and cambisols (Figure 2).
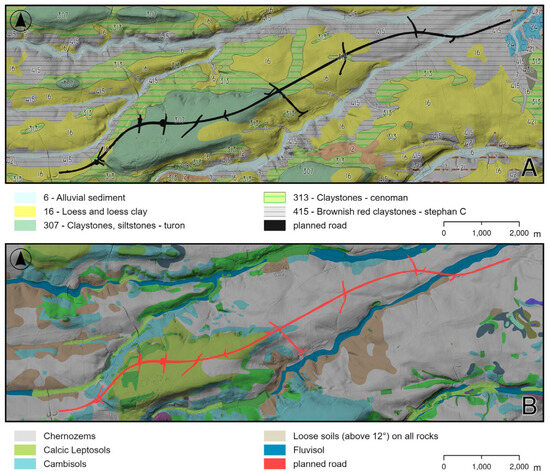
Figure 2.
Location of the planned road I/16 Slany-Velvary: (A) route on the geological map of the Czech Republic 1:50,000 and (B) route on the map of soil types according to BPEJ. Basemap: DMR5G, (ČÚZK, ČGS, VÚMOP).
4. Archaeological Investigation Design—Prediction Models and Prospection
The planned construction of the road I/16 from Slaný to Velvary had a length of 13.3 km. The total area of the permanent construction was 71.5 ha, and the road width was 30 to 40 m. For the sake of clarity, the route was divided into 21 sectors for construction purposes as part of the tender (Figure 1). Subsequent archaeological research has documented each of these sectors separately.
As part of the preparation for the archaeological excavation, an archive literature review was first carried out. The aim was to determine the archaeological potential based on the previously known archaeological sites in the vicinity of the project area (approximately 500 m on either side of the proposed route) [17]. It turned out that only two prehistoric sites were recorded in the area.
With the absence of information, it was decided to carry out a fieldwalking survey [18]. Surveys were carried out repeatedly along the entire route of the proposed road except for areas inaccessible due to agricultural crops and permanent vegetation.
Subsequently, at the request of the investor, the route of the future construction was subjected to a multispectral-geotechnical survey [19] and a geophysical (magnetic) survey, which were carried out between 2 and 14 January 2018 [20]. The magnetometry survey covered more than 80 hectares along the route. The survey did not only cover the polygon of the structure. Where it was possible, the survey area was extended by a 5–10 m wide strip on either side, which is useful for the better interpretation of structures located on or extending beyond the proposed route.
The magnetic survey was carried out using an LEA MAX fluxgate magnetometer (Eastern Atlas, Berlin, Germany) with ten probes FEREX CON 650 (Foerster, Reutlingen Germany) spaced 0.5 m apart. The instrument was used in ATV mode on all sectors and was towed by a quad bike. The measured data were recorded together with the position using the S-82 RTK GNSS instrument (South Instruments, Guangzhou, China).
The raw data were normalised using a median filter, and drift correction was applied. They were processed and interpolated (to a grid with a cell size of 0.25 m) in EAL D2 software (v1.0-190927, Eastern Atlas, Berlin, Germany). The output was the resulting map of the vertical gradient ΔZ of the Earth’s magnetic field (nT)—the magnetogram. Data interpretation, visualisation, and analysis were performed in ArcGIS Pro 3.2 (ESRI, Redlands, CA, USA).
5. Results of Prospections and Archaeological Excavation
The aim of the various prospection methods was to identify areas where the concentrations of archaeological situations could potentially pose risks during the construction planning process. This study primarily compared the geophysical data with the results of the archaeological excavations; therefore, in the following section, we mainly focus on the results of the magnetic survey, while the other methods are only briefly discussed.
Based on the results obtained, we identified sites with traces of past anthropogenic activities in the geophysical data. The surveyed areas contained several magnetic anomalies that can be interpreted as potential archaeological features based on their nature, measured values, and expert assessment. A total of 278 potential archaeological objects were identified.
The interpretation of several features could have been challenging due to the diverse geological subsoil. In addition, we identified several buried features whose fills had magnetic values that differed only slightly from their surroundings, increasing the potential for interpretation errors. Furthermore, the deep ploughing and post-depositional processes observed at several locations indicated significant disturbance to the archaeological structures and poor preservation. The preservation of subsurface features in situ is a crucial factor for the successful interpretation of the geophysical survey at archaeological sites. Subsequent excavations revealed the extent to which individual structures and situations were damaged or preserved.
The geophysical survey results were reasonably consistent with the subsequent archaeological investigation. In sectors 1 to 5 (0.3–2.9 km), the magnetic prospection only sporadically documented archaeological features, with some sectors being completely empty. The surface survey did not record any evidence of habitation in the area, and the follow-up survey during topsoil stripping confirmed the absence of any archaeological situations in the prospected area. Archaeologically positive situations were only revealed in sector 3, which was not prospected due to dense vegetation.
However, there was no significant change in the situation in sectors 6, 7, and 8 (2.9–4.5 km). The geophysical survey identified approximately 70 potential archaeological features, mostly circular and oval in shape with a diameter of approximately 1–2 m. As they were freely scattered in the area, their anthropogenic character was highly questionable. Subsequent archaeological monitoring during the excavation revealed that the area was empty. The magnetic survey revealed significant contamination of the area by small metal objects. This was also confirmed by the detector prospection, which documented a modern refuse dump that had been ploughed up in this location.
Between km 4.5 and 5.25 in sector 9, none of the studies [17,18] predicted significant archaeological situations. On the contrary, geophysical surveys here identified 35 and archaeological research documented 66 objects (Figure 3 and Figure 4). Notably, anomalies of a regular rectangular shape measuring approximately 2 × 5 m were later identified as graves of the Bylany culture from the Hallstatt period. Between km 4.7 and the beginning of sector 10, there were a total of 16 cremation graves, and 16 chamber graves spread across the flat hill.
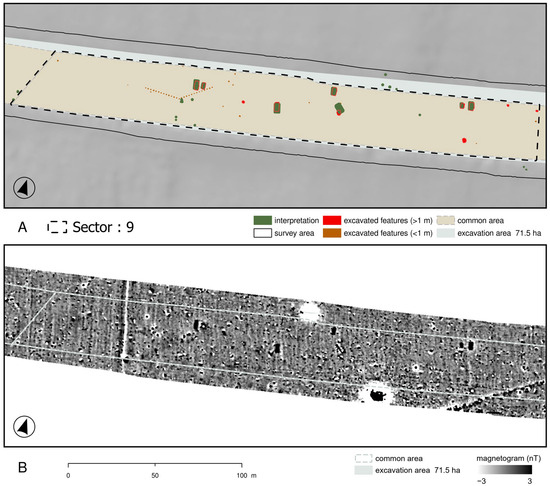
Figure 3.
Sector 09, polygon 09_A western part: (A) interpretation and results of archaeological research and (B) the magnetogram.
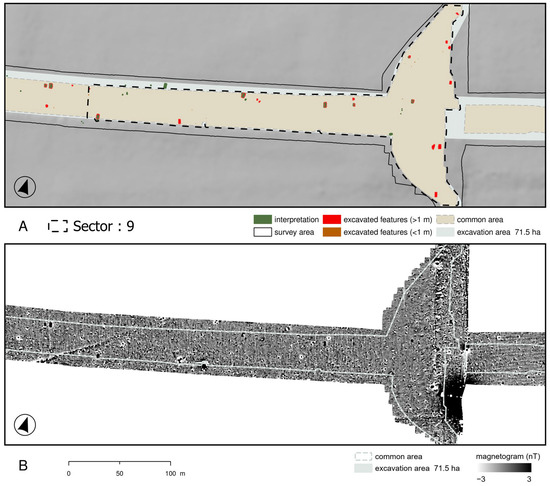
Figure 4.
Sector 09, polygon 09_A eastern part: (A) interpretation and results of archaeological research and (B) the magnetogram.
Numerous archaeological situations were also recorded in the following sectors. On the almost 2 km long sector 10 (5.25–7.0 km), several concentrations of settlement-like objects were recorded by geophysical survey (Figure 5). The existence of prehistoric settlements in this location was also presumed by archive literature research and fieldwalking survey. On the contrary, multispectral imaging did not predict a settlement activity here. Subsequent archaeological excavations documented the existence of more than a thousand archaeological situations (post-holes, hearths, ovens, production facilities, ditches, pithouses, road remains, graves, earthworks, and various pits of unspecified function). Chronologically, they fall within the Eneolithic pottery culture and the Middle Bronze Age barrow culture, and a very distinctive component on the site are objects from the Early and Late Bronze Age, the Hallstatt period, and the earlier Roman period.
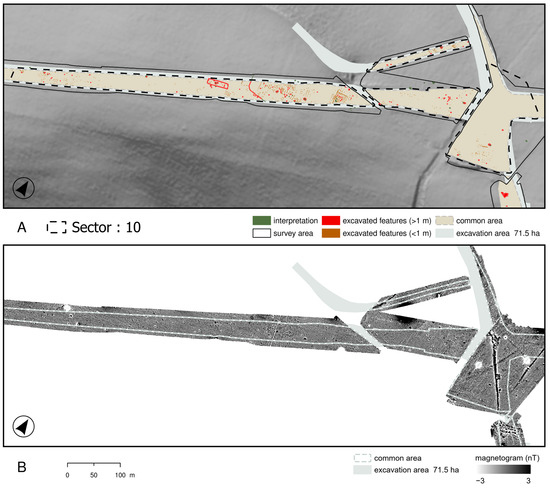
Figure 5.
Sector 10: (A) interpretation and results of archaeological research and (B) the magnetogram.
A significant settlement site was also found in sector 11 even though the preliminary literature research did not foresee evidence of settlement in this sector, and the results of the fieldwalking survey only suggested the possibility of the existence of isolated prehistoric remains. The geophysical prospection identified two significant settlement groups here, which were later confirmed by archaeological excavation (Figure 6). In addition to various settlement archaeological features, three large exploitation clay pits were detected in the area. The site was occupied during various phases of prehistory (Neolithic, Early and Late Bronze Age, Hallstatt period) and early medieval times.
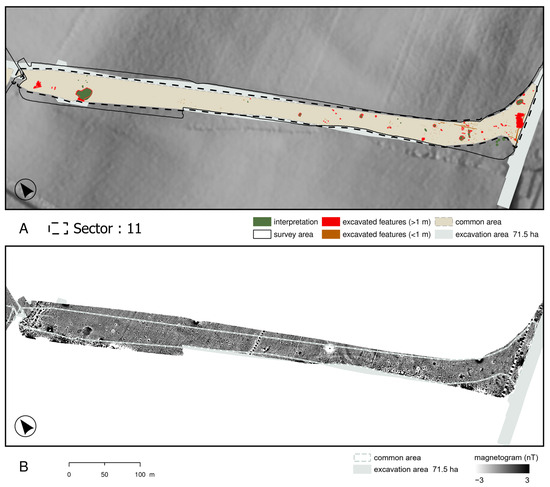
Figure 6.
Sector 11: (A) interpretation and results of archaeological research and (B) the magnetogram.
In the following sectors, sectors 12 to 15 (7.0–9.2 km), settlement activity appeared to decrease. The presence of significant archaeological components here was not suggested by literature research, fieldwalking survey, or geophysical survey. The latter documented here only a few questionable archaeological objects with no further specification apart from geological and recent structures (an abandoned field road, property boundaries, and a small amount of waste). The given findings proved to agree with the observations during the excavation when only three buried objects were documented, which could be dated to the Late Bronze Age, with minor remains of unspecified objects and layers of the undetermined prehistoric and medieval age.
Sector 16 (9.2–9.7 km) again proved rich in archaeological situations. In addition to the geophysical survey, which identified 27 settlement features here, the presence of archaeological situations in the sector was also suggested by preliminary literature research and fieldwalking survey, although only in the form of isolated components (Figure 7). Multispectral imaging had completely misjudged the situation at the site. While the survey report indicated a possible archaeological site at a very small spot, this location was outside of the excavated area and relatively far from the largest concentration of buried archaeological features. During the subsequent archaeological excavation, 275 archaeological features were identified and documented. The first significant component was composed predominantly of settlement features belonging to the Únětice culture of the Early Bronze Age. Overall, graves were much more represented than were settlement objects in the sector. The oldest component was represented by the burial of the bell beaker culture (55 graves), which form three groups close to each other in the area. The next component was a group of seven graves from the Únětice culture and seven burial pits from the La Tène period. The earliest evidence of anthropogenic activity on the site was small modern stone quarries (marlstone) [16].
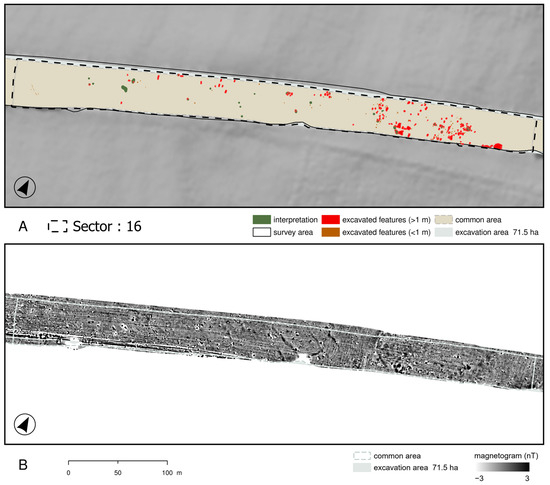
Figure 7.
Sector 16: (A) interpretation and results of archaeological research and (B) the magnetogram.
Evidence of past anthropogenic activity was also documented in sectors 17 and 18 (9.9–11 km). Geophysical surveys here revealed several concentrations of anomalies that could represent small, buried settlement features (Figure 8 and Figure 9). Possible archaeological components were already foreseen here by the primary literature research, and the results of surface collections also assumed sparse evidence of settlement features. The archaeological excavation confirmed these assumptions. Dozens of archaeological situations were investigated in the area, which indicated settlement activities, especially during the agricultural prehistoric and Hallstatt periods, mainly in the form of post-holes. Part of a large circular enclosure was also uncovered.
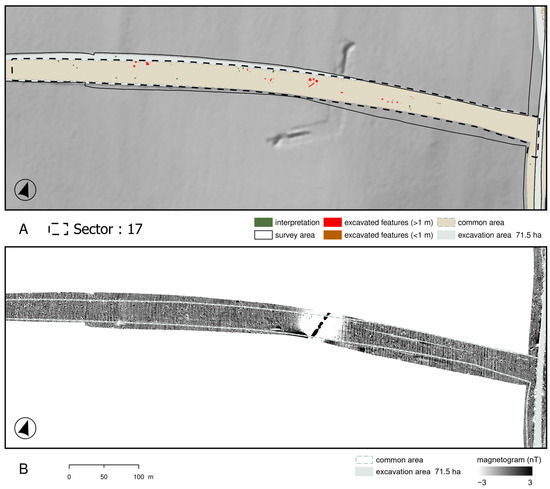
Figure 8.
Sector 17: (A) interpretation and results of archaeological research and the (B) magnetogram.
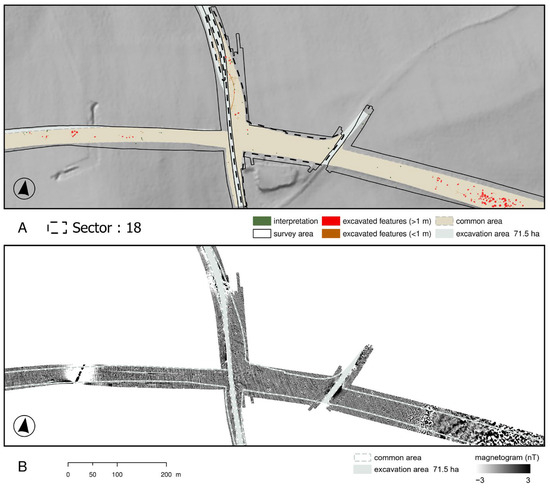
Figure 9.
Sector 18: (A) interpretation and results of the archaeological research and (B) the magnetogram.
The archaeological excavation on the left bank of the Červený potok in the final section, section 19 (11–12.1 km), revealed significant remains of the core of an agricultural settlement from the early Middle Ages. Several other objects could be dated to agricultural prehistory as well as to the Bronze Age. While the settlement at this site was assumed by the literature research and the fieldwalking survey, the geophysical survey identified only six magnetically positive anomalies, interpreted as potential settlement pits, in addition to the old channel (paleochannel) of the Červený potok. The reason for this was the magnetically significant geological subsoil, which did not allow for the identification of archaeological situations (Figure 10).
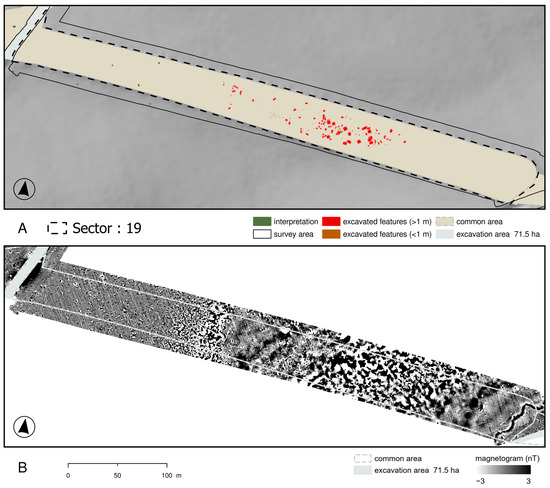
Figure 10.
Sector 19: (A) interpretation and results of the archaeological research and (B) the magnetogram.
It was not possible to identify any archaeological features by magnetic survey, even in the final sections, sections 20 and 21. The narrow strips along the existing road were heavily obstructed by modern utilities, which made it impossible to evaluate these areas. However, the subsequent archaeological excavation did not reveal any archaeological features here.
The archaeological excavation identified seven concentrations of archaeological features in the study area (Figure 11A). Based on the literature research, only two concentrations were expected in the area (Figure 12A). Each of the preliminary prospecting methods identified a different number of these concentrations with varying degrees of accuracy and detail (Table 1).
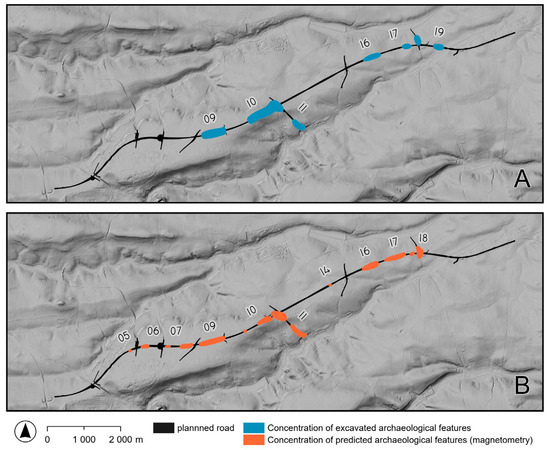
Figure 11.
Project area of the planned road I/16 Slaný–Velvary: (A) the concentrations of the archaeological features identified during the excavation and (B) the concentrations of the possible archaeological features predicted by magnetic prospection. Basemap DMR5G (ČÚZK).
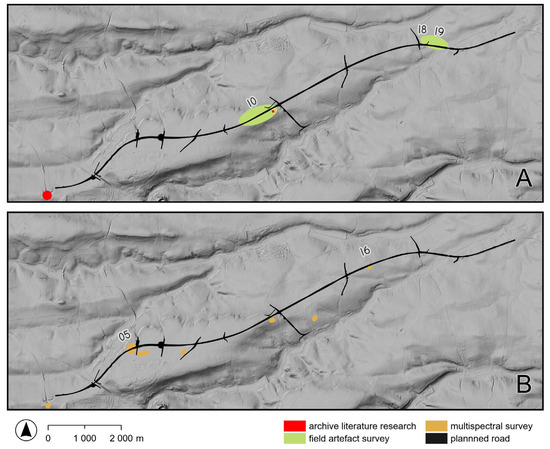
Figure 12.
Project area of the planned road I/16 Slaný–Velvary: (A) the sites identified by the archive literature research [17] and field artefact survey [18] and (B) the sites identified by multispectral survey [19].

Table 1.
Performance of the applied prediction methods.
The magnetic survey detected six concentrations (Figure 11B). However, it was not able to successfully identify archaeological features in sector 19 due to the prominent geological background. The fieldwalking survey indicated two concentrations and, with some degree of uncertainty, predicted the presence of three more (Figure 12A). The multispectral imaging method proved to be the least effective, as it predicted settlement in the vicinity of two sites with a high degree of uncertainty(Figure 12B). This is not surprising because for the successful application of the method, there are strict criteria for the condition of the surveyed area, the vegetation and climatic conditions, the selection of a suitable sensor (with appropriate spectral and spatial accuracy), and the evaluation of the acquired data (radiometric corrections, ground reference measurements, etc.) [21]. Thermovision combined with near infra-ed (NIR) and visible spectrum was chosen in the case of the multispectral survey. The flight altitude during the primary analysis data collection was 200 m while the flight speed was 140–170 km/h for overflight of areas under different temperatures and weather conditions during two days in September 2017 [19].
This evaluation of prediction performance was relatively simplistic. Except for the magnetic survey, none of the methods could detect individual archaeological features, only managing to identify areas where potential archaeological situations might exist. Each method comes with its inherent limitations. For instance, archival literature searches are limited by the extent of prior archaeological studies. While covering almost the entire area of the building footprint, Multispectral imaging identified several potential sites; however, these were not confirmed during subsequent rescue archaeological excavations—not a single site was verified. Consequently, the two sites identified near the archaeological sites seemed coincidental.
The field artefact survey was notably effective, suggesting that repeating the survey at different times of the year could further refine the identification of sites that were initially deemed questionable. However, neither the field artefact nor multispectral surveys provide insights into the intensity and nature of the site occupation. The magnetic survey’s ability to intricately reveal the extent and character of specific archaeological situations in the study area set it apart from the other methods. This distinction underscores the comparative effectiveness of the magnetic survey in archaeological research, especially at the level of individual objects.
6. A Method for the Evaluation of the Effectiveness of Magnetic Surveys
In general, it is very difficult to determine the effectiveness of geophysical surveys accurately. Effectiveness can thus be defined as the rate of success at which geophysical prospection predicts the presence of subsequently archaeologically excavated situations. The results of the archaeological excavation provide a reference layer (reality) that we can cross-reference with the interpretation of the magnetic prospection (prediction). Despite the interpretive nature of archaeological excavation and the fact that it is subjective [22], the results of the excavation must be considered as objective truth, at least in the context of our study. Archaeological excavation is destructive in nature and involves procedures that cannot be repeated. It introduces a number of complications associated with inconsistencies in excavation techniques and documentation. In contrast, a geophysical survey is non-destructive, allowing the entire process to be repeated and reconstructed again and again. The results of geophysical prospecting are objective in nature, and they acquire subjectivity only through a subsequent process of interpretation, in which anthropogenic features have to be identified and distinguished from natural structures.
The whole spectrum of activities related to the logistical planning of the construction, the implementation of earthworks, and the rescue of the archaeological and cultural heritage depends on the level of risk or the potential for archaeological situations to occur. The parameter that clearly expresses the “volume” of archaeology within the planned construction is the number of archaeological objects or their intensity. Other parameters are the area of the research, the cubic volume of soil to be moved during the excavation of the objects, or the number of days worked. The role of geophysical prospection is to detect the presence of archaeological situations in advance, which will allow us to define these parameters better. At the same time, geophysical prospecting will also help us to point out places where the occurrence of archaeological situations is expected to be minimal.
6.1. Limits of Analysis
The comparison of the interpretation of the geophysical prospection with the results of archaeological excavation presents several challenges. Besides the technical limitations of each method, in the case of geophysical methods, for example, the sensitivity of the instrument or the problems of data interpretation, and in the case of excavation, for example, the chosen method of excavation or its documentation, the evaluation itself is problematic. In fact, it is a comparison of two essentially different methods of identifying archaeological situations.
Geophysical prospection—in our case, magnetic survey—examines archaeological situations through the physical properties of the soil or deposits. Archaeological research, on the other hand, examines the visual and material properties of archaeological structures, observing characteristics such as changes in soil colour, grain size, compactness, composition and, above all, the presence of artefacts or remains of anthropogenic activities. In both cases, the identification of archaeological objects depends on several factors such as the pedological bedrock, the geological setting, the extent of the area surveyed, and the climatic conditions. In principle, there is no way to verify the accuracy of one method by the results of the other, and it is questionable whether the results of geophysical prospection can be verified by archaeological research at all [23,24].
A further limitation in the comparison of excavation and magnetic prospection results lies in the influence of spatial inaccuracies. Despite the widespread use of geodetic grade survey instruments, achieving absolutely accurate object location is still a challenge. Although errors at the beginning of an archaeological survey are only a few centimetres, they are compounded during subsequent processes such as scanning and digitalisation. A further complication in the comparison of results is the differences in conditions and ground conditions during geophysical survey and archaeological research. Finally, understanding the relationship between anomalies and their sources is also very important, as geophysical anomalies may not correspond to the shapes of excavated archaeological objects. All these factors lead to positional discrepancies, which can lead to misjudged comparisons.
6.2. Process for Evaluating the Effectiveness of Magnetic Surveys
Almost the entire area of the construction has been archaeologically investigated. As some areas were inaccessible at the time of the geophysical prospection, parts of some sections (about 15 ha) were not fully investigated. These are mainly areas under modern roads and areas of permanent vegetation (apple orchard at sector 3). The comparison was, therefore, made only within the area that was investigated by both methods (geophysical prospection and subsequent excavation). A so-called “common area” was created. This area (51.3 ha) represents 64% of the total area of the prospection (80 ha) or 72% of the area of the construction (71.5 ha)—the area of the research (Chart 1).
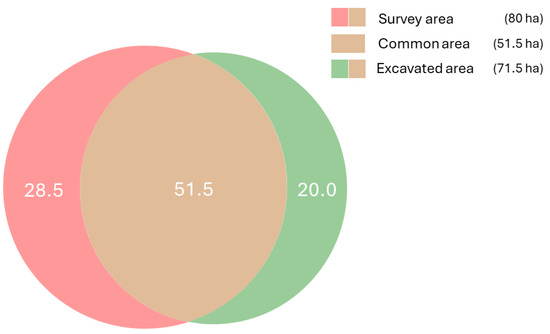
Chart 1.
Chart of common area as a result of the intersection of the survey and excavated area.
Interpretation of the magnetic prospection data was created directly in the GIS environment. Also, the plans of the archaeological research were scanned and converted into vector format, which allowed for their further analysis and processing. The individual layers were unified, and their attributes were optimised so that they were compatible and comparable with each other [25]. The initial dataset consisted of two groups of polygons. For the analysis, we worked with polygons of outlines of objects documented during excavation and polygons of interpreted anomalies from geophysical surveys. These were the 1999 archaeologically surveyed objects and 278 magnetic anomalies interpreted as potential archaeological features.
Only objects with a diameter greater than 1 m were included in the analyses. These were objects that could be expected to be detected by prospection due to the configuration of the used magnetometer and the rather complicated geological subsoil. We removed small features, mainly post-holes and smaller pits, from the overall dataset. Thus, from the original number of 1999 archaeologically excavated objects (the cumulative area of their floor plans occupied 2152 m2), 435 objects (the cumulative area of their floor plans occupied 1770 m2; Table 2) were included in the analyses. These represent up to 82% of the total area of the excavated objects (Chart 2).

Table 2.
Overview table of the analysed data sample in the common area.
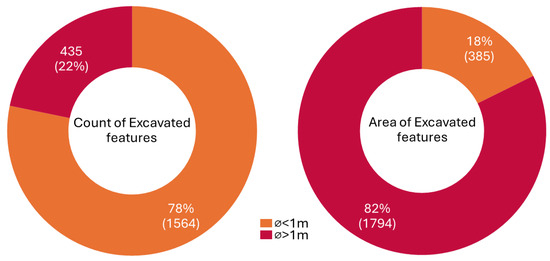
Chart 2.
Frequency (count) of objects by size and percentual representation of objects (area).
There were several studies conducted that relied on the subjective assessments of prospection success [6,26,27,28]. Our analytical procedures were inspired by a methodology originally used in a pilot study of decision-making in archaeological excavations in the UK [29] and subsequently in other projects [7,30]. In assessing the effectiveness of geophysical prospection, we used quality control techniques for the automatic classification of remote sensing data [31,32].
In general practice, there are several metrics for evaluation, but most of them rely on a “confusion matrix” (Figure 13), which records hits and misses. In the context of our study, the confusion matrix distinguished between the presence (positive class) and absence of archaeological situations (negative class) with the following categories:
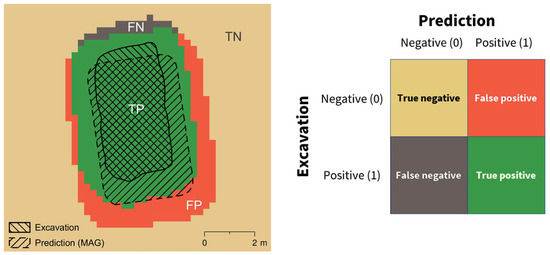
Figure 13.
Schematic representation of the concept of the confusion matrix in the context of this study.
True positive (TP): validated—number of cases correctly identified as containing archaeological features.
False positive (FP): number of cases that were incorrectly identified as containing archaeological features (false alarms).
True negative (TN): number of cases correctly identified as not containing archaeological features.
False negative (FN): number of cases incorrectly identified as not containing archaeological features (missed detections).
We applied two basic methodological approaches to evaluate the effectiveness of the magnetic survey: manual visual comparison and statistical spatial correlation.
6.3. Manual–Visual Comparison
Initially, we evaluated the effectiveness of the magnetic survey by directly correlating the vector layers of the polygons: the plan of the archaeologically documented objects and the interpretive map of the magnetic survey. For each documented archaeological feature, we searched within a one-meter radius for a potential anomaly that might indicate its presence. Each match was additionally verified manually. This is a qualitative and subjective assessment based on expert judgement carried out at the level of individual objects. This procedure can eliminate possible shape variations and positional inaccuracies, consider different climatic conditions during the survey and research, pedological and geological influences or differences in research methodology. The advantage is that this approach allows a detailed analysis of individual objects, correlation is done at the object/anomaly level, and it is possible to get an idea of which types of objects were recorded during geophysical prospecting and which were not.
6.4. Statistical Spatial Correlation
The method we chose is based on the principles of statistical spatial correlation. It is based on the comparison of a pair of data layers and the search for a correlation between the occurrence of an anomaly interpreted as a potential archaeological situation and an archaeologically excavated (confirmed) object.
Statistical spatial correlation is an objective analytical technique that provides a clear numerical value and reduces the degree of subjectivity. For large archaeological sites, it allows for the rapid processing of results. The procedure is standardised and reproducible, allowing for comparison with other case studies. However, the method oversimplifies complex relationships into a single numerical value, which can miss important nuances and produce misleading results.
To minimise the impact of possible spatial inaccuracies arising from the documentation of the archaeological research and the geophysical prospection, we enlarged the original vectors by one meter around the perimeter (buffer: envelope zone). In the next step, the polygon vectors were converted into raster form. This resulted in two binary rasters for each section, whose cells represent archaeological objects or interpretations (1). and blank areas (0). The cells of both binary rasters corresponded in size to the cell of the resulting magnetogram (0.25 × 0.25 m). By overlaying the two rasters, we created a basis for a confusion matrix (Figure 13) that contained 8,210,000 cells. Given that the distribution of categories in the models (1 versus 0) was significantly skewed, with archaeological sites comprising only 1 to 3% of the total area, it was crucial to select evaluation metrics that adequately reflected this imbalance. For such cases, it is recommended to use a statistical evaluation using the F1 score (Table 3), which is a harmonised average of the precision and recall values [32].

Table 3.
Formulas of the used metrics [32].
Precision illustrated what percentage of archaeological objects predicted by magnetic prospection were actually confirmed as archaeological objects. A high precision value meant that the majority of objects identified by magnetic prospecting were actually archaeological finds, indicating that the prospection method had a low rate of false reports.
Recall quantified the ability of magnetic prospection to detect all archaeological objects in a given area. It was the ratio of the area of correctly geophysical identified archaeological objects to the total area of excavated archaeological objects. A high recall indicated that the magnetic prospection was successful in identifying the majority of archaeological objects, indicating the good sensitivity of the method.
Achieving high precision in archaeological prospection means carefully identifying anomalies as potential archaeological features, ensuring that they are indeed genuine. Conversely, high recall means capturing a wide range of genuine archaeological features, even if this includes some false positives. Striking a balance between these metrics is essential for accurate analysis. Prioritising precision alone risks overlooking important features, while focusing on recall alone can lead to an overabundance of false positives, requiring additional resources for investigation. Optimising both precision and recall involves refining detection methods, adapting survey approaches and using expert knowledge to identify genuine archaeological features effectively.
7. Results and Discussion
The first stage of analysis involved a visual–manual correlation of the correspondence between the interpreted anomalies and the archaeologically documented objects. From the initial pair of vector polygon layers (with objects over 1 m in diameter), we created a group (layer) of objects containing geophysically recorded and subsequently archaeologically confirmed objects (80) and archaeological objects that were not geophysically recorded (355).
Despite the fact that only 80 out of 435 archaeological objects (18%) were detected by geophysical prospection, these objects occupied up to 42% of the area of the analysed archaeological objects (Table 4 and Table 5). When the areas of archaeological objects with a diameter of less than 1 m were included in the total set, the geophysical prospection successfully detected 34% of the total area of archaeological objects.

Table 4.
Overview of the input dataset of archaeologically excavated objects used in this study.

Table 5.
Basic descriptive statistics—manual comparison.
In magnetic prospection interpretation, the identification process revolves around magnetic anomalies rather than individual objects. Consequently, there is often a difference between the number of excavated objects and the interpreted anomalies. These anomalies might represent a single object or a cluster of multiple objects. Therefore, a more suitable method for evaluating effectiveness is to compare the percentage of the area covered by recorded objects or verified anomalies. This approach accounts for the potential clustering of objects within anomalies and provides a more comprehensive assessment of prospection outcomes.
It is evident from Table 1 and the preceding text that not all sections were suitable for comparative analysis. For this reason, we only selected those sections where concentrations of objects were detected by the magnetic survey and documented during the archaeological survey. In total, there were six sections (sections 9, 10, 11, 16, 17, 18).
The comparison of the individual sections shows that the magnetic survey followed the same trend as the archaeological survey. The magnetic prospection correctly predicted the extent of archaeology in most areas of the future building route (Chart 3). The manual comparison that takes place at the level of individual objects allowed us to investigate the reasons why some objects in the geophysical data were correctly or incorrectly identified. Detailed analysis revealed certain tendencies. Although the findings may not be statistically significant, it is evident that objects successfully predicted by prospection are larger and have greater depth. This observation is consistent with the expectation that magnetic prospection can identify primarily large objects (Table 5, Chart 4 and Chart 5).
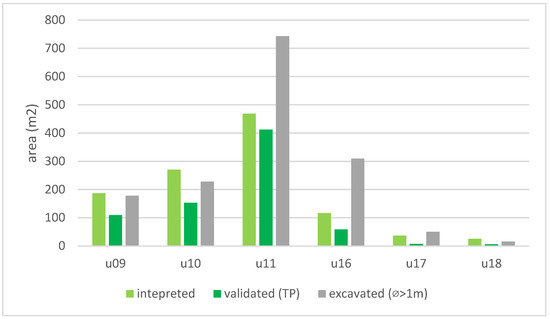
Chart 3.
Area comparison of the interpreted and excavated archaeological objects for the analysis sector.
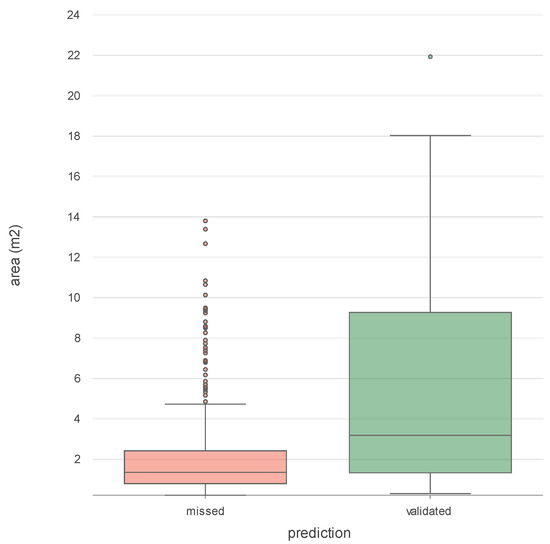
Chart 4.
Areas of archaeological objects and their presence/absence in the geophysical data.
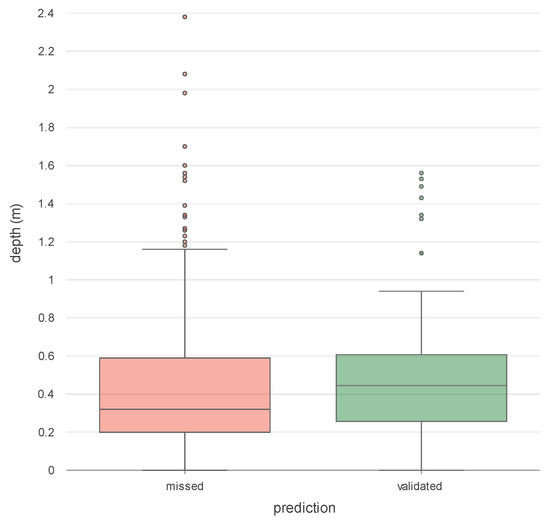
Chart 5.
Depths of archaeological objects and their presence/absence in the geophysical data.
We also observed that geophysical prospection identified different types of objects with different rates of success (Chart 6, Chart 7 and Chart 8, Table 6). High detection success rates were achieved by prospecting in the hut claypit and line categories. Prospection also achieved a surprisingly high success rate in the identification and interpretation of burial pits, mainly due to the correct identification of 11 chambered graves in sector 09.
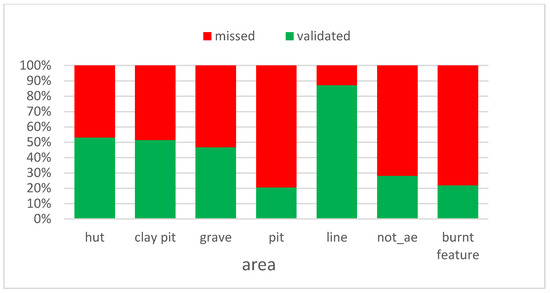
Chart 6.
Percentage comparison (area) of the excavated archaeological objects by function and detection success rate in geophysical prospection.
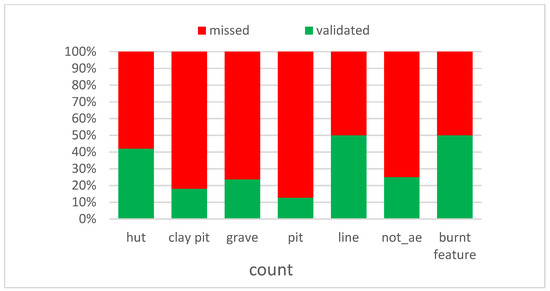
Chart 7.
Percentage comparison (count) of the excavated archaeological objects by function and detection success rate in geophysical prospection.
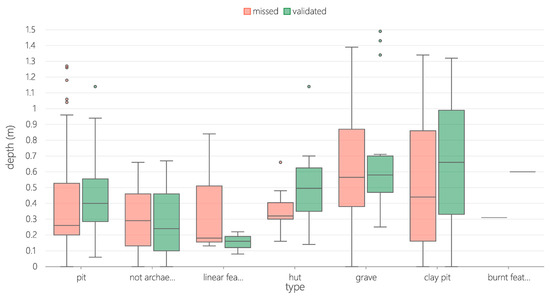
Chart 8.
Depths of archaeologically excavated objects categorised by their function and presence/absence in the geophysical data.

Table 6.
Overview of the excavated archaeological objects by their functions and presence/absence in the geophysical data.
In the next step, the metrics listed above were calculated for each analysed sector (Table 7). At first sight, it is obvious that the prospecting in sections 16, 17, and 18 was not very successful. In contrast, for sections 9, 10, and 11, the evaluation criteria indicated that the effectiveness of the magnetic survey was good. The reasons for this disproportion are not clear at first sight. The spectrum of objects is similar in both groups. Therefore, the possible reasons for this trend could be associated with natural factors. The main prerequisite for objects to be detected by magnetic prospection is their sufficient contrast to the surroundings. This contrast is the result of the different physical properties of the object fill and the environment in which the object is embedded. In addition to the anthropogenic activity itself, the differences in the physical properties of the deposits are directly influenced by the composition of the underlying geology and the nature of the soil layer. In order to verify the assumption of the influence of geological and pedological conditions on the detection of archaeological situations, we further divided the study area (common area) into polygons according to the geological map—Czech Republic 1:50,000 [33]—and soil type (according to the Bonitovaná půdně ekologická unit, BPEJ Hlavní půdní jednotka [34]). The aim was not only to reveal the factors influencing the detection success but also to increase the accuracy and reliability of geomagnetic data interpretation.

Table 7.
Summary of calculated metrics within the investigated sections. Spatial correlation of prospecting and survey results within a 1 m radius (analysed sections).
The entire route of the future road was divided into 63 polygons, with each polygon representing a geological or soil unit. Considering the results of the previous analyses, we only further investigated the polygons from sections 9, 10, 11, 16, 17 and 18. These were 12 polygons covering approximately 16 hectares. Within these polygons, we calculated precision (Chart 9), recall (Chart 10), and F1 scores (Chart 11). The percentage representation of each soil type and geological unit is shown in Chart 12.
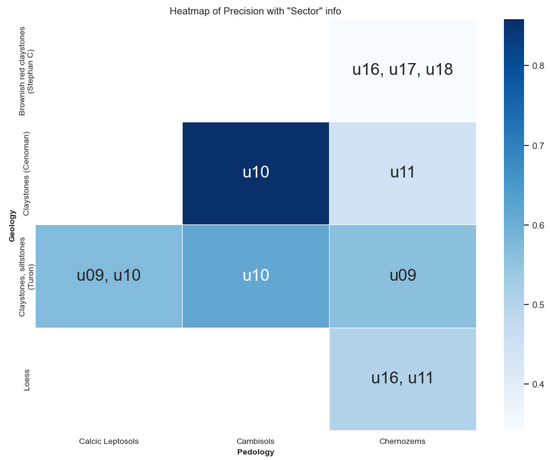
Chart 9.
Heatmap of the geological (Y-axis) and pedological (X-axis) combination. Each cell’s intensity indicates the level of precision, with darker shades representing higher precision.
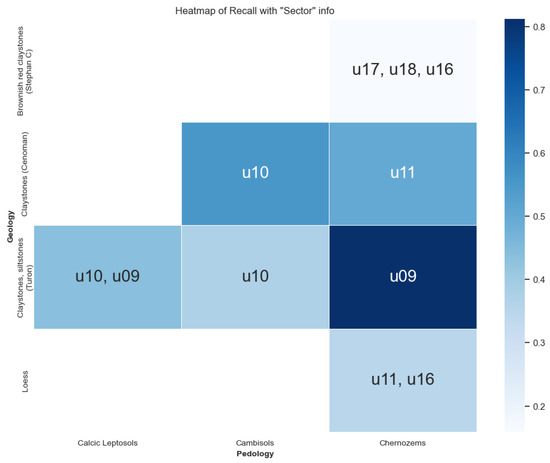
Chart 10.
Heatmap of the geological (Y-axis) and pedological (X-axis) combination. Each cell’s intensity indicates the level of precision, with darker shades representing higher recall.
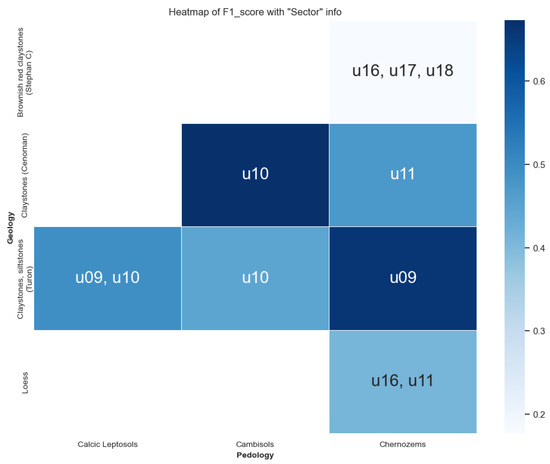
Chart 11.
Heatmap of the geological (Y-axis) and pedological (X-axis) combination. Each cell’s intensity indicates the level of precision, with darker shades representing a higher F1 score.
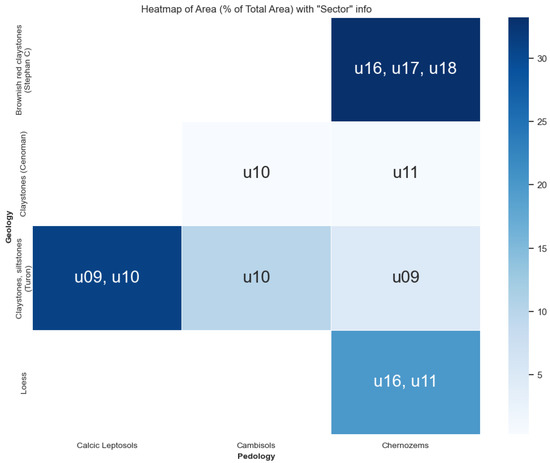
Chart 12.
Heatmap of the geological (Y-axis) and pedological (X-axis) combination. Each cell’s intensity indicates the level of precision, with darker shades representing a higher area in percentage.
The results, similarly to the manual comparison, indicate that the prospection was successful in sectors 09, 10, and 11. However, it was not as successful in sectors 16, 17, and 18. The bedrock of the first tree sector (09, 10, 11) consists of clastic freshwater to marine hardened sediments—claystones of the Turonian and Cenomanian Age with varying degrees of calcic leptosols, chernozems, and cambisols at the surface. In contrast, from section 16 to the end of the study area, the bedrock is dominated by clastic hardened sediments—brownish red claystones (Stephan C age)—in combination with chernozems.
The combination of cambisol and clastic freshwater to marine hardened sediments (Cenoman age) yielded the highest F1 score values (0.67). The high efficiency of magnetic prospection can be attributed to the presence of a large object in a relatively small area (approximately 500 m2). Although the magnetic survey revealed the archaeological potential of this small area, it did not record its characteristic feature, the small post-holes (building footprint). The second in order is a combination of chernozems and clastic marine hardened sediments—claystones and siltstones—(Turonian age), with an F1 score of 0.66.
This combination (polygon u09_A—Figure 3) is located in the western part of section 09. In section 09, the magnetic survey correctly identified the presence of chambered graves, often buried in weathered marl [16]. In the western part of u09_A, we correctly identified all graves (5), as shown by the very high recall value (0.81). This indicates that the survey and its subsequent interpretation correctly identified the sites and their extent—successfully identifying 81% of their area. The precision value (0.56) indicates that 56% of the predicted objects in a given area were, in fact, archaeological objects. The intensity of archaeology in the area not only correctly identified the archaeological objects but also correctly delineated them.
The same spectrum of features, but with a different soil type (clastic leptosols), was investigated in the eastern part of the sector (polygon u09_B—Figure 4). The change in soil type was not visible on the magnetogram. However, in the eastern part of the area, we observed increased concentrations of disturbance signals, which complicate the identification of objects. This disturbance was caused by the presence of dirt roads and an old parcel system. In the calcic leptosols, the statistical indicators were lower (Table 8). Nevertheless, the magnetic survey can be considered successful. Prospection here identified 7 of the 12 chambered graves. However, these were the only objects here that it predicted correctly. It correctly identified 54% of the area of archaeological situations. However, due to disturbance features here, interpretation was hampered, and several of the predicted anomalies were not confirmed as archaeological features.

Table 8.
Overview of the calculated metrics for the 12 environmental polygons.
It should be mentioned that excavation revealed several cremation (urn) burials in addition to chambered graves. However, none of them were identified by magnetic prospection. However, their impact on the assessment of effectiveness by statistical metrics was zero, as none of the burials were larger than 1 m in diameter.
The bedrock, consisting mainly of clastic consolidated sediments (Turonian age)—sandy siltstones to claystones—also provided good conditions for magnetic prospection in section 10 (Figure 5). This section is almost 2 km long and almost 2/3 of the section area is covered by calcareous leptosols and the rest by cambisols. The spectrum of objects recovered was different from that of section 09. Here, a polyculture settlement with a range of settlement objects was uncovered. As in the case of cremation (urn) burials, the small postholes were not recorded by the geophysical survey. The predictive value of the geomagnetic survey was therefore questionable despite the high F1, precision, and recall values. The calculated metrics indicate a reasonably good performance (Table 8), but the underlying geology made it impossible to identify small features and thus capture a key feature of the settlement. However, larger objects with an average area of 6 m2 were successfully detected. It was possible to capture a partial plan of the structure (building footprint in the form of a ditch) but no post pits.
The combination of chernozems and loess (including a small polygon of chernozems and siltstones) enabled the successful detection of settlement features in sector 11 (Figure 6). It can also be concluded that the prospection was effective in identifying archaeological situations, successfully predicting 55% of the area of archaeological situations based on the high evaluation metrics (F1 score: 0.55; precision: 0.73; recall: 0.45) (Table 8). The identification of large exploitation pits—claypits—also contributed to the high values. Despite recurrent recent magnetic disturbances on the perimeter of the survey area, the objects identified were in high contrast. Overall, the prospection of the area can be assessed as successful, as the character of the archaeological site was captured or correctly identified. However, as in previous cases, graves escaped detection in this area.
The magnetic prospection was not successful in sectors 16, 17, and 18 (Table 8; Figure 7, Figure 8 and Figure 9). This indicates the potential presence of archaeological situations on the site but a failure to recognise the nature of the archaeological site. The surface of sectors 16, 17, and 18 are covered by chernozem. The geological bedrock consists of brownish red claystones—clastic consolidated sediments (Stephan C age)—with occasional loess fills. The area of sector 16 was the most geologically complicated part of the entire area investigated. The eastern part of the area is made up of rocks of the Líně Formation, with a predominance of deep red and whitish grey claystone and dusty sediments. There was no evidence of prehistoric or medieval archaeological activity in this sector, probably due to the predominantly silty nature of the underlying geology. This type of bedrock continued into the western half. Here, the deposits of a Mesozoic river were also recorded, whose course meandered and slightly cut into the older carboniferous rocks. The river channel fill consisted of variously laminated sands and gravels, in places very intensely eroded into solid dark rusty, ferruginous sandstones and siltstones (ferricrete) [16]. The area was strongly influenced by Pleistocene cryogenic processes. In addition to ice wedges, there were also frost pots or small erosion furrows. The frost depression fills were distinctly different in colour and grain size from their surroundings and thus resembled archaeological objects. It is not easy to distinguish them from archaeological objects on the magnetogram [16].
In general, the number of examined objects in sections 16, 17, and 18 was smaller than in that in the previous sectors (Table 1; only objects with a diameter of more than 1 m are counted in the statistics). In contrast to sector 16, where several components (settlement, burial site) were investigated, only a few dozen objects were excavated in sections 17 and 18 within the surveyed area. The survey captured only a fraction of the post-holes, and from these, it was not possible to identify any floor plan of an above-ground structure. In addition to 85% of the graves in sector 16, a large part of the circular area, consisting, however, mainly of postholes less than 1 m in diameter, also escaped detection.
We tested the influence of environmental variables, specifically topsoil (pedology), through repeated geophysical measurements in section 16 after removing the topsoil. The resulting magnetogram (Figure 14) showed clearer bedrock layers and cryogenic structures due to reduced noise, enhancing the visibility of geological features. Despite the improved contrast, interpreting small archaeological objects would be ambitious. While topsoil removal primarily reduced noise and improved data quality, it did not significantly enhance the detectability of smaller archaeological features. We can conclude that topsoil did not significantly impact the initial detection and interpretation of objects in the magnetic data in the surveyed sector.
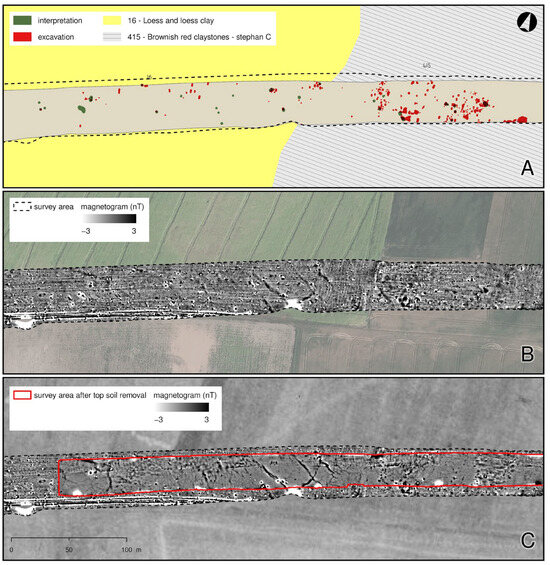
Figure 14.
Sector 16: (A) interpretation and results of the archaeological excavation, (B) the magnetogram, and (C) the magnetogram of the area after the topsoil stripping. (ČÚZK a ČGS).
These comparisons indicate that environmental variables such as geological subsoil and soil type have an obvious influence on the effectiveness of magnetic prospecting and its interpretation. Clastic sedimentary bedrock (Stephan C age)—brownish red clay—was found to be the least suitable category. Although geological parameters play an important role, the nature of archaeological situations, especially their dimensions (areal extent), was found to be more important for the successful identification of archaeological objects than were environmental variables. This is supported by the difference between sections 09, 10, and 11, where larger objects were successfully detected, and between sections 16, 17, and 18, where smaller objects were more difficult to identify (Chart 13 and Chart 14).
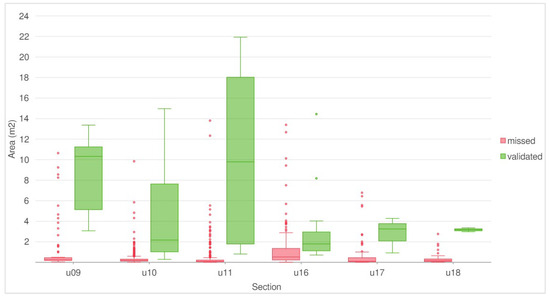
Chart 13.
Area of all archaeologically investigated features within the analysed sectors.
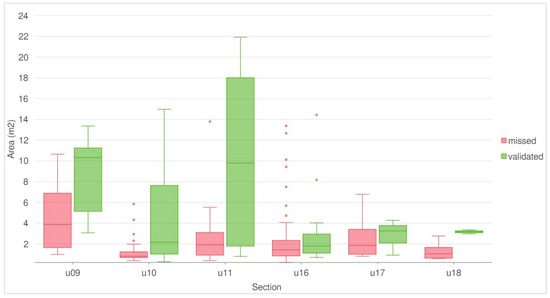
Chart 14.
Area of archaeologically investigated features with a diameter larger than 1 m within the analysed sectors.
8. Conclusions
In this article, we present the results of geophysical measurements and compare the interpretation of the magnetic survey with the results of rescue archaeological excavations in the route of the construction of the I/16 road Slaný–Velvary. The aim is to understand the importance of geophysical prospection and to determine its contribution and limits in rescue archaeological research. The area affected by the construction of the road has not previously been the subject of archaeological prospection aimed at discovering new sites, and this is reflected in the low number of previously known and confirmed archaeological sites lying in the immediate vicinity of the planned construction. Due to the lack of information, surface collections and a multispectral-geotechnical survey were conducted along the entire route. These methods provided new knowledge regarding the occurrence of archaeological sites in the study area but did not provide fundamental knowledge regarding the intensity of archaeological cultural heritage. Moreover, as subsequent archaeological excavation showed, multispectral imaging also mistakenly identified void sites as areas with high potential for archaeological occurrence. It was, therefore, decided to carry out a geophysical survey, which subsequently (just before the start of the excavation) covered almost the entire route of the upcoming construction.
The magnetic survey identified over 278 potential archaeological features that clustered into smaller sites or that were loosely spread across the survey area. The results of the geophysical survey proved to be in reasonably good agreement with the subsequent archaeological observations. We attempted to define prospection effectiveness as the degree of success with which geophysical prospection predicted the presence of subsequently archaeologically documented features. We applied two basic methodological approaches to assess the effectiveness of magnetic prospecting: manual visual comparison and statistical spatial correlation. For the correctness of the analyses, we only compared objects with a diameter greater than 1 m.
The visual–manual correlation showed that although geophysical prospection detected only 80 of the 435 archaeological objects (18%), these objects covered up to 42% of the area of the analysed archaeological objects. When the areas of small archaeological objects were included in the total set, geophysical prospection successfully detected 34% of the total area of archaeological objects. At the same time, the objects that were successfully predicted by the prospection were found to be larger in size and at greater depths. We also observed that geophysical prospection identified different types of objects with different success rates. Above-average detection success rates were achieved by prospecting the hut, clay pit. and linear feature categories. Magnetic prospection also achieved a surprisingly high success rate in the identification and interpretation of burial pits, in particular by correctly identifying 11 chambered graves.
Within the statistical spatial correlation, we could only analyse some sections. The resulting trend was similar, but we observed significant differences within individual sections. The possible reasons for this phenomenon may be related to natural factors such as the composition of the underlying geology and the nature of the soil layer. Clastic sediments (Stephan C age)—brownish red clay—proved to be the least suitable category, and topsoil is unlikely to have played a significant role in the detection and interpretation of objects in the magnetic data. Although geological parameters play an important role, it has been shown that, in addition to environmental variables, the nature of the archaeological situations, particularly their areal extent, is important for the successful identification of archaeological objects. In general, it can be said that even if geophysical prospection does not identify all objects, the fact that it correctly identifies the presence of some of them makes a huge contribution to the logistical preparation of rescue archaeological research.
Author Contributions
Conceptualization, T.T., D.M. and P.M.; methodology, T.T. and P.M.; analysis, T.T.; resources, T.T., D.M. and P.M.; data curation, T.T.; writing—original draft preparation, T.T., D.M. and P.M.; writing—review and editing, T.T., D.M. and P.M.; visualisation, T.T.; supervision, P.M.; project administration, P.M.; funding acquisition, P.M. All authors have read and agreed to the published version of the manuscript.
Funding
The study was supported by the state support of the Technology Agency of the Czech Republic under the TAČR ÉTA project Optimised archaeological prediction in the process of large-scale construction sites (TL03000537).
Data Availability Statement
The data presented in this study are available on request from the corresponding author.
Conflicts of Interest
The authors declare no conflicts of interest.
References
- Clark, A.J. Seeing Beneath the Soil: Prospecting Methods in Archaeology; Taylor & Francis e-Library: Abingdon, UK, 2003; p. 192. [Google Scholar]
- David, A.; Linford, N.; Linford, P. Geophysical Survey in Archaeological Field Evaluation, 2nd ed.; English Heritage: Swindon, UK, 2008. [Google Scholar]
- Schmidt, A.R.; Linford, P.; Linford, N.; David, A.; Gaffney, C.F.; Sarris, A.; Fassbinder, J. EAC Guidelines for the use of geophysics in archaeology: Questions to ask and points to consider. In Eac Guidelines 2; Europae Archaeologia Consilium (EAC): Namur, Belgium, 2016; p. 136. [Google Scholar]
- Gaffney, V.; Neubauer, W.; Garwood, P.; Gaffney, C.; Löcker, K.; Bates, R.; De Smedt, P.; Baldwin, E.; Chapman, H.; Hinterleitner, A.; et al. Durrington walls and the Stonehenge Hidden Landscape Project 2010–2016. Archaeol. Prospect. 2018, 25, 255–269. [Google Scholar] [CrossRef]
- Stamnes, A.A.; Gustavsen, L. Archaeological Use of Geophysical Methods in Norwegian Cultural Heritage Management—A Review. In A Sense of the Past: Studies in Current Archaeological Applications of Remote Sensing and Non-Invasive Prospection Methods; Kamermans, H., Gojda, M., Posluschny, A., Eds.; Archaeopress: Oxford, UK, 2014; pp. 17–31. [Google Scholar]
- Hulin, G.; Bayard, D.; Depaepe, P.; Koehler, A.; Prilaux, G.; Talon, M. Geophysics and preventive archaeology: Comparison with trial trenching on the CSNE project (France). Archaeol. Prospect. 2018, 25, 155–166. [Google Scholar] [CrossRef]
- Bonsall, J.; Gaffney, C.F.; Armit, I. A Decade of Ground Truthing: Reappraising Magnetometer Prospection Surveys on Linear Corridors in light of Excavation evidence 2001–2010. In A Sense of the Past: Studies in Current Archaeological Applications of Remote Sensing and Non-Invasive Prospection Methods; BAR International Series, 2588; Kamermans, H., Gojda, M., Posluschny, A., Eds.; Archaeopress: Oxford, UK, 2014; pp. 3–17. [Google Scholar]
- Belshé, J.C. Recent magnetic investigations at Cambridge University. Adv. Phys. 1957, 6, 192–193. [Google Scholar] [CrossRef]
- Aitken, M.J.; Webster, G.; Rees, A. Magnetic prospecting. Antiquity 1958, 32, 270–271. [Google Scholar]
- Le Borgne, E. Susceptibilité magnétique anormale du sol superficiel. Ann. De Géophysique 1955, 11, 399–419. [Google Scholar]
- Faßbinder, J.W.E.; Stanjek, H. Occurrence of bacterial magnetite in soils from archaeological sites. Archaeol. Pol. 1993, 31, 117–128. [Google Scholar]
- Fassbinder, J.W.E. Seeing beneath the farmland, steppe and desert soil: Magnetic prospecting and soil magnetism. J. Archaeol. Sci. 2015, 56, 85–95. [Google Scholar] [CrossRef]
- Bonsall, J.; Gaffney, C.F.; Armit, I. Preparing for the Future: A Reappraisal of Archaeo-Geophysical Surveying on Irish National Road Schemes 2001–2010; Archaeological Sciences, Division of Archaeological, Geographical and Environmental Sciences, University of Bradford: Bradford, UK, 2014; p. 159. [Google Scholar]
- Campana, S.; Dabas, M. Archaeological impact assessment: The BREBEMI project (Italy). Archaeol. Prospect. 2011, 18, 139–148. [Google Scholar] [CrossRef]
- Bína, J.; Demek, J. Z nížin do Hor: Geomorfologické Jednotky České Republiky, 1st ed.; Academia: Praha, Czech Republic, 2012. [Google Scholar]
- Zavřel, J. Silniční Obchvat 1/16 Slaný—Velvary—Vyhodnocení Geologických a Petrografických Poměrů Archeologicky Zkoumaných Ploch; Archeologický ústav AV ČR v Praze: Prague, Czech Republic, 2021; p. 182. [Google Scholar]
- Ernée, M.; Štefan, I. Archeologický Průzkum Formou Rešerše pro akci I/16 Slaný—Velvary, Okres Kladno; Archeologický ústav AV ČR v Praze: Mělník, Czech Republic, 2002. [Google Scholar]
- Varadzin, L. Nálezová zpráva: Povrchový průzkum na trase plánované komunikace Velvary-Slaný. In Nálezová Zpráva; Archeologický ústav AV ČR v Praze: Praha, Czech Republic, 2005. [Google Scholar]
- Hejda, P. Závěrečná zpráva k plnění zakázky dle objednávky č. 02PT-005293. In Multispektrální—Geotechnický Průzkum Letecké Geofyzikální Snímkování “Lokalita I/16 Slaný—Velvary”; Air Vision Technology, s.r.o: Litvínov, Czech Republic, 2017. [Google Scholar]
- Milo, P.; Tencer, T.; Vágner, M.; Prišťáková, M. Správa o geofyzikálnom prieskume I/16 Slaný—Velvary. In Správa o Geofyzikálnom Prieskume; Masarykova Univerzita, ÚAM FF: Brno, Czech Republic, 2018. [Google Scholar]
- Doneus, M.; Verhoeven, G.; Atzberger, C.; Wess, M.; Ruš, M. New ways to extract archaeological information from hyperspectral pixels. J. Archaeol. Sci. 2014, 52, 84–96. [Google Scholar] [CrossRef]
- Tilley, C. Excavation as theatre. Antiquity 1989, 63, 275–280. [Google Scholar] [CrossRef]
- Seren, S.; Trinks, I.; Hinterleitner, A.; Neubauer, W. The Anomaly That Wasn´t There—ON the Visibility of Archaeological Prospection Anomalies and Their Causative Structures in the Subsurface. In Archaeological Prospection, Proceedings of the 10th International Conference, Vienna, Austria, 29 May–2 June 2013; Austrian Academy of Sciences Press: Vienna, Austria, 2013; pp. 252–254. [Google Scholar]
- Löcker, K.; Kucera, M.; Trinks, I.; Neubauer, W. Successfully falsified… On epistomological problems of archaeological excavations and geophysical surveys. Archaeol. Pol. 2015, 53, 222–224. [Google Scholar]
- Neubauer, W. GIS in archaeology—The interface between prospection and excavation. Archaeol. Prospect. 2004, 11, 159–166. [Google Scholar] [CrossRef]
- Knight, D.; Pearce, M.; Wilson, A. Beneath the soil from Trent to Nene: Assessment of the performance of geophysical survey in the East Midlands: Archive Report. In Archive Report Distributed via the Archaeology Data Service; English Heritage: York, UK, 2007. [Google Scholar]
- Jordan, D. How effective is geophysical survey? A regional review. Archaeol. Prospect. 2009, 16, 77–90. [Google Scholar] [CrossRef]
- Stibrányi, M. Switching to Digital Tools: Heritage evaluation for preventive archaeology in Hungary. Internet Archaeol. 2017, 43. [Google Scholar] [CrossRef]
- Hey, G.; Lacey, M. Evaluation of Archaeological Decision-Making Processes and Sampling Strategies; Oxford Archaeological Unit: Oxford, UK, 2001; p. 124. [Google Scholar]
- Linford, N.; David, A. Appendix 2: Study of Geophysical Surveys. In Evaluation of Archaeological Decision-making Processes and Sampling Strategies; Hey, G., Lacey, M., Eds.; Oxford Archaeological Unit: Oxford, UK, 2001; pp. 76–89. [Google Scholar]
- Lillesand, T.M.; Kiefer, R.W.; Chipman, J.W. Remote Sensing and Image Interpretation, 7th ed.; Wiley: Hoboken, NJ, USA, 2015; p. 736. [Google Scholar]
- Maxwell, A.E.; Warner, T.A.; Guillén, L.A. Accuracy Assessment in Convolutional Neural Network-Based Deep Learning Remote Sensing Studies—Part 2: Recommendations and Best Practices. Remote Sens. 2021, 13, 2591. [Google Scholar] [CrossRef]
- ČGS. Geologická Mapa 1:50,000. In Geovědní Mapy 1:50,000 [Online]; Česká Geologická Slúžba: Praha, Czech Republic, 2024. [Google Scholar]
- SPÚ. Vektorová Vrstva Bonitovaných Půdně-Ekologických Jednotek (BPEJ); Státní Pozemnkový Úřad: Prague, Czech Republic, 2024. [Google Scholar]
Disclaimer/Publisher’s Note: The statements, opinions and data contained in all publications are solely those of the individual author(s) and contributor(s) and not of MDPI and/or the editor(s). MDPI and/or the editor(s) disclaim responsibility for any injury to people or property resulting from any ideas, methods, instructions or products referred to in the content. |
© 2024 by the authors. Licensee MDPI, Basel, Switzerland. This article is an open access article distributed under the terms and conditions of the Creative Commons Attribution (CC BY) license (https://creativecommons.org/licenses/by/4.0/).