Article

Refraction Correction Based on ATL03 Photon Parameter Tracking for Improving ICESat-2 Bathymetry Accuracy

1
Institute of Geospatial Information, Information Engineering University, Zhengzhou 450001, China
2
Key Laboratory of Spatiotemporal Perception and Intelligent Processing, Ministry of Natural Resources, Zhengzhou 450001, China
3
Collaborative Innovation Center of Geo-Information Technology for Smart Central Plains, Zhengzhou 450001, China
*
Author to whom correspondence should be addressed.
Remote Sens. 2024, 16(1), 84; https://doi.org/10.3390/rs16010084
Submission received: 20 November 2023 / Revised: 18 December 2023 / Accepted: 19 December 2023 / Published: 25 December 2023
(This article belongs to the Section Ocean Remote Sensing)

Abstract

:
The refraction phenomenon causes ICESat-2 nearshore bathymetry errors by deviating seafloor photons’ coordinates. A refraction correction method based on ATL03 photon parameter tracking was proposed to improve the ICESat-2 bathymetry accuracy. The method begins by searching for sea–air intersections using photon parameters. Instead of relying on mathematical operations, it uses logical relations to establish a relationship between the seafloor and the surface, which improves efficiency. Then, a refraction correction model is designed based on Snell’s law for different sea surface fluctuations. This model is clear and suitable for scholars new to refraction correction. The results show the effectiveness of the proposed method since the RMSE is reduced by 1.8842 m~5.2319 m compared with the raw data. Our method has better tolerance than other methods at different water depth ranges.

Graphical Abstract

1. Introduction

Bathymetry is vital for understanding seafloor topography, assessing marine ecosystems, and ensuring the sustainable use of marine resources [1,2,3,4]. The Light detection and range (LiDAR) is a vital bathymetry technology that mainly includes airborne and spaceborne [5,6,7,8]. The Airborne Lidar Bathymetry (ALB) system is challenging to be the primary technique for nearshore bathymetry because of its high prices and inability to perform high-frequency in-flight detection in disputed maritime and remote land areas [9,10]. There are no spaceborne marine LiDAR satellites conducting on-orbit experiments. In 2018, NASA launched the Ice, Cloud, and Land Elevation Satellite-2 (ICESat-2), which features the Advanced Topographic Laser Altimeter System (ATLAS) [11]. This system is capable of accurately mapping surface elevations [12,13]. The ATLAS system benefits nearshore bathymetry using a 532 nm laser that can penetrate the water [14]. Some photons reach the sea surface while others penetrate it to the seafloor. Calculating the elevation difference between the two types of photons makes it possible to achieve bathymetry. ICESat-2’s data product, ATL03, stores geospatial information on bathymetry photons and can be used to enable ocean profile reconstruction and bathymetry with a maximum depth of detection of 40 m in clear water [15].
ICESat-2 bathymetric accuracy is affected by the bathymetric photon extraction and refraction phenomenon [16,17]. Firstly, the high sensitivity of ATLAS results in a significant amount of noise photons in the ATL03 data, and the absorption of laser pulses by the water body blurs the distinction between bathymetry photons and noises. Secondly, photon coordinate errors arise from the laser pulses’ divergence from their original transmission route during their propagation through the sea–air interface due to the refraction coefficient [18]. ICESat-2 stores the seafloor photons’ coordinates without considering the refraction errors. Therefore, refraction correction is necessary to receive accurate information about water depth.
Sea surface fluctuations complicate the refraction phenomenon. However, current research has simplified the measurement scenarios to varying degrees. Parrish et al. [15] assumed a flat sea surface and used Snell’s law to correct refraction errors, proposing a formula for the refraction correction of seafloor photons under this assumption. The sea surface is fluctuating, and in extreme cases, wave heights can reach several meters, requiring the consideration of refraction errors caused by sea surface fluctuations. Xu et al. [19] considered a fluctuating sea surface, affecting the air–water interface’s laser incidence angle. Their correction procedure deemed the refraction error induced by sea surface waves. Based on this, Ma et al. [20,21] proposed that the laser emission and sea surface waves influence the laser incidence angle. Therefore, when performing refraction correction, the effect of sea surface fluctuations on the direction of laser incidence should be considered, assuming that the vertical laser pulse emission is deficient. Precisely estimating the shape of the sea surface is crucial for determining an accurate laser incidence angle. Liu et al. [22] utilized a plane equation to fit the sea surface photons in the direction of the satellite orbit, enabling them to obtain the laser incidence angle and correct for refraction errors caused by waves perpendicular to the orbital direction. Zhang et al. [23] employed the Joint North Sea Wave Project (JONSWAP) wave spectrum for simulating sea surface fluctuations and determining the instantaneous slope of the sea surface. The slope of the sea surface complicates laser incidence at the sea surface and, at the same time, complicates the phenomenon of refraction, which is a problem worth studying.
In this paper, we propose and validate a refraction correction method based on parameter tracking to improve the accuracy of ICESat-2 bathymetry. The innovations of the method include the following two points: (1) Finding the sea–air intersections using photon parameters to realize the connection between the seafloor and the sea surface. (2) Classify the sea surface fluctuations and design the corresponding refraction correction and bathymetry method using Snell’s law. The structure of the paper is as follows: Section 2 gives the experimental area and data for the article. Section 3 describes the proposed method. We construct the refraction correction model and connect the seafloor to the sea surface with bathymetry photon parameters. Section 4 focuses on the experimental results, showing the resultant plots of the bathymetry signal extraction and the refraction correction of the seafloor photons and verifying the method’s reliability. The discussion is in Section 5, analyzing in detail the error distribution and the effect of water depth variations on ICESat-2 bathymetry.

2. Materials

2.1. Study Area

The study took place in the region of Culebra, Puerto Rico, which is situated between latitudes 18.25° to 18.36°N and longitudes 65.15° to 65.35°W, as depicted in Figure 1. Known for its pristine flamenco beaches, Culebra is a popular tourist destination recognized in Puerto Rico. The ecological environment of the study area is well-preserved, ensuring high water transparency, making it an ideal location for assessing the accuracy of ICESat-2 bathymetry.

2.2. ATL03 Dataset

ATL03 is a photon point cloud data that stores geospatial information of signal photons reflected from the sea surface and seafloor. These data can reconstruct ocean vertical profiles and bathymetry [24]. The six laser beams (gt1r, gt1l, gt2r, gt2l, gt3r, and gt3l, where l and r represent left and right, respectively) emitted by ATLAS are divided into three groups pushed along the direction of flight, each group consisting of one strong and one weak laser beam [25]. The energy of a strong laser beam is about four times that of a weak laser beam [26], so only strong laser beams are covered in this study. The geolocation information for each photon based on the WGS84 ellipsoid, as well as the distance along the track (dist_ph_along) and the laser pulse counter (ph_id_pluse), is stored in ‘ATL03/gtx/heights’. ‘ATL03/gtx/geolocation’ contains the elevation angle (ref_elev) for each photon unit pointing vector.
Figure 1 shows the distribution of the six ground tracks in Culebra. Dashed lines of different colors indicate the various tracks. In addition, Table 1 lists the number of ATL03 datasets used in this study, the time of acquisition (Universal Time Coordinated (UTC)), and the latitudinal range of the six ground tracks.

2.3. Reference ALB Data

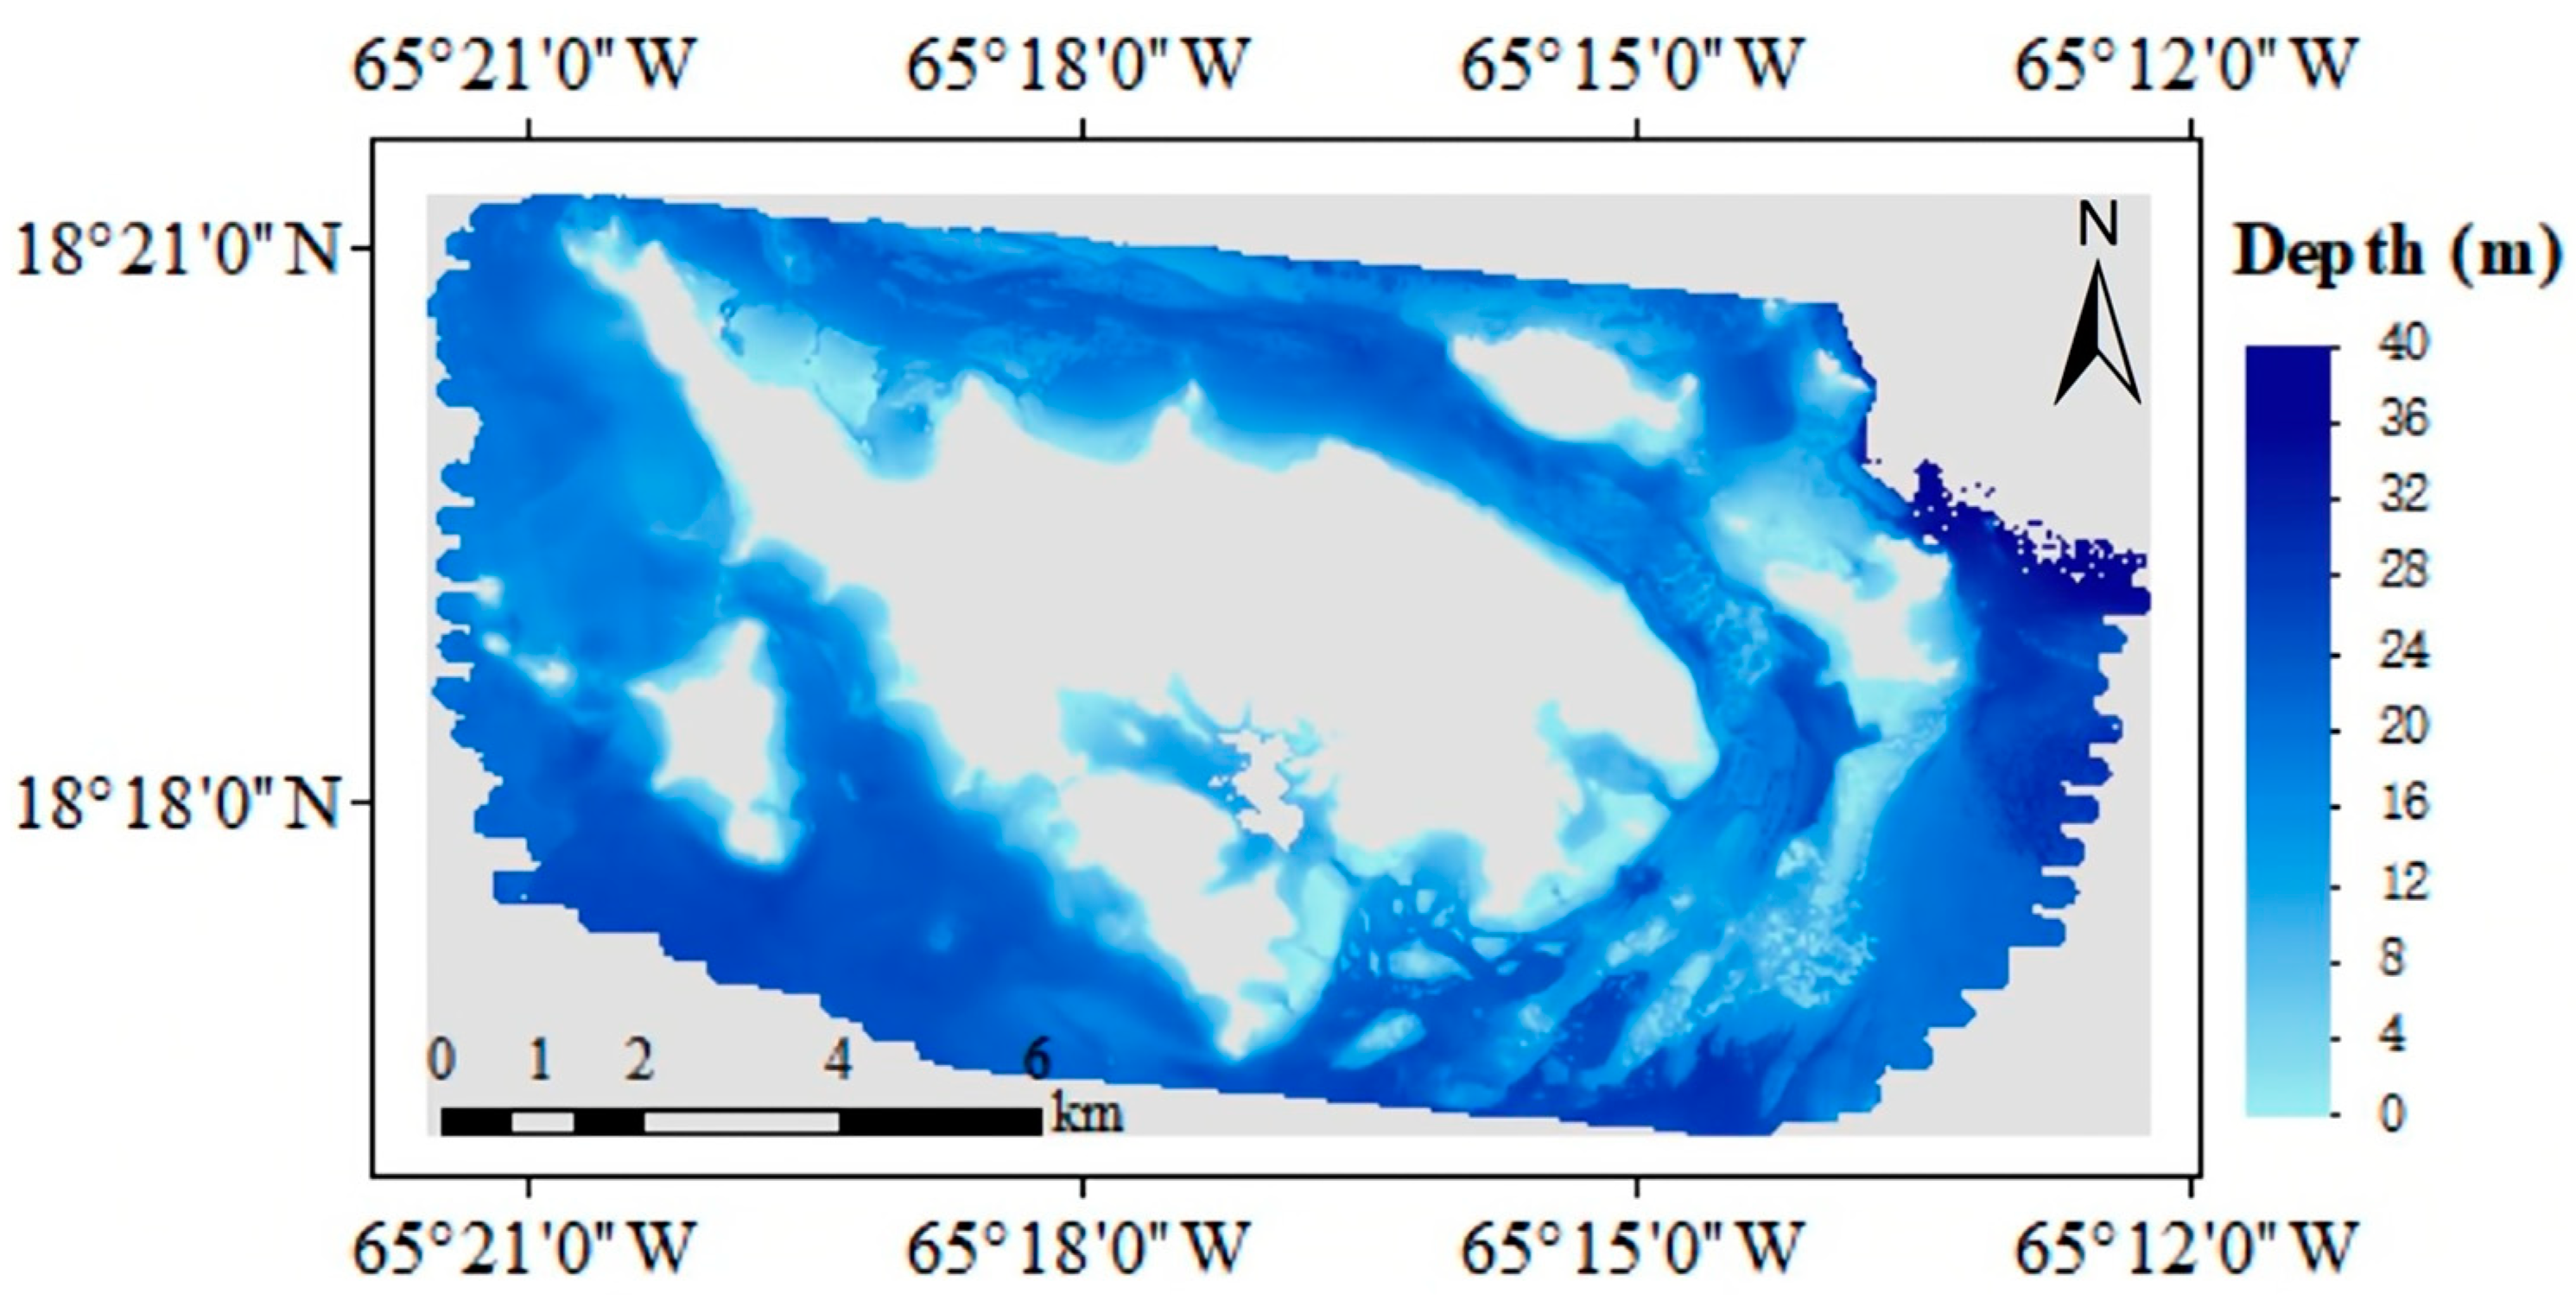
The study utilizes airborne LiDAR data published by NOAA’s Office of Coastal Management to validate the bathymetry accuracy of ICESat-2 data used in the study area (https://www.coast.noaa.gov/dataviewer/#/LiDAR/search/ (accessed on 15 September 2023)) as shown in Figure 2. These data were collected by Leading Edge Geomatics using a Riegl VQ-880-G II Topobathymetric LiDAR system with the bathymetry sensor parameters set to a course altitude of 450 m AGL, an approximate flight speed of 130 knots, a laser pulse rate of 200 kHz, and a central wavelength of 515 nm. This LiDAR dataset meets ASPRS Positional Accuracy Standards for Digital Geospatial Data (2014), with horizontal positioning accuracy R M S E x and R M S E y of 31.1 cm and 25.4 cm, respectively, vertical positioning accuracy R M S E z of 18.5 cm, and bathymetry accuracy R M S E h of 12.1 cm.

3. Methods

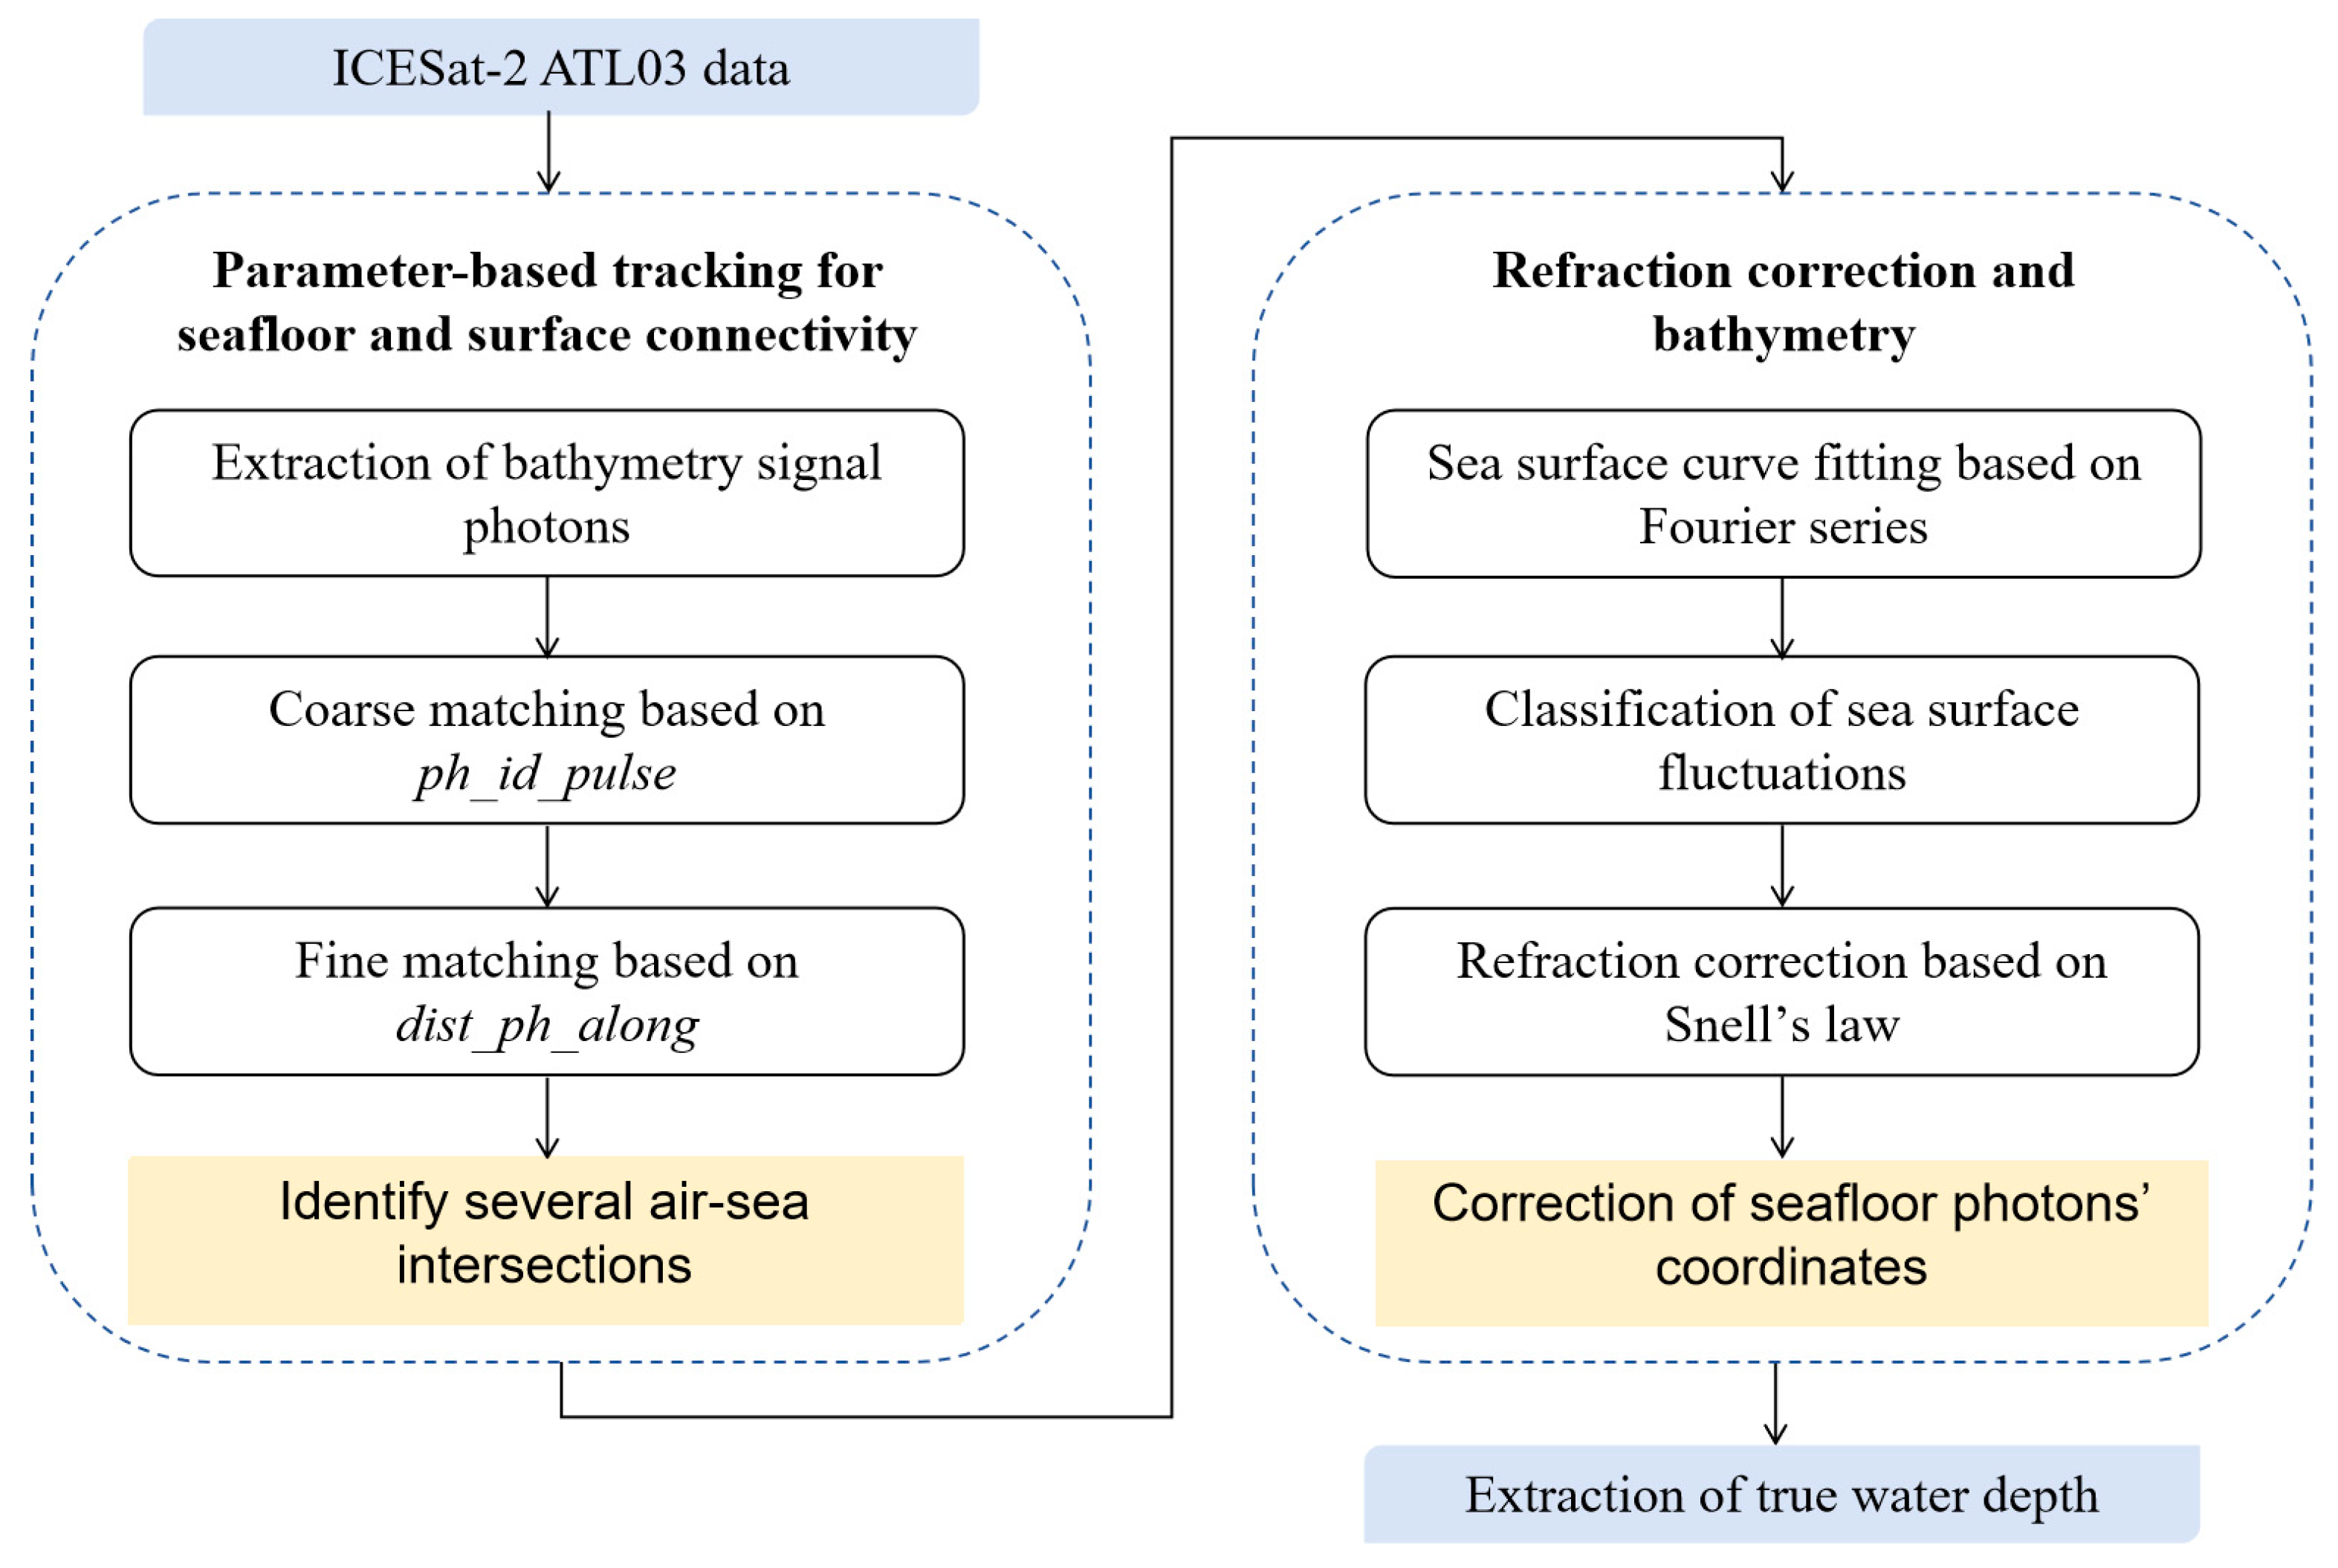
The sea surface deviates from the water surface by external forces and recovers as quickly as possible by gravity or surface tension, producing fluctuations [27]. The laser emission and sea surface slope determine the laser incidence angle. Considering the influence of water column and sea surface fluctuation on the accuracy of ICESat-2 bathymetry, a refraction correction method based on ATL03 photon parameter tracking is derived and proposed. This part includes two items: (1) Classify and analyze the effect of sea surface slope angle on the laser incidence angle, and use Snell’s law to design the corresponding refraction correction model, based on which we obtain the water depth extraction model, which eliminates the sea surface fluctuation. (2) Realize the seafloor and sea surface connection using parameter tracking to obtain the sea surface fluctuation corresponding to the seafloor photons. Figure 3 displays a flow diagram of the method proposed.

3.1. Refraction Correction and Bathymetry Model

When the sea surface is subjected to external forces and is in a non-planar state, the bathymetry accuracy of ICESat-2 is affected by the refraction phenomenon and sea surface fluctuation. Our purpose is to break this limitation. Figure 4 shows a diagram of the sea surface fluctuation. The green dashed line is the water depth without refraction correction, D; the yellow solid line is the corrected water depth, D c o r r e c t ; and the red solid line is the distance from the mean sea level to the true seafloor, which is the true water depth, D t r u e . The difference of d between D t r u e and D c o r r e c t is expressed in Equation (1). The difference of Z between D c o r r e c t and D is expressed by Equation (2). Thus, the difference between D t r u e and D is d and Z , expressed by Equation (3).
D t r u e = D c o r r e c t + d ,
D c o r r e c t = D Z ,
D t r u e = D + d Z ,
where D can be obtained by the difference between the fluctuating sea surface photon’s elevation ( h s u r f a c e ) and the uncorrected seafloor photon’s elevation ( h s e a f l o o r ), expressed by Equation (4). d is the deviation distance between the mean sea surface and the fluctuating sea surface, obtained by making a difference between the fluctuating sea surface photon’s mean elevation ( h s u r f a c e ¯ ) and h s u r f a c e , and expressed in Equation (5).
D = h s u r f a c e h s e a f l o o r ,
d = h s u r f a c e ¯ h s u r f a c e ,
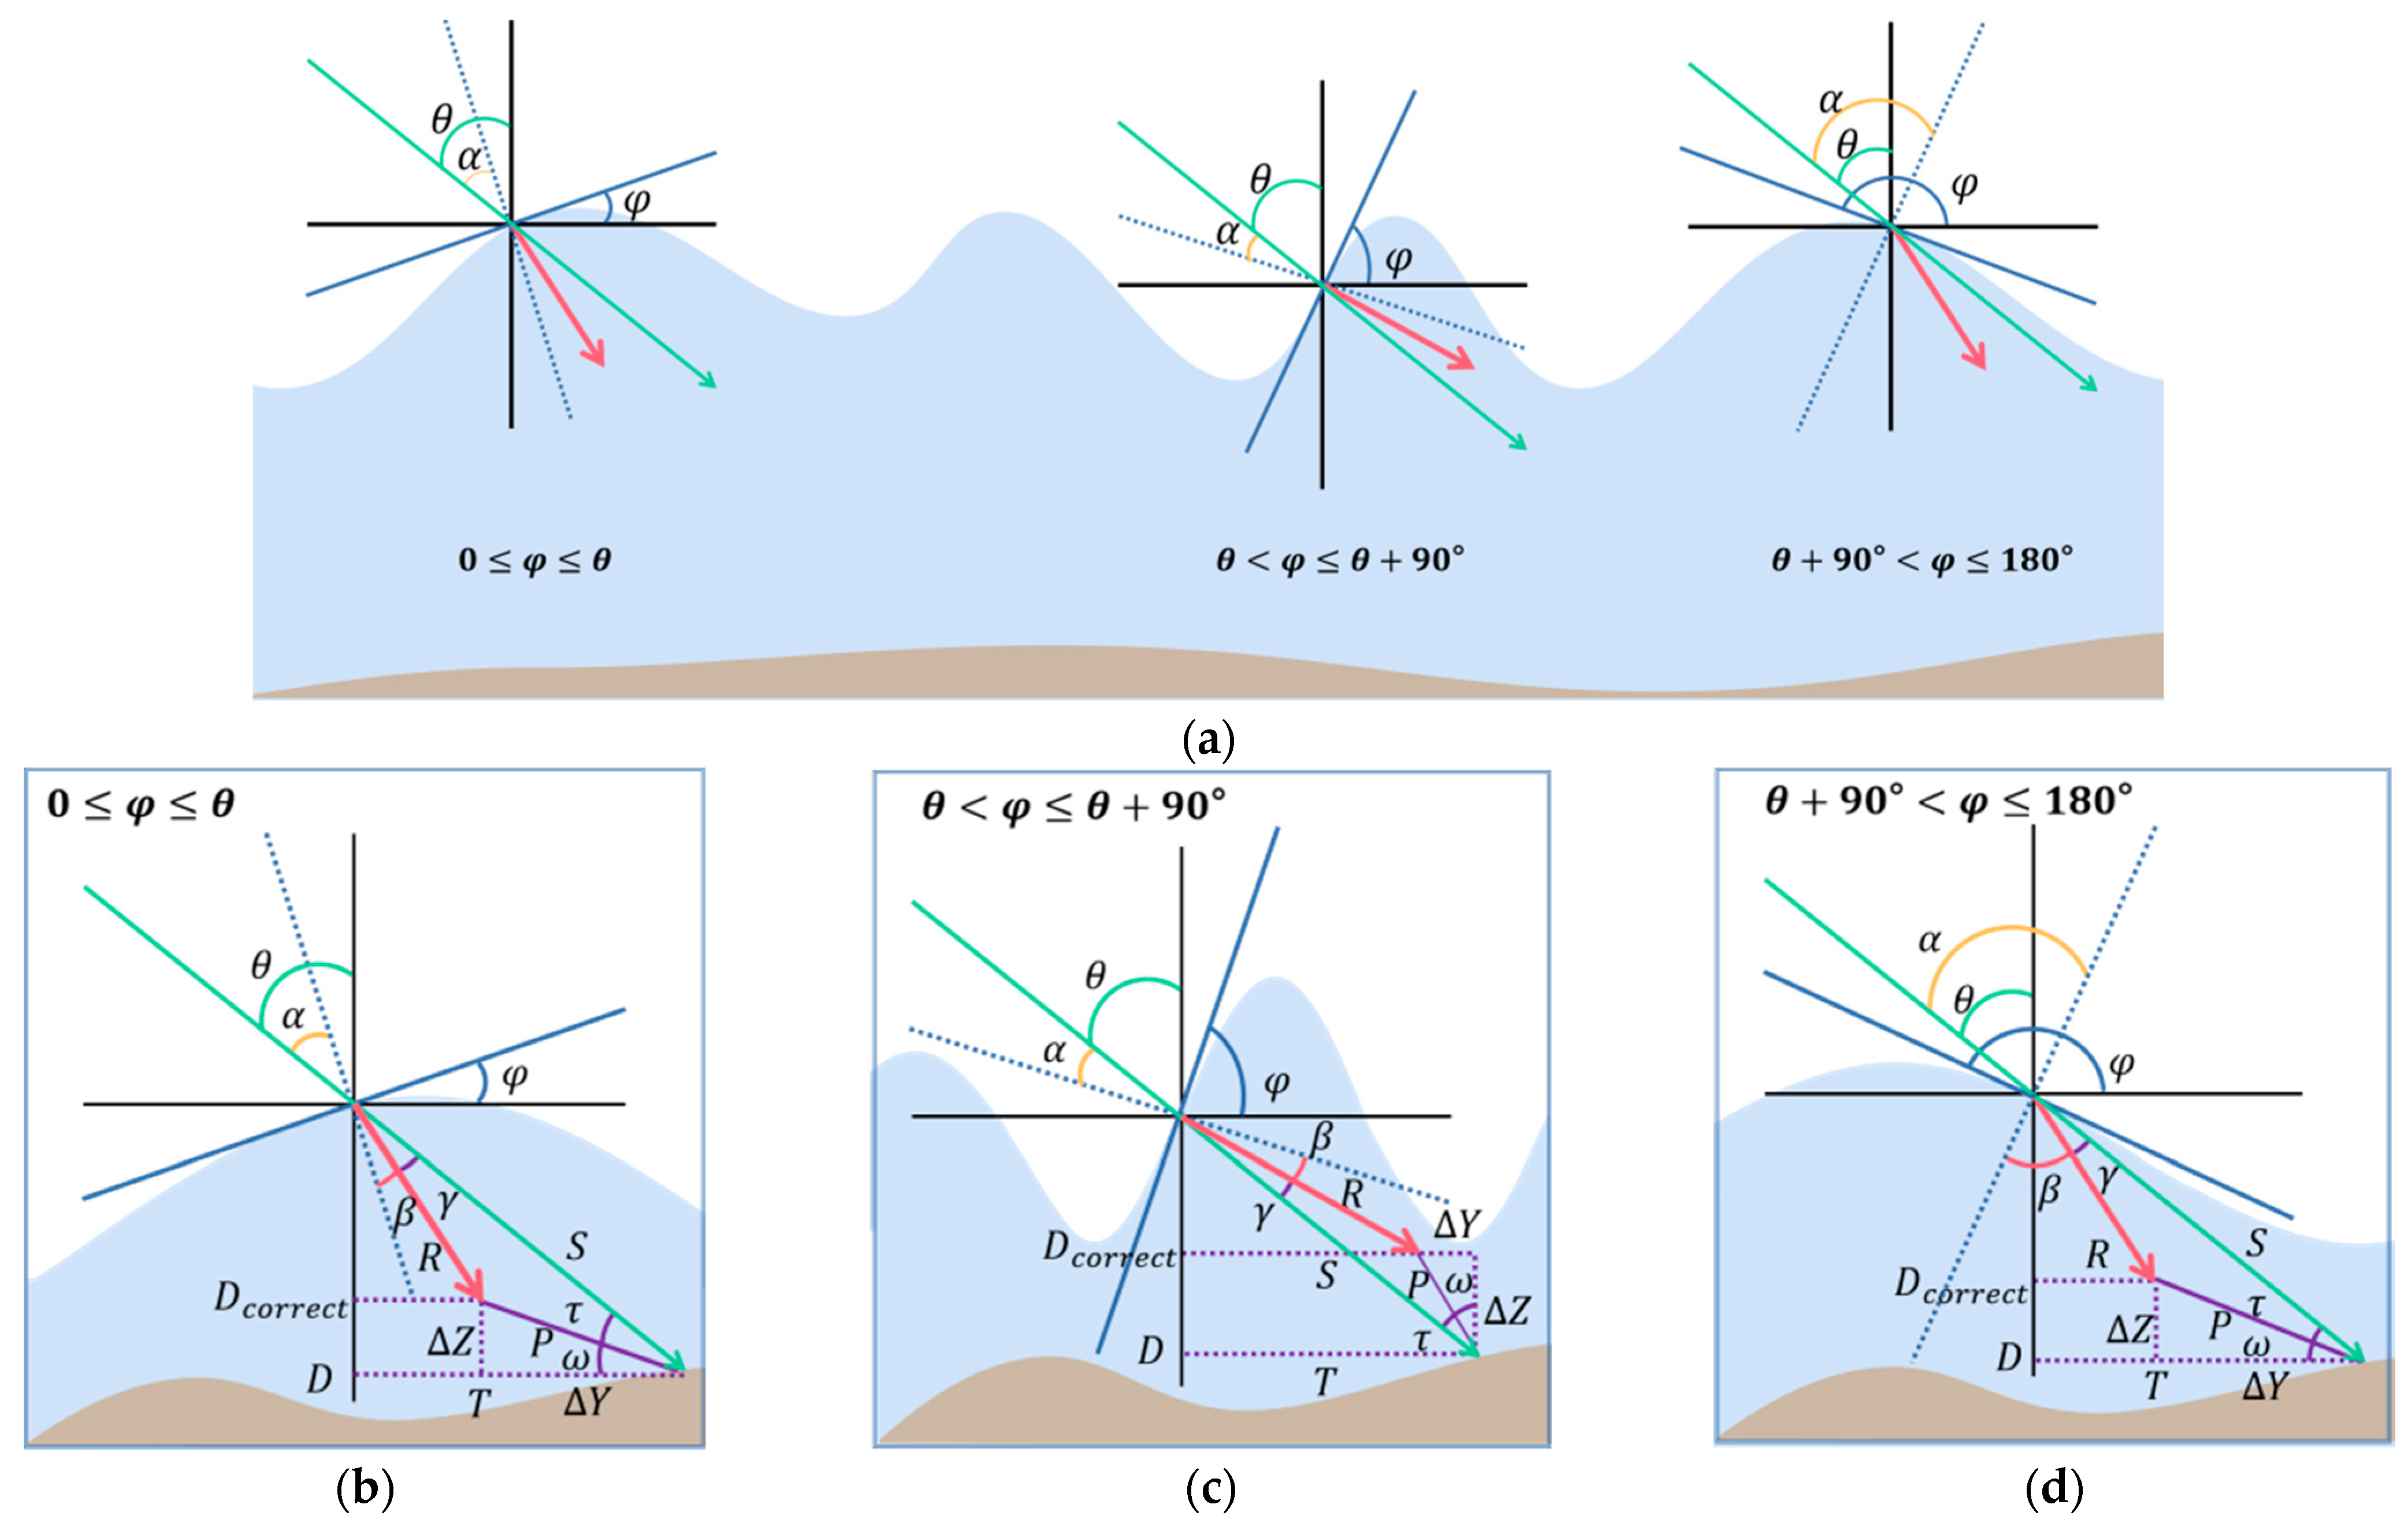
To find Z , we simulate the propagation of laser incidents on the sea surface under different fluctuation conditions. First, the sea surface fluctuations are categorized in Figure 5a. α is the laser incidence angle; θ is the laser emission angle; and φ is the sea surface slope angle. Second, Figure 5b–d illustrates the model for solving Z in different cases.
In a right triangle formed by Z , Y and P , Z is represented by Equation (6).
Z = P s i n ω , 0 φ θ P c o s ω , θ < φ θ + 90 ° P s i n ω , θ + 90 ° < φ 180 ° ,
where P is the distance between the seafloor photons before and after correction, expressed in Equation (7), and ω is the interior angle of R t Z Y P , expressed in Equation (8). “ R t ” stands for a right triangle.
P = S 2 + R 2 2 S R c o s γ ,
ω = π / 2 θ τ , 0 φ θ θ τ , θ < φ θ + 90 ° π / 2 θ τ , θ + 90 ° < φ 180 ° ,
Equation (6) relates the difference in water depth, Z , before and after refraction correction to the parameters P and ω . Equation (7) expresses P in terms of parameters S , R , and γ . Similarly, Equation (8) represents ω in terms of θ and τ . Thus, the critical task of constructing a refraction correction and bathymetry model is to solve for the parameters related to P and ω , namely S , R , γ , θ , and τ .
S is the laser transmission distance between the uncorrected seafloor photon and the corresponding sea surface photon. In R t D S T , it can be expressed in Equation (9).
S = D / c o s θ ,
where θ is related to parameter r e f _ e l e v of ATL03 and is expressed by Equation (10).
θ = π / 2 r e f _ e l e v ,
R is the laser transmission distance between the corrected seafloor photon and the corresponding sea surface photon. The refraction coefficient is the ratio of the light speed in a vacuum to that in a medium. Since the laser propagation time is constant before and after correction, the relationship between S and R can be expressed by Equation (11).
R = S · n 1 / n 2 ,
γ is the difference between α and the laser refraction angle β , expressed in Equation (12). α is expressed by Equation (13). According to the Snell’s law, β is expressed by Equation (14).
γ = α β ,
α = θ φ , 0 φ θ φ θ , θ < φ θ + 90 ° 180 ° φ + θ , θ + 90 ° < φ 180 ° ,
β = s i n 1 n 1 · s i n α / n 2 ,
where, φ is the parameter indicating the degree of sea surface fluctuation, which is the angle between the inclined sea surface and the sea level. Yang et al. [18] and Zhang et al. [23] utilized JONSWAP spectra to establish sea surface profiles to find φ . However, the JONSWAP expression does not reflect the effect of water depth on the spectral shape, and the standard JONSWAP with the peak-enhancement factor of 3.3 only applies to 37.7% of the global coasts [27]. In linear theory, the fluctuating sea surface can be represented as a combination of an infinite number of mutually independent and randomly phased simple harmonic motions. The sea surface can be expressed using the Fourier series, defined by Equation (15).
f ( x ) = a 0 + k = 1 [ a k c o s ( k ω x ) + b k s i n ( k ω x ) ] ,
where a 0 , a k , b k , and ω are the Fourier coefficients, solved by the least square method, and k is the number of Fourier terms. In the article, we use curve fitting of the fluctuating sea surface using a 5-term Fourier series, where the sea surface photon’s along-track distance serves as the input data, and the sea surface photon’s elevation serves as the output data. A first-order derivative of the fitted function gives the sea slope of each photon, expressed in Equation (16), and the sea slope angle is expressed in Equation (17).
ρ ( x ) = k = 1 5 [ a k k ω s i n ( ω x ) + b k k ω s i n ( k x ) ] ,
φ ( x ) = a c t a n ( ρ ( x ) ) ,
τ is the R P S pinch angle, expressed in Equation (18).
τ = s i n 1 R · s i n r / P ,
Here, we have preliminarily completed the construction of the model. The model assumes that laser beams pair seafloor and surface photons. So, the next step is to realize this assumption.

3.2. Parameter-Based Tracking for Seafloor and Surface Connectivity

For photon-counting bathymetry, it is impossible to directly or accurately obtain the coordinates of the sea–air intersections corresponding to different seafloor photons as in the case of conventional full-waveform LiDAR [24]. However, this process is vital to constructing refraction correction and bathymetry extraction models. Ray tracing is often employed to determine the sea–air intersection of each seafloor photon [18,23,24]. Zhang et al. [23] used the laser incidence angle and the seafloor photon coordinates to establish a spatial line for the transmission path. Chen et al. [24] treated the immediate sea surface as a plane and found a geometric relationship between the laser beam, the seafloor photons, and the instantaneous sea surface. Yang et al. [18] established the relationship between surface photons, laser beams, and seafloor photons. The method of ray tracing contains a large number of mathematical calculations. Therefore, we propose a parameter tracking based on the connection between the seafloor and the sea surface to use a logical relationship to simplify finding the sea–air intersection.
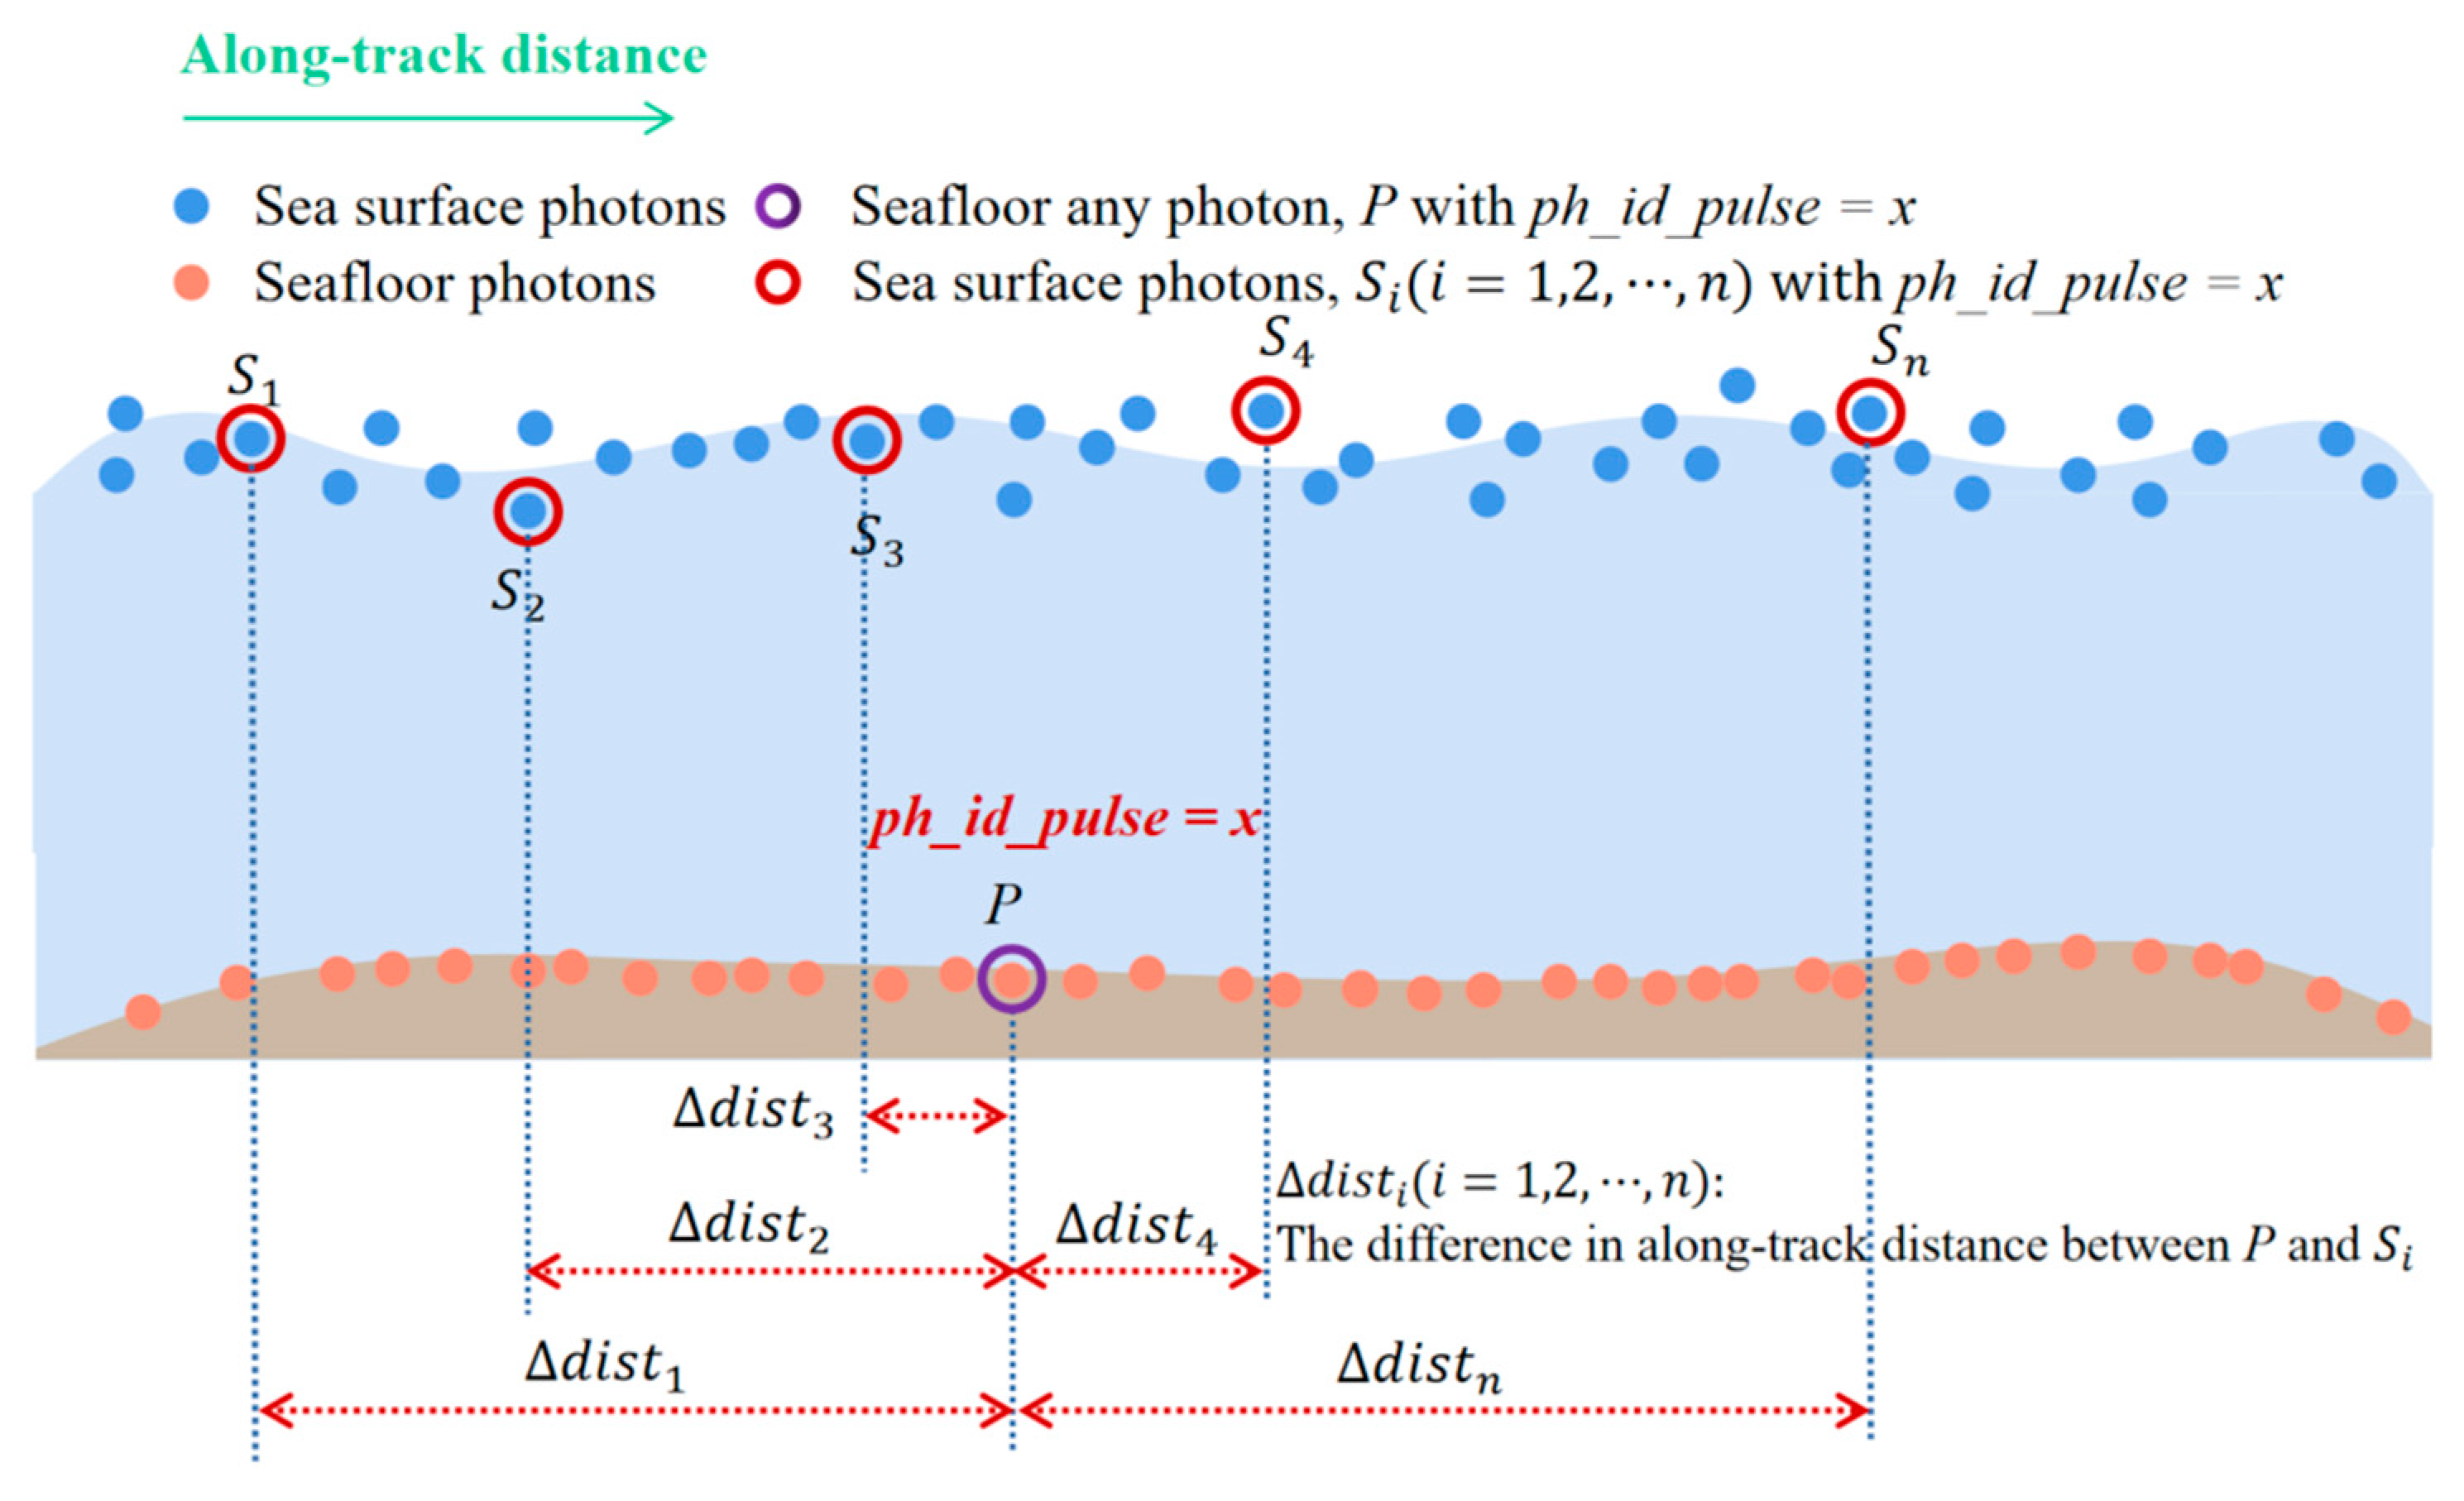
ph_id_pulse is reset for each new primary frame from counts 1 to 200 as part of the photon ID. Based on the along-track segment method, dist_ph_along is stored in ‘ATL03/gtx/heights’ in the segment projected to the ellipsoid of the received photon. We define a pair of seafloor and surface photons with the same ph_id_pulse and the slightest difference in dist_ph_along as being emitted by the same laser beam. As shown in Figure 6, any seafloor photon P with ph_id_pulse of x corresponds to n sea surface photons on the surface with ph_id_pulse also of x, denoted as S i ( i = 1,2 , , n ) , and the absolute value of the difference between the dist_ph_along of P and S i ( i = 1,2 , , n ) is denoted as d i s t i ( i = 1,2 , , n ) . The point with the smallest d i s t i is considered to belong to the same laser emission as P, such as the S 3 , and is defined as the sea–air intersection of P in Figure 6.
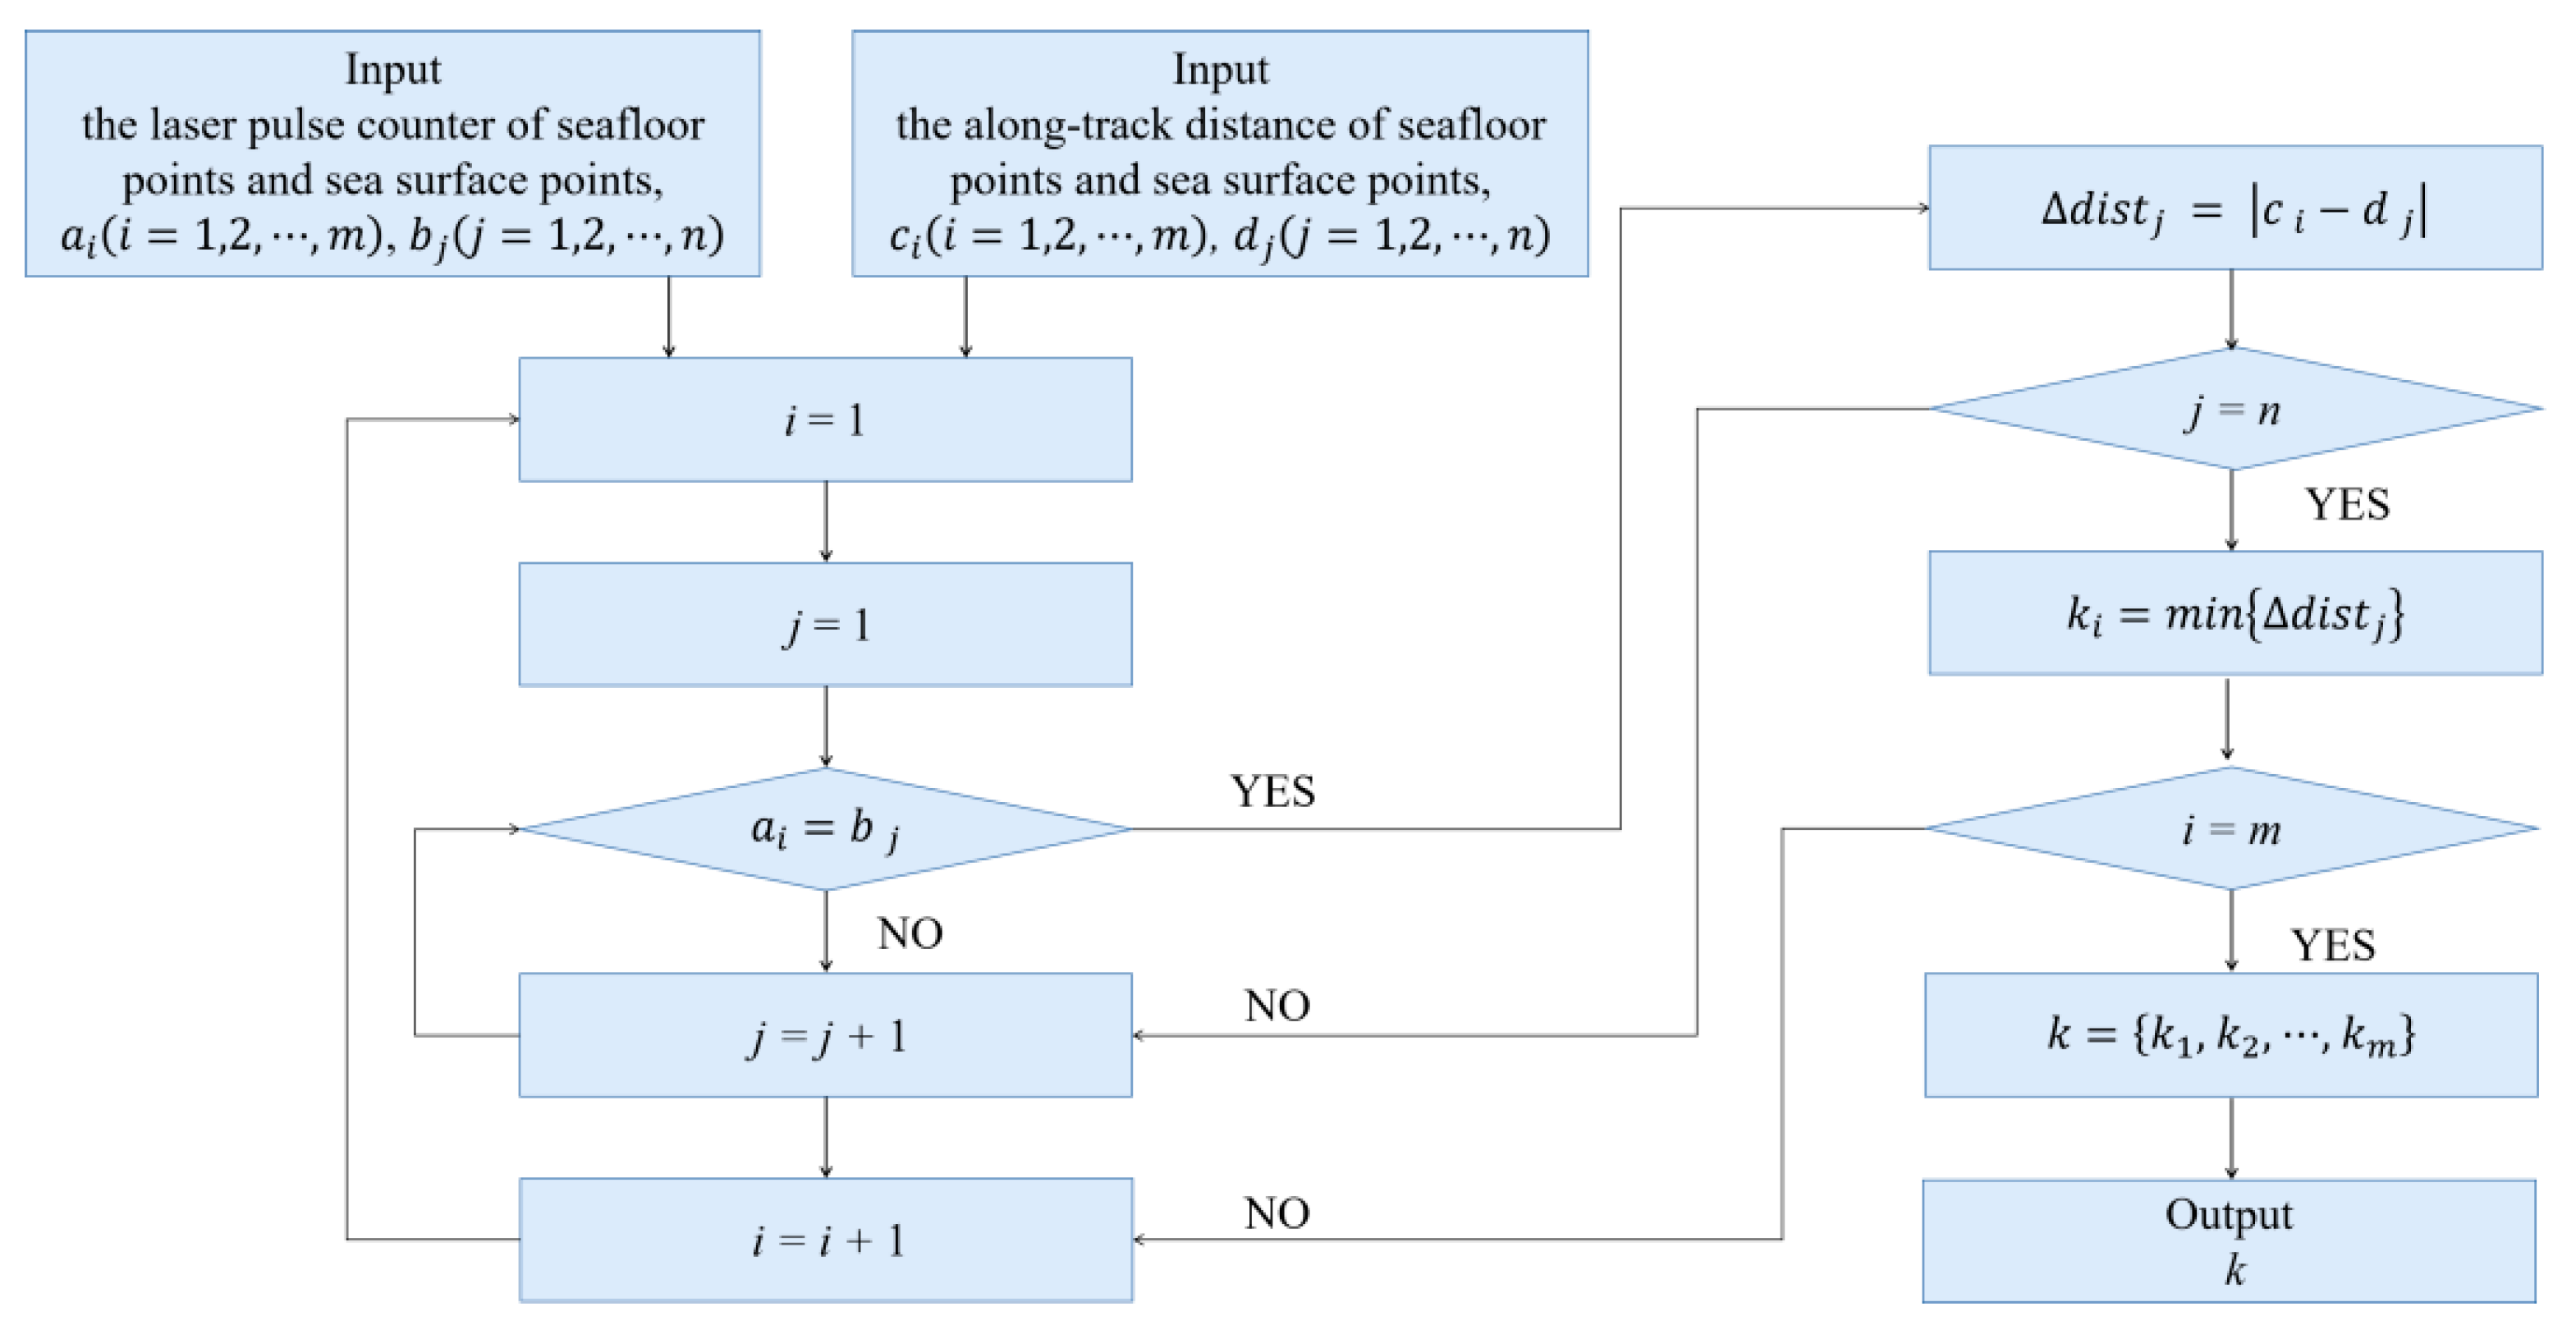
The parameters ph_id_pulse and dist_ph_along of the bathymetry photons serve as input data, and the connection flow depicted in Figure 7 develops the sea–air intersections of all the seafloor photons.
1. Input Parameters. Enter each photon’s parameters ph_id_pulse and dist_ph_along, denoting seafloor points as P i i = 1 , 2 , , m and surface points as S j ( j = 1 , 2 , , n ) .
2. Coarse matching based on ph_id_pulse. Starting from the first seafloor point P 1 , the laser pulse counter of P 1 is matched to that of the sea surface points S j ( j = 1 , 2 , , n ) , i.e., a 1 and b j ( j = 1 , 2 , , n ) are compared. When a 1 = b j , it means that P 1 and S j have the same ph_id_pulse.
3. Fine matching based on dist_ph_along. Calculate the absolute difference of the along-track distances between P 1 and S j , and call it d i s t j ( d i s t j = c 1 d j ). The sea surface photon S j at the d i s t j minimum is relabeled as k 1 .
4. For other sea surface points, P 2 ~ P m , the process of finding corresponding sea surface photons is the same with P 1 .
5. Output sea–air intersections. Output k = k 1 , k 2 , , k m .

4. Results

Data from six orbits over Culebra, acquired at different times and with separate coverage, are used for the experiment to ensure the adequacy and comprehensiveness of the experiment and avoid chance. Firstly, we verify through experiments that our refraction correction method can increase the accuracy of the shallow-sea bathymetry measured by ICESat-2. Meanwhile, to verify the reliability of our proposed method, two other refraction correction methods, namely Parrish’s [15] and Ma’s [20] methods, are selected for comparison experiments and use high-precision airborne LiDAR data as a reference. Parrish’s method [15] innovatively considered the ICESat-2 bathymetry errors due to the refraction phenomenon, and Ma’s method [20] firstly analyzed and corrected for bathymetry errors due to water column refraction effects, sea surface refraction, and water surface fluctuations. Both methods are classical refraction correction methods.

4.1. Refraction Correction and Bathymetry Results for Seafloor Signal Photons

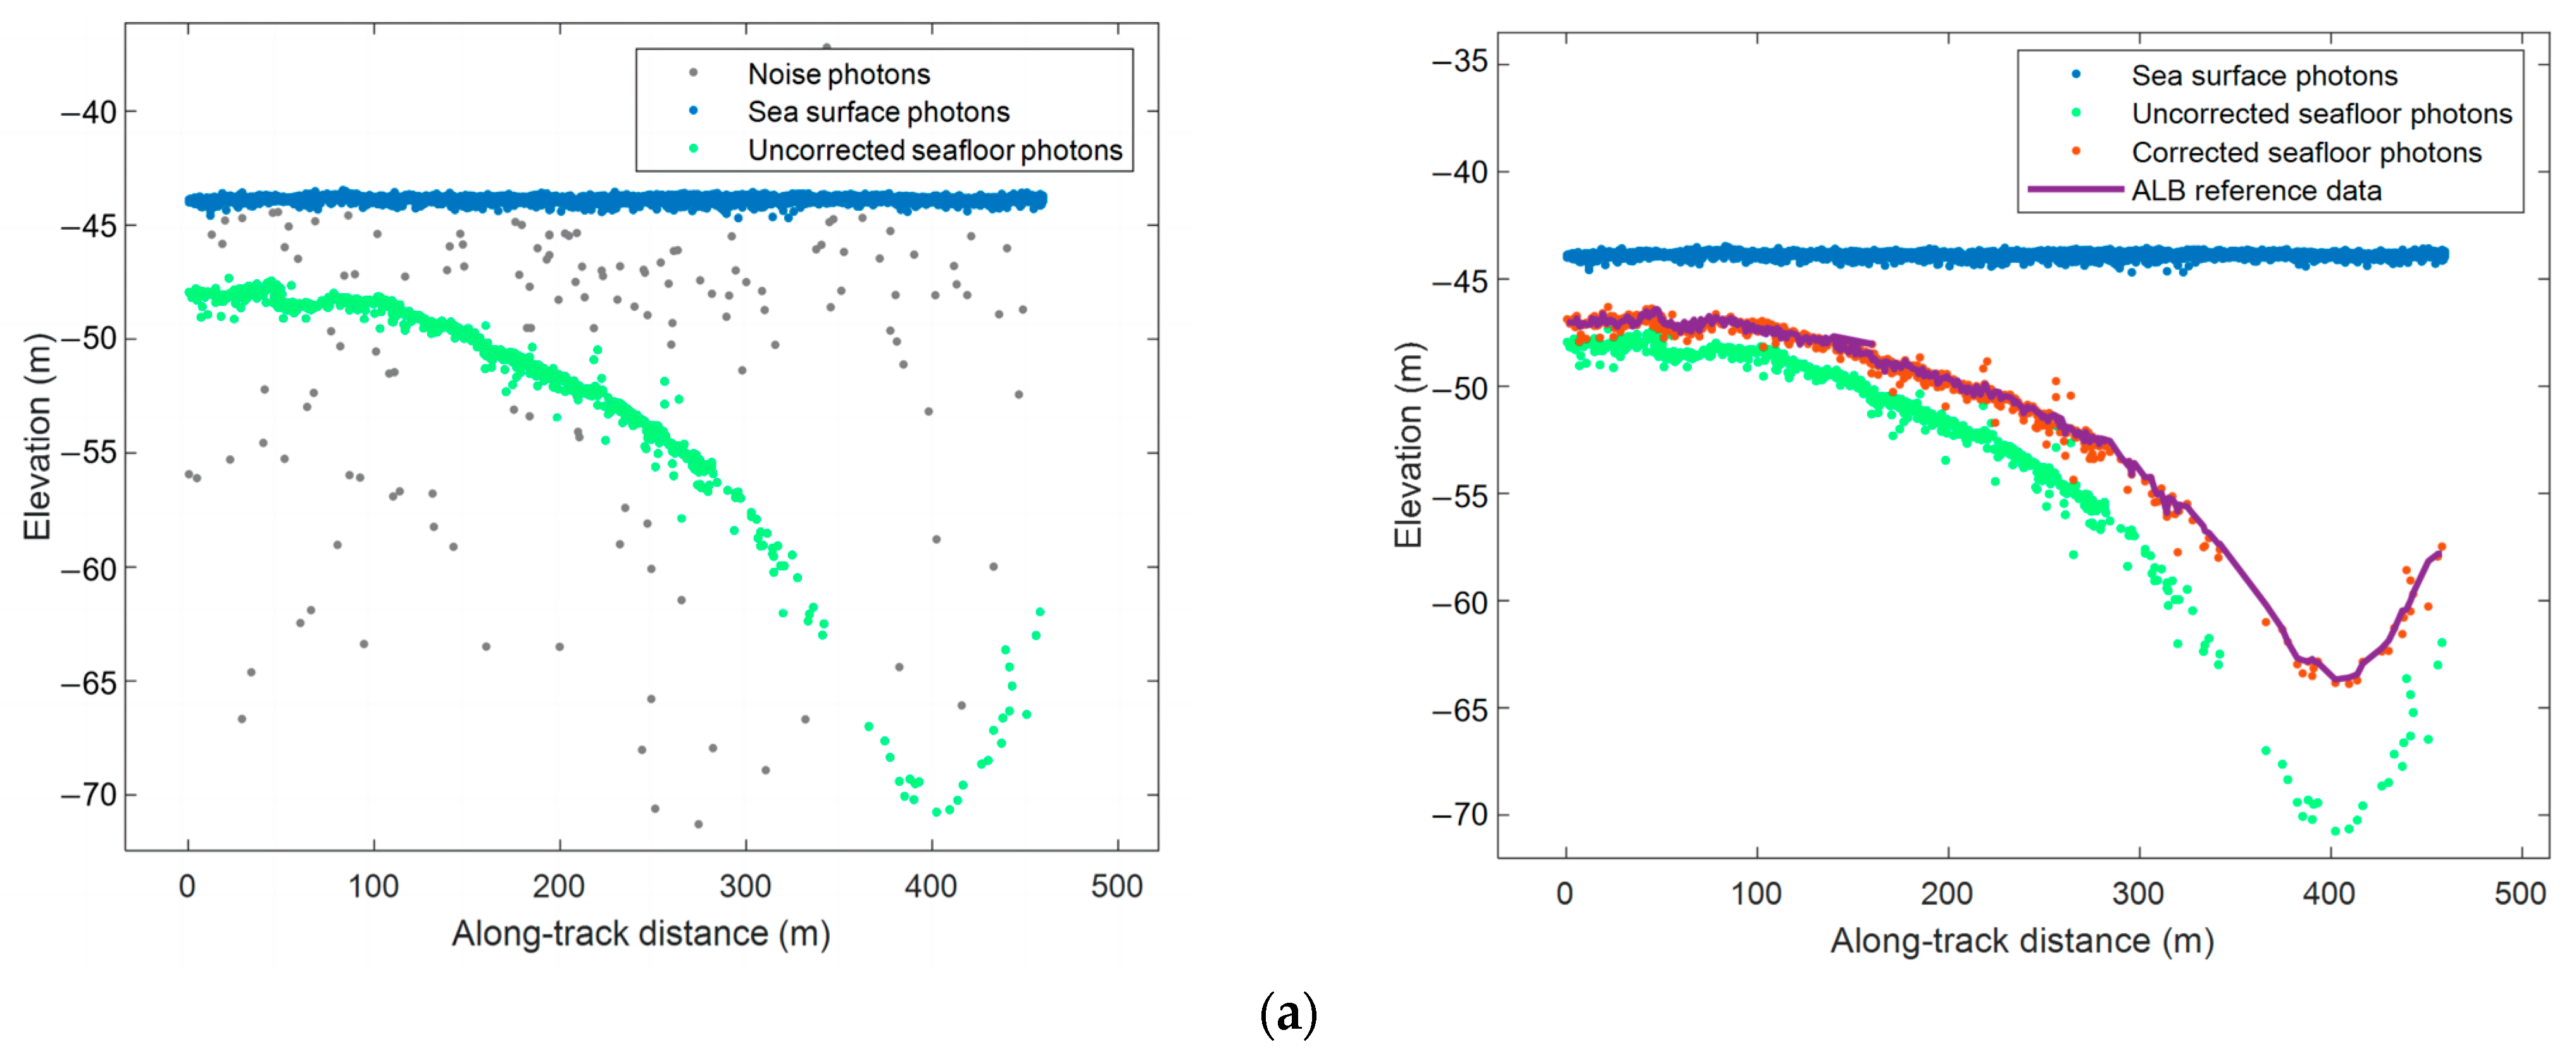
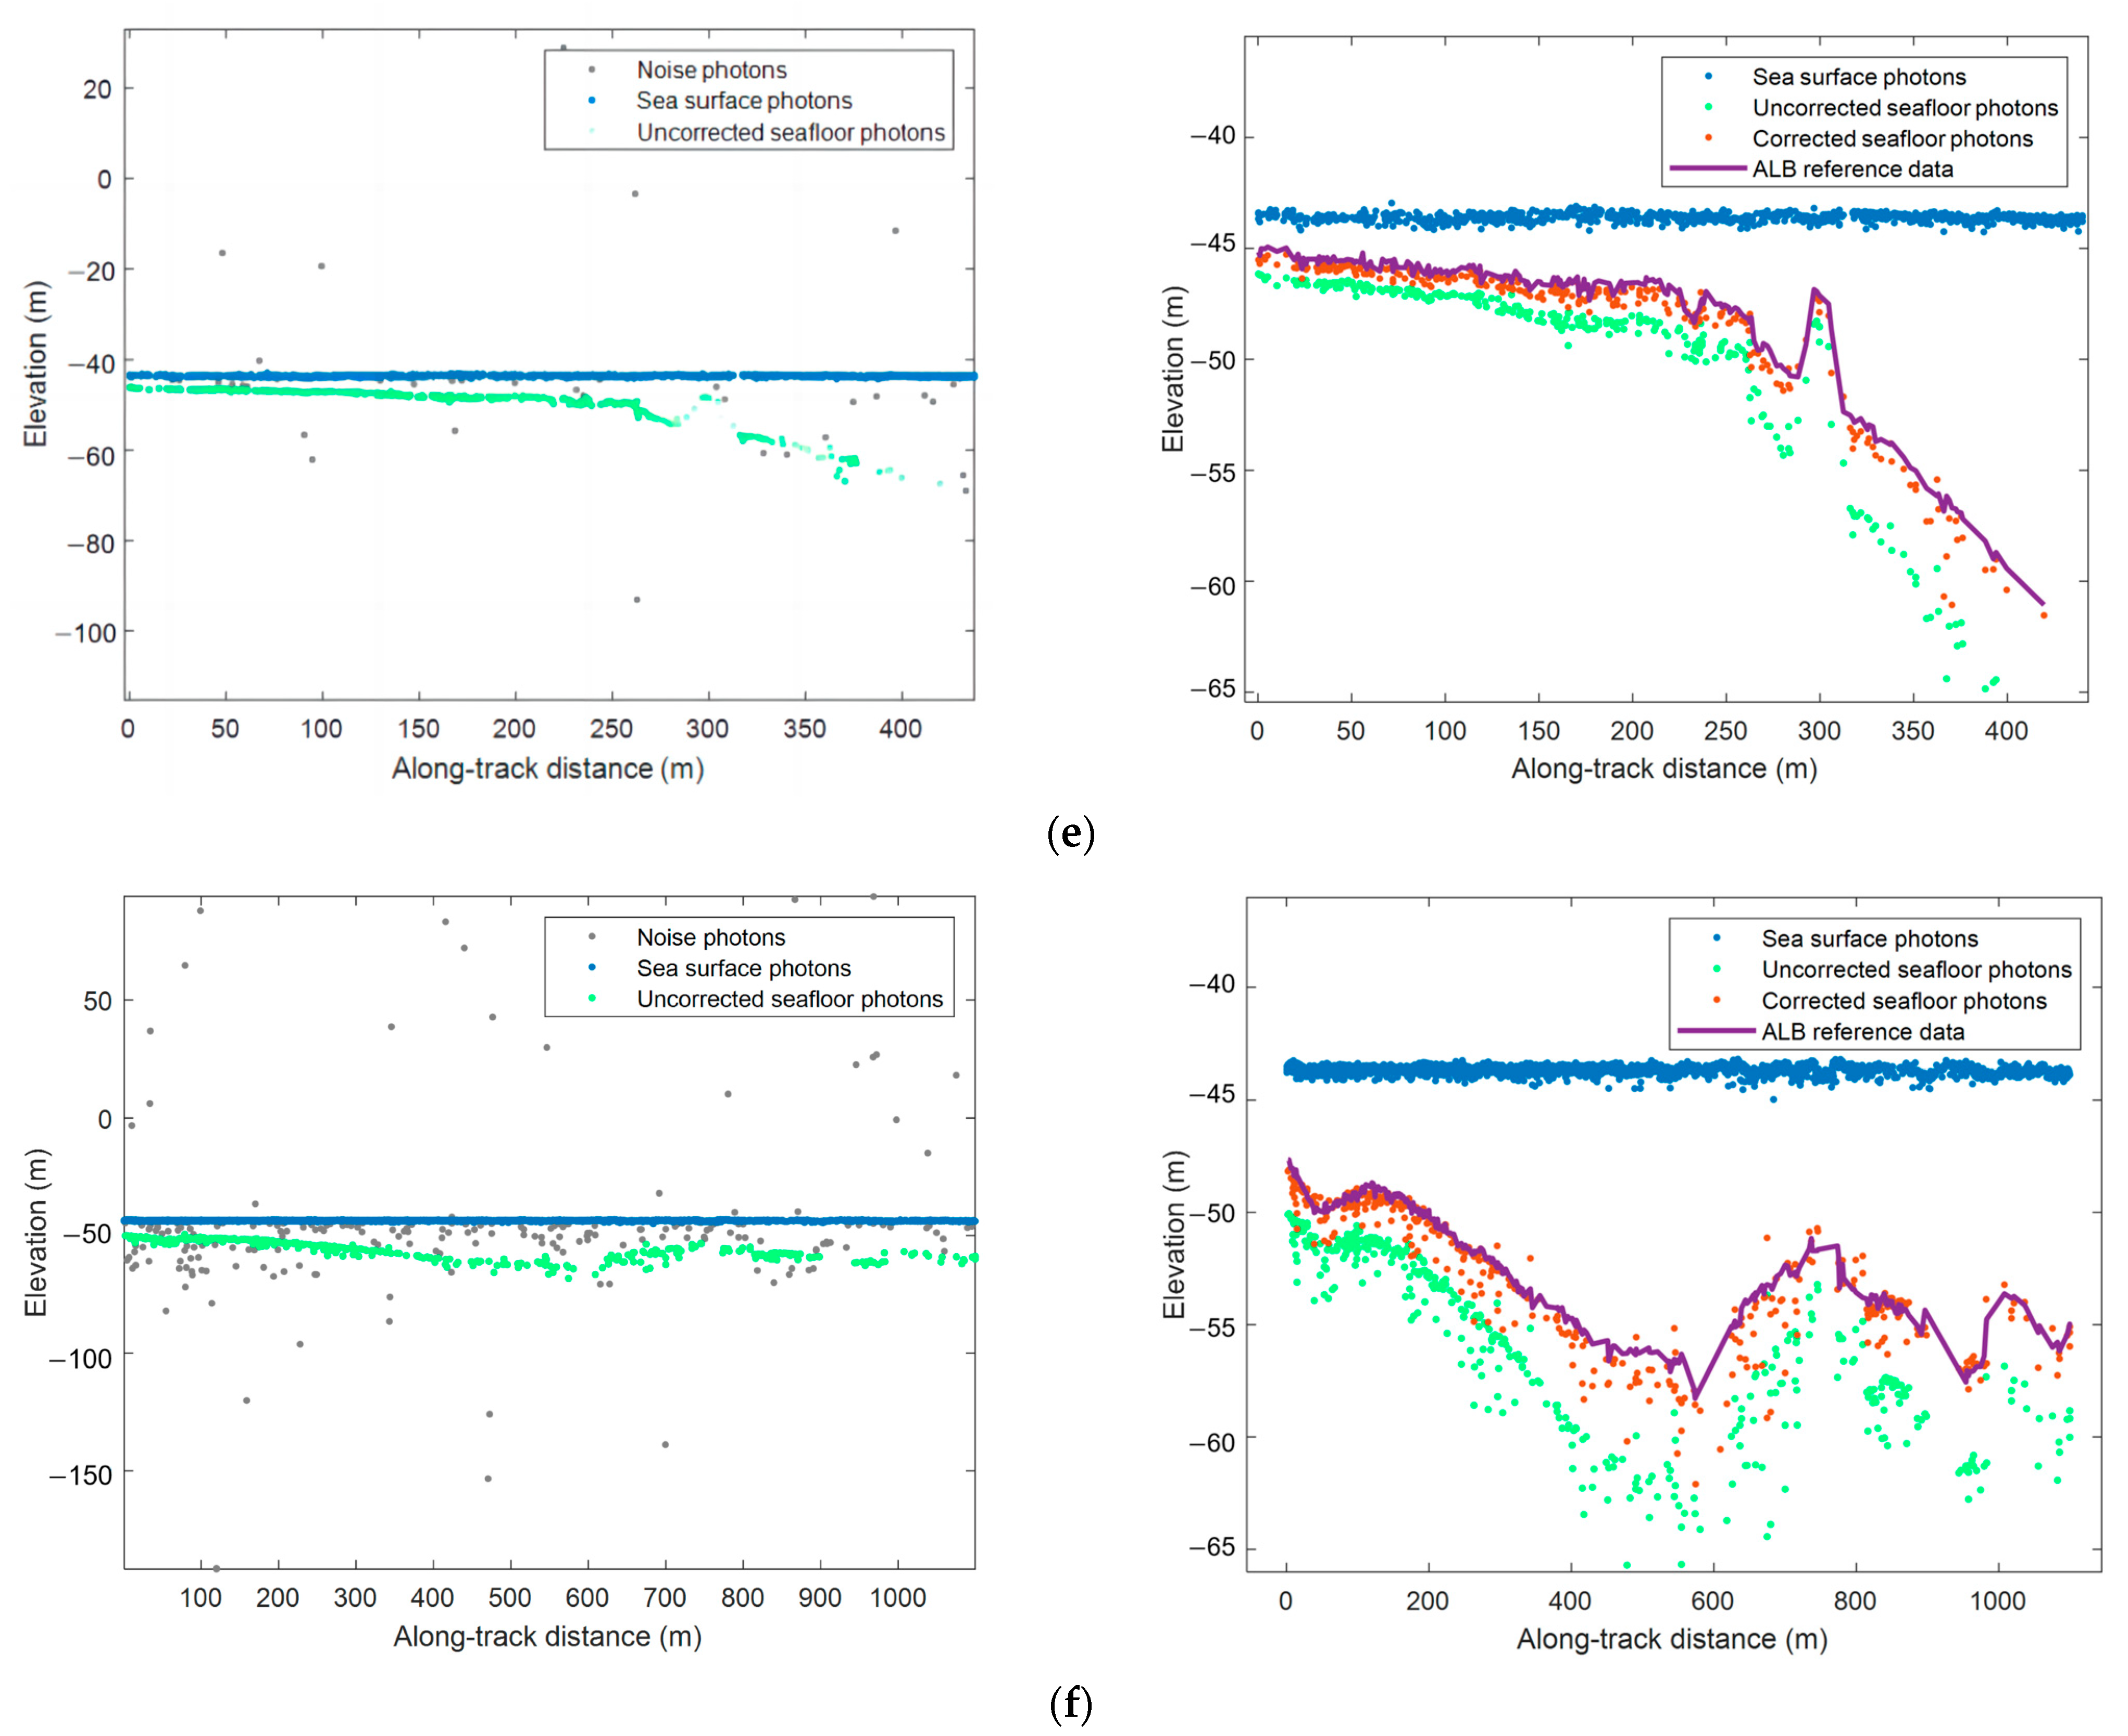
For the six orbits of Culebra (the six orbits data have different sea surface fluctuations and seafloor topography), the Quadtree Isolation [28] and the elevation histogram are used to extract and classify the signal photons first, and then the refraction correction of seafloor photons is carried out by our method, and the results are shown in Figure 8. The blue dots are sea surface photons, the gray dots are noise dots, and the green and brown dots are seafloor photons before and after correction. 20190119gt3l and 20200717gt3l were acquired in the afternoon when too much sunlight was more intense and contained more noise; 20181024gt3r, 20190420gt2l, and 20201016gt2l were obtained in the morning and had a lower noise content than data acquired in the afternoon; and 20200721gt2l was acquired in the early hours of the morning and contained the least amount of noise. By observation, it is found that the Quadtree Isolation [28] accurately removes most of the noise photons for orbital data acquired at different times and with varying noise contents. The elevation histogram also distinguishes the seafloor and sea surface.
Correction of seafloor photons using refraction correction in Section 3. Comparison of the seafloor photons before and after correction shows that the coordinates of the seafloor points stored in ATL03 are deeper than the actual measurements, while the deviation of their distances from each other increases as the water depth increases, as shown in the right column of Figure 8. The purple line is the elevation obtained by the high-precision ALB reference data. The ALB data and the refraction-corrected seafloor photons’ elevations generally agree. 20181024gt3r shows smooth topography variations and a corrected maximum water depth of 19.8897 m, so the seafloor photons best fit the ALB data. The topography of 20190119gt3l also changes gently, but the corrected maximum bathymetry reaches 24.4220 m. The topography of 20190420gt2l, 20200717gt3l, 20200721gt2l, and 20201016gt2l changes significantly, and the corrected maximum bathymetry is all less than 20.5 m. These five tracks show partial seafloor photons lying below the ALB data, which would result in photon-extracted water depths higher than the true value. These results show that the bathymetry precision and accuracy of ICESat-2 in nearshore bathymetry are affected by refraction phenomenon, water depth, and topography variations and that the bathymetry displacements of the seafloor photons increase with increasing water depth and drastic changes in topography.

4.2. Validation of Refraction Correction and Bathymetry

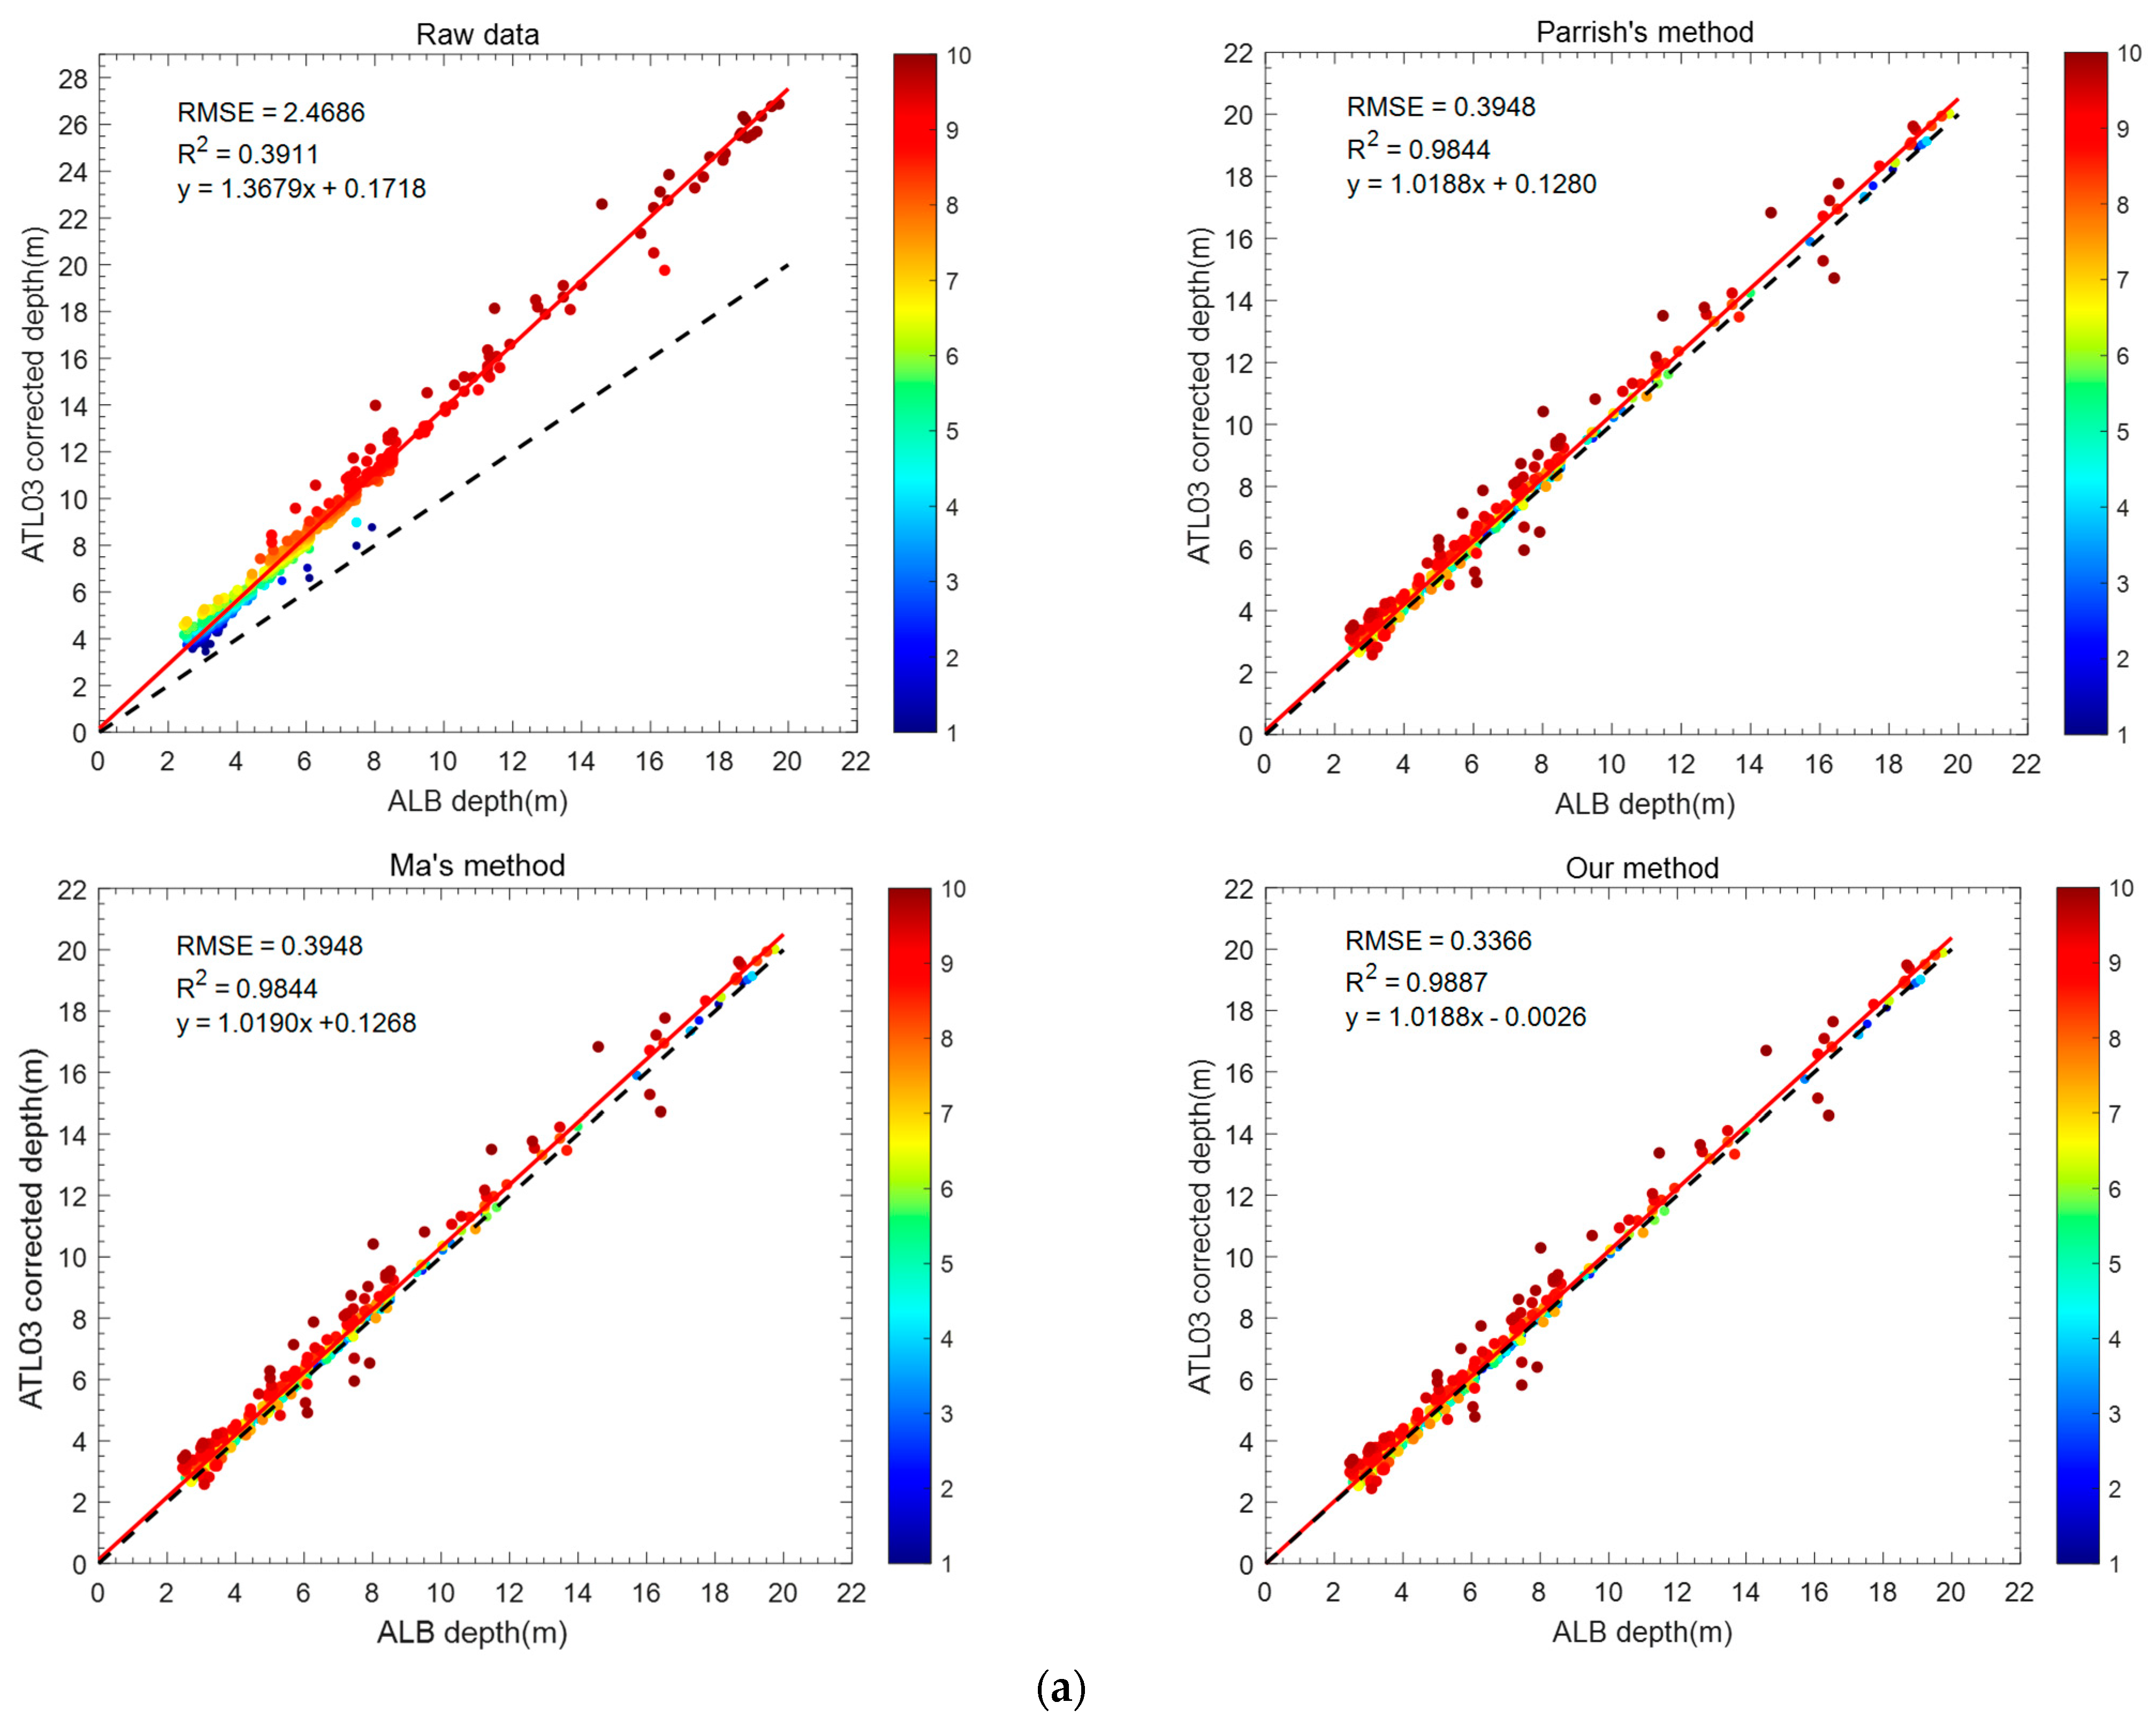
The accuracy of the bathymetry extraction and refraction correction methods proposed for ICESat-2 was confirmed by comparing bathymetry results before and after correction with the high-precision ALB reference data. We used our method, Parrish’s [15] and Ma’s [20] refraction correction methods, and calculated the RMSE and regression equations, as shown in Figure 9. Because the results for all tracks illustrate the reliability of our method and due to space constraints, Figure 9 shows only the data for 20181024gt3r and 20190119gt3l. The black dashed line is the 1:1 line, and the red solid line is the corresponding regression line. The brightness of the points in the map corresponds to the difference between ICESat-2 bathymetry and ALB bathymetry: the greater the difference, the brighter the points, and vice versa. Ten categories separate the variations between the two sets of data.
The results show that the ALB reference data and the raw ICESat-2 bathymetry differ significantly. Still, the ICESat-2 inverted bathymetry produced by three refraction correction methods shows substantial agreement with the ALB reference data. The ICESat-2 raw bathymetry regression line shows a significant deviation from the 1:1 straight line, with most bathymetry points being vast and brilliant. In contrast, the refraction correction regression line shows minimal variation from the 1:1 straight line, and the bathymetry points are mainly distributed on the 1:1 straight line, with only a slight overestimation. It indicates that refraction correction can improve the accuracy of bathymetry.
Our method produced bathymetry results using 6-track ICESat-2 data that were significantly similar to the ALB results. The root mean square error (RMSE) ranged from 0.3366 m to 1.5566 m, and the correlation coefficient ( R 2 ) ranged from 0.7359 to 0.988. Table 2 provides further details. Compared to the raw water depth, our method effectively improves the bathymetry accuracy of ICESat-2 (RMSE of 2.4686 m to 6.7885 m before refraction correction). The RMSE reduction in the 20190119gt3 orbit is the largest, which decreases by 5.2319 m. The most minor reduction in RMSE is the 20200721gt2l track, which has a decrease of 1.8842m. In contrast to Parrish’s [15] and Ma’s [20] methods, ours makes full use of the parameters provided by ATL03 to realize the connection between the seafloor and surface photons and considers the variation in the laser incidence angle when the sea surface undulates. The RMSE of the refraction correction results of Parrish’s [15] and Ma’s [20] methods are 0.3948 m~1.6063 m, 0.3948 m~1.6047 m, and the R 2 is 0.7229~0.9844 and 0.7229~0.9844, respectively. For the 20181024gt3r orbit, the RMSE received by our method is 0.3366 m, which is 0.0582 m less than the RMSE obtained by both Parrish’s [15] and Ma’s [20]; for the 20190119gt3l orbit, the RMSE obtained by our method is 1.5566 m, a decrease of 0.0497 m and 0.0481 m over the RMSE obtained by Parrish’s [15] and Ma’s [20], respectively. Our method has optimal RMSE and R 2 in all cases. Therefore, our proposed refraction correction and water depth extraction methods are reliable.

5. Discussion

To further validate the accuracy of our proposed refraction correction and bathymetry methods, as well as to recognize the sources and effects of the errors, the error distributions of the bathymetry before and after correcting the 6-track ICESat-2 are counted with the ALB as the reference data (refraction correction using Parrish’s [15], Ma’s [20], and our method, respectively). To assess our method’s robustness, we statistically determined the accuracy of each refraction correction method in different water depths.

5.1. Error Analysis of Bathymetry

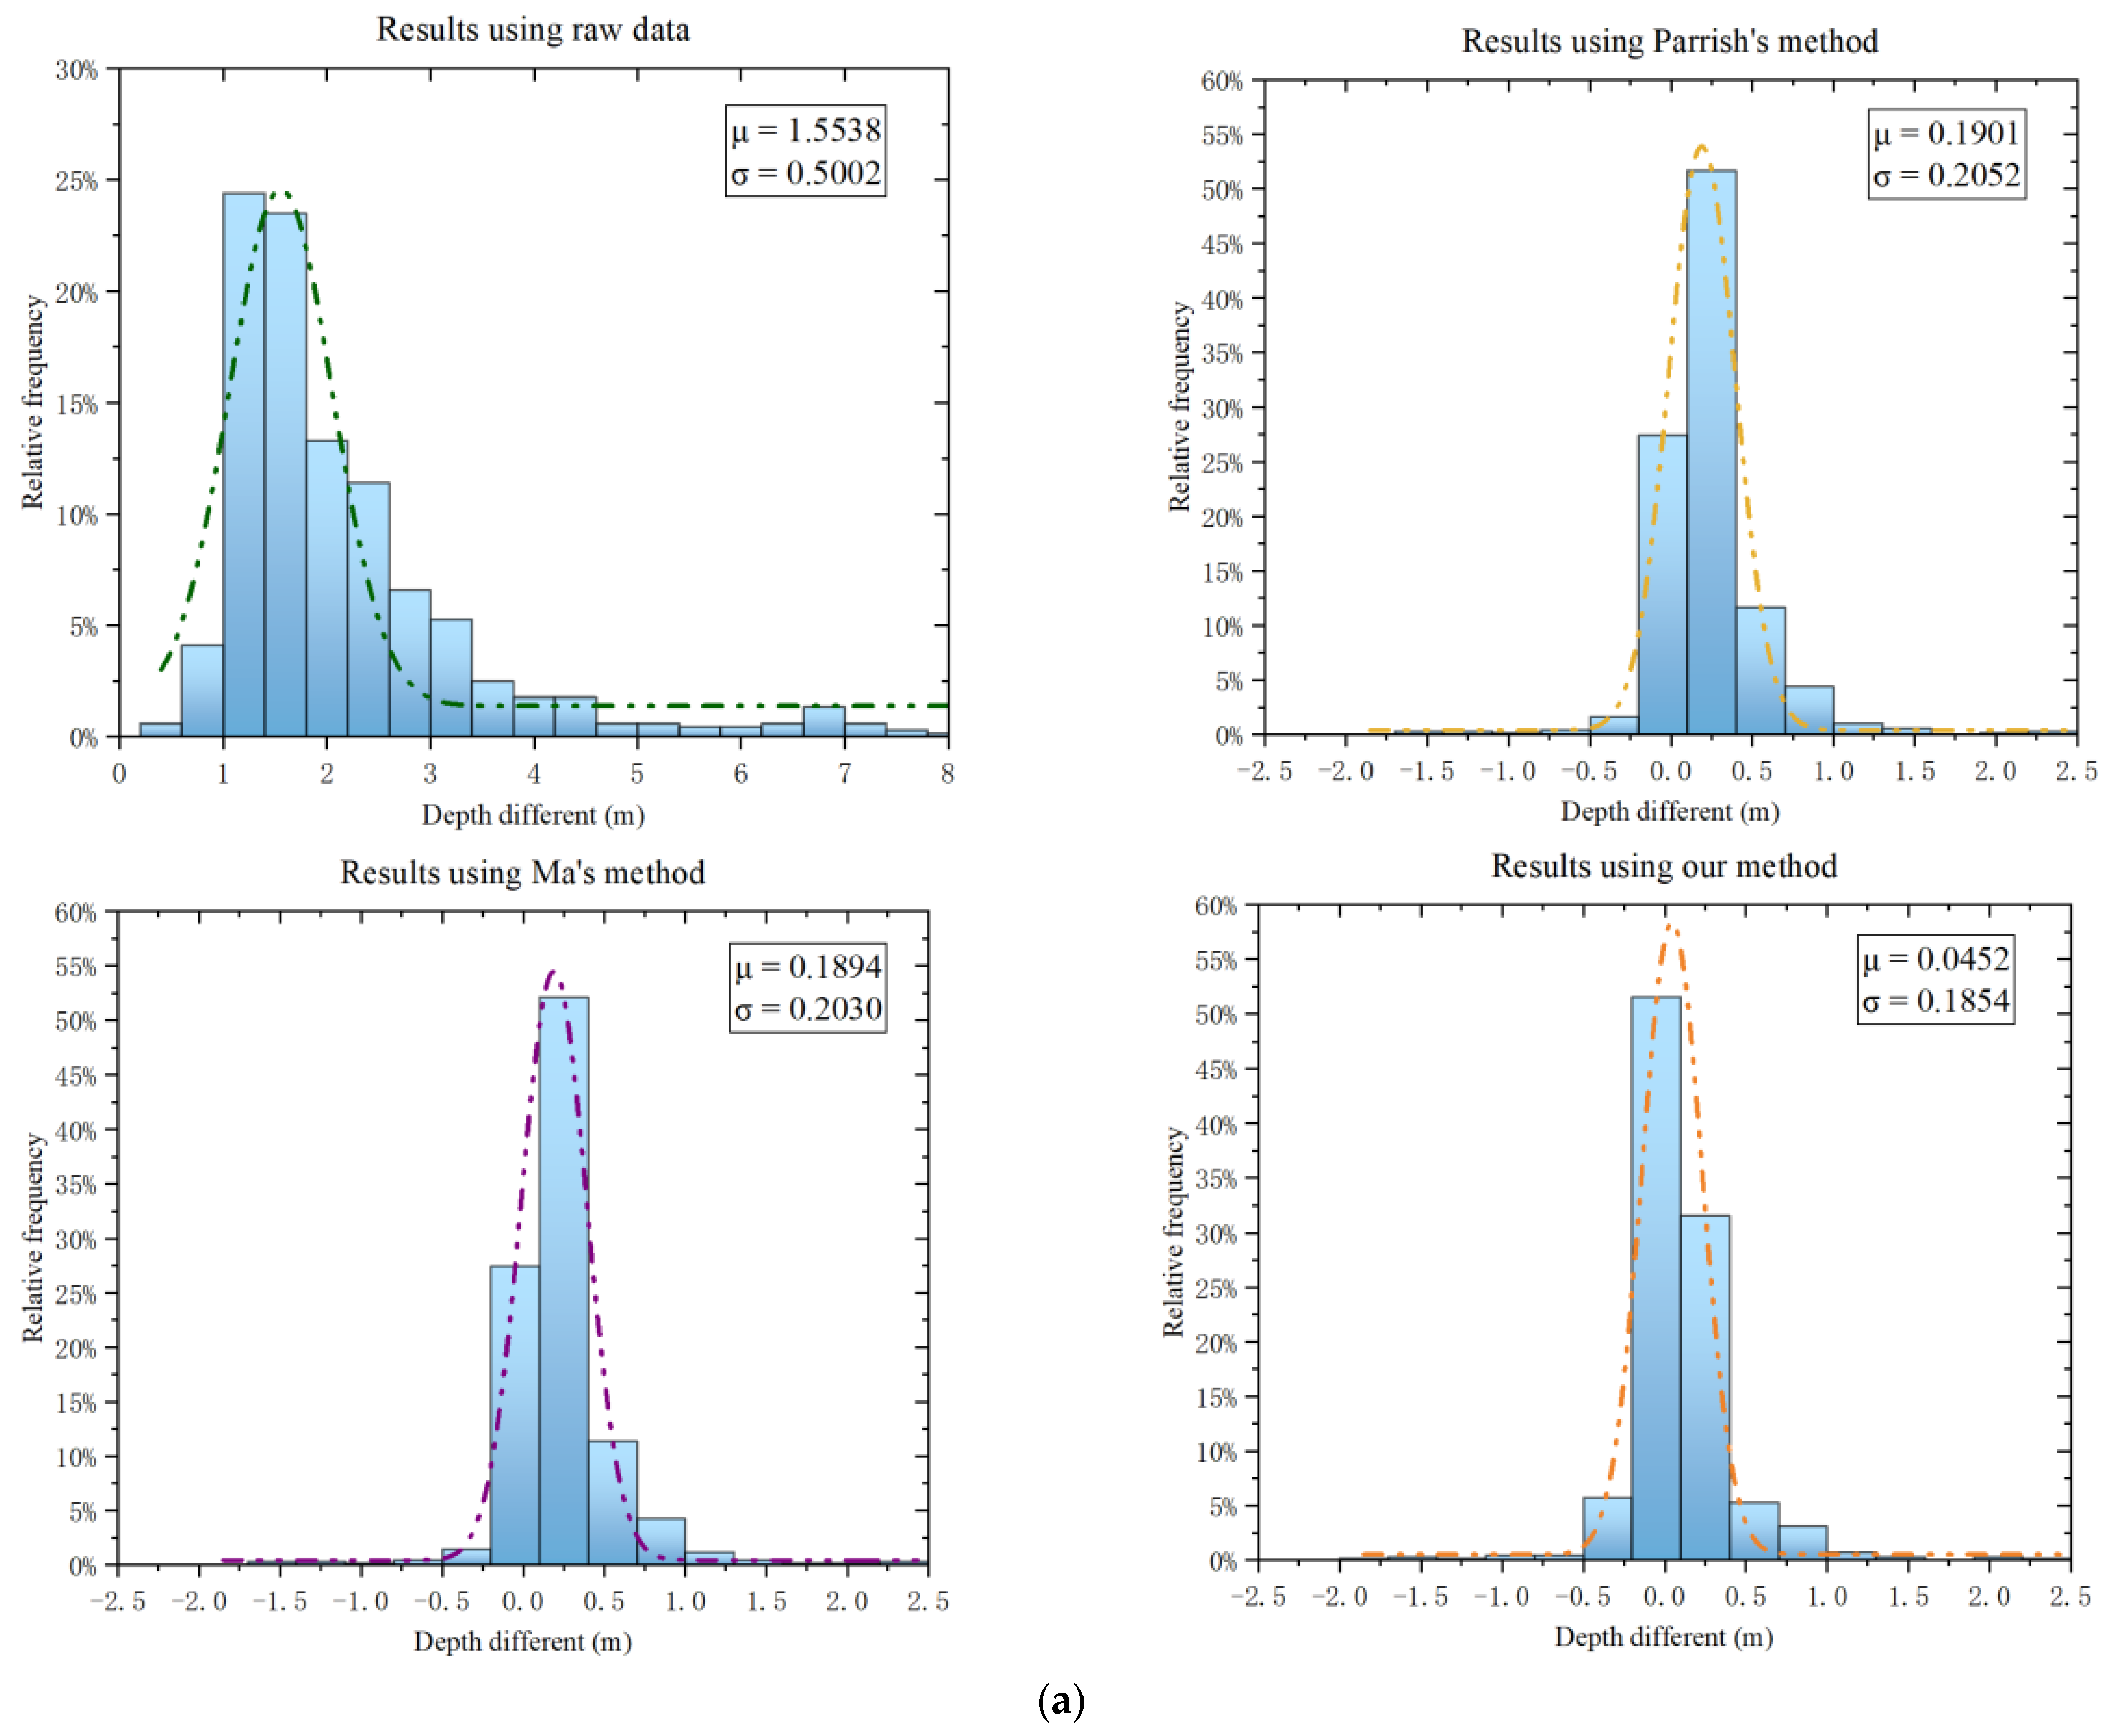
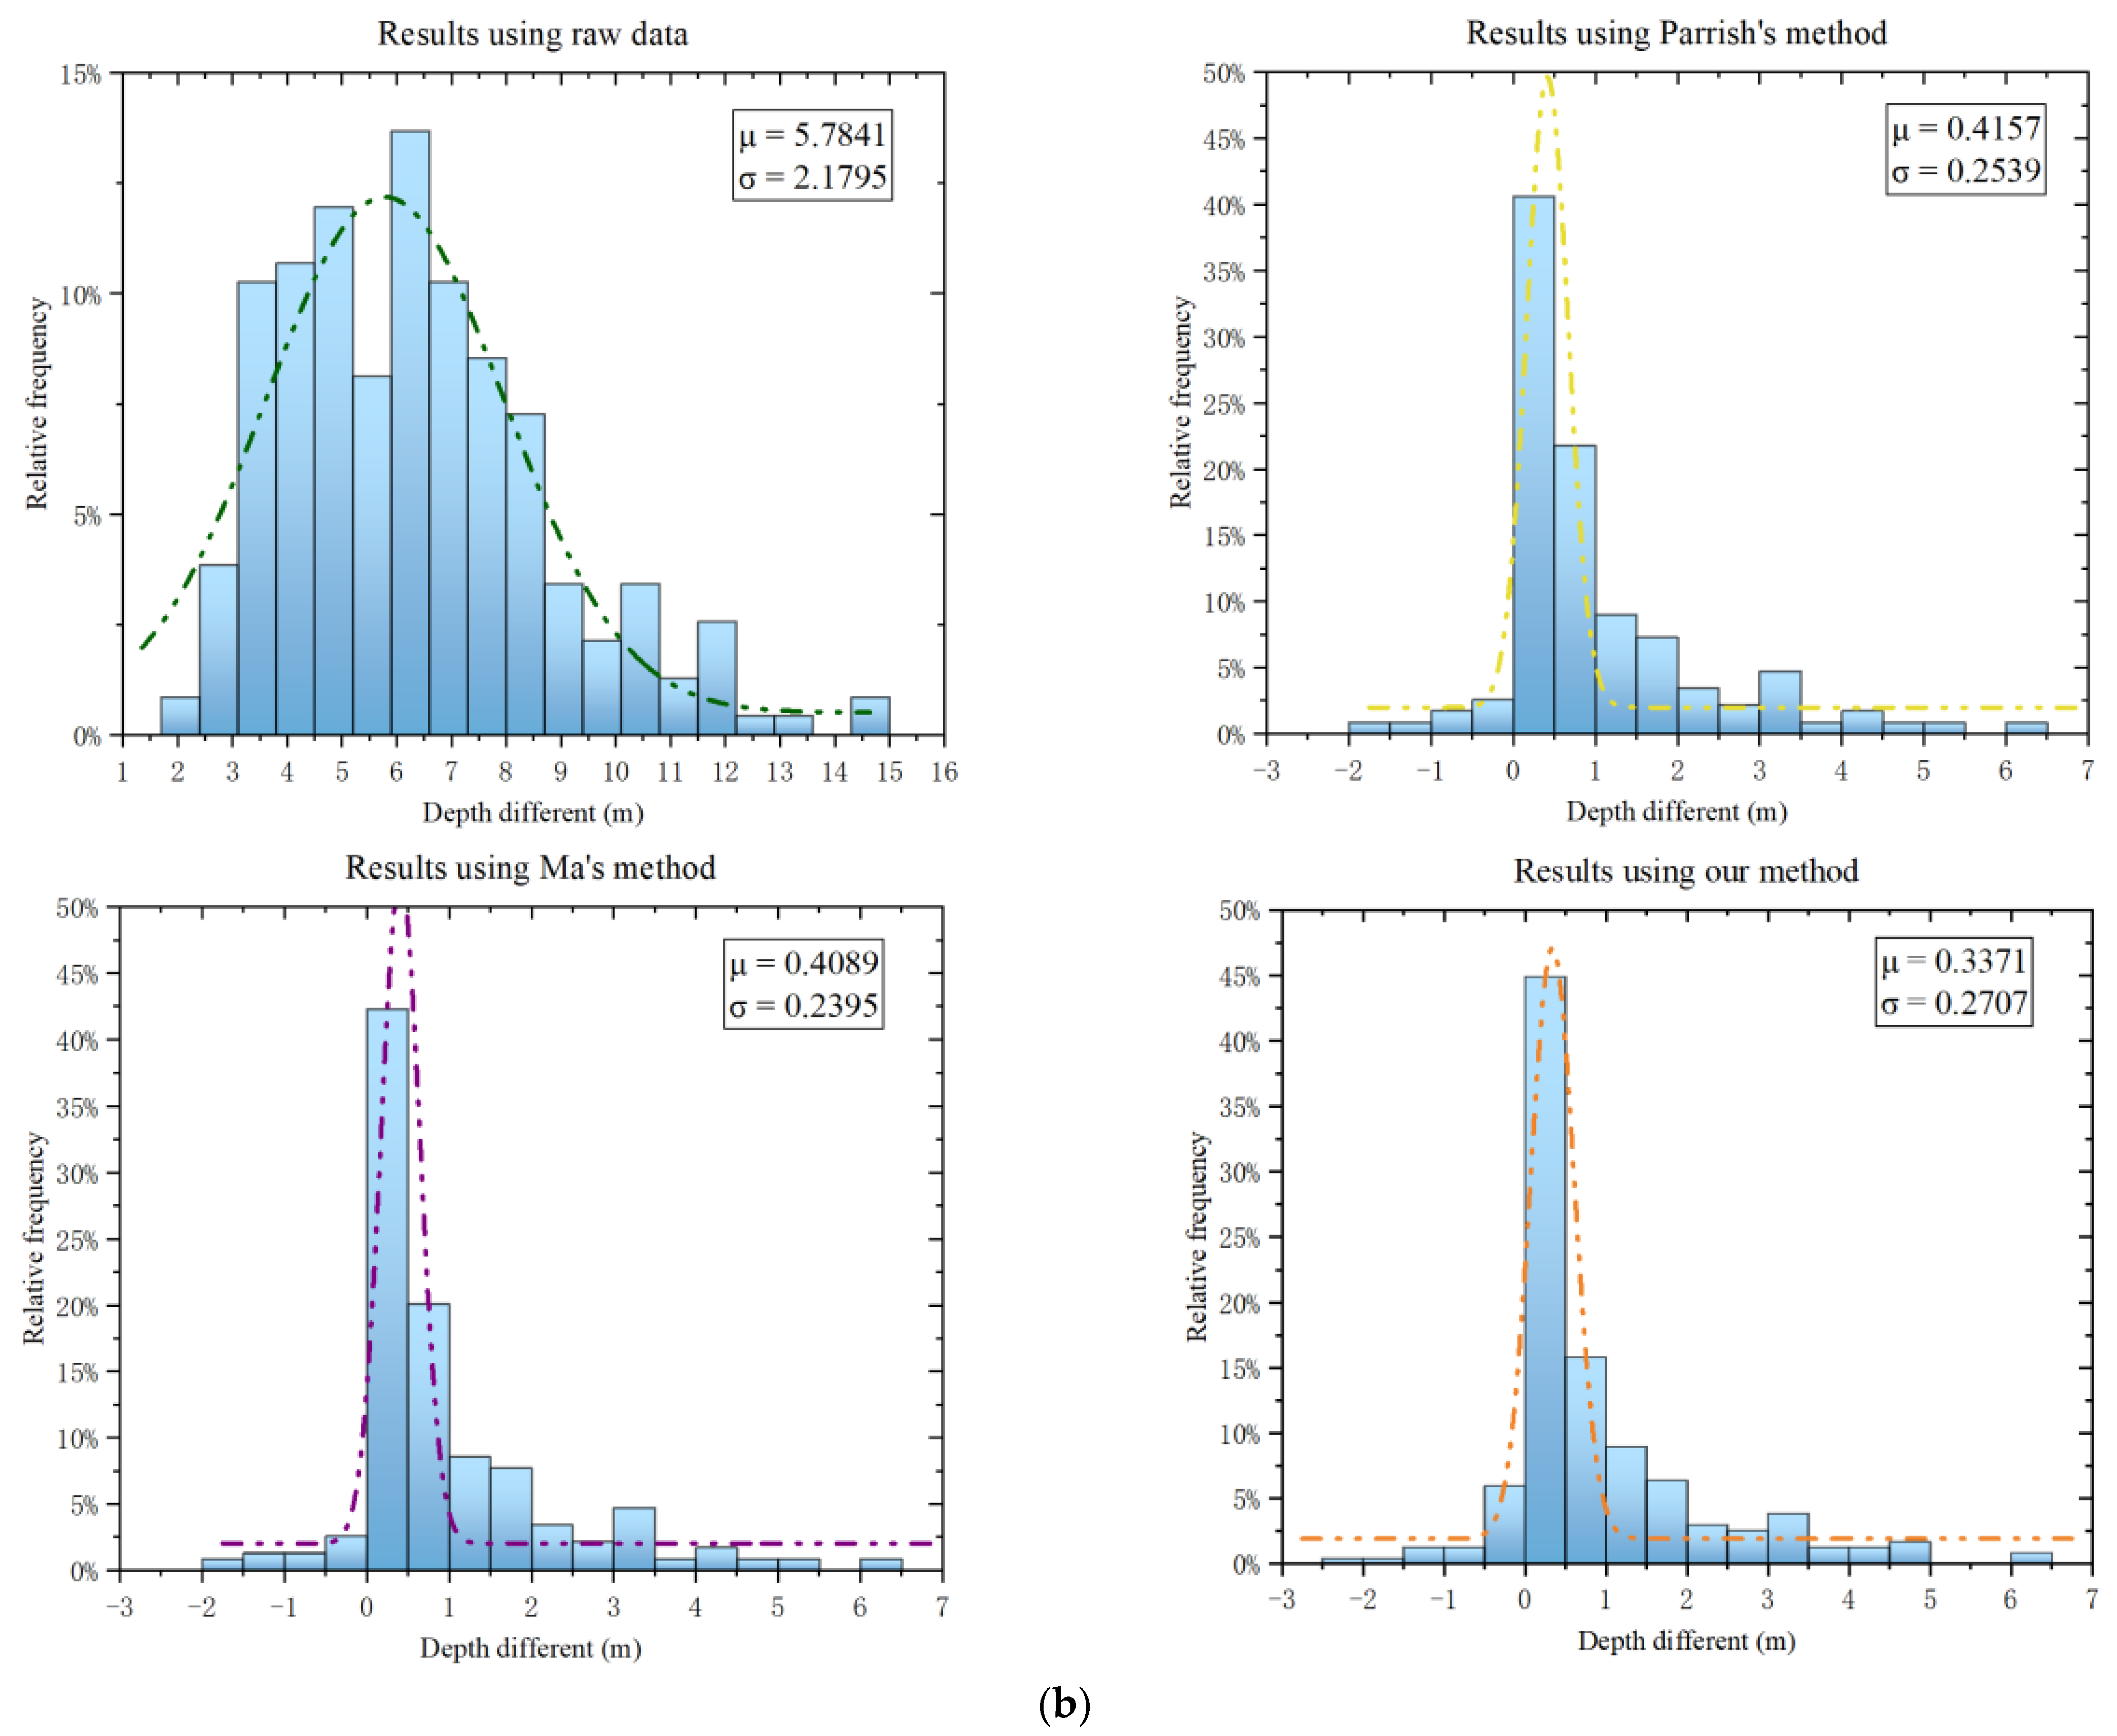
To better evaluate the ability of our method to weaken the bathymetry error, the high-precision ALB bathymetry data were used as the true value, and the error statistics and analysis were performed for both the raw and corrected bathymetry, as shown in Figure 10. Because the results for all orbits illustrate that our method can reduce bathymetry errors, and due to space constraints, Figure 10 only shows the data for 20181024gt3r and 20190119gt3l. The other data reflect the situation consistent with these two sets of data. The dashed line is the error fitting curve. The raw bathymetry curve is flat and distributed over a wide area. In contrast, the curve for corrected bathymetry is steep, with a small and centralized distribution of errors.
The statistical measures for the errors, including the range, mean, and standard deviation, have been listed in Table 3. The error’s mean value of the raw bathymetry error is 1.3500 m~5.7841 m, and the standard deviation is 0.0750 m~2.1795 m. The mean and standard deviation of the corrected bathymetry error obtained by our method are significantly reduced (the mean value is 0.0452 m~0.4053 m, and the standard deviation is 0.0923 m~0.5507 m). However, the standard deviation of the raw water depth for track 20200721gt2l is 0.0750 m, which is smaller than that of the corrected water depth. The slight standard deviation indicates that most errors in raw bathymetry are distributed around the mean. However, the error range of the raw water depth of this orbit is 0.8338 m~10.3489 m, and the mean value is 1.3500 m. Therefore, a significant error still exists between the raw water depth and the true water depth of the 20200721gt2l orbit, which requires refraction correction.
Compared to Parrish’s [15] (mean: 0.1901 m~0.4371 m) and Ma’s [20] (mean: 0.1894 m~0.4368 m) methods, our method yields the smallest mean value of the water depth, which is closest to 0, i.e., most relative to the true value of the water depth. For the 20181024gt3r orbit, our method yields a mean value of 0.0452 m, which is 0.1449 m and 0.1442 m smaller than that of Parrish’s [15] and Ma’s [20] methods, respectively; for the 20190119gt3l orbit, our method yields a mean value of 0.3371 m, which is smaller than that of those of Parrish’s [15] and Ma’s [20] methods by 0.0786 m and 0.0718 m, respectively. In addition, although the standard deviation of the 20190119gt3l orbit and the 20200717gt3l orbit obtained by our method is not the smallest, the mean value obtained by ours is the smallest, which explains the errors in the bathymetry results obtained by our method are distributed around smaller values.
Further, compared with Parrish’s [15] method, our method considers the influence of sea surface fluctuation on ICESat-2 photon bathymetry. Compared with Ma’s [20] method, we classify the fluctuation of the sea surface reasonably. The reason for more consideration is that the change in the sea surface complicates the refraction phenomenon. Assuming the sea surface is flat, the angle of incidence of the laser is constant. However, due to the influence of sea breeze, the incidence direction of the laser relative to the sea surface is often changed. In addition, based on Snell’s law, we establish a refraction correction and water depth extraction model by using the spatial position relationship between laser beams, which is very friendly for scholars new to refraction error correction.
Therefore, experimental data and algorithm principles show that our method is more comprehensive, can effectively correct the bathymetry error caused by the refraction phenomenon, and can weaken the error better than other methods.

5.2. Analyzing the Accuracy of Refraction Correction Methods for Different Water Depth Intervals

To further analyze the bathymetry capability of our method in different water depth segments, the data were grouped according to a 2-m water depth interval based on the minimum water depth value for each track of data. The RMSE of ICESat-2 raw and corrected bathymetry is calculated within each interval segment for each data track, using the ALB as the reference bathymetry, as shown in Table 4.
The comparison demonstrates that our bathymetry error correction methods have minor RMSE in various bathymetry intervals of different orbital data than the ICESat-2 raw bathymetry data and other bathymetry error correction methods. It suggests that our method is more adaptable to different bathymetry. The statistics also indicate that the RMSE progressively rises with increasing water depth. Because seawater at different depths has different temperatures, salt densities, and various watercolor elements that contribute to seawater stratification, the propagation of lasers in water bodies is exceptionally complex, and multiple refractions may occur during the process. At the same time, due to the complexity of the geometric configuration of the photon path, there is still a specific difference between the actual propagation path of the photon and the corrected path, so with the increase of the depth, the photon bathymetry accuracy will also have an inevitable decrease.
However, there are anomalies in the 20201016gt2l, 20200717gt3l, and 20200721gt2l track data. The RMSE for the 6 to 8 m water depth interval of the 20190420gt2l track is 0.9828 m, more significant than the RMSE for the 8 to 10 m and the two water depth intervals greater than 10 m for this track. The seafloor topography corresponding to this track (Figure 8c) shows that the presence of water depths of 6 to 8 m is a variation in seafloor topography. The RMSE of the 4 to 6 m and 6 to 8 m water depth intervals of orbit 20200717gt3l is 1.4119 m and 1.2151 m, respectively, and the RMSE of these intervals is greater than the RMSE for the 8 to 10 m water depth intervals of this orbit. By looking at the seafloor topography corresponding to this track (Figure 8d), there is an apparent variation in seafloor topography at water depths of 4 to 6 m, and 6 to 8 m. Figure 8e shows that there is an undulation of the seafloor topography at a water depth of about 6 m. In comparison, the 20200721gt2l track has a significant bathymetry error in the water depth interval of 6 to 8 m, with the RMSE of 1.1099 m, which is larger than the RMSE of the track in the water depth interval of 8 to 10 m. The analysis indicates that changes in seafloor topography mainly cause anomalous bathymetry errors. This is because discrepancies in the seafloor topography increase the positioning error of ATL03 photons [29].

6. Conclusions

To increase the accuracy of ICESat-2 bathymetry, we present an innovative refraction correction method in this study based on ATL03 photon parameter tracking. The sea–air intersection and related sea surface slope angle and laser incidence angle are calculated for each seafloor photon using the parameters provided by ATL03. Then, according to Snell’s law and the geometric relationship between the laser beams, the correction of the bathymetry error of the seafloor photons is realized. The corrected water depth generated by the proposed approach is compared with the ALB reference water depth using six ATL03 orbit data in Culebra to verify reliability and accuracy. The highest precision of the proposed method is 0.3366 m for RMSE and 0.9887 for R 2 . Our method has higher accuracy and more robust adaptation to bathymetry changes than others. It provides essential evidence for the reliability of ICESat-2’s bathymetry performance in Culebra and contributes positively to the accurate prediction of bathymetry.
Further, based on experiments and discussions, we have identified two factors that affect the accuracy of ICESat-2’s refraction correction:
1. Drastic changes in seafloor topography: If the seafloor topography undergoes significant changes, it can decrease the photon localization accuracy of ICESat-2.
2. Increase in water depth: As water depth increases, laser pulse energy weakens, and laser path recovery becomes more difficult due to water propagation’s complexity.
Our study provides valuable information for nearshore area management, resource development, and utilization. However, the accuracy of the bathymetry obtained by our method needs improvement for applications that require higher precision, such as navigation charts. This is due to seafloor topography fluctuation and increasing water depth. In the future, we will continue to enhance the adaptive capability of the method to adapt to bathymetric measurements in different environments.

Author Contributions

Conceptualization, L.C. and S.X.; methodology, L.C. and S.X.; software, L.C. and G.Z.; validation, L.C., S.X. and G.Z.; formal analysis, L.C.; data curation, S.G.; writing—original draft preparation, L.C.; writing—review and editing, L.C., G.Z. and M.G. All authors have read and agreed to the published version of the manuscript.

Funding

This research was funded by the National Natural Science Foundation of China Projects (Grant No. 41876105, 41371436).

Data Availability Statement

The ICESat-2 ATL03 product can be downloaded from https://search.earthdata.nasa.gov, accessed on 15 September 2023. Airborne LiDAR data published by NOAA’s Office of Coastal Management in the article is available at https://www.coast.noaa.gov/dataviewer/#/lidar/search/, accessed on 15 September 2023.

Acknowledgments

We thank the National Aeronautics and Space Administration (NASA) for providing ICESat-2 data and NOAA’s Office of Coastal Management for providing Airborne LiDAR data.

Conflicts of Interest

The authors declare no conflict of interest.

References

  1. Dong, Y.; Liu, Y.; Hu, C.; Xu, B. Coral reef geomorphology of the Spratly Islands: A simple method based on time-series of Landsat-8 multi-band inundation maps. ISPRS J. Photogramm. Remote Sens. 2019, 157, 137–154. [Google Scholar] [CrossRef]
  2. Andersen, J.H.; Al-Hamdani, Z.; Harvey, E.T.; Kallenbach, E.; Murray, C.; Stock, A. Relative impacts of multiple human stressors in estuaries and coastal waters in the North Sea-Baltic Sea transition zone. Sci. Total Environ. 2020, 704, 135316. [Google Scholar] [CrossRef] [PubMed]
  3. Zhang, X.H.; Chen, Y.F.; Le, Y.; Zhang, D.F.; Yan, Q.; Dong, Y.S.; Han, W.; Wang, L.Z. Nearshore Bathymetry Based on ICESat-2 and Multispectral Images: Comparison Between Sentinel-2, Landsat-8, and Testing Gaofen-2. IEEE J. Sel. Top. Appl. Earth Obs. Remote Sens. 2022, 15, 2449–2462. [Google Scholar] [CrossRef]
  4. Wang, Z.; Yang, X.; Su, F.; Zhang, H.; Yan, F.; Zhang, J. Remote Sensing Application in China’s Coastal Zones and Islands: Recent Progress and Some Suggestions. Strateg. Study CAE 2019, 21, 59–63. [Google Scholar] [CrossRef]
  5. Saylam, K.; Brown, R.A.; Hupp, J.R. Assessment of depth and turbidity with airborne Lidar bathymetry and multiband satellite imagery in shallow water bodies of the Alaskan North Slope. Int. J. Appl. Earth Obs. Geoinf. 2017, 58, 191–200. [Google Scholar] [CrossRef]
  6. Li, Y.; Gao, H.; Jasinski, M.F.; Zhang, S.; Stoll, J.D. Deriving High-Resolution Reservoir Bathymetry from ICESat-2 Prototype Photon-Counting Lidar and Landsat Imagery. IEEE Trans. Geosci. Remote Sens. 2019, 57, 7883–7893. [Google Scholar] [CrossRef]
  7. Schwarz, R.; Mandlburger, G.; Pfennigbauer, M.; Pfeifer, N. Design and evaluation of a full-wave surface and bottom-detection algorithm for LiDAR bathymetry of very shallow waters. ISPRS J. Photogramm. Remote Sens. 2019, 150, 1–10. [Google Scholar] [CrossRef]
  8. Markus, T.; Neumann, T.; Martino, A.; Abdalati, W.; Brunt, K.; Csatho, B.; Farrell, S.; Fricker, H.; Gardner, A.; Harding, D.; et al. The Ice, Cloud, and land Elevation Satellite-2 (ICESat-2): Science requirements, concept, and implementation. Remote Sens. Environ. 2017, 190, 260–273. [Google Scholar] [CrossRef]
  9. Caballero, I.; Stumpf, R.P. On the use of Sentinel-2 satellites and lidar surveys for the change detection of shallow bathymetry: The case study of North Carolina inlets. Coast. Eng. 2021, 169, 103936. [Google Scholar] [CrossRef]
  10. Babbel, B.J.; Parrish, C.E.; Magruder, L.A. ICESat-2 Elevation Retrievals in Support of Satellite-Derived Bathymetry for Global Science Applications. Geophys. Res. Lett. 2021, 48, e2020GL090629. [Google Scholar] [CrossRef]
  11. Hsu, H.-J.; Huang, C.-Y.; Jasinski, M.; Li, Y.; Gao, H.; Yamanokuchi, T.; Wang, C.-G.; Chang, T.-M.; Ren, H.; Kuo, C.-Y.; et al. A semi-empirical scheme for bathymetric mapping in shallow water by ICESat-2 and Sentinel-2: A case study in the South China Sea. ISPRS J. Photogramm. Remote Sens. 2021, 178, 1–19. [Google Scholar] [CrossRef]
  12. Zhang, G.; Chen, W.; Xie, H. Tibetan Plateau’s lake level and volume changes from NASA’s ICESat/ICESat-2 and Landsat Missions. Geophys. Res. Lett. 2019, 46, 13107–13118. [Google Scholar] [CrossRef]
  13. Abdalati, W.; Zwally, H.J.; Bindschadler, R.; Csatho, B.; Farrell, S.L.; Fricker, H.A.; Harding, D.; Kwok, R.; Lefsky, M.; Markus, T.; et al. The ICESat-2 Laser Altimetry Mission. Proc. IEEE 2010, 98, 735–751. [Google Scholar] [CrossRef]
  14. Albright, A.; Glennie, C. Nearshore Bathymetry from Fusion of Sentinel-2 and ICESat-2 Observations. IEEE Geosci. Remote Sens. Lett. 2021, 18, 900–904. [Google Scholar] [CrossRef]
  15. Parrish, C.E.; Magruder, L.A.; Neuenschwander, A.L.; Forfinski-Sarkozi, N.; Alonzo, M.; Jasinski, M. Validation of ICESat-2 ATLAS Bathymetry and Analysis of ATLAS’s Bathymetric Mapping Performance. Remote Sens. 2019, 11, 1634. [Google Scholar] [CrossRef]
  16. Thomas, N.; Lee, B.; Coutts, O.; Bunting, P.; Lagomasino, D.; Fatoyinbo, L. A Purely Spaceborne Open Source Approach for Regional Bathymetry Mapping. IEEE Trans. Geosci. Remote Sens. 2022, 60, 4708109. [Google Scholar] [CrossRef]
  17. Wang, B.; Ma, Y.; Zhang, J.; Zhang, H.; Zhu, H.; Leng, Z.; Zhang, X.; Cui, A. A noise removal algorithm based on adaptive elevation difference thresholding for ICESat-2 photon-counting data. Int. J. Appl. Earth Obs. Geoinf. 2023, 117, 103207. [Google Scholar] [CrossRef]
  18. Yang, F.; Su, D.; Ma, Y.; Feng, C.; Yang, A.; Wang, M. Refraction Correction of Airborne LiDAR Bathymetry Based on Sea Surface Profile and Ray Tracing. IEEE Trans. Geosci. Remote Sens. 2017, 55, 6141–6149. [Google Scholar] [CrossRef]
  19. Xu, N.; Ma, Y.; Zhang, W.; Wang, X.H.; Yang, F.; Su, D. Monitoring Annual Changes of Lake Water Levels and Volumes over 1984-2018 Using Landsat Imagery and ICESat-2 Data. Remote Sens. 2020, 12, 4004. [Google Scholar] [CrossRef]
  20. Ma, Y.; Xu, N.; Liu, Z.; Yang, B.; Yang, F.; Wang, X.H.; Li, S. Satellite-derived bathymetry using the ICESat-2 lidar and Sentinel-2 imagery datasets. Remote Sens. Environ. 2020, 250, 112047. [Google Scholar] [CrossRef]
  21. Ma, Y.; Xu, N.; Sun, J.; Wang, X.H.; Yang, F.; Li, S. Estimating water levels and volumes of lakes dated back to the 1980s using Landsat imagery and photon-counting lidar datasets. Remote Sens. Environ. 2019, 232, 111287. [Google Scholar] [CrossRef]
  22. Liu, C.; Qi, J.; Li, J.; Tang, Q.; Xu, W.; Zhou, X.; Meng, W. Accurate Refraction Correction-Assisted Bathymetric Inversion Using ICESat-2 and Multispectral Data. Remote Sens. 2021, 13, 4355. [Google Scholar] [CrossRef]
  23. Zhang, D.; Chen, Y.; Le, Y.; Dong, Y.; Dai, G.; Wang, L. Refraction and coordinate correction with the JONSWAP model for ICESat-2 bathymetry. ISPRS J. Photogramm. Remote Sens. 2022, 186, 285–300. [Google Scholar] [CrossRef]
  24. Chen, Y.; Zhu, Z.; Le, Y.; Qiu, Z.; Chen, G.; Wang, L. Refraction correction and coordinate displacement compensation in nearshore bathymetry using ICESat-2 lidar data and remote-sensing images. Opt. Express 2021, 29, 2411–2430. [Google Scholar] [CrossRef] [PubMed]
  25. Cao, B.; Fang, Y.; Gao, L.; Hu, H.; Jiang, Z.; Sun, B.; Lou, L. An active-passive fusion strategy and accuracy evaluation for shallow water bathymetry based on ICESat-2 ATLAS laser point cloud and satellite remote sensing imagery. Int. J. Remote Sens. 2021, 42, 2783–2806. [Google Scholar] [CrossRef]
  26. Xu, N.; Ma, Y.; Zhou, H.; Zhang, W.; Zhang, Z.; Wang, X.H. A Method to Derive Bathymetry for Dynamic Water Bodies Using ICESat-2 and GSWD Data Sets. IEEE Geosci. Remote Sens. Lett. 2022, 19, 1500305. [Google Scholar] [CrossRef]
  27. Mattia Mazzaretto, O.; Menendez, M.; Lobeto, H. A global evaluation of the JONSWAP spectra suitability on coastal areas. Ocean. Eng. 2022, 266, 112756. [Google Scholar] [CrossRef]
  28. Zhang, G.; Xu, Q.; Xing, S.; Li, P.; Zhang, X.; Wang, D.; Dai, M. A Noise-Removal Algorithm Without Input Parameters Based on Quadtree Isolation for Photon-Counting LiDAR. IEEE Geosci. Remote Sens. Lett. 2022, 19, 6501905. [Google Scholar] [CrossRef]
  29. Zhu, X.; Nie, S.; Wang, C.; Xi, X.; Lao, J.; Li, D. Consistency analysis of forest height retrievals between GEDI and ICESat-2. Remote Sens. Environ. 2022, 281, 113244. [Google Scholar] [CrossRef]
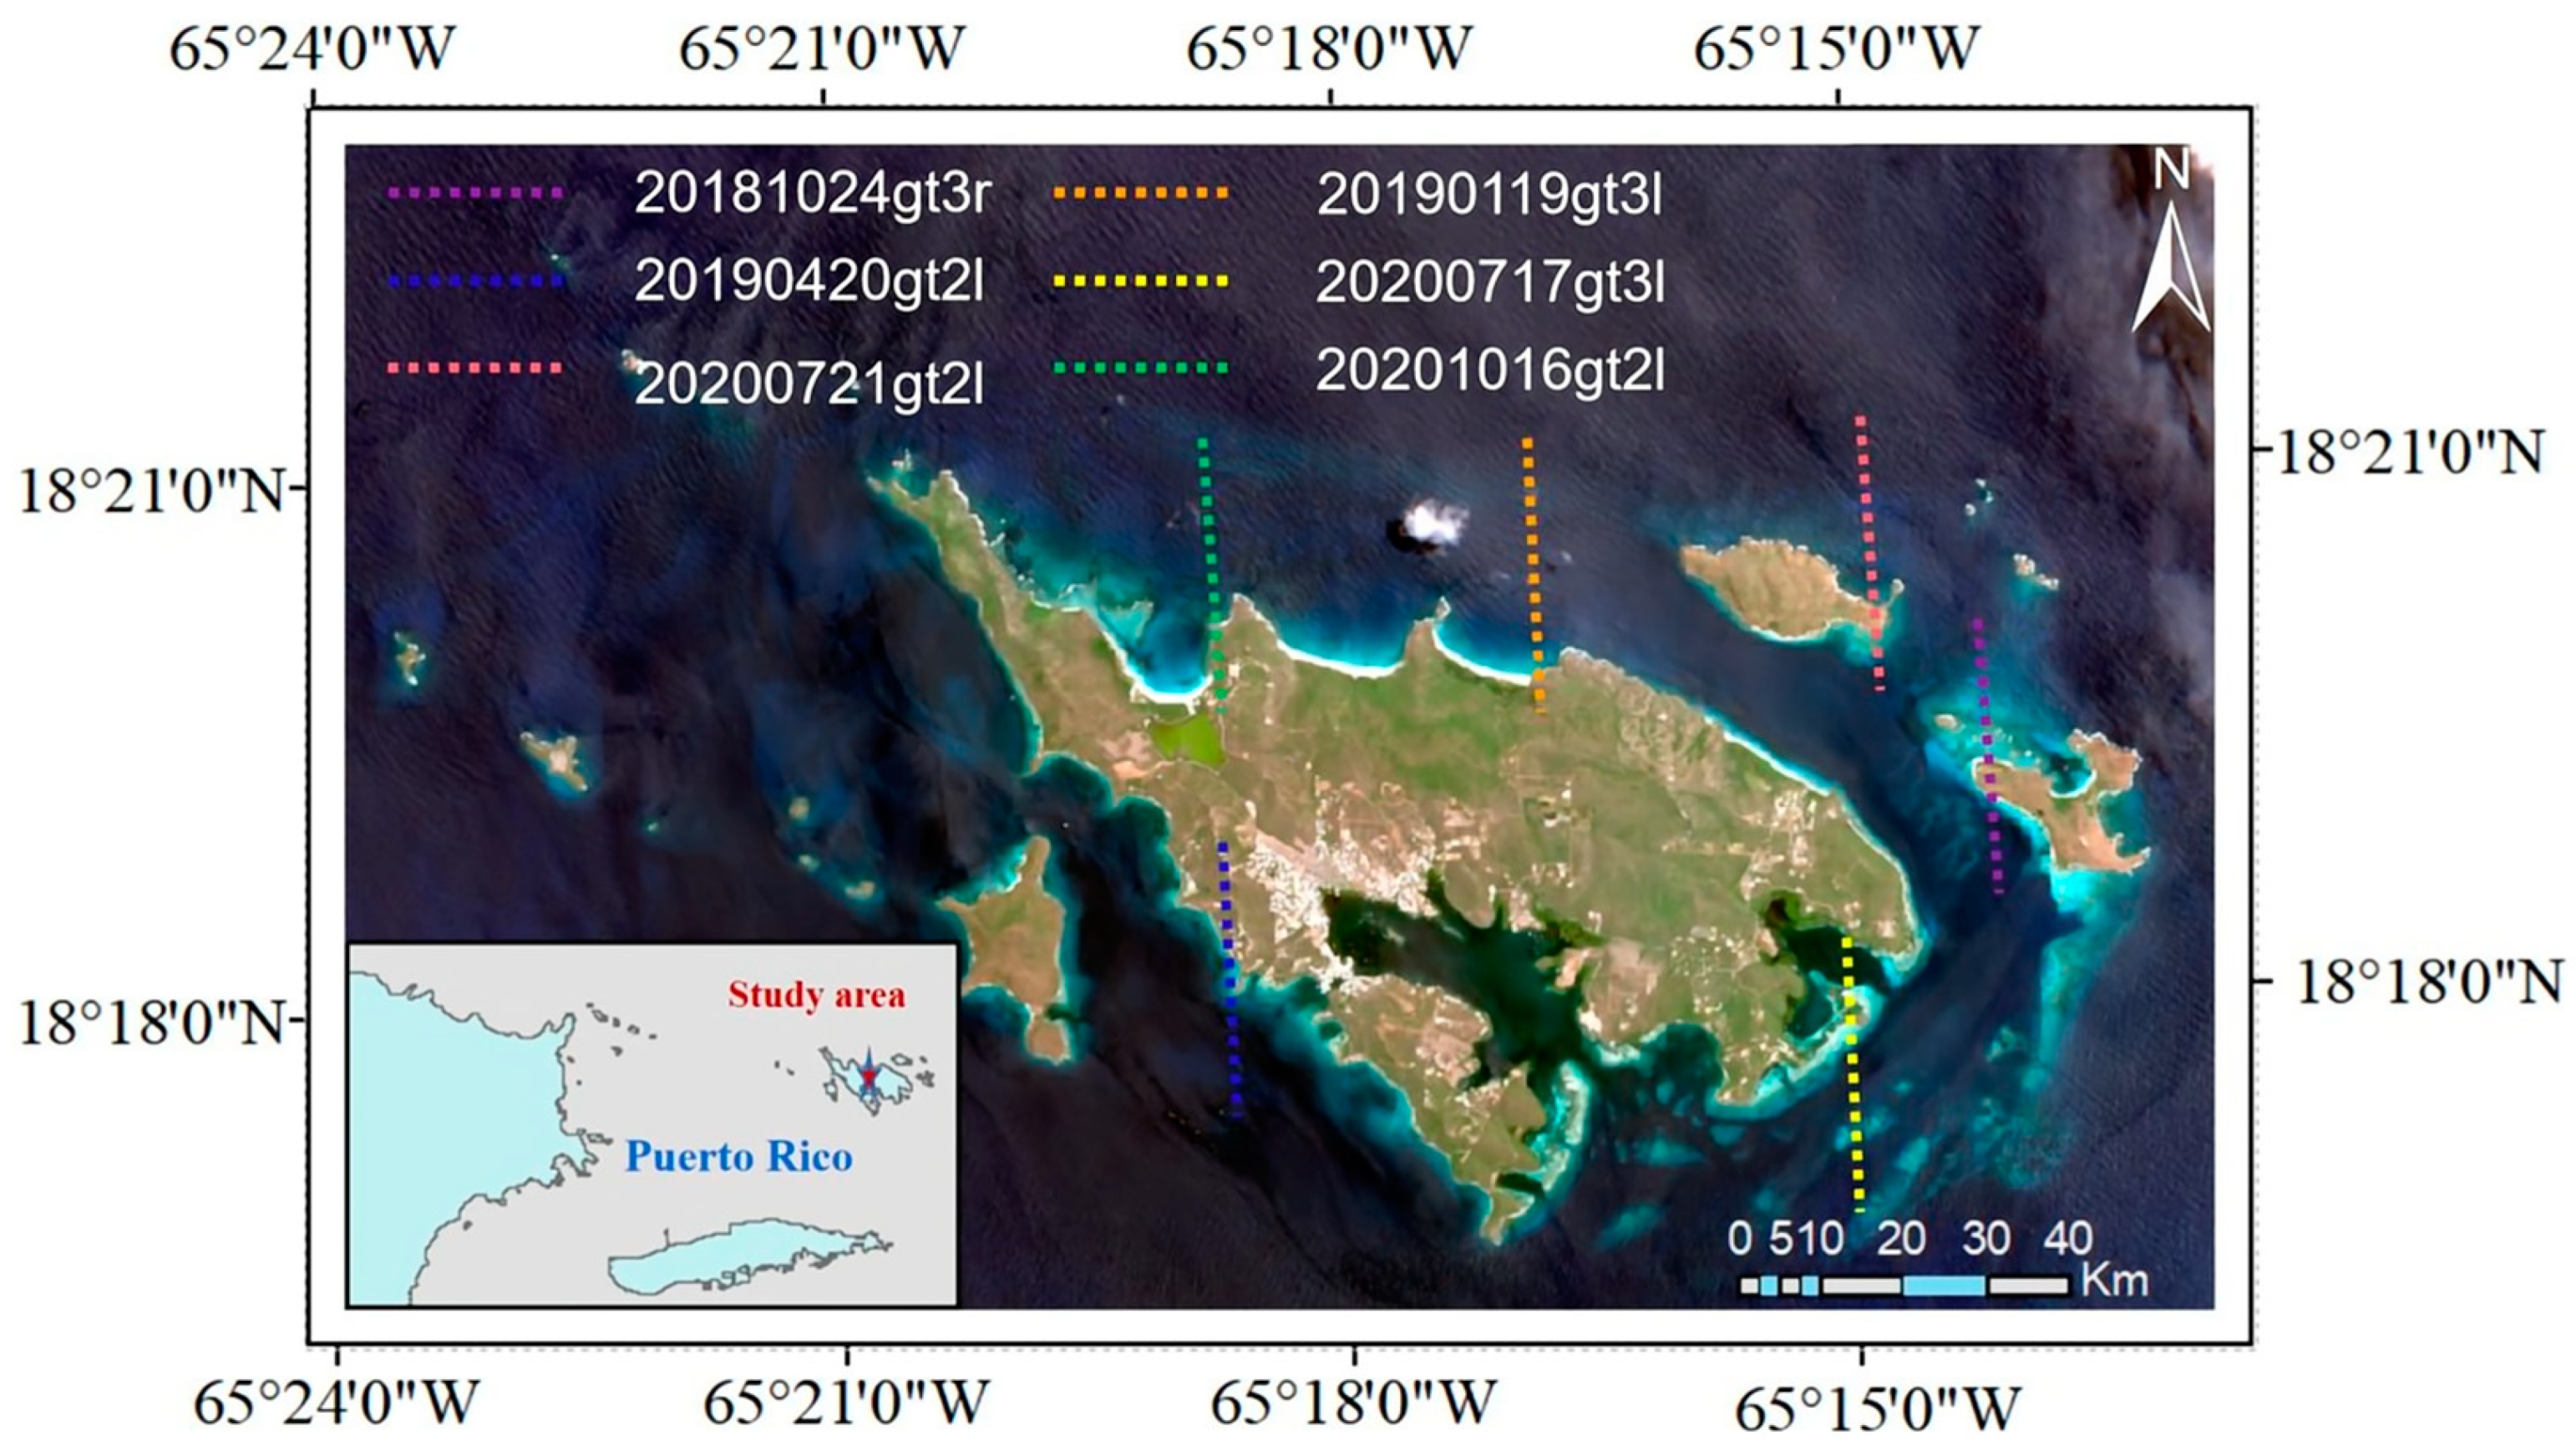
Figure 1. Schematic of the study area and ICESat-2 data trajectory.
Remotesensing 16 00084 g001
Figure 2. Shallow bathymetry inversion results for ALB reference data. Ten water classes showed the nearshore water depths; the darker the area’s color, the deeper the water. The land was covered in a mask.
Remotesensing 16 00084 g002
Figure 3. Flow chart of refraction correction method based on parameter tracking.
Remotesensing 16 00084 g003
Figure 4. Diagram of sea level rise and fall [20].
Remotesensing 16 00084 g004
Figure 5. Diagram of refraction correction and bathymetry. (a) Diagram of laser incident angle size. (b) Refraction correction when 0 φ θ . (c) Refraction correction when θ < φ θ + 90 ° . (d) Refraction correction when θ + 90 ° < φ 180 ° . The green solid line is the original laser beam; the red solid line is the refracted laser beam; the blue solid line is tangent to the sea surface point; and the blue dashed line is normal to the sea surface point. θ is the laser emission angle; α is the laser incidence angle; β is the laser refraction angle; and φ is the sea surface slope angle. D is the uncorrected water depth; D c o o r e c t is the corrected water depth; S is the laser transmission distance between the uncorrected seafloor photon and the corresponding sea surface photon; R is the laser transmission distance between the corrected seafloor photon and the corresponding sea surface photon; and P is the distance between the seafloor photon before and after correction.
Remotesensing 16 00084 g005
Figure 6. Diagram of parameter-based tracking connecting the seafloor and the sea surface.
Remotesensing 16 00084 g006
Figure 7. Flow chart of the seafloor and sea surface photons connections.
Remotesensing 16 00084 g007
Figure 8. Signal photons extraction and seafloor photons refraction correction. (a) 20181024gt3r. (b) 20190119gt3l. (c) 20190420gt2l. (d) 20200717gt3l. (e) 20200721gt2l. (f) 20201016gt2l.
Remotesensing 16 00084 g008aRemotesensing 16 00084 g008bRemotesensing 16 00084 g008c
Figure 9. Accuracy of bathymetry measured by ICESat-2 compared to ALB reference data. The red solid line represents the matching regression line, and the black dashed line represents the 1:1 line. (a) 20181024gt3r. (b) 20190119gt3l.
Remotesensing 16 00084 g009aRemotesensing 16 00084 g009b
Figure 10. Error distribution of ICESat-2 inversion bathymetry compared to high-precision ALB reference data. The dashed line is the fitted curve for the bathymetry error. (a) 20181024gt3r. (b) 20190119gt3l.
Remotesensing 16 00084 g010aRemotesensing 16 00084 g010b
Table 1. ICESat-2 ATL03 data collection details in the study site.
DateTrackTime (UTC)Latitude Range (°N)
24 October 2018gt3r07:2918.3180–18.3221
19 January 2019gt3l15:1418.3324–18.3376
20 April 2019gt2l10:5418.2996–18.3030
17 July 2020gt3l13:1318.2810–18.2910
21 July 2020gt2l01:0818.3301–18.3340
16 October 2020gt2l08:5318.3299–18.3398
Table 2. Comparison of accuracy of bathymetry extraction before and after refraction correction.
DatasetRaw DataParrish’s [15]Ma’s [20]Ours
R 2 RMSE/m R 2 RMSE/m R 2 RMSE/m R 2 RMSE/m
20181024gt3r0.39112.46860.98440.39480.98440.39480.98870.3366
20190119gt3l−1.68866.78850.84951.60630.84981.60470.85861.5566
20190420gt2l−2.12832.57230.87060.52320.87050.52330.87270.5189
20200717gt3l−0.34724.51650.89581.25610.89591.25520.89881.2379
20200721gt2l0.36322.50450.95160.69050.95180.68880.95570.6603
20201016gt2l−1.58294.24640.72291.39080.72291.39090.73591.3579
Table 3. Statistics of bathymetry errors before and after refraction correction.
DatesetError Correction Method of BathymetryError
RangeMeanStandard Deviation
20181024gt3rraw data[0.3721, 8.0055]1.55380.5002
Parrish’s [15][−1.6918, 2.4010]0.19010.2052
Ma’s [20][−1.6862, 2.4037]0.18940.2030
ours[−1.8224, 2.2705]0.04520.1854
20190119gt3lraw data[1.7275, 14.8129]5.78412.1795
Parrish’s [15][−1.9490, 6.4320]0.41570.2539
Ma’s [20][−1.9479, 6.4314]0.40890.2395
ours[−2.0320, 6.3493]0.33710.2707
20190420gt2lraw data[0.2895, 5.8635]2.19240.2853
Parrish’s [15][−1.2883, 2.2441]0.22330.1995
Ma’s [20][−1.2846, 2.2431]0.22290.1974
ours[−1.2951, 2.2375]0.21840.1994
20200717gt3lraw data[−0.8652, 12.5306]4.00701.7007
Parrish’s [15][−3.0447, 7.2198]0.29040.5356
Ma’s [20][−3.0515, 7.2107]0.29460.5388
ours[−3.0851, 7.1794]0.26860.5507
20200721gt2lraw data[0.8338, 10.3489]1.35000.0750
Parrish’s [15][−0.6951, 4.4112]0.43710.1774
Ma’s [20][−0.6881, 4.4181]0.43680.1737
ours[−0.7366, 4.3697]0.40530.1729
20201016gt2lraw data[0.5431, 17.6839]3.89800.6138
Parrish’s [15][−2.0084, 11.8424]0.32610.2075
Ma’s [20][−1.9900, 11.8291]0.38390.2404
ours[−2.0772, 11.7736]0.29850.0923
Table 4. ICESat-2 bathymetry accuracy in different bathymetry partitions.
DatesetError Correction Method of BathymetryDivision of Depth, RMSE of Each Segmentation (m)
20181024gt3r [2, 4][4, 6][6, 8][8, 10]>10
raw data0.97091.42382.00152.51654.4315
Parrish’s [15]0.46630.73410.83571.30832.0290
Ma’s [20]0.28120.30610.42140.53540.8042
ours0.22020.27840.34890.45370.6898
20190119gt3l [8, 10][10, 12][12, 14][14, 16]>16
raw data 3.03963.66634.65737.5903
Parrish’s [15]0.47460.86461.09091.72461.9882
Ma’s [20]0.49760.85771.06811.71972.0265
ours0.44450.80991.03661.69921.9704
20190420gt2l [4, 6][6, 8][8, 10]>10
raw data0.37712.16233.17433.5238
Parrish’s [15]0.35320.98860.42990.5578
Ma’s [20]0.35361.00550.43190.5470
ours0.34900.98280.42620.5328
20200717gt3l [2, 4][4, 6][6, 8][8, 10]>10
raw data1.04541.94832.95352.76895.0541
Parrish’s [15]0.52561.43531.23970.79741.4582
Ma’s [20]0.52641.43481.23930.79701.4569
ours0.50511.41191.21510.79171.4361
20200721gt2l [2, 4][4, 6][6, 8][8, 10]>10
raw data1.21731.71422.20293.39395.3464
Parrish’s [15]0.45380.57321.14290.62551.4349
Ma’s [20]0.45020.57251.13960.61981.4367
ours0.41530.54301.10990.64931.4401
20201016gt2l [4, 6][6, 8][8, 10][10, 12]>12
raw data 2.20792.81473.29035.4403
Parrish’s [15]0.42340.82700.87011.05942.7469
Ma’s [20]0.41840.83010.86751.06412.7481
ours0.38710.81940.81621.02802.3496
Disclaimer/Publisher’s Note: The statements, opinions and data contained in all publications are solely those of the individual author(s) and contributor(s) and not of MDPI and/or the editor(s). MDPI and/or the editor(s) disclaim responsibility for any injury to people or property resulting from any ideas, methods, instructions or products referred to in the content.