Communication

Application of UAV Push-Broom Hyperspectral Images in Water Quality Assessments for Inland Water Protection: A Case Study of Zhang Wei Xin River in Dezhou Distinct, China

1
School of Geoscience and Surveying Engineering, China University of Mining and Technology-Beijing, Ding 11 Xueyuan Road, Haidian District, Beijing 100083, China
2
Key Laboratory of Computational Optics Imaging Technology, Aerospace Information Research Institute, Chinese Academy of Sciences, No. 9 Dengzhuang South Road, Haidian District, Beijing 100094, China
3
School of Opto-Electronics, University of Chinese Academy of Sciences, No. 19 (A) Yuquan Road, Shijingshan District, Beijing 100049, China
*
Author to whom correspondence should be addressed.
Remote Sens. 2023, 15(9), 2360; https://doi.org/10.3390/rs15092360
Submission received: 4 April 2023 / Revised: 27 April 2023 / Accepted: 27 April 2023 / Published: 29 April 2023

Abstract

:
A water quality parameter retrieval scheme based on the UAV push-broom hyperspectral images was designed and validated for assessing the ecological health of Zhang Wei Xin River in Dezhou distinct, China. First, a UAV carrying a push-broom hyperspectral imager that is lightweight and has a small size was used to acquire high spatial and hyperspectral resolution images. Then, the mosaicked reflectance data of the whole river were produced by a seamless image mosaicking method with high geometrical accuracy and spectral fidelity. Next, the in-field measurements of different parameters and the corresponding spectral reflectance from the mosaicked images at the sampling points were used to build the water quality parameter retrieval models for total phosphorus (TP), chlorophyll a (Chla), and total suspended solids (TSS). To validate the model, the retrieval results of the testing sampling points were compared with the measured parameters. The coefficients of determination R2 of TP, Chla, and TSS were 0.886, 0.918, and 0.968, respectively. The retrieved TP, Chla, and TSS maps showed that the water pollution of Zhang Wei Xin River is serious, the total phosphorus exceeds the standard, and the water body is in a state of eutrophication. The UAV-based hyperspectral remote sensing technique provides a cost-effective method for inland water monitoring at a local scale with high accuracy.

1. Introduction

Inland waters, including rivers, lakes, and reservoirs on the Earth’s surface, are the main components of the water resources that are related to human life and ecological environment construction and protection [1]. Because of global warming and waste and pollution of water resources, events such as the outbreak of the harmful algal blooms have become more prevalent [2], being apt in causing the decline of aquatic plant and animal species and serious damage to the inland water ecosystem. Monitoring the inland water quality over time can help to better understand the water conditions, leading to improvements in the water environment and resource management. Traditionally, the point-wise measurements in situ are implemented to assess water quality. Although such measurements are accurate to a point in time and space, they may become costly and time consuming, as well as inadequate in observing temporal and spatial variations over a large area. In the development of remote sensing technology, water quality assessment using satellite, aerial, and ground-based multispectral and hyperspectral images have been applied worldwide. In the past few decades, many ocean color remote sensing algorithms have been proposed, in which reflectance values at the location of in situ measurements are used to build the empirical formulas by statistical regression analysis methods [3], of which the multi-variable and partial least square (PLS) regression methods are most widely used [4]. In general, these algorithms usually require small computational costs, minimal time, and use some self-deeming featuring bands, usually less than 30 bands without theoretical support [5]. The featuring bands vary depending on the characteristics of water organic matter. The difference and relationship between the electromagnetic solar radiation reflected from water is analyzed, and some water quality parameters that modify its spectral properties, such as the content level of chlorophyll a (Chla), total suspended solid (TSS), total phosphorus (TP), total nitrogen (TN), and turbidity, can be estimated by the featuring bands and spectral indices [6]. Despite the potential use of satellite imagery in the inland water quality assessment, the lack of an adequate spatial resolution limits their use at an appropriate scale. On the one hand, small inland waters may be so shallow that light penetrates to the bottom, such that reflectance from the water is a function of bottom conditions in addition to that of the water itself. Urban rivers [5], small irrigation pond water [7], fishery water [8], and reservoirs [9], which are associated with the freshwater aquatic ecosystem and human health, are difficult to map, and the low-density algae blooms are usually undetectable. On the other hand, as the inland water environment is suffering damage from human activities, such as eutrophication, industry production, agriculture activities, and daily life, conditions in inland waters are temporally more dynamic and often spatially more heterogeneous. The satellite revisiting period limitation and impacts of cloud coverage do not allow for frequent monitoring of inland waters [10] to meet the requirement of effective remote sensing water quality warning systems, in which a 6–8 h alert of an impending ingress event is always required. While the site-specific assessment of inland water is of high cost, the satellites that are designed for inland water monitoring are still under development, being of urgent need to develop new technologies that can meet the needs of inland water quality assessment [4] in near real time.
With the recent advancements in the technology of UAVs and miniaturization optical sensors, UAV multi-spectral and hyperspectral imagery is available with more frequency, facilitating the analysis and monitoring of inland water areas. Some water color algorithms have been proposed on the basis of UAV multispectral imagery to estimate turbidity, phytoplankton, etc. [11]. Compared with multispectral sensors, hyperspectral sensors have much narrower bandwidths, and the total number of bands can reach more than one-hundred. Hence, the use of hyperspectral cameras can yield spectral data with higher quality to significantly improve the prediction model [12] in order to estimate the water quality. Its applications in water quality assessment have become a research hotspot in recent years [13]. For example, a strong relationship between the TSS concentration of water samples in the Mississippi River, USA, and reflectance at 705 nm was found [14]. By monitoring the reflectance in blue, red, and red-edge spectral ranges, one can directly estimate Chl-a concentration [15]. Water quality parameter modelling algorithms using self-adapting selection of different artificial neural networks (ANNs) have been proposed to estimate nitrogen, phosphorus, biochemical oxygen demand (BOD), chemical oxygen demand (COD), and Chla from UAV hyperspectral images [5]. Among these studies, the majority reported that linear regression is adequate in order to describe the correlation [4,16], while some suggested the use of polynomial functions [17], principal component analysis (PCA), and artificial neural network (ANN) [18]. However, there are limited investigative studies on the use of the UAV-based hyperspectral images in inland water monitoring. For one thing, many sensors have become available for measuring reflectance at a much higher spectral resolution. When mounting them on the UAV, the inherently unstable imaging geometry due to wind-related three-dimensional motions of the imaging platform during data acquisition makes most hyperspectral images suffer from various degrees of geometric distortion. In addition, due to atmospheric interference and/or sensor defects, there also exists radiometric distortion on images. Furthermore, the high variability of the composition of constituents such as phytoplankton, associated organisms, and mineral and sediment particles in inland waters poses a challenge for reliable interpretation of the optical information contained in the light reflected from the water surface received by the imaging sensor. Moreover, the water spectral properties change with the substance and organic matter. For the successful applications of UAV hyperspectral imagery for the determinations of water quality parameters in inland waters, analytical techniques are required for the decomposition of individual water quality parameters from the compound reflectance signal.
As UAVs have the advantages of easy operation at any time in any place with a comparable lower cost, this research work proposed a new solution to water quality assessment for the understanding of inland water pollution conditions. The data on Zhang Wei Xin River in the DeZhou Section in Shandong Province were acquired and processed to extract the water quality parameters for assessing river health. A lightweight push-broom hyperspectral imaging system was first mounted onboard the UAV to obtain images with high spatial and spectral resolution. Then, a seamless image mosaicking approach was used to transform the UAV-based push-broom hyperspectral images into the hyperspectral reflectance data with high geometrical accuracy and spectral fidelity [19]. Finally, a water quality parameter retrieval procedure based on the in situ water parameter measurements and UAV hyperspectral reflectance data was proposed, and TSS, TP, and Chla maps of the Zhang Wei Xin River were generated accordingly. It was proven that the UAV-mounted hyperspectral imager can be used as a supplement to conventional ground-based river monitoring programs. The correlation R2 of TP, Chla, and TSS measured in field and the retrieval results are 0.886, 0.918, and 0.968, respectively. The produced TSS, TP, and Chla maps show the spatial distribution information of the pollution degree in the river.

2. Materials and Methods

2.1. Study Area

Zhang Wei Xin River is a boundary river of Hebei and Shandong provinces (Figure 1). It flows eastward into the Bohai Sea. The river is 460 km long, and its watershed covers almost 20,000 km2. As has been reported, Zhang Wei Xin River was a potable water supply for both human and domestic animals before 1995. However, the industrial and domestic sewage from upstream of Shanxi, Henan, and Hebei provinces has been discharged through Zhang Wei Xin River into Bohai Sea since 1995. Moreover, when there is a flood risk in the upstream area, the dam gate is opened and a huge amount of polluted water flows through Zhang Wei Xin River into the Bohai Sea. Some data show that the COD of the discharged water exceeds the water pollution standard and can reach to 159 mg/L, 4 times more than the category-IV water standard, meaning that it is heavily polluted. The villagers along the river have suffered from the lack of clean drinking water. The local economy has also suffered a huge loss. If the farmland was to be irrigated with the river water, the soil would become poisonous and seeds would die. If the river water was to be seriously polluted, the aquaculture ponds would also be polluted if the discharge lost control, and the fish and other aquatic products in the ponds would be unable to survive. With polluted water flowing continuously through Zhang Wei Xin River, exhaust fumes and sewage travel to Bohai Bay with a spread distance of more than 10 km. The Seashell Islands Nature Reserve of the Yellow River Delta has also suffered from the degradation of shells, and the wetland ecosystem has seriously been damaged. Although the government has done much to control the discharge by closing factories without environmental approval and desilting the river, pollution is still currently a serious issue. It is therefore essential to find a cost-effective way to monitor the river water quality.

2.2. Data Acquisition

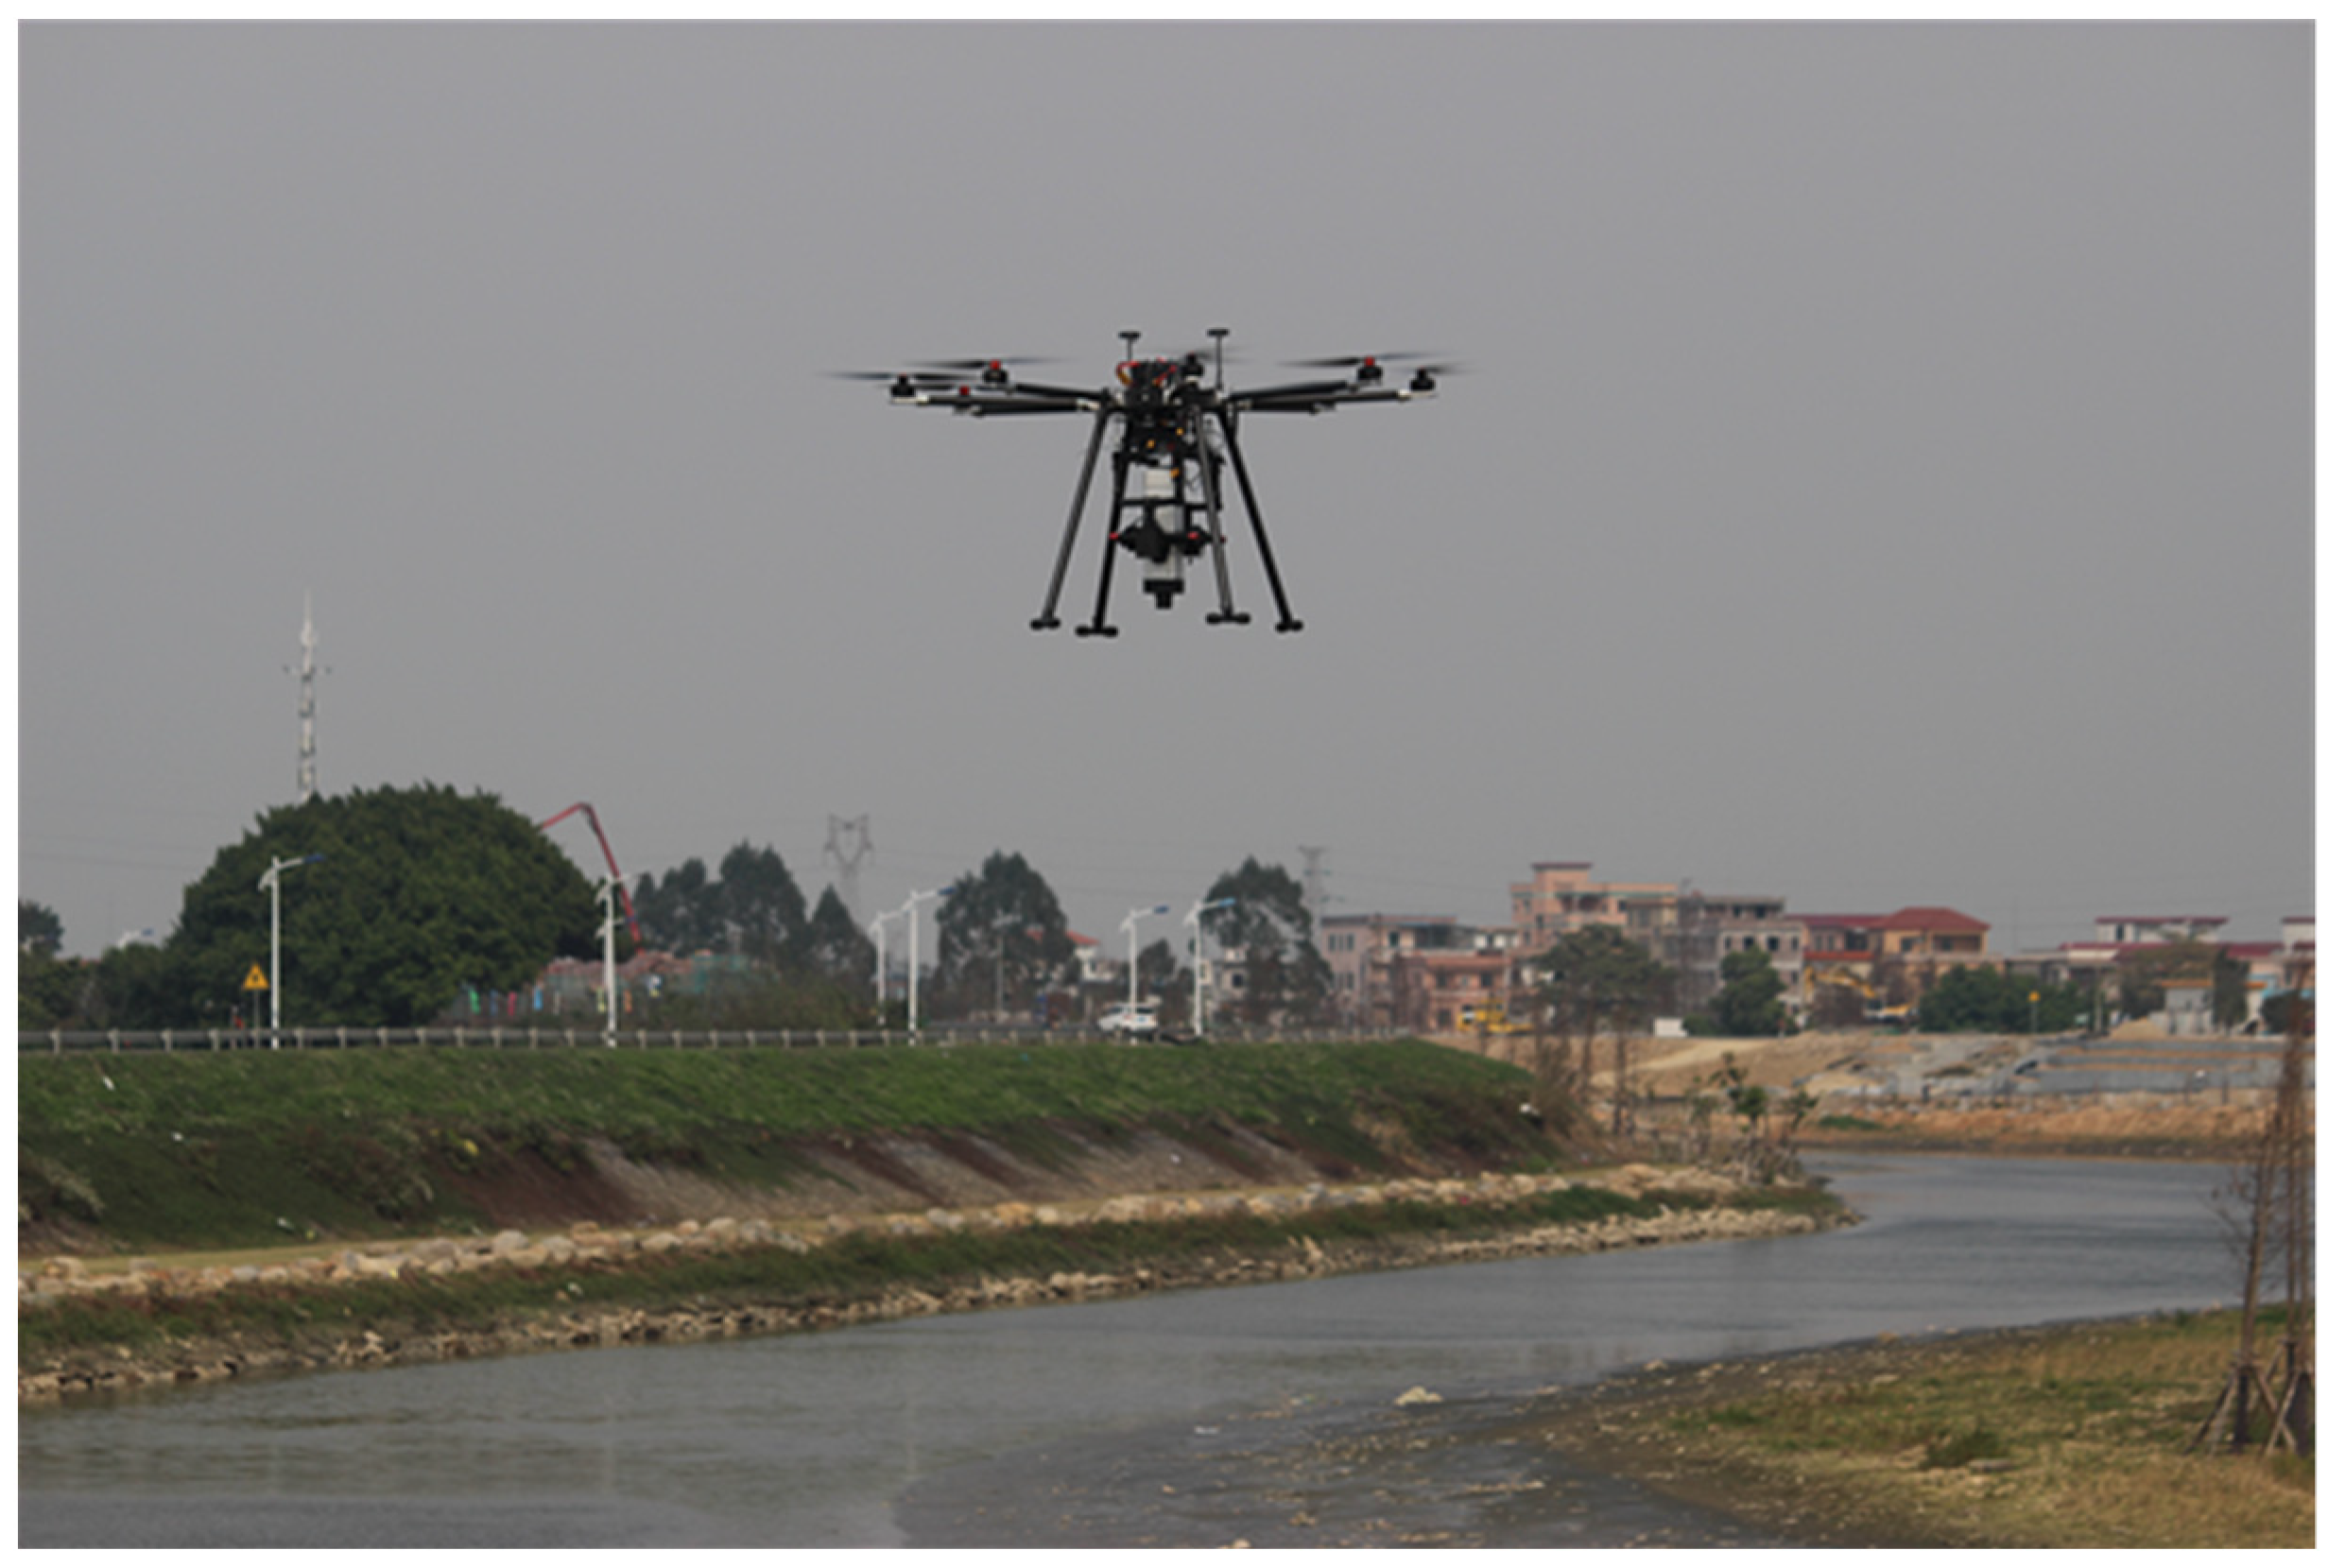
On 17 October 2018, the UAV-based hyperspectral images were collected and processed to obtain the geometrically corrected mosaicked reflectance data that were later used to build the water quality estimate models. The ZK-VNIR-FPG480 hyperspectral imaging system (ZKYD Data Technology Co., Ltd., Beijing, China), including an eight-rotor UAV platform (DJ 1 M600 Pro), an image stabilization platform, a hyperspectral imager, a high-speed data acquisition controller, and a position orient system (POS), was used to acquire the images (Figure 2). The hyperspectral imager and the Sky2 airborne GNSS receiver were pointed vertically downward on the drone DJI M600 Pro. The imager was at the center of rotation of the gimbal, being used to keep the sensor horizontal when the UAV was moving. The sensor covered the spectral range of 400–1000 nm with a spectral resolution of 2.8 nm and a spatial resolution of 0.9 m at 1 km flying height.
The UAV-based hyperspectral images were acquired at 120 m in sunny weather. While the influence of the atmosphere on the images can be almost entirely ignored, a whiteboard with known reflectance data was put as the calibration target to facilitate the conversion of UAV image DN to surface reflectance. To obtain as large an area of image data as possible during one flight, the flight lines were set parallel along the river course to acquire the hyperspectral image strips. In each flight line, linear push-broom detectors were used to scan the ground surface along the flight direction with 480 spatial pixels across the flight line, and the spectral signals were recorded and decomposed into 270 bands to construct the arrays of each hyperspectral image. At the same time of imaging, the Sky2 and GNSS satellite receiving antenna recorded the GNSS base’s real-time kinematics (RTK) signals that were used to derive the UAV external orientation elements. The UAV turned around after reaching the terminal and flew along the next line until the entire river was scanned.
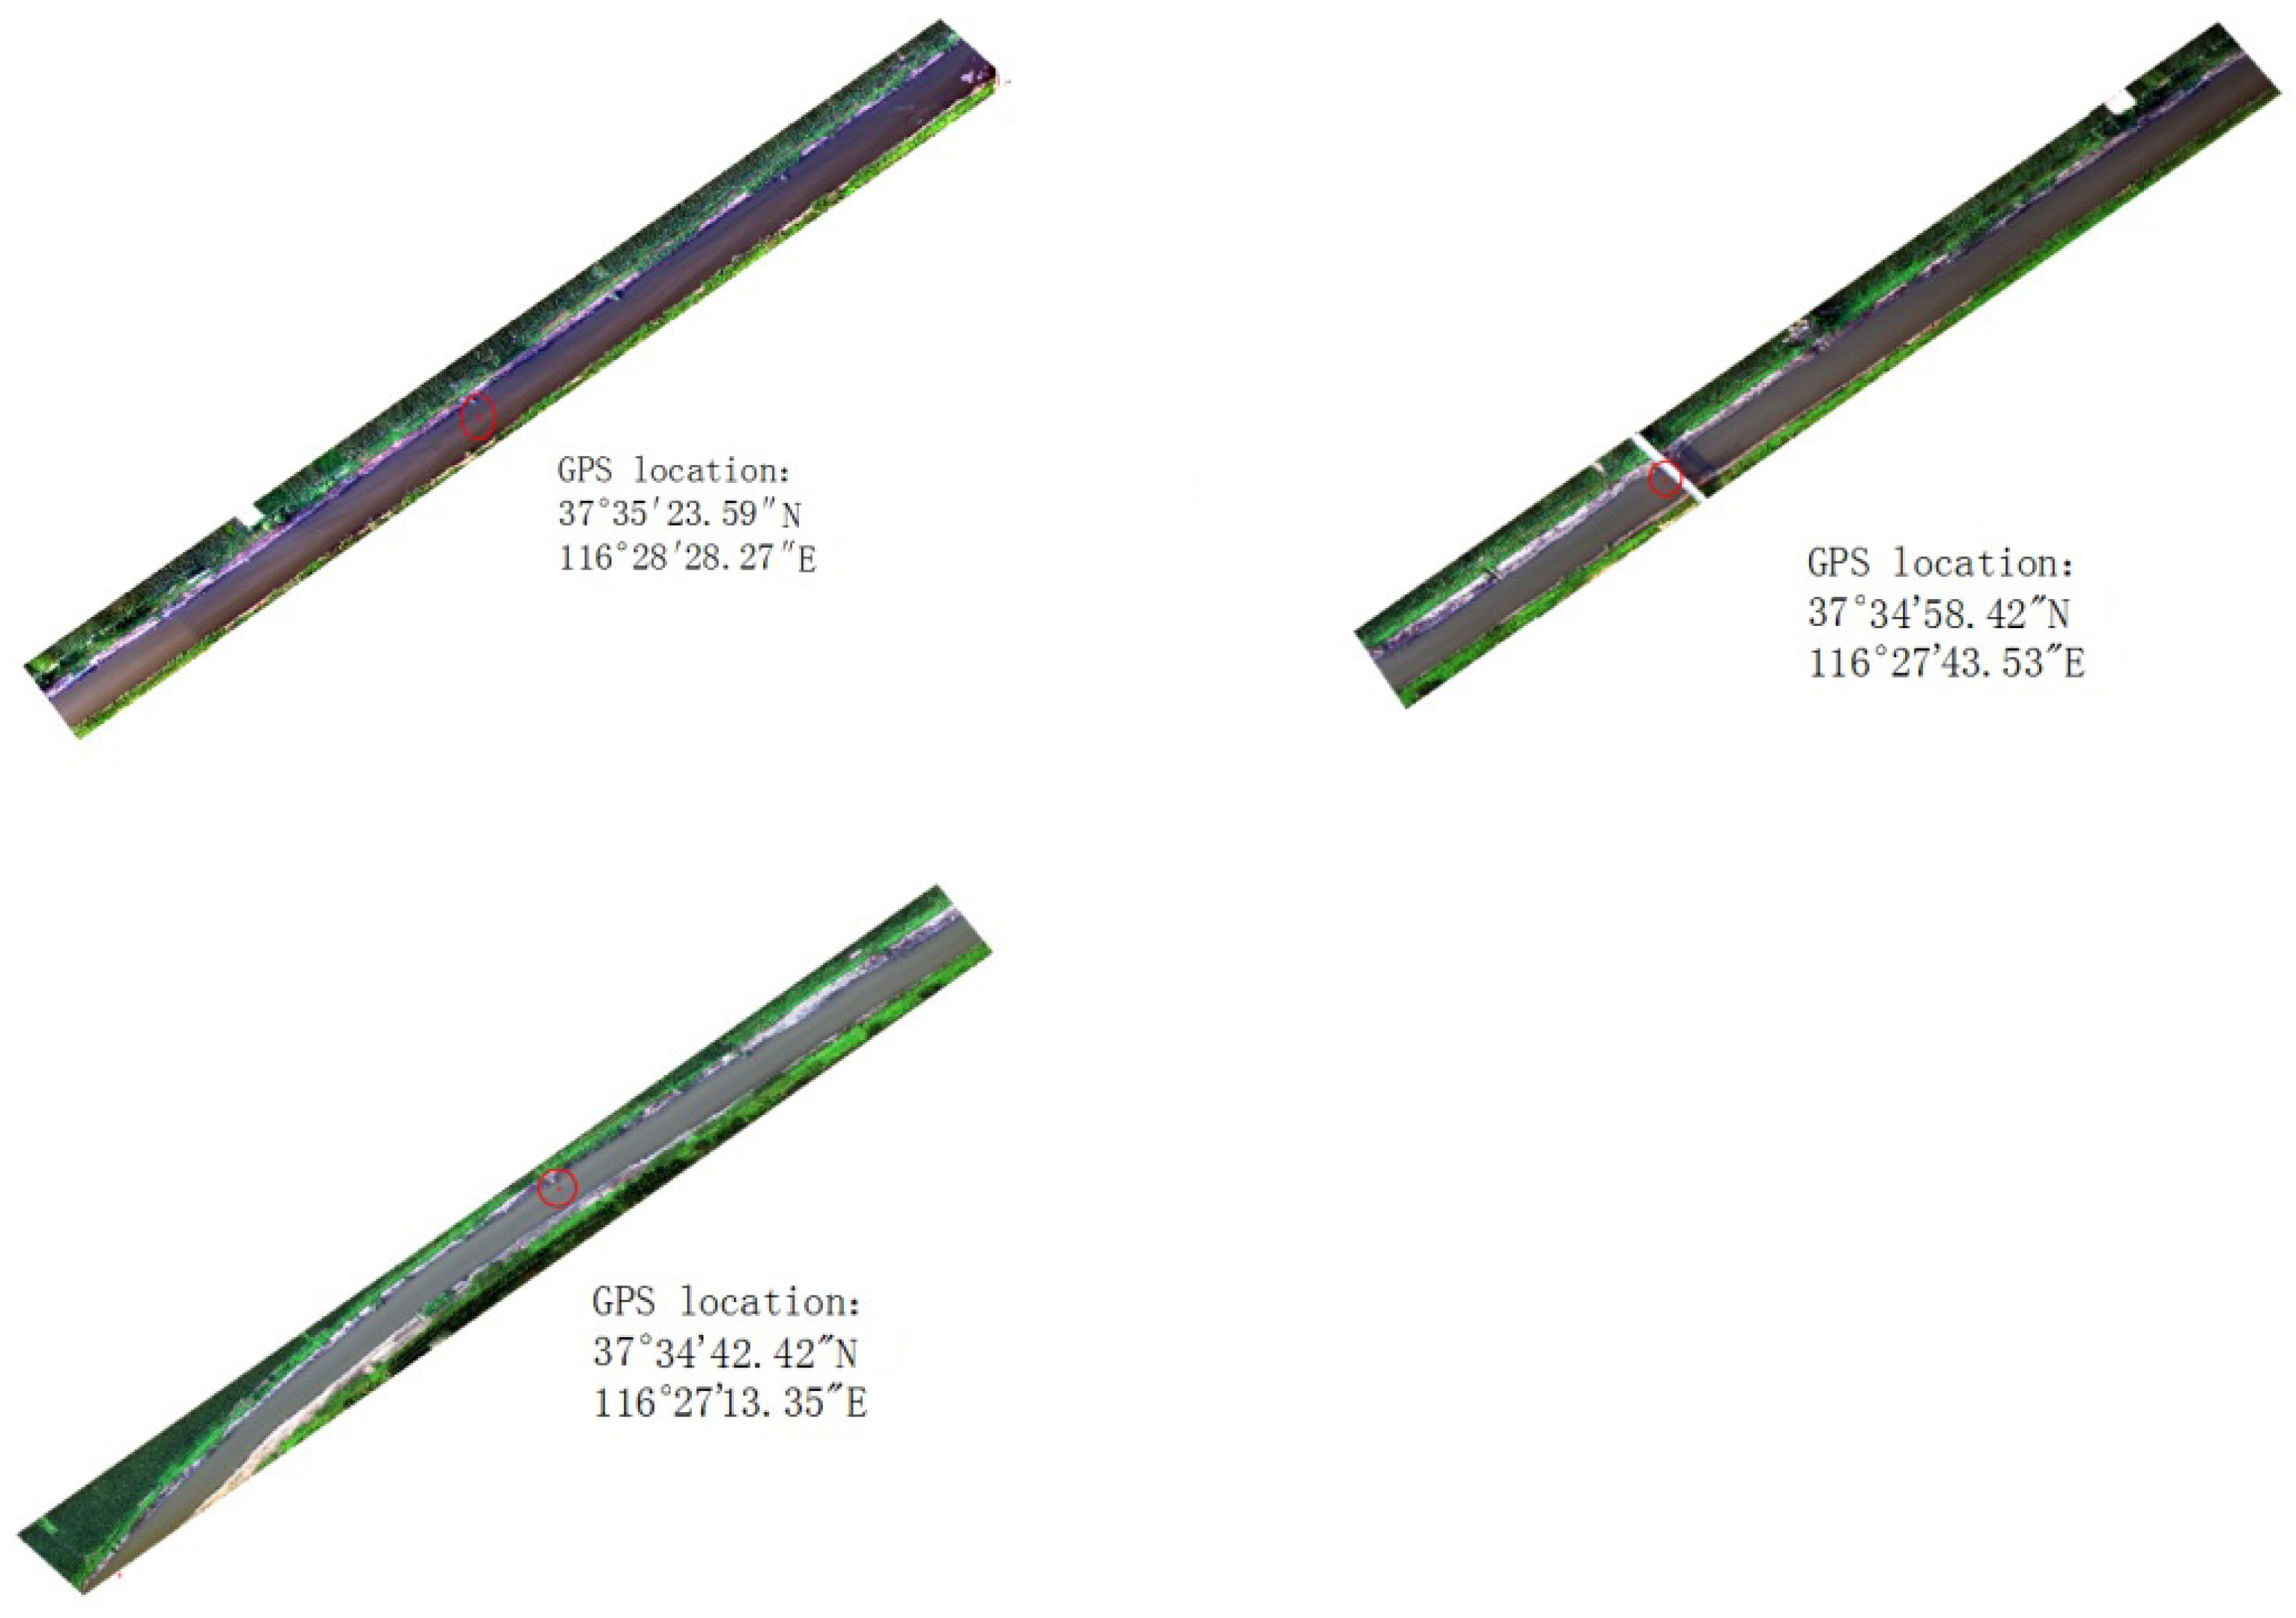
According to the technical specifications for water quality sampling, the water samples were collected 0.5 m below the sampling points in Zhang Wei Xin River and taken to the laboratory. The water quality parameters, including TSS, TP, and Chla, were assessed with the national standard chemical method. The location of the water sample points was measured by a hand-held global position system (GPS). The total 20 sample points (Figure 3) were divided into a training group and a testing group to build and evaluate the water parameter extraction model. In the experiment, the 12 km long river was monitored. With consideration that the whole river is a curved line with different radian, it was divided into several river courses in UAV hyperspectral image acquisition, with each one being a river course with a line shape. Figure 4 shows the hyperspectral image of three river courses; on each river course, there was a sampling point located on it. The hyperspectral reflectance data of the whole river were acquired by the mosaicking of the hyperspectral reflectance data of the river courses. The mosaicked hyperspectral reflectance data of Zhang Wei Xin River is shown in Figure 3 with a curved line with 12 km parallel roads along the sides.

2.3. Water Quality Assessment Workflow Based on UAV Hyperspectral Images

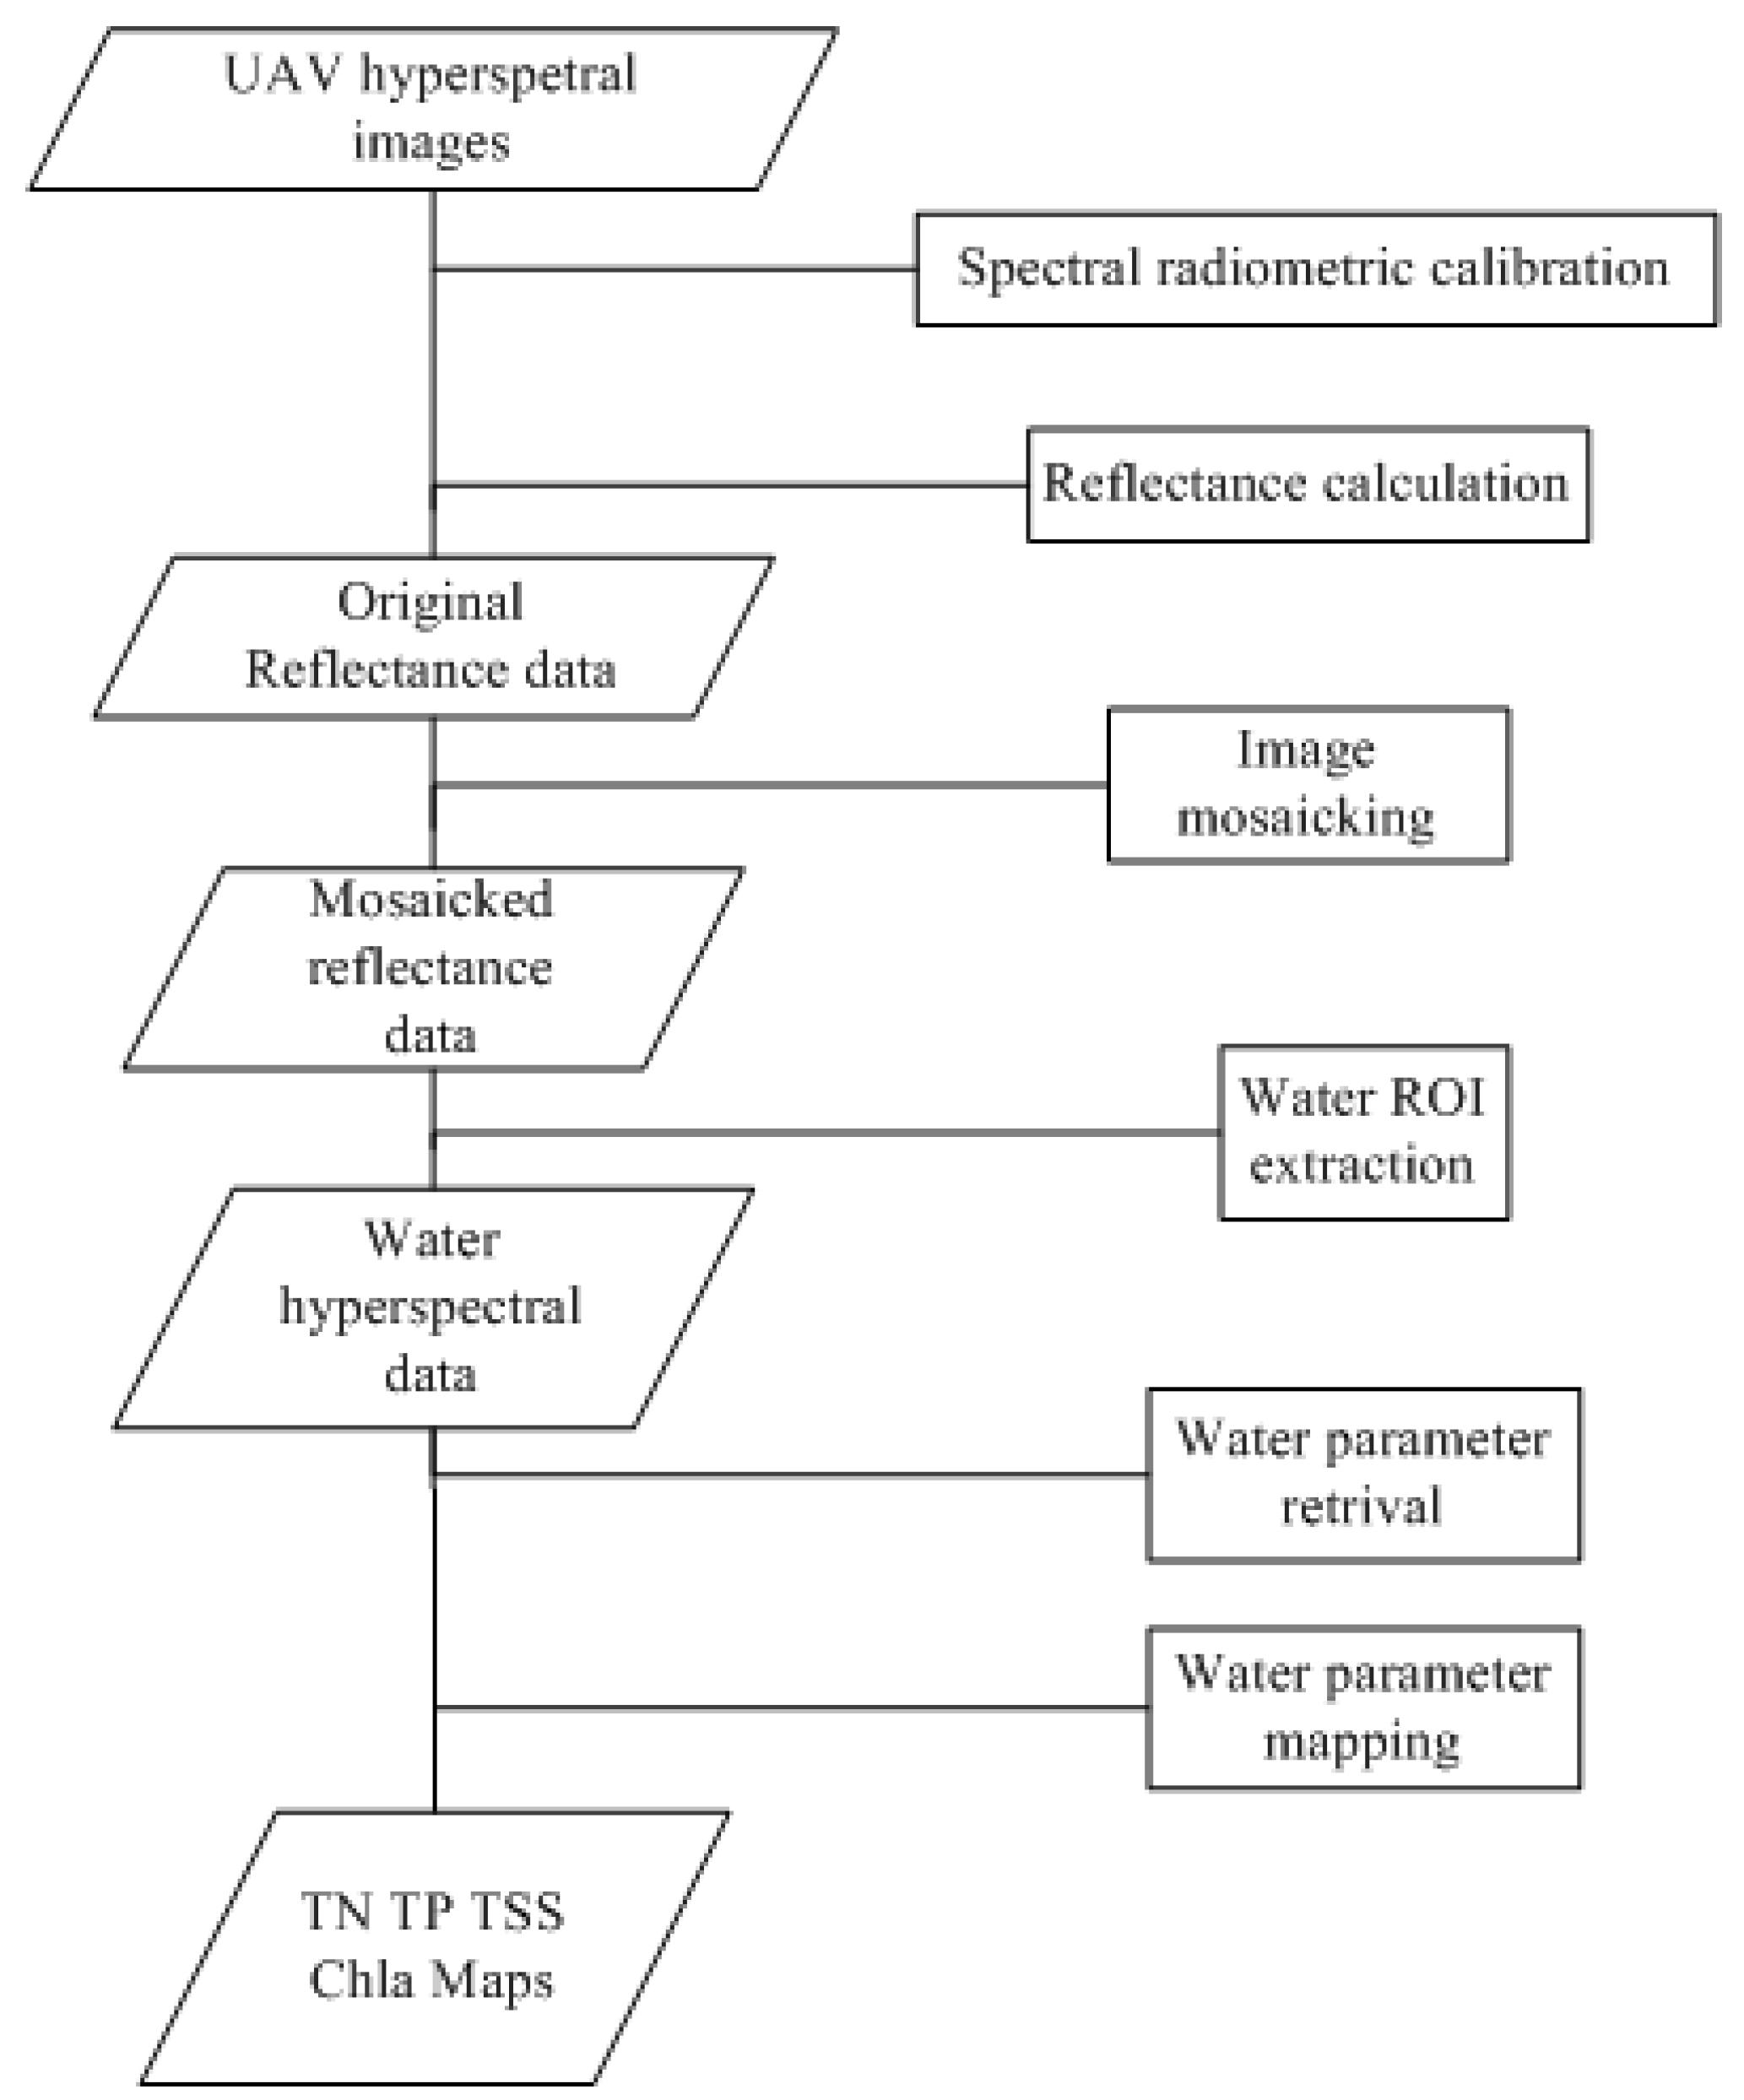
The water quality parameter extraction procedure is illustrated in Figure 5. First, the UAV hyperspectral images were spectral radiometrically calibrated, and the original reflectance data were calculated. Secondly, the UAV reflectance data were seamlessly mosaicked to produce the reflectance data of the whole study area [19]. Thirdly, the hyperspectral data of the water was acquired by water ROI extraction. Finally, the reflectance and the measured water quality parameters of the sample points were statically analyzed to build the water parameter retrieval models, and the spatial distribution maps of TSS, TP, and Chla were generated on the basis of the established models.
In the water ROI extraction, the river parts were extracted from the hyperspectral image by Normalized Difference Water Index (NDWI) threshold segmentation. The water and other classes of ground objects were separated. The NDWI was calculated by the following equation:
N D W I = B a n d G r e e n B a n d N I R B a n d G r e e n + B a n d N I R
In the equation, the BandGreen and BandNIR were used to calculate NDWI. The NDWI value range was between [−1, 1]. As an example, Figure 6 shows the mosaicked river course of Figure 4 and its NDWI image. The river water ROI can be extracted from the NDWI image by threshold segmentation. When the NDWI image pixel’s NDWI was higher than 0, it was a water area; otherwise, it was not a water area.
The components in the water determine the water quality of the river at a certain location. With the discharge of waste from human and agriculture activities, the phosphorus (P) in the water increases. It provides phytoplankton the required nutrition for growth. Thus, the phytoplankton will grow very quickly and seriously contaminate the water. As the growth of phytoplankton increases, the Chla density of the water also increases. Therefore, the distribution maps of water TP and Chla can provide us with the water eutrophication information from both the aspects of density and location, being helpful for the government department in order to deal with the pollution accordingly. TSS is the solid material in water, including the inorganic material, silt, and microorganisms, etc. As the density of TSS increases, the transparency of water decreases, and the reflectance of water also changes. The distribution map of TSS can provide us with the water pollution information.
With different densities of TSS, TP, and Chla, the water has different spectral reflectance features. For clear water, the spectral reflectance is commonly 4–5% in the visible spectral band; the reflectance is decreased to nearly 0 in the near-infrared bands after 780 nm because clear water has high absorption of the spectra. In the water parameter estimation, the 450–850 nm range of spectral bands was analyzed with consideration that the noises of such bands are low and the typical water spectral feature information is within this range. In Zhang Wei Xin River, there are four types of spectral curve features, as shown in Figure 7. Generally, the Zhang Wei Xin River water has higher spectral reflectance than clear water due to its complex composition. As shown in Figure 7d, the class IV water reflectance curves were the unimodal curves, with only one peak at 550 nm (green band). After 650 nm, the reflectances were nearly 0. It was the typical black and odorous water that was mainly located in the river where the urban domestic sewage and industrial wastewater are discharged. As shown in Figure 7c, the class III water reflectance curves were the atypical bimodal curves, having spectral reflectance with more heterogeneity. The water color was more normal than class IV water, with high transparency and some algae growth. Class III water covered the most part of the river water located in the city. As shown in Figure 7a, class I water had the typical double peak and multi-shoulder curves because their components were more complex with algae, suspended solids, etc. The algae reflectance peak was located at 633 nm (red band), and the shoulder curve was located at 690 nm (red band). The suspended solids reflectance peak was located at 580 nm (yellow band). There were some peaks after 750 nm (red band), and there was not a peak at 550 nm (green band). As shown in Figure 7b, class II water had the typical bimodal curves (Figure 7b). The peaks were mainly located at 550 nm (green band) and 700 nm (red band). There was no obvious reflectance peak between 600 and 700 nm. There was some composition of algae and suspended solids, with the water being black and odorous. The class II water was mostly located outside the main city. After the river flows out of the main city, the river flow speed decreases with a wider course, and thus much of the polluted matter is deposited and the water transparency becomes higher.
In the water retrieval modelling, the sample point’s spectral reflectance values and the corresponding measured TP, TSS, and Chla were statistically analyzed. In TP and TSS modelling, the linear regression model between the spectral reflectance of typical band and the water parameter was established using the curve-fitting method to find the optimal function curve that can fit the scatter plot that is consisted by the training samples. In each scatter plot, the independent variable was the featuring spectral feature that is sensitive to the water parameter to be retrieved; the dependent variable was the corresponding water quality measurement value. The water parameter retrieval result using the curve fitting function should be as close as to the samples’ measured value. For validation, the coefficients of determination R2 between the measured variable and the retrieval variable was calculated. The functions of TP and TSS are shown in Equations (2) and (3). In the Chla modelling, the bands of 665 nm, 709 nm, and 754 nm were used to calculate the difference of the indexes first, and then the linear regression model was established. The function of Chla is shown in Equation (4). The models were provided by the research team at the Institute of Hydrobiology, Chinese Academy of Sciences [20].
T P = 4.43 + 19.764 × b 477
T S S = 574.83 × b 575 2.7244
C h l a = 22.06 + 149.05 × b 754 × ( 1 b 665 1 b 709 )

3. Water Quality Parameter Extraction Results

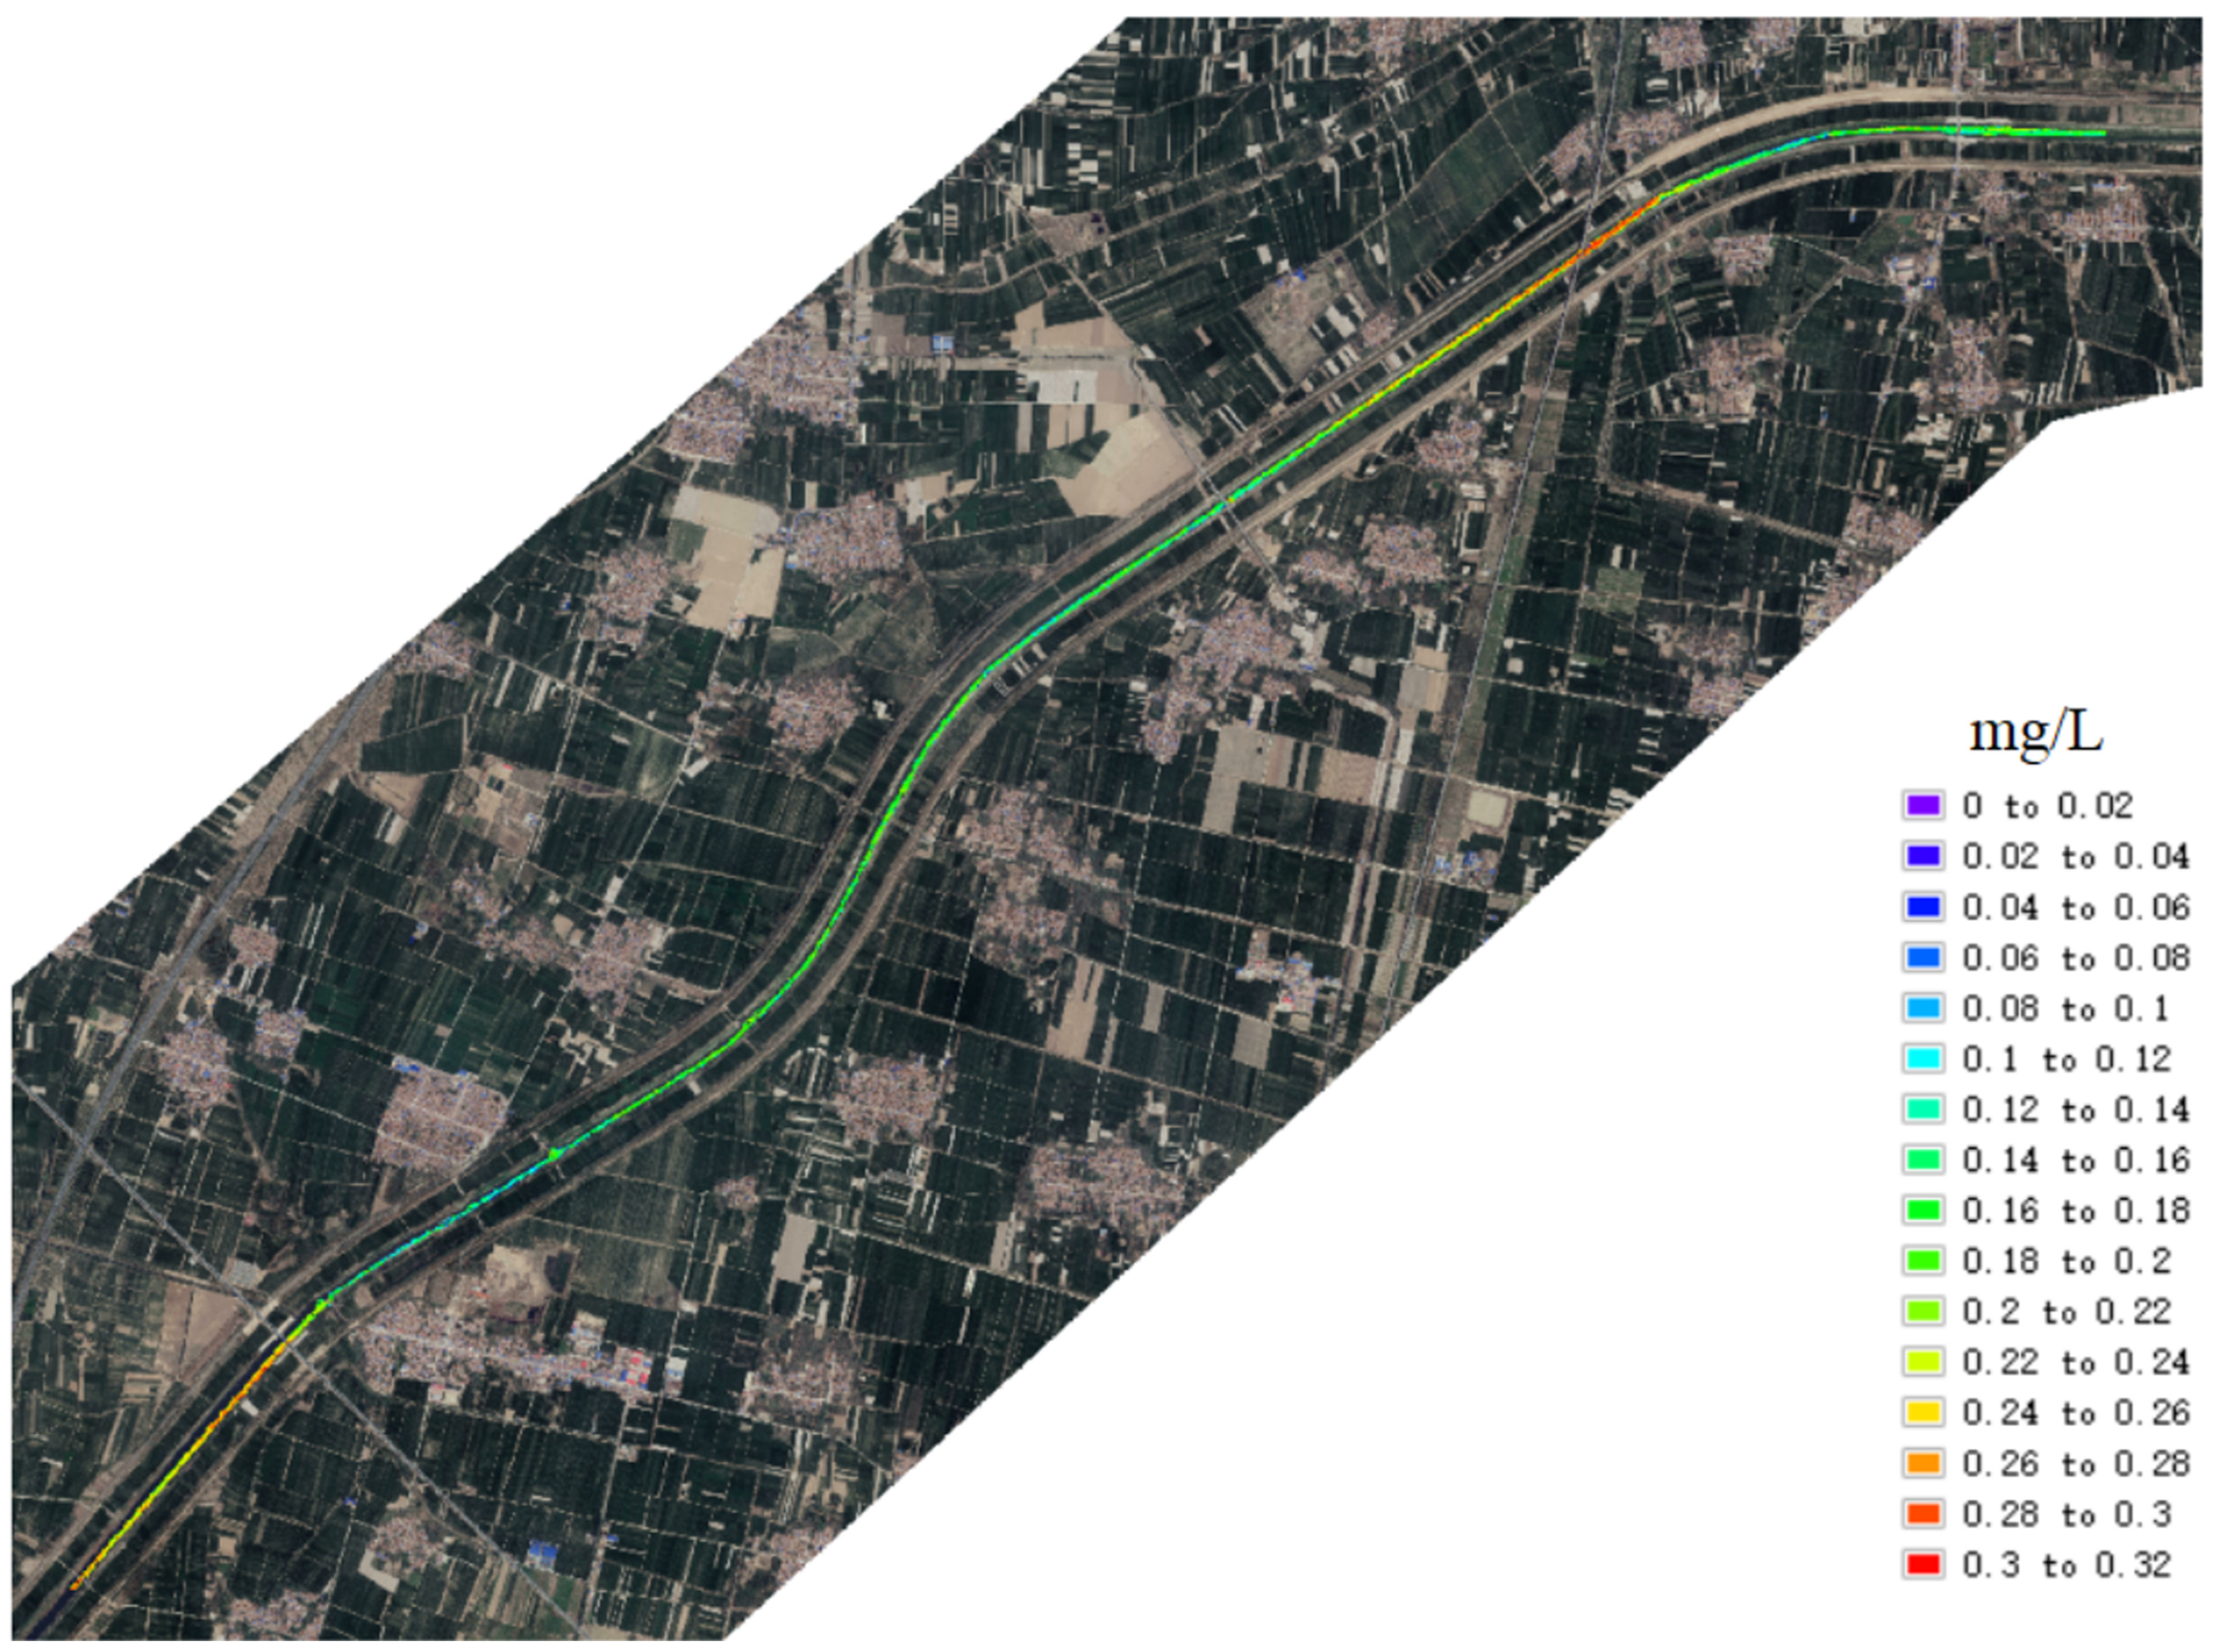
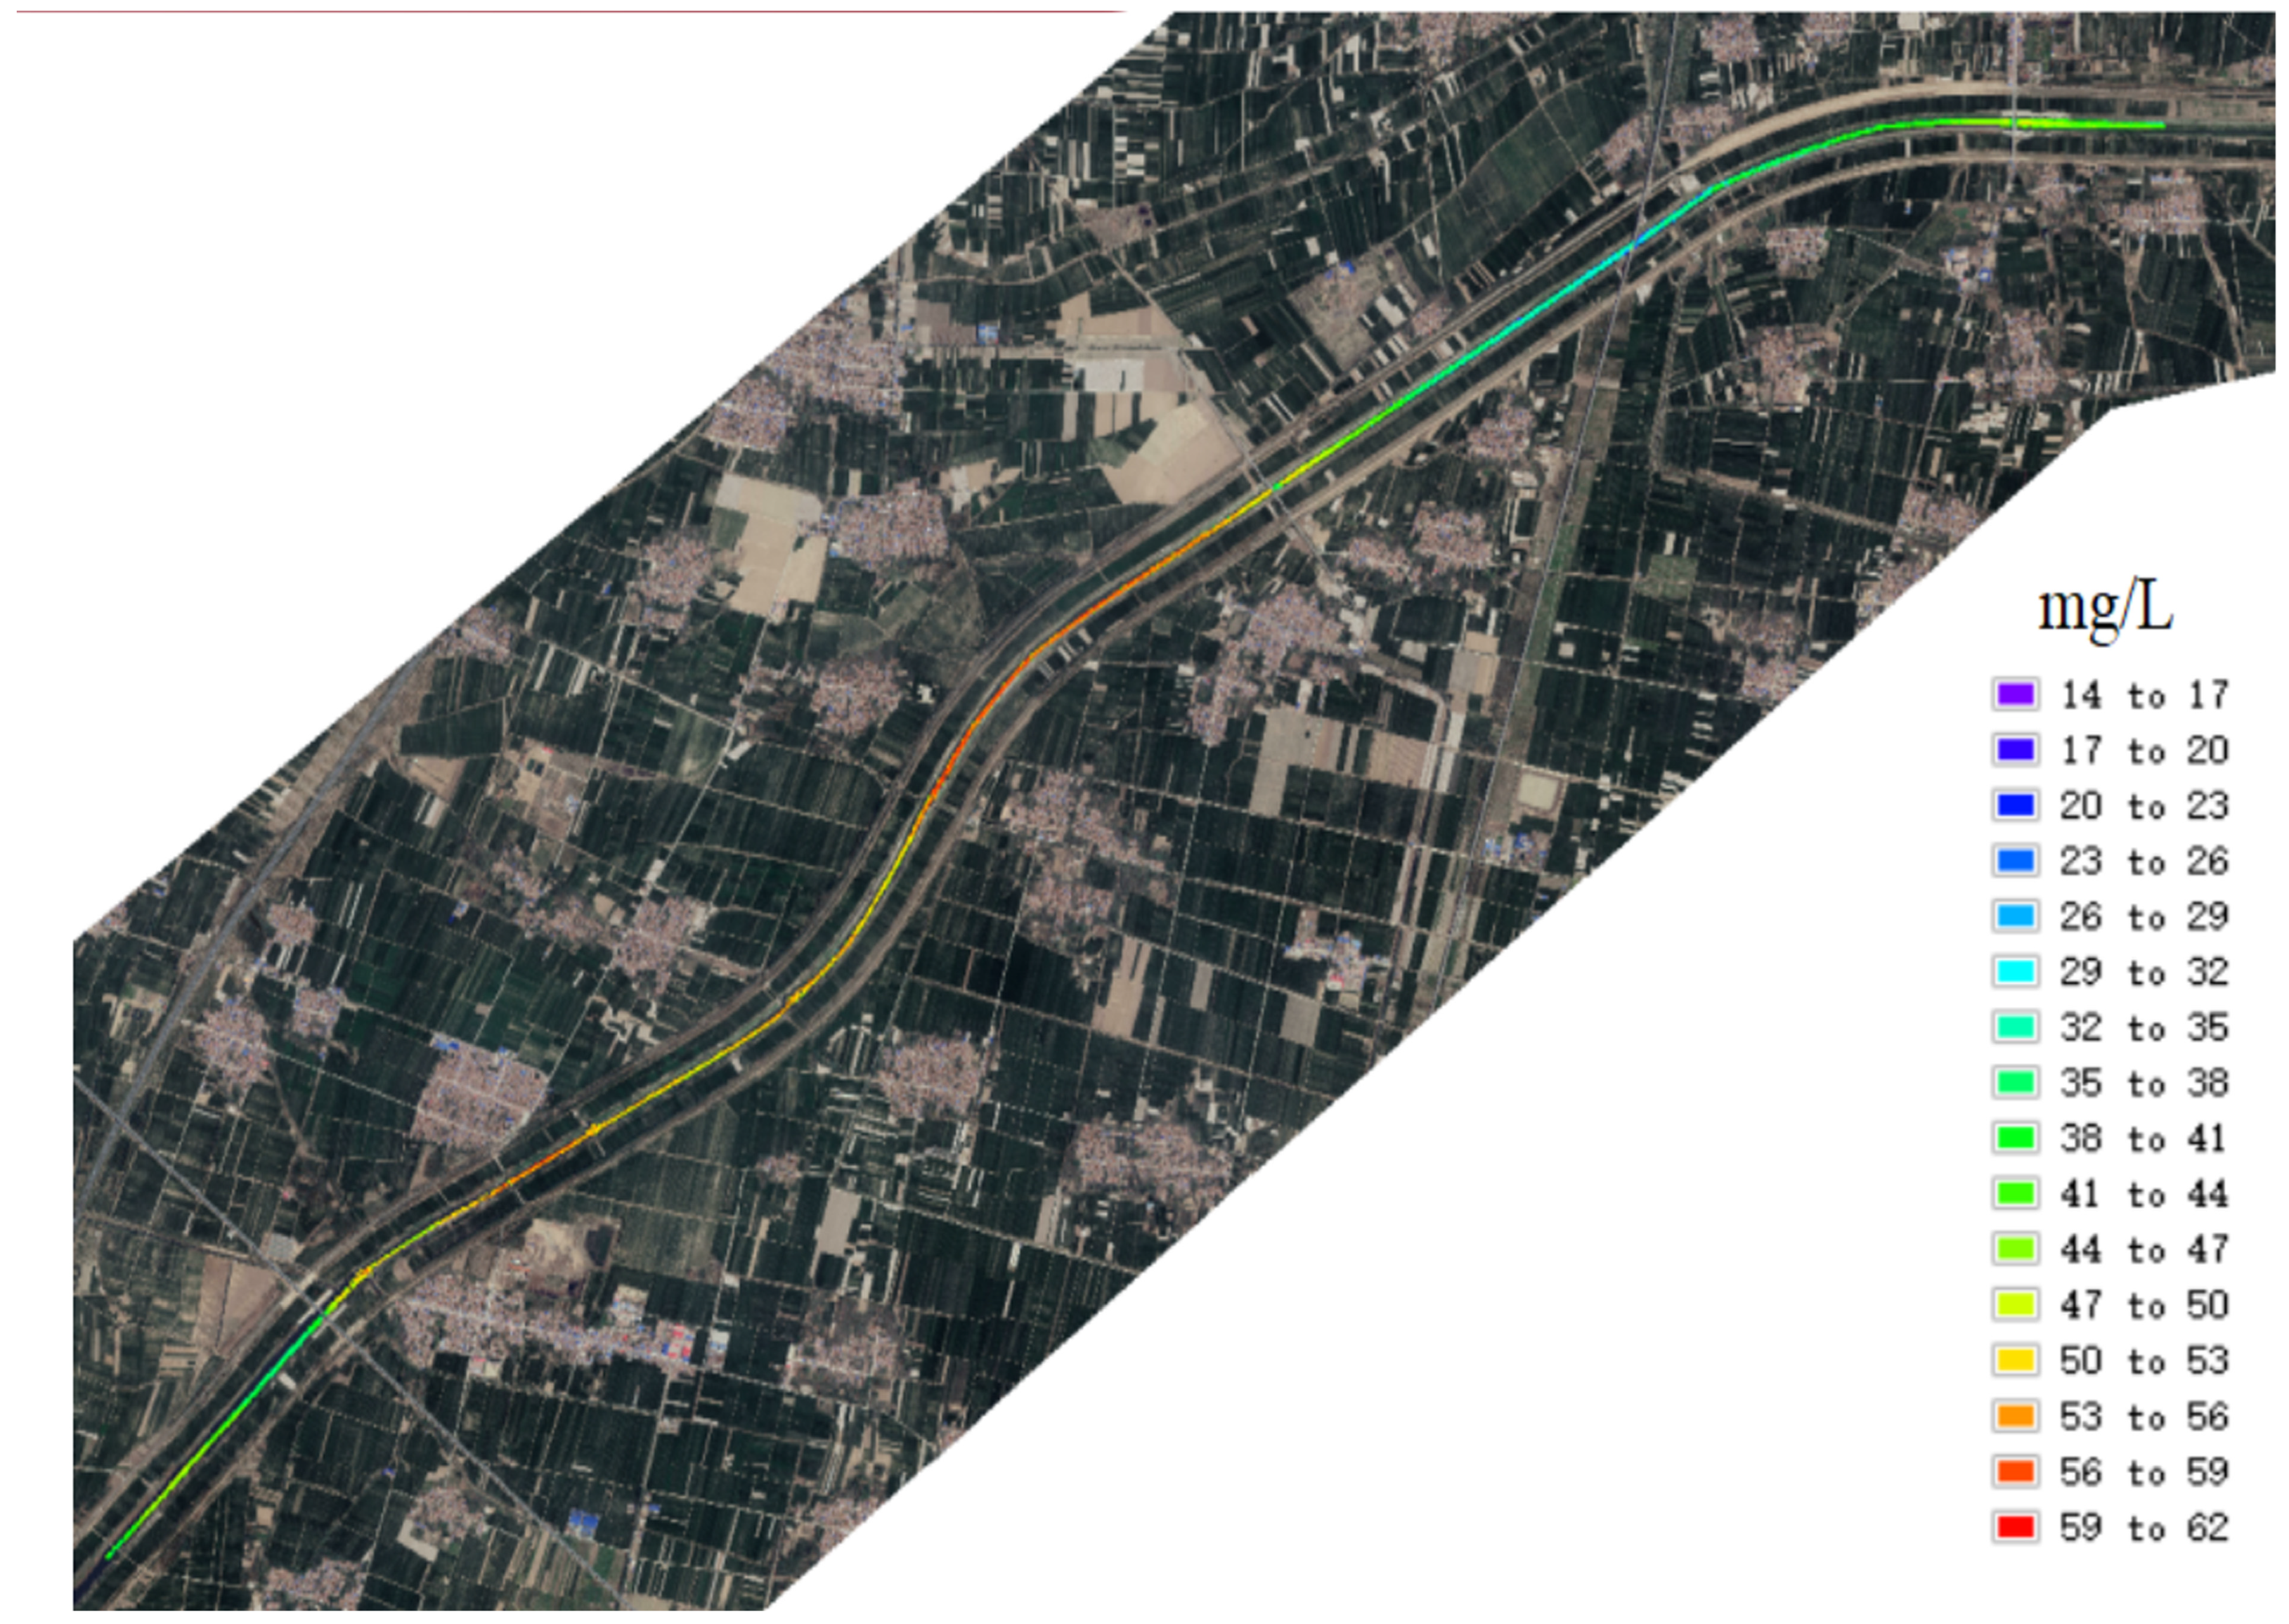
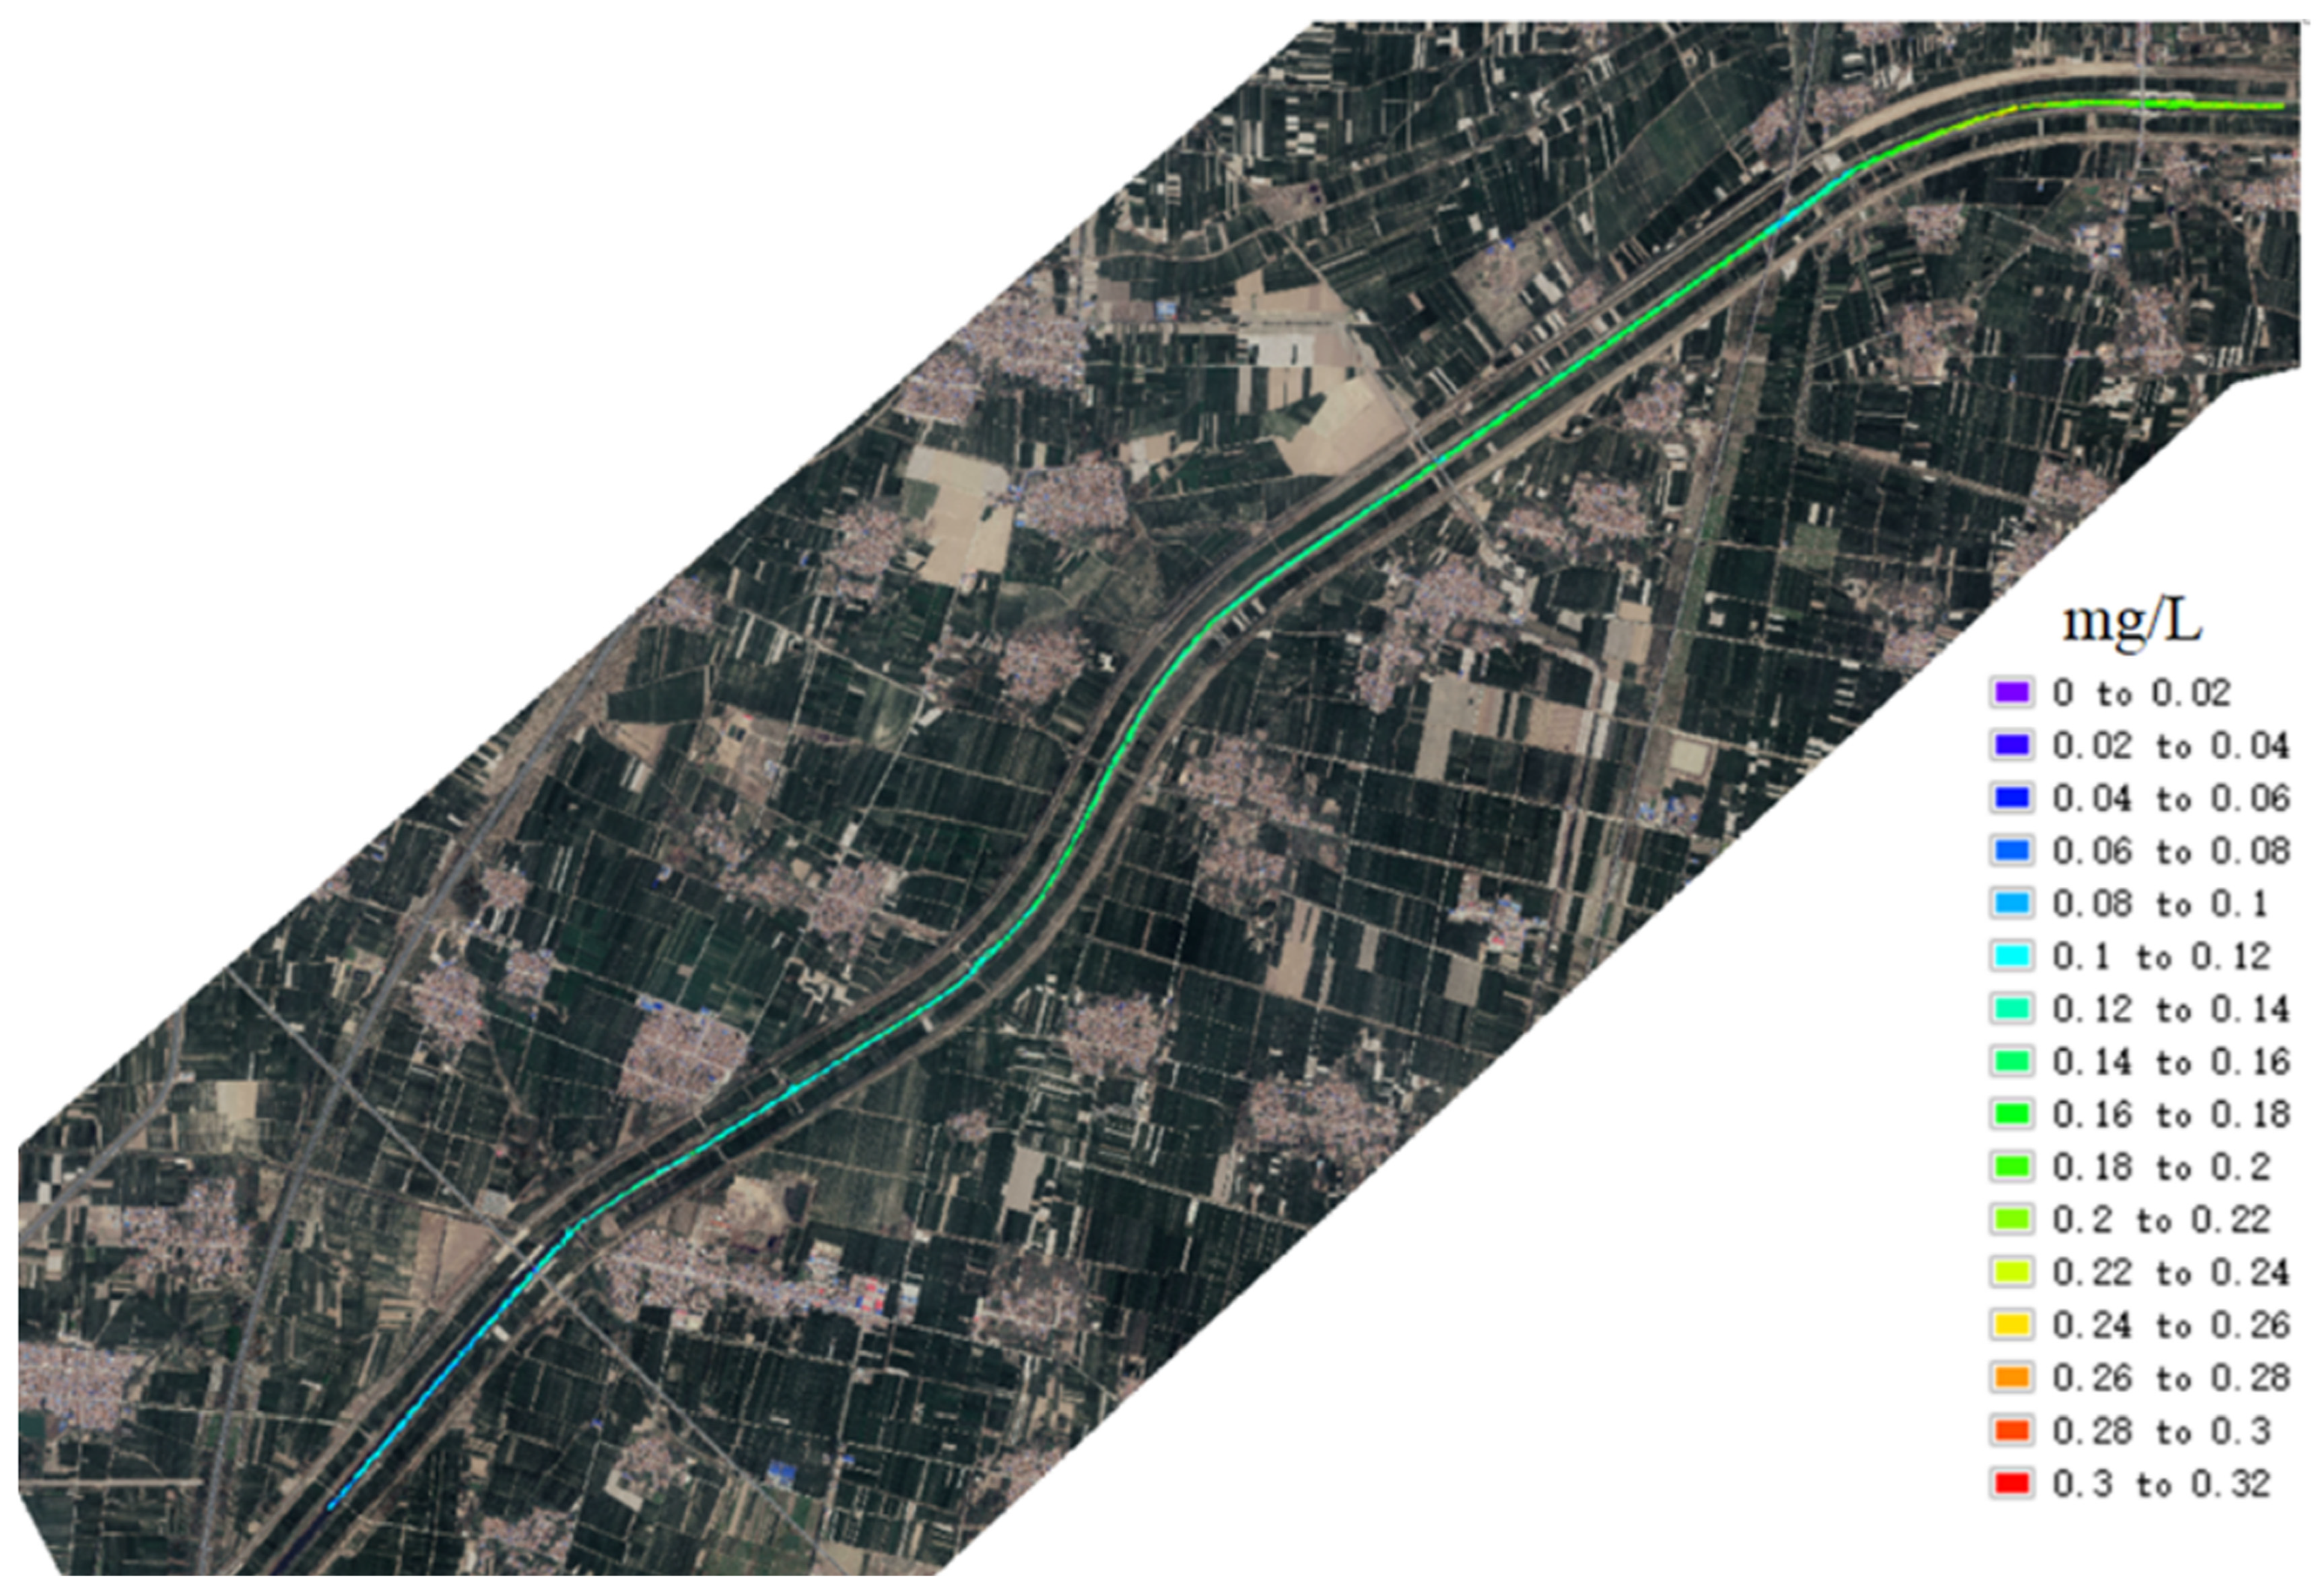
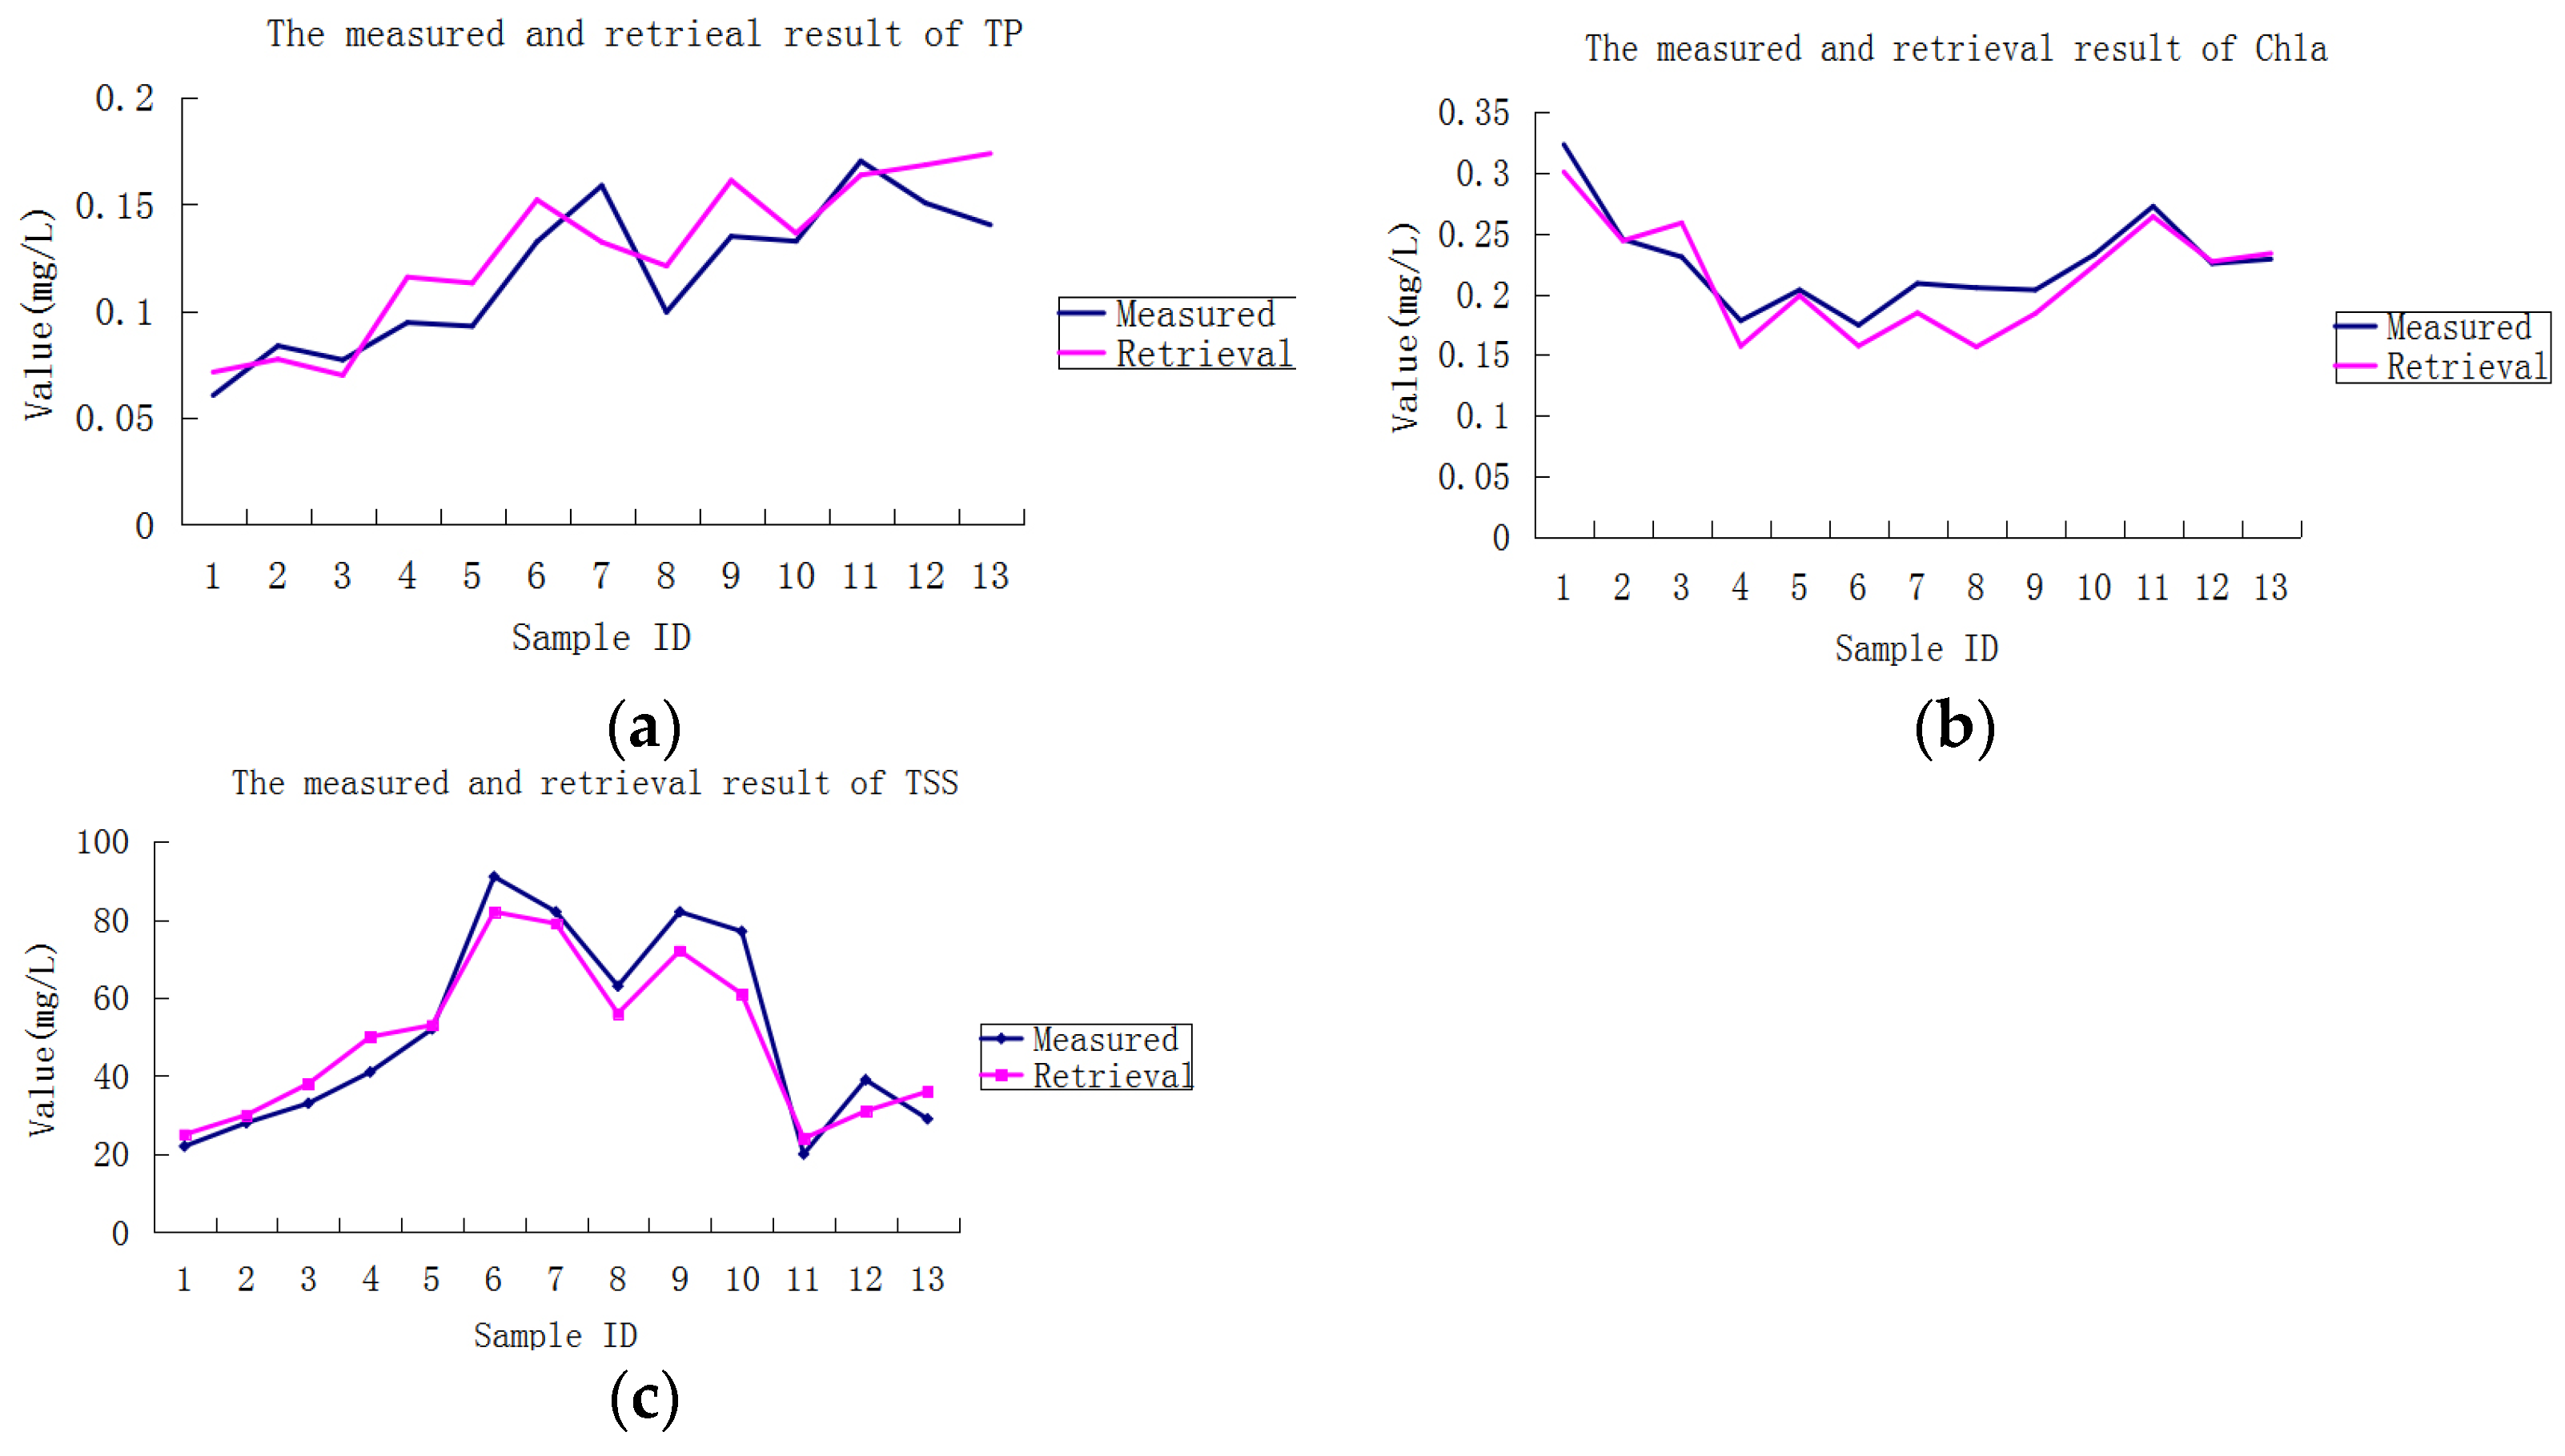
The TP, TSS, and Chla maps of the Zhang Wei Xin River were calculated on the basis of the water quality retrieval model and are shown in Figure 8, Figure 9 and Figure 10, respectively. In the river, the phosphate was the main nutrient in the eutrophication process. A high concentration of P could lead to a high concentration of Chla and cause a eutrophication process. Eutrophication started to occur when the P concentration reached 0.02 mg/L. For validation, the measured water parameters and the retrieval results were compared, as shown in Table 1. The measured and retrieval results of TP, Chla, and TSS are shown in the line charts in Figure 11a–c. As shown in the figures, the trend line of the TP, Chla, and TSS of the measured and retrieval values were coherent at the 1–12 sample points, except for the 13th sample point. As shown in Table 1, although at the 12th and 13th sample points there were larger deviation degrees in TSS and TP assessments, the deviation degrees were less than 24.13%. By statistical analysis, the coefficients of determination R2 of the measured and retrieval values of TP, Chla, and TSS were 0.886, 0.918, and 0.968, respectively.

4. Discussion

In this study, the R2 and the percentage of the difference were used as the criteria to determine if the proposed model properly fit our data. One study evaluated the applicability of regression models to predict the eutrophication parameters from the UAV multi-spectral images and generally exhibited the best linear results with the R2 values of 0.8154 and 0.8086 for TP and Chla, respectively [21]. Huang X. X. et al., used UAV multispectral remote sensing to monitor water quality parameters. The optimize-MPP algorithm was proposed to build the inversion model for the suspended sediment concentration (SS) and turbidity (TU) parameters. The optimal inversion model of SS had a R2 of 0.787 [22]. With the new developed hyperspectral imaging system, the spectral reflectance of water can be acquired at a low altitude, and thus it provides more detailed information of the water contents. The proposed UAV hyperspectral image water quality assessment method is a cost-effective way for the local government to understand the distribution of the TP, Chla, and TSS, showing the water pollution and eutrophication conditions. The linear regression models of TP and Chla by the hyperpsectral bands in Equations (2) and (4) had higher R2 values than only using the multi-spectral bands. Seen from the experiment results in Table 1 and Figure 11, the UAV hyperspectral image retrieval results were comparable to the measured water quality parameters. The deviation degrees between the measured value and the retrieval value were quite small. The trend lines of the measured and retrieval parameters were mostly coherent. Zhang Y. S. proposed an auto-adapting method based on the multiple artificial neural networks (ANN) to predict water quality parameters, including phosphorus, nitrogen, biochemical oxygen demand, chemical oxygen demand, and chlorophyll a. The R2 ranged from 0.93 (phosphorus) to 0.98 (nitrogen) [5]. Compared to this research work, our method was simpler; only the sensitive spectral bands were used to construct the linear regression model, and the R2 values of TP, Chla, and TSS were 0.886, 0.918, and 0.968, respectively.
According to the environmental quality standards for surface water in China, the TP value range of class I water is 0–0.02 mg/L, class II water is 0.02–0.1 mg/L, class III water is 0.1–0.2 mg/L, class IV water is 0.2–0.3 mg/L, and class V water is 0.3–0.4 mg/L. According to the integrated wastewater discharge standard of China, SS discharge of the city two-level sewage treatment plant is below 20 mg/L for the level 1 standard and below 30 mg/L for the level 2 standard. When the Chla value exceeds 0.01 mg/L, the river is eutrophic. From Figure 8, Figure 9 and Figure 10, it can be seen that the TP retrieval result ranged from 0 to 0.32 mg/L, the TSS retrieval result ranged from 14 to 62 mg/L, and the Chla retrieval result ranged from 0 to 0.32 mg/L. Therefore, Zhang Wei Xin River has been seriously polluted by the discharged waste. The distribution maps of TP, Chla, and TSS can be used to locate the pollution site and help the government make decisions on river water treatment.

5. Conclusions

Although the UAV push-broom hyperspectral imagery provides us with high spatial and spectral resolution images, the use of it in inland water quality assessment is minimal. The purpose of this research work was to validate the reflectivity of using push-broom UAV hyperspectral images in water quality assessment. The push-broom hyperspectral images were first mosaicked to obtain the high spatial and spectral resolution images with high geometric accuracy and spectral fidelity. Then, the water parameters were retrieved on the basis of the regression model that was established by the statistical analysis of the measured water parameters and the sensitive spectral features. The research shows that the UAV-based hyperspectral data can be effectively used to obtain the spatial distribution information for inland water monitoring. As shown in Table 1, the coefficients of determination R2 of TP, Chla, and TSS measured and retrieved from the UAV hyperspectral images were 0.886, 0.918, and 0.968, respectively. As the TP, TSS, and Chla maps show, the Zhang Wei Xin River suffers from the problems of water pollution and eutrophication. The government can use the map to identify the area where the pollution is most serious and make plans to regulate the river.
While the method proposed is a general workflow for water quality assessment, there is still much work that needs to be done in the future to obtain more accurate water parameter retrieval results. First, the water quality monitoring of small inland water by the proposed method generally requires a simultaneous observation of water samples alongside the UAV hyperspectral imager scan the river. The way in which to collect the representative samples along the river is a direction for further study. Secondly, while the water is flowing, the texture on the water and sun glint phenomenon may cause noise on the hyperspectral images, making the processing of hyperspectral images more difficult. The way in which to design the UAV flight scheme and reduce the noise needs to be studied. In this research, the seamless mosaicking method was used to obtain the hyperspectral images with high geometrical accuracy and high spectral fidelity. Due to the data volume being quite large, only the sensitive bands were selected and used to build the water parameter estimation model. The way in which to use a more complex modelling algorithm to make full use of the hyperspectral image and extract more accurate water quality parameters is also a key issue that needs to be studied.

Author Contributions

Conceptualization, G.Z.; methodology, L.Y.; validation, B.Z. and L.Y.; formal analysis, L.Y.; investigation, L.Y.; resources, G.Z.; data curation B.Z.; writing—original draft preparation, L.Y.; writing—review and editing, G.Z.; funding acquisition, L.Y. All authors have read and agreed to the published version of the manuscript.

Funding

This research was funded in part by Chinese Academy of Sciences Strategic Leading Science and Technology Project (Class A) (XDA13020506); the National Natural Science Foundation of China (61405204); China’s National Key R&D Program (2018YFB0504903, 2016YFB0501402); the High-Resolution Remote Sensing, Surveying and Mapping Application Demonstration System (Phase II) (42-Y30B04-9001-19/21); the National Key Research and Development Program for Intergovernmental Inovation Cooperation of Science and Technology (2022YFE0127700); the Fundamental Research Funds for the Central Universities (2022YQDC12) of the China University of Mining and Technology—Beijing and the College students’ Innovative Entrepreneurial Training Plan Program (C202302008) of the China University of Mining and Technology—Beijing.

Data Availability Statement

Not applicable.

Acknowledgments

It is appreciated that the associate research fellow Gong Liang Yu (Institute of Hydrobiology, Chinese Academy of Sciences) provided the data and technical support for the water quality sampling, measuring, and retrieval modelling, and that Xing Ming and Wenji Guo (ZKYD Data Technology Co., Ltd., Beijing, China) provided the UAV data, and that Xiao Xu (HUAWEI TECHNOLOGIES CO.LTD) mosaicked the hyperspectral images.

Conflicts of Interest

The authors declare no conflict of interest.

References

  1. Zhang, B.; Li, J.S.; Shen, Q.; Wu, Y.H.; Zhang, F.F.; Wang, S.L.; Yao, Y.; Guo, L.N.; Yin, Z.Y. Recent research progress on long time series and large scale optical remote sensing of inland water. Natl. Remote Sens. Bull. 2021, 25, 37–52. [Google Scholar] [CrossRef]
  2. Brooks, B.W.; Lazorchak, J.M.; Howard, M.D.A.; Johnson, M.V.; Morton, S.L.; Perkins, D.A.K.; Reavie, E.D.; Scott, G.I.; Smith, S.A.; Steevens, J.A. Are harmful algal blooms becoming the greatest inland water quality threat to public health and aquatic ecosystems? Remote Sens. Environ. 2016, 240, 111619. [Google Scholar] [CrossRef] [PubMed]
  3. Fichot, C.G.; Downing, B.D.; Bergamaschi, B.A.; Windham-Myers, L.; MarvinDiPasquale, M.; Thompson, D.R.; Gierach, M.M. High-Resolution Remote Sensing of Water Quality in the San Francisco Bay-Delta Estuary. Environ. Sci. Technol. 2016, 50, 573–583. [Google Scholar] [CrossRef] [PubMed]
  4. Huang, H.; Li, M.Y.; Chen, Y.H.; Chen, G.; Liu, H.L.; Xing, Q.G.; Cai, J.N. Water quality retrieval by hyperspectral for city rivers in Pearl River Estuary based on partial least squares regression. Water Resour. Prot. 2021, 37, 36–42. [Google Scholar]
  5. Zhang, Y.S.; Wu, L.; Ren, H.Z.; Liu, Y.; Zheng, Y.Q.; Liu, Y.W.; Dong, J.J. Mapping Water Quality Parameters in Urban Rivers from Hyperspectral Images Using a New Self-Adapting Selection of Multiple Artificial Neural Networks. Remote Sens. 2020, 12, 336. [Google Scholar] [CrossRef]
  6. Guimaraes, T.T.; Veronez, M.R.; Koste, E.C.; Gonzaga, L.; Bordin, F.; Inocencio, L.C.; Larocca, A.P.C.; de Oliveira, M.Z.; Vitti, D.C.; Mauad, F.F. An Alternative Method of Spatial Autocorrelation for Chlorophyll Detection in Water Bodies Using Remote Sensing. Int. J. Remote Sens. 2020, 9, 416. [Google Scholar] [CrossRef]
  7. Kim, G.; Baek, I.; Stocker, M.D.; Smith, J.E.; Van Tassel, A.L.; Qin, J.W.; Chan, E.D.; Pachepsky, Y.; Kim, M.S. Hyperspectral Imaging from a Multipurpose Floating Platform to Estimate Chlorophyll-a Concentrations in Irrigation Pond Water. Remote Sens. 2020, 12, 2070. [Google Scholar] [CrossRef]
  8. Cheng, L.; Tan, X.Y.; Yao, D.; Xu, W.X.; Wu, H.Y.; Chen, Y. A Fishery Water Quality Monitoring and Prediction Evaluation System for Floating UAV Based on Time Series. Sensors 2021, 21, 4451. [Google Scholar] [CrossRef] [PubMed]
  9. Su, T.C.; Chou, H.T. Application of Multispectral Sensors Carried on Unmanned Aerial Vehicle (UAV) to Trophic State Mapping of Small Reservoirs: A Case Study of Tain-Pu Reservoir in Kinmen, Taiwan. Remote Sens. 2015, 7, 10078–10097. [Google Scholar] [CrossRef]
  10. Mcilwaine, B.; Rivas Casado, M.; Leinster, P. Using 1st derivation reflectance signatures within a remote sensing framework to identify macroalgae in marine environments. Remote Sens. 2019, 11, 704. [Google Scholar] [CrossRef]
  11. McEliece, R.; Hinz, S.; Guarini, J.M.; Coston-Guarini, J. Evaluation of Nearshore and Offshore Water Quality Assessment Using UAV Multispectral Imagery. Remote Sens. 2020, 12, 2258. [Google Scholar] [CrossRef]
  12. Kieu, H.T.; Law, A.W.-K. Remote sensing of coastal hydro-environment with portable unmanned aerial vehicles (pUAVs) a state-of-the-art review. J. Hydro-Environ. Res. 2021, 37, 32–45. [Google Scholar] [CrossRef]
  13. Zeng, C.Q.; Richardson, M.; King, D.J. The impacts of environmental variables on water reflectance measured using a lightweight unmanned aerial vehicle (UAV)-based spectrometer system. ISPRS J. Photogramm. Remote Sens. 2017, 130, 217–230. [Google Scholar] [CrossRef]
  14. Olmanson, L.G.; Brezonik, P.L.; Bauer, M.E. Airborne hyperspectral remote sensing to assess spatial distribution of water quality characteristics in large rivers: The Mississippi River and its tributaries in Minnesota. Remote Sens. Environ. 2013, 130, 254–265. [Google Scholar] [CrossRef]
  15. Kim, J.S.; Seo, I.W.; Baek, D. Modeling spatial variability of harmful algal bloom in regulated rivers using a depth-averaged 2D numerical model. J. Hydro-Environ. Res. 2018, 20, 63–76. [Google Scholar] [CrossRef]
  16. Goddijn, L.M.; White, M. Using a digital camera for water quality measurements in Galway Bay. Estuar. Coast. Shelf Sci. 2006, 66, 429–436. [Google Scholar] [CrossRef]
  17. Lim, H.S.; MatJafri, M.Z.; Abdullah, K. Algorithm for turbidity mapping using digital camera images from a low-altitude light aircraft. In Proceedings of the 2009 2nd IEEE International Conference on Computer Science and Information Technology, Beijing, China, 8–11 August 2009; pp. 200–204. [Google Scholar]
  18. Jiang, Q.O.; Xu, L.D.; Sun, S.Y.; Wang, M.L.; Xiao, H.J. Retrieval model for total nitrogen concentration based on UAV hyperspectral remote sensing data and machine learning algorithms—A case study in the Miyun Reservoir, China. Ecol. Indic. 2021, 124, 107356. [Google Scholar]
  19. Yi, L.; Chen, J.M.; Zhang, G.; Xu, X.; Ming, X.; Guo, W. Seamless Mosaicking of UAV-Based Push-Broom Hyperspectral Images for Environment Monitoring. Remote Sens. 2021, 13, 4720. [Google Scholar] [CrossRef]
  20. Guo, W.J.; Yu, G.L.; Liu, X.Y.; Chen, Y.X. Water environment multi-parameter retrieval and monitor technique based on UAV-based hyperspectral imaging system. In Proceedings of the Chinese Hydraulic Engineering Society (CHES) Annual Conference, Nanchang, China, 18–22 October 2018. [Google Scholar] [CrossRef]
  21. Lin, C.-Y.; Tsai, M.-S.; Tsai, J.T.H.; Lu, C.-C. Prediction of Carlson Trophic State Index of Small Inland Water from UAV-Based Multispectral Image Modeling. Appl. Sci. 2023, 13, 451. [Google Scholar] [CrossRef]
  22. Huang, X.-X.; Ying, H.-T.; Xia, K.; Feng, H.-L.; Yang, Y.-H.; Du, X.-C. Inversion of Water Quality Parameters Based on UAV Multispectral Images and the OPT-MPP Algorithm. Environ. Sci. 2020, 41, 3591–3600. [Google Scholar] [CrossRef]
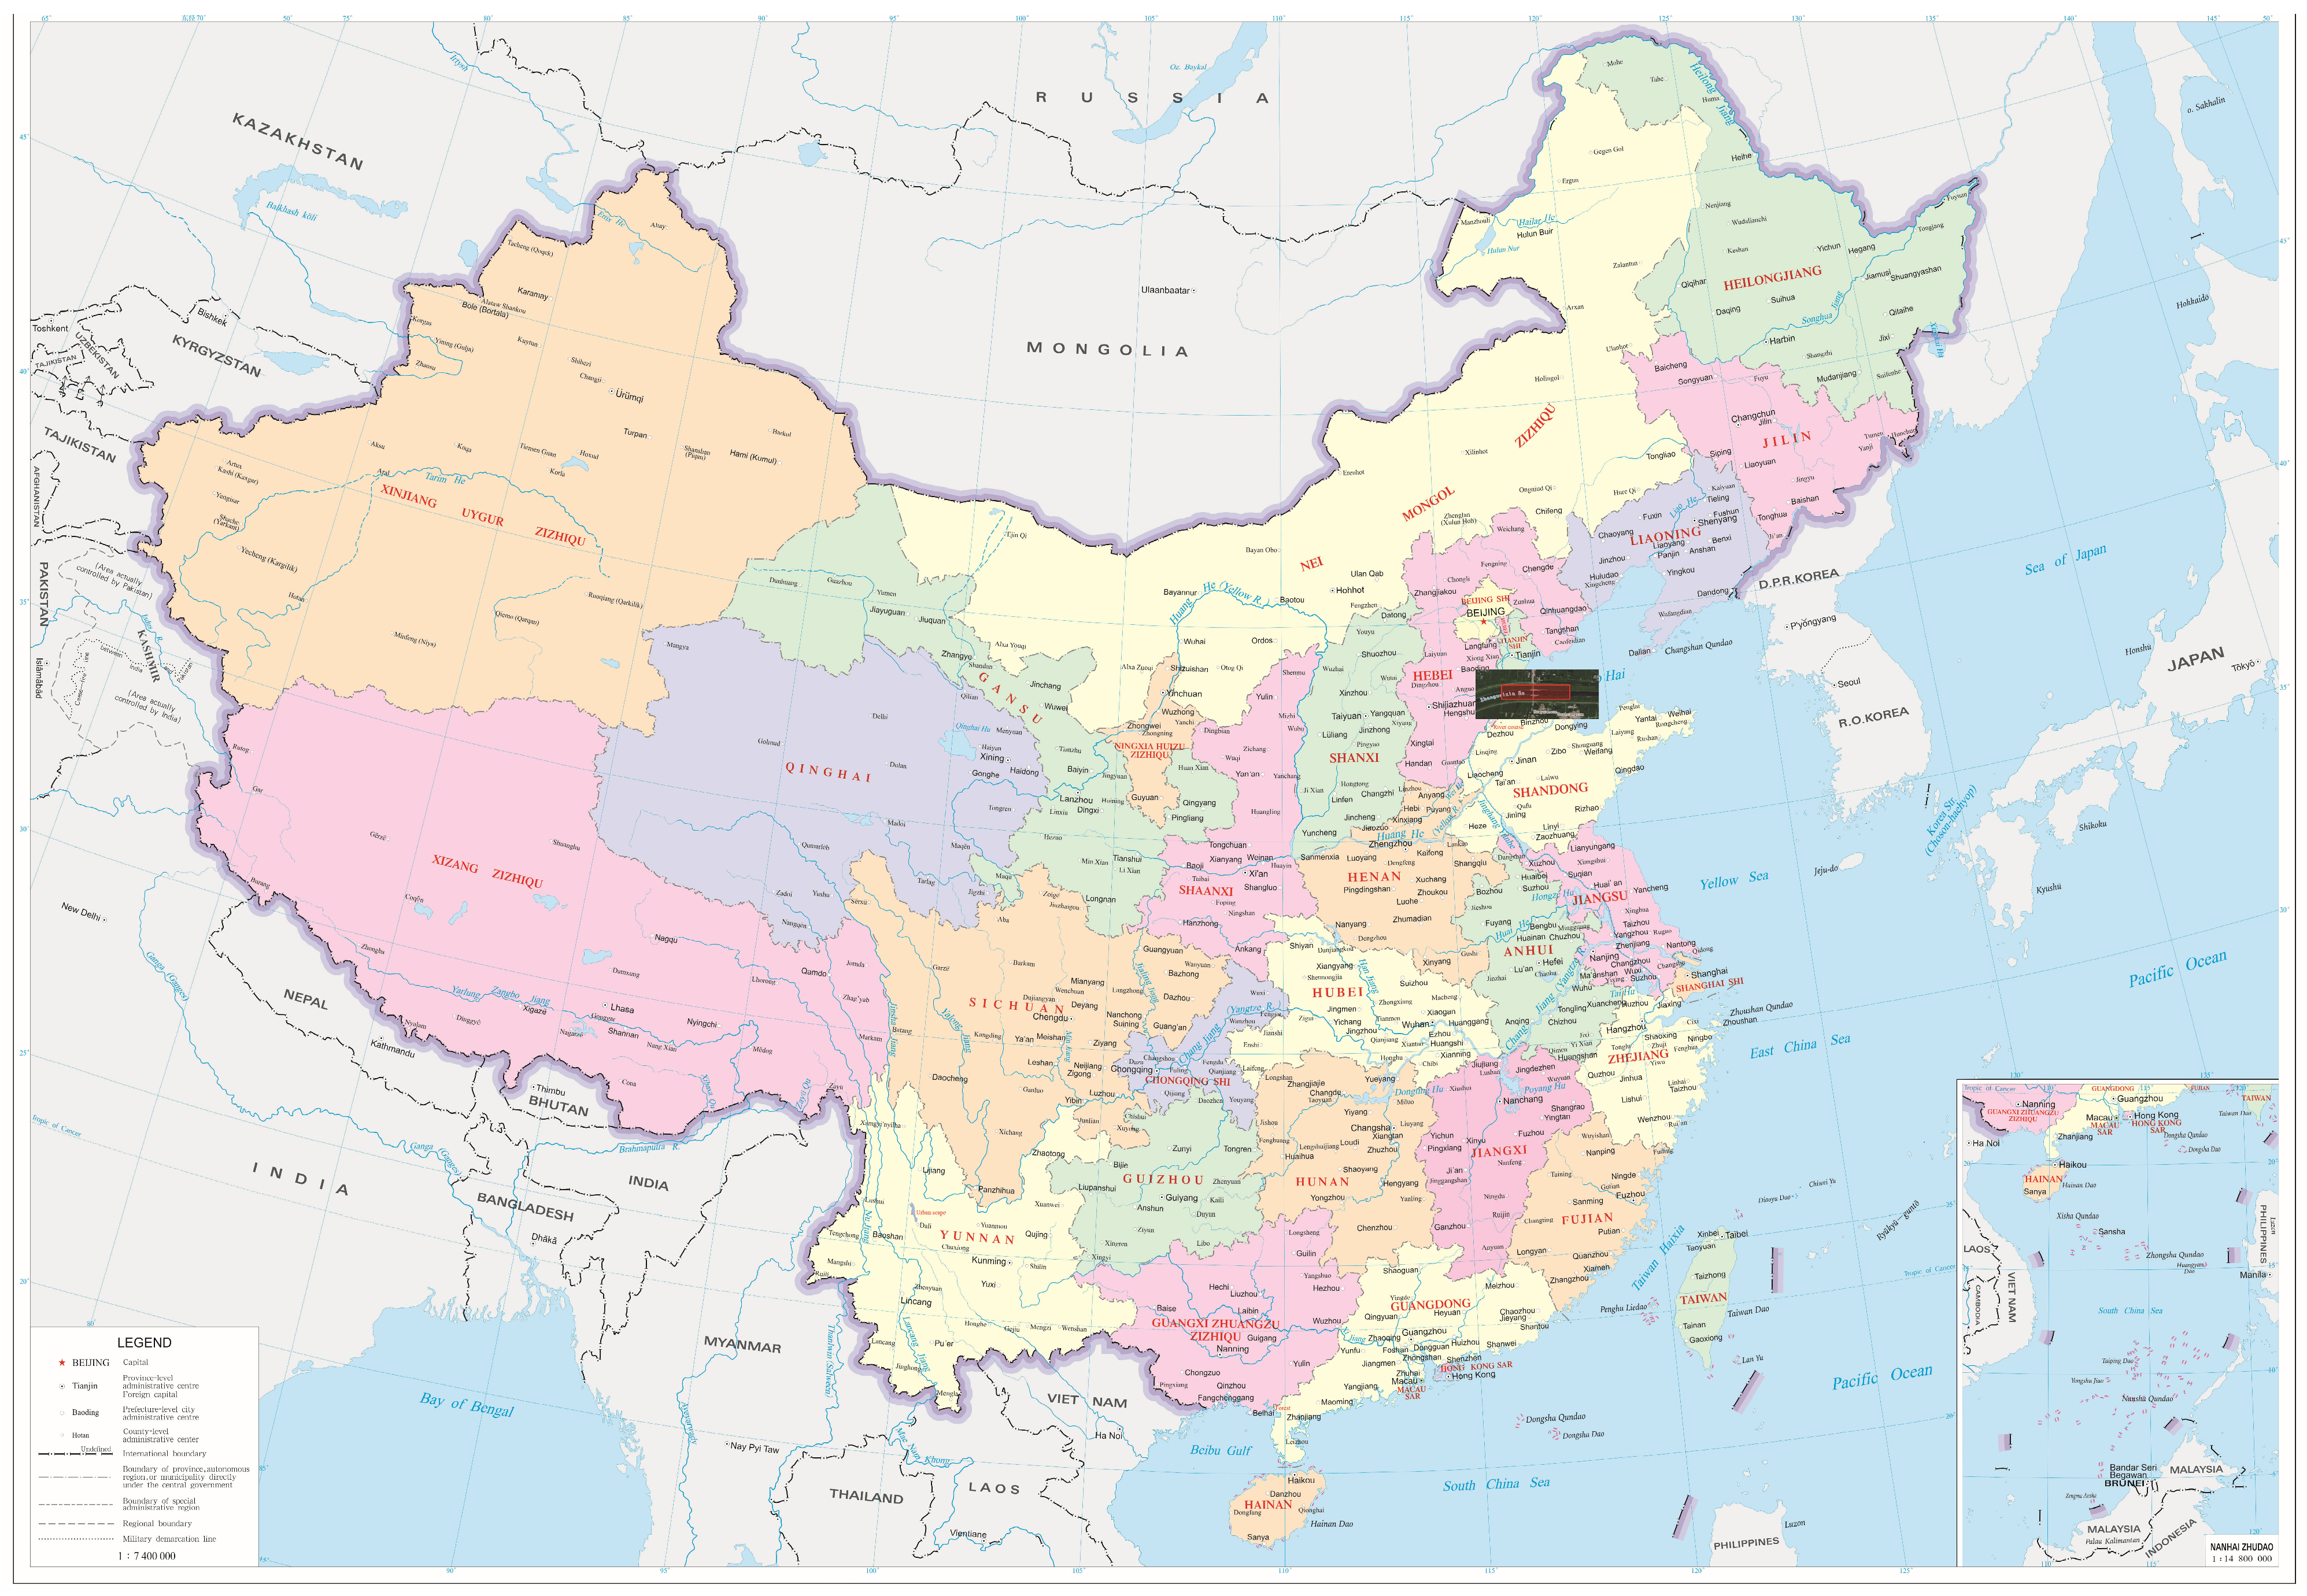
Figure 1. The location of Zhang Wei Xin River in China.
Remotesensing 15 02360 g001
Figure 2. The UAV hyperspectral image acquisition.
Remotesensing 15 02360 g002
Figure 3. The mosaicked hyperspectral image of the whole river course (red points are the samples).
Remotesensing 15 02360 g003
Figure 4. The three hyperspectral images of river courses (the red point in the circle is the sampling point).
Remotesensing 15 02360 g004
Figure 5. The UAV hyperspectral image water quality parameter extraction workflow.
Remotesensing 15 02360 g005
Figure 6. The water extraction example: (a) the mosaicked river course; (b) the NDWI image.
Remotesensing 15 02360 g006
Figure 7. Typical water spectral curve features: (a) class I: the double peak and multi shoulder curves; (b) class II: the typical bimodal curves; (c) class III: the atypical bimodal curves; (d) class IV: the unimodal curves. Different colors represent the spectral curves of water samples within each typical class.
Remotesensing 15 02360 g007aRemotesensing 15 02360 g007b
Figure 8. The TP retrieval result of Zhang Wei Xin River.
Remotesensing 15 02360 g008
Figure 9. The TSS retrieval result of Zhang Wei Xin River.
Remotesensing 15 02360 g009
Figure 10. The Chla retrieval result of Zhang Wei Xin River.
Remotesensing 15 02360 g010
Figure 11. The line charts of the measured and retrieval results of the testing sample points in Zhang Wei Xin River. (a) TP. (b) Chla. (c) TSS.
Remotesensing 15 02360 g011
Table 1. Comparison of the measured water parameters and the retrieval results.
Testing SamplesTP (mg/L)Chla (mg/L)TSS (mg/L)
MeasuredRetrievalDeviation Degree (%)MeasuredRetrievalDeviation Degree (%)MeasuredRetrievalDeviation Degree (*) (%)
10.06050.071418.010.32330.3007−6.99222513.63
20.08370.0774−7.520.24520.244−0.4828307.14
30.07710.0699−9.330.23060.258712.18333815.15
40.09460.115922.510.1780.157−11.79415021.95
50.09290.113121.740.20340.1986−2.3552531.92
60.13250.152114.790.17430.1572−9.819182−9.89
70.15880.1323−16.680.20880.1845−11.638279−3.65
80.09950.121121.700.20520.1564−23.786356−11.11
90.1350.161219.400.20340.1839−9.588272−12.19
100.13270.13652.860.23250.2233−3.957761−20.77
110.17030.1637−3.8750.27240.2639−3.12202420.00
120.15060.168511.880.22520.22680.713931−20.51
130.14040.173823.780.22880.23352.05293624.13
* The deviation degree is the percentage of the difference between measured and retrieval values.
Disclaimer/Publisher’s Note: The statements, opinions and data contained in all publications are solely those of the individual author(s) and contributor(s) and not of MDPI and/or the editor(s). MDPI and/or the editor(s) disclaim responsibility for any injury to people or property resulting from any ideas, methods, instructions or products referred to in the content.