Article

CTCD-Net: A Cross-Layer Transmission Network for Tiny Road Crack Detection

1
State Key Laboratory of Information Engineering in Surveying, Mapping and Remote Sensing, Wuhan University, Wuhan 430079, China
2
Beidou Research Institute, Faculty of Engineering, South China Normal University, Foshan 528000, China
3
National-Local Joint Engineering Laboratory of Geo-Spatial Information Technology, Hunan University of Science and Technology, Xiangtan 411201, China
*
Author to whom correspondence should be addressed.
Remote Sens. 2023, 15(8), 2185; https://doi.org/10.3390/rs15082185
Submission received: 31 March 2023 / Revised: 13 April 2023 / Accepted: 17 April 2023 / Published: 20 April 2023
(This article belongs to the Section Remote Sensing Image Processing)

Abstract

:
Crack detection is essential for the safety maintenance of road infrastructure. However, there are two major limitations to detecting road cracks accurately: (1) tiny cracks usually possess less distinctive features and are more susceptible to noises, so they are apt to be ignored; (2) most existing methods extract cracks with coarse and thicker boundaries, which needs further improvement. To address the above limitations, we propose CTCD-Net: a Cross-layer Transmission network for tiny road Crack Detection. Firstly, we propose a cross-layer information transmission module based on an attention mechanism to compensate for the disadvantage of unobvious features of tiny cracks. With this module, the feature information from upper layers is transmitted to the next one, layer by layer, to achieve information enhancement and emphasize the feature representation of tiny crack regions. Secondly, we design a boundary refinement block to further improve the accuracy of crack boundary locations, which refines boundaries by learning the residuals between the label images and the interim coarse maps. Extensive experiments conducted on three crack datasets demonstrate the superiority and effectiveness of the proposed CTCD-Net. In particular, our method largely improves the accuracy and completeness of tiny crack detection.

1. Introduction

Roads are fundamental transport infrastructures and play a crucial part in promoting urban communication and economic prosperity. However, as one of the most common road problems, cracks seriously affect driving safety and the quality of transportation activities [1,2]. Timely detection of road cracks will contribute to improving road performance and ensuring road serviceability [3]. Therefore, automatic crack detection is an essential task. Especially for tiny cracks, which can easily deteriorate into large cracks or potholes after rain or intense insolation, it is essential to detect them as early as possible to realize warning in advance.
Traditional crack detection approaches are mostly based on image processing; for instance, region growing methods [4], edge detection-based methods [5,6], and threshold-based methods [7,8]. These detection methods only use simple features such as continuity, texture features, and geometric features, which makes them susceptible to noises, shadows, and uneven illuminations [9]. In other words, these methods have poor robustness and anti-interference ability. Thus, some more complex hand-crafted features were designed to promote the performance of crack detection and enhance robustness, such as wavelet features [10], local binary patterns [11], and histogram of oriented gradient [12]. Subsequently, shallow machine learning algorithms, such as support vector machine (SVM) [13] and random forest (RF) [14], have been incrementally employed for detecting cracks and have shown better performance.
Although the above-mentioned methods have made some progress in crack detection, they mainly utilized features that strongly rely on subjective experience. In addition, these methods are still unable to distinguish noises and cracks effectively from images in complex road environments, leading to unreliable crack results.
Recently, the increasingly efficient progression of deep learning (DL) has led to it being broadly employed for semantic segmentation [15,16]. For crack detection, some works [17,18,19] treated it as a classification task, using deep learning as a classifier to categorize a given patch of input images as crack and non-crack, and then used the positive patches to locate the crack regions. Further, many researchers employed object detection networks for crack detection, using rectangular boxes to represent crack regions on images [20,21,22]. However, image-classification-based and object-detection-based approaches only yield approximate regions of cracks rather than precise information, which is not the optimal result and is also not conducive to further quantitative analysis.
To solve this problem, researchers have applied pixel-level segmentation networks to crack detection, e.g., FCN [23], SegNet [24], and U-Net [25], and derived many segmentation-based variant networks [26,27,28] from fundamental baselines. Further, to improve the crack detection performance, researchers have embedded some effective modules into these advanced baseline networks in different ways, such as various attention mechanisms and feature fusion operations [29,30,31]. Although the aforementioned methods have made considerable progress, the ability to extract tiny cracks still needs to be improved and the issue of coarse and thicker crack boundaries also needs further investigation.
In summary, automatic road crack detection from CCD images remains a challenging task, which is manifested in two aspects:
(1)
Tiny cracks generally possess weaker feature information and are more susceptible to the interference from noises, so many existing methods achieve poor performance and completeness in extracting tiny cracks.
(2)
Most of the existing methods for crack detection tend to generate coarse and thicker crack boundaries, which are not desirable results.
Figure 1 visually illustrates the two main challenges of crack detection with a simple example. The red and green rectangular boxes mark tiny cracks that are not completely extracted. It can be seen that the extracted cracks have rougher and thicker boundaries than the labels.
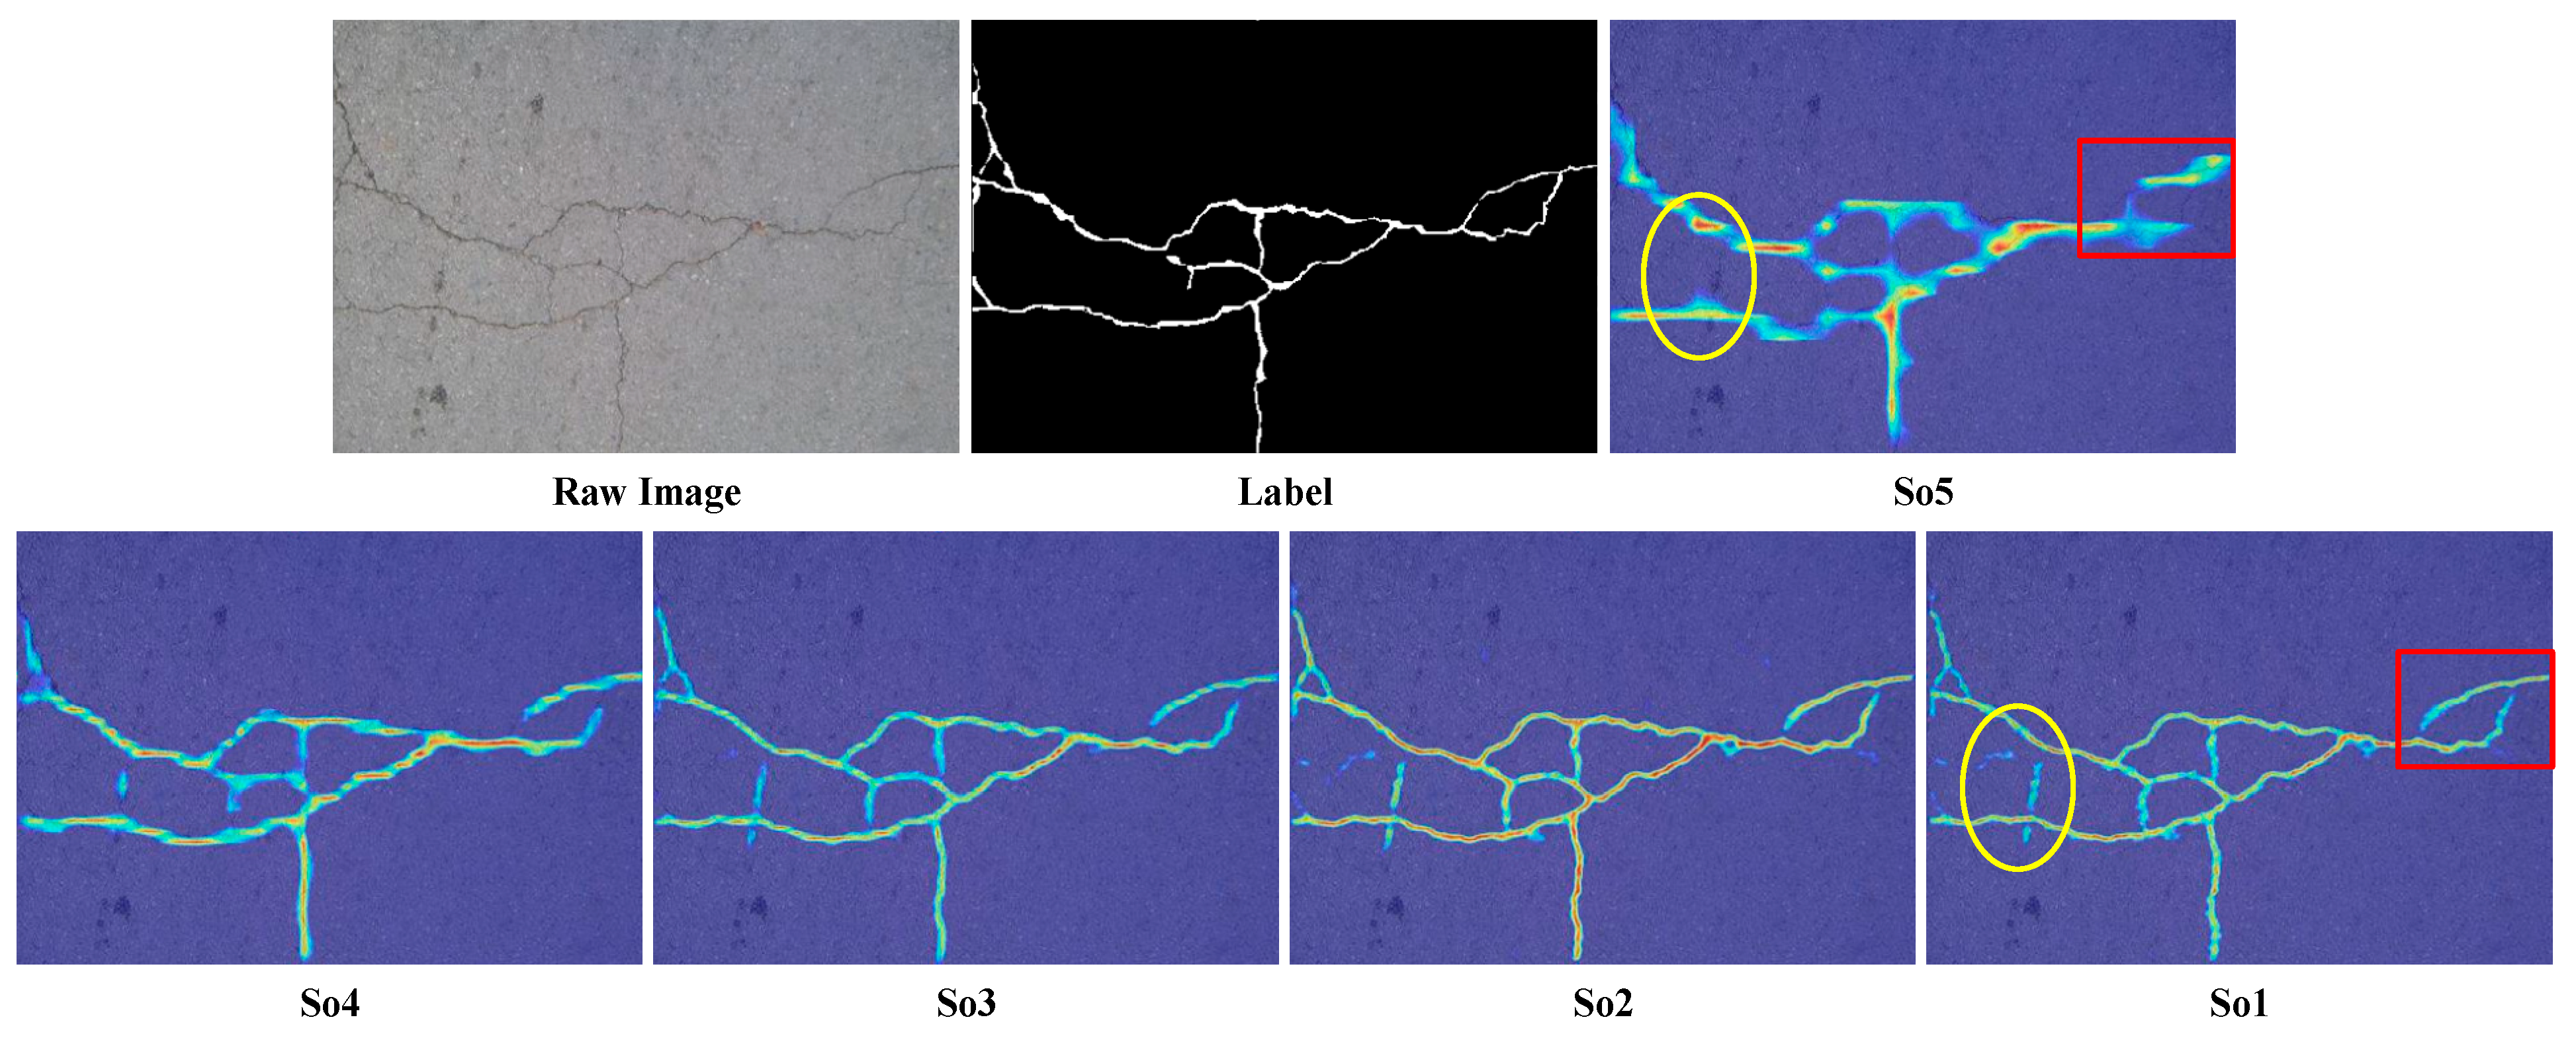
For surmounting the above issues, the paper proposes CTCD-Net: a cross-layer transmission network for tiny road crack detection. To overcome the first challenge, the key issue to be addressed is how to enhance the representation of tiny cracks while suppressing noises. Given the fact that higher-layer features generally possess much more semantic information (such as rough locations of cracks), while lower-layer features possess more details about tiny cracks, but also introduce more noises (as shown in Figure 2), we propose a cross-layer information transmission module, which effectively realizes the information complementarity among high layers and low layers. Furthermore, it should be considered that if all channels of a feature map have the same weight, the features of tiny cracks are apt to be ignored or not significantly represented because they are weaker. Thus, we incorporate attention mechanisms into the cross-layer information transmission module, which can automatically learn the significance of all channels for the current task and then assign corresponding weights to each channel. The attention-based cross-layer information transmission module enables our model to focus more on tiny cracks, thus improving the capability of tiny crack detection. To overcome the second challenge, we design a boundary refinement block based on residual structure and apply it before both the final output and the side outputs at each layer of the proposed CTCD-Net, which learns the residuals between the label images and the interim coarse maps to refine crack boundaries.
Our contributions are presented below:
(1)
CTCD-Net for tiny road crack detection is proposed, which utilizes SegNet with five side outputs as the backbone architecture and takes advantage of the complementary information from all layers.
(2)
An attention-based cross-layer information transmission module is proposed. At each layer, the module integrates attention mechanisms to transmit the information from higher layers to the next layer to achieve the full use of complementary feature information, which improves the extraction ability of tiny cracks to a great extent.
(3)
A boundary refinement block based on residual structure is proposed. The refinement block is embedded before both the final output and the five side outputs from each layer, which effectively addresses the problem of coarse and thicker boundaries.
The rest of this paper is structured as follows. Section 2 reviews the related work. Section 3 describes the details of the proposed CTCD-Net. In Section 4, we analyze the experimental results. In Section 5, we discuss the main findings of our paper and prospects for future work. In Section 6, we conclude our works.

2. Related Work

2.1. Crack Detection Based on Deep Learning

Crack detection using deep learning is generally summarized briefly into the following approaches: (1) image-classification-based [17,18,19], (2) object-detection-based [32,33], and (3) pixel-level semantic-segmentation-based approaches. The approach proposed in our paper is a semantic segmentation method, so we review the related works about this category in detail.
Initially, Xie et al. [34] and Liu et al. [35] successively designed the holistically nested edge detection (HED) model and the richer convolutional features (RCF) model for detecting edges, respectively. Because cracks and edges are similar linear objects, HED and RCF are also usually employed for crack detection. Then, Liu et al. [29] presented DeepCrack on the basis of deeply supervised network (DSN) and HED, and refined the final maps through guided filtering (GF) and conditional random field (CRF). However, because these three methods only contain an encoder structure, the prediction results are seriously affected by background noises.
Therefore, encoder–decoder-based networks were further applied to crack detection. U-Net [25] is a popular baseline network, which concatenates the corresponding features from an encoder and decoder through skip connections, which is improves crack detection performance. Further, Yang et al. [36] designed a crack detection model similar to encoder–decoder, which incorporated the feature pyramid technique and hierarchical boosting technique into HED. It includes a bottom-up structure and a top-down structure. Subsequently, compared with traditional networks that have only one output from the last layer, some works output the results at each layer through side networks and then fuse them to generate the final prediction [29,31,37]. This fusion operation of side outputs has been shown to be helpful for improving the capability of crack detection.
Moreover, to obtain more context information, Fan et al. [37] and Qu et al. [38] introduced dilation convolution modules into their networks aimed to increase the receptive field. Xu et al. [39] presented a locally enhanced transformer for extracting long-range contextual features with the aim of establishing a promising crack detection method. With the evolution of attention mechanisms, many works have introduced them into crack detection in various ways [30,40,41]. All of these approaches have contributed to the advances in crack detection to different extents. However, the above-mentioned methods pay little attention to tiny cracks, and thus achieve poor performance in extracting tiny cracks.
To address this issue, Liu et al. [42] designed a novel shape semantic prior module for guiding the model forward, and embedded it into an encoder–decoder network. It improves the accuracy of tiny crack extraction to a certain extent, but still does not consider the problem of coarse crack boundaries.
For the problem of coarse and thicker boundaries, Guo et al. [43] presented a model that takes the original edges of images as an additional feature for crack refinement, but the method needs to detect the edges in advance, and results in more parameters because of the inclusion of two U-shaped architectures.

2.2. Attention Mechanism

Attention mechanisms in computer vision are similar to humans’ selective vision, aiming to promote information that is more helpful for the current task and suppress less important information. Hu et al. [44] presented one new method, named the squeeze-and-excitation network (SENet), for adaptively re-calibrating channel-wise features. Channel attention (CA) emphasizes the significance of different channels, while spatial attention (SA) emphasizes the significance of spatial location. Therefore, Woo et al. [45] and Park et al. [46] designed the convolutional block attention module (CBAM) and the bottleneck attention module (BAM). CBAM could be regarded as the series connection of CA and SA, while BAM could be understood as the parallel connection of CA and SA. Considering that long-range dependencies help to understand global information, Wang et al. [47] designed non-local neural networks (NLNet) for capturing them. Cao et al. [48] designed a lightweight global context (GC) module by integrating SENet and NLNet, which achieved effective global context modeling. Because of the effectiveness of attention mechanisms, many works [30,39,40,41] have introduced them into automatic crack detection and have made some progress.

2.3. Boundary Refinement

A coarse and thicker boundary is still an issue in automatic crack detection. In saliency detection, Wang et al. [49] designed multi-stage refinement nets to refine the interim coarse maps. Deng et al. [50] used the newly presented residual refinement block recurrently to alternatively exploit the features from different layers to refine their saliency detection results. Qin et al. [51] and Peng et al. [52] employed an encoder–decoder-like net and simple residual structure as refinement modules, respectively, and both of them achieved good results. In crack detection, Liu et al. [29] refined cracks through guided filtering and conditional random field, but they only regarded them as post-processing operations rather than involving them in end-to-end network training. Guo et al. [43] adopted a refinement module similar to [51] and used the original edges of input images as an additional feature for crack refinement, but this method resulted in more parameters because of the inclusion of two U-shaped architectures. In the existing crack detection networks, boundary refinement is rarely introduced and explored, which is a challenging but meaningful problem that needs further research.

3. Methodology

3.1. Model Overview

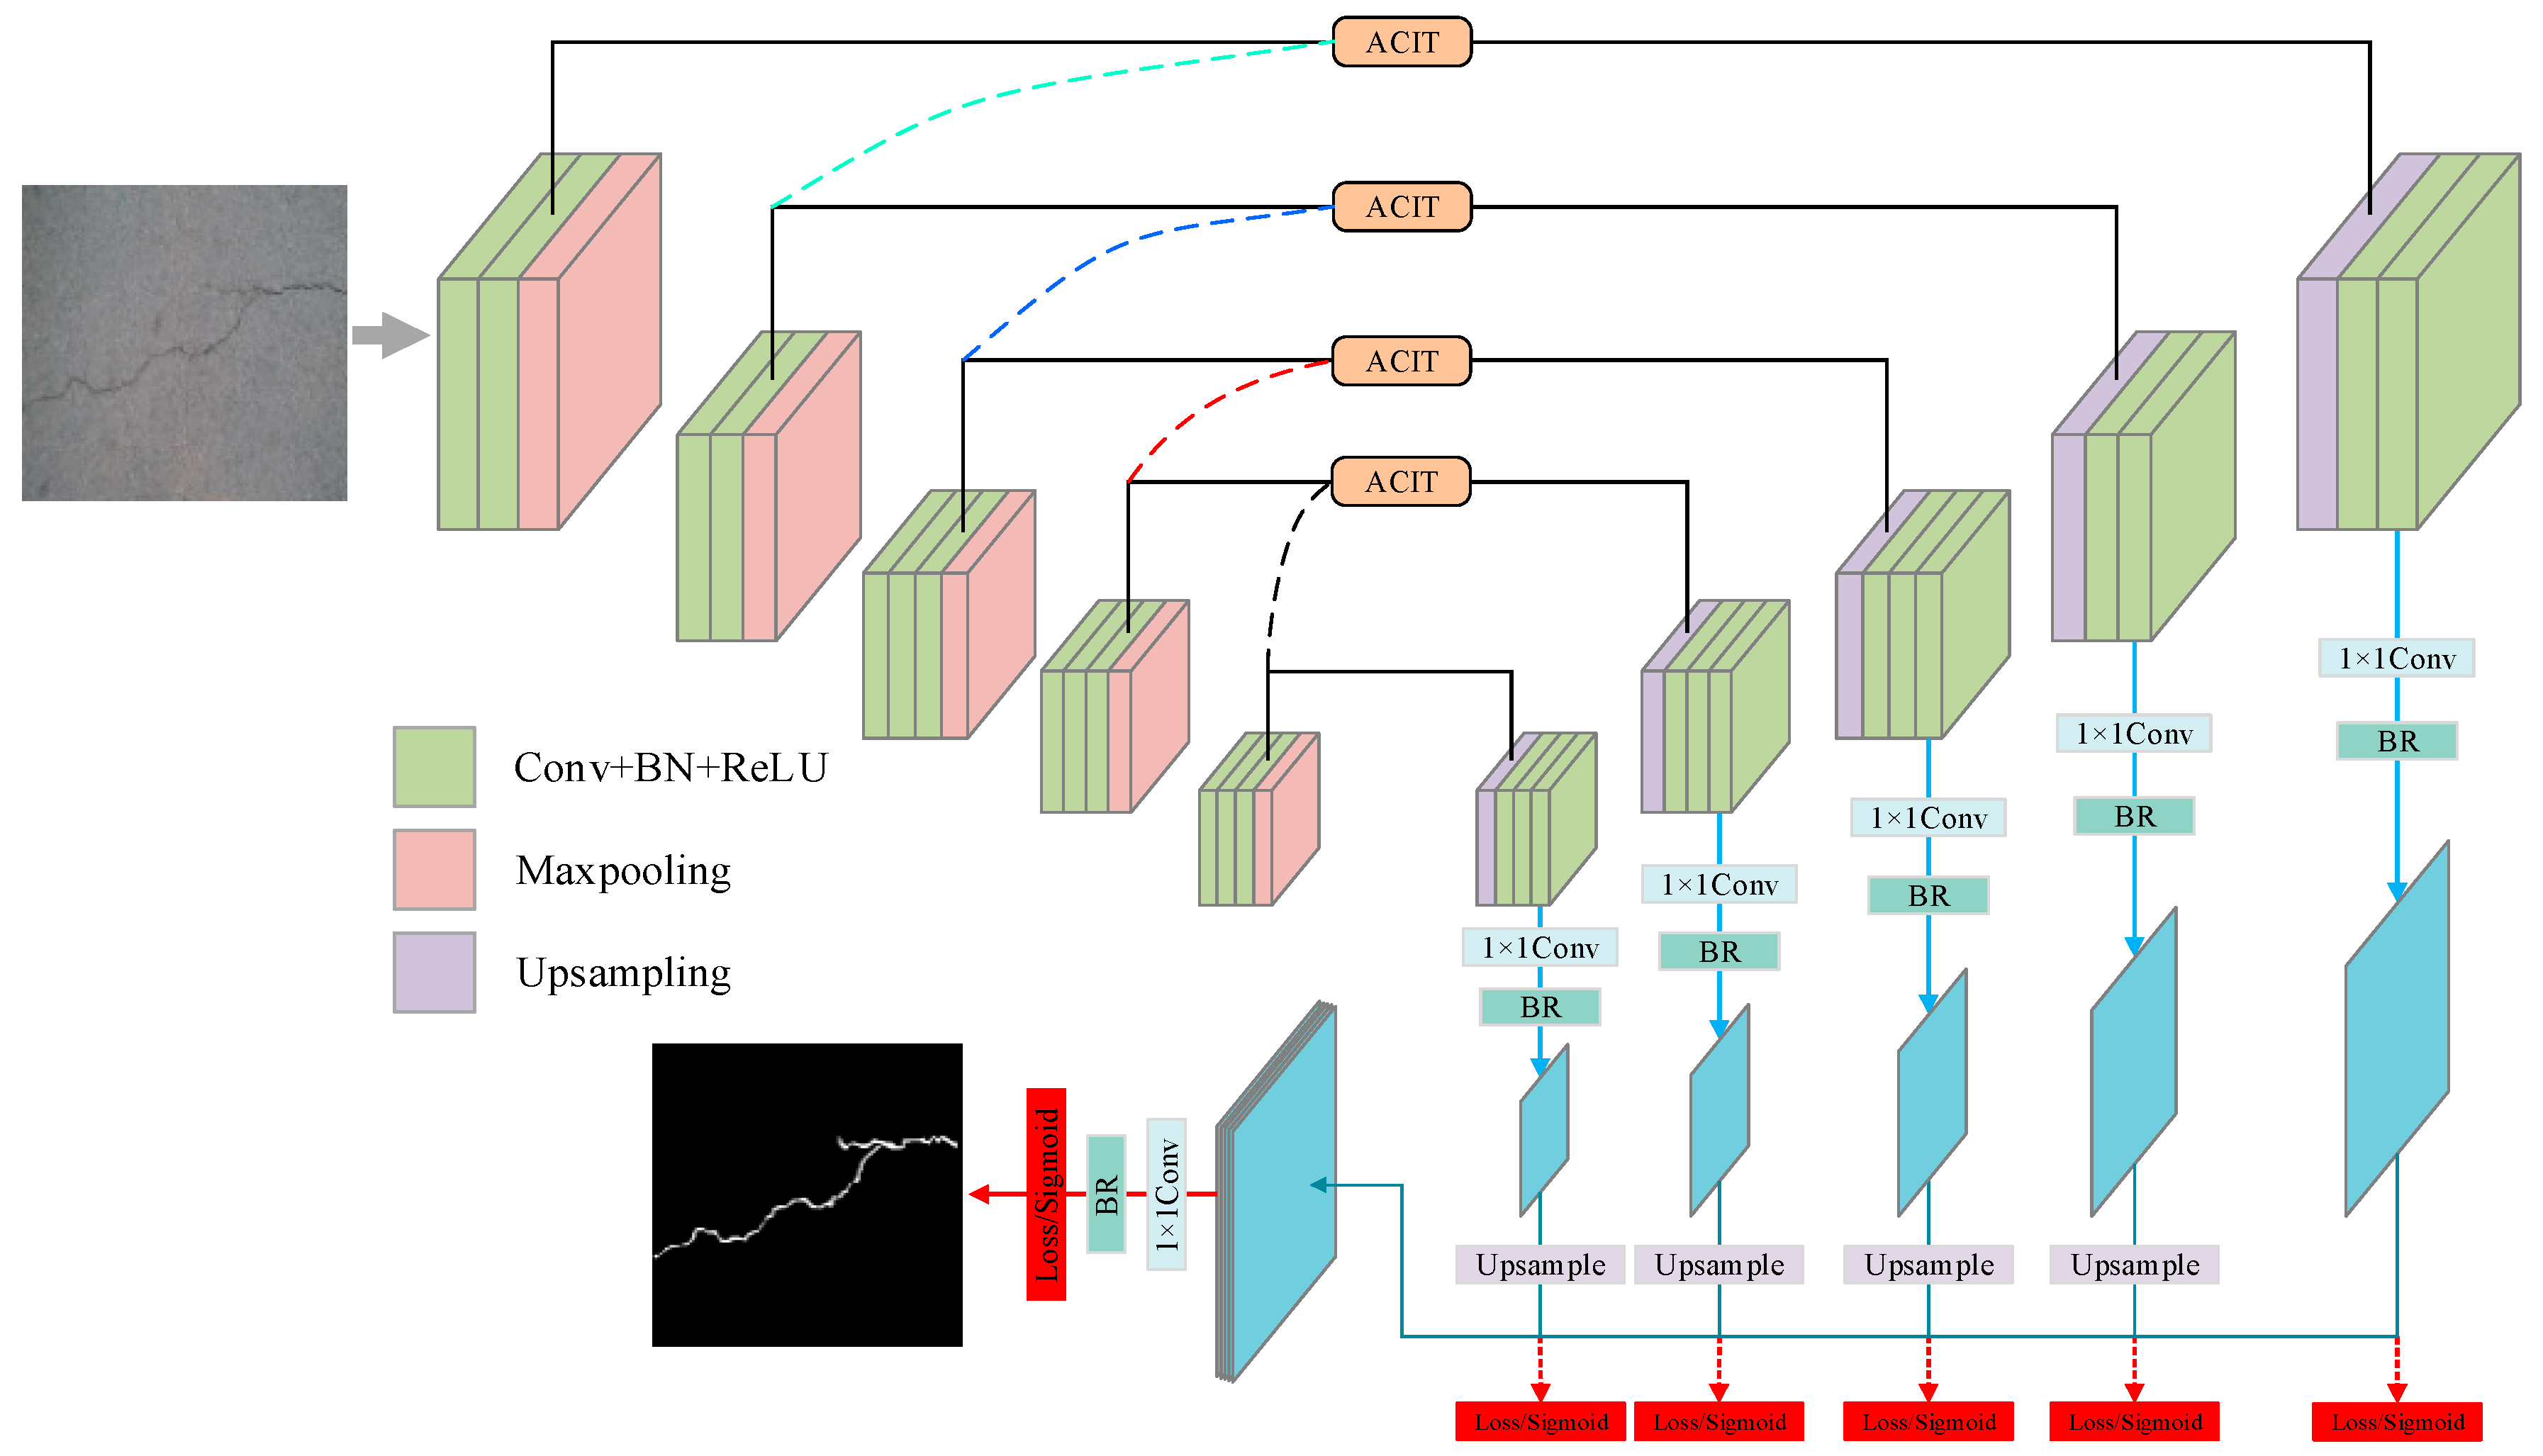
The crack detection method in our work is considered as a pixel-wise binary segmentation task. After inputting crack images into the network, crack prediction probability maps can be obtained, in which crack pixels possess higher values while non-crack pixels possess lower values. Figure 3 shows the architecture of CTCD-Net. It has three key portions: (1) a SegNet structure with five side outputs for extracting hierarchical features of the original images; (2) attention-based cross-layer information transmission (ACIT) modules for achieving the transmission of complementary information from higher layers and lower layers; and (3) boundary refinement (BR) blocks based on a residual structure for solving the problem of coarse and thicker crack boundaries.
CTCD-Net has the same number of layers as SegNet, with five layers. Starting from the input layer and proceeding downward, the layers of CTCD-Net are numbered 1–5 in sequence. During training, the crack images and labels are first fed into CTCD-Net, then the hierarchical features are extracted through the encoder architecture of SegNet. At each convolution layer (except layer 1), the feature information from the current layer is transmitted to the next layer through the ACIT module. Specifically, the feature information of encoder layer 5 is transmitted to encoder layer 4, and the synthesis information of the two layers is then fused with the feature map of decoder layer 4 through concatenation. Information transmission between other layers can be accomplished in a similar manner. At the fifth layer (the highest layer), the features from the encoder and decoder are concatenated directly.
At each decoder layer, a coarse side output is obtained with a 1 × 1 convolution operation, then the coarse side output is fed into a BR block to obtain the refined map. Subsequently, all of the refined maps are concatenated to generate the final result. Finally, loss functions both for all side outputs and for the final result are calculated to train the model.

3.2. Attention-Based Cross-Layer Information Transmission Module

As discussed in Section 1, to improve the extraction ability of tiny cracks while suppressing noises, the key is how to sufficiently leverage the rich information from all layers (location information from high layers and detail information of tiny cracks from low layers). For this purpose, we propose a cross-layer information transmission (CIT) module, which transmits the feature information from higher layers to the next one layer by layer.
Further, it should be considered that if each channel is given the same weight, the features of tiny cracks are apt to be ignored or not significantly represented. Thus, we embed the SE attention mechanism [44] into the CIT module. An attention mechanism can emphasize the importance of the features of tiny cracks, thus compensating for the disadvantage of unobvious features of tiny cracks.
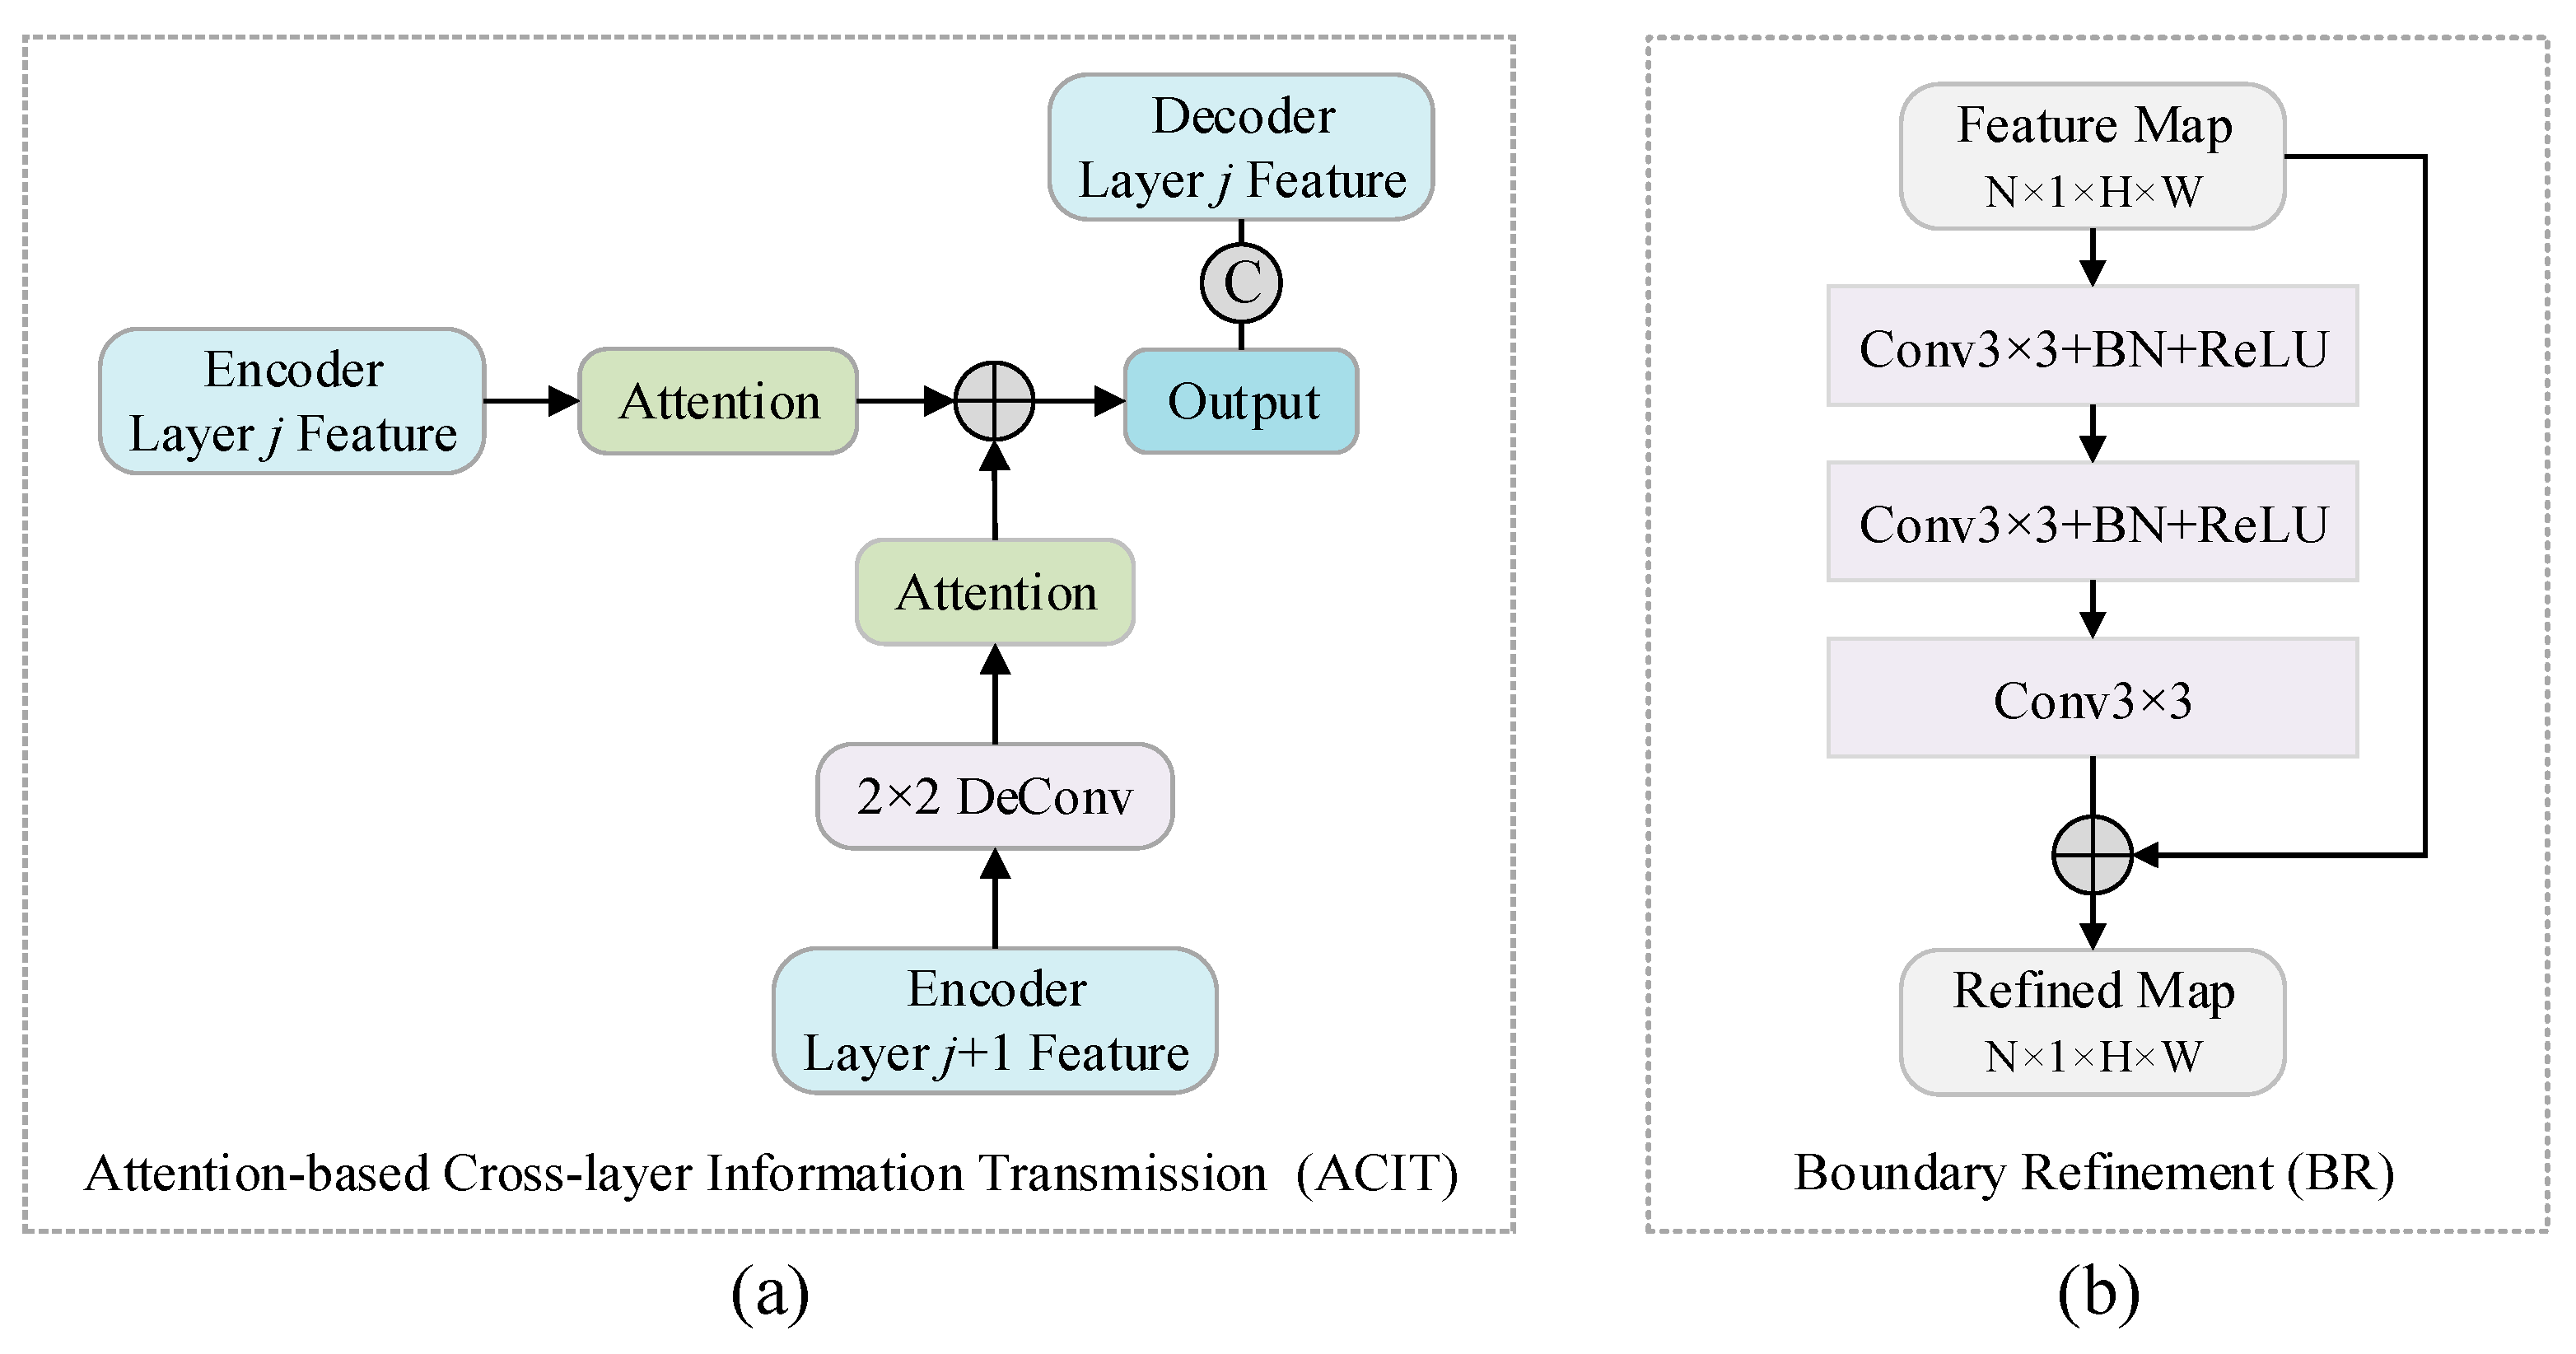
The proposed ACIT module is shown in Figure 4a. At each convolution layer using the ACIT module, an attention operation is performed directly on the feature of layer j from the encoder, while the feature map of layer j + 1 first needs to be up-sampled to twice its original size through a 2 × 2 deconvolution to be the same size as the feature map of layer j. This is because the fusion operation requires that the two input feature maps have the same size. After the attention operations, the two results are then added in an element-wise way, obtaining a synthesis feature map. Subsequently, the synthesis map is concatenated with the feature of layer j from the decoder. The result is used for further operations afterwards.
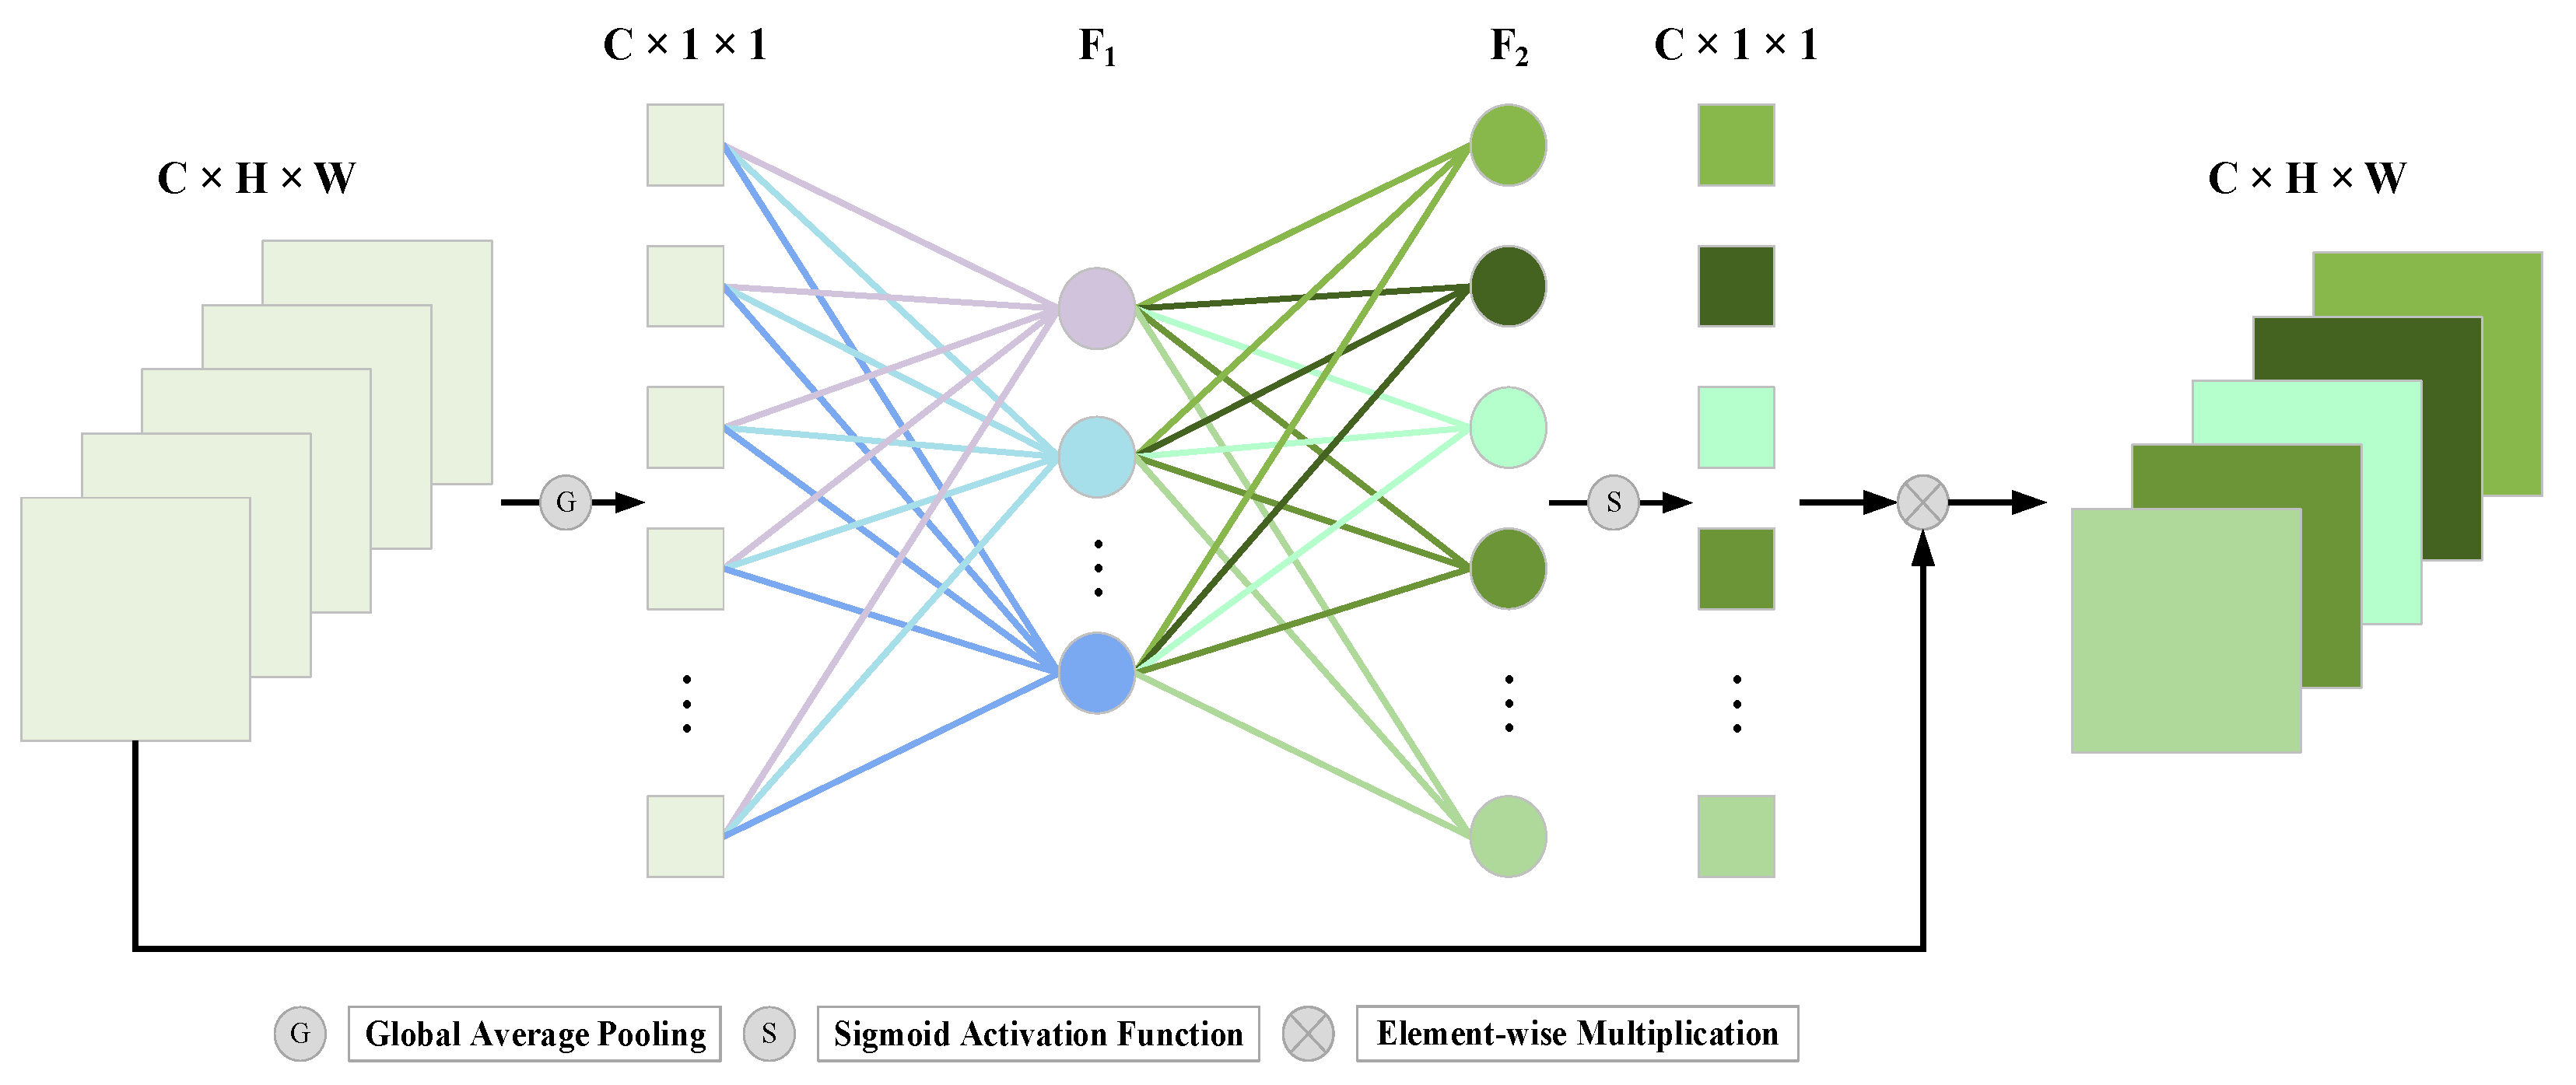
Figure 5 shows the implementation of the SE attention mechanism. For the input feature with a shape of C × H × W, global average pooling is firstly employed to obtain global information for each channel, squeezing the shape to C × 1 × 1. Two fully connected (FC) layers are then adopted to learn the nonlinear relationships between each channel. A ReLU layer is placed between the two FC operations. Finally, the result activated by the sigmoid function is multiplied with the input feature to generate the new result. The whole implementation process can also be expressed by the following:
A t t e n t i o n x : x = S i g m o i d F 2 R F 1 G x x
where x is the input feature; G represents global average pooling;  F 1  is an FC layer with a reduction ratio r (r = 16 in this paper) and  F 2  is another FC layer; and R denotes the ReLU activation function. Then, the ACIT module can be expressed by the following:
A C I T : c a t A t t e n t i o n e j + A t t e n t i o n U e j + 1 , d j
where  e j  and  d j  are the j-th layer features from the encoder and decoder, respectively, and U represents a 2 × 2 deconvolution operation.
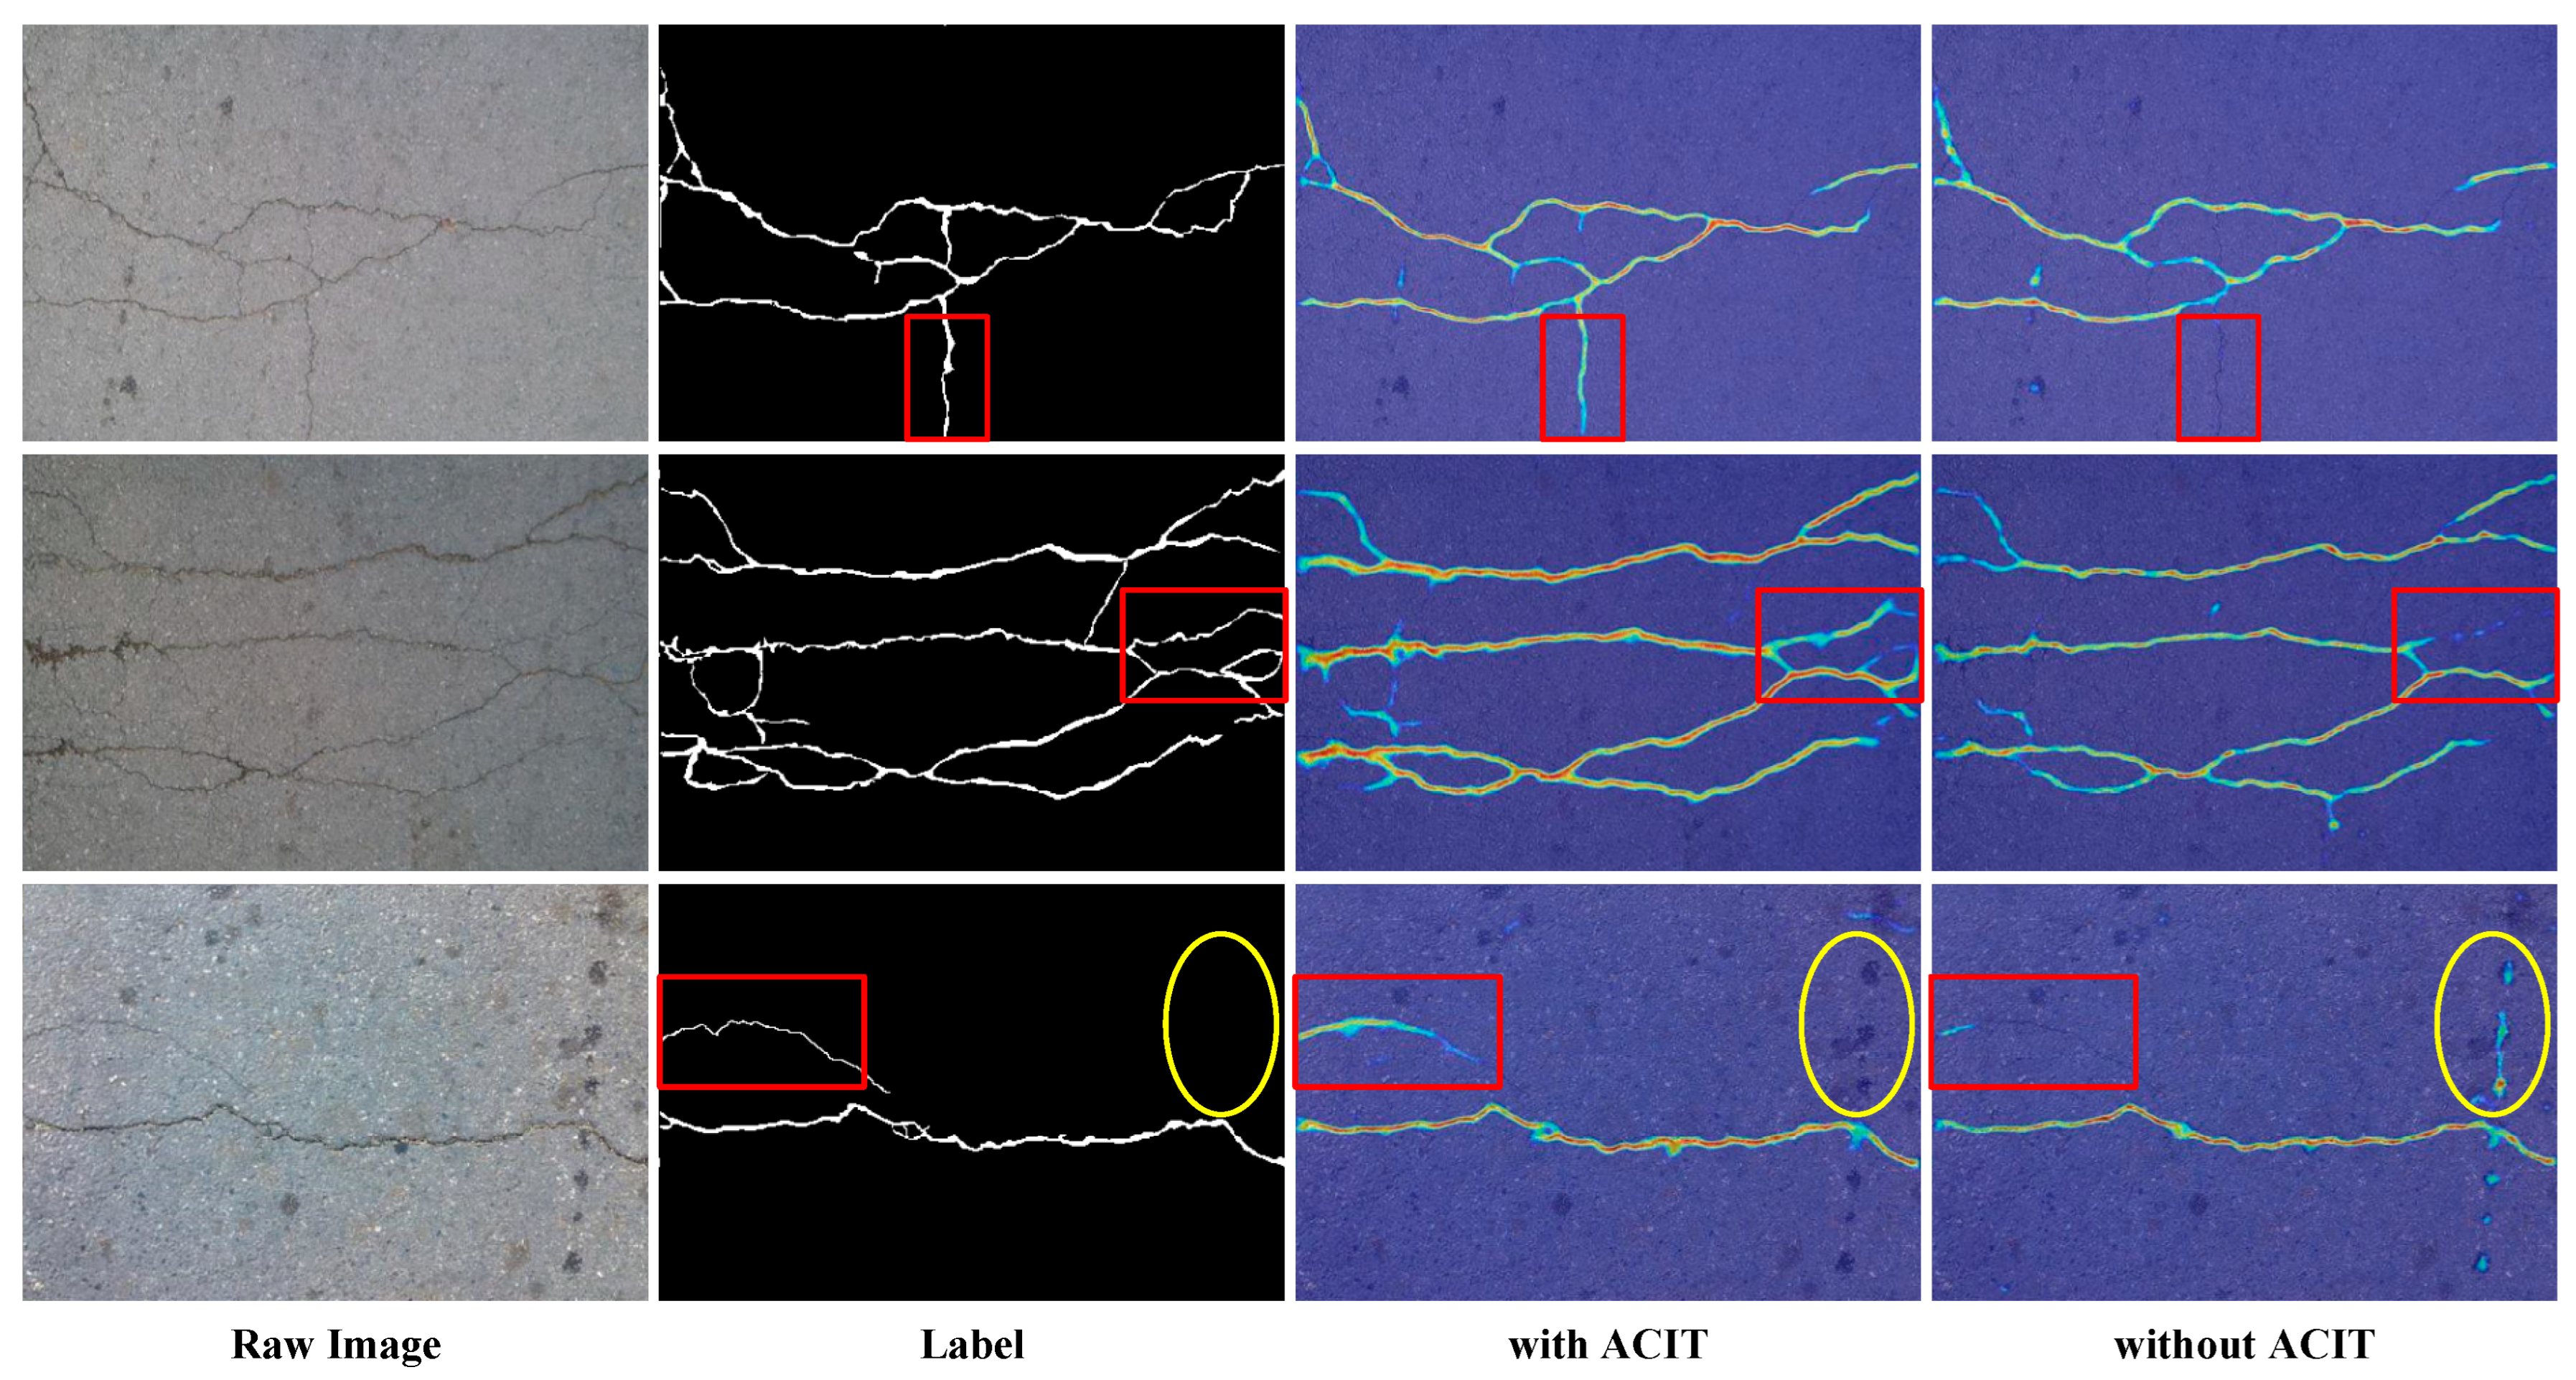
We visualize the feature maps during training as heat maps, which can intuitively show where the model is more focused. It can be observed from Figure 6 that, with the use of the ACIT module, the model pays more attention to tiny crack regions during training and simultaneously reduces the interference of noises to some extent, which demonstrates the effectiveness of ACIT.

3.3. Boundary Refinement Block

Refinement blocks are usually designed as residual structures, which learn the residuals between labels and coarse maps to refine boundaries. Inspired by [52], we design a crack boundary refinement block (as shown in Figure 4b) to tackle the problem of rough and thicker crack boundaries. For a coarse feature map, the residual is obtained by first performing two convolution blocks successively and then continuing with a 3 × 3 convolution layer. The convolution block comprises a 3 × 3 convolution, batch normalization (BN), and a ReLU function. The refined result can then be obtained by adding the coarse map and the residual.
The BR blocks are used before all side outputs and before the final result. Figure 7 visually demonstrates the effectiveness of the BR blocks with feature heat maps.

3.4. Comparison with Other Architectures

With SegNet [24] as the backbone, the proposed CTCD-Net introduces four ACIT modules and six BR blocks. Both CTCD-Net and DeepCrack18 [31] contain side output structures; however, different from DeepCrack18, instead of simply exporting side outputs, CTCD-Net embeds the proposed BR block before each layer’s side output. The concatenation of all the refined side outputs is also fed into a BR block to generate the final prediction. This effectively addresses the problem of a coarse boundary.
CTCD-Net is also quite different from FFEDN [42]. FFEDN designs a shape semantic prior module, which introduces shape prior maps into the decoder stage and performs element-wise multiplication with decoder features. For the feature fusion, FFEDN only fuses the features of the encoder and decoder at the same layer. Different from FFEDN, CTCD-Net introduces the ACIT module, which firstly transmits the information from the upper layer to the lower layer one by one at the encoder stage, and then fuses the joint information of the encoder with the features of the decoder. This transmission strategy helps to capture more useful and detailed features, so as to improve the expression ability of tiny cracks and attach more importance to them. Moreover, compared with FFEDN, CTCD-Net performs boundary refinement for cracks, which is absent in FFEDN.

3.5. Loss Function

For measuring the differences between the predicted result map P and the annotated label Y, the binary cross-entropy (BCE) is an effective loss function frequently used in semantic segmentation. The expression is as follows (N is number of pixels):
L B C E P , Y = 1 N i = 1 N Y i log P i + 1 Y i log 1 P i
To eliminate the influence of the unbalanced ratio of crack pixels and non-crack pixels, we introduce two class-balance factors,  w c  and  w n , and new loss function  L P , Y  is defined as follows:
L P , Y = 1 N i = 1 N w c Y i log P i + w n 1 Y i log 1 P i
where  w c  and  w n  are the weights for cracks and non-cracks, respectively.
Obviously, the class with a larger proportion should have a smaller weight, while the class with a smaller proportion should have a larger weight, so as to achieve the purpose of balance. In many works in the literature [36,42], the class-balancing weight β is used to represent the weight of cracks and 1 − β is the weight of non-cracks.
w c = β = N n N n + N c , w n = 1 β = N c N n + N c
where  N n  is the number of non-crack pixels and  N c  is the number of crack pixels.
Similar to [29], to simplify the calculation, we set the balance weight for non-cracks as 1, then the corresponding weight for cracks can be expressed as follows:
w n = 1 , w c = β 1 β = N n N c
Finally, in this paper, we set  w n = 1  and  w c = α N n / N c , where  α 0 , 1  is a balance factor in case the prediction results contain too many false positives.
Let L be the total number of side outputs, then the side output maps can be written as  F l , where  l = 1 , , L . Further, the final prediction map can be written as  F f . Finally, the loss function  L t  used in this paper is defined as follows:
L t = L F f , Y + l = 1 L L F l , Y

4. Experiments and Results

First, we introduce the implementation details of the experiments, including the experimental settings, datasets, comparison methods, and evaluation metrics. Then, we analyze the experimental results.

4.1. Experimental Settings

The proposed CTCD-Net and all comparison methods are implemented on PyTorch. For each convolution layer, the initial biases are set to zeros and the weights are initialized with the ‘kaiming uniform’. To expand the existing datasets, data augmentations are adopted, including rotation, flipping, and Gaussian blur. During training models, the stochastic gradient descent (SGD) is utilized to optimize model parameters with a batch size of 8. The initial learning rate equals 0.005 and will be divided by ten after every 50 epochs. The momentum is 0.9 and the weight decay is 0.0002. We train networks with 300 epochs in total. All experiments are performed on a computer with a single NVIDIA GeForce RTX 3090 GPU and a CPU (Intel Core i9-10900X, 3.7 GHz, GIGABYTE Technology, Taiwan, China).

4.2. Datasets

To prove the proposed model can effectively and completely extract tiny cracks while suppressing noise, we choose the following three datasets, in which the images all have a lot of background noise, and most of the cracks on these images are small and tiny, which meets the research requirements of this paper.
(1)
DeepCrack537: Liu et al. [29] built a dataset named DeepCrack537, comprising 537 images with annotated labels. All of the images and labels are 544 × 384 pixels in size. DeepCrack537 is separated randomly (300 images for training and 237 images for testing) to train and evaluate all models.
(2)
CFD: CFD [14] contains 118 images with manually annotated segmentation labels. All the images are 480 × 320 pixels in size. Most of the cracks in these images are tiny and affected by interference of noises. CFD is separated randomly (72 images for training and 46 images for testing) to train and evaluate models.
(3)
AED: AED consists of three datasets: AIGLE_RN (38 images), ESAR (15 images), and Dynamique (16 images) [53,54]. These images are unevenly illuminated and affected by interference of noises such as stains, and the cracks in these images are mostly tiny. By cropping and resizing, finally, we obtain 253 images of 256 × 256 pixels with annotated ground truth, which are separated randomly (153 images for training and 100 images for testing). AED is also used for the generalization study.

4.3. Comparison Methods

To demonstrate the effectiveness and superiority of the proposed CTCD-Net, we adopted eight existing and advanced methods to compare to our model, namely, HED, RCF, U-Net, SegNet, Deepcrack18, Deepcrack19, FPHBN, and FFEDN.
HED and RCF were originally proposed for edge detection, and because cracks and edges are similar linear objects, they are often used for crack detection. U-Net and SegNet are typical semantic segmentation networks that are often used as a backbone for many innovative models. DeepCrack18, DeepCrack19, FPHBN, and FFEDN are designed specifically for road crack detection and have all achieved considerable results. FFEDN is a recently proposed model, which is the second-best method in this paper.
During training, all methods adopted the same datasets and hyper parameters.
(1)
HED: HED [34] is an improved network based on FCN and VGG16 for edge detection, which fuses all side out features by concatenation operation.
(2)
RCF: RCF [35] is an edge detection network improved based on HED, in which addition operation is utilized for all features at each stage before generating side outputs.
(3)
U-Net: U-Net [25] is a frequently used baseline network, which concatenates the features at the same layer from the encoder and decoder.
(4)
SegNet: SegNet [24] is an encoder–decoder symmetric structure. It is also a popular baseline network.
(5)
Deepcrack18: Deepcrack18 [31] is a network built on SegNet. It fuses multi-scale features together by concatenation operation.
(6)
Deepcrack19: Deepcrack19 [29] employs the encoder structure of SegNet and adopts side networks at each layer. All side outputs are fused in a concatenation way to generate the final prediction. Considering that GF and CRF are only model-independent post-processing solutions, we use DeepCrack-BN as described in [29] to compare to our method.
(7)
FPHBN: FPHBN [36] promotes the performance of crack detection with the utilization of a feature pyramid and hierarchical boosting net.
(8)
FFEDN: FFEDN [42] introduces two effective modules into an encoder–decoder model for tiny crack detection.

4.4. Metrics

To quantitatively evaluate all trained models, we adopt five metrics commonly used in semantic segmentation: precision (P), recall (R), F1-score (F), IoU, and mIoU.
According to the comparison between the manually annotated label images and the predicted maps, we classify pixels into the following groups: true/false positive (TP/FP) and true/false negative (TN/FN). Here, positive denotes crack pixel and negative denotes non-crack pixel. Then, the five metrics can be expressed as follows:
P = T P T P + F P ,   R = T P T P + F N
F = 2 × P × R P + R
I o U = T P T P + F P + F N
m I o U = 1 2 ( T P T P + F P + F N + T N T N + F N + F P )
We draw the precision–recall (PR) curves by selecting a series of segmentation thresholds with equal intervals and obtain the best global threshold that maximizes the F1-score value, and then use the best threshold to calculate other metrics. Specifically, the range of the segmentation thresholds is [0, 1), and the P and R values are calculated every 0.01 interval, resulting in 100 sets of (P, R) values, which are used to plot the PR curves.

4.5. Experimental Results

Three types of experiments are performed for demonstrating the effectiveness and superiority of CTCD-Net, which are comparison experiments, generalization experiments, and ablation experiments.

4.5.1. Comparison Experiments

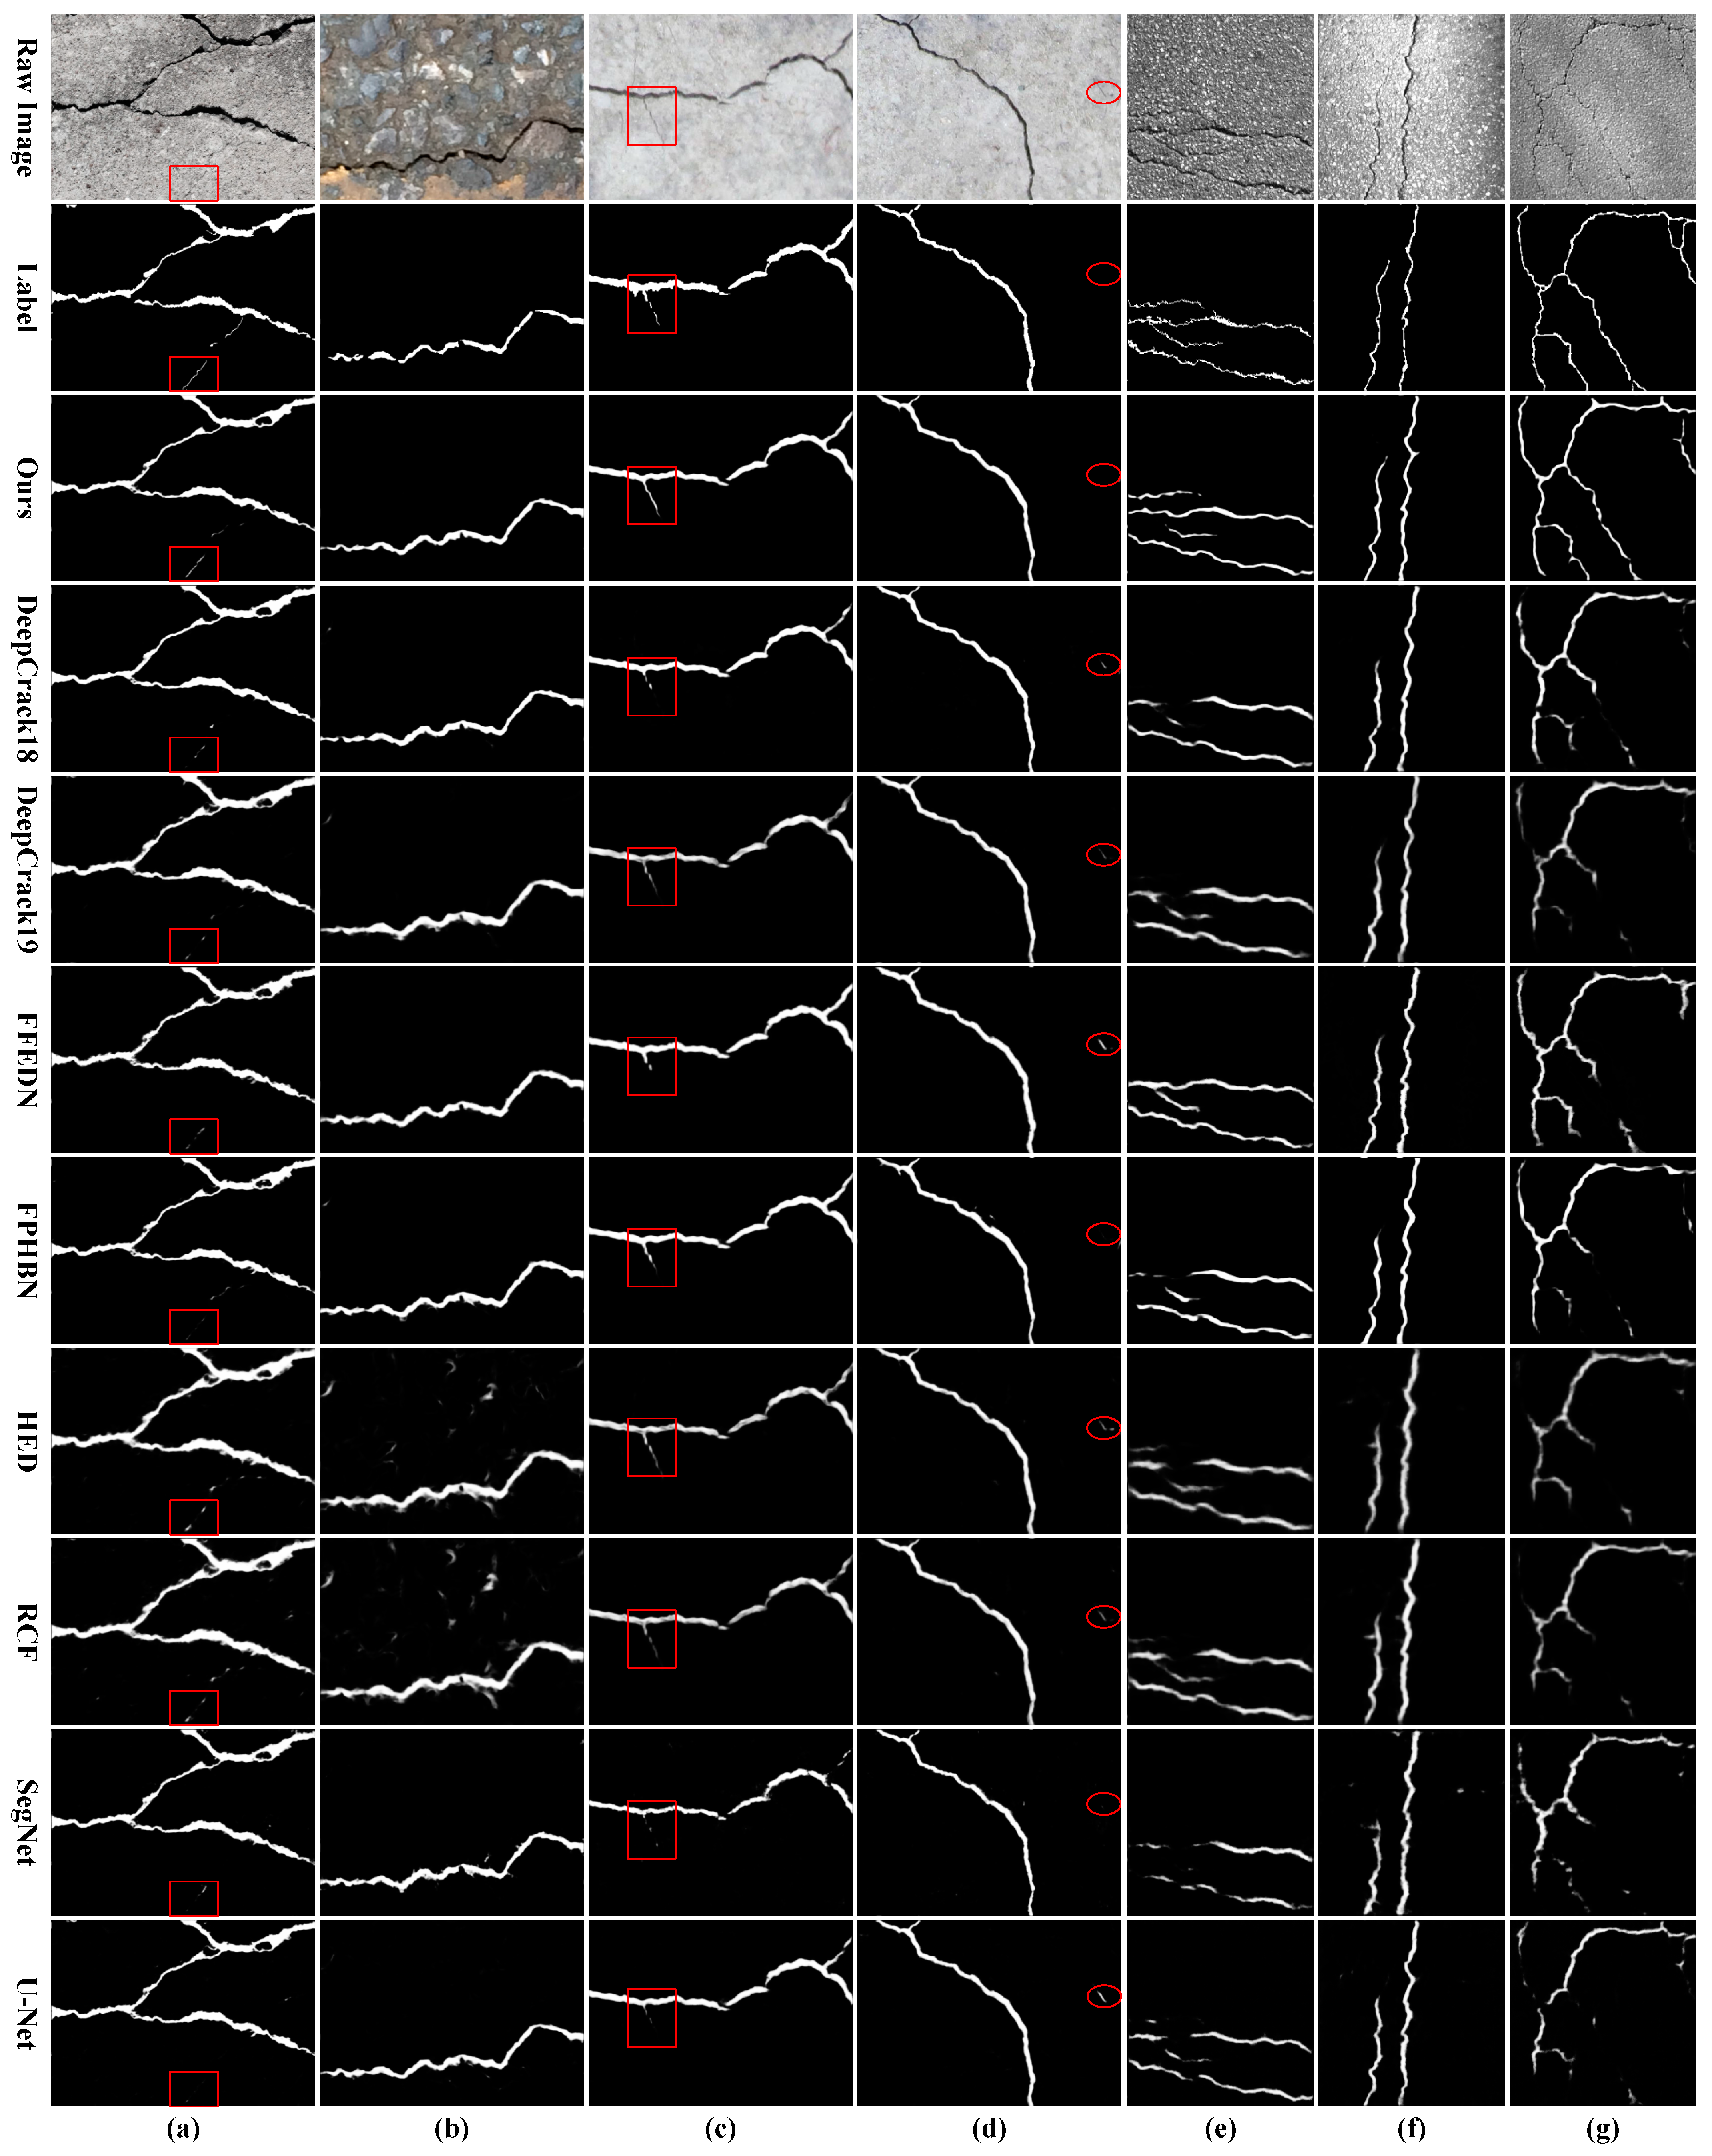
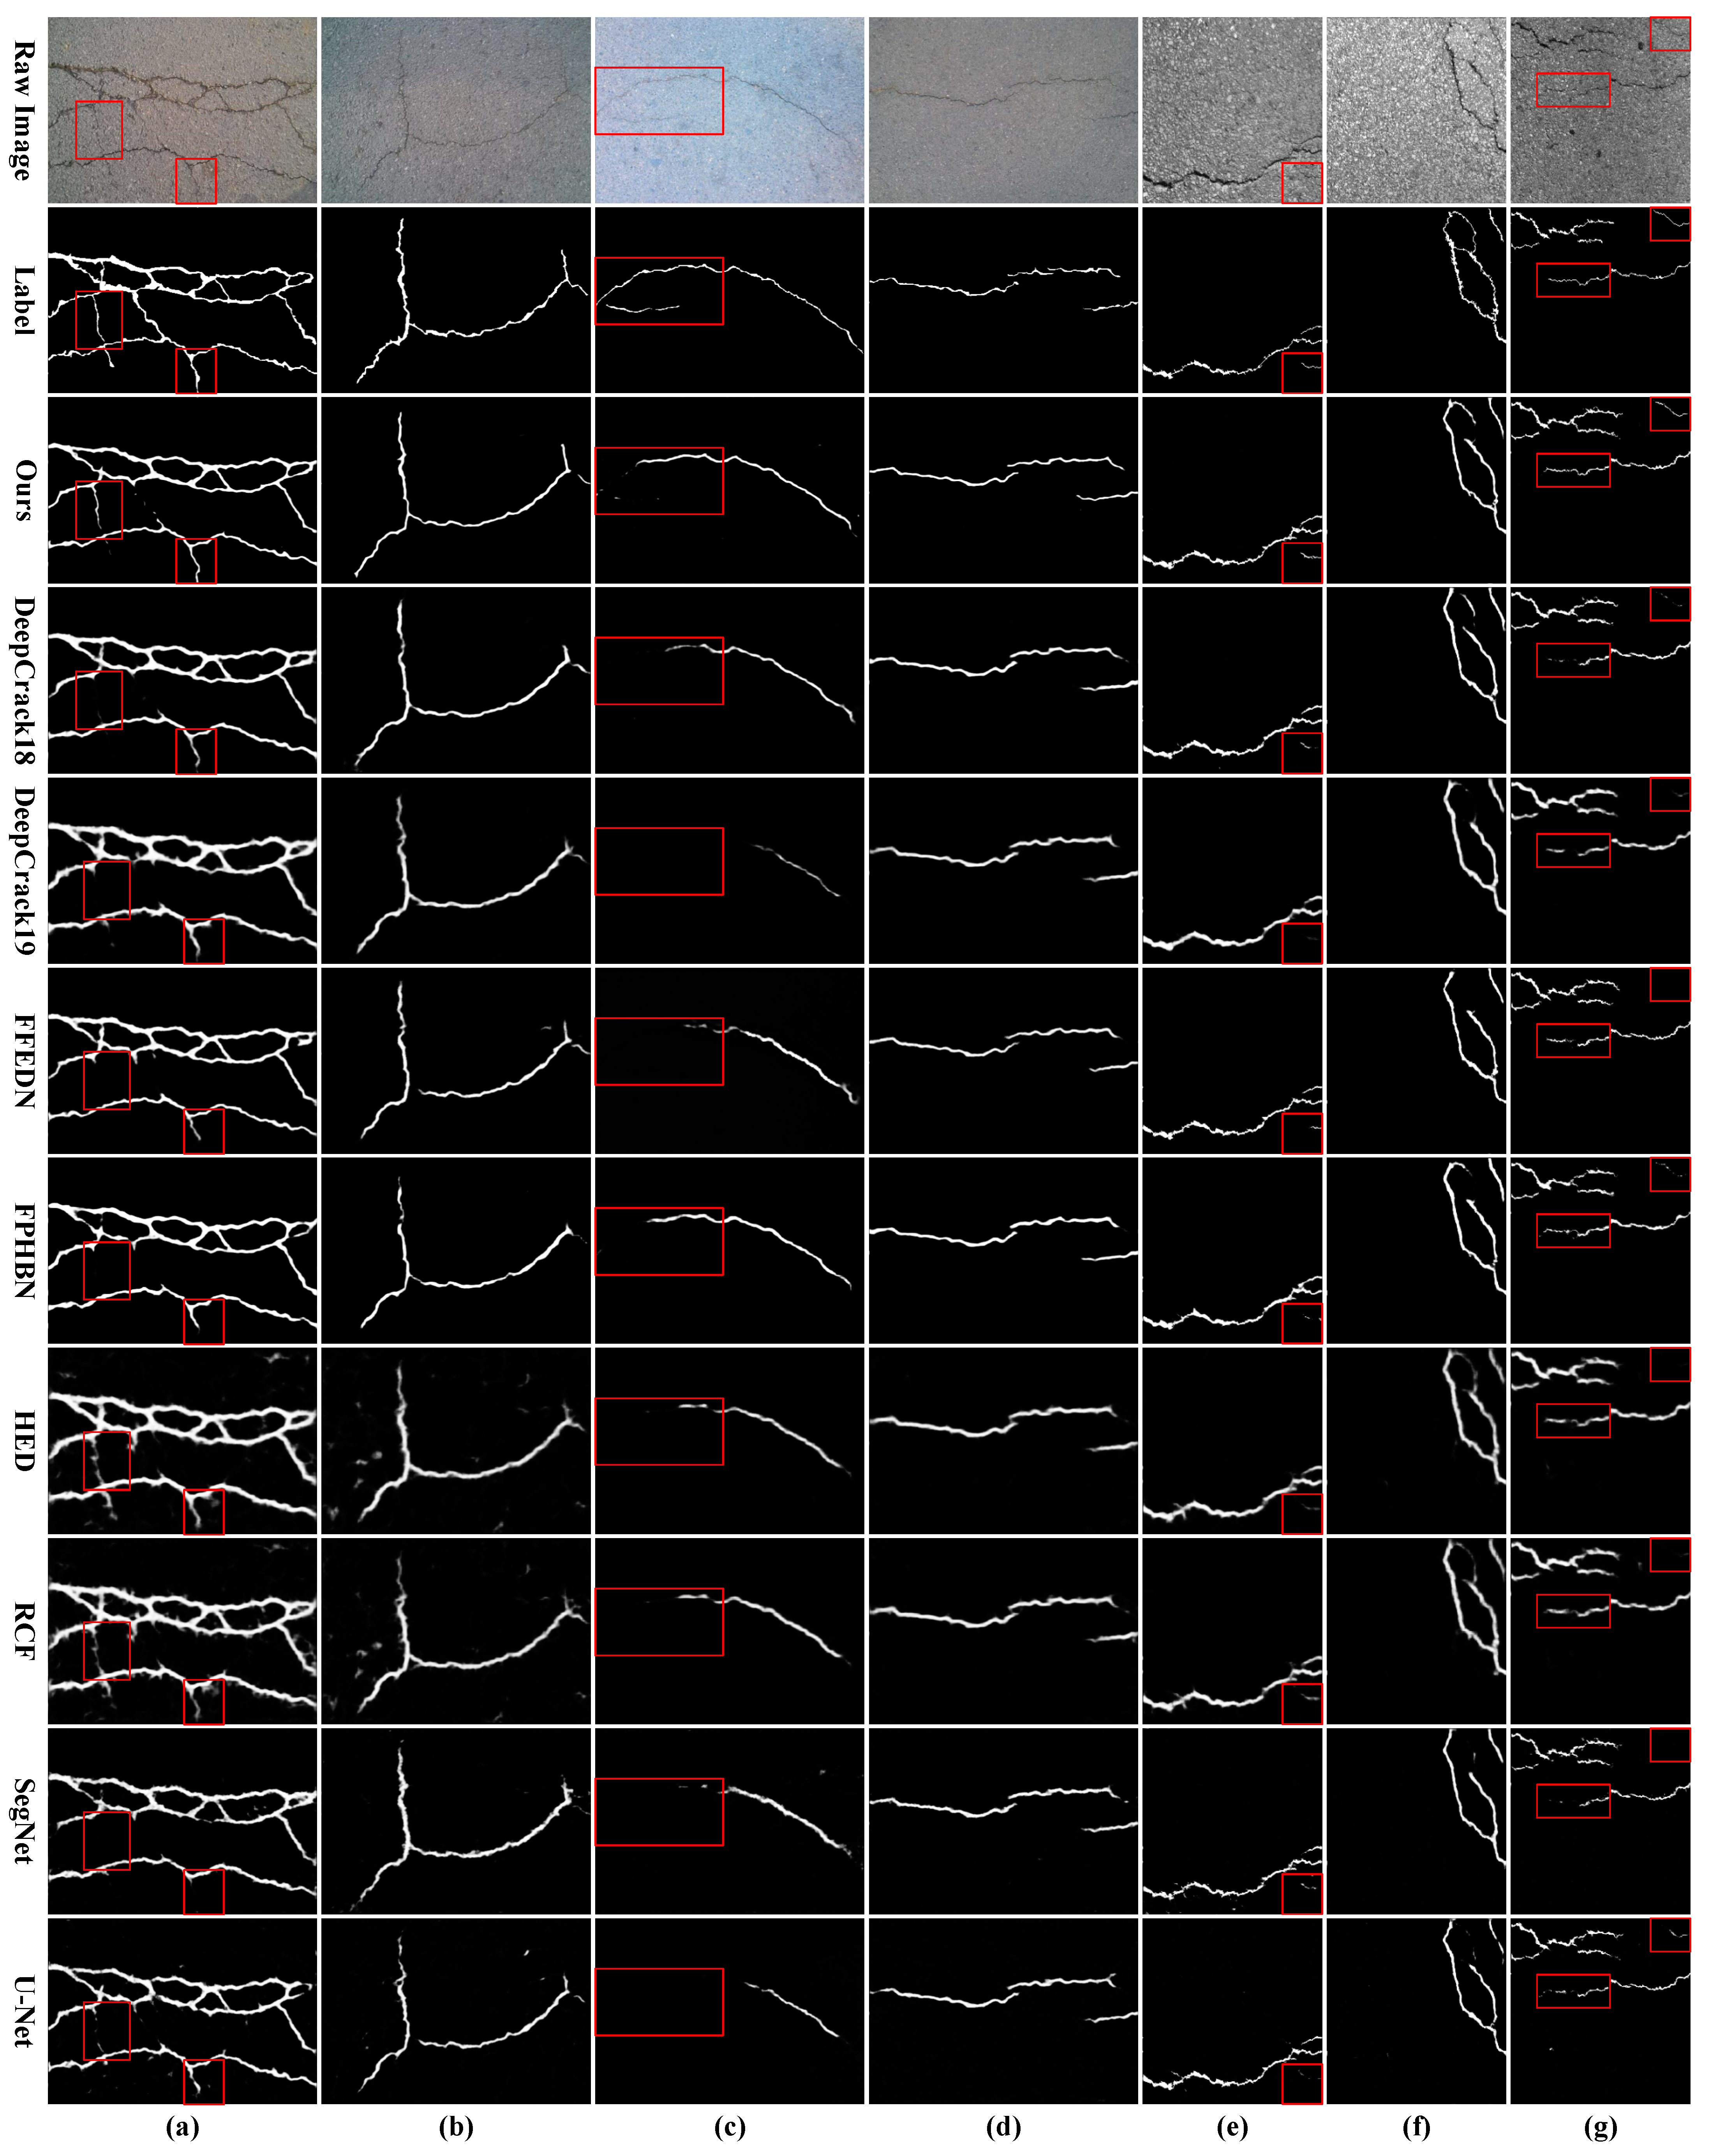
Figure 8 shows the PR curves on the three datasets. The small rectangles in the figure represent the position of the optimal F for each curve. Figure 9 and Figure 10 show the qualitative visualization of the crack detection results.
(1)
Results on DeepCrack537. From Figure 8a, we can see that the PR curve of CTCD-Net is nearest to the top-right, which means CTCD-Net achieves the highest F and the optimal detection performance. Table 1 shows the quantitative evaluation results on DeepCrack537. CTCD-Net achieves the optimal results in the five metrics, with the best P, R, F, IoU, and mIoU of 86.59%, 83.10%, 84.81%, 73.62%, and 86.14%, respectively. Moreover, there are 2.04%, 2.05%, 2.04%, and 3.02% improvements compared with SegNet on P, R, F, and IoU, respectively. The improvements confirm the effectiveness of the two presented modules. Figure 9a–d show the crack detection results selected from DeepCrack537. It is obvious that CTCD-Net has the strongest extraction ability for tiny cracks and it is the least disturbed by background noises.
(2)
Results on CFD. Similarly, from Figure 8b, we can conclude that CTCD-Net still achieves the optimal performance. We can observe from Table 2 that CTCD-Net surpasses all comparison methods in the five metrics, having the best P, R, F, IoU, and mIoU of 66.74%, 73.57%, 69.99%, 53.83%, and 76.38%, respectively. Furthermore, compared with FFEDN (the second-best method), there are performance improvements of 1.09%, 0.80%, 0.96%, and 1.13% in P, R, F, and IoU, respectively. Compared with SegNet and DeepCrack18, there are performance improvements of 5.79% and 2.57%, respectively, in the metric F. The results also confirm the effectiveness and superiority of the two presented modules. Figure 10a–d show the crack detection results selected from CFD. It is obvious that the extraction performance of CTCD-Net is the best, and the results of tiny cracks extracted by CTCD-Net are more accurate and complete than all comparison methods. In addition, it can be seen that the boundaries of the cracks extracted by CTCD-Net are clearer and more accurate, while the cracks extracted by the comparison methods, especially HED, RCF, and DeepCrack19, are much coarser and thicker than the labels.
(3)
Results on AED. Figure 8c shows the PR curves on AED. CTCD-Net still achieves the optimal performance. Table 3 shows the quantitative results. CTCD-Net achieves the optimal P, R, F, IoU, and mIoU of 65.28%, 71.42%, 68.21%, 51.76%, and 75.35%, respectively. Compared with FFEDN (the second-best method), there are performance improvements of 0.44%, 0.62%, 0.52%, and 0.60% performance in P, R, F, and IoU, respectively. Compared with SegNet and DeepCrack18, there are performance improvements of 3.61% and 2.97%, respectively, in the metric F. The images in AED are unevenly illuminated and affected by interference of noises, and the cracks in those images are mostly tiny. From Figure 10e–g, we can see that the ability to extract tiny cracks of CTCD-Net is better than that of other comparison methods by a large margin. Moreover, the cracks detected by CTCD-Net are clearer and the crack boundaries are more refined and accurate.
It can be observed that the accuracy in Table 1 (DeepCrack537) is higher than that in Table 2 (CFD) and Table 3 (AED). This is because the images in CFD and AED are unevenly illuminated and the cracks in these images are mostly tiny cracks. The proportion of crack pixels is much lower than that of non-crack pixels, so even a small number of incorrectly predicted pixels will result in a relatively large drop in accuracy. However, in DeepCrack537, in addition to tiny cracks, there are also more large cracks that are relatively easy to identify, and the proportion of crack pixels is higher than that in CFD and AED, which, relatively speaking, has a greater error-tolerant rate. Therefore, the accuracy on DeepCrack537 is slightly higher than that on CFD and AED.
In summary, the proposed CTCD-Net has a more complete and accurate ability to extract tiny cracks, and the boundaries of the extracted cracks are clearer and more refined, with more accurate boundary locations. The results indicate that, using our two presented modules, the crack detection performance can be improved remarkably, especially for tiny cracks.

4.5.2. Generalization Experiments

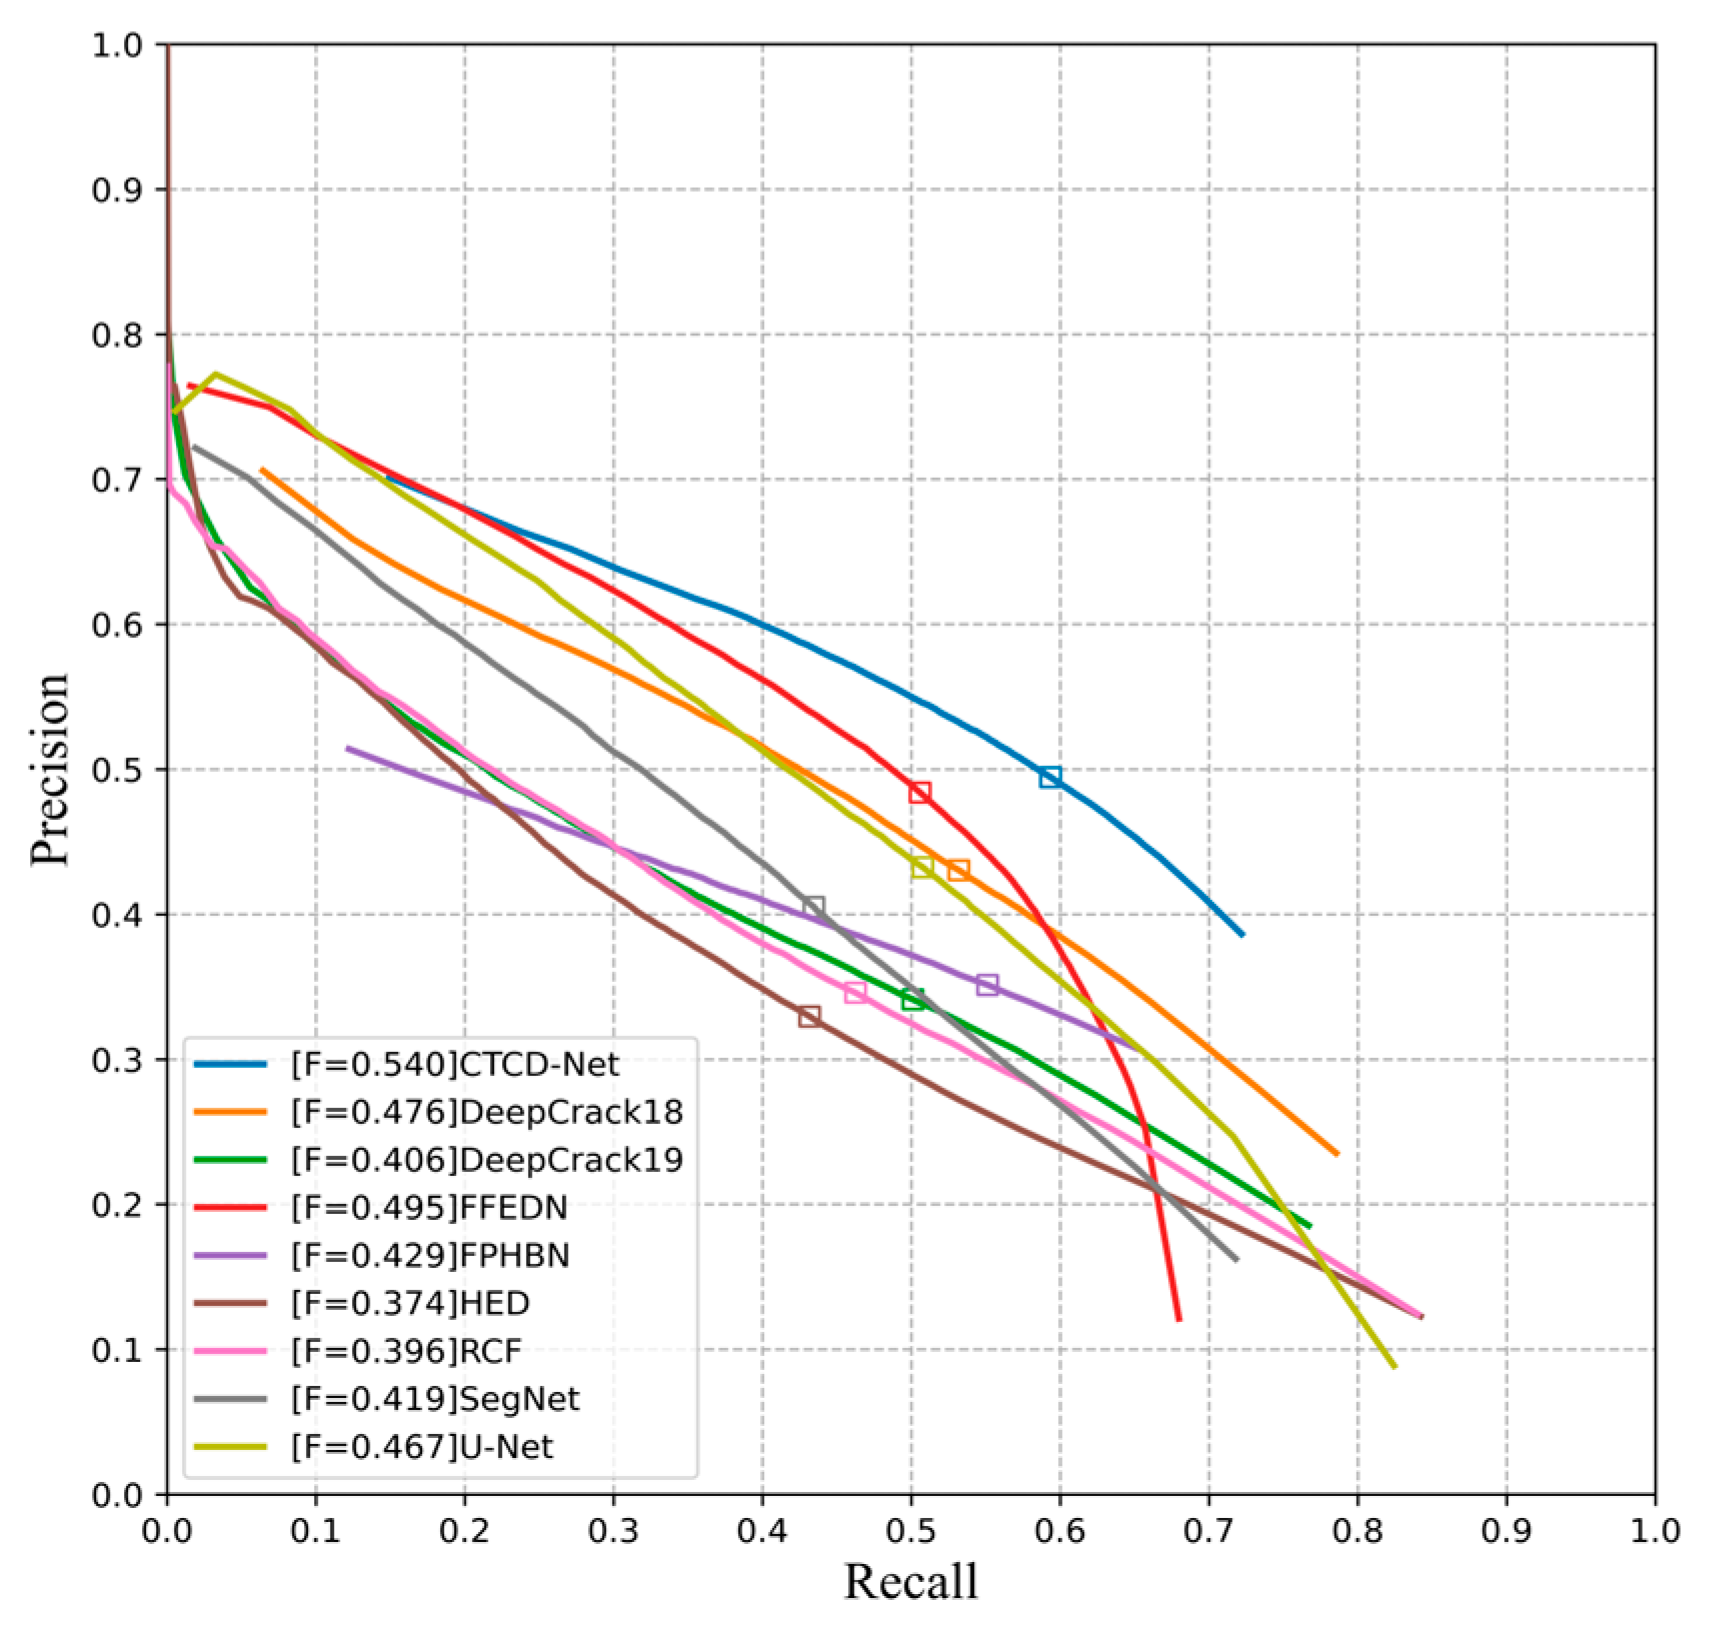
To assess the generalization capability of all models, we use models trained on CFD dataset to evaluate the AED. The PR curves are shown in Figure 11 and the quantitative evaluation is shown in Table 4. It can be seen that the accuracy in Table 4 is lower than that in Table 1, Table 2 and Table 3. This is because different datasets have different distributions and contain different features, and the test performance of the trained models on another different dataset is generally lower than that on the same dataset. However, CTCD-Net still achieves the best overall performance, gaining the best F1 of 53.96%, benefiting from the ACIT module being able to effectively capture more features. Compared with FFEDN (the second-best method), the performance of CTCD-Net on F1 improves by 4.49%. The visualization results of crack detection of the generalization experiments on AED are shown in Figure 9e–g. The accuracy and completeness of the cracks extracted by CTCD-Net are higher than other comparison models, indicating that CTCD-Net has better generalization ability.

4.5.3. Ablation Experiments

We perform five ablation experiments on the CFD dataset to demonstrate the effectiveness of the presented ACIT module and BR block: (1) SegNet; (2) SegNet + Side represents an improved model based on SegNet, which produces side outputs at each convolution stage and fuses all side outputs; (3) SegNet + BR is the same as SegNet + Side, but adds the BR blocks before all side outputs and the final result; (4) SegNet + ACIT represents the model introducing ACIT modules into SegNet + Side; and (5) the proposed CTCD-Net. Table 5 shows the quantitative evaluation results. We can conclude that both the ACIT module and the BR block are conducive to crack detection and that the best performance can be realized by using both modules simultaneously.
It can be seen from Figure 12 that tiny cracks extracted by SegNet are incomplete and the boundaries are coarse and thicker; SegNet + ACIT improves the extraction ability of tiny cracks, but still the problem of thicker boundaries remains; the boundaries of the cracks extracted by SegNet + BR are clearer, but the extracted tiny cracks are still incomplete; CTCD-Net with the two modules not only improves the extraction ability of tiny cracks, but also solves the problem of inaccurate boundaries. The analyses demonstrate the effectiveness and superiority of the two modules.

5. Discussion

As the results show in the ablation experiments, the ACIT module introduced in this paper performs excellently in the task of extracting tiny cracks and the BR block enables the extraction of cracks closer to the ground truth without having coarse and thicker boundaries. Therefore, we introduce these two modules into the backbone network at the same time to build CTCD-Net in this paper. The comparison experiments indicated that CTCD-Net achieves the best overall performance, which we believe is important for road problem detection, as it helps to provide an early warning of tiny cracks and prevent their further deterioration.
It can be seen from Table 4 that CTCD-Net outperforms other comparison models in terms of generalization ability. In Section 4.5.2, we discussed the reason the generalization accuracy in Table 4 is generally lower than the test accuracy in Table 1, Table 2 and Table 3. It depends on the distribution of different datasets. To improve the generalization ability of the model, we can consider using larger training datasets. Moreover, we can consider deepening networks, but at the same time, we should consider the problem of overfitting with the deepening of networks. How to balance the depth of networks and overfitting is also an open study.

6. Conclusions

The aim of this paper is to improve the accuracy and completeness of tiny road crack detection and address the problem of coarse crack boundaries. Therefore, we proposed a novel and effective method named CTCD-Net. Firstly, for the purpose of enhancing the feature representation of tiny cracks while suppressing noises, we proposed the ACIT module, which transmits the information from higher layers to lower layers, layer by layer, enabling our model to pay more attention to tiny cracks. Secondly, to solve the problem of rough and inaccurate crack boundaries, we proposed the BR block, which can effectively refine crack boundaries based on a simple residual structure.
To prove the effectiveness of the two proposed modules, we conducted five ablation experiments. We separately introduced one of the two modules into the backbone network and outputted the feature heat maps to visualize the training process, and the visualization and accuracy results were satisfactory and in line with expectations. In comparison experiments, the proposed CTCD-Net achieved the best values on all five metrics, demonstrating its effectiveness and superiority in crack detection. It is clear from the crack visualization results that CTCD-Net improved the accuracy and completeness of tiny crack extraction to a great extent, and the crack boundaries are clearer and closer to the ground truth. The results of the generalization experiments also showed that the generalization ability of CTCD-Net is superior to that of all comparison models.
In future studies, we will consider applying the proposed model to different scenarios, such as dams and bridges, and consider how to further improve the generalization ability of the model on different datasets.

Author Contributions

Conceptualization, C.Z. and Y.C.; methodology, C.Z.; software, C.Z.; investigation, C.Z. and X.C.; resources, L.T., X.C. and C.L.; writing—original draft preparation, C.Z. and Y.C.; writing—review and editing, C.Z., Y.C., L.T., X.C. and C.L.; supervision, L.T. and C.L.; project administration, Y.C. and L.T.; funding acquisition, L.T. All authors have read and agreed to the published version of the manuscript.

Funding

This work was supported by the National Natural Science Foundation of China (Grant Nos. 41971405, 41671442, 42271449).

Institutional Review Board Statement

Not applicable.

Informed Consent Statement

Not applicable.

Data Availability Statement

The authors do not have permission to share data.

Acknowledgments

Thanks to Xue Yang for providing funding support for this article. The funding is the National Natural Science Foundation of China (Grant No. 42271449).

Conflicts of Interest

The authors declare no conflict of interest.

References

  1. Ma, L.; Li, J. SD-GCN: Saliency-based dilated graph convolution network for pavement crack extraction from 3D point clouds. Int. J. Appl. Earth Obs. Geoinf. 2022, 111, 102836. [Google Scholar] [CrossRef]
  2. Mohan, A.; Poobal, S. Crack detection using image processing: A critical review and analysis. Alex. Eng. J. 2018, 57, 787–798. [Google Scholar] [CrossRef]
  3. Gupta, P.; Dixit, M. Image-based crack detection approaches: A comprehensive survey. Multimed. Tools Appl. 2022, 81, 40181–40229. [Google Scholar] [CrossRef]
  4. Li, Q.; Zou, Q.; Zhang, D.; Mao, Q. FoSA: F* seed-growing approach for crack-line detection from pavement images. Image Vis. Comput. 2011, 29, 861–872. [Google Scholar] [CrossRef]
  5. Dorafshan, S.; Thomas, R.J.; Maguire, M. Comparison of deep convolutional neural networks and edge detectors for image-based crack detection in concrete. Constr. Build. Mater. 2018, 186, 1031–1045. [Google Scholar] [CrossRef]
  6. Zhao, H.; Qin, G.; Wang, X. Improvement of canny algorithm based on pavement edge detection. In Proceedings of the 2010 3rd International Congress on Image and Signal Processing, Yantai, China, 16–18 October 2010; pp. 964–967. [Google Scholar]
  7. Kamaliardakani, M.; Sun, L.; Ardakani, M.K. Sealed-crack detection algorithm using heuristic thresholding approach. J. Comput. Civ. Eng. 2016, 30, 04014110. [Google Scholar] [CrossRef]
  8. Liu, F.; Xu, G.; Yang, Y.; Niu, X.; Pan, Y. Novel approach to pavement cracking automatic detection based on segment extending. In Proceedings of the 2008 International Symposium on Knowledge Acquisition and Modeling, Wuhan, China, 21–22 December 2008; pp. 610–614. [Google Scholar]
  9. Wang, J.; Liu, F.; Yang, W.; Xu, G.; Tao, Z. Pavement crack detection using attention u-net with multiple sources. In Proceedings of the Chinese Conference on Pattern Recognition and Computer Vision (PRCV), Nanjing, China, 16–18 October 2020; pp. 664–672. [Google Scholar]
  10. Zhou, J.; Huang, P.S.; Chiang, F.-P. Wavelet-based pavement distress detection and evaluation. Opt. Eng. 2006, 45, 027007. [Google Scholar] [CrossRef]
  11. Hu, Y.; Zhao, C.-X. A novel LBP based methods for pavement crack detection. J. Pattern Recognit. Res. 2010, 5, 140–147. [Google Scholar] [CrossRef]
  12. Kapela, R.; Śniatała, P.; Turkot, A.; Rybarczyk, A.; Pożarycki, A.; Rydzewski, P.; Wyczałek, M.; Błoch, A. Asphalt surfaced pavement cracks detection based on histograms of oriented gradients. In Proceedings of the 2015 22nd International Conference Mixed Design of Integrated Circuits & Systems (MIXDES), Torun, Poland, 25–27 June 2015; pp. 579–584. [Google Scholar]
  13. Li, G.; Zhao, X.; Du, K.; Ru, F.; Zhang, Y. Recognition and evaluation of bridge cracks with modified active contour model and greedy search-based support vector machine. Autom. Constr. 2017, 78, 51–61. [Google Scholar] [CrossRef]
  14. Shi, Y.; Cui, L.; Qi, Z.; Meng, F.; Chen, Z. Automatic road crack detection using random structured forests. IEEE Trans. Intell. Transp. Syst. 2016, 17, 3434–3445. [Google Scholar] [CrossRef]
  15. Chen, Y.; Weng, Q.; Tang, L.; Wang, L.; Xing, H.; Liu, Q. Developing an intelligent cloud attention network to support global urban green spaces mapping. ISPRS J. Photogramm. Remote Sens. 2023, 198, 197–209. [Google Scholar] [CrossRef]
  16. Chen, Z.; Wang, C.; Li, J.; Fan, W.; Du, J.; Zhong, B. Adaboost-like End-to-End multiple lightweight U-nets for road extraction from optical remote sensing images. Int. J. Appl. Earth Obs. Geoinf. 2021, 100, 102341. [Google Scholar] [CrossRef]
  17. Dung, C.V.; Sekiya, H.; Hirano, S.; Okatani, T.; Miki, C. A vision-based method for crack detection in gusset plate welded joints of steel bridges using deep convolutional neural networks. Autom. Constr. 2019, 102, 217–229. [Google Scholar] [CrossRef]
  18. Eisenbach, M.; Stricker, R.; Seichter, D.; Amende, K.; Debes, K.; Sesselmann, M.; Ebersbach, D.; Stoeckert, U.; Gross, H.-M. How to get pavement distress detection ready for deep learning? A systematic approach. In Proceedings of the 2017 International Joint Conference on Neural Networks (IJCNN), Anchorage, AK, USA, 14–19 May 2017; pp. 2039–2047. [Google Scholar]
  19. Zhang, L.; Yang, F.; Zhang, Y.D.; Zhu, Y.J. Road crack detection using deep convolutional neural network. In Proceedings of the 2016 IEEE International Conference on Image Processing (ICIP), Phoenix, AZ, USA, 25–28 September 2016; pp. 3708–3712. [Google Scholar]
  20. Deng, J.; Lu, Y.; Lee, V.C.S. Concrete crack detection with handwriting script interferences using faster region-based convolutional neural network. Comput. Aided Civ. Infrastruct. Eng. 2020, 35, 373–388. [Google Scholar] [CrossRef]
  21. Du, Y.; Pan, N.; Xu, Z.; Deng, F.; Shen, Y.; Kang, H. Pavement distress detection and classification based on YOLO network. Int. J. Pavement Eng. 2021, 22, 1659–1672. [Google Scholar] [CrossRef]
  22. Zhang, H.; Song, Y.; Chen, Y.; Zhong, H.; Liu, L.; Wang, Y.; Akilan, T.; Wu, Q.J. MRSDI-CNN: Multi-model rail surface defect inspection system based on convolutional neural networks. IEEE Trans. Intell. Transp. Syst. 2022, 23, 11162–11177. [Google Scholar] [CrossRef]
  23. Long, J.; Shelhamer, E.; Darrell, T. Fully convolutional networks for semantic segmentation. In Proceedings of the IEEE Conference on Computer Vision and Pattern Recognition (CVPR), Boston, MA, USA, 7–12 June 2015; pp. 3431–3440. [Google Scholar]
  24. Badrinarayanan, V.; Kendall, A.; Cipolla, R. SegNet: A deep convolutional encoder-decoder architecture for image segmentation. IEEE Trans. Pattern Anal. Mach. Intell. 2017, 39, 2481–2495. [Google Scholar] [CrossRef]
  25. Ronneberger, O.; Fischer, P.; Brox, T. U-Net: Convolutional networks for biomedical image segmentation. In Proceedings of the International Conference on Medical Image Computing and Computer-Assisted Intervention, Munich, Germany, 5–9 October 2015; pp. 234–241. [Google Scholar]
  26. Huyan, J.; Li, W.; Tighe, S.; Xu, Z.; Zhai, J. CrackU-Net: A novel deep convolutional neural network for pixelwise pavement crack detection. Struct. Control Health Monit. 2020, 27, e2551. [Google Scholar] [CrossRef]
  27. Ren, Y.; Huang, J.; Hong, Z.; Lu, W.; Yin, J.; Zou, L.; Shen, X. Image-based concrete crack detection in tunnels using deep fully convolutional networks. Constr. Build. Mater. 2020, 234, 117367. [Google Scholar] [CrossRef]
  28. Yang, X.; Li, H.; Yu, Y.; Luo, X.; Huang, T.; Yang, X. Automatic pixel-level crack detection and measurement using fully convolutional network. Comput. Aided Civ. Infrastruct. Eng. 2018, 33, 1090–1109. [Google Scholar] [CrossRef]
  29. Liu, Y.; Yao, J.; Lu, X.; Xie, R.; Li, L. DeepCrack: A deep hierarchical feature learning architecture for crack segmentation. Neurocomputing 2019, 338, 139–153. [Google Scholar] [CrossRef]
  30. Sun, X.; Xie, Y.; Jiang, L.; Cao, Y.; Liu, B. DMA-Net: DeepLab with Multi-Scale Attention for Pavement Crack Segmentation. IEEE Trans. Intell. Transp. Syst. 2022, 23, 18392–18403. [Google Scholar] [CrossRef]
  31. Zou, Q.; Zhang, Z.; Li, Q.; Qi, X.; Wang, Q.; Wang, S. Deepcrack: Learning hierarchical convolutional features for crack detection. IEEE Trans. Image Process. 2018, 28, 1498–1512. [Google Scholar] [CrossRef] [PubMed]
  32. Liu, J.; Zhao, Z.; Lv, C.; Ding, Y.; Chang, H.; Xie, Q. An image enhancement algorithm to improve road tunnel crack transfer detection. Constr. Build. Mater. 2022, 348, 128583. [Google Scholar] [CrossRef]
  33. Ma, D.; Fang, H.; Wang, N.; Zhang, C.; Dong, J.; Hu, H. Automatic Detection and Counting System for Pavement Cracks Based on PCGAN and YOLO-MF. IEEE Trans. Intell. Transp. Syst. 2022, 23, 22166–22178. [Google Scholar] [CrossRef]
  34. Xie, S.; Tu, Z. Holistically-Nested Edge Detection. In Proceedings of the IEEE International Conference on Computer Vision (ICCV), Santiago, Chile, 11–18 December 2015; pp. 1395–1403. [Google Scholar]
  35. Liu, Y.; Cheng, M.-M.; Hu, X.; Wang, K.; Bai, X. Richer Convolutional Features for Edge Detection. In Proceedings of the IEEE Conference on Computer Vision and Pattern Recognition (CVPR), Honolulu, HI, USA, 21–26 July 2017; pp. 3000–3009. [Google Scholar]
  36. Yang, F.; Zhang, L.; Yu, S.; Prokhorov, D.; Mei, X.; Ling, H. Feature pyramid and hierarchical boosting network for pavement crack detection. IEEE Trans. Intell. Transp. Syst. 2020, 21, 1525–1535. [Google Scholar] [CrossRef]
  37. Fan, Z.; Li, C.; Chen, Y.; Wei, J.; Loprencipe, G.; Chen, X.; Di Mascio, P. Automatic crack detection on road pavements using encoder-decoder architecture. Materials 2020, 13, 2960. [Google Scholar] [CrossRef]
  38. Qu, Z.; Chen, W.; Wang, S.-Y.; Yi, T.-M.; Liu, L. A crack detection algorithm for concrete pavement based on attention mechanism and multi-features fusion. IEEE Trans. Intell. Transp. Syst. 2021, 23, 11710–11719. [Google Scholar] [CrossRef]
  39. Xu, Z.; Guan, H.; Kang, J.; Lei, X.; Ma, L.; Yu, Y.; Chen, Y.; Li, J. Pavement crack detection from CCD images with a locally enhanced transformer network. Int. J. Appl. Earth Obs. Geoinf. 2022, 110, 102825. [Google Scholar] [CrossRef]
  40. Qu, Z.; Wang, C.-Y.; Wang, S.-Y.; Ju, F.-R. A Method of Hierarchical Feature Fusion and Connected Attention Architecture for Pavement Crack Detection. IEEE Trans. Intell. Transp. Syst. 2022, 23, 16038–16047. [Google Scholar] [CrossRef]
  41. Xiang, X.; Zhang, Y.; El Saddik, A. Pavement crack detection network based on pyramid structure and attention mechanism. IET Image Process. 2020, 14, 1580–1586. [Google Scholar] [CrossRef]
  42. Liu, C.; Zhu, C.; Xia, X.; Zhao, J.; Long, H. FFEDN: Feature Fusion Encoder Decoder Network for Crack Detection. IEEE Trans. Intell. Transp. Syst. 2022, 23, 15546–15557. [Google Scholar] [CrossRef]
  43. Guo, J.-M.; Markoni, H.; Lee, J.-D. BARNet: Boundary aware refinement network for crack detection. IEEE Trans. Intell. Transp. Syst. 2021, 23, 7343–7358. [Google Scholar] [CrossRef]
  44. Hu, J.; Shen, L.; Sun, G. Squeeze-and-excitation networks. In Proceedings of the IEEE Conference on Computer Vision and Pattern Recognition (CVPR), Salt Lake City, UT, USA, 18–23 June 2018; pp. 7132–7141. [Google Scholar]
  45. Woo, S.; Park, J.; Lee, J.-Y.; Kweon, I.S. CBAM: Convolutional block attention module. In Proceedings of the European Conference on Computer Vision (ECCV), Munich, Germany, 8–14 September 2018; pp. 3–19. [Google Scholar]
  46. Park, J.; Woo, S.; Lee, J.-Y.; Kweon, I.S. BAM: Bottleneck attention module. arXiv 2018, arXiv:1807.06514. [Google Scholar] [CrossRef]
  47. Wang, X.; Girshick, R.; Gupta, A.; He, K. Non-Local Neural Networks. In Proceedings of the IEEE Conference on Computer Vision and Pattern Recognition (CVPR), Salt Lake City, UT, USA, 18–23 June 2018; pp. 7794–7803. [Google Scholar]
  48. Cao, Y.; Xu, J.; Lin, S.; Wei, F.; Hu, H. GCNet: Non-local networks meet squeeze-excitation networks and beyond. In Proceedings of the IEEE/CVF International Conference on Computer Vision Workshops, Seoul, Republic of Korea, 27 October–2 November 2019. [Google Scholar]
  49. Wang, T.; Borji, A.; Zhang, L.; Zhang, P.; Lu, H. A stagewise refinement model for detecting salient objects in images. In Proceedings of the IEEE International Conference on Computer Vision (ICCV), Venice, Italy, 22–29 October 2017; pp. 4019–4028. [Google Scholar]
  50. Deng, Z.; Hu, X.; Zhu, L.; Xu, X.; Qin, J.; Han, G.; Heng, P.-A. R3Net: Recurrent residual refinement network for saliency detection. In Proceedings of the 27th International Joint Conference on Artificial Intelligence, Stockholm, Sweden, 13–19 July 2018; pp. 684–690. [Google Scholar]
  51. Qin, X.; Zhang, Z.; Huang, C.; Gao, C.; Dehghan, M.; Jagersand, M. BASNet: Boundary-aware salient object detection. In Proceedings of the IEEE/CVF Conference on Computer Vision and Pattern Recognition, Long Beach, CA, USA, 16–20 June 2019; pp. 7479–7489. [Google Scholar]
  52. Peng, C.; Zhang, X.; Yu, G.; Luo, G.; Sun, J. Large kernel matters—Improve semantic segmentation by global convolutional network. In Proceedings of the IEEE Conference on Computer Vision and Pattern Recognition (CVPR), Honolulu, HI, USA, 21–26 July 2017; pp. 4353–4361. [Google Scholar]
  53. Amhaz, R.; Chambon, S.; Idier, J.; Baltazart, V. Automatic crack detection on two-dimensional pavement images: An algorithm based on minimal path selection. IEEE Trans. Intell. Transp. Syst. 2016, 17, 2718–2729. [Google Scholar] [CrossRef]
  54. Chambon, S.; Moliard, J.-M. Automatic road pavement assessment with image processing: Review and comparison. Int. J. Geophys. 2011, 2011, 989354. [Google Scholar] [CrossRef]
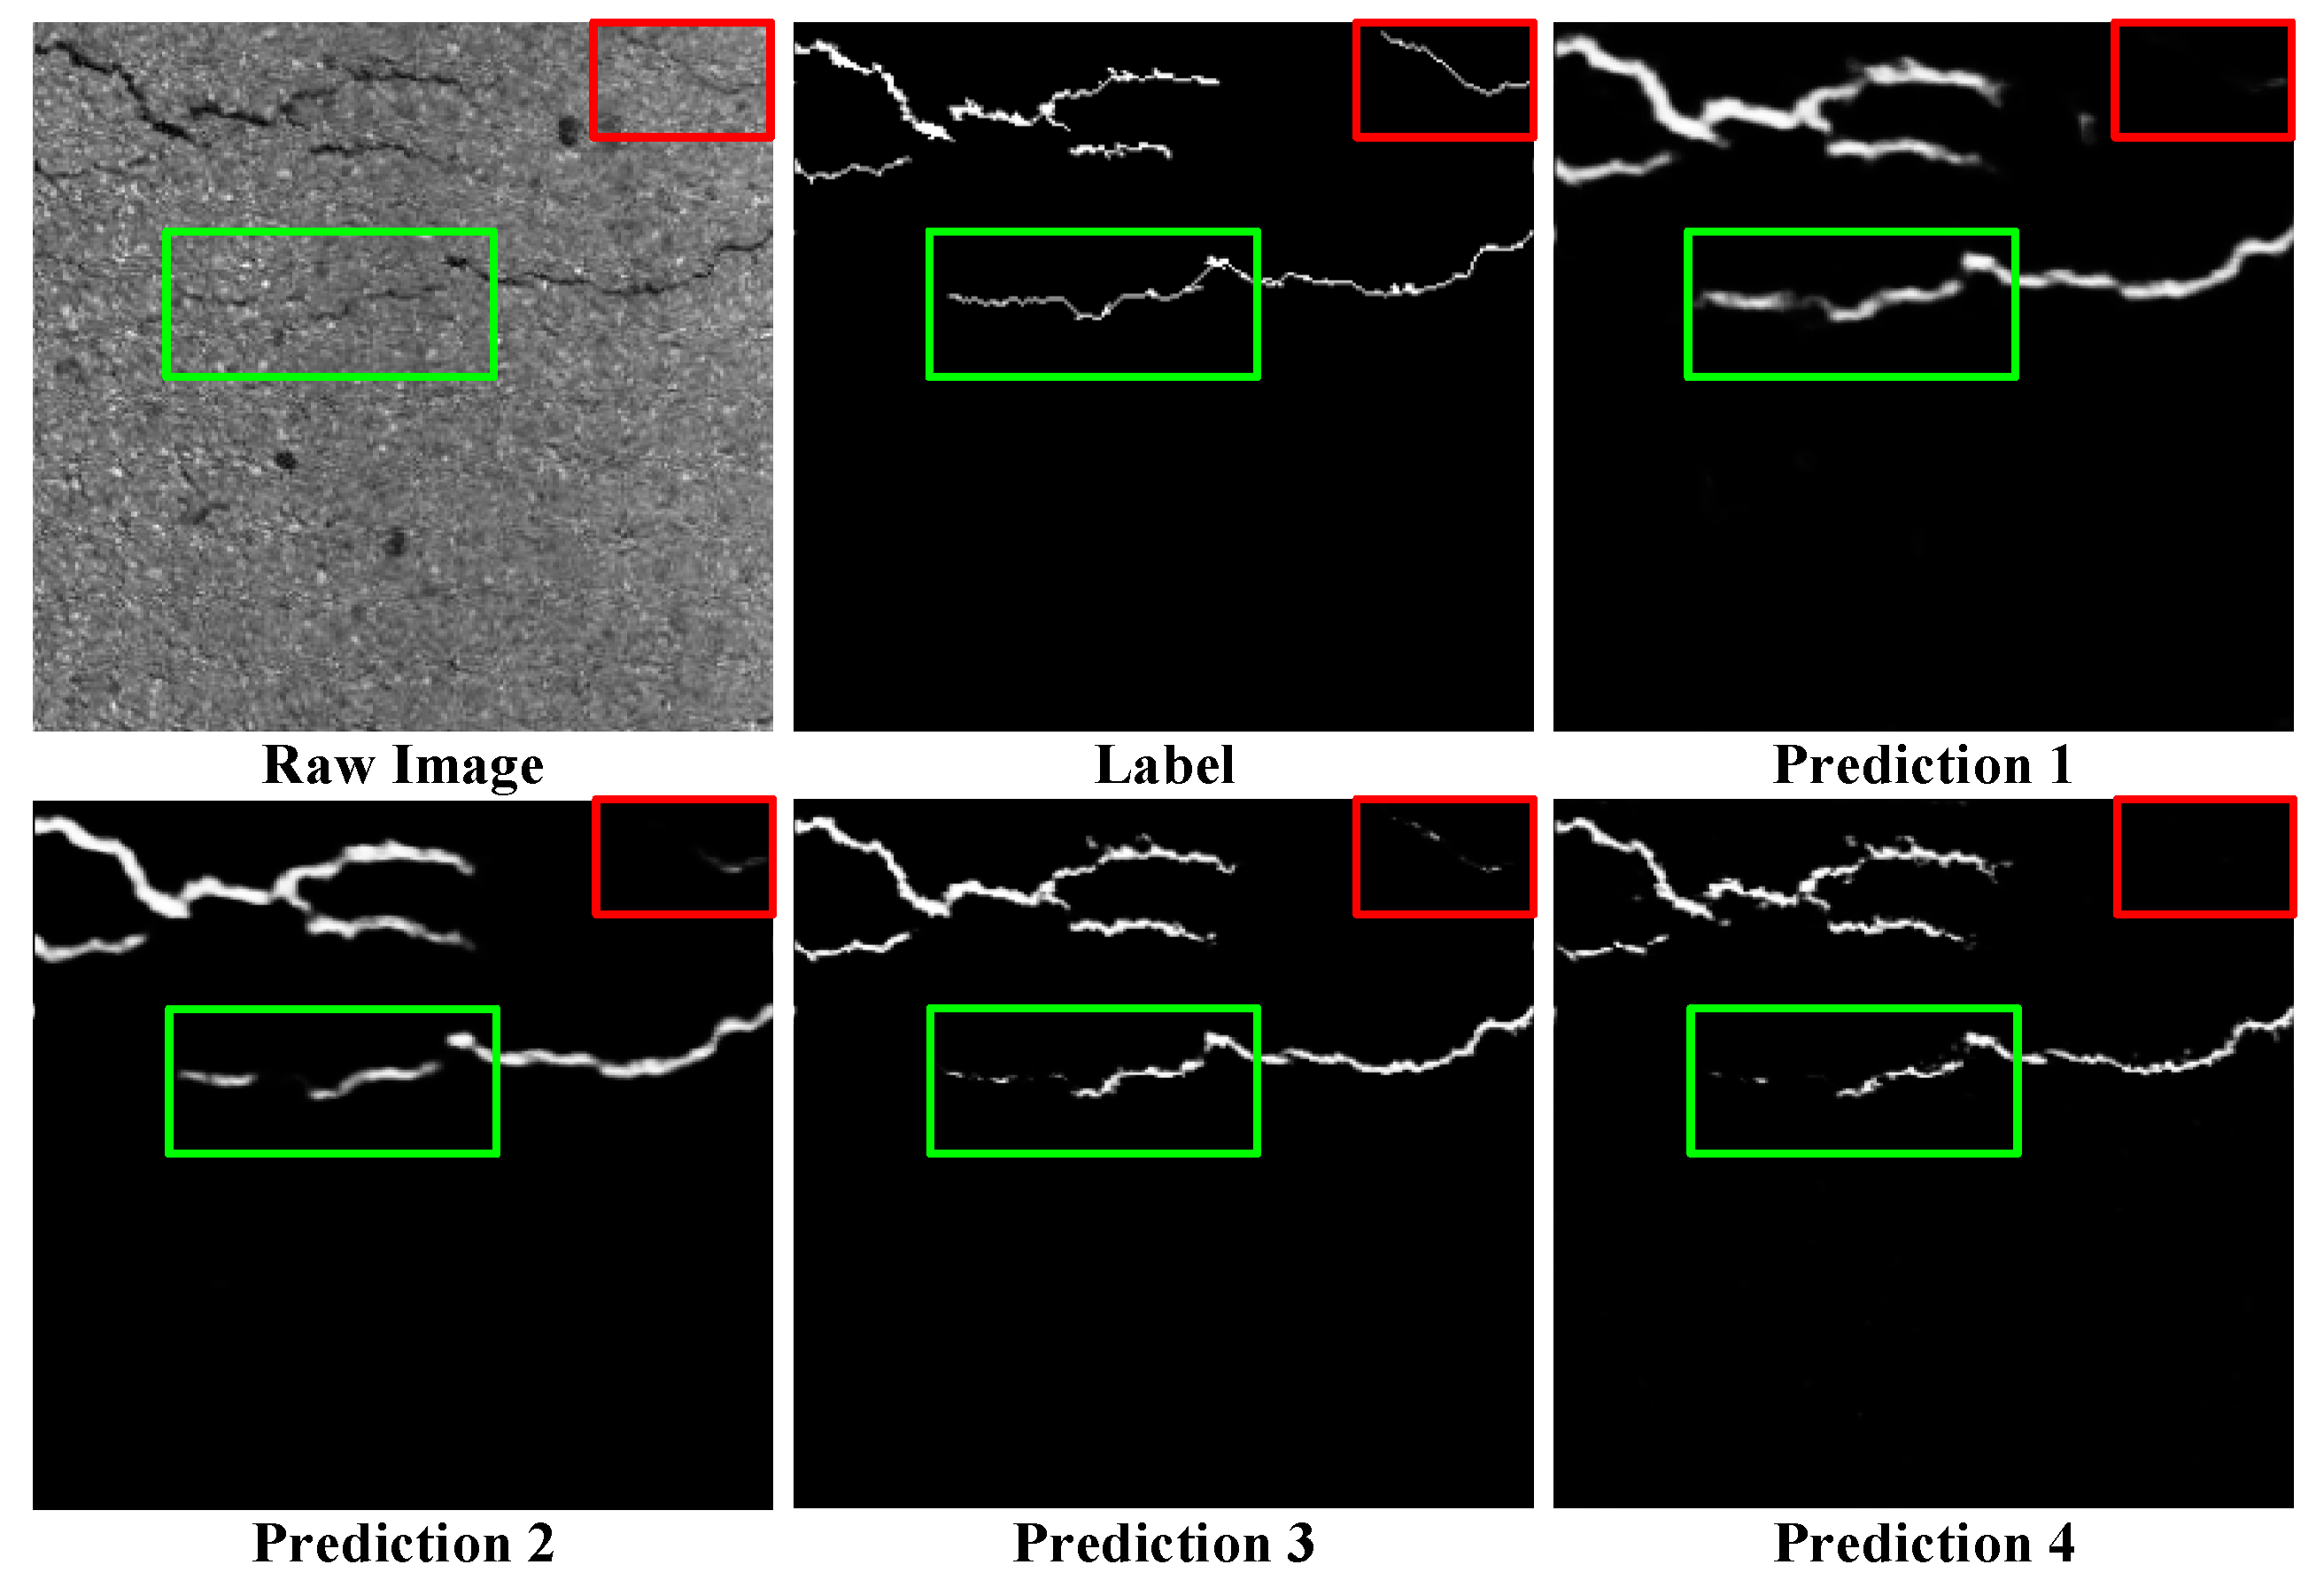
Figure 1. Visual presentation of the two challenges in crack detection: poor performance and completeness in extracting tiny cracks (red boxes); rougher and thicker crack boundaries (green boxes).
Remotesensing 15 02185 g001
Figure 2. Visual presentation of feature heat maps of different layers. High-layer features contain more rough information of crack locations, while lower-layer features contain more details of tiny cracks (red rectangular boxes), but at the same time contain more noise (yellow ellipses). So refers to side-out.
Remotesensing 15 02185 g002
Figure 3. The architecture of CTCD-Net. The three main parts are as follows: (1) a SegNet architecture with side outputs, (2) four attention-based cross-layer information transmission (ACIT) modules, and (3) six boundary refinement (BR) blocks.
Remotesensing 15 02185 g003
Figure 4. The architecture of the proposed (a) ACIT module and (b) BR block.
Remotesensing 15 02185 g004
Figure 5. The implementation of the SE attention mechanism. C, H, and W represent the number of channels, height, and width of the input feature map, respectively. F1 and F2 are two fully connected (FC) layers.
Remotesensing 15 02185 g005
Figure 6. The visualization of feature heat maps during training with/without the proposed ACIT module. With the use of the ACIT module, the model pays more attention to tiny crack regions (red rectangular boxes) and simultaneously reduces the interference of noises (yellow ellipses).
Remotesensing 15 02185 g006
Figure 7. The visualization of feature heat maps during training with/without the proposed BR block.
Remotesensing 15 02185 g007
Figure 8. The PR curves on three datasets.
Remotesensing 15 02185 g008
Figure 9. The crack detection results of all methods: (ad) Deepcrack537 and (eg) the results of the generalization study from AED.
Remotesensing 15 02185 g009
Figure 10. The crack detection results of all methods: (ad) CFD and (eg) AED.
Remotesensing 15 02185 g010
Figure 11. The PR curves of the generalization experiment.
Remotesensing 15 02185 g011
Figure 12. The visualization results of ablation experiments on CFD.
Remotesensing 15 02185 g012
Table 1. Comparison results on DeepCrack537.
MethodsMetrics
PRFIoUmIoU
HED80.3880.4480.4167.2482.74
RCF79.6979.3079.5065.9782.07
U-Net84.5280.2282.3269.9584.20
SegNet84.5581.0582.7770.6084.54
DeepCrack1885.5382.6884.0872.5485.57
DeepCrack1981.3180.4680.8867.9083.10
FPHBN84.7081.2882.9670.8884.69
FFEDN86.4282.4484.3872.9985.81
Ours86.5983.1084.8173.6286.14
Table 2. Comparison results on CFD.
MethodsMetrics
PRFIoUmIoU
HED56.3466.1060.8343.7171.13
RCF56.6667.3761.5544.4671.52
U-Net64.1769.6466.8050.1474.48
SegNet60.5668.3064.2047.2872.99
DeepCrack1862.3073.4567.4250.8574.82
DeepCrack1958.9568.7763.4846.5072.58
FPHBN57.9371.1363.8546.9072.77
FFEDN65.6572.7769.0352.7075.80
Ours66.7473.5769.9953.8376.38
Table 3. Comparison results on AED.
MethodsMetrics
PRFIoUmIoU
HED53.7966.2459.3742.2270.39
RCF53.6268.2860.0742.9370.75
U-Net64.5668.0266.2549.5374.22
SegNet60.2269.6664.6047.7173.25
DeepCrack1861.8369.0465.2448.4173.62
DeepCrack1952.8765.4058.4741.3169.92
FPHBN59.3368.4663.5746.5972.68
FFEDN64.8470.8067.6951.1675.05
Ours65.2871.4268.2151.7675.35
Table 4. Comparison results on generalization experiments.
MethodsMetrics
PRFIoUmIoU
HED32.9643.1737.3822.9860.36
RCF34.5946.2539.5824.6761.23
U-Net43.2450.7746.7030.4764.32
SegNet40.5143.4541.9326.5262.32
DeepCrack1843.0453.1947.5831.2264.69
DeepCrack1934.1350.1040.6025.4761.58
FPHBN35.1355.1342.9227.3262.51
FFEDN48.3950.5949.4732.8665.62
Ours49.4659.3553.9636.9567.68
Table 5. Results of ablation experiments.
MethodsMetrics
PRFIoUmIoU
SegNet60.5668.3064.2047.2872.99
SegNet + Side62.9172.1967.2350.6474.72
SegNet + BR63.0973.3867.8551.3475.08
SegNet + ACIT65.1572.8168.7752.4075.64
CTCD-Net 66.7473.5769.9953.8376.38
Disclaimer/Publisher’s Note: The statements, opinions and data contained in all publications are solely those of the individual author(s) and contributor(s) and not of MDPI and/or the editor(s). MDPI and/or the editor(s) disclaim responsibility for any injury to people or property resulting from any ideas, methods, instructions or products referred to in the content.