Abstract
Cross water–air interface acoustic and electromagnetic integrated communication (AEIC) technology refers to an underwater speaker that excites the water surface micro-amplitude wave (WSAW) on the water’s surface, and millimeter wave radar detects the vibrations of the WSAW to realize the transmission of information. The research on cross-media communication meets many challenges due to the large amplitude of the water surface disturbance and the small amplitude of the WSAW. In this paper, a novel sea wave interference suppression method based on improved complete ensemble empirical mode decomposition with adaptive noise (CEEMDAN) and wavelet transform (WT) is presented. This method divides the phase change into different intrinsic mode functions (IMFs) and obtains a reconstructed scale of the WSAW signal through wavelet decomposition and correlation procession to separate the WSAW signal and the sea wave interference. It is proved to be better than the reference filtering method by experiment. By using this novel method, the bit error rate (BER) of the communication system can be reduced effectively.
1. Introduction
In recent years, with the increasing development of ocean exploration, mastering the initiative of the ocean is conducive to occupying a favorable position in future naval battles. Countries are becoming increasingly aware of the economic value of the ocean and its important military strategic position. In order to make rational use of ocean resources and occupy the military initiative, countries need to continuously develop cross-media communication technology. Cross-media communication has many applications in maritime communication, including underwater resource exploration [1,2,3], marine biological population monitoring [4,5,6], and underwater target location and communication [7,8,9]. In terms of application, a robot can transmit the distribution information of undersea mineral resources to an aerial platform through cross-media communication. Scientists can place sensors on marine organisms to observe their physiological characteristics’ migration law through cross-media communication.
Cross-media communication refers to underwater speakers that excite a water surface micro-amplitude wave (WSAW) on the water’s surface, and a millimeter wave radar system detects the vibrations of the WSAW to realize information transmission. Cross-media communication includes uplink communication and downlink communication. Uplink communication means an underwater sound source sends underwater reconnaissance information to an aerial platform. Downlink communication means an aerial platform sends instructional information to an underwater vehicle. Among them, the uplink communication pressure is heavy. The existing cross-media communication methods mainly include buoy communication [10,11], optical communication [12,13], opto-acousto communication [14,15,16], and acoustic–electromagnetic communication [17,18,19].
Buoy communication has the problem of poor concealment, which easily exposes its position [7]. Optical communication has the problems of complex equipment and technical difficulty; at the same time, it has high requirements for water quality. Opto-acousto communication is greatly affected by foggy weather. In addition, communication technology requires the high stability of the laser platform. Acoustic–electromagnetic communication has the advantages of high concealment, all-time and all-weather operation, etc. It can be used for efficient and reliable communication between underwater vehicles and aircraft and satellites in the future.
One of the real difficulties in cross-media communication is how to eliminate water surface interference, including sea wave and ship interference, and extract the water surface micro-amplitude wave (WSAW) signal. Regarding the interference suppression of cross-media communication, many research groups have analyzed interference characteristics and proposed corresponding algorithms to realize interference suppression on the water’s surface. In [17], Tonolini eliminates the interference through a band-pass filter, but it cannot effectively filter out the interference components in the communication frequency band. Underwater wireless optical communication has been proposed, and it changes the seawater turbidity and wind speed to reduce the impact of the water surface, thereby reducing the bit error rate (BER) [20]. In [21], Antonelli applies a laser Doppler vibrometer (LDV) to detect the WSAW at the time-varying dynamic water–air interface and proposes an adaptive LDV tracking algorithm based on the principle of minimum loss to compensate for the roughness of the hydrodynamic surface. In opto-acousto communication, improved phase generation carrier technology removes the water surface fluctuation interference and the result is better. However, the interference frequency is required to be lower than 5 Hz, and the maximum disturbance amplitude is not more than 2 cm, which has great limitations in practical applications [22].
This paper focused on a novel method of sea wave interference suppression based on improved complete ensemble empirical mode decomposition with adaptive noise (CEEMDAN) and wavelet transform (WT). This novel method is based on frequency, and it can separate interference signals of different frequencies from communication signals. According to the radar echo model of superimposed sea wave interference, it is proved that the WSAW and the sea wave interference can be extracted by the phase signal so as to separate the WSAW signal. The performance of this novel method based on improved CEEMDAN and WT is compared with the reference filtering method. We attempted to verify the preferable performance of this novel method by means of theoretical derivation and experiment.
The remainder of this paper is organized as follows. In Section 2, the radar echo model of superimposed sea wave interference is demonstrated. Novel sea wave interference suppression based on improved CEEMDAN and WT is proposed in Section 3. The interference suppression results and communication performance of the novel method and reference method are presented in Section 4. Section 5 concludes this paper.
2. Cross-Media Communication Model
In this section, we analyze the signal transmission of the cross-media communication system, which contains the underwater speaker that excites the WSAW, and the radar emits a frequency-modulated continuous wave (FMCW) and processes the reflected signals. The overall communication system includes two parts: water–air interface and radio frequency (RF) model.
2.1. Water–Air Interface
A sound wave enters the air from the water. Reflection and transmission will occur at the interface due to the large difference in the characteristic impedance between the air and water. The reflection and transmission at the interface will cause a vibration at the water–air interface, and the particle interference at the incident point of the sound pressure that excites the WSAW propagates laterally on the water’s surface.
The incident sound pressure is , the incident angle is 0°, and the angular frequency is ; the initial position change of the free water surface can be expressed as [18]:
where is the density of water; represents the speed of sound propagation in the water; is the wave number of the WSAW, which is obtained from the dispersion relationship; and is the attenuation coefficient in water, which can be expressed as [23]:
where is the water viscosity of the water medium; is the water surface tension at 25 °C; and is the acceleration of gravity.
The choice of the horizontal axis in Equation (1) does not affect the form of the harmonic of the WSAW. Therefore, a 3D mathematical model of the WSAW is obtained by extending Equation (1):
where and are two horizontal axes.
2.2. RF Model
Cross water–air interface acoustic and electromagnetic integrated communication (AEIC) technology estimates the WSAW parameters by detecting the delay change in the target echo. The initial distance from the calm water surface to the radar is . In order to conveniently conduct research, the sea wave interference, , is formed by the superposition of a series of sinusoidal interference. The millimeter-wave radar illuminates the center of the vibration of the water’s surface; then, the instantaneous distance, , from the radar to the water’s surface can be expressed as:
where is the slow time.
In order to achieve high phase resolution while eliminating the interference from other reflectors in the environment, AEIC uses an FMCW-based wideband radar. The transmitted signal can be described as:
where is the amplitude of the transmitted signal; is the center frequency of the transmitted signal; is the chirp rate; is the initial phase; and is the time width of the sweep frequency.
Considering the influence of the WSAW and sea wave interference, the time-delay function is . The received signal can be expressed as:
where is a constant related to the water surface reflection coefficient and spatial propagation attenuation.
The received signal and the transmitted signal are mixed and filtered to obtain the beat signal. Considering the actual situation, the vibration speed of the WSAW is much slower than the speed of light. Then:
The time evolution of the phase change of the beat signal, , can be described as:
where is the wavelength of the radar’s transmitted signal. The above phase change includes the WSAW and the sea wave interference. Based on the above, a novel sea wave interference suppression method is proposed, which eliminates the sea wave component and retains the WSAW component .
2.3. Problem Description
There are sea waves on the sea surface, the amplitude of which is much larger than the WSAW’s, and the WSAWs are superimposed on it in Figure 1. In order to ensure communication on the surface of the sea, it is necessary to separate the wave interference to realize normal communication from underwater to the water’s surface.
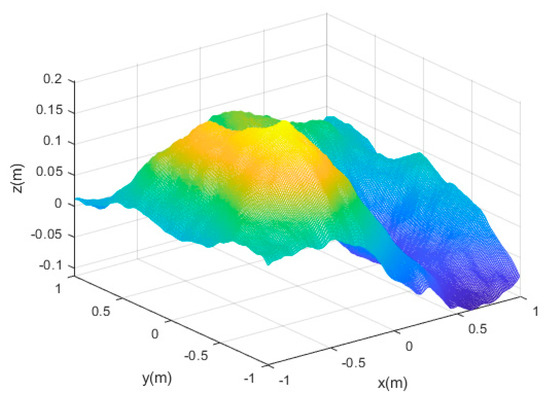
Figure 1.
Ocean surface simulation (superposed WSAWs). Wind speed: 3 m/s.
3. Proposed Algorithm
One of the cores of AEIC is to eliminate the sea wave interference and ensure normal communication. In this section, we propose and elaborate an improved CEEMDAN joint WT sea wave interference suppression method.
3.1. Preprocess
The proposed algorithm consists of three parts in total. Preprocessing is the first part. The FMCW radar first needs to be used for the acquisition of data, which contain scene information within the radar range. Then, pulse compression is performed on the data, and the range bins containing the WSAW signals are selected for the scattering intensity of the range bin after frequency mixing and filtering. Finally, the phase signal is extracted to obtain the water surface vibration signals. Preprocessing also includes knowing the underwater speaker frequencies for correlation processing.
3.2. Improved CEEDMAN Algorithm
Empirical mode decomposition (EMD) is a novel method for handling nonstationary data series, which was proposed by Huang [24] in 1998. Signals are decomposed one by one, and a data series containing different characteristic scales is obtained, which is called the intrinsic mode function (IMF) [24].
The data collected by radar include sea wave and WSAW data, which are preprocessed to obtain one-dimensional time–distance data. Since the sea waves and WSAWs contain multiple frequency components, they can be separated based on the frequency. The EMD algorithm can decompose a signal into multiple frequency components, but it is prone to modal aliasing. By adding Gaussian white noise in the decomposition process, the modal aliasing phenomenon can be effectively suppressed. The improved CEEMDAN algorithm is as follows.
The Gaussian white noise decomposed by EMD is added to the improved CEEMDAN’s first decomposition instead of the original Gaussian white noise. In contrast, the improved CEEMDAN adds Gaussian white noise with the same multiple decompositions.
The first decomposition of the improved CEEMDAN obtains the IMF component by calculating the mean value of the IMF component, and each decomposition after the first decomposition obtains the IMF component by calculating the mean value of the residual component and subtracting the mean value of the residual component from the signal.
Definition: represents the -order IMF component obtained by the EMD of the signal; is the average calculation of the local envelope of the signal; and is the zero-mean Gaussian white noise. The phase is converted from Equation (8) into the distance . The improved CEEMDAD algorithm flow is as follows.
White noise is added to , and the superimposed signal is decomposed to obtain the first-order IMF by EMD:
where is the amplitude coefficient of the noise added to the decomposition, generally set to ; is the number of times white noise is added, which is usually set between and . The local envelope averaging is solve; then, the ensemble averaging is performed to obtain the first-order residual components:
The first-order IMF is calculated:
The white noise is added to the first residual error, , and the superimposed signal is decomposed to obtain the second-order IMF by EMD. The second-order residual error is obtained by and ensemble averaging. The second-order residual error is obtained from the first-order residual error to obtain the second-order IMF:
Equations (11) and (12) are repeated to calculate the IMF; then, the -order residual error, , can be expressed as:
The -order IMF is calculated:
Whether the above conditions satisfy the termination condition is determined (i.e., the residual error does not exceed two extreme values) and, if so, the decomposition is stopped.
3.3. Reconstruction Scale
In the previous step, Gaussian white noise was added to suppress mode aliasing. Here, wavelet transform is needed to de-noise each modal component.
WT is a function, , that satisfies the condition and is generated by translation and scaling. The WT of signal is defined as:
where is the wavelet transform coefficient; is the wavelet basis function; and and are the stretch and translation factors, respectively. Equation (15) shows that the choices of the wavelet basis function significantly influence each IMF. Through experimental tests, the wavelet basis function “coif4” was selected in this manuscript to obtain better results.
After the interference signal is removed by wavelet decomposition, the new signal can be reconstructed using the inverse wavelet transform:
where is the wavelet admissible constant, and is the Fourier transform of the wavelet basis function .
The received phase signals include the WSAW signal and sea wave interference signal. The novel sea wave interference suppression algorithm can divide into multiple different IMFs based on the frequency. In order to determine the modal function of the WSAW signal, the corresponding reconstructed scale is calculated by correlation to separate the WSAW and sea wave interference. The separated WSAW signal is reconstructed to further restore the transmission information of the underwater speaker.
A flowchart of the sea wave interference suppression is shown in Figure 2. The received echo is de-sloped and low-pass filtered. The yellow line indicates the one-dimensional range result of the superposition of the WSAW and the sea wave interference. The maximum value in each range bin is determined, and the corresponding phase is extracted. The main purpose of preprocessing is to estimate the frequency of the transmitted signal. The frequencies will correlate with the results after the wavelet decomposition to determine the reconstructed scale, . Then, the superimposed signal is decomposed into multiple IMFs and the residual error by the improved CEEMDAN, and the frequencies of the IMFs vary from high frequency to low frequency. In the above process, white noise is added to achieve the continuity of frequencies between adjacent scales, which can eliminate the influence of frequency aliasing.
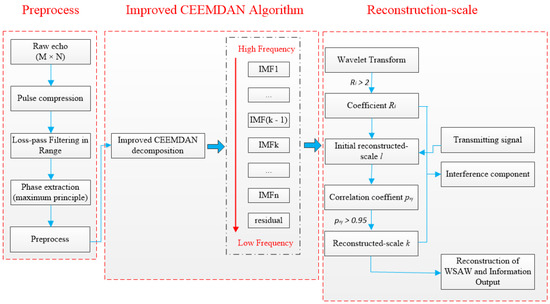
Figure 2.
Flowchart of the sea wave interference algorithm.
The key point shown in Figure 2 is to determine the reconstruction scale, which needs to be determined by the multiscale IMF and the residual error. The product, , of the energy density, , and the average cycle, , are calculated, where is the ith IMF energy density, . is the ith IMF average cycle, . Moreover, is the length of the ith IMF, is the amplitude of the ith IMF, and is the sum of the extreme points of the ith IMF.
The coefficient is calculated as:
The product, , of the energy density, , and the average cycle, , is a constant [25]. When a point in is a local minimum, it contains useful frequency components. When , the initial reconstructed scale is equal to .
The signals of the initial reconstructed scale and the preprocess frequencies are reconstructed. Correlation is performed on the reconstructed signals. When the correlation coefficient is greater than 0.95, the IMFs are considered to be the WSAW signals.
where is the correlation coefficient; is the initial reconstructed scale signals; and is the preprocess frequency reconstructed signals.
The reconstructed scale is determined by the correlation coefficient, and the corresponding scale is selected to reconstruct the WSAW signal to realize the information from the underwater speaker to the air platform.
4. Experimental Results
The measured results show that the algorithm has the ability to suppress sea wave interference. In this section, the experimental data were acquired to study the performance of the algorithm and the performance indicators of the cross-media communication were analyzed. Specifically, we designed a cross-media communication system, which includes an underwater sound source device that transmits underwater signals, a millimeter wave radar that receives radio frequency signals, a variable fan that forms the sea wave interference, and a host for signal processing.
In Figure 3, the signal generator transmits the signal to the underwater speaker through the power amplifier and excites the water’s surface to form the WSAW. The variable fan is adjusted to form the sea wave interference on the water’s surface, and the WSAW is superimposed. The radar transmits the FMCW signal with a center frequency of 34.6 GHz and a bandwidth of 1.2 GHz to measure the change in the water surface vibration. Figure 4 shows an actual cross-media communication scenario for interference suppression. The experiment was carried out in an open place. The transmitting and receiving antennas illuminated the water surface vertically, and each was placed 1 m away from the water’s surface. The underwater speaker was placed in an experimental water tank with a depth of 0.28 m. The antenna phase center was aligned with the center of the underwater speaker.
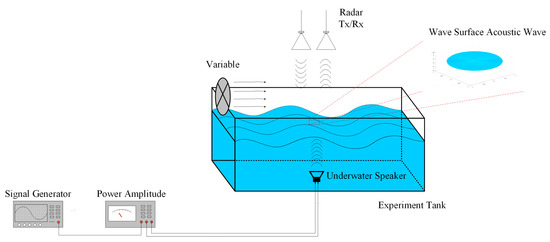
Figure 3.
Schematic diagram of the experimental system.
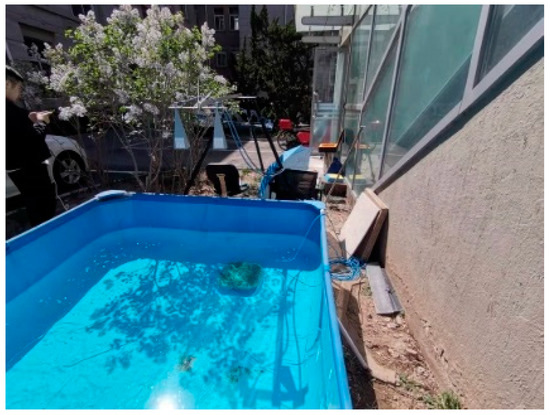
Figure 4.
Interference suppression experiment’s platform construction.
The Ka-band FMCW radar prototype for the cross-media communication was designed by the National Key Laboratory of Microwave Imaging Technology, Chinese Academy of Science. The radar utilized a two-horn antenna type, as presented in Figure 4. The key parameters of the cross-media communication are shown in Table 1.

Table 1.
Parameters of the cross-media communication.
In this section, we set up an experiment to verify the effectiveness of the improved algorithm. We considered the influence of the sea waves caused by the different wind speeds of the variable fan on the interference suppression algorithm, and we took the filtering method as a comparison [17] and the BER as the communication indicators to evaluate the effectiveness of the algorithm. The variable fan was set to two conditions: strong wind (4th gear) and weak wind (1st gear).
Figure 5a shows the original echo matrix of the received signal when the variable fan was in 4th gear, and Figure 5b is the range change containing the WSAW and sea wave interference. The ordinate axis represents the slow time, and the abscissa axis is the distance from the radar to the water’s surface. From the echo matrix, it is clear that there was a high power reflection from the water’s surface.
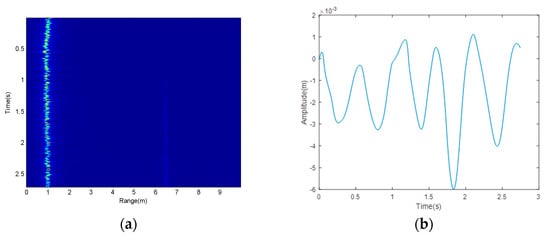
Figure 5.
(a) One−dimensional range result of the WSAW and sea wave interference; (b) range change result.
The bandwidth of the transmitted signal was 1.2 GHz, and the width of the range resolution unit was 0.125 m. If the sea wave interference exceeded one range bin, the result is shown in Figure 5a. In the process of extracting the phase, there was the phenomenon of cross range bin. The phase of the range bin cannot represent the actual water surface vibration, while the strongest scattered power represents the actual water surface’s reflected power. During the experiment, due to the limitations of the size and power of the variable fan, the sea wave interference caused by the wind did not exceed 0.5 m. Therefore, the vibration position of the water’s surface was found, and the scattered power amplitudes in the range bins were searched to the left and right. The maximum value was taken as the actual water surface’s reflected power. The change trend of the water surface obtained through the phase change is shown in Figure 5b.
Figure 5b includes the sea wave signals and WSAW signals. In order to eliminate the sea wave signals, an improved CEEMDAN decomposition was carried out, which decomposed the superimposed signals into multiple IMFs and the residual error. During the signal processing, the signals were artificially added with the same decomposition Gaussian white noise, and wavelet denoising was performed on each IMF to reduce the influence of the errors on the subsequent signal reconstruction. The IMF corresponding to the initial reconstruction scale was determined using Equation (17), and then the IMF corresponding to the reconstruction scale was determined using Equation (18). Thus, the reconstruction scale corresponding to the IMFs included the WSAW signals. The remaining IMFs were discarded to realize the separation of the WSAW signal and sea wave interference signal.
Under the condition of a weak wind in the 1st gear of the variable, the correlation coefficients of the underwater speaker frequencies calculated using Equation (18) were . The corresponding reconstruction scale signals were selected for reconstruction. Figure 6a shows the result obtained using the proposed method, and Figure 6b is the corresponding time–frequency analysis. The results of the proposed method are basically consistent with the transmitting frequencies of the underwater speaker.
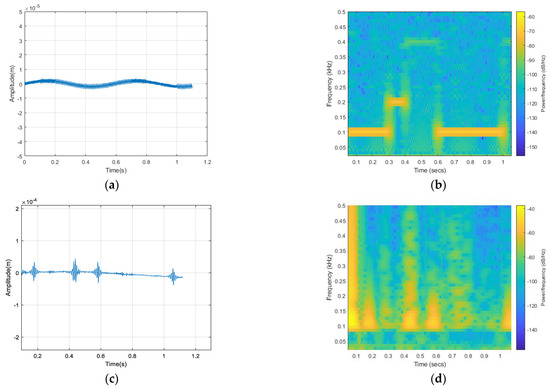
Figure 6.
(a) The proposed algorithm’s result (weak wind); (b) time−frequency result; (c) filtering method’s result (weak wind); (d) time−frequency result.
In this paper, the interference suppression method in translational acoustic-RF communication (TARF) was selected as a comparison. TARF proposes a filtering method to eliminate water surface interference caused by swimming in a pool. We designed a bandpass filter as a comparison of the proposed algorithm. The bandpass range was 80–420 Hz due to the communication frequencies of 100 Hz, 200 Hz, 300 Hz, and 400 Hz. Figure 6c shows the sea wave interference suppression result. Figure 6d shows the corresponding time–frequency analysis result. It can be clearly seen from the results that the effect of the filtering method on the interference suppression was not obvious.
For the weak wind condition, Table 2 shows the BER for the two different methods. In Figure 7, the blue circle is an ideal constellation. The black asterisk represents the decoding result of the filtering, and the BER was 12.71%. The red plus sign represents the processing result of the proposed algorithm, and the BER was 0. The BER of the proposed algorithm was much lower than that of the filtering method.
Table 2.
BER of the proposed algorithm and filtering (weak wind).
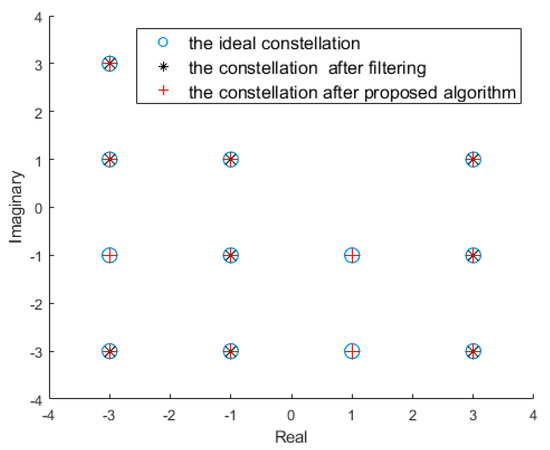
Figure 7.
The results of the constellations of the ideal, proposed algorithm and filtering (weak wind).
Figure 8 shows the results of the variable fan under in 4th gear. The initial reconstructed signals were correlated with the transmission frequency reconstructed signals, and the correlation coefficients calculated using Equation (18) were . The corresponding reconstruction scale signals were selected for reconstruction.
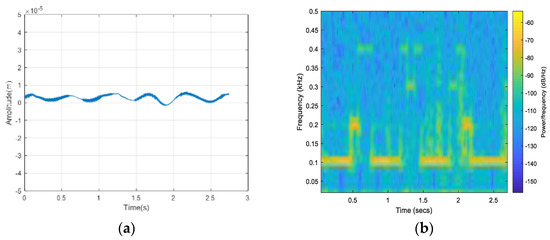
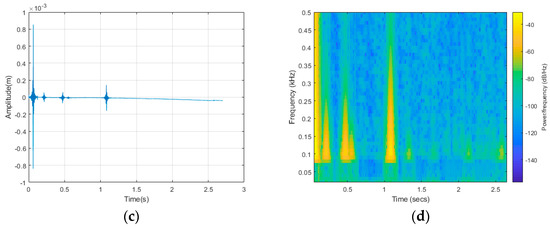
Figure 8.
(a) The proposed algorithm’s result (strong wind); (b) time–frequency result; (c) proposed algorithm’s result (strong wind); (d) time–frequency result.
Figure 8a is the result obtained by the proposed method, and Figure 8b is the corresponding time–frequency analysis. Figure 8c shows the result obtained by filtering, and Figure 8d is the corresponding time–frequency analysis. The proposed method could remove the interference signal, but the filtering method could not effectively eliminate the interference.
The encoding adopts 16QAM. Table 3 shows the BER of the two different methods under strong wind. In Figure 9, the black asterisk represents the decoding result of the filtering, and the BER was 0.07%. The red plus sign represents the processing result of the proposed algorithm, and the BER was 17.14%. Under the condition of sea wave interference, the proposed method could effectively reduce the BER.
Table 3.
BER of the proposed algorithm and filtering (strong wind).
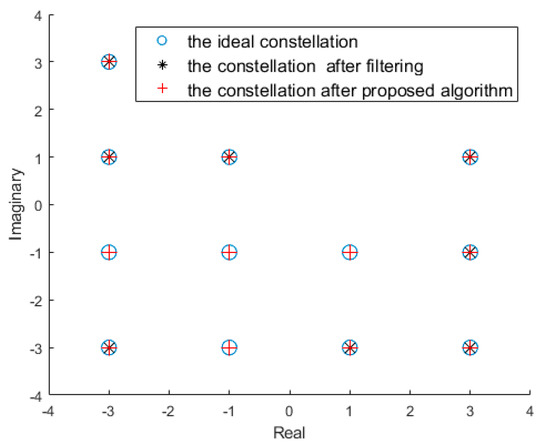
Figure 9.
The results of the constellations of the ideal, proposed algorithm and filtering (strong wind).
Due to the limitation of the experimental conditions, the sea wave interference caused by the wind did not exceed 0.5 m. Under the two different conditions of weak wind and strong wind, the proposed algorithm could well eliminate the wave interference and ensure a low BER. Compared with the proposed algorithm, the filtering method needs to know the interference frequency distribution to design the corresponding filter. However, the sea wave frequencies are in a wide range, and the sea wave frequencies may be within the range of the communication frequency band, which results in greater difficulty in the design of the filter. The proposed algorithm is not affected by the interference in the communication frequency band. It mainly searches for the IMFs corresponding to the reconstruction scale, which contain the characteristic information of the WSAW and reconstructs it to obtain the WSAW signals. In practical applications, the method proposed in this paper can adapt to more complex sea surfaces than the filtering method.
In addition, the above related experiments were all based on a fixed distance from the radar to water and the distance from the speaker to water. However, in actual situations, the actual distance exceeds the set distance by the water tank experiment. Recall the AEIC, the receiver employs a millimeter wave radar to measure the WSAW to realize the information transmission from underwater to above water. The radar transmits the FMCW signals and measures their reflection off the water’s surface. The radar measures the change in the distance by estimating the phase of the beat signal after the mixed frequency of the transmitted signal and the received signal. The phase of the beat signal can be expressed as Equation (8). In Figure 5a, the phase changes include the WSAW signals and the sea wave signals. The extracted phase changes are shown in Figure 5b, which are the input of the proposed algorithm. Therefore, we can increase the transmission power to ensure that the radar detects the water within an effective distance.
As for the distance from the speaker to the water, it has little influence on the results. In Equation (3), the frequency of the WSAW is consistent with the transmitting frequency of the speaker, and it is not affected by the distance. The essence of AEIC is to estimate the frequency of the WSAW. Therefore, the preprocessed phase signals contain the WSAW signals, and we can separate the WSAW signal from the sea wave signals.
5. Conclusions
In this paper, we proposed a novel sea wave interference suppression method based on improved CEEMDAN and WT. Under the condition of sea wave interference, this novel method and the traditional filtering method were discussed and compared. The novel sea wave interference suppression method has the characteristics of strong environmental adaptability and a low bit error rate, and it is suitable for cross-media communication in complex sea environments. This method can automatically eliminate the wave interference and reduce the bit error rate, which is of great significance for the practical application of cross-medium communication.
Author Contributions
Conceptualization, J.L.; methodology, J.L.; formal analysis, J.L.; investigation, X.B.; resources, X.L.; data curation, L.Z. and X.B.; validation, J.L., X.B. and Q.G.; writing—original draft preparation, J.L.; writing—review and editing, J.L., X.B., Q.G. and L.Z. All authors have read and agreed to the published version of the manuscript.
Funding
This research received no external funding.
Data Availability Statement
Not applicable.
Acknowledgments
The authors thank all colleagues who participated in the cross-media system’s design and the acquisition of the measured data. The authors would like to express their gratitude to the anonymous reviewers and the editor for their constructive comments on the paper.
Conflicts of Interest
The authors declare no conflict.
Abbreviations
The following abbreviations are used in this manuscript:
| CEEMDAN | Complete Ensemble Empirical Mode Decomposition with Adaptive Noise |
| AEIC | Acoustic and Electromagnetic Integrated Communication Technology |
| WSAW | Water Surface Micro-Amplitude Wave |
| WT | Wavelet Transform |
| IMF | Intrinsic Mode Function |
| BER | Bit Error Rate |
| LDV | Laser Doppler Vibrometer |
| FMCW | Frequency-Modulated Continuous Wave |
| RF | Radio Frequency |
| EMD | Empirical Mode Decomposition |
| TARF | Translational Acoustic-RF Communication |
References
- Jarry, J. SAR, NAUTILE, SAGA, ELIT-four new vehicles for underwater work and exploration: The IFREMER approach. IEEE J. Ocean. Eng. 1986, 3, 413–417. [Google Scholar] [CrossRef]
- Li, W.; Dimarzio, C.A.; Mcknight, S. Laser-induced acoustic detection of buried objects. In Proceedings of the SPIE-the International Society for Optical Engineering, Boston, MA, USA, 15 October 1998; pp. 841–847. [Google Scholar]
- Beverini, N.; Firpi, S.; Guerrini, P.; Maccioni, E.; Maguer, A.; Morganti, M.; Stefani, F.; Trono, C. Fiber laser hydrophone for underwater acoustic surveillance and marine mammals monitoring. In Proceedings of the SPIE-International Conference on Lasers, Applications, and Technologies, Kazan, Russia, 10 September 2010; Volume 7994, pp. 285–291. [Google Scholar] [CrossRef]
- Thomas, G.L.; Hahn, T.; Thorne, R. Combining passive and active underwater acousitics with video and laser optics to assess fish stocks. In Proceedings of the OCEANS 2006, Boston, MA, USA, 18–21 September 2006. [Google Scholar] [CrossRef]
- Williamson, B.J.; Blondel, P.; Armstrong, E.; Bell, P.S.; Hall, C.; Waggitt, J.J.; Scott, B. A self-contained subsea platform for acoustic monitoring of the environment around marine renewable energy devices-field deployments at wave and tidal energy sites in Orkney, Scotland. IEEE J. Ocean. Eng. 2015, 4, 67–81. [Google Scholar] [CrossRef]
- Manik, H. Underwater acoustic signal processing for detection and quantification of fish. In Proceedings of the 2011 International Conference on Electrical Engineering and Informatics, Bandung, Indonesia, 17–19 July 2011; pp. 3–5. [Google Scholar] [CrossRef]
- Ameer, P.M.; Jacob, L. Underwater localization using stochastic proximity embedding and multi-dimensional scaling. Wirel. Netw. 2013, 19, 1679–1690. [Google Scholar] [CrossRef]
- Liu, C.; Zakharov, Y.V.; Chen, T. Broadband underwater localization of multiple sources using basis pursuit de-noising. IEEE Trans. Signal Process. 2012, 60, 1708–1717. [Google Scholar] [CrossRef]
- Cho, H.; Gu, J.; Joe, H.; Asada, A.; Yu, S. Acoustic beam profile-based rapid underwater object detection for an imaging sonar. J. Mar. Sci. Tech. 2015, 20, 180–197. [Google Scholar] [CrossRef]
- Yuan, F.; Huang, Y.; Chen, X.; Cheng, E. A biological sensor system using computer vision for water quality monitoring. IEEE Access 2018, 6, 61535–61546. [Google Scholar] [CrossRef]
- Dietz, A.J.; Klein, I.; Gessner, U.; Frey, C.M.; Kuenzer, C.; Dech, S. Detection of water bodies from AVHRR data-a TIMELINE thematic processor. Remote Sens. 2017, 9, 57. [Google Scholar] [CrossRef]
- Islam, M.S.; Younis, M.F. Analyzing Visible Light Communication Through Air-Water Interface. IEEE Access 2019, 7, 123830–123845. [Google Scholar] [CrossRef]
- Chen, L.; Shao, Y.; Di, Y. Underwater and Water-Air Optical Wireless Communication. J. Light. Technol. 2022, 40, 1440–1452. [Google Scholar] [CrossRef]
- Lee, M.; Bourgeois, B.; Hsieh, S.; Martinez, A.; Hickman, G. A laser sensing scheme for detection of underwater acoustic signals. In Proceedings of the 1988 IEEE Southeastcon, Knoxville, TN, USA, 11 May 1988; pp. 253–257. [Google Scholar] [CrossRef]
- Antonelli, L.; Blackmon, F. Experimental demonstration of remote, passive acousto-optic sensing. J. Acoust. Soc. Am. 2004, 116, 3393–3403. [Google Scholar] [CrossRef] [PubMed]
- Blackmon, F.; Antonelli, L. Remote, aerial, trans-layer, linear and non-linear downlink underwater acoustic communication. In Proceedings of the IEEE OCEANS 2006, Boston, MA, USA, 18–21 September 2006. [Google Scholar] [CrossRef]
- Tonolini, F.; Adib., F. Networking across boundaries: Enabling wireless communication through the water-air interface. In Proceedings of the ACM SIGCOMM 2018 ACM Special Interest Group on Data Communication, Budapest, Hungary, 20–25 August 2018; pp. 117–131. [Google Scholar] [CrossRef]
- Qu, F.; Qian, J.; Wang, J.; Lu, X.; Bai, X.; Tu, X.; Wei, Y. Cross-Medium Communication Combining Acoustic Wave and Millimeter Wave: Theoretical Channel Model and Experiments. IEEE J. Ocean. Eng. 2022, 47, 483–492. [Google Scholar] [CrossRef]
- Luo, J.; Liang, X.; Guo, Q.; Zhao, T.; Xin, J.; Bu, X. A Novel Estimation Method of Water Surface Micro-Amplitude Wave Frequency for Cross-Media Communication. Remote Sens. 2022, 14, 22. [Google Scholar] [CrossRef]
- Dong, Y.; Tang, S.; Zhang, X. Effect of Random Sea Surface on Downlink Underwater Wireless Optical Communication. IEEE Commun. Lett. 2013, 17, 2164–2167. [Google Scholar] [CrossRef]
- Antonelli, L.; Kirsteins, I. Bearing estimation error analysis using laser acoustic sensor measurements on a hydrodynamic surface. In Proceedings of the IEEE OCEANS 2000, Providence, RI, USA, 11–14 September 2000. [Google Scholar] [CrossRef]
- Zhang, L.; Zhang, X.; Liu, G.; Tang, W. Laser Interferometric Detection of Water Surface Acoustic Wave Based on Improved Phase-Generated Carrier Wave Demodulation. Chin. J. Lasers 2017, 44, 1–9. [Google Scholar]
- Zhang, L.; Zhang, X.; Tang, W. Amplitude measurement to weak sinusoidal water surface acoustic wave using laser interferometer. Chin. Opt. Lett. 2015, 13, 091202. [Google Scholar] [CrossRef]
- Huang, N.E.; Shen, Z.; Long, S.R. The empirical mode decomposition and the Hilbert spectrum for nonlinear and non-stationary time series analysis. Proc. Math. Phys. Eng. Sci. 1998, 454, 903–995. [Google Scholar] [CrossRef]
- Flandrin, P.; Goncalves, P.; Rilling, G. Detrending and denoising with empirical mode decompositions. In Proceedings of the IEEE European Signal Processing Conference 2014, Vienna, Austria, 6–10 September 2004. [Google Scholar]


Disclaimer/Publisher’s Note: The statements, opinions and data contained in all publications are solely those of the individual author(s) and contributor(s) and not of MDPI and/or the editor(s). MDPI and/or the editor(s) disclaim responsibility for any injury to people or property resulting from any ideas, methods, instructions or products referred to in the content. |
© 2023 by the authors. Licensee MDPI, Basel, Switzerland. This article is an open access article distributed under the terms and conditions of the Creative Commons Attribution (CC BY) license (https://creativecommons.org/licenses/by/4.0/).