Article

Evaluating Pavement Lane Markings in Metropolitan Road Networks with a Vehicle-Mounted Retroreflectometer and AI-Based Image Processing Techniques

1
Department of Civil Engineering, Induk University, 12 Choansan-ro, Nowon-gu, Seoul 01878, Republic of Korea
2
Department of Civil Engineering, Sangmyung University, 31 Sangmyeongdae-gil, Dongnam-gu, Cheonan-si 31066, Republic of Korea
*
Author to whom correspondence should be addressed.
Remote Sens. 2023, 15(7), 1812; https://doi.org/10.3390/rs15071812
Submission received: 15 February 2023 / Revised: 22 March 2023 / Accepted: 27 March 2023 / Published: 28 March 2023
(This article belongs to the Special Issue Road Detection, Monitoring and Maintenance Using Remotely Sensed Data)

Abstract

:
The objectives of this study were to evaluate pavement lane markings in a metropolitan road network and to develop a maintenance strategy for safe daytime and night-time driving. To achieve this, data on the retroreflectivity and physical defect ratio of lane markings were collected remotely using a vehicle-mounted retroreflectometer and high-resolution camera. The retroreflectivity was measured and analyzed by road type (city freeways, arterial roads, and collector roads) and by lane color (yellow, white, and blue) over a total length of 6790.34 km. The results indicate that the retroreflective performance deteriorates the most in the case of white lanes, regardless of the road classification, especially in the case of the first white lane. Additionally, the physical defects of lane markings were investigated over a total length of 502.82 km and categorized by road classification and lane color. Mask R-CNN and the Otsu Threshold method were used to automatically calculate the ratios of the defects. The results indicate that city freeways show a lower defect ratio than arterial and collector roads for all colors. Moreover, there is no significant difference between the white lanes for all types of roads. The distribution trends and relationship between retroreflectivity and the defect ratios were discussed according to the road type and lane color, and a method for selecting maintenance priority was suggested. The results show that the number of lanes requiring the restoration of retroreflectivity increases as the defect ratio increases. Therefore, we suggest prioritizing maintenance work on the lanes with a higher ratio of defects, covering a higher proportion of low-retroreflectivity sections. In addition, the unit length for data averaging can be adjusted to improve the work efficiency.

1. Introduction

Pavement lane markings play a vital role in traffic management by providing drivers with visual guidance and information on regulations and instructions, thus promoting traffic safety and communication. Previous studies have shown that the degraded performance of lane markings, including the center line, can contribute to an increase in the number of traffic accidents of up to 40% [1]. It is crucial that the pavement lane markings are installed in a way that maximizes their functionality, allowing road users to easily distinguish them. To ensure visibility during both day and night, regular maintenance and management processes are required. The visibility of pavement lane markings during the day is impacted by the level of physical damage of the marking area, while night-time visibility is dependent on the retroreflective performance of the markings. In particular, the retroreflective performance is reported to have a high correlation with night-time traffic accidents [2,3].
The purpose of lane marking systems on road pavements is to provide drivers with the visual information and guidance they need for safe vehicle operation. While the colored paint renders the lane markings easily visible during the day, it may be difficult to recognize the marking systems at night. To improve visibility during night-time driving, glass beads can be applied to the surface of the painted area or directly mixed into the paint, which increases the retroreflectivity of the markings at night [4,5]. Retroreflectivity is the phenomenon whereby light from a vehicle’s headlights is reflected off of the pavement markings and back to the driver’s field of view. This is achieved when light enters the glass beads on the pavement and is refracted back as a source of light. The retroreflective performance of pavement lane markings can be expressed using the coefficient of retroreflected luminance (RL), as follows:
R L = L E L = mcd / m 2 lux = mcd / lux · m 2
where L is luminance observed (unit: mcd/m2) and EL is illuminance perpendicular to the source (unit: lux).
The longevity of pavement lane markings refers to the amount of time during which they are able to effectively provide guidance and information to road users. However, the lifespan of painting materials can vary significantly depending on factors such as the type of surface they are applied to, the climate, and usage conditions [6]. In other words, the retroreflectivity performance of pavement lane markings can gradually decrease due to factors such as increased traffic volume and repetitive lane changes by vehicles, as well as the characteristics of the materials. This can result in a performance that falls below a threshold that can easily be distinguished by drivers. Previous research has determined the service life of pavement lane markings by measuring how long it takes for their retroreflective properties to drop below a certain level or by monitoring their durability (i.e., the amount of material loss) as a method for evaluating performance [7,8,9]. Figure 1a,b shows examples of lane marking and their visual distinction at night according to their retroreflectivity performance.
The degree of physical deterioration of pavement lane markings is important for safe driving during the day. Pavement lane markings can become worn and damaged due to factors such as vehicular friction, rendering them less visible and potentially dangerous for drivers. To ensure road safety, road agencies and governments work to maintain pavement lane markings in a good condition, but this requires manual inspections by trained professionals. This process can be time-consuming and resource-intensive. To address these problems, a vision-based inspection method using vehicle-mounted cameras has been introduced [10,11,12]. However, this method poses a challenge in that it requires handling of a large amount of data. To address this issue, automated techniques using machine learning have been developed to analyze the data more efficiently and provide preliminary results [13]. As one of the widely adopted techniques, advanced CNN (convolutional neural network) methods have been utilized to investigate the deteriorated conditions of pavement lane markings [14].
CNNs are based on an image recognition technique that mimics the visual processing of living organisms. They are able to recognize patterns regardless of their size or position. CNNs consist of an input and output layer, one or more convolution layers, pooling layers, and fully connected layers. They receive an image as the input and extract filtered features for learning through convolution layers. CNNs provide a high accuracy in classification but are subject to the limitation of being able to classify only one object per input image. R-CNN (Regions with CNN) is an algorithm developed for multi-object detection. It identifies numerous object candidates in the input image and detects features by inputting them into a CNN. The detected features are then classified by a classifier such as support vector machine (SVM), and bounding boxes are drawn for each object in the image using techniques such as non-maximum suppression (NMS). The developer of R-CNN improved the algorithm’s shortcomings and speed through Fast R-CNN, which is faster and more efficient than R-CNN. It does not require the input image to be resized or a separate CNN for each object, thus reducing the computation. Instead, it extracts features by performing convolution directly on the input image data in the convolutional layer. Faster R-CNN is an algorithm that improves upon R-CNN by adding a new network called the Region Proposal Network (RPN) to search for the object’s location, thus eliminating the need for the Selective Search algorithm and reducing the analysis time [15]. Faster R-CNN enhances the speed of multi-object detection in images by incorporating improvements on the original R-CNN. This is achieved by adopting an RPN that proposes object candidates and a classification network that shares feature maps, resulting in a faster detection performance compared to the traditional methods. The Mask R-CNN algorithm is a model that can simultaneously perform object detection, classification, and instance segmentation, which is the ability to distinguish the boundaries of each object in an image, by extending Faster R-CNN. It has the ability to apply a mask to the object’s shape based on the detection box shape in Faster R-CNN. In the Faster R-CNN step, the class classification is already completed; thus, it is relatively easy to perform instance segmentation. In a previous study, it was reported that when using this method to automatically detect and evaluate pavement lane marking, it shows acceptable reliability [14].
The objectives of this study were to evaluate the condition of pavement lane markings within a metropolitan road network and propose a comprehensive maintenance strategy to ensure safe driving conditions during both daytime and night-time. To accomplish these goals, remote data collection on the retroreflectivity and physical defects of lane markings was conducted using vehicle-mounted equipment. Initially, retroreflectivity, a crucial factor for night-time driving safety, was examined and analyzed by categorizing the data based on the road types, including city freeways (CF), arterial roads (AR), and collector roads (CR), as well as lane colors such as yellow, white, and blue. The total length of the analyzed road network amounted to 6790.34 km. Subsequently, the investigation of the physical defects of lane markings was carried out over a total length of 502.82 km, with categorization based on the road classification and lane color. To automate the calculation of defect ratios, an AI (artificial intelligence)-based image processing technique, Mask R-CNN, was utilized in conjunction with the Otsu Threshold method. Lastly, distribution patterns and correlations between the retroreflectivity and defect ratios were examined in relation to the road type and lane color. Based on these findings, a methodology for determining maintenance priorities was proposed.

2. Field Investigation Program

2.1. Investigation Plan

In this study, the conditions of pavement lane markings in the Seoul metropolitan area were assessed by investigating and analyzing their retroreflectivity and defect ratios. Approximately 6790 km (converted to the single-lane equivalent) of lane markings was examined. Based on the road classification, CF accounted for 1562.62 km, AR accounted for 2774.69 km, and CR accounted for 2453.03 km. Additionally, in terms of color, 2204.32 km were yellow lanes, 4359.01 km were white lanes, and 227.01 km were blue lanes. In addition, the defect ratio was calculated by scanning a total of 502.82 km, including 74.52 km of CF, 225.47 km of AR, and 202.83 km of CR. Out of this total, 173.67 km were yellow lanes and 329.14 km were white lanes. The defect ratio of blue lane markings was not assessed. To investigate the correlation between the two factors, it was crucial to ensure that both retroreflectivity and defect ratio measurements were obtained from the same set of lane markings. Consequently, for this comparison, a 502.82 km segment was selected for retroreflectivity measurements from the total 6790 km length that was initially examined. The information is summarized in Table 1.

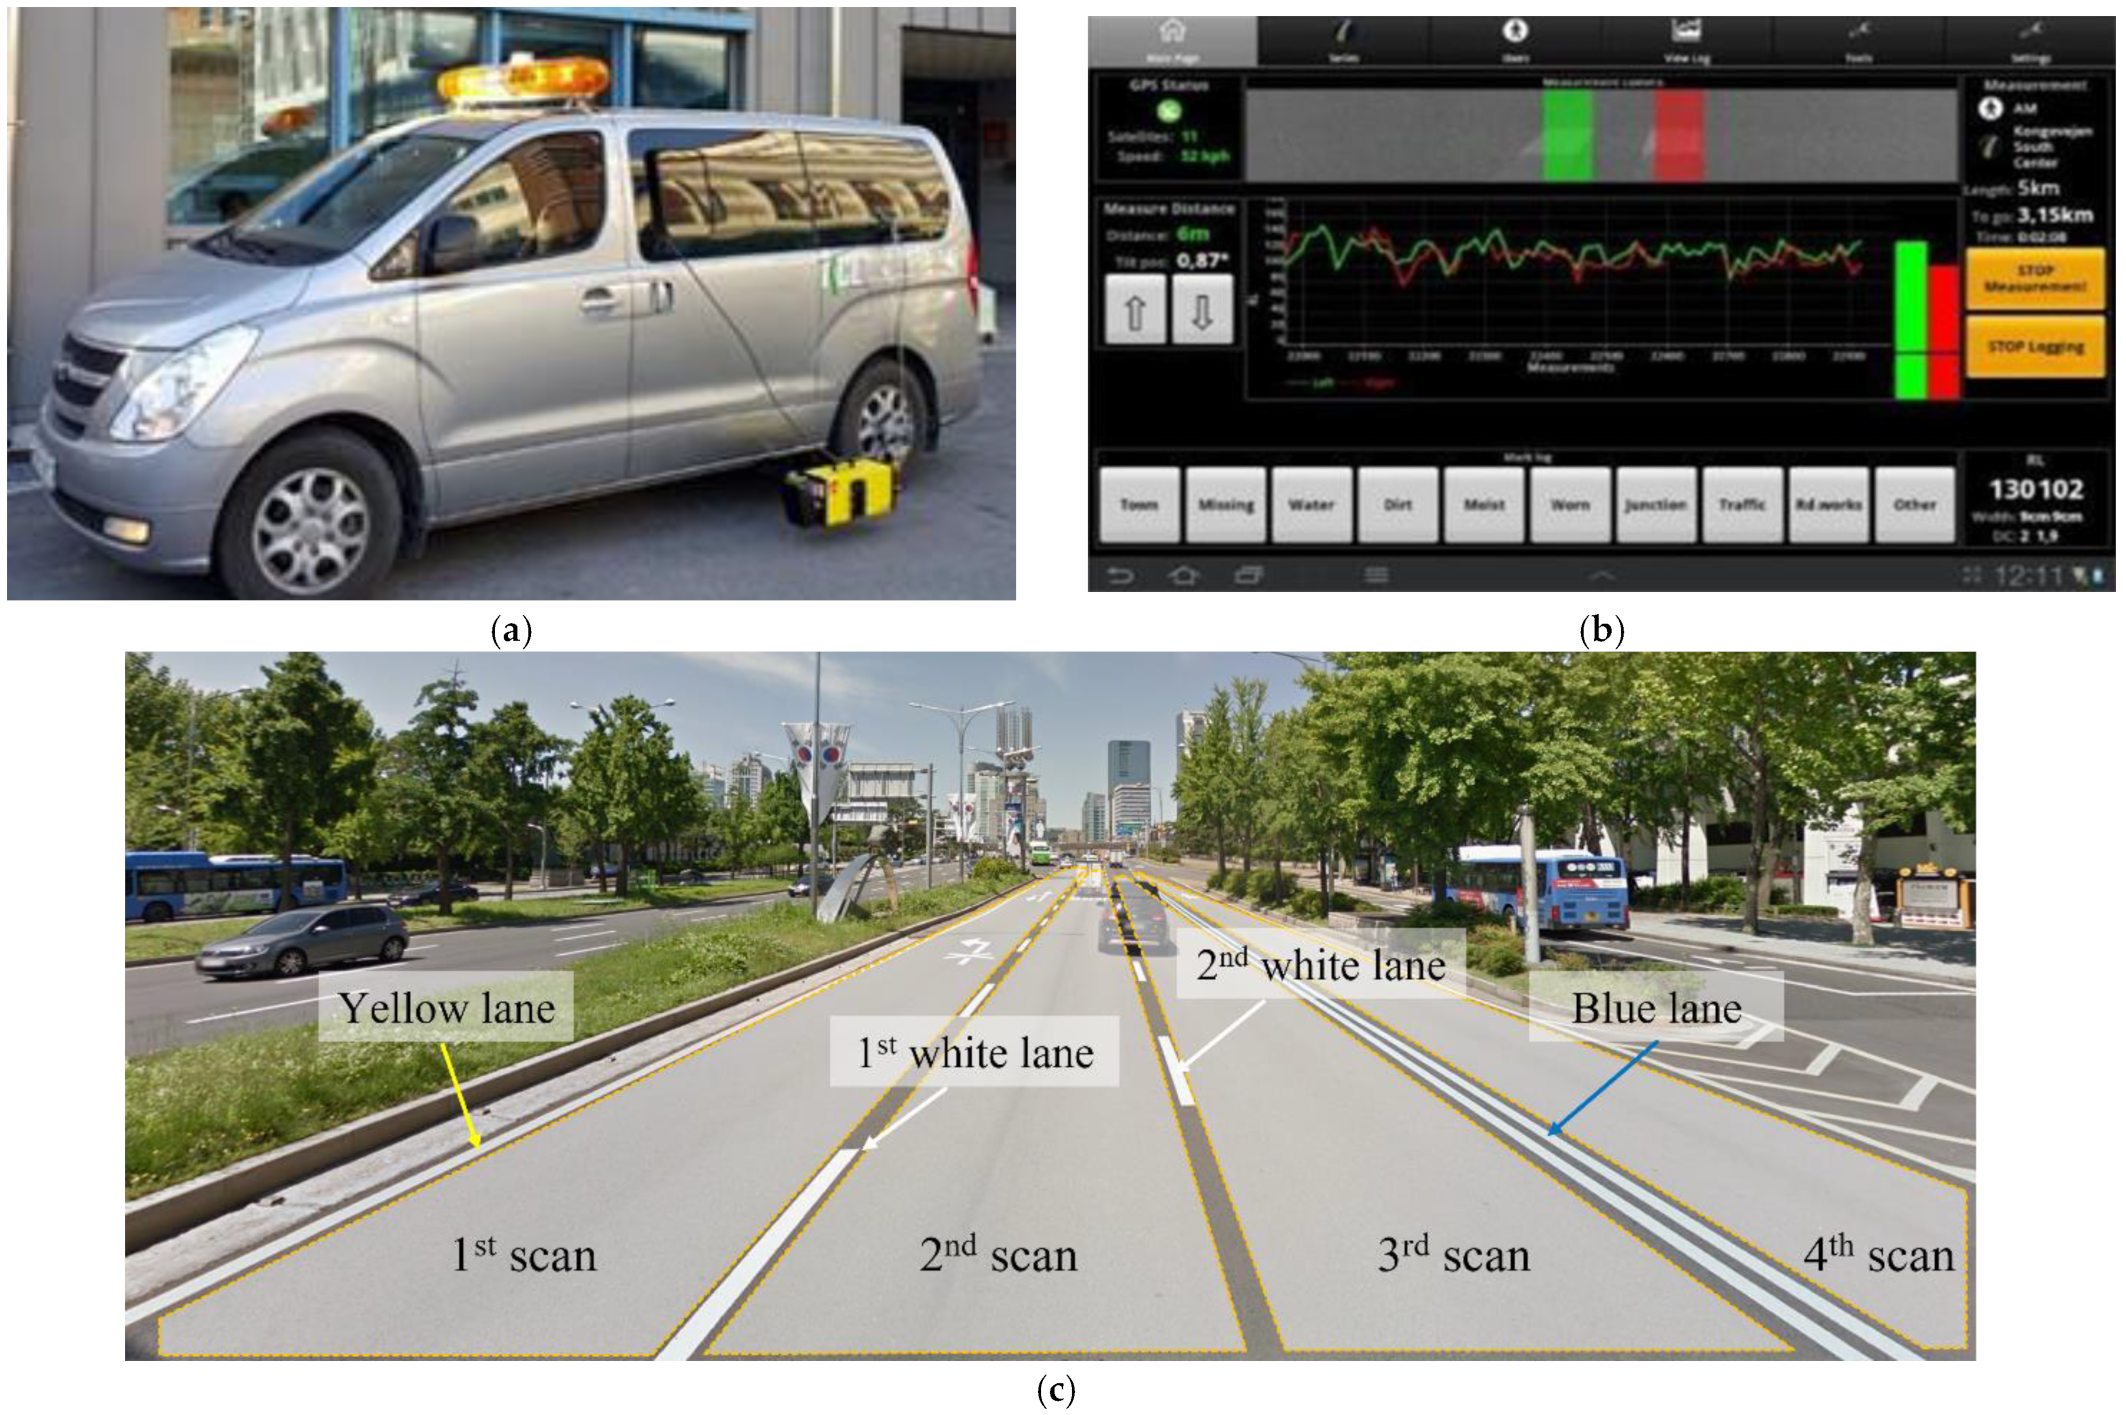
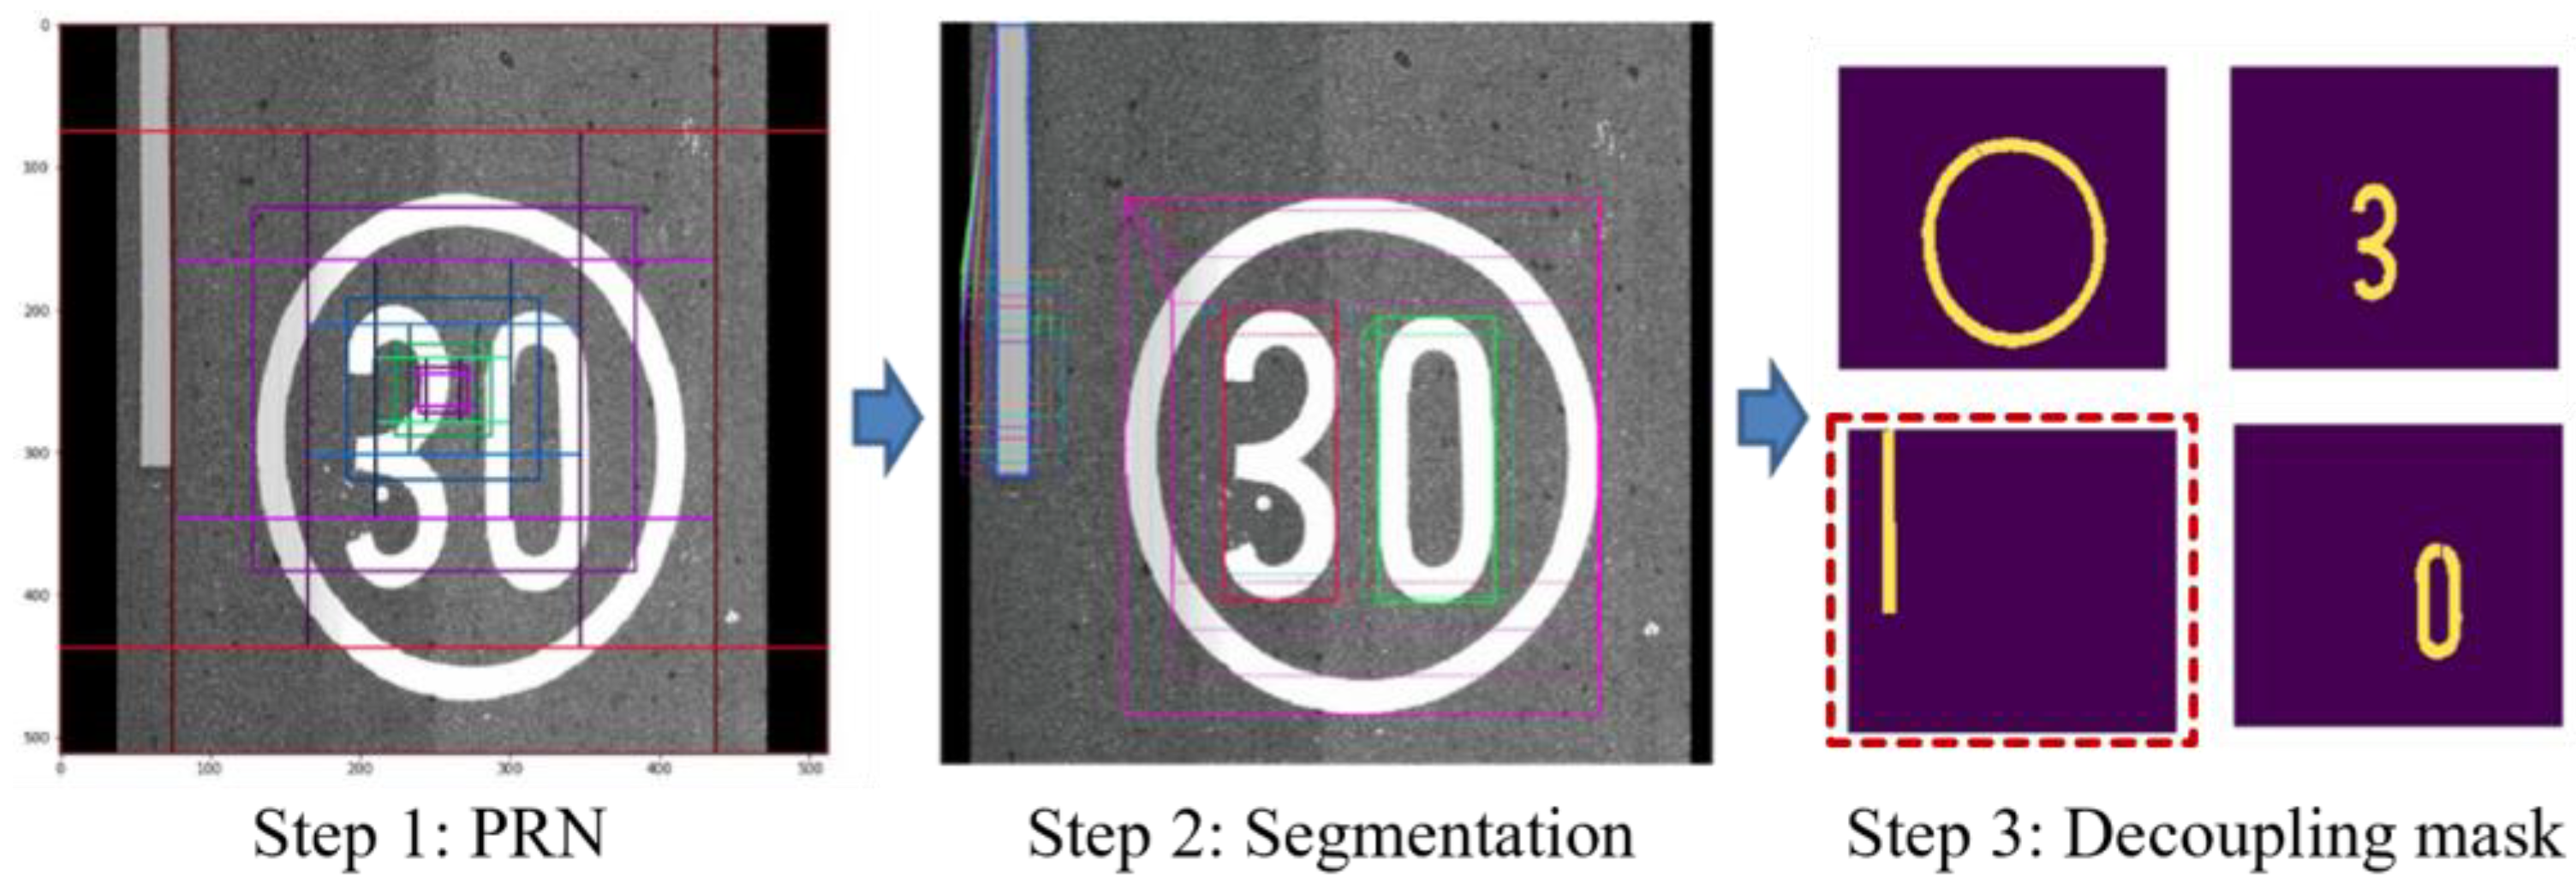
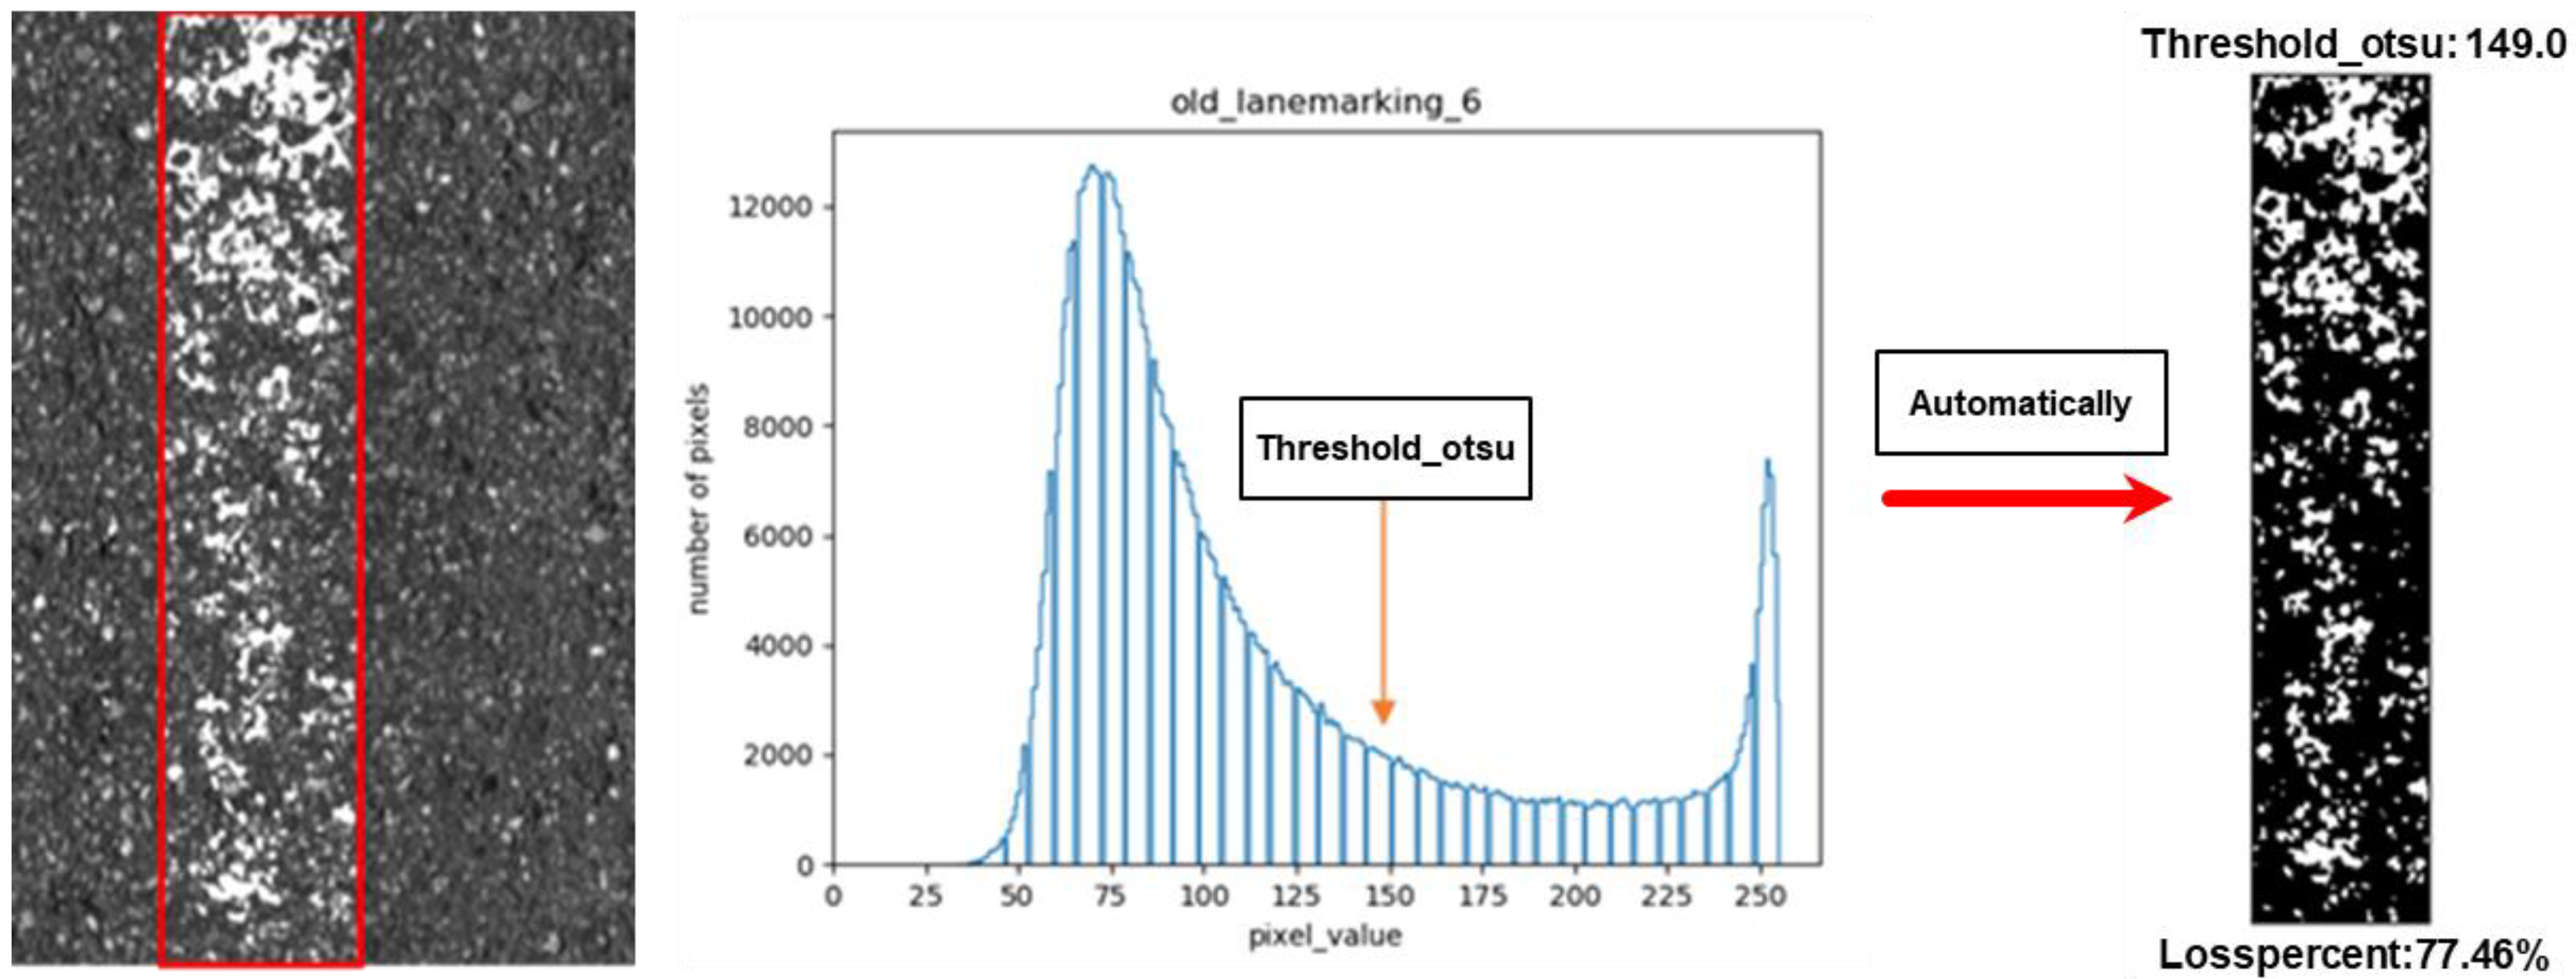
2.2. Investigation Methods

Figure 2 presents the condition immediately after painting and the condition of the white and yellow lane markings in use. As shown in Figure 2b,d, it is expected that the retroreflectivity will decrease due to surface contamination and the wearing of the glass beads on the lanes, caused by friction between tires and the uneven surfaces. In this study, a vehicle-mounted retroreflectometer was used to assess lane retroreflectivity in a safe, efficient, and timely manner across a total distance of 6712 km. As shown in Figure 3a, the system was mounted on the left side of the vehicle and scanned the left lane during driving. The retroreflectometer used in this study has a measurement range of 40–2000 mcd/(lux·m2) and is capable of measuring an area of 1 × 1 m per scan. Figure 3b shows the information screen monitored in real time inside the vehicle. The monitoring system displays the scanned distance, corresponding GPS (Global Positioning System) coordinate, and measured retroreflectivity of the lane markings as a graph. In this investigation, the data were continuously collected based on the surrounding traffic flow, and the results were automatically obtained by calculating the average value of the retroreflectivity measured every 10 m. Figure 3c shows an example of four-lane road scanning. The yellow lane on the left was measured in the first scan, the white lanes were subsequently measured in the second and third scans, and the blue lane was measured in the fourth scan. The rightmost lane was not scanned in the investigation program.
Regular calibration by an accredited institution is essential to ensure the accuracy and reliability of retroreflectometers. However, this calibration process only accounts for measurements taken in a stationary state and not those taken during movement. To confirm the reliability of the measurement method adopted in this study, 28 sections were selected, and differences between the stationary and driving measurements of the retroreflectivity of lane markings were examined. As shown in Figure 4, the data were analyzed using first-order linear regression analysis. The results show that the values measured using the handheld type are higher compared to those taken using the vehicle-mounted type, with a linear regression coefficient of 1.18 and an R2 value of 0.96. Previous studies have reported that there is no significant difference between measurements taken by a vehicle-mounted retroreflectometer and a handheld type [16,17]. Therefore, in this study, the retroreflectivity values measured via the vehicle-mounted equipment were used and analyzed without any conversion process.
In this study, an AI-based image processing approach was employed for the analysis of lane marking defects. Two-dimensional images with a resolution of 1.0 mm2 per pixel were continuously collected using a vehicle-mounted scanner in normal traffic flow conditions. To identify the lane marking objects in the acquired images and accurately detect their boundaries, Mask R-CNN, a type of neural network algorithm, was utilized. The AI model was trained using a dataset of over 20,000 based on Seoul’s PMS (pavement management system). Figure 5 demonstrates an example of the method used to extract lane markings from a 2D road surface image.
Physical defects of lane markings include any cracks, contamination, or peeling that can be observed, as well as any other defects that can be identified in the images. These physical defects can be broadly separated into two categories: peeling, where the coating has completely worn off and the surface is visible, and changes in brightness caused by pollution or the fading of the lane markings’ color. The vehicle-mounted road surface scanner captures images of the lane markings using laser-based cameras, which are then presented as grayscale images. By applying a specific threshold to these images, they can be converted into binary images, allowing for the accurate calculation of the percentage of physical defects of the lane markings. However, due to factors such as lighting conditions, the brightness and contrast of the images may vary, making it difficult to consistently apply specific threshold values. To overcome this problem, in this field investigation, we used the Otsu Threshold method, which is a statistical method for identifying the optimal threshold for dividing a grayscale image into black and white, resulting in a clearer boundary between the healthy and defective parts of the lane markings. The Otsu Threshold method is a method of image thresholding which is used to separate the foreground and background of an image [18,19]. It automatically determines the threshold value based on the image’s histogram, such that the threshold separates the image into two classes with maximal inter-class variance.
Therefore, the procedure for analyzing the defect ratio using the image of the pavement lane markings in this paper is as follows: (1) the extraction of the pavement lane marking images using Mask R-CNN, (2) conversion of the extracted images into histograms, (3) determination of the threshold using the Otsu Threshold method to distinguish between physical defects and normal parts, (4) representation of the images as binary images, and (5) the calculation of the area of black pixels in the binary images to measure the physical defects and calculate the ratio of defects to the total area (see Figure 6).
In this study, the method for automatically calculating the defect ratio of pavement lane marking was verified by comparison with the manually analyzed defect ratio using the image shown in Figure 7. As a result, when analyzing the defect ratio in the images using the Otsu Threshold method, a 7.16% defect ratio was calculated, and with manual calculation, the defect ratio was 7.03%. In other words, an error of less than 2% was identified, thus confirming the accuracy of the Otsu Threshold method.

3. Results and Discussion

To enhance the organization and clarity of the experimental results, here, we present the information in a coherent manner. We begin by introducing the primary factors (i.e., the retroreflectivity and defect ratios) of pavement lane markings analyzed, including the road classifications and color types. Next, we discuss the results by comparing the retroreflectivity values and defect ratios between different road classifications and color types. In addition, we discuss the relationship between the traffic volume and retroreflectivity while examining the factors that influence the quality of lane markings.

3.1. Retroreflectivity

Figure 8 illustrates the average retroreflectivity of the lane markings classified by road type, with ratios lower than the repainting criteria (i.e., yellow lanes: 70 mcd/(lux∙m2), white lanes: 100 mcd/(lux∙m2), and blue lanes: 40 mcd/(lux∙m2) [20]). The yellow-colored center lane (Figure 8a) has an average value of 153.33 mcd/(lux∙m2) for CF, with a ratio 17.1% below the repainting criterion. On the other hand, the average values for AR and CR are 95.43 and 105.64, respectively, with ratios 39.3% and 38.0% below the criterion of 70 mcd/(lux∙m2). The average retroreflectivity of the white lanes by road classification is shown in Figure 8b. CF has the highest value, at 167.2 mcd/(lux∙m2), while AR and CR have values of 112.3 and 113.0, respectively. The ratios of white lanes are 43%, 48%, and 55% below the repainting criterion for CF, AR, and CR, respectively. This difference may be due to the reduced frequency of lane changes by vehicles driving on CF compared to AR and CR, leading to less wear of the glass beads due to tire friction. Lastly, Figure 8c presents the average retroreflectivity values by road classification and the ratios below the repainting criterion for blue lanes. Blue lanes are typically the rightmost lanes in the road system in Seoul and are designated for buses only. These bus-only lanes are primarily operated on AR and some CR but not CF. The average retroreflectivity values measured for AR and CR were 108 mcd/(lux∙m2) and 99.41 mcd/(lux∙m2), and the ratios were determined to be 21% and 23% below the repainting criteria, respectively. Since other types of vehicles are not permitted in bus-only lanes, the ratio below the criteria is considered to be low, as these vehicles are unable to intrude into blue lanes while driving. Although the repainting criterion for blue lanes is 40 mcd/(lux∙m2), which is much lower than that of white lanes (100 mcd/(lux∙m2)), the measured average retroreflectivity values of the white and blue lanes are similar in the cases of both AR and CR, suggesting that the loss of the retroreflective function of white lanes is relatively significant under routine traffic conditions.
Figure 9 shows the measured average retroreflectivity of white lines for each road type. While there are multiple white lanes on a road depending on its design, there are typically only one yellow lane and one blue lane. In this study, to investigate the retroreflective characteristics of each white lane, one-way five-lane roads for CF and AR and three-lane roads for CR were considered. The results indicate that the average retroreflectivity of the first white lane on CF, 110.5 mcd/(lux∙m2), is lower than that of the other lanes. This can be interpreted as causing a significant loss of retroreflective function of the road when vehicles change lanes at high speeds to enter the first lane in order to pass a vehicle on the highway. The other lanes of CF exhibit relatively high retroreflective values, ranging from 194.6 mcd/(lux∙m2) to 244.2 mcd/(lux∙m2). These results indicate that there is a difference in visibility between white lanes on CF during night-time driving. On the other hand, AR and CR present the similar values, regardless of the number of lanes, which we understand to be due to frequent lane changes, without a specific pattern for all lanes in the Seoul area with heavy traffic.
Eight sections of city highways in the Seoul area were selected for an investigation of the relationship between the traffic volume and average retroreflectivity of white lanes. As shown in Figure 10, sections 5 and 6 had relatively low measured average retroreflective values of 129 mcd/(lux∙m2) and 137 mcd/(lux∙m2), respectively, with the highest monthly average daily traffic (MADT) value of approximately 250,000 for both sections. However, sections 2, 4, and 8, which had relatively low MADTs of around 100,000, showed relatively higher retroreflectivity values of 190 mcd/(lux∙m2), 197 mcd/(lux∙m2), and 185 mcd/(lux∙m2), respectively. This demonstrates a meaningful relationship between the average retroreflectivity of white lanes and the traffic volume, with retroreflectivity decreasing as the traffic volume increases.

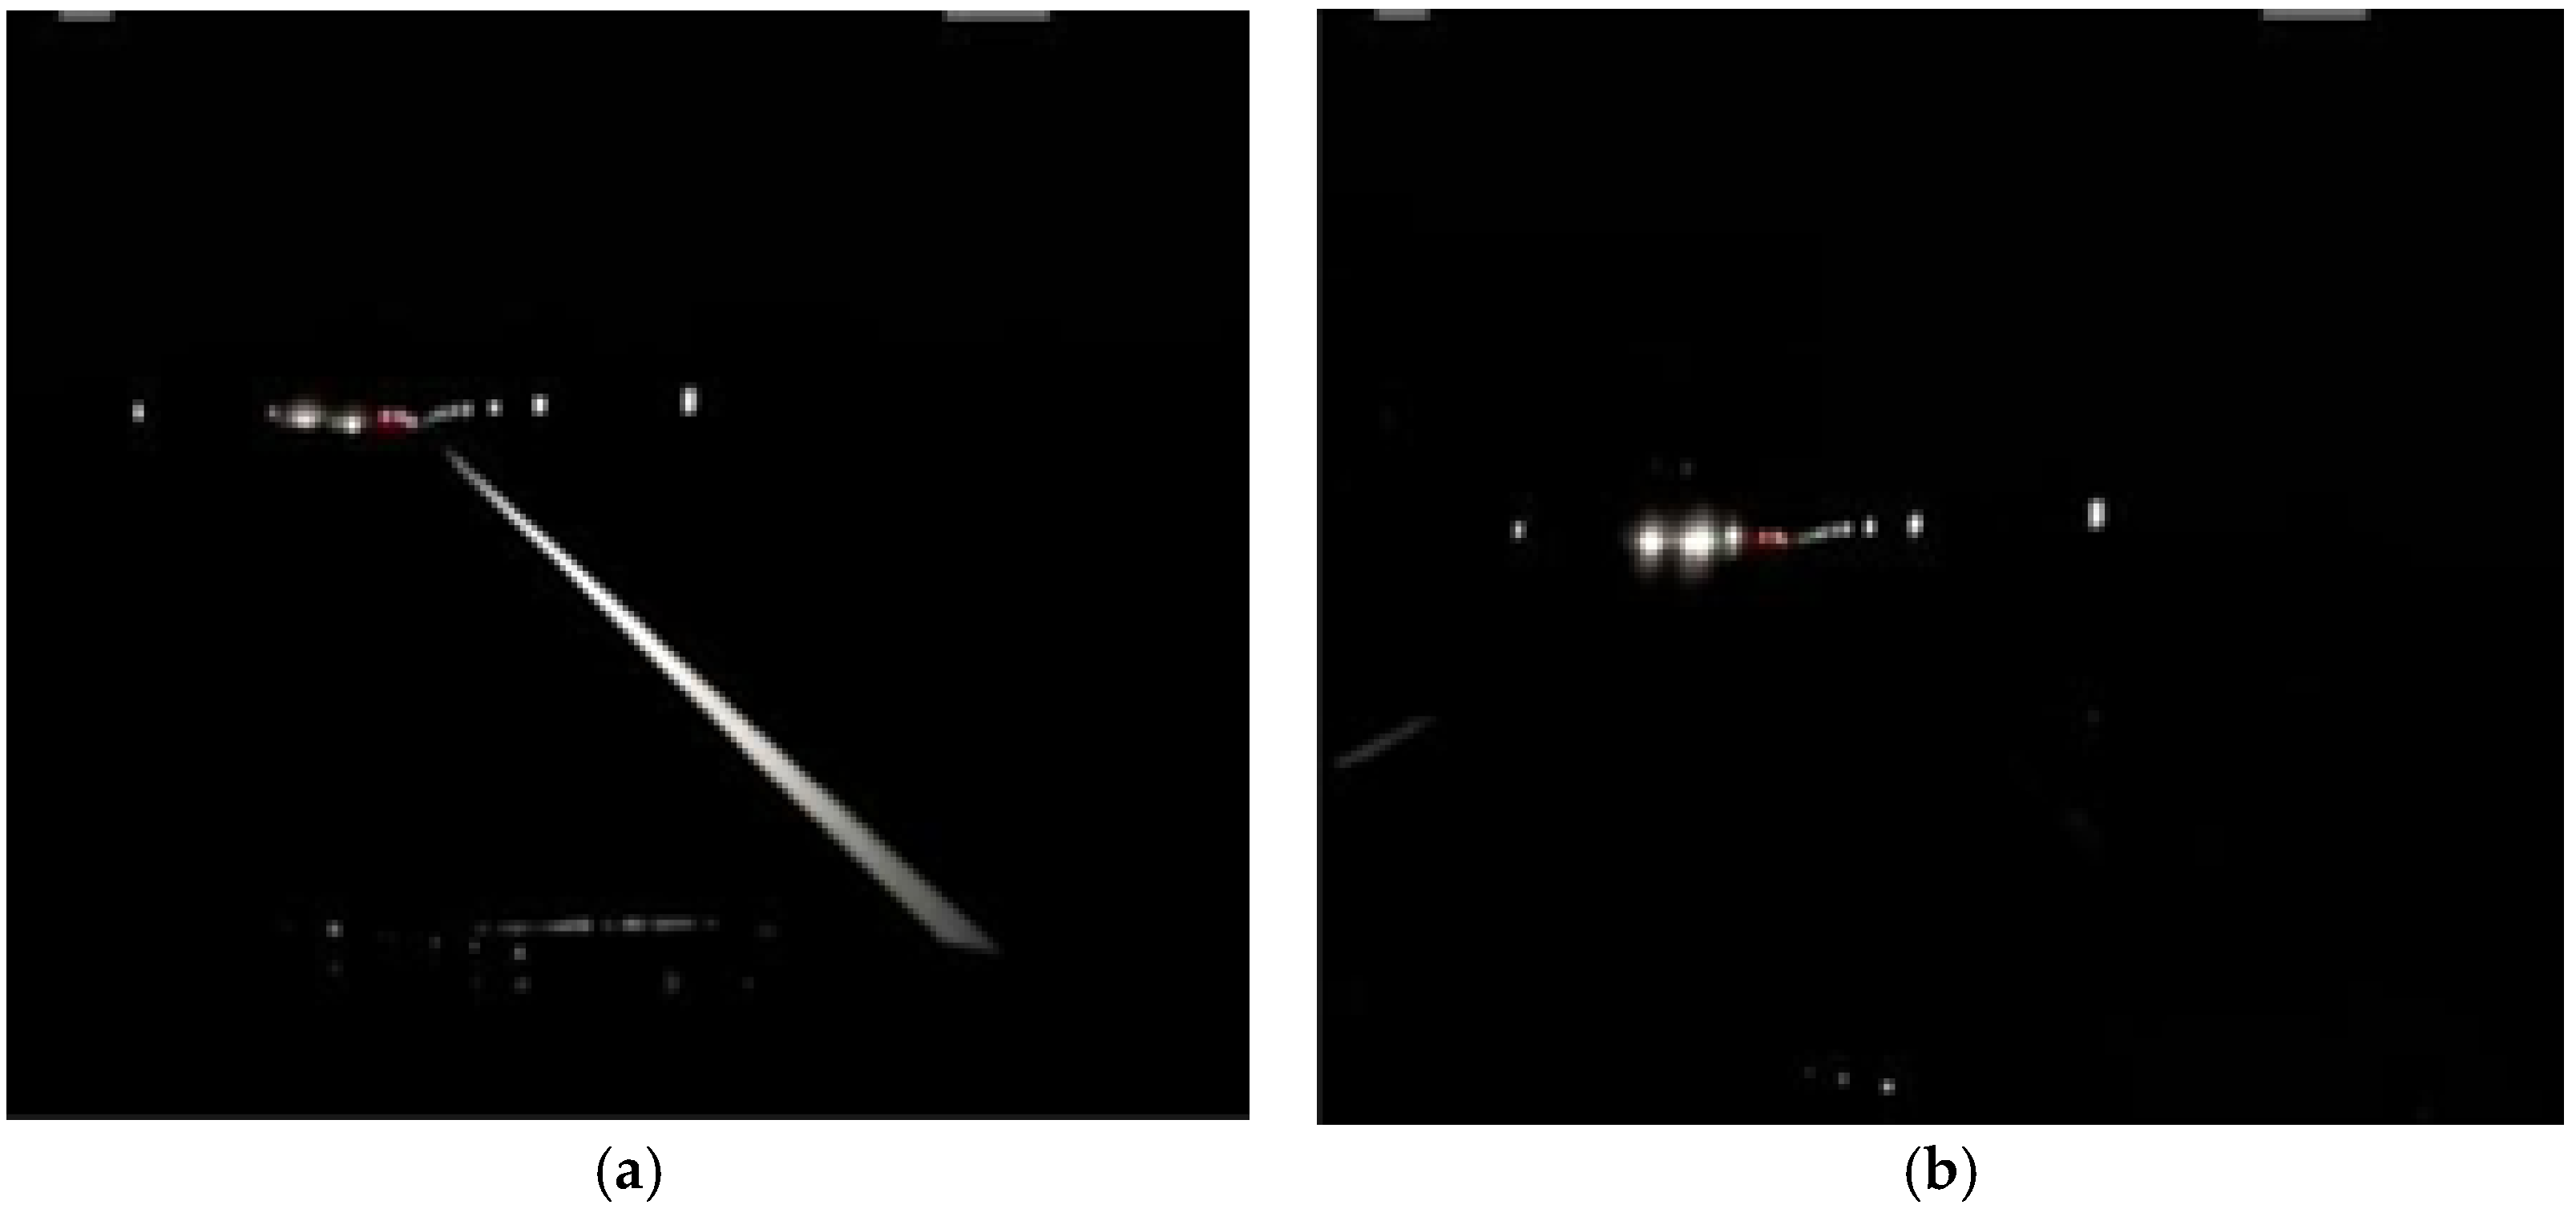
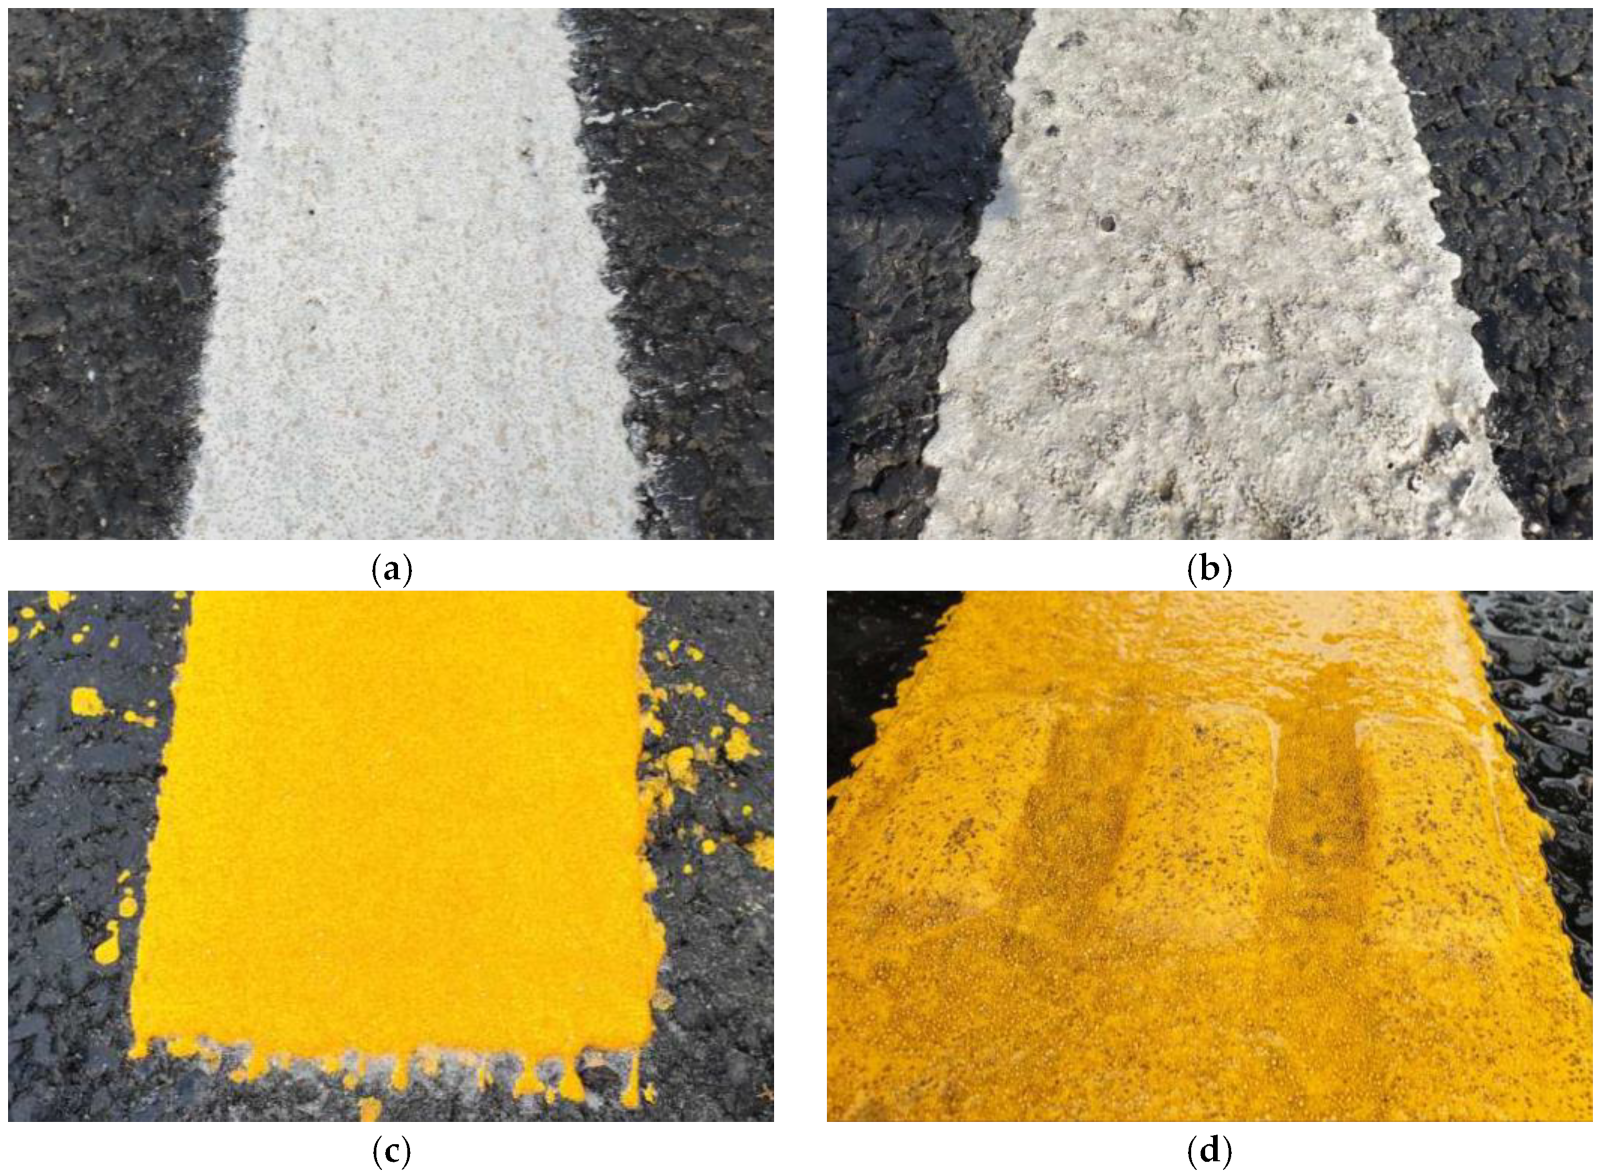
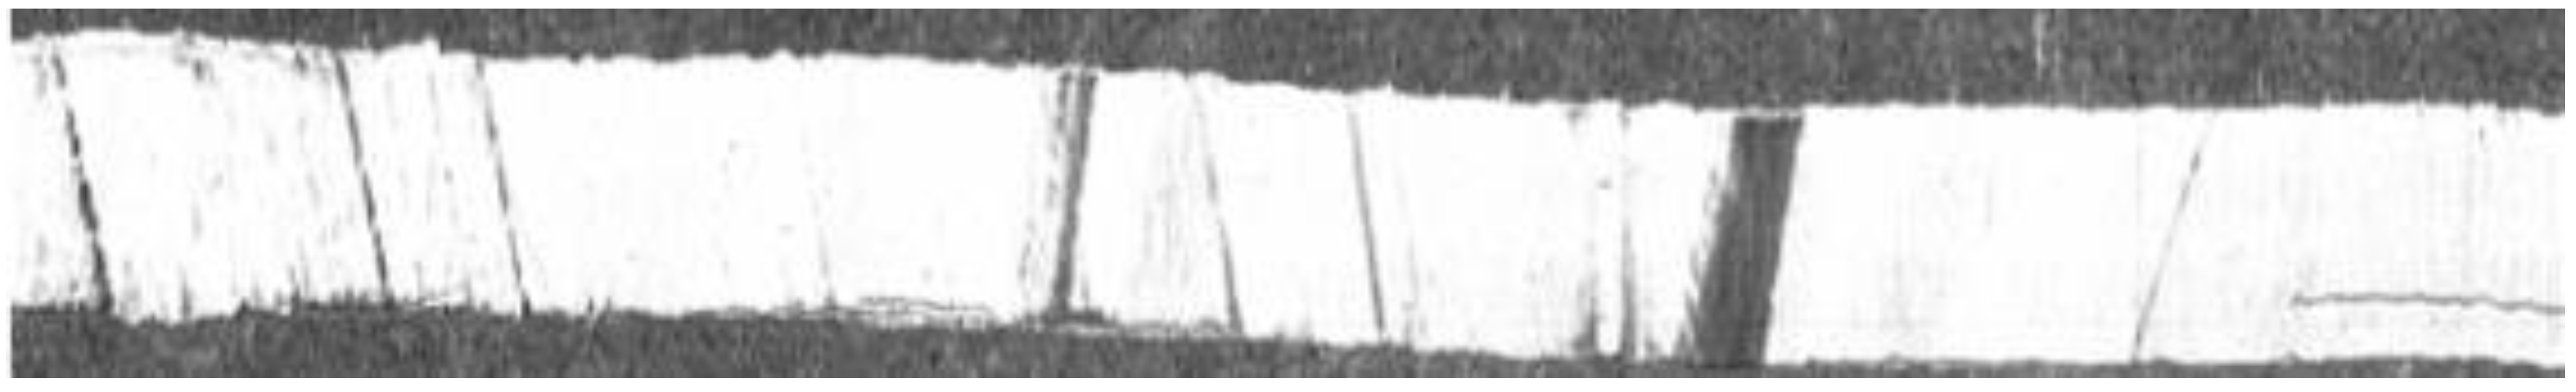
3.2. Lane Marking Defects

The automatically computed defect ratios of pavement lane markings are shown in Figure 11. Figure 11a displays the average defect ratios by road classification for yellow and white lanes. The CF shows defect ratios of 2.1% for yellow lanes and 3.84% for white lanes, while the AR and CR have similar ratios ranging from 6.03% to 6.57%. Figure 11b presents the defect ratios by the number of white lanes and road classification. The rightmost lane of CF exhibits a relatively low ratio of 2.52%, but the other white lanes have similar ratios of defects ranging from 3.73% to 4.09%. For AR and CR, the defect ratios are similar, between 5.82% and 6.52%, regardless of the number of lanes or road type. These results suggest that CF maintains better painting conditions compared to AR and CR, but there is no significant difference between the white lanes according to a specific road type, implying similar visibility for road users during daytime driving.

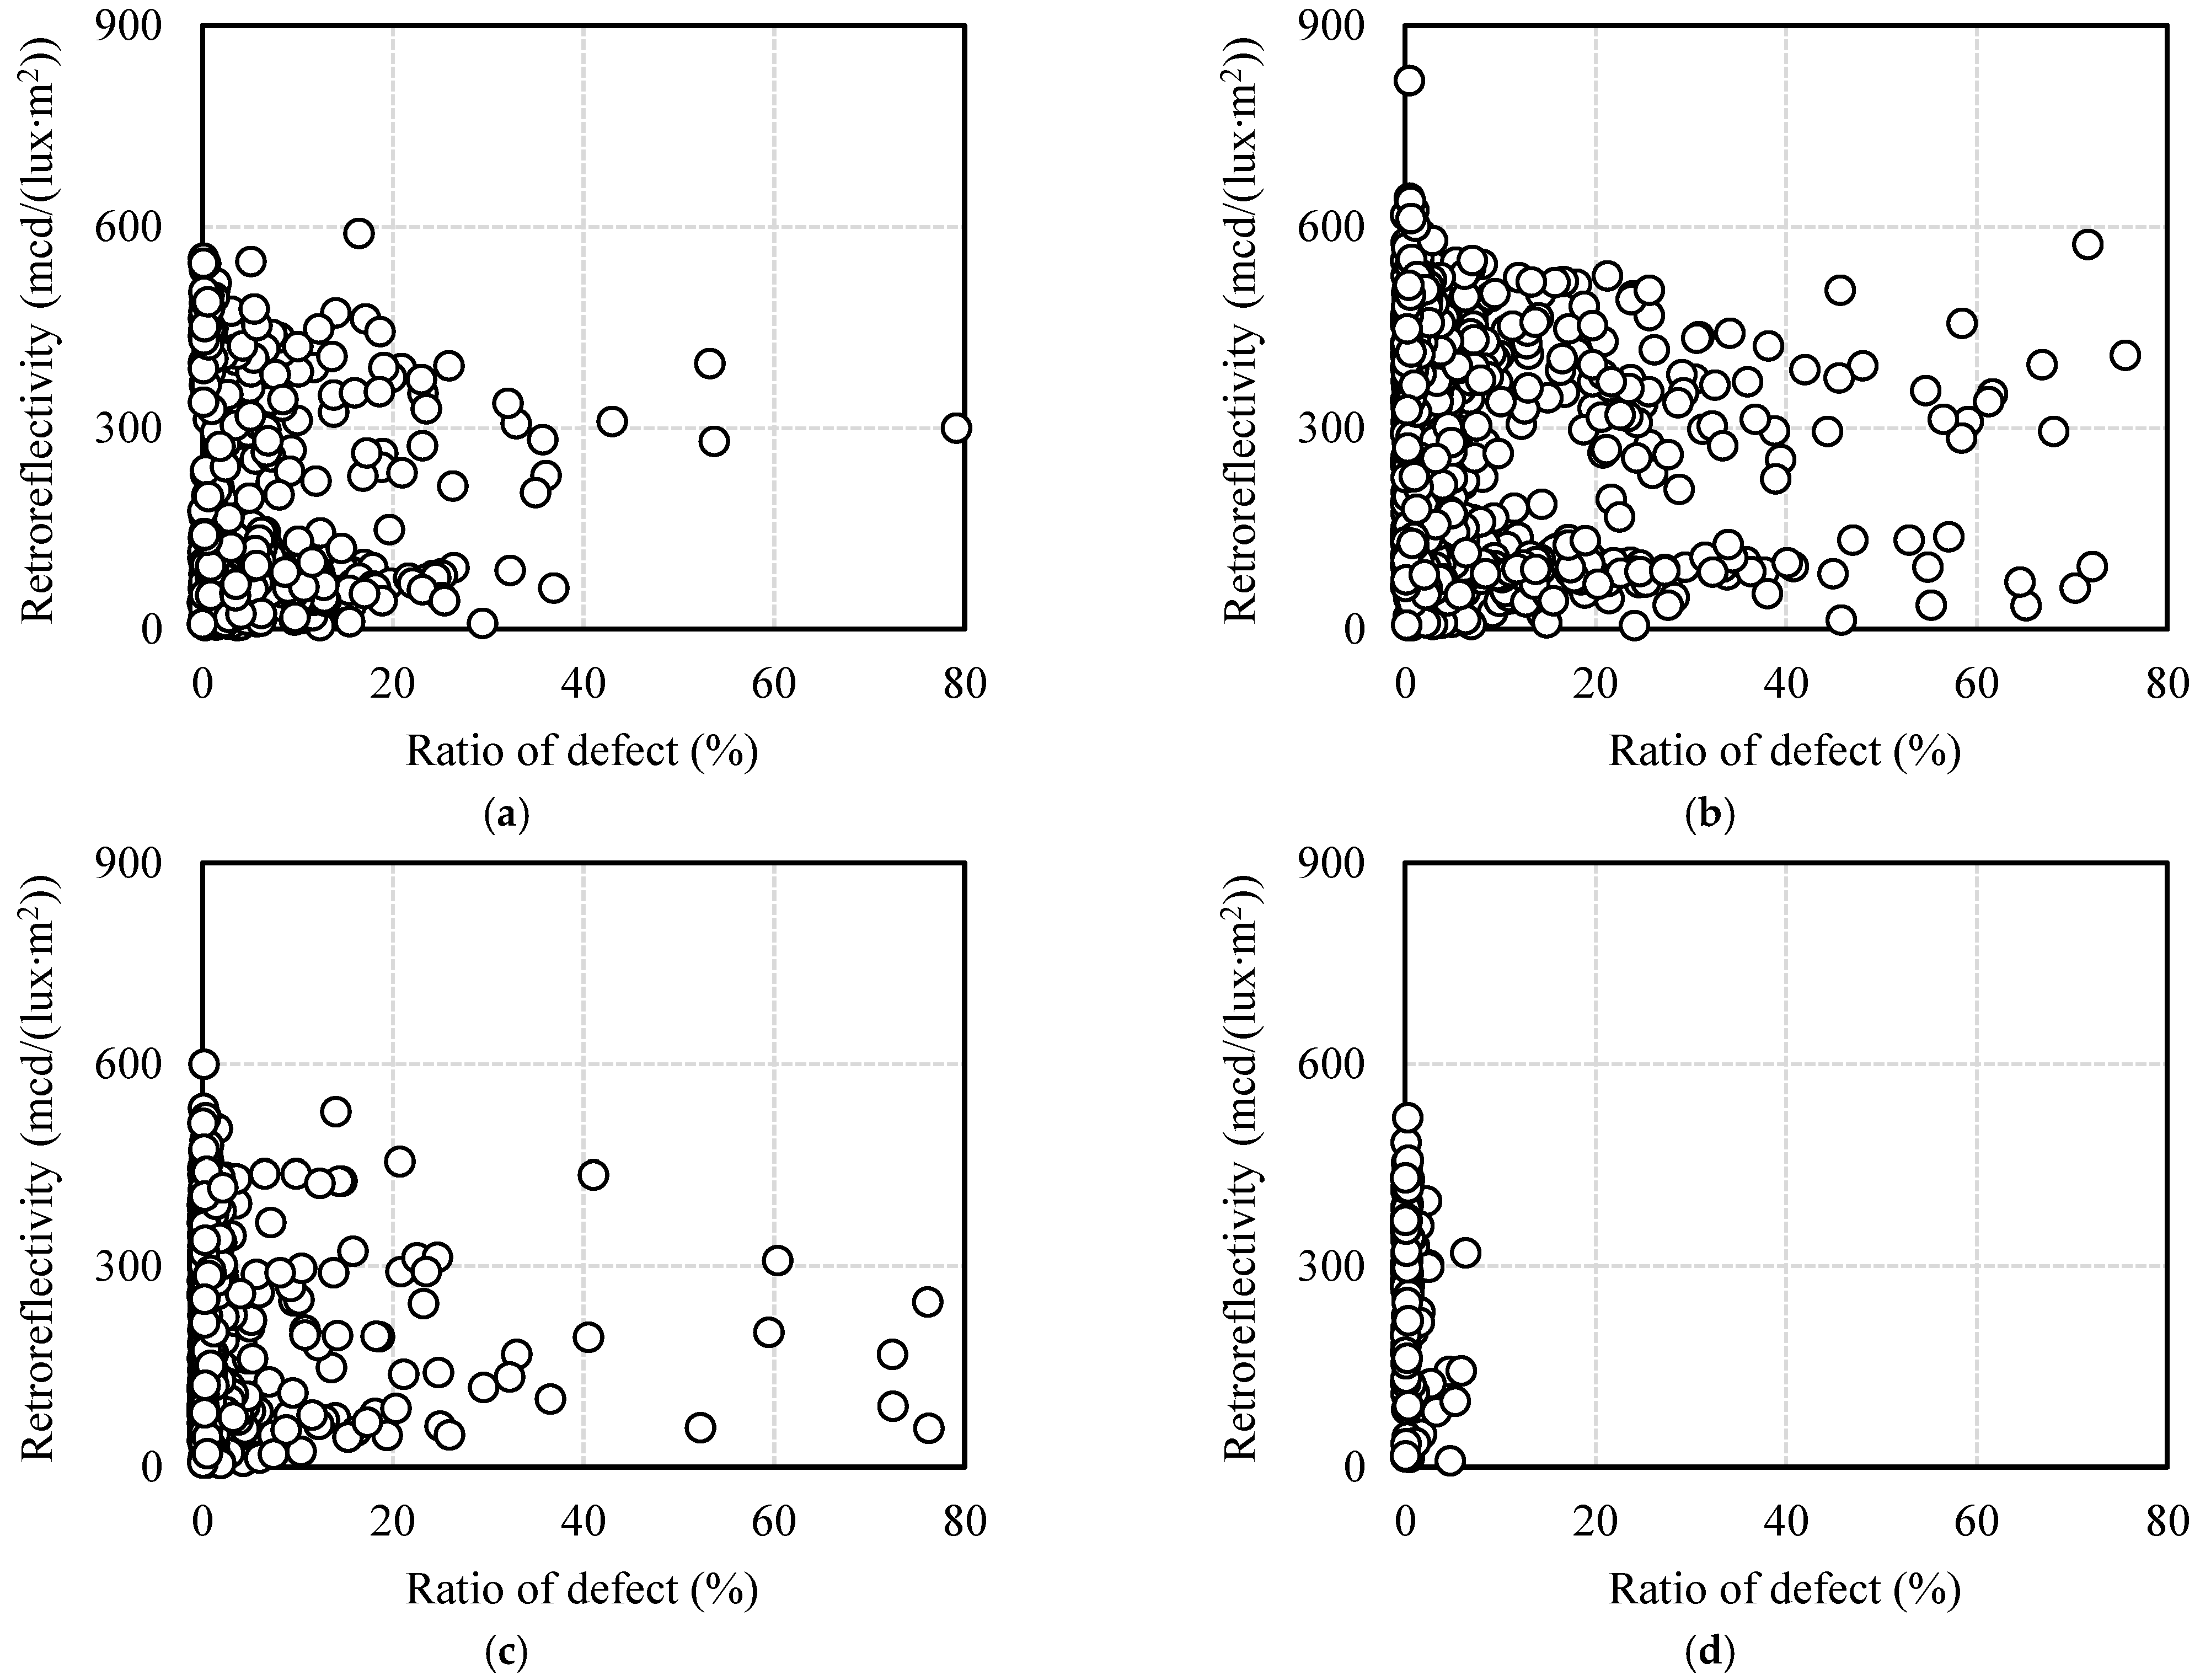
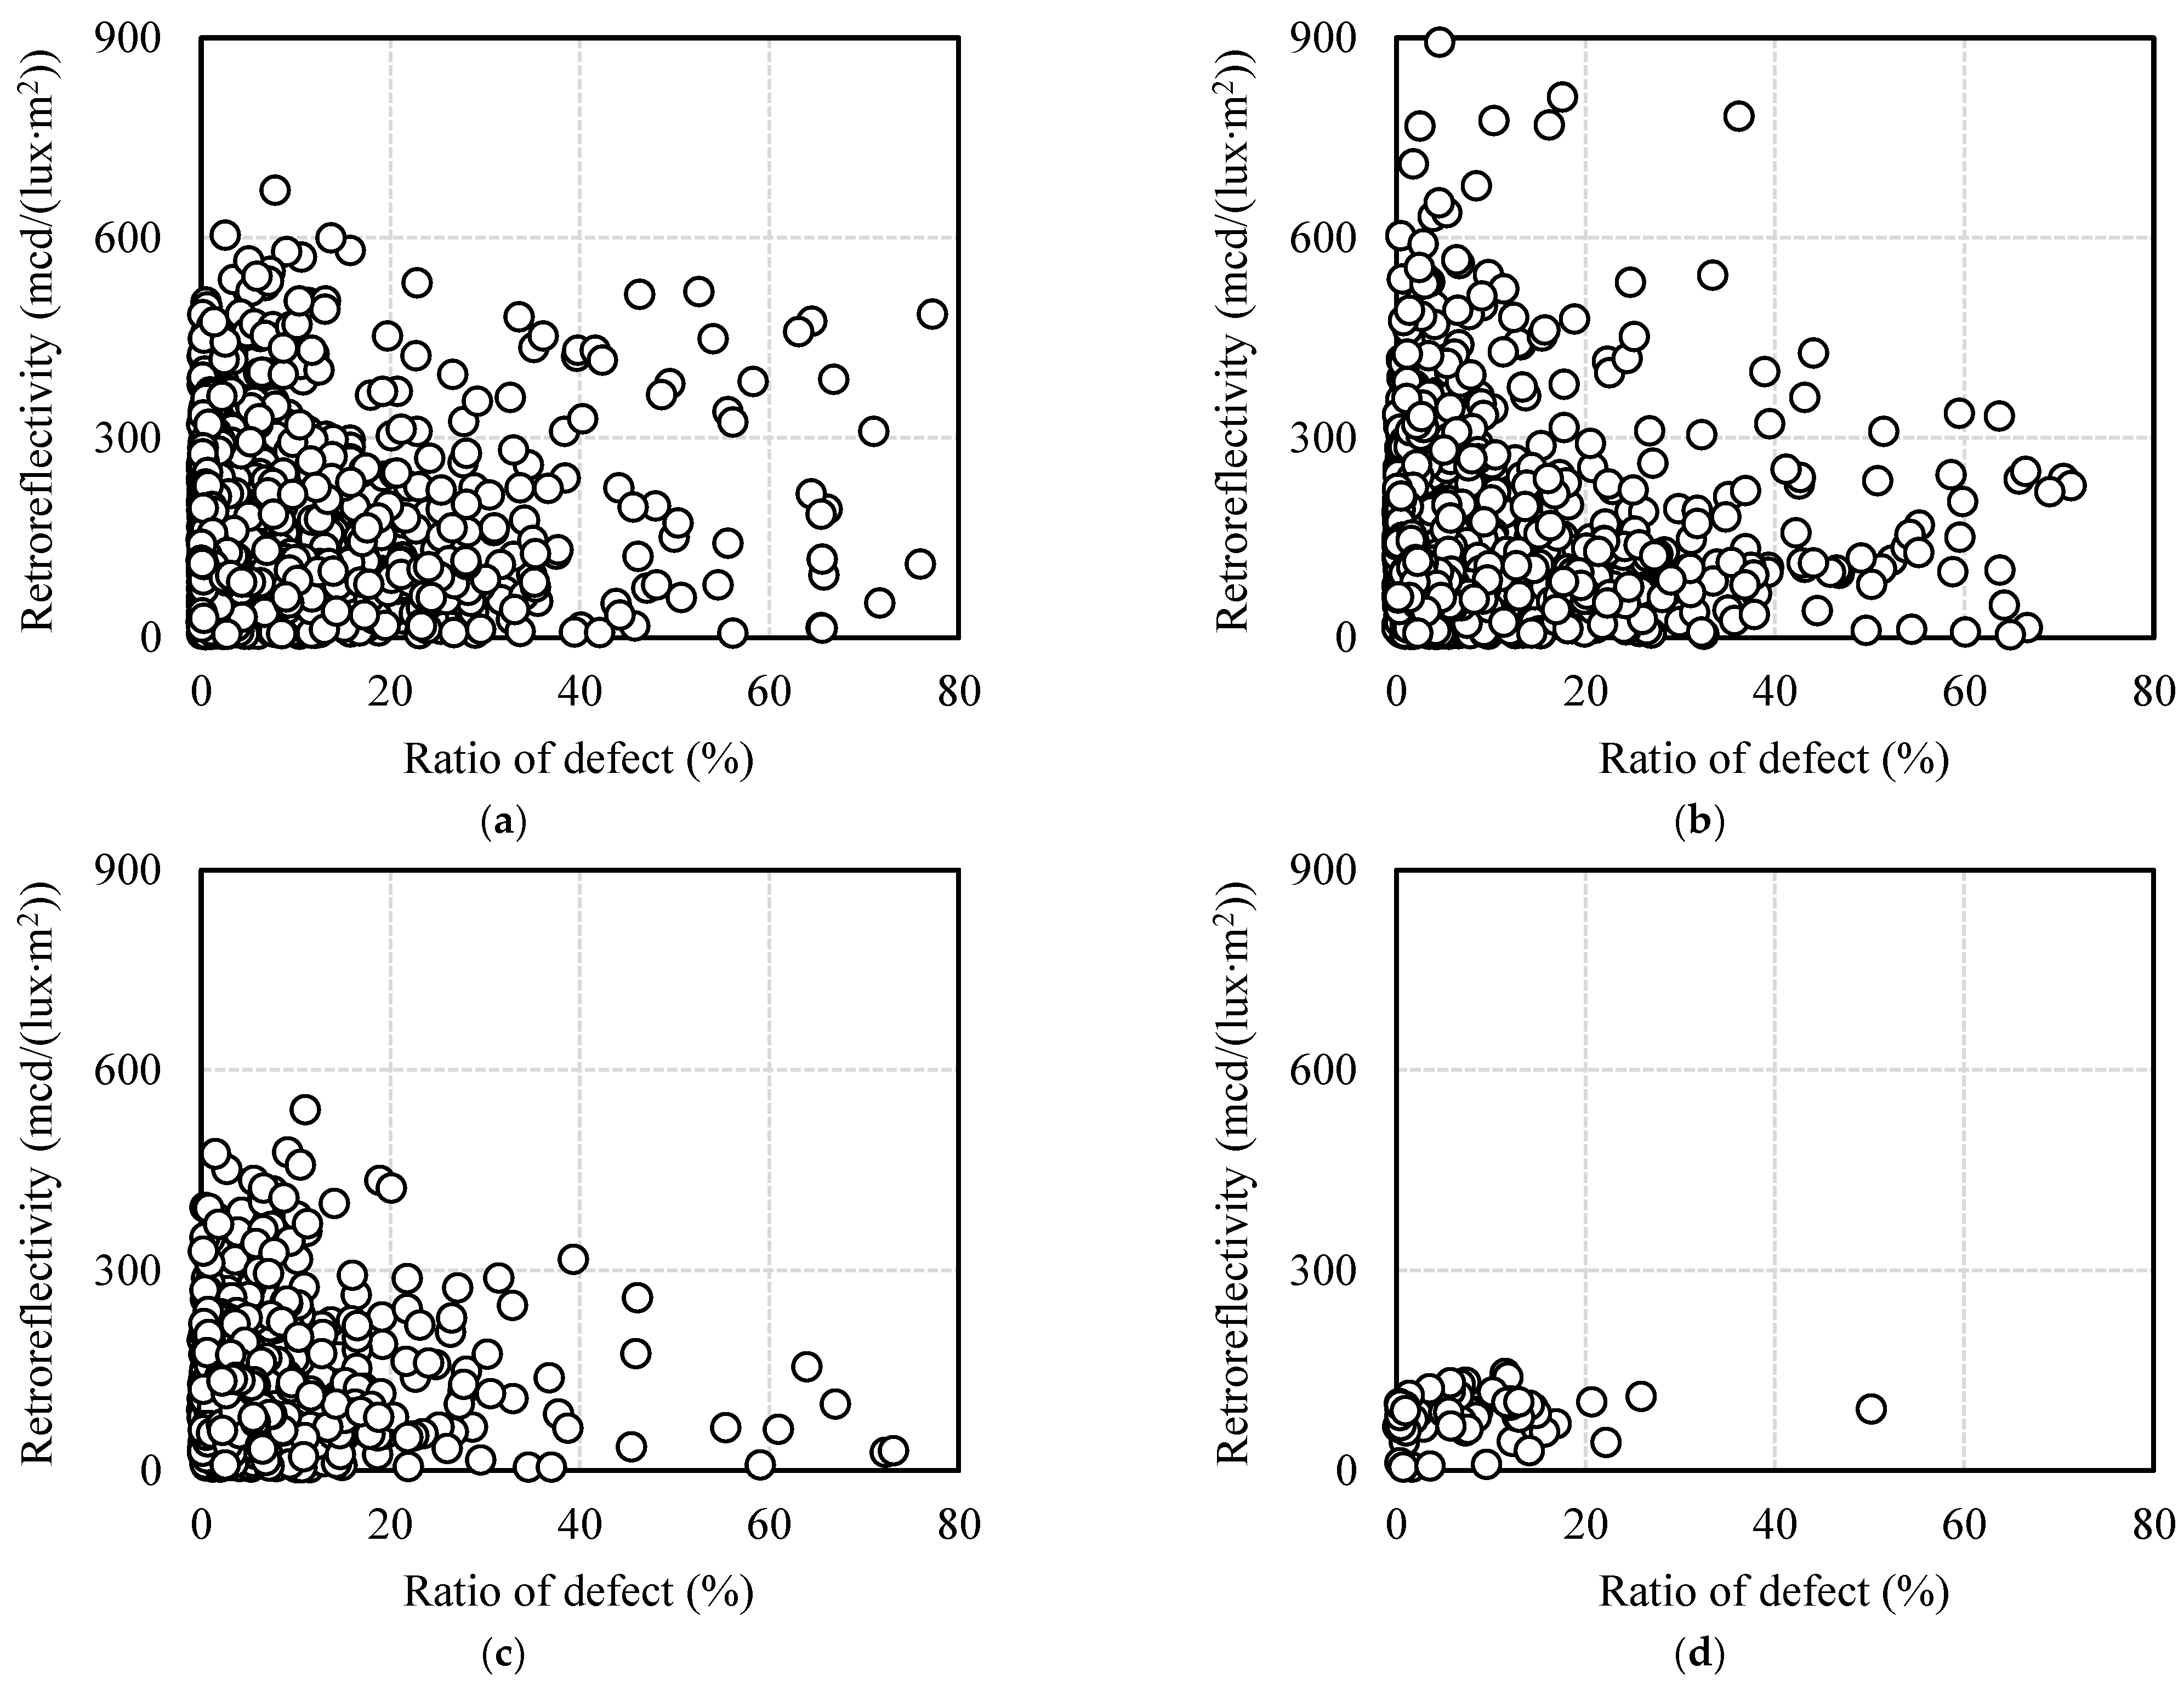
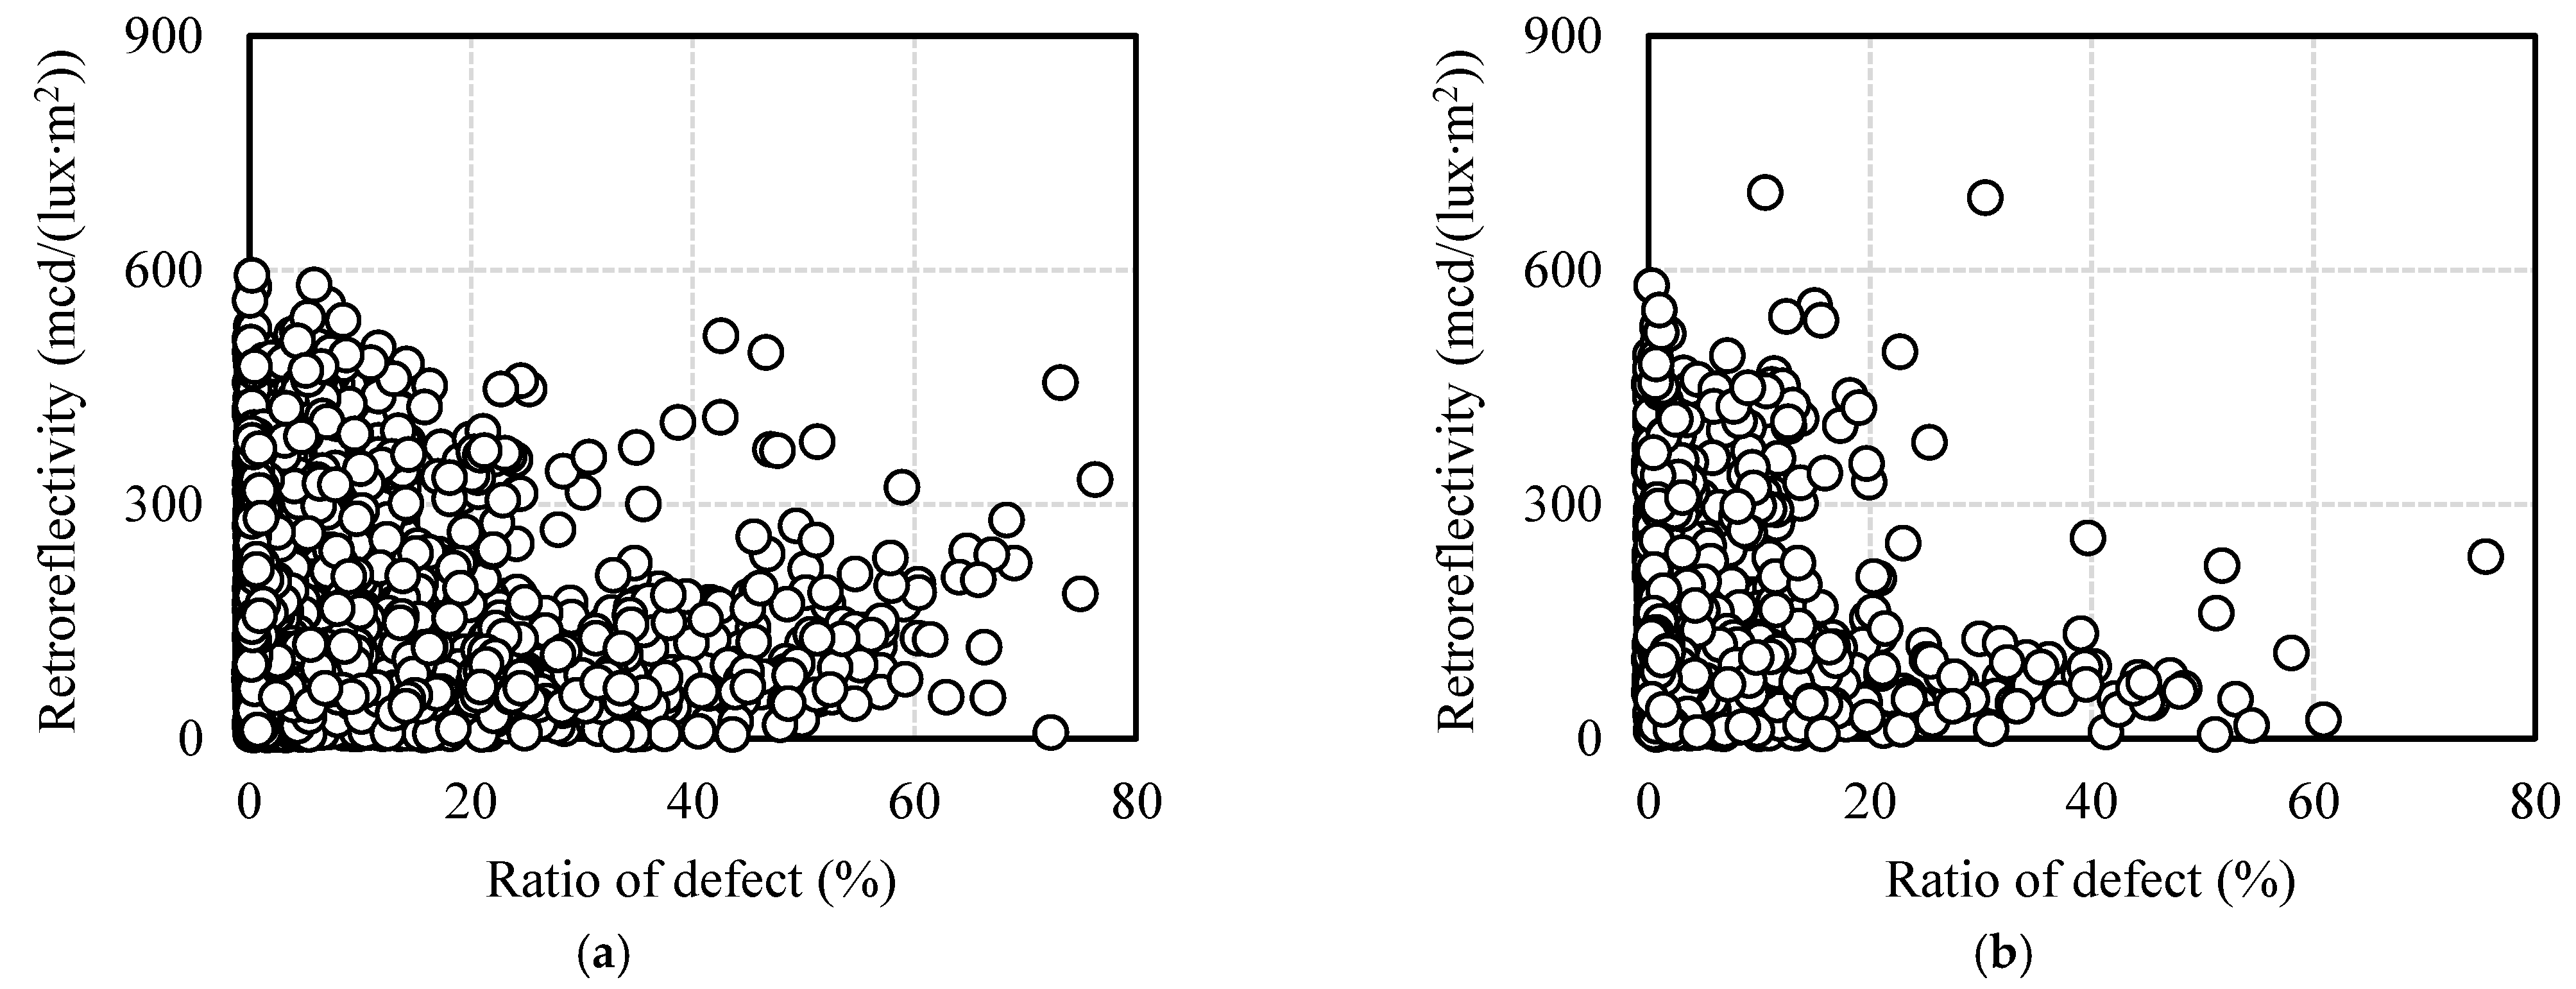
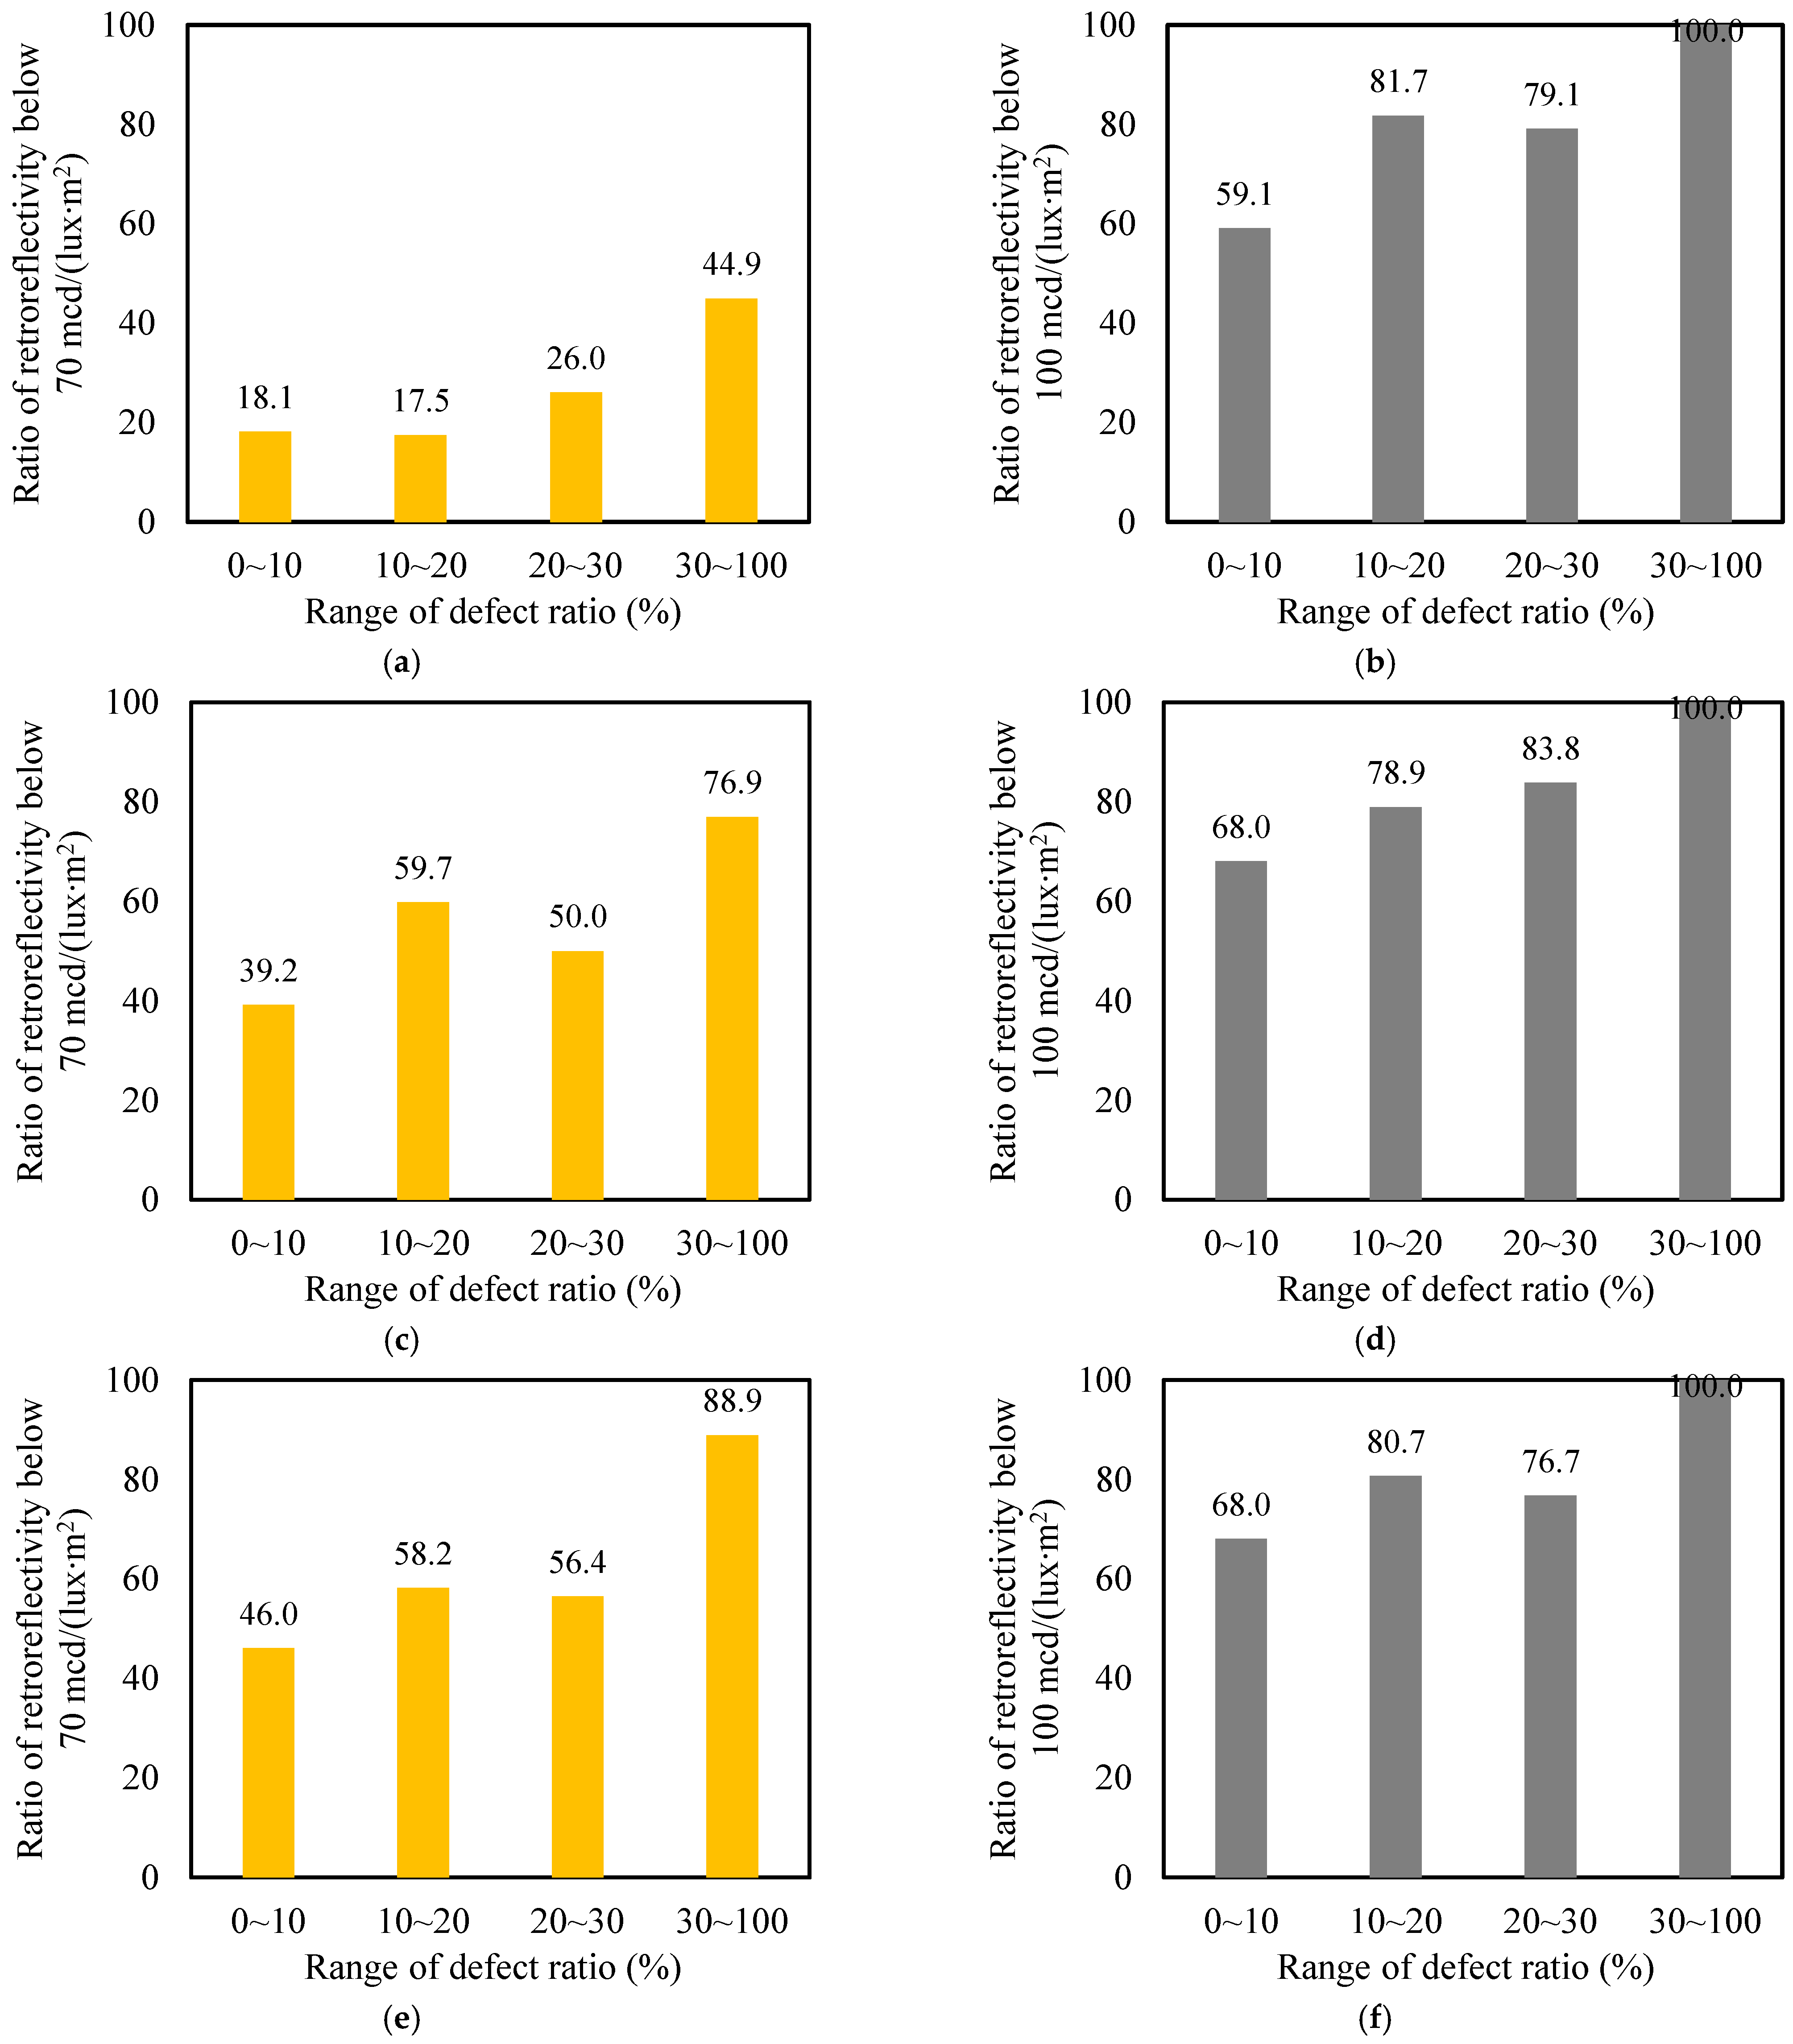
3.3. Retroreflectivity versus Defect Ratio

To investigate the distribution trends of the defect ratios and retroreflectivity values of pavement lane markings on the 502.82 km section for which the defect ratios were measured, the defect ratio and retroreflectivity were plotted on the X- and Y-axes, respectively, and the data were analyzed. Each data point represents the average measured value of a scanned 10 m length. As shown in Figure 12, the data were categorized into four areas on the graph. An area with a low defect ratio and high retroreflectivity was labeled as “I: good condition”, an area with a low defect ratio and low retroreflectivity was labeled as “II: poor glass beads”, an area with a high defect ratio and high retroreflectivity was labeled as “III: poor painting”, and an area with a high defect rate and low retroreflectivity was labeled as “IV: poor overall”.

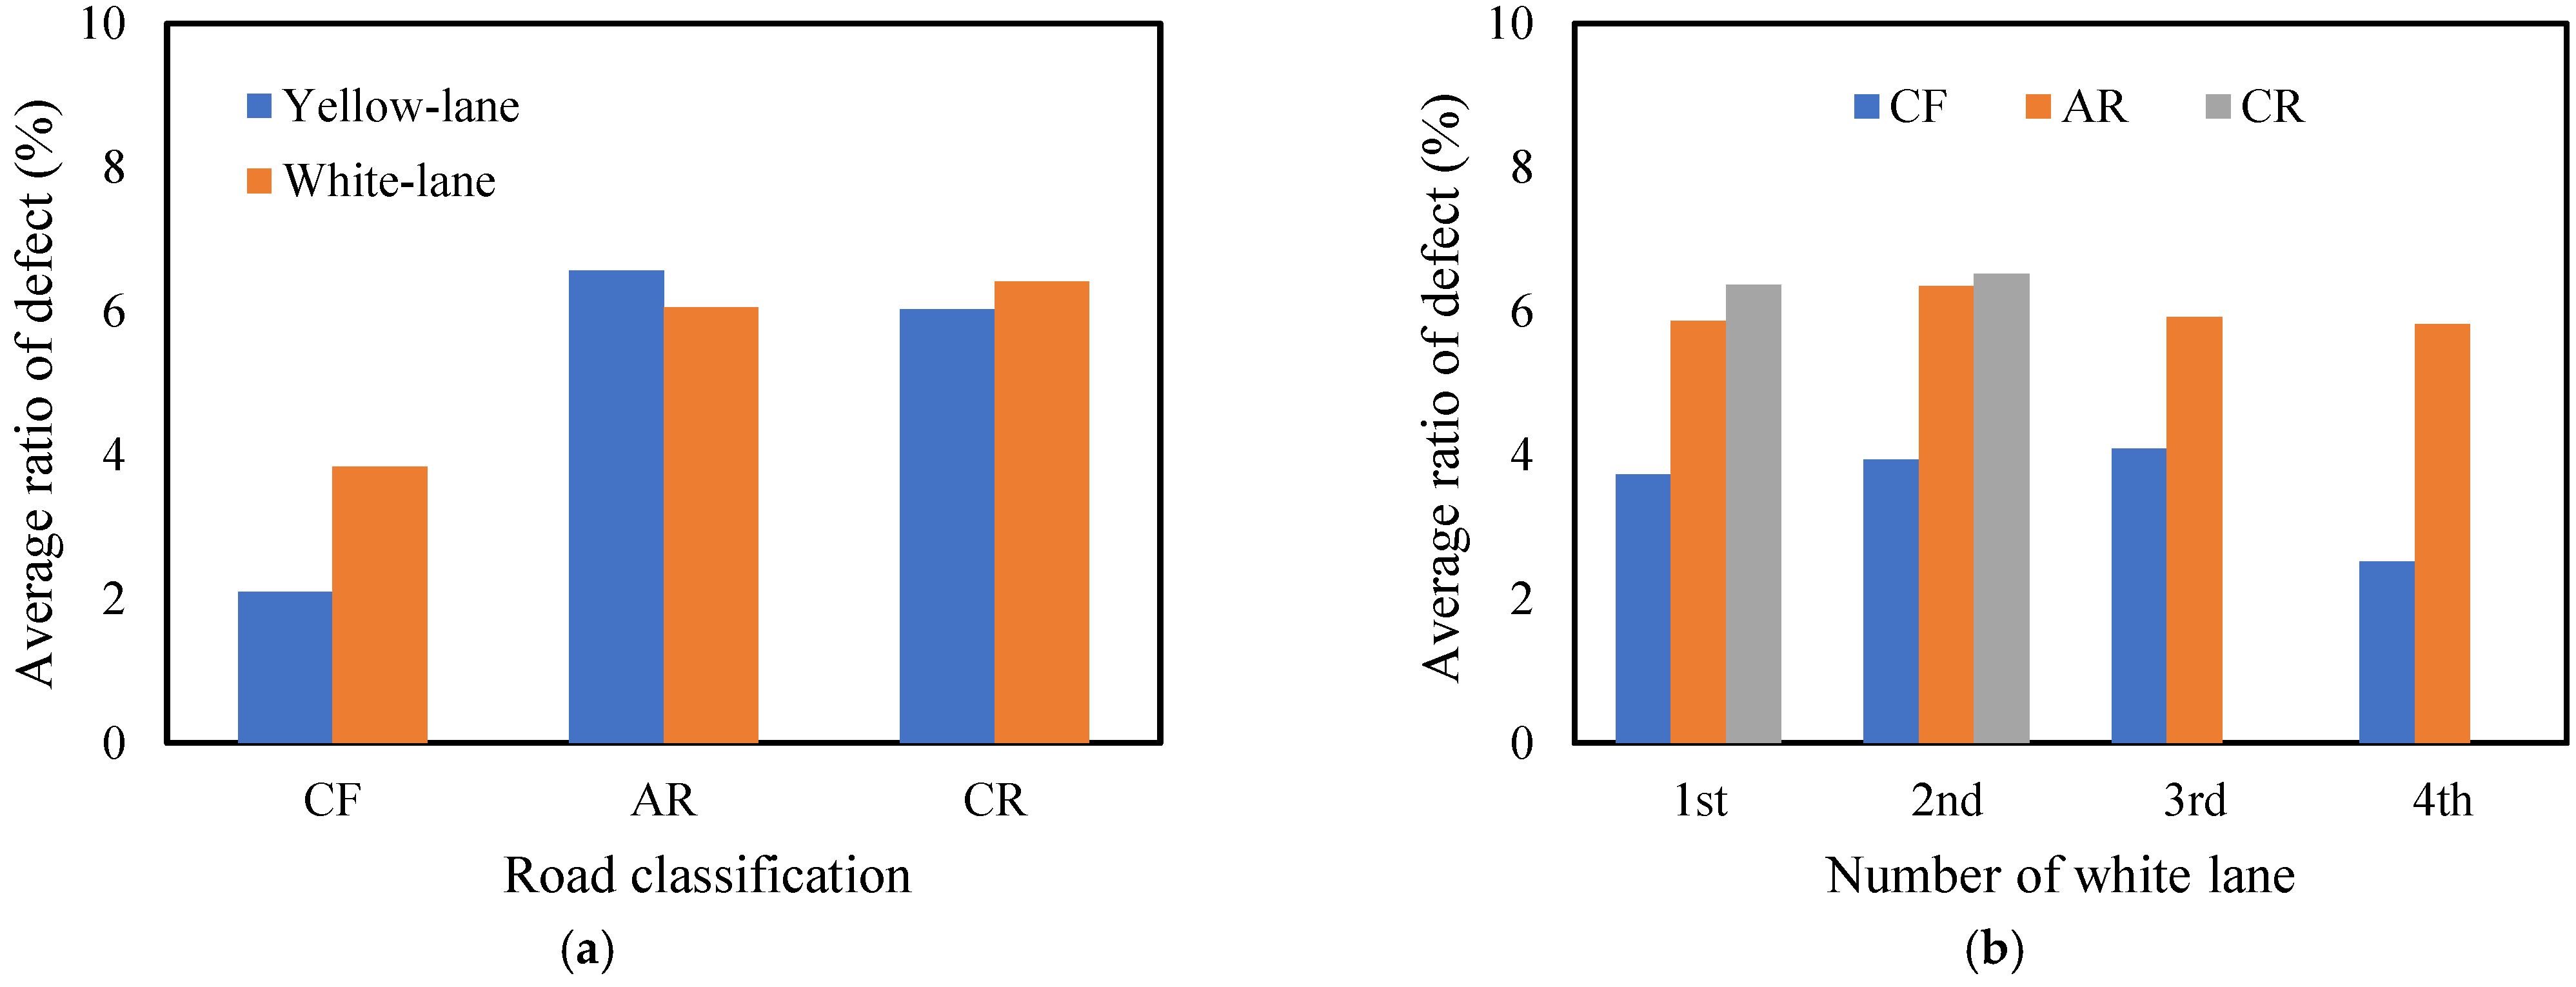
3.4. Yellow-Colored Lane

Figure 13 presents the data distributions of the retroreflectivity and defect ratio of yellow lanes according to the road classification. It can be seen that the data are generally scattered in the form of a right-angled triangle. In the case of CF, as shown in Figure 13a, there are relatively few data points in areas where the painting has peeled off, represented by the labels III and IV, but many data points are distributed in label II, indicating the low retroreflective performance of the lane markings. This may be due to the wear of the glass beads applied to the surface of the lane markings or contamination of the pavement surface. These types of damage can be attributed to the aging of the lane markings and poor maintenance works. Figure 13b shows that more data are distributed in label IV compared to CF, indicating that aging has progressed in the sections. When the ratio of defects increases as the retroreflective performance decreases, it is considered that the pavement surface abrasion has progressed due to vehicle passage, even though the yellow line is a center line. In the case of CR, as shown in Figure 13c, a large amount of data are placed in label III, demonstrating a good retroreflective performance despite the high ratio of defects in the lane markings, and it is inferred that these are relatively recently painted lane markings with the loss of only a few glass beads. Nonetheless, the high ratio of defects may indicate that the quality control of the painting work in this section is insufficient.

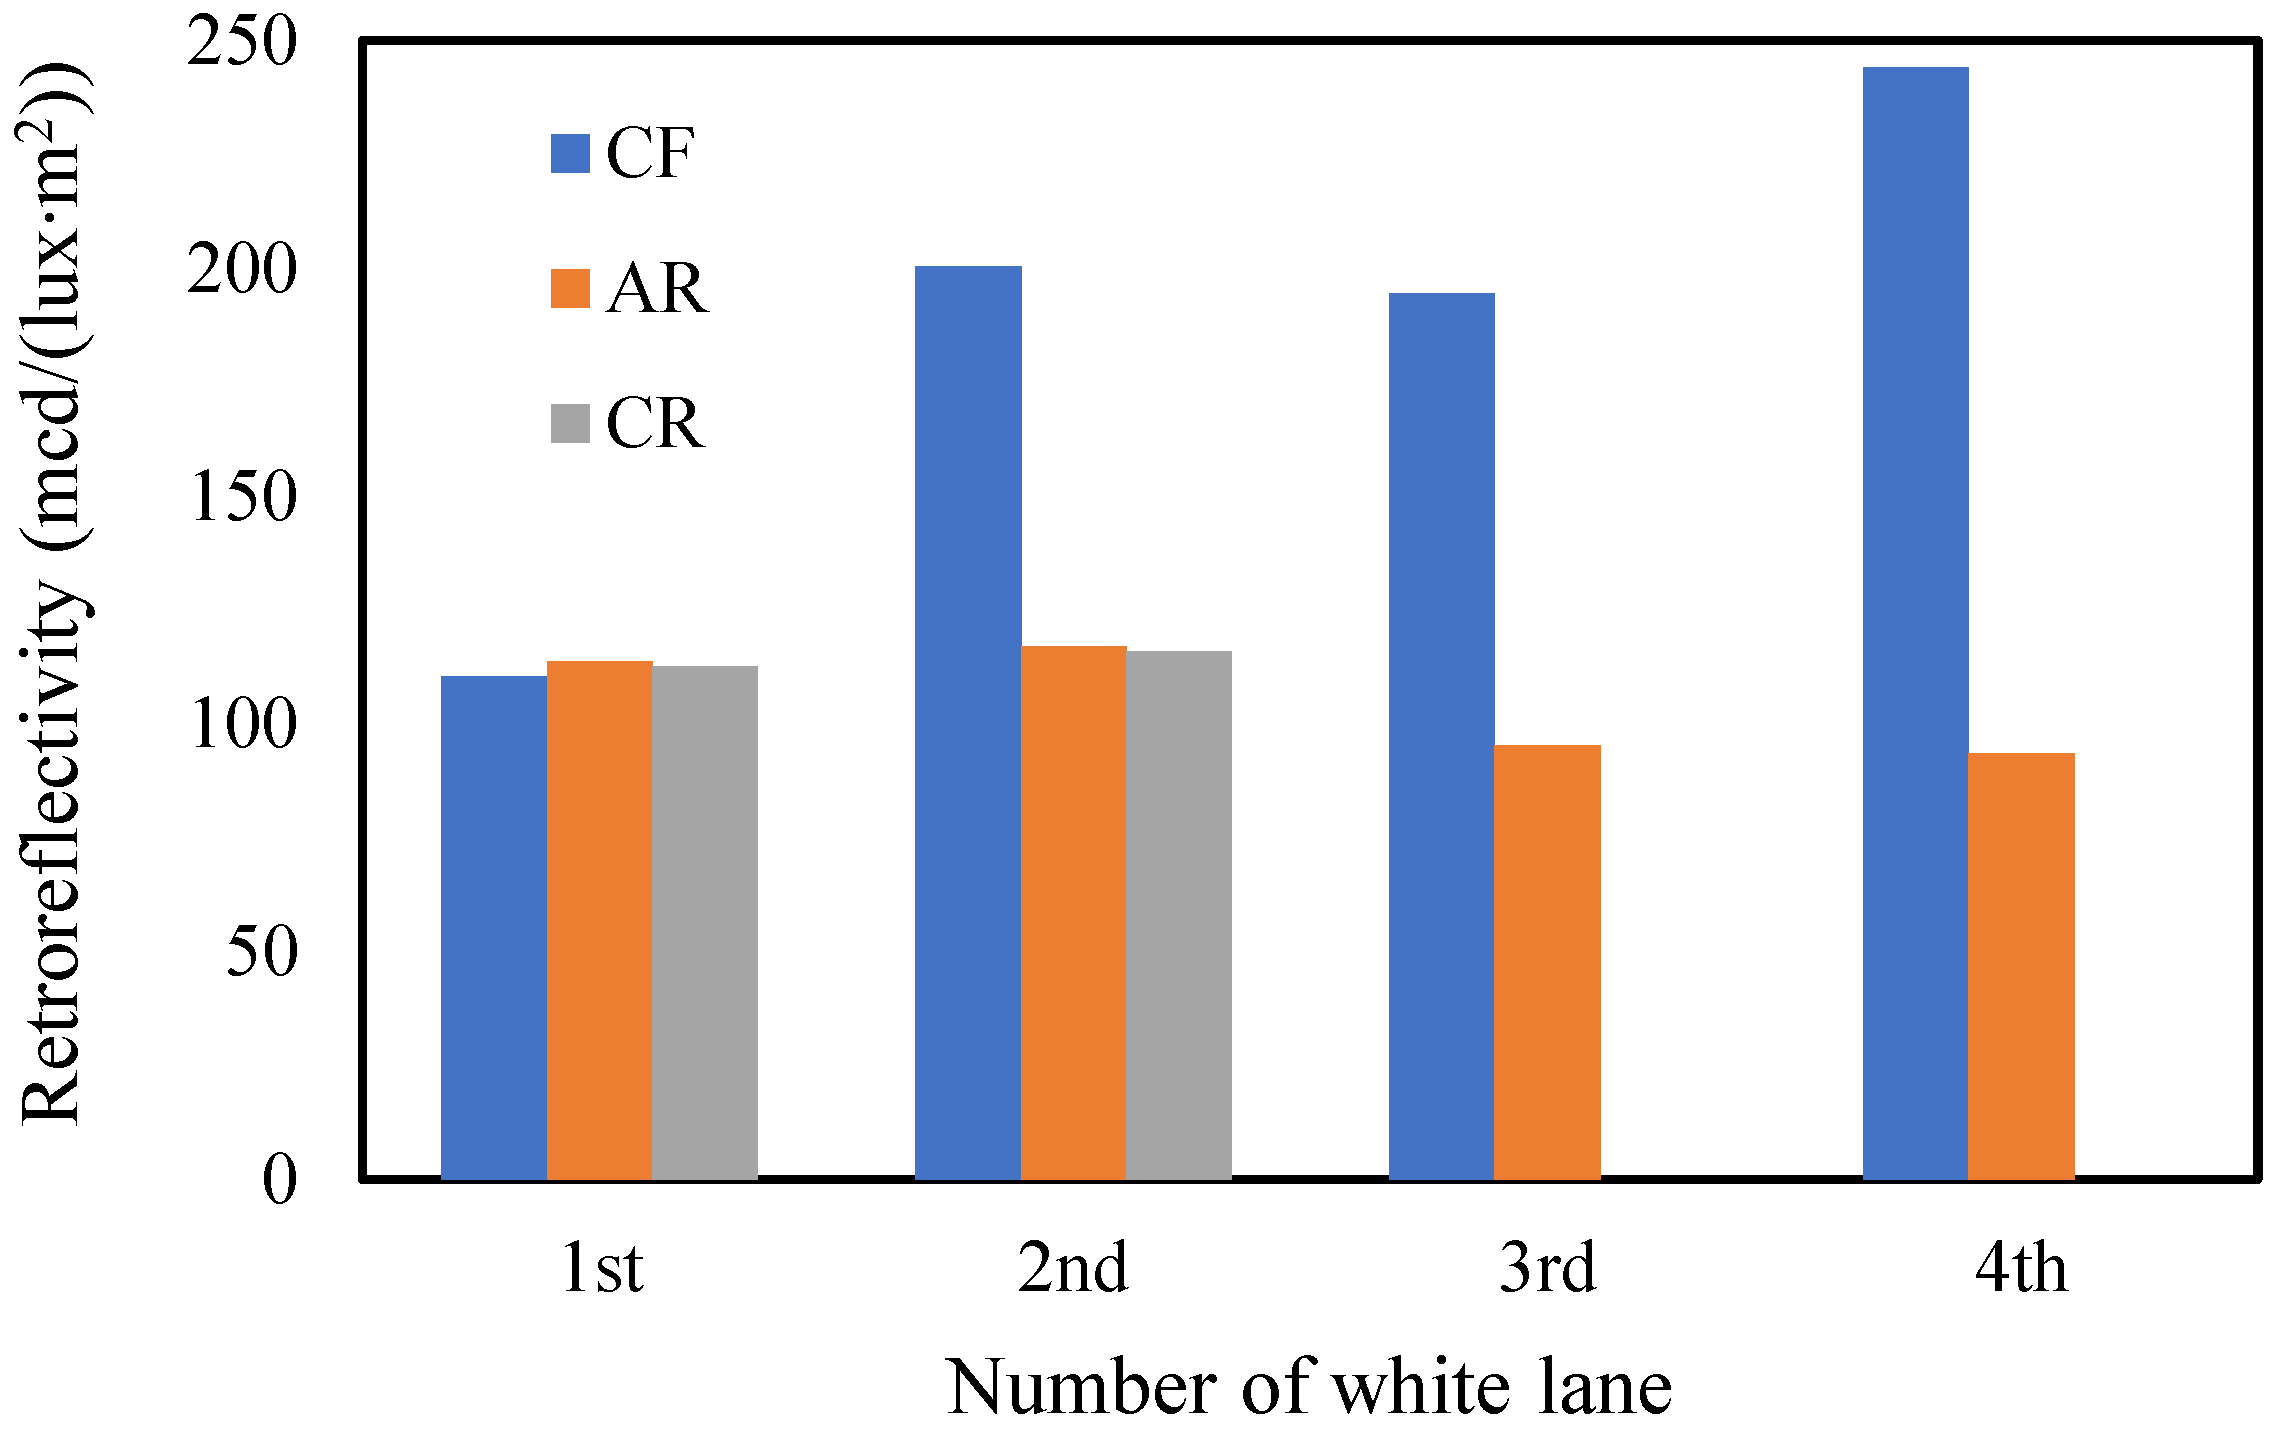
3.5. White-Colored Lanes

Figure 14 displays the distribution of the retroreflectivity and defect ratios of white-colored lane markings for CF, categorized by the number of lanes. It is noticeable that the white lanes have a higher ratio of defects than the yellow lane in the case of CF. Since the amount of data corresponding to label III is greater compared to that of the yellow lanes, it can be assumed that the painting work if of an insufficient quality or that the paint has peeled off due to frequent vehicle passage. Moreover, there is a distribution of a large amount of data corresponding to label II. This may be due to the low quality of the spreading of glass beads or the fact that glass beads have fallen from the paint over time due to friction caused by frequent lane changes by vehicles driving at high speeds. However, for the last white lane (see Figure 14d), few lane defects are observed, but many data points with low retroreflectivity are still identified.
The distributions of the retroreflectivity and ratio of defects for white-colored lane markings on AR are presented in Figure 15 according to the number of lanes. The overall defect ratio of the white lanes on AR is higher than that of those on CF. A large amount of data are scattered in the labels III and IV, which implies that the quality of the painting work is lower. The data corresponding to label IV show that the retroreflective performance of glass beads decreases with the quality degradation of the lane painting, which is considered as aging. The high occurrence of data in label II for all the white lanes may be due to the poor quality of glass bead spreading or the loss of glass beads over time as a result of vehicle passage with frequent lane changes. Moreover, the last white lane exhibits a different distribution trend for AR compared to CF. In the case of AR, the data points are scattered horizontally, while in the case of CF, the data are distributed vertically. This indicates that the retroreflective performance of the fourth white lane marking is lower in the case of AR, and more defects of the lane markings are observed in AR than in CF.
The distributions of the retroreflectivity and defect ratios of white lane markings for CR, classified by the number of lanes, are shown in Figure 16. The trends of the data distributions are similar to those of AR. The range of the defect ratio is broadly scattered up to the level of 80%, and there are many sections of lane markings where the retroreflective performance is not effective despite the low ratio of defects. It can be seen that the data are distributed over a wide range in the form of a right-angled triangle.
In summary, the trends of the distribution data suggest that the quality of the lane markings, specifically their retroreflectivity and ratios of defects, varies across different sections and may be affected by factors such as the quality of the painting work, maintenance quality, and the wear caused by traffic and frequent lane changes. The high occurrence of lane marking defects and low retroreflectivity of some sections may pose a risk to road safety, especially at night or in adverse weather conditions. Therefore, the results imply the need for the regular monitoring and maintenance of lane markings to ensure their visibility and effectiveness in guiding drivers and preventing accidents.

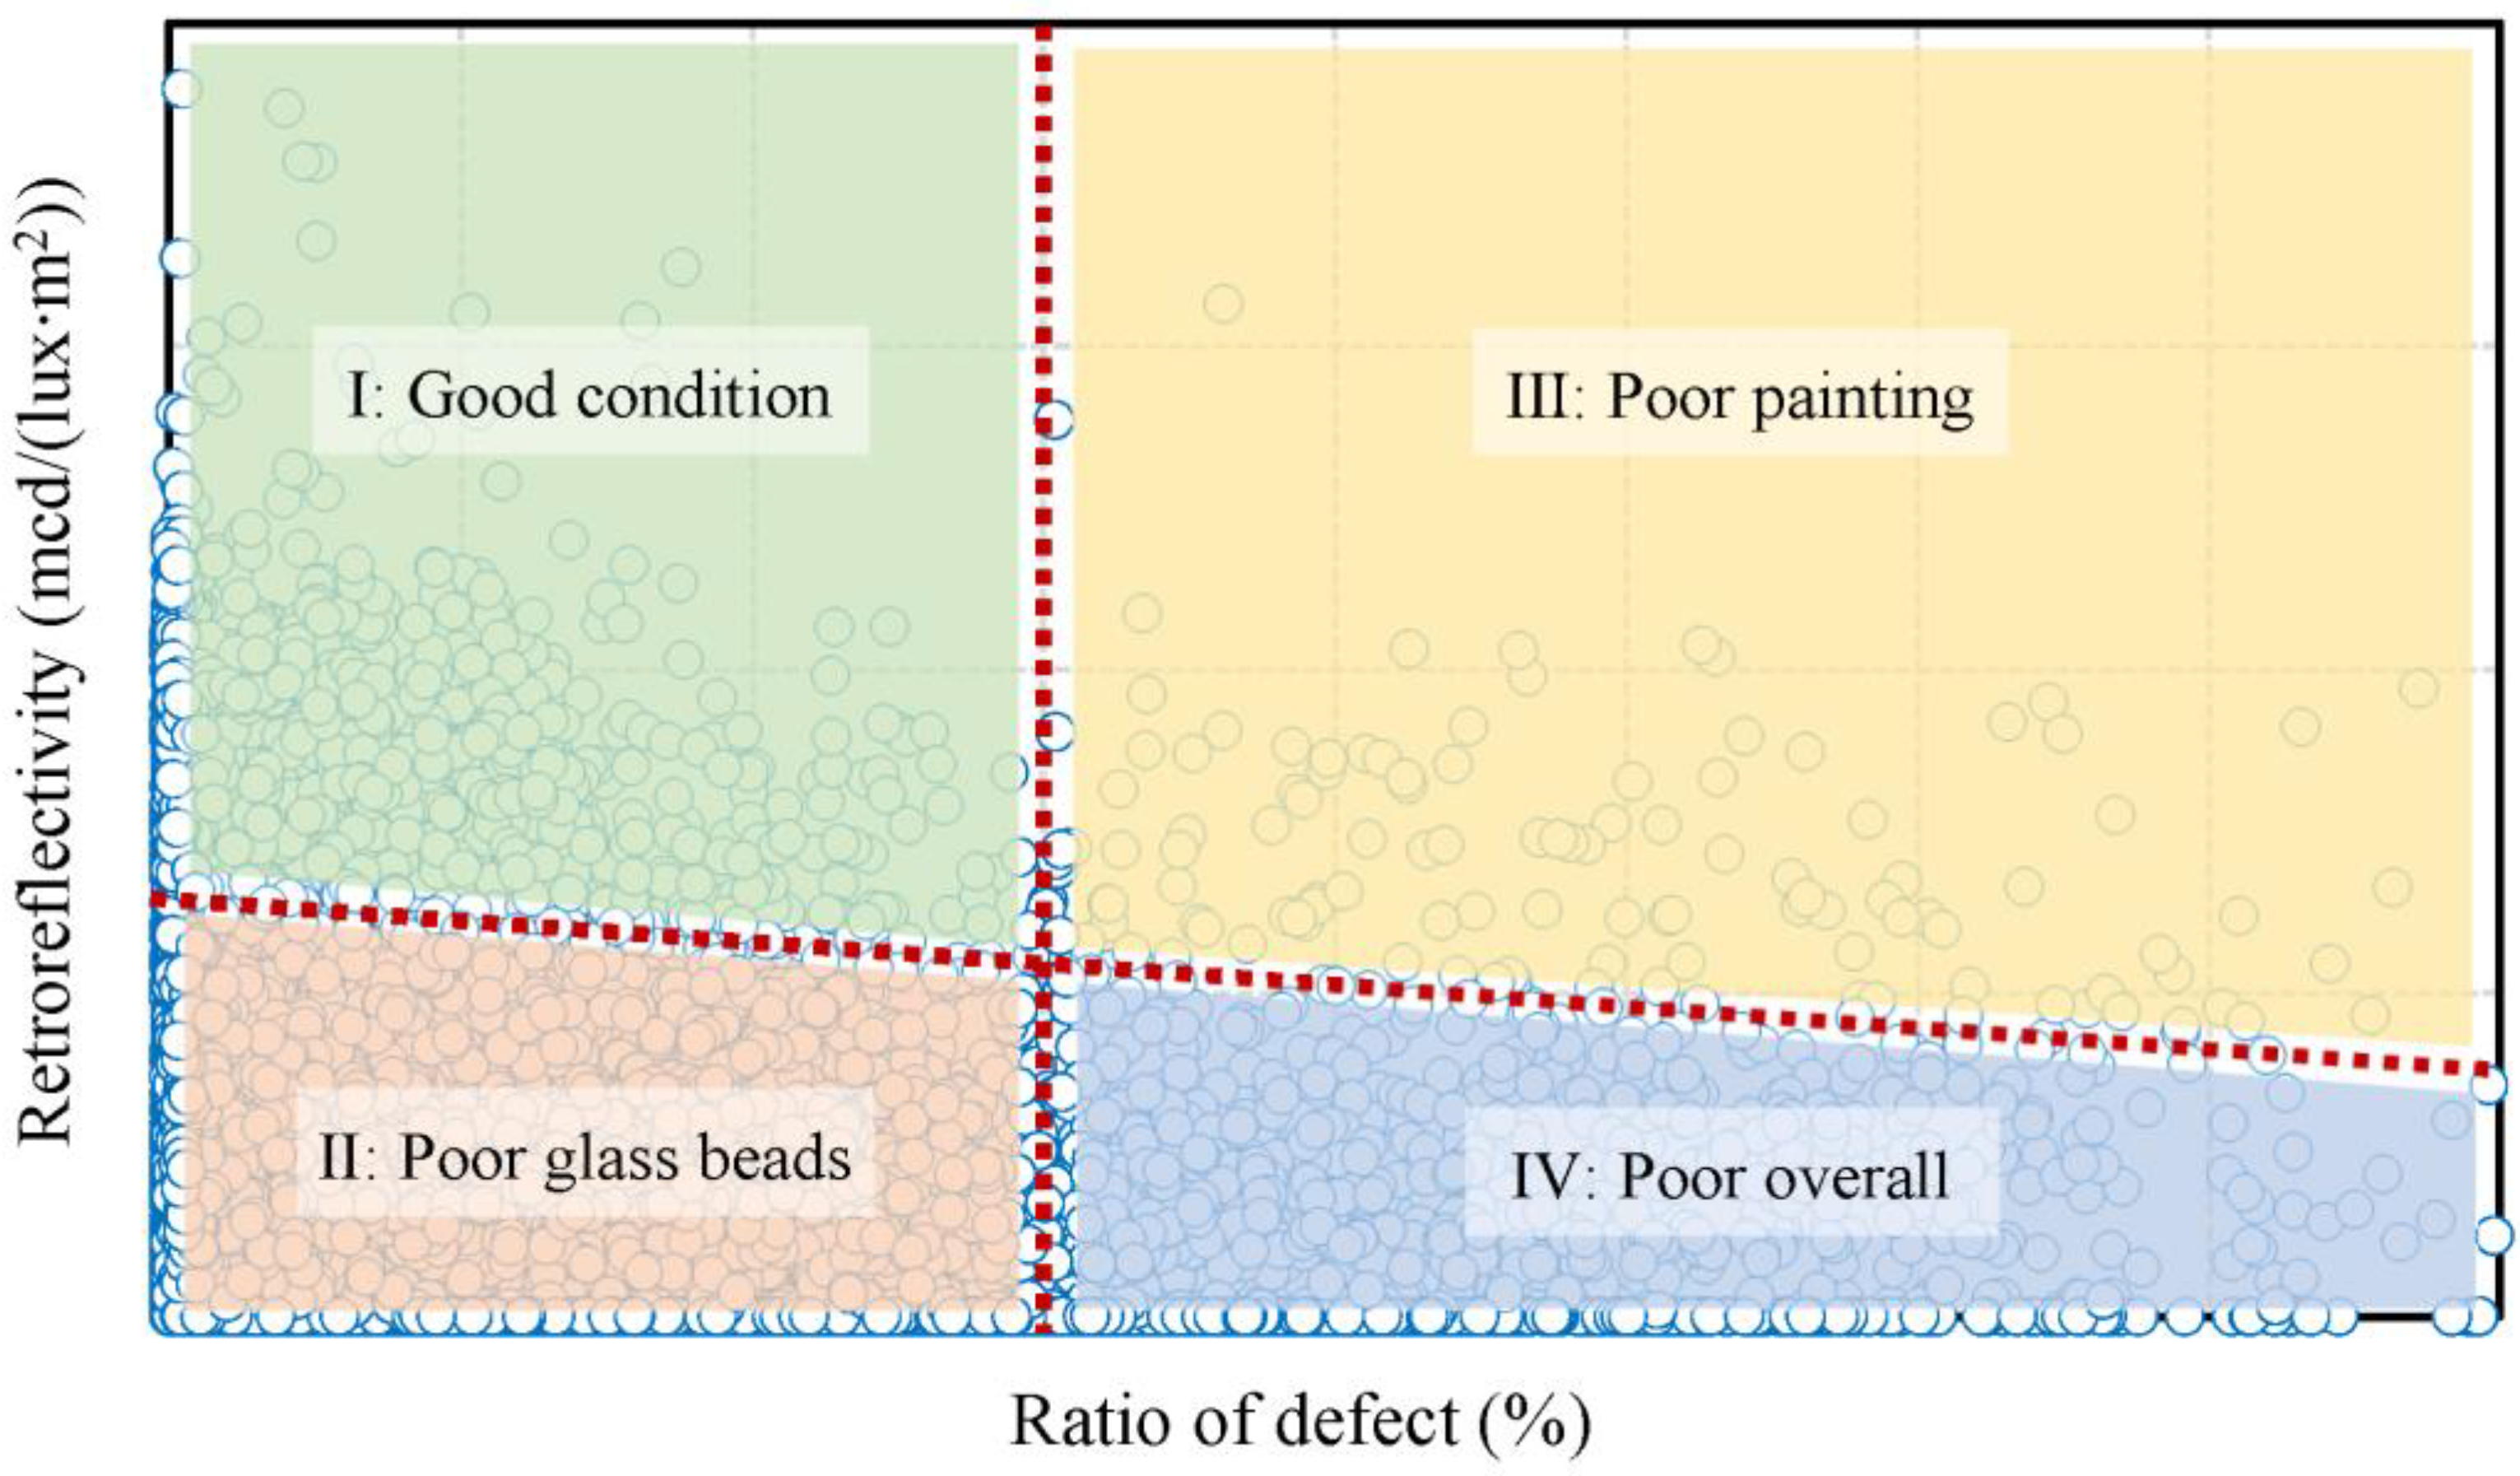
4. Development of Maintenance Priority

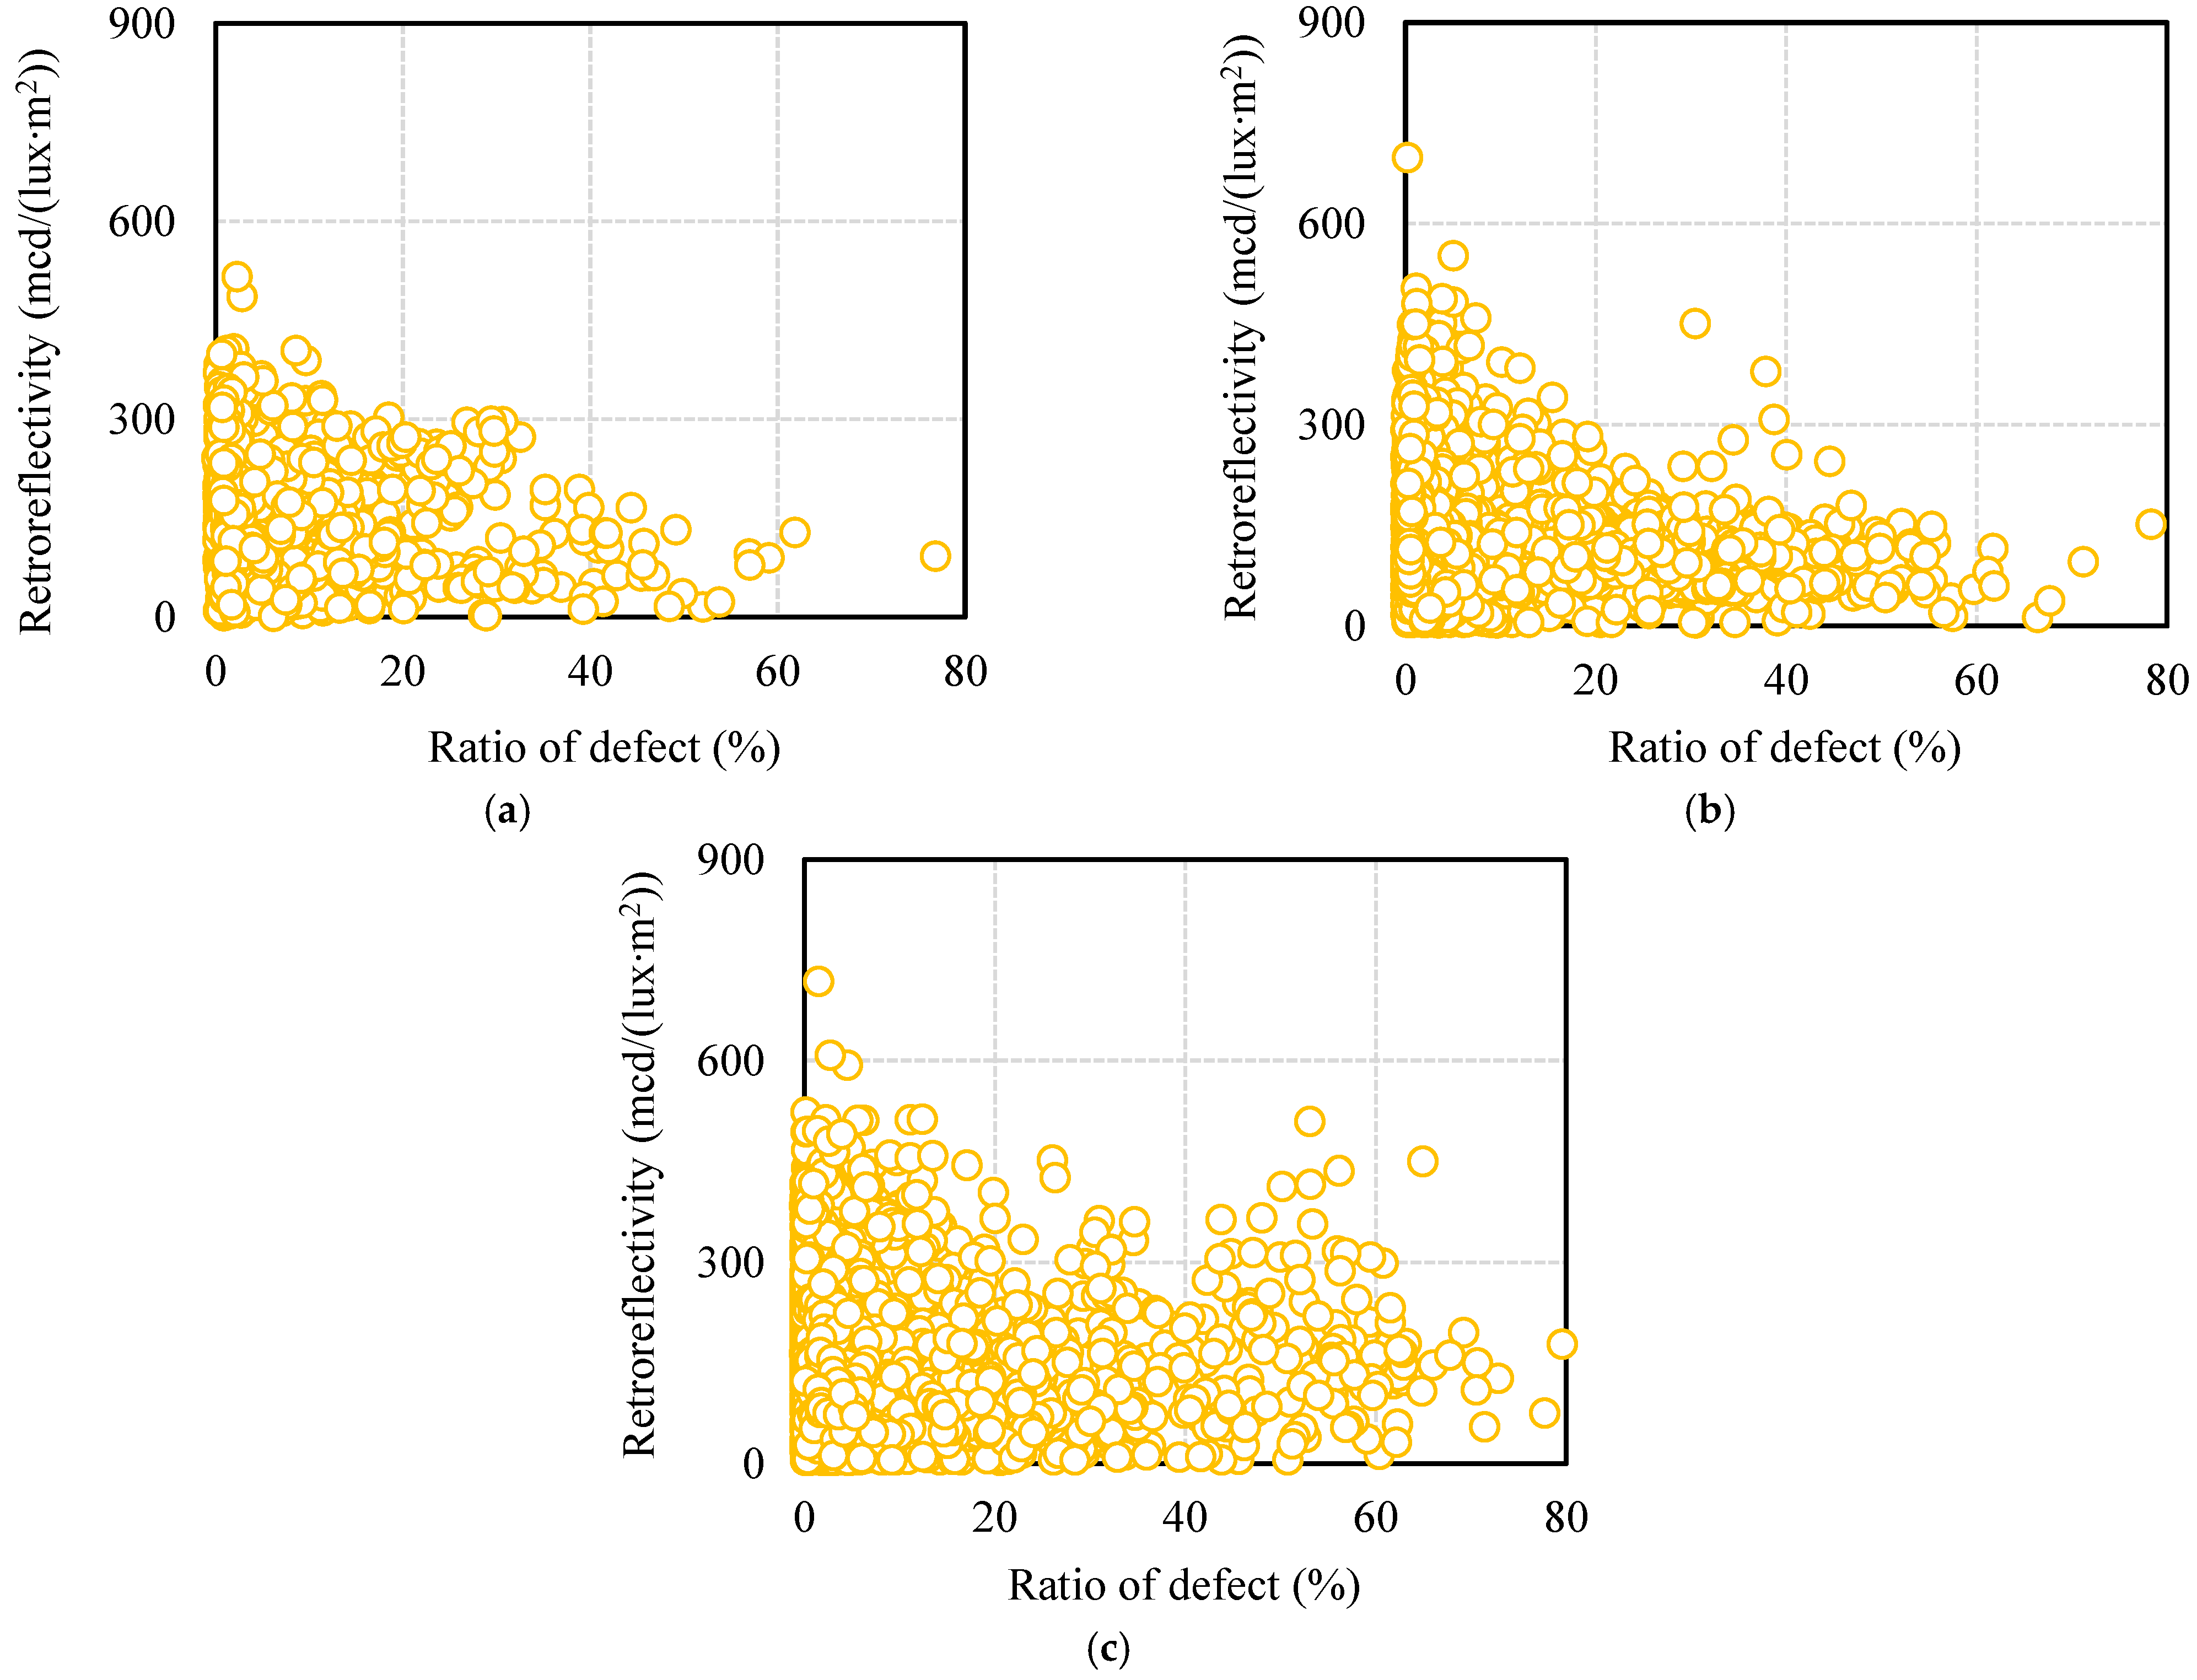
Re-Plotting of Data Distribution by 100 m Average

When repainting pavement lane markings, dividing the work into 10 m sections can help to improve work efficiency. This is because this method requires workers using the equipment to stop and start the painting process more frequently, which can increase the time and effort needed to complete the maintenance work. Using longer lengths of 100 m or more may be more efficient depending on the work environment. Therefore, to define priorities for maintenance work on the lane markings, the distributions of the retroreflectivity and ratio of defects were re-plotted to average 100 m by road classification and color, as shown in Figure 17. Compared to the data distribution plotted as a 10 m average, it is more apparent that the data are distributed in the form of a right-angled triangle. Additionally, the amount of data corresponding to label III, which represents the sections with high ratios of defects and high retroreflectivity, is difficult to identify for all the road types and colors. Conversely, similar to the case of the 10 m average, a significant amount of data are plotted in label II, in which the retroreflective performance decreases over time, even if the pavement surface is healthy with a low physical defect ratio. These results suggest that it may be necessary to prioritize maintenance work by focusing on retroreflectivity first in order to ensure the overall safety and performance of lane markings.
Thus, the dataset of lane markings was categorized into four ranges of defect ratios (i.e., 0~10%, 10~20%, 20~30%, and 30~100%) based on the road classification and lane marking color. Subsequently, an analysis was conducted to determine the proportion of lane marking sections with retroreflectivity values below the specified criteria for repainting requirement (i.e., 70 mcd/(lux∙m2)) for yellow lanes and 100 mcd/(lux∙m2) for white lanes), as shown in Figure 18. The results indicate that as the ratio of physical defects increases, there is a corresponding increase in the proportion of lane marking sections that are below the specified retroreflectivity criteria, regardless of the road classification or lane color. However, it was found that in the case of CF, the proportion of sections that showed values below the criteria was lower than those for AR and CR. Conversely, for white lane markings, similar proportions of unsatisfactory sections were observed regardless of the road classification. Figure 18a demonstrates that as the defect ratio of yellow lanes on CF increases, the ratio of retroreflectivity below 70 mcd/(lux∙m2) also increases. Specifically, for a defect ratio of 0 to 10%, the proportion requiring repainting is 18.1%, whereas for a defect ratio of more than 30%, the proportion requiring repainting is 44.9%. The data presented in Figure 18b indicate that the white lane markings on CF exhibit a decline in retroreflective performance as the ratio of defects increases. When the defect ratio is between 0% and 10%, 59.1% of the sections fail to meet the repainting criterion of 100 mcd/(lux∙m2). On the other hand, when the defect ratio exceeds 30%, none of the sections meet the repainting criteria. Likewise, for the yellow lane markings on AR and CR, it was identified that 76.9% and 88.9% of the sections, respectively, with defect ratios of 30% or more failed to meet the criteria for retroreflective performance. Similarly, for the white lanes on AR and CR, it was determined that all the lanes with defect ratios of more than 30% required repainting to restore their retroreflective performance.
In summary, if maintenance priority is determined for the lane markings observed in this study, in the case of the white lanes, one should prioritize all sections with defect ratios of more than 30%. Meanwhile, for the yellow lanes, the section with the highest defect ratio range of 30~100% should be considered as the priority for maintenance work. It is important to note that this threshold value is specific to the case investigated in this study, and the values may differ in other cases. Subsequently, to maintain the performance of lane markings with a restrained budget, a maintenance strategy can be suggested based on the results. This strategy involves prioritizing maintenance work by focusing on the categorization of the dataset of lane markings according to the ranges of defect ratios based on road classification and lane marking color. If a sufficient budget is available, the percentage can be decreased, allowing for more maintenance works to be carried out. Conversely, the percentage can be increased if budget limitations are a concern. Repainting, including the application of glass beads, should be prioritized for the sections with higher defect ratios, which have a corresponding increase in the proportion of lane marking sections that are below the specified retroreflectivity criteria. This is because sections with higher defect ratios often have poor retroreflectivity, but not all sections with poor retroreflectivity have higher defect ratios. Moreover, the length used for averaging and the decision making, which was 100 m in this study, can be altered to improve the work efficiency depending on the work environment.

5. Conclusions

In this study, the pavement lane markings in a metropolitan road network were assessed, and a maintenance strategy was developed to ensure safe driving during both day and night. Field data were collected using vehicle-mounted equipment to measure the retroreflectivity and physical defects of the lane markings. The retroreflectivity, which is crucial for safe driving at night, was analyzed by road classification and lane color over a total length of 6790.34 km. The physical defects of the lane markings were also analyzed over a total length of 502.82 km, and the ratios of defects were automatically calculated using Mask R-CNN and the Otsu Threshold method. The distribution trends and relationship between the retroreflectivity and defect ratios were discussed, and a method for prioritizing maintenance work was suggested. The specific findings are as follows:
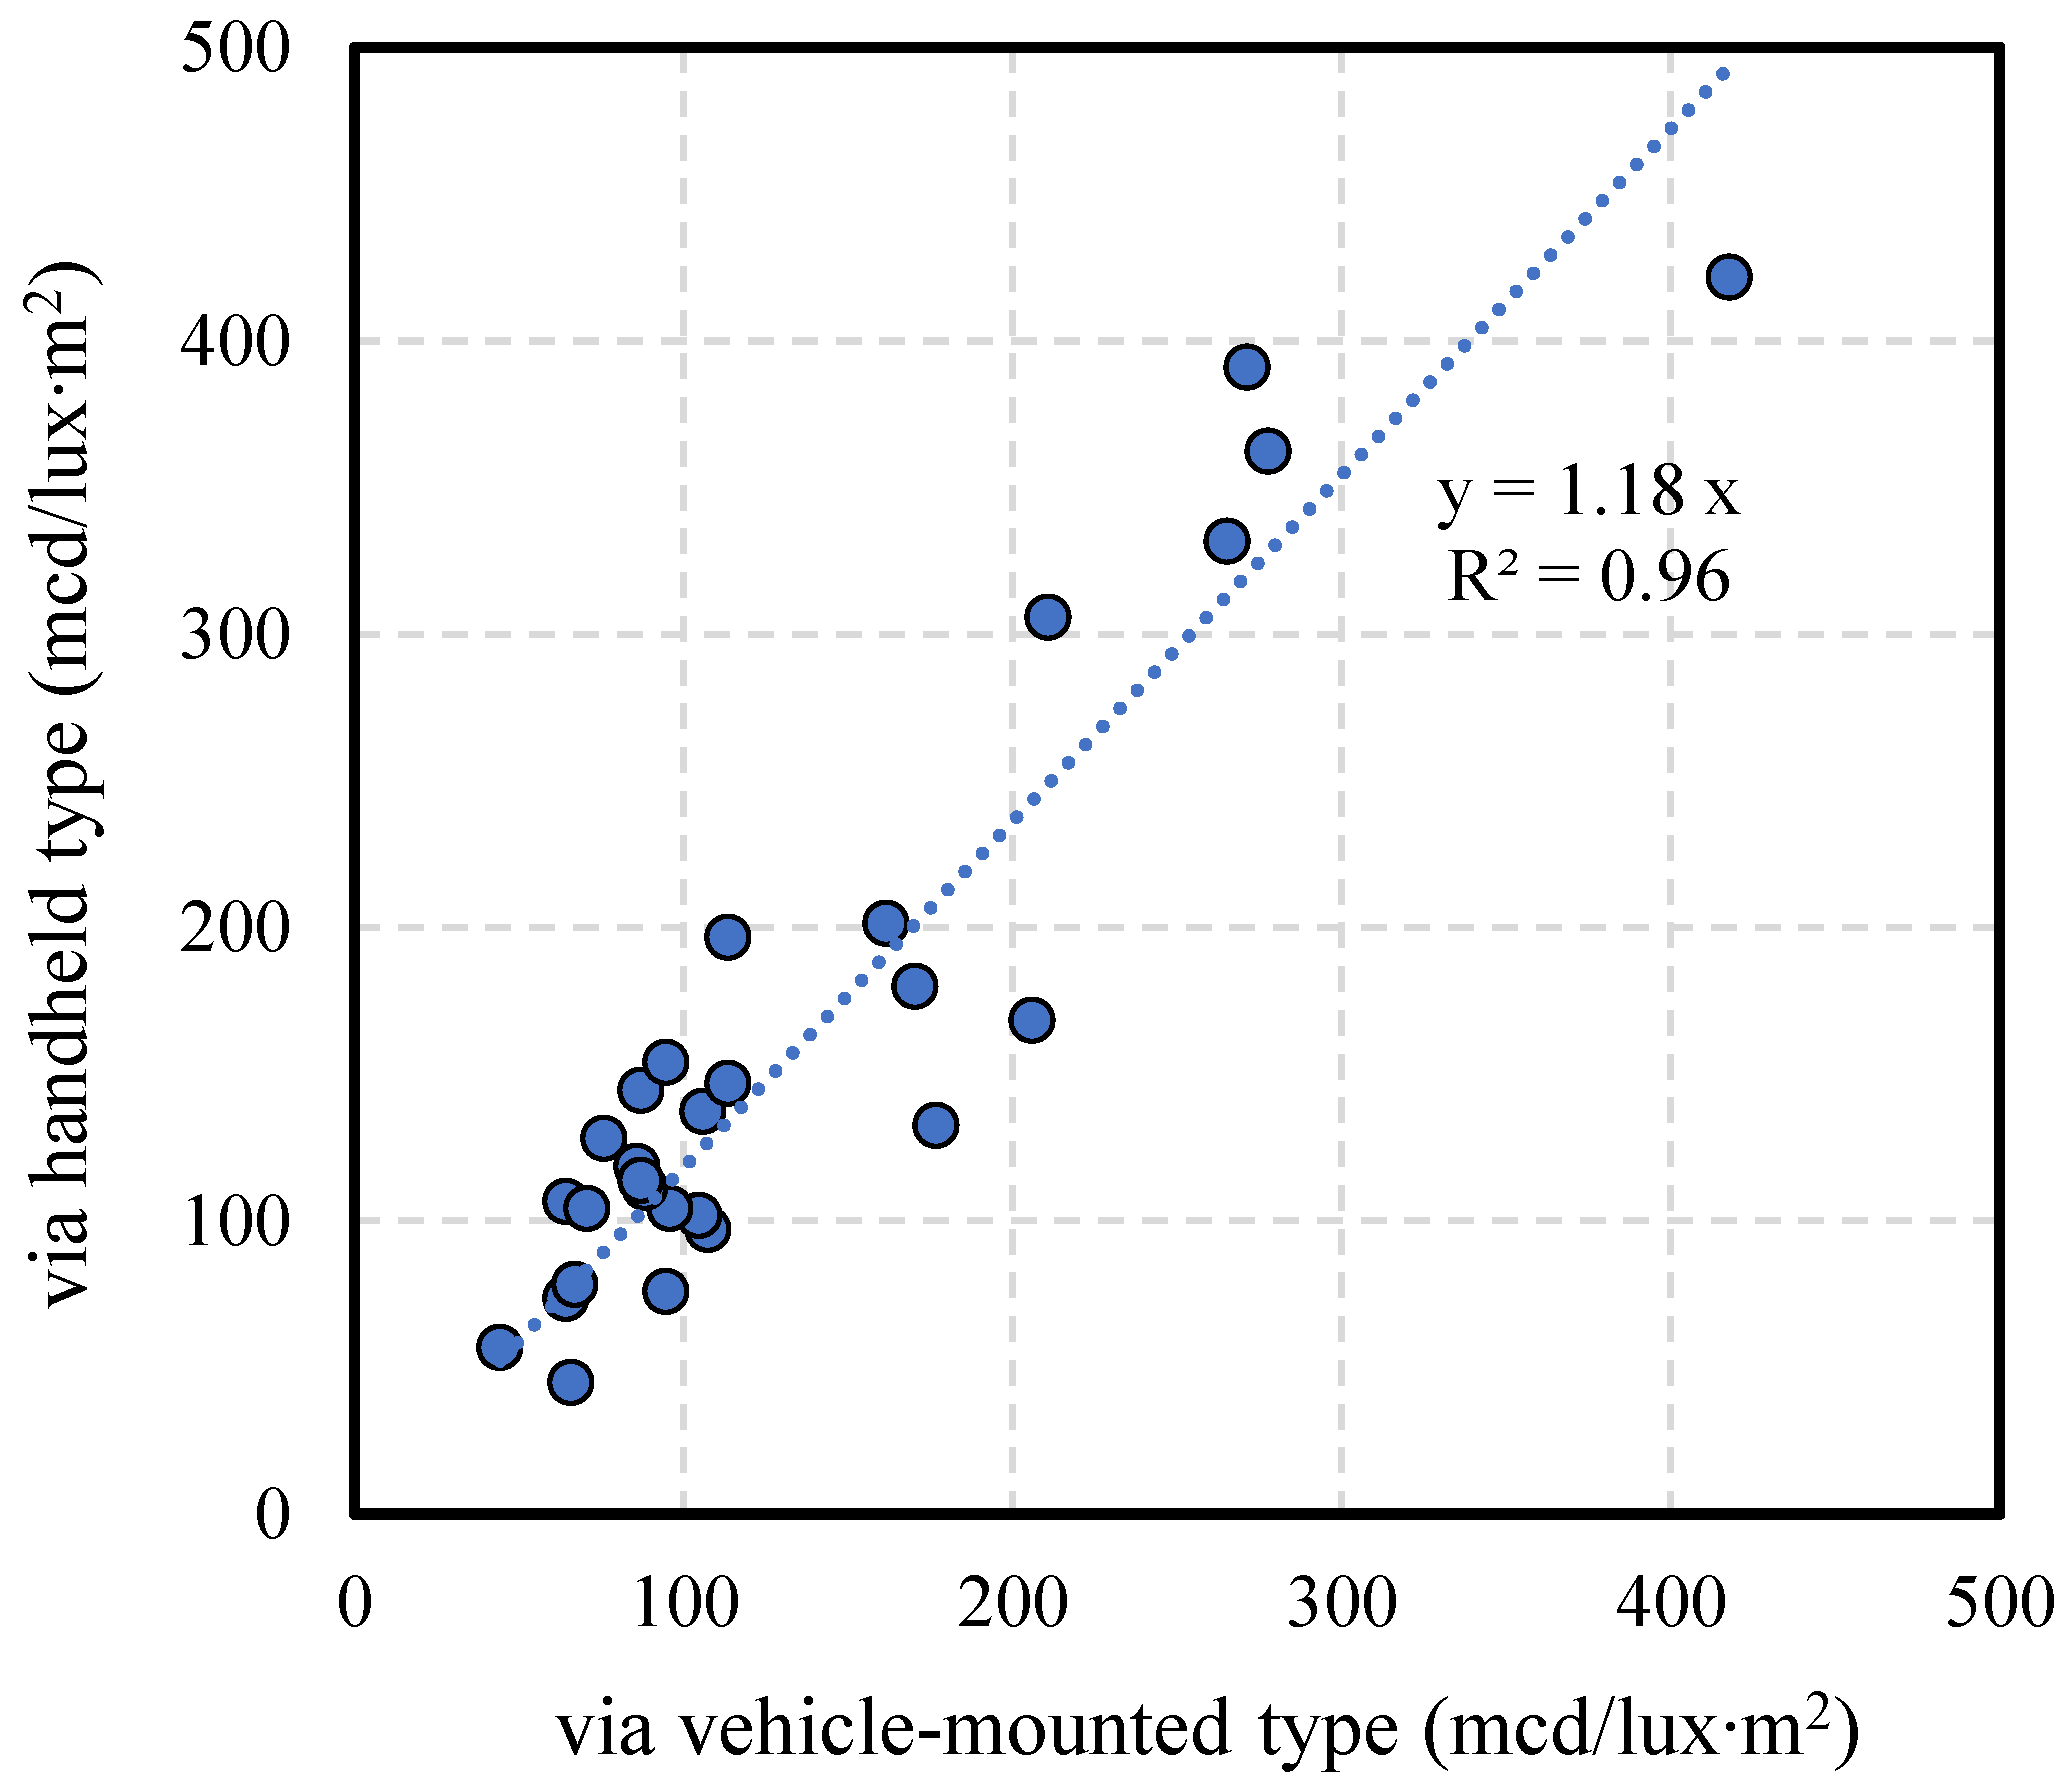
  • The vehicle-mounted retroreflectometer and high-resolution camera enabled the continuous and rapid collection of retroreflectivity data and images of the pavement lane markings without traffic controls. Moreover, the measured retroreflectivity values did not show significant differences compared to the values obtained by the handheld device.
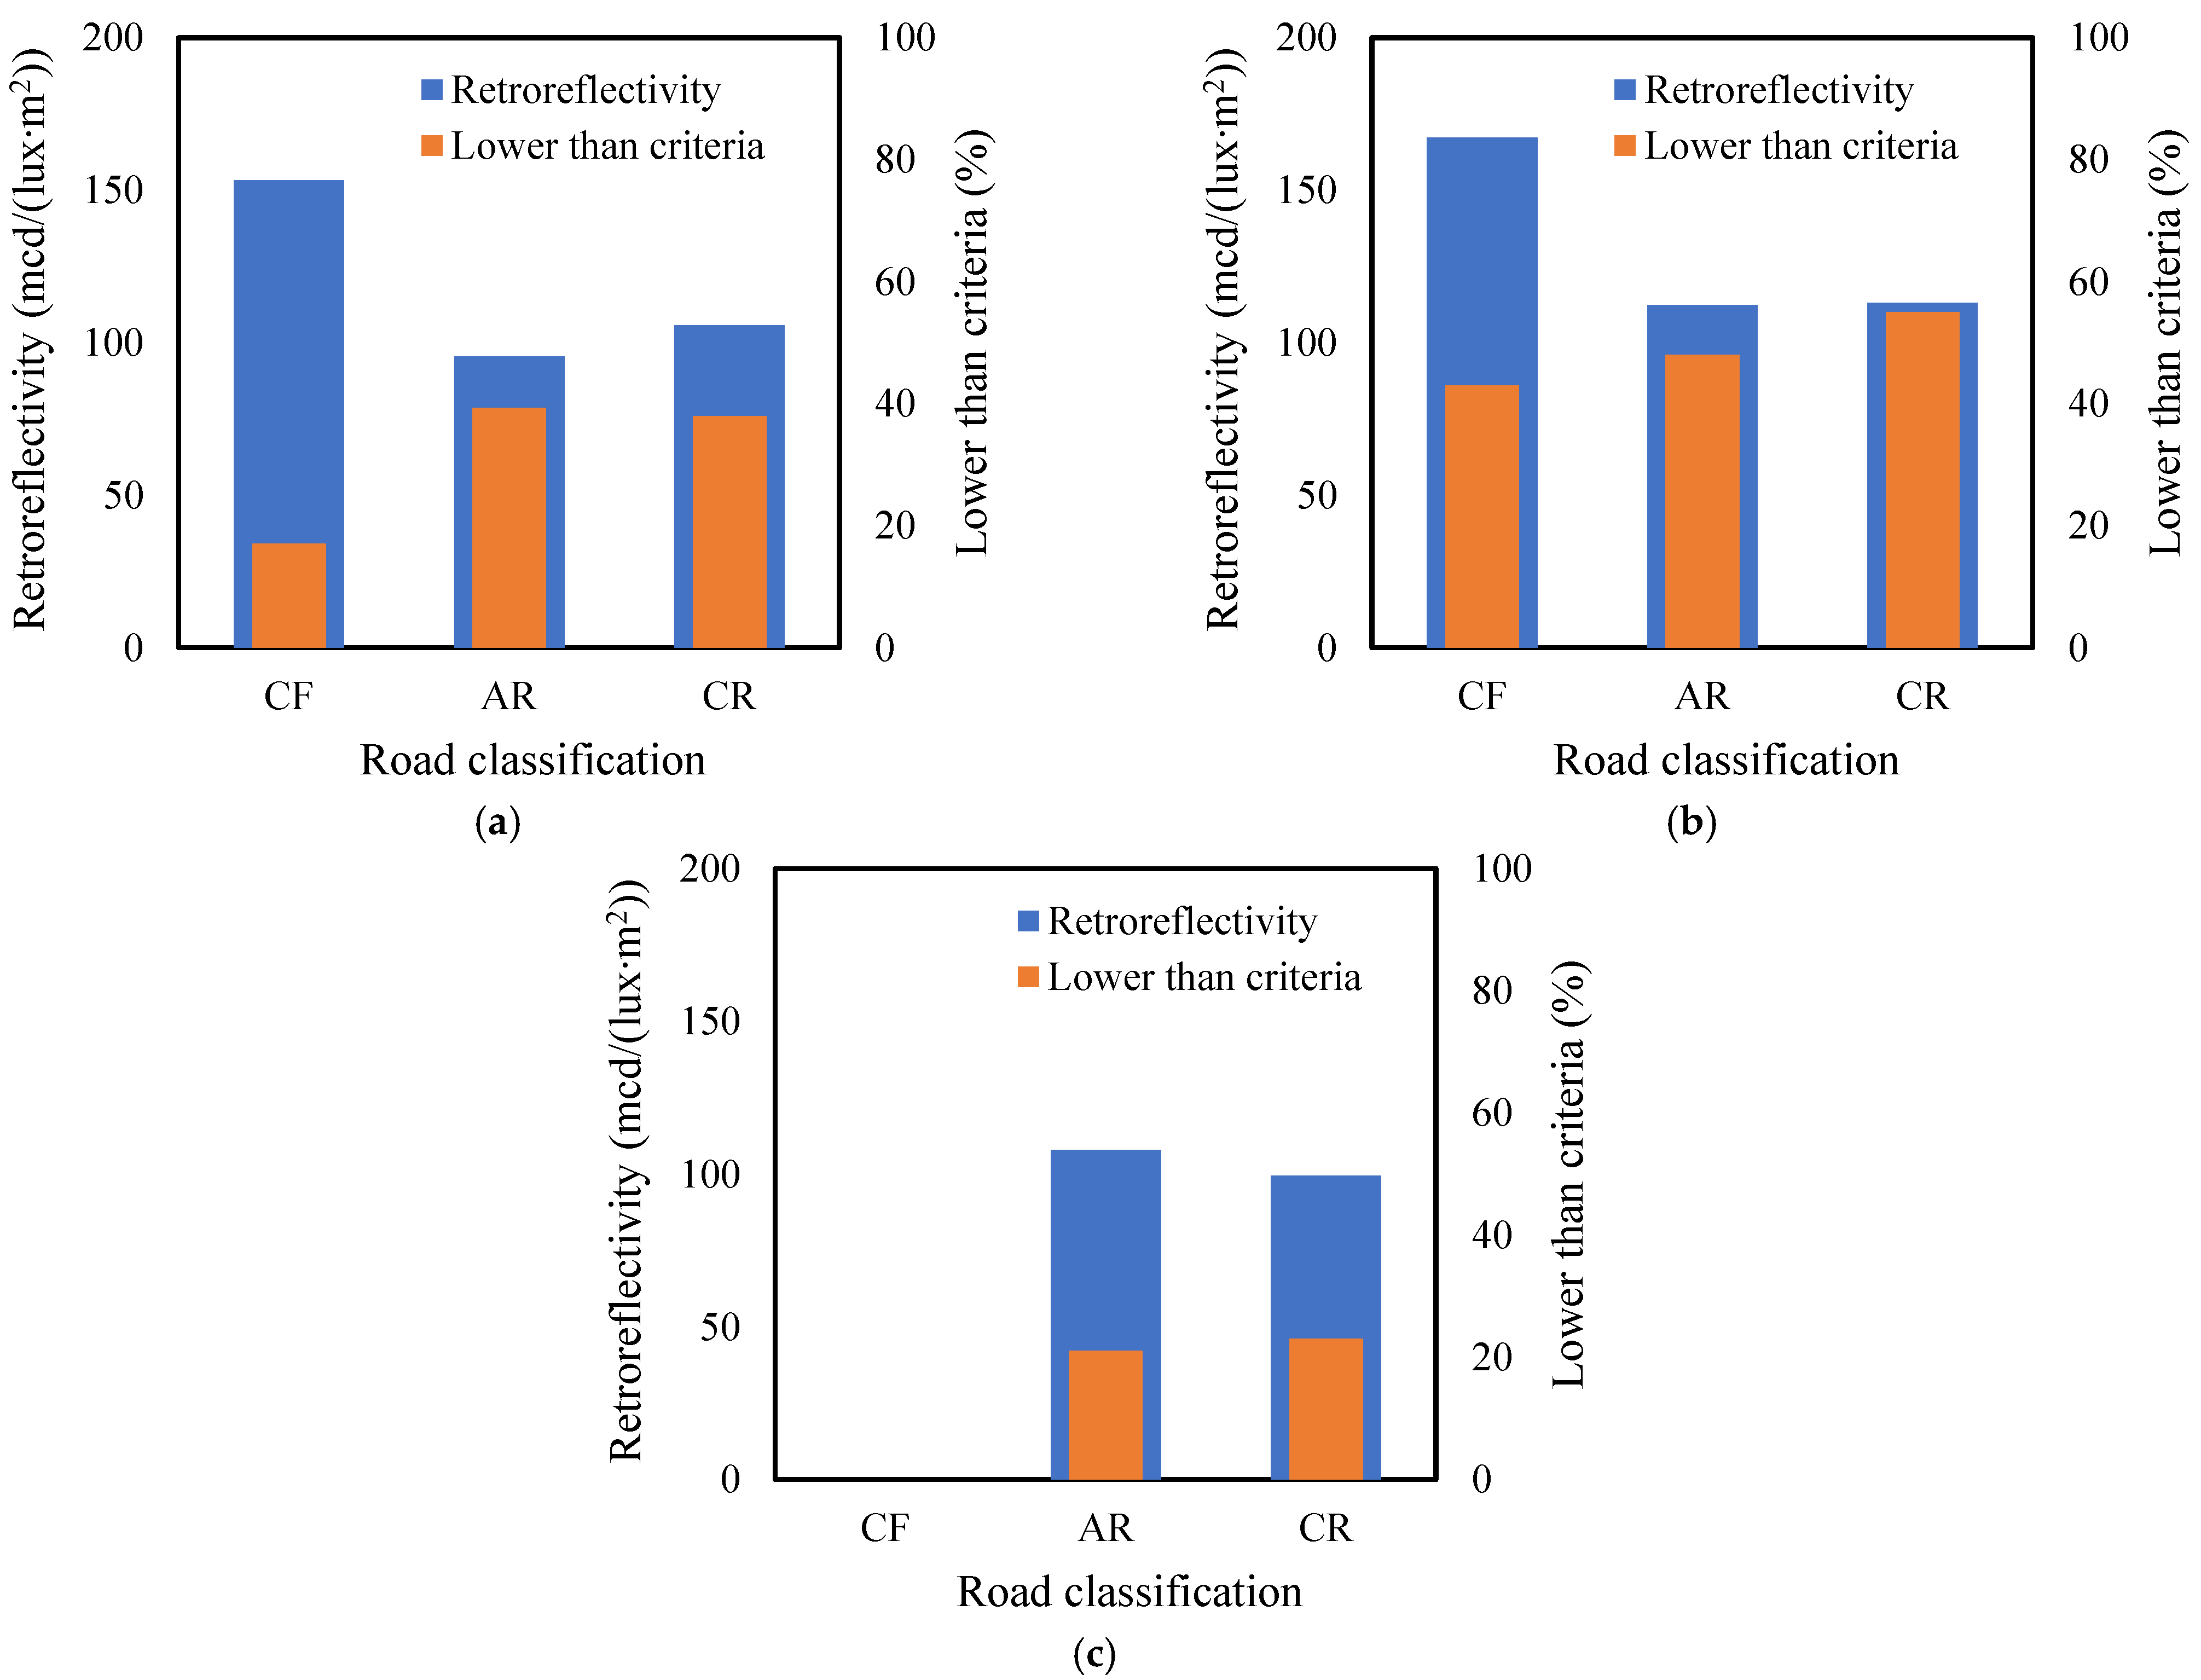
  • The average retroreflectivity measured for CF was higher for both yellow and white lanes compared to AR and CR. Moreover, the ratio of lane markings failing to meet the retroreflectivity criteria was lower in case of CF than in AR and CR. In the case of AR and CR, 48% and 55% of the white lanes, respectively, fell below the retroreflectivity criterion of 100 mcd/(lux∙m2), which suggests a significant loss of the retroreflective performance critical for drivers in routine night-time traffic conditions in the case of the white lanes.
  • The calculated defect ratio of CF was lower than those of AR and CR for both yellow and white lanes. For the white lanes of CF, the defect ratio ranged from 2.52% to 4.09%, while the ratios were determined to be between 5.82% and 6.52% for AR and CR. This means that while CF maintains better painting conditions compared to AR and CR, there is no significant difference in the defect ratios of white lanes according to specific road types, suggesting that their visibility to users is similar across different driving lanes during daytime driving.
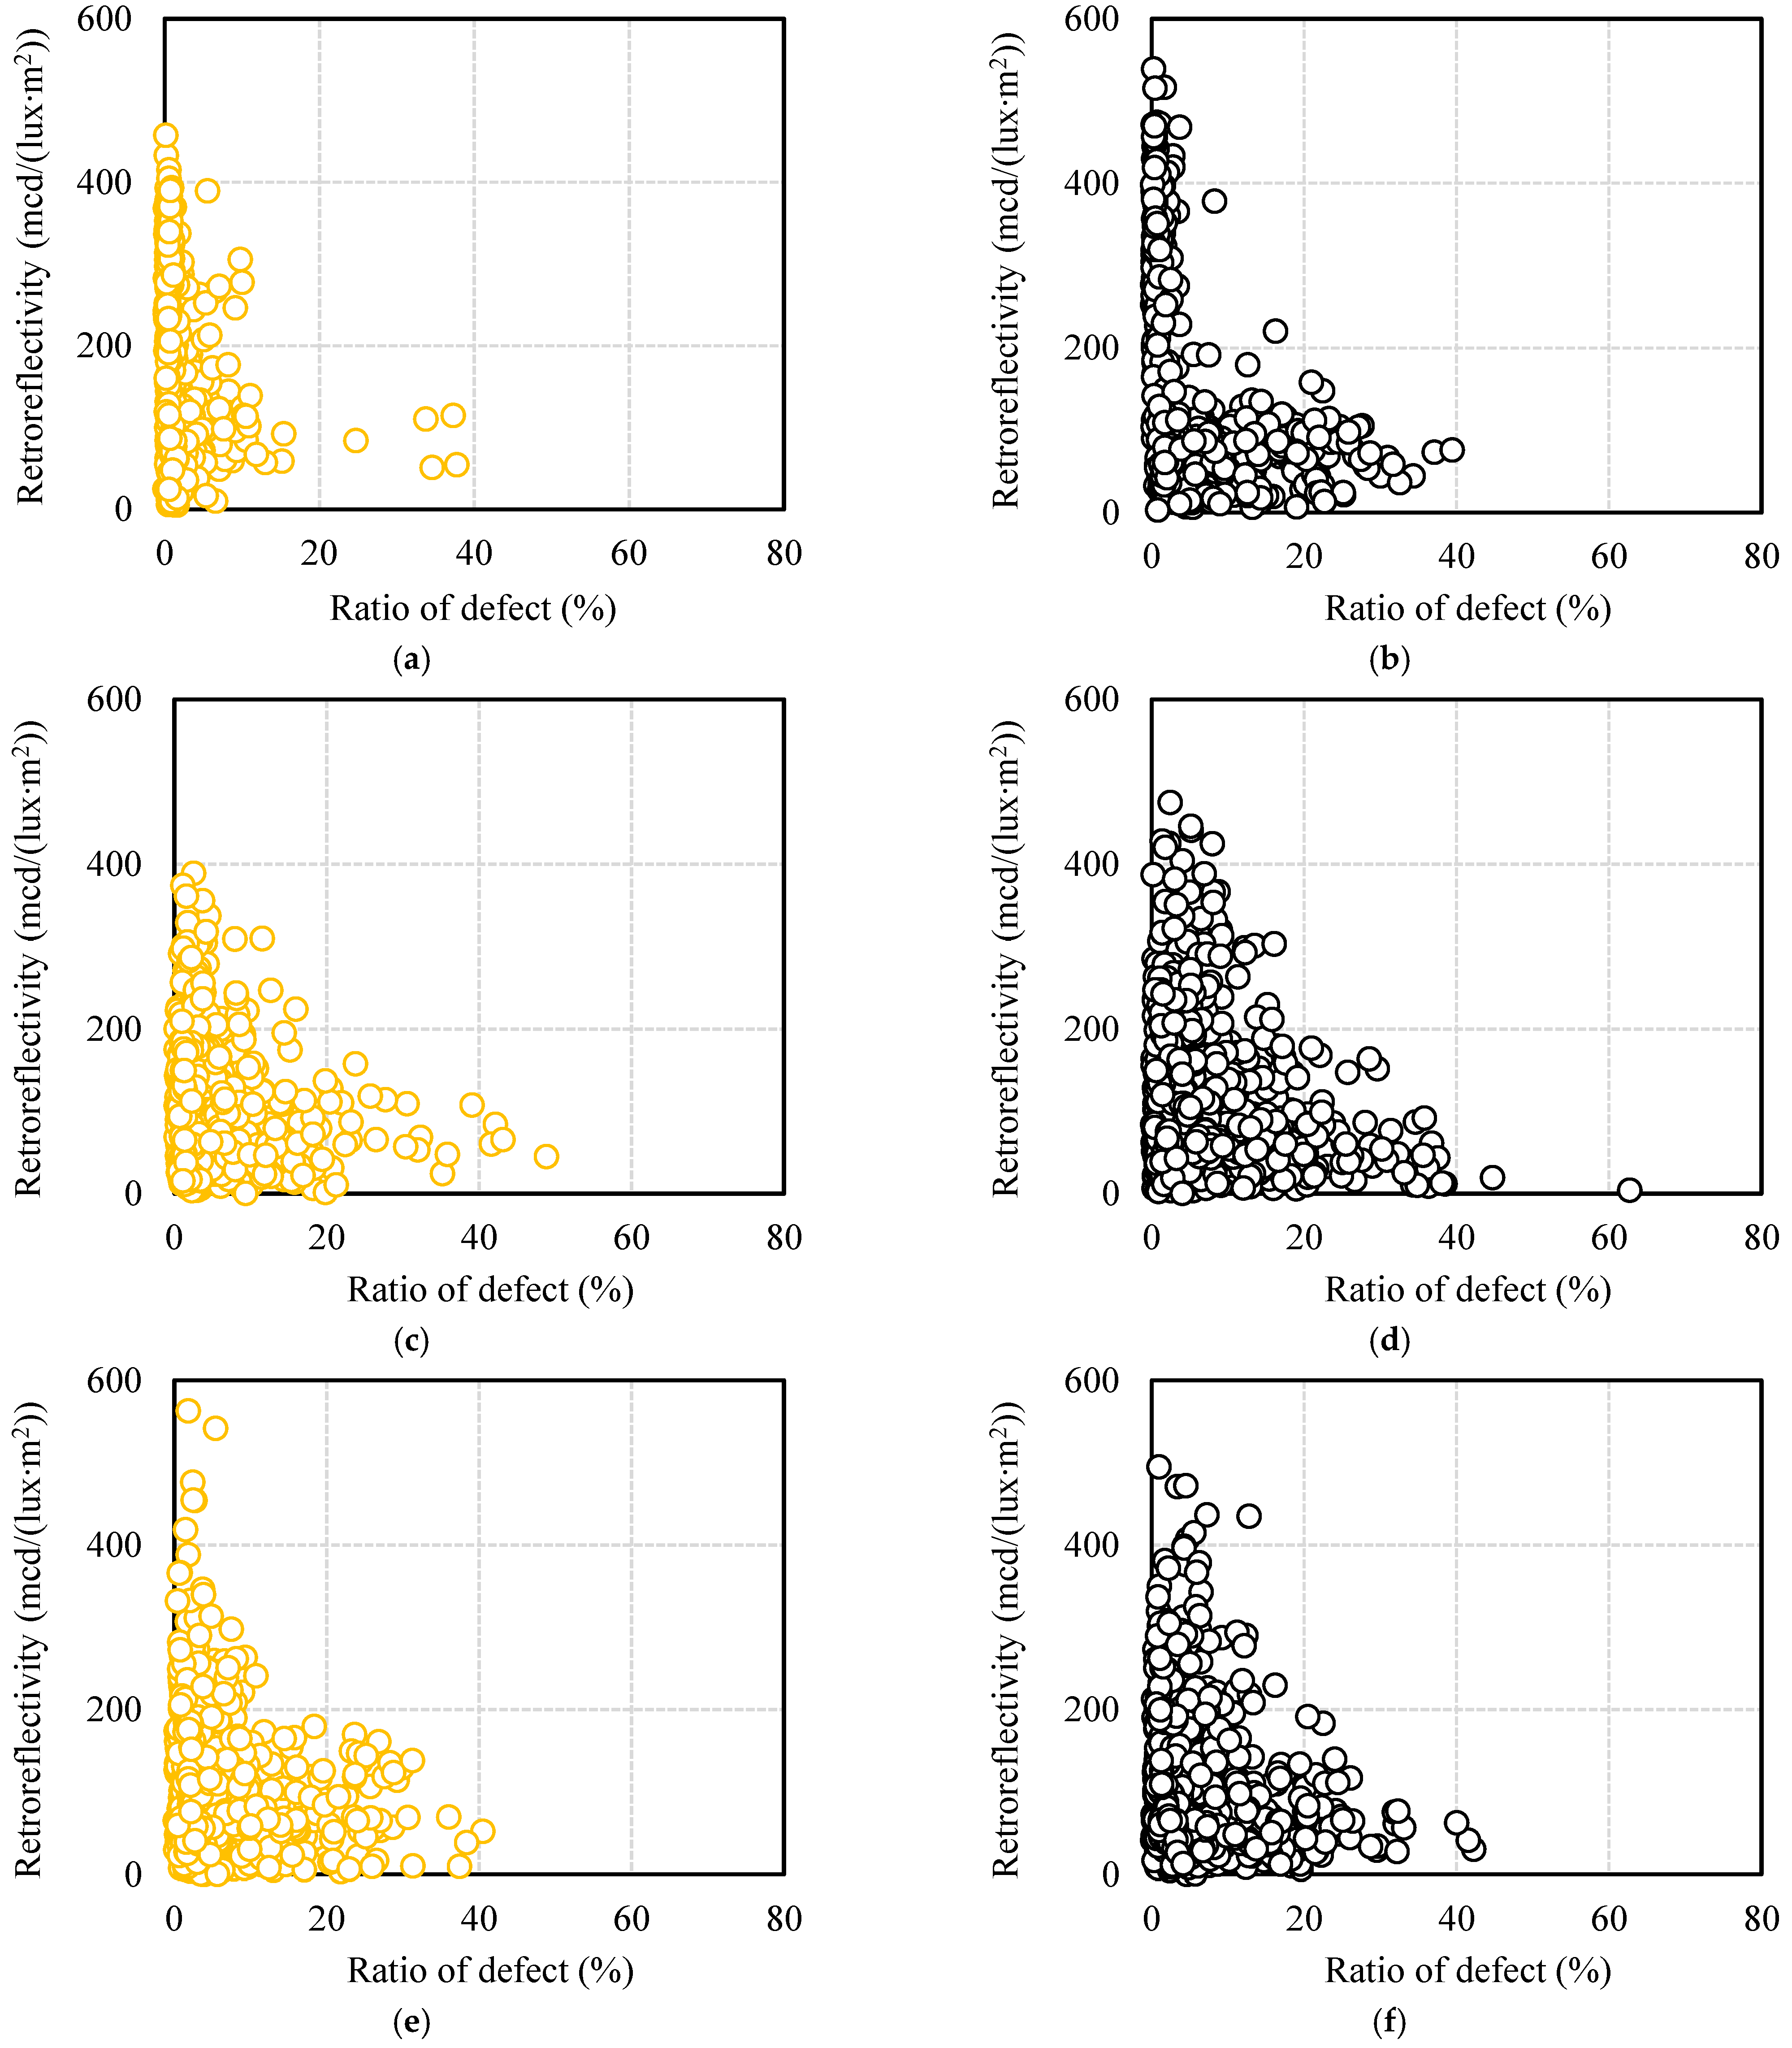
  • The data in the dataset consisting of the defect ratio and retroreflectivity values of pavement lane markings were classified into four categories based on the levels of the defect ratio and retroreflectivity. The data distributions indicated a mix of generally good conditions, poor glass beads conditions, and aging conditions. Thus, the occurrence of lane marking defects and low retroreflectivity in some sections may pose a risk to road safety.
  • The unit length of lane markings used for averaging the retroreflectivity and defect ratio can be adjusted to improve work efficiency depending on the work environment. To select maintenance priorities more efficiently, it is better to first categorize the dataset of lane markings by range of the defect ratio. This is because the sections with higher defect ratios typically have poor retroreflectivity; however, not all sections with poor retroreflectivity necessarily have higher defect ratios.
  • These research results may potentially be used to improve road safety through the prioritization of maintenance work in areas with poor lane marking retroreflectivity and high defect ratios. Efficient resource allocation can be facilitated by informed decision-making regarding maintenance priorities, leading to cost savings through reduced labor and optimized resource utilization. The AI-based image processing techniques and customizable approaches used in this study may allow for the development of tailored and adaptable maintenance strategies which can be scaled and applied to other regions or road networks. Moreover, these results and methods can serve as a foundation for future research exploring additional factors affecting road safety or investigating the integration of advanced technologies for more sophisticated road maintenance strategies.

Author Contributions

Conceptualization, S.L. and B.H.C.; methodology, S.L.; validation, S.L. and B.H.C.; investigation, S.L. and B.H.C.; writing—original draft preparation, S.L. and B.H.C.; writing—review and editing, B.H.C.; visualization, S.L. and B.H.C.; supervision, S.L. and B.H.C. All authors have read and agreed to the published version of the manuscript.

Funding

This research received no external funding.

Data Availability Statement

Not applicable.

Conflicts of Interest

The authors declare no conflict of interest.

References

  1. Avelar, R.E.; Carlson, P.J. Characterizing the association between nighttime crashes and retroreflectivity of edgelines and centerlines on Michigan rural two-lane highways. In Proceedings of the 93rd Annual Meeting of the Transportation Research Record, Washington, DC, USA, 12–16 January 2014. [Google Scholar]
  2. Migletz, J.; Graham, J.L. Long-Term Pavement Marking Practices: A Synthesis of Highway Practice; Transportation Research Board: Washington, DC, USA, 2002. [Google Scholar]
  3. Smadi, O.; Hawkins, N.; Nlenanya, I.; Bektaş, B.A. Pavement Markings and Safety; Minnesota State University: Mankato, MN, USA, 2010. [Google Scholar]
  4. Smadi, O.; Souleyrette, R.R.; Ormand, D.J.; Hawkins, N. Pavement marking retroreflectivity: Analysis of safety effectiveness. Transp. Res. Rec. 2008, 2056, 17–24. [Google Scholar] [CrossRef]
  5. Zhang, G.; Hummer, J.E.; Rasdorf, W. Impact of bead density on paint pavement marking retroreflectivity. J. Transp. Eng. 2010, 136, 773–781. [Google Scholar] [CrossRef]
  6. Bahar, G.; Masliah, M.; Erwin, T.; Tan, E.; Hauer, E. Pavement Marking Materials and Markers: Real-World Relationship between Retroreflectivity and Safety over Time; Transportation Research Board: Washington, DC, USA, 2006. [Google Scholar]
  7. Mull, D.M.; Sitzabee, W.E. Paint pavement marking performance prediction model. J. Transp. Eng. 2012, 138, 618–624. [Google Scholar] [CrossRef]
  8. Jiang, Y. Durability and Retro-Reflectivity of Pavement Markings (Synthesis Study); Joint Transportation Research Program, Indiana Department of Transportation and Purdue University: West Lafayette, IN, USA, 2008. [Google Scholar]
  9. Parker, N.A.; Meja, M.S.J. Evaluation of performance of permanent pavement markings. Transp. Res. Rec. J. Transp. Res. Board 2003, 1824, 123–132. [Google Scholar] [CrossRef]
  10. Xu, S.; Wang, J.; Wu, P.; Shou, W.; Wang, X.; Chen, M. Vision-based pavement marking detection and condition assessment—A case study. Appl. Sci. 2021, 11, 3152. [Google Scholar] [CrossRef]
  11. Burghardt, T.E.; Popp, R.; Helmreich, B.; Reiter, T.; Böhm, G.; Pitterle, G.; Artmann, M. Visibility of various road markings for machine vision. Case Stud. Constr. Mater. 2021, 15, e00579. [Google Scholar] [CrossRef]
  12. Babić, D.; Babić, D.; Fiolić, M.; Eichberger, A.; Magosi, Z.F. Impact of road marking retroreflectivity on machine vision in dry conditions: On-road test. Sensors 2022, 22, 1303. [Google Scholar] [CrossRef] [PubMed]
  13. Inzerillo, L.; Di Mino, G.; Roberts, R. Image-based 3D reconstruction using traditional and UAV datasets for analysis of road pavement distress. Autom. Constr. 2018, 96, 457–469. [Google Scholar] [CrossRef]
  14. Alzraiee, H.; Ruiz, A.L.; Sprotte, R. Detecting of pavement marking defects using faster R-CNN. J. Perform. Constr. Facil. 2021, 35, 04021035. [Google Scholar] [CrossRef]
  15. Ren, S.; He, K.; Girshick, R.; Sun, J. Faster R-CNN: Towards real-time object detection with region proposal networks. arXiv 2015, arXiv:1506.01497v3. [Google Scholar] [CrossRef] [PubMed] [Green Version]
  16. Pike, A.M.; Ballard, L.D.; Carlson, P.J. Evaluation of retroreflectivity measurement techniques for profiled and rumble stripe pavement markings. Transp. Res. Rec. J. Transp. Res. Board 2011, 2258, 80–87. [Google Scholar] [CrossRef]
  17. Re, J.M.; Carlson, P.J. Practices to Manage Traffic Sign Retroreflectivity; Transportation Research Board: Washington, DC, USA, 2012. [Google Scholar]
  18. Yang, P.; Song, W.; Zhao, X.; Zheng, R.; Qingge, L. An improved Otsu threshold segmentation algorithm. Int. J. Comput. Sci. Eng. 2020, 22, 146–153. [Google Scholar] [CrossRef]
  19. Marzougui, M.; Alasiry, A.; Kortli, Y.; Baili, J. A lane tracking method based on progressive probabilistic hough transform. IEEE Access 2020, 8, 84893–84905. [Google Scholar] [CrossRef]
  20. Han, E.; Kang, J.H.; Kim, C.H.; Park, S.; Yun, I. Study on the minimum recursive reflection performance according to the color of road surface. J. Korea Inst. Intell. Transp. Syst. 2020, 19, 37–48. [Google Scholar] [CrossRef]
Figure 1. Comparison of lane markings in terms of visibility at night as a result of retroreflectivity performance: (a) adequate visibility and (b) inadequate visibility.
Remotesensing 15 01812 g001
Figure 2. Comparison of lane marking conditions featuring glass beads: (a) newly applied white, (b) contaminated white, (c) newly applied yellow, and (d) contaminated yellow.
Remotesensing 15 01812 g002
Figure 3. Overview of the retroreflectivity investigation program: (a) vehicle-mounted retroreflectometer, (b) real-time monitoring system, and (c) illustration of the scanning procedure for a four-lane road.
Remotesensing 15 01812 g003
Figure 4. Comparison of retroreflectivity measurements obtained using vehicle-mounted and handheld devices.
Remotesensing 15 01812 g004
Figure 5. Lane marking extraction from a 2D road surface image using Mask R-CNN.
Remotesensing 15 01812 g005
Figure 6. Automatic calculation of pavement lane marking defect ratios using the Otsu Threshold method.
Remotesensing 15 01812 g006
Figure 7. Image for validating the Otsu Threshold method.
Remotesensing 15 01812 g007
Figure 8. Average retroreflectivity of lane markings by road classification with ratios below re-painting criteria: (a) yellow lanes, (b) white lanes, and (c) blue lanes.
Remotesensing 15 01812 g008
Figure 9. Average retroreflectivity of white lanes across road classifications.
Remotesensing 15 01812 g009
Figure 10. Average retroreflectivity of white lanes compared to traffic volume on CF.
Remotesensing 15 01812 g010
Figure 11. Lane marking defect ratios (a) by road classification and (b) by number of white lanes.
Remotesensing 15 01812 g011
Figure 12. Data distribution of defect ratio and retroreflectivity with four assessment labels.
Remotesensing 15 01812 g012
Figure 13. Data distributions of retroreflectivity and defect ratio for yellow lanes: (a) CF, (b) AR, and (c) CR.
Remotesensing 15 01812 g013
Figure 14. Data distribution of retroreflectivity and defect ratios for white lane markings of CF by the number of lanes: (a) 1st lane, (b) 2nd lane, (c) 3rd lane, and (d) 4th lane.
Remotesensing 15 01812 g014
Figure 15. Data distribution of the retroreflectivity and defect ratios of white lane markings on AR by the number of lanes: (a) 1st lane, (b) 2nd lane, (c) 3rd lane, and (d) 4th lane.
Remotesensing 15 01812 g015
Figure 16. Data distribution of retroreflectivity and defect ratios for white lane markings on CR by the number of lanes: (a) 1st and (b) 2nd lanes.
Remotesensing 15 01812 g016
Figure 17. Data distribution of retroreflectivity and defect ratios for lane markings by road type and color: (a) CF—yellow, (b) CF—white, (c) AR—yellow, (d) AR—white, (e) CR—yellow, and (f) CR—white.
Remotesensing 15 01812 g017
Figure 18. Ratios of retroreflectivity below the criteria according to defect ratio ranges by road type and color: (a) CF—yellow, (b) CF—white, (c) AR—yellow, (d) AR—white, (e) CR—yellow, and (f) CR—white.
Remotesensing 15 01812 g018
Table 1. Distances examined for the assessment of retroreflectivity and defect ratios of pavement lane markings, categorized by road classification and color (units: km).
Investigation
Item
Road
Classification
ColorTotal
YellowWhiteBlue
RetroreflectivityCF378.111184.51-1562.62
AR777.941782.70214.052774.69
CR1048.271391.8012.962453.03
Total2204.324359.01227.016790.34
Defect ratioCF10.2264.29-74.52
AR69.86155.61-225.47
CR93.59109.24-202.83
Total173.67329.14-502.82
Disclaimer/Publisher’s Note: The statements, opinions and data contained in all publications are solely those of the individual author(s) and contributor(s) and not of MDPI and/or the editor(s). MDPI and/or the editor(s) disclaim responsibility for any injury to people or property resulting from any ideas, methods, instructions or products referred to in the content.

