Abstract
Satellite-observed night-time light (NTL) data provide a measure of the lighting brightness seen from space at different times and spatial and temporal resolutions, thus offering opportunities to explore them in many applications at different spatial locations (global, regional, local). However, most applications to date have been at relatively large spatial scales, despite the need to measure indicators at a local level. This paper sets out an analysis of the potential of NTL data for populating indicators at more local (neighbourhood, street) scales. We first reviewed the overall potential of NTL data for social indicators at different spatial scales by using a systematic search of the literature and applying the Maturity Matrix Framework (MMF). We also explored a case study (Durango State, Mexico) using Visible Infrared Imaging Radiometer Suite (VIIRS) imageries, other geospatial data, and the social gap index (SGI) to identify social gaps at the local scale. The literature review showed that NTL can play a role in supporting 49 out of 192 sustainable development goal (SDG) indicators having a focus on social issues, but most of these have been explored at the global or country scales. In the case study, we found that low radiance is indeed associated with higher SGI levels (i.e., more social deprivation) and vice versa. However, more research is needed from other contexts to support a link between NTL radiance levels and social indicators at local scales.
1. Introduction
Night-time light (NTL) data have increasingly become useful as a means for assessing various indicators important in sustainable development, and a summary of the characteristics of existing satellite sources of NTL data is provided in Table 1. The era of NTL imagery began when Croft [1] observed faint emission sources, such as city lights, auroras, and gas flares, from night-time photographs taken by the Defence Meteorological Satellite Program’s Operational Linescan System (DMSP/OLS), which was originally designed to monitor cloud top temperatures in the early 1970s. In 1992, the National Oceanic and Atmospheric Administration/National Geophysical Data Center (NOAA/NGDC) developed an open access digital archive. DMSP/OLS collected night-time images for 20 years (1992–2013) at a coarse spatial resolution between 1 and 2.7 km over swaths of 3000 km and covered the entire planet every 24 h. These images have been processed into four datasets: daily and monthly datasets, cloud-free coverage, a composite of night-time stable light, and average visible data [2]. These products can be openly accessed from three different sources [3,4,5] and have resulted in many applications [6].
The Visible Infrared Imaging Radiometer Suite (VIIRS) sensor on board the Suomi NPP was launched in October 2011 and features a panchromatic sensor for measuring night-time lights through the Day and Night Band (DNB) sensor. The VIIRS/DNB brought significant improvements over the DMSP/OLS sensor through its higher spatial resolution of 742 m, free access to daily images, and improved radiometrically calibrated products; thus, blooming effects have been largely mitigated [7]. From April 2012 until the present, NPP-VIIRS/DNB global, monthly and annual composites have been available and freely accessible [3,4,5] along with other products such as VIIRS night fire, VIIRS gas flaring, VIIRS boat detection, and Standard Black Marbles [4].
Astronaut photography has been taken from various NASA missions, including the Space Shuttle missions and the International Space Station (ISS). The database of these photos is extensive, includes both daytime and night-time photos, and is freely accessible via the Gateway of Astronaut Photography of the Earth [8]. However, one of the main problems of astronaut photography is the motion blur produced by the orbital movement of the ISS [9]. To overcome this issue, in 2012, ESA mounted aboard the space station a special tripod called Nightpod. The mechanism incorporated into the camera allowed it to capture the Earth at night in greater detail [10].
The Luojia 1-01 (LJ1-01) satellite was built by Wuhan University and launched in June 2018, providing night-time images at 130 m resolution due to its onboard complementary high-sensitivity planar array metal oxide semiconductor [11]. The LJ1-01 is the world’s first professional nigh-time satellite with a swath width of 250 km and covers China and Southeast Asia, North America and a good part of Europe’s surface every 15 days, and its data are freely available for research purposes [12]. These night-time images play a critical role in achieving more accurate results in detecting distinct energy-releasing objects, such as urban impervious surfaces [13], population density and human activities [14]. Further, researchers have found it feasible to detect urban expansion through the combination of LJ1-01 data and other imagery data [15].

Table 1.
Satellite and Sensor capabilities in capturing NTL.
Table 1.
Satellite and Sensor capabilities in capturing NTL.
| Satellite/Sensors | Spatial Resolution | Temporal Resolution | Overpass Time | Coverage | Data Availability | Products | Product Source |
|---|---|---|---|---|---|---|---|
| DMSP/OLS | 1–2.7 km (depending on the product) and 30 arc-seconds | Every 24 h | 20:00–22:00 | 65°S to 75°N | 1992–2013 | Cloud-free coverage; composite of night-time stable light; average visible data | [3] [4] [5] |
| VIIRS/DNB | 742 m (one pixel) and 15 arc-seconds | Every 24 h | 01:30 (+/− 1 h depending on the latitude) | 65°S to 75°N | April 2012–present | NTL annual and monthly composites; VIIRS night fire; VIIRS gas flaring; VIIRS boat detection; standard Black Marble. | [3] [4] [5] |
| CubeSat (AeroCube-4 and 5) * | 500 m and 124 m | Inconsistent | 12–4 a.m. | Different areas across the planet | 2014 and 2015 (both experimental) | High spatial resolution imagery | [16] |
| International Space Station (ISS) | 5–200 m | Occasionally | 11 p.m. | Varies | 2003–present (occasionally) | Photos of Earth during the night | [8] [17] |
| LJ1-01 | 130 m | 15 days | 10:30 p.m. | China, Southeast Asia, Europe, South and North America, and eastern Australia. | June 2018–March 2019 | High spatial resolution imagery | [12] |
| EROS-B * | 0.7 m | 3 days (30° off-nadir) 6 days (15° off-nadir) | Varies (equatorial crossing time—12:20 a.m.) | Depends on the season and sun’s position | June 2013–present | VHR of night-time imagery with panchromatic band | [18] |
| JL1-3B and JL1-07/08 * | <1 m | At least once per day | Around 10 p.m. | Images are acquired on request. | 2018–present 2019–present | VHR of night-time imagery with panchromatic band and improved multispectral (red, green, and blue) bands. | [19] |
* Commercial satellite imagery.
The first commercial satellites to acquire data at night at 0.7 m spatial resolution were the EROS-B satellites, and the data have become publicly available since 2013 via ImageSat International [20]. Jilin-1 (JL1)-3B, the first commercial satellite to offer multispectral night-time light images at 0.92 m spatial resolution, launched in 2017, and was followed by the JL1-07/08 satellite launched in 2018. Both have a panchromatic band, and the latter brought improvements to the multispectral bands (i.e., blue, green, red, red edge, and near-infrared) [19]. Likewise, a variety of CubeSats have been launched in recent years, including the CubeSat Multispectral Observing System (CUMULOS), as well as the multispectral AeroCube 4 and 5, both experimental, offering medium spatial resolution and inconsistent coverage [16].
Various studies have indicated that NTL data have a high correlation with indicators that have commonly been used in sustainable development and are at the heart of the Sustainable Development Goals (SDGs) initiative mediated by the United Nations. The SDGs have an associated set of targets and indicators, and the intention is for all countries to meet these targets by 2030. The SDG indicators span environmental, economic, and social concerns [21], but while there has been much progress in the use of Earth Observation (EO) to monitor environment issues such as land degradation and deforestation, less progress has been made with economic and social indicators. Included in the latter, for example, would be indicators of employment, poverty and exclusion, life expectancy and welfare, living conditions and human resources [22,23,24,25]. NTL data have been used to assess indicators such as GDP per capita (a proxy for income) [26,27,28,29], electrification rates and access to electrification in rural areas [30], population density [31,32,33] and global population [34], urbanisation dynamics [35], socioeconomic activities [36,37,38], quality of life [39], regional inequality [40], poverty [41,42], fishing activities [43,44], human rights [45], incidence of cancer [46,47,48] and political conflicts and wars [49]. Moreover, poverty estimation was initially assessed through NTL at the global scale because of the strong correlation between economic activity and light intensity [50]. Elvidge et al. (2009) [41] developed the first global poverty map, and Wang et al. (2012) [50] estimated poverty at the county level using night-time light images. In addition, Sutton et al. (1997) [51] correlated DMSP night-time satellite data with population density and found that saturated pixels of DMSP imagery can predict population size.
Most of the published studies to date have been based on relatively large spatial scale assessments (i.e., country and regions), and few studies have explored the potential of night-time light data for social indicators at more local scales such as neighbourhoods within a city. However, the identification of areas of poverty and weak infrastructure and services at the local scale is critical for strategic policy interventions, especially for regions with sparse statistical data. Using satellite imagery and geospatial data means, at least in theory, such socioeconomic evaluations could be performed with great efficiency and relative cost-efficiency when compared with more traditional approaches to data collection. However, the potential for use of NTL data at such local scales has received relatively little attention to date. The research reported in this paper aimed to address this important gap in knowledge, and the approach taken was first to review the potential of night-time satellite data for social indicators (within the SDG framework and others) at all scales and spatial resolutions. This review did not focus on all of the literature in this field, as this has been covered previously, including a detailed review published in this journal [6,52], but rather on those works that suggest a potential to use NTL data to specifically support social indicators within the SDG framework [53], as well as revealing gaps in the literature where future research should be directed and explored. As part of this analysis, the potential of using data from NTL imagery for populating SDG social indicators (listed in Tables S1–S3) was assessed using the Matrix Maturity Framework (MMF) [54], representing the first time that this has been done with such data. Secondly, to illustrate the challenges involved in such work, the paper presents a case study of the use of VIIRS, very high resolution (VHR) daytime imagery and Google Street View (GSV) imagery coupled with the social gap index (SGI) at a local scale in Santiago Papasquiaro in Durango State, Mexico.
2. Materials and Methods
2.1. Literature Acquisition and Evaluation of All NTL Satellites for Social Indicators
An outline of the approach taken with the analysis of the literature is provided as Figure 1. The literature was first sourced via Google Scholar using the search terms “night-time” + “sensors” + “satellite” + “data” + “datasets”. To address research themes, a more granular search was implemented using a specific name of the satellite or sensor along with the terms “night-time” and “main application” (acquired from the first step). The final search was conducted by using the name of a research theme (which emerged from previous steps) and the satellite/sensor that was not found in the previous step to ensure that no themes had been missed. For example, in the first search, “human and economic” application might have been generated, while in the second step when combining the satellite/sensor name, e.g., “DMSP” + “night-time” + “human and economic” resulted in the “Poverty evaluation” research theme; thus, later we queried the research theme with all other NTL satellite names e.g., “EROS-B” + “Poverty evaluation”. Likewise, we included information about the scalability of the approach reviewed (spatial resolution and spatial location) so that for each publication cited, we added one of the following abbreviations: L—local (small town, rural, or neighbouring level), C—City, CT—Country, R—Regional, G—Global.
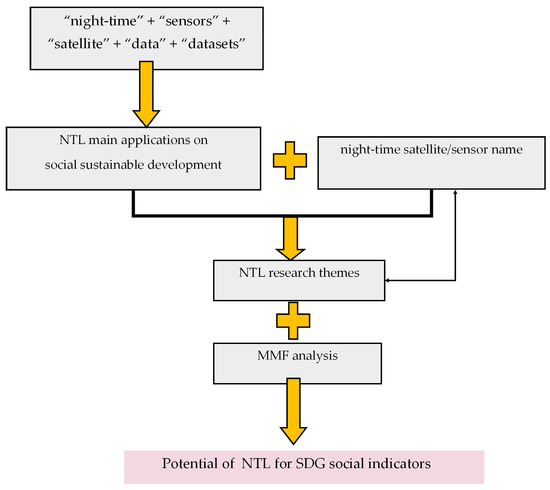
Figure 1.
Flowchart of the NTL satellites for social indicators analysis.
The final step of the analysis of the literature was based on the latest version of the Maturity Matrix Framework (MMF) developed by Andries et al. (2018) [54]. MMF is an analytical framework designed to assess the potential of EO to populate SDG indicators. MMF is based on six premises (uncertainty assessment (A), directness (B), completeness (C), requirement for non-EO information (D), practicability (E), and cost-effectiveness analysis (F)), where each premise has five scored components (from 1 to 5), that generate an aggregated assessment score, referred to as the Maturity Matrix Score (MMS). MMS is calculated as follows: MMS = (Premise A + Premise B + Premise C + Premise D + Premise E + Premise F)/6, and was applied to the reviewed papers and their approaches linked to the relevant indicators, aiming to understand the potential utility of EO data to populate SDG indicators. Examples of the application of MMF and conclusions that can be reached are provided in [54]. However, here it was applied more specifically for NTL data and SDG social indicators (listed in Tables S1–S3). Indicators with MMS values between 1 and 2 (colour coded as red) had weak support from satellite data; indicators with MMS values between 2 and 4 (amber) had partial support; and indicators with MMS values between 4 and 5 (green) had strong support. The resulting MMS scores were tabulated.
2.2. Case Study
2.2.1. Study Area and Data Sources
Santiago Papasquiaro (SP) is a city located in the municipality of SP, one of 39 municipalities of Durango State, Mexico (Figure 2). In Mexico, the administrative hierarchy is State (e.g., Durango), municipality (e.g., Santiago Papasquiaro) and locality (e.g., Santiago Papasquiaro, El Aguajito, etc.). According to the 2020 census, the population of SP city was 30,063, and that of the municipality was 48,549 [55]. The SP municipality comprises 416 localities, 22 of which were included in this study, and represents an area of relatively high social deprivation, although this can vary significantly between localities. CONEVAL (acronym in Spanish for Consejo Nacional de Evaluacion de la Politica de Desarrollo Social-National Council for the Evaluation of Social Development Policy) calculated the social gap index (SGI) (Indice de Rezago Social) for states, municipalities, and localities across Mexico in 2000, 2005, 2010 and 2020 across 32 states, 2469 municipalities and 108,149 localities, according to the methodology described in [56]. The SGI is a weighted measurement that comprises a range of social deprivation indicators covering education, access to health services, basic services in the dwelling, and assets in people’s households (Table S4) [56]. It allows a regional ordering from the highest to the lowest degree of social lag, and it is categorised into five levels from “very low” to “very high”, the latter corresponding to the highest levels of deprivation. The SGI is not a multidimensional index of poverty, as it does not incorporate income, social security, and food indicators, but instead, the index attempts to capture social features. Having information on social indicators disaggregated to the municipal level enables decision-making in matters of social policy, especially to analyse inequality of social coverage in the national territory [56].
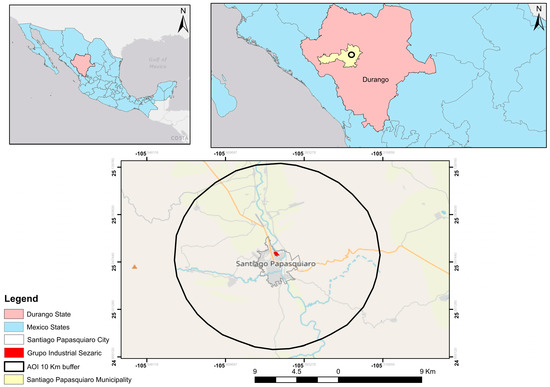
Figure 2.
Study area map, part of Santiago Papasquiaro city.
In terms of NTL data sources, we used VIIRS from 2014 and 2021 monthly composites imagery, via Google Earth Engine (GEE) [57], Very high resolution (VHR) daytime satellite data (obtained from Google Earth Pro—GEP), Google Street View (GSV) and existing values of the SGI. Table 2 presents all datasets used to address the aim of the case study. The VHR images for the study area were extracted from Google Earth Pro (GEP) and manipulated in ArcGIS 10.8. With the assistance of GSV, a tool integrated into the GEP, it was possible to validate road extraction and discriminate between paved and unpaved roads only in those available areas across Santiago Papasquiaro (Figure S1). The blue lines in Figures S1.1 and S1.2 represent the roads available on GSV, and the “yellow man” pegman offers the user the possibility to navigate virtually up and down the road along the existing blue line, with a complete 360° view of the street level (Figure S1.4). An additional function is provided by the photo sphere, which allowed observation of some of the unpaved areas for which GSV is not available (Figure S1.3).
Table 2.
Data sources and description.
2.2.2. Data Analysis of VIIRS
Geemap, a Python package for interactive mapping with GEE [59], was used to process monthly VIIRS-DNB composites for 2014 and 2021. The night-time data were filtered for ephemeral lights (fires, aurora, fishing boats, etc.), and had background (non-light) areas set to zero. The procedure for removing these lights is described by Elvidge et al. (2017) [7]. First, the annual composite for the area of interest (AOI) was calculated, based on the monthly VIIRS-DNB for both years, reducing the image collection by using the average function. In GEE, VIIRS-DNB Image Collection can be found as follows: viirs2014 = ee.ImageCollection(“NOAA/VIIRS/DNB/MONTHLY_V1/VCMSLCFG”).filterDate(“1 January 2014”, “31 December 2014”).select(‘avg_rad’); viirs2021 = ee.ImageCollection(“NOAA/VIIRS/DNB/MONTHLY_V1/VCMSLCFG”).filterDate(“1 January 2021”, “31 December 2021”).select(‘avg_rad’).
After these monthly composite average radiances were obtained, background light that the VIIRS instrument is sensitive to could influence interpretation (example shown in Figure 3). The removal of the background light is particularly important when these data are used at local scales and/or small areas, and a common approach is to standardize the data to be “zero-centred” (i.e., have a mean of zero) and have unit variance. Therefore, Equation (1) was used to subtract the mean of the entire image from each pixel’s value and then divide that by the standard deviation of the entire image. In order to obtain the mean and standard deviation of the image, the reduceRegion functions (reducer = ee.Reducer.mean() and reducer = ee.Reducer.stdDev()) were used (as described by GEE [60]) and illustrated in Figure 3.
where X′ is the “noise removed” image (Figure 3)
X′ = (X − μ)/σ
X is the annual composite (Figure 3),
μ = mean of the X image,
σ = standard deviation of X image.
Further, the average radiance values were classified as follows: no lights (≤0), low (>1–2), medium (2–5), and high (>5) for both years 2014 and 2021.

Figure 3.
The impact of background noise removal.
2.2.3. Analysis of Variance on the Radiance Data
A three-way analysis of variance (ANOVA) via SPSS™ was used to explore a potential relationship between log-transformed radiance and the SGI using the following factors:
- SGI: 0 = SGI values less than 0 (i.e., negative values); 1 = SGI values equal to and greater than zero (i.e., positive values) (Table S5)
- Year codes: 0 for the SGI from 2010 (radiance values from 2014) and 1 for SGI from 2020 (radiance values from 2021)
- Location codes: Each of the 24 locations was given a categorical code from 1 to 24.
No interaction terms were included in the model.
The data were first tested to ensure they had a normal distribution, and Levene’s test was used to achieve this. Levene’s test can be based on any measure of location but typically involves the use of the sample mean [47], median [48] and trimmed mean [48]. Levene’s test (based on median) was used in this study, and the results are presented below:
Levene statistic for the two SGI groups: 1.35 (p = 0.252)
Levene statistic for the two-year groups: 0.00 (p = 0.999)
Neither test was statistically significant, thereby suggesting that ANOVA could be applied to these data.
2.2.4. Analysis of Automatic Road Extraction
To provide a degree of “ground-truthing” of the NTL data, it was assumed that in the AOI the major sources of night-time lights would be roads and buildings. It was thus necessary to explore how the NTL data matched with known infrastructure that could generate NTL. To acquire satellite images from Google Earth Pro (GEP), the grid overlay function was used to divide the area of interest into several grids (Figure S2), and JPEG images of each square grid were captured with a size of 145 m2. A complete image of each grid was then reconstructed by mosaicking the JPEG images and georeferencing them [61] using ArcGIS 10.8 (ESRI, Redlands, CA, USA).
Having a complete image for our AOI allowed the extraction of the roads by using image segmentation (images were segmented based on their spectral, spatial, and/or texture characteristics) [62]. Image segmentation can be performed in different ways and processed by software such as ArcGIS and ENVI, which allow quick automation to identify roads and other types of surfaces.
To classify the imagery in this study, we first used the Feature Extraction with Rule-based Classification tool in ENVI software (described in [63]), which has been used previously in the literature [64,65,66]. The main steps are presented in Figure 4. First, ENVI created and displayed a segmentation image in the Layer Manager. The object/segment was represented by a group of pixels with similar spectral, spatial and texture attributes, in which our image was split into many segments. Each segment was assigned the mean spectral values of all of the pixels that belonged within a segment. For each segment, ENVI computed various spatial, spectral, and texture attributes. Merge level was the option used to aggregate all of the small segments in order to avoid over-segmentation and to improve the delineation of feature boundaries. This is a non-parametric technique and is independent of the assumption that the data are normally distributed [67]. In the next step, we built several rules to define and extract two types of asphalt classes, unpaved and paved roads. Therefore, we first defined as spectral min and max for paved roads the pixel values between 85 to 175, and then for unpaved roads, the pixel values from 50 to 85. The selection of pixel values was helped by inspecting different areas using the Attribute Histogram dialogue. To distinguish and extract the two types of roads from parking lots, house roofs or any other rectangular surface, we used the Major Length rule and Texture Mean rule, thus obtaining two individual rasters. Once the extracted paved and unpaved roads were obtained, the paved roads were further classified into two classes, <10 m and >10 m. In the final step, we convert each raster in vector (polyline) as paved and unpaved, respectively, using the Export Classification Vectors tool, which comes with the information on the width of the road. The level of correctness of the results for the paved/unpaved roads classification was visually evaluated by using GSV roads and sphere availability (Figure S1).
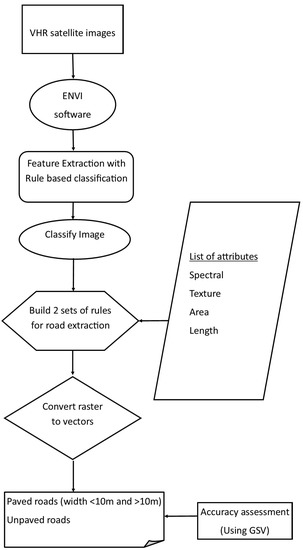
Figure 4.
Road extraction workflow.
3. Results
3.1. Analysis of Published Studies on the Use of NTL Data for Social Indicators
Table 3 presents an overview of the NTL datasets collected from various sensors and platforms that have been explored for a wide range of applications and research themes, where the abbreviation next to the paper reviewed indicates the approach’s spatial location. The columns in Table 3 have been arranged from the lowest (coarse) resolutions to the highest (as the arrow pointed). Most peer-reviewed articles have been based on the use of free open-access NTL satellites/sensors (DMSP and VIIRS) to explore a wide range of social applications and research themes. Table 3 also suggests a trade-off between spatial and location resolutions, where coarse resolutions have higher applicability on the large scale (global, regional, and country) and vice versa. For instance, using DMSP data could detect only the cores of towns with a minimum area of 4.5 km2. On the other hand, VIIRS and LJ1-01 images could detect most town and city levels and some village levels, with the minimum area of 0.3 km2 and 0.1 km2, respectively [68], with applications for poverty evaluation [69,70], energy supply [71,72], prediction of GDP and income [14,38], urbanisation [73,74], population distribution and density [14,32], marine activities [75,76], assessment of flood risk and wildfire [77,78], and understanding religious and cultural festivals [79]. LJ1-01 NTL data do allow for some limited applications at a local level [14,80,81,82], but the satellite’s coverage is limited, only some parts of the planet are covered (Figure 5), and there is no availability of monthly or annual composites, unlike DMSP and VIIRS data. Higher spatial resolution night-time imagery from commercial satellites (e.g., EROS-B, and JL1-03) has shown great potential for investigating spatial patterns and measuring light pollution [83], freight traffic [20], urban functional zones [84], urbanisation [85] and road quality [86], including at the local level, such as neighbourhoods and streets [20,87]. However, to date, the commercial NTL data available from these sources have been underused.
Table 3.
Applications of night-time satellites by spatial resolution and location. G—Global; R—Regional, CT—Country; C—City; L—Local.
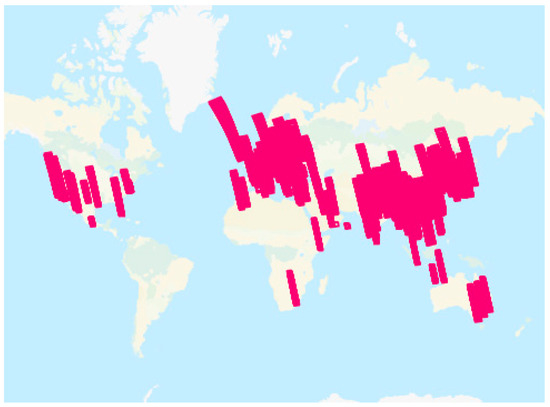
Figure 5.
LJ1-01 data coverage since 2018. Source: [12].
It should be noted that VHR NTL imagery is not necessarily useful for all applications, and actually, Anderson et al. (2010) [33] and Katz and Levin (2016) [83] have shown that medium and low resolutions would correlate better for assessing urbanisation, population density and light pollution. Elvidge et al. (2007) [193] have suggested that a sensor with a medium spatial resolution of 50–100 m would be sufficient to explore urban and rural areas.
In rural areas, the prediction of poverty using NTL was shown to be more uncertain than in more densely populated areas [37,194]. As NTL disperses over large areas (known as the “blooming effect”), these data alone provide meaningful interpretation typically only at the city level, as demographic and wealth variations are far more granular within urban neighbourhoods. Thus, to target disadvantaged areas and groups, especially in rural areas, satellite-based poverty estimation models must provide more detailed estimates than just NTL. Lately, several studies have investigated multiple types of satellite imagery, including multispectral and night-time imagery [42], by extracting the land cover and use [195] and assessing road and roof materials [196], all acting as proxies when correlating with traditional data (e.g., census, income, GDP, etc) for representing poverty, socioeconomic condition and household wealth [197].
Table 4 presents the results of applying the MMF to the potential of NTL data for populating social indicators. The analysis suggests that a total of 49 of the SDG indicators could be supported by NTL (and other datasets), albeit to varying degrees. The results are represented by the MMS values from 1 to 5 in traffic light colours, green, amber and red. The grey colour was assigned to those SDG indicators that lack any NTL contribution in the literature reviewed. Of these 49, 21 in red had MMS values between 1 and 2, meaning that NTL could provide weak support, 27 amber indicators had MMS values between 2 and 4, indicating that NTL data could partially and indirectly contribute to populating the indicator, and 1 green indicator had MMS values between 4 and 5, indicating strong and direct support from EO data. Some example applications are for SDG indicators 4.4.1, 11.7.1 and 7.1.1, and the following paragraphs provide some more detailed context.
SDG indicator 4.4.1 (Proportion of youth and adults with information and communications technology (ICT) skills, by type of skill) is considered a social indicator, as it measures the proportion of the population that has equal learning opportunities to develop ICT skills [198]. For countries and years where no data from household surveys are available, proxy measurements can be conducted by assessing the electricity consumption rate and electricity access. Many studies have shown that there is a strong relationship between electricity access and ICT skills [199,200], as many developing countries have unreliable and fluctuating local power supplies and internet, which hinder the ability to use a computer or to connect to local data centres. Where traditional data about electricity coverage and access are missing, NTL data have been explored to estimate the electricity consumption [93], electrification rate [71,95] and power outages [39,144]. However, on balance, this indicator may have weak support from NTL (MMS = 1.88, red), but there is potential that can be developed further.
SDG indicator 11.7.1 (Average share of the built-up area of cities that is open space for public use for all, by sex, age and persons with disabilities) can be supported partially by Liu et al. (2018) [201]’s research (MMF 2.33, amber), as they developed a global urban land product that predicts urban land by the Normalized Urban Areas Composite Index (NUACI). The index, implemented through the GEE platform, uses Landsat imagery and DMSP-OLS night-time lights as datasets. Three indexes (the Normalized Difference Water Index, Normalized Difference Vegetation Index, and Normalized Difference Built-up Index) were extracted from Landsat imagery to calculate the NUACI. In addition, a binary mask was obtained by segmenting DMSP-OLS into urban and non-urban by applying a specific threshold. Based on these data, the NUACI was calculated, obtaining a raster showing the percentage of impervious surface area per pixel. The final Global Urban Land dataset was obtained after applying region-specific segmentation thresholds to the NUACI images showing the degree of imperviousness. However, even though the approach is straightforward to measure only a part of the 11.7.1 indicator (the part that focuses on spatial analysis to delimit the built-up area of the city), this cannot offer information on population characteristics or green area functionality (e.g., public parks or gardens, playing fields, golf courses, allotments, etc.), and further exploration is required.
SDG indicator 7.1.1 measures the extent of the population with access to electricity, by urban and rural (%), where the World Bank is currently the data custodian collecting household surveys, such as the Demographic and Health Surveys, Living Standards Measurement Surveys, Multi-Indicator Cluster Surveys, and the World Health Survey. When these surveys were missing or too expensive to collect, NTL proved to have a high potential to estimate where the electricity exists or is missing [71,72,93,94,95,96,97]. Therefore, observations of NTL have been widely used to map human presence and the availability of electricity at global and regional scales. There are fewer examples of the use of this method at the sub-national level, especially when measuring the energy access of rural areas located inside forests, as these are more difficult to detect using NTL imagery. In this case, survey data and the use of daytime optical satellites and more advanced techniques based on SAR data can be used [202]. Moreover, when assessing SDG 7.1.1 under MMF 2.0 and supported by Falchetta et al. [203]’s work, we obtained a high MMS score (4.18, green), which meant that NTL could directly measure the electricity coverage. Falchetta et al. found wide inequality in electrification quality, especially in developing countries, which actually is not reflected in traditional statistics. For instance, with the same density of people with access to electricity, Nepalese households emit less light than Ugandan households, which emit less than Zambian households. This finding may be explained by a variety of socioeconomic variables, including consumption patterns, a decline in outdoor activities, energy-saving technologies, the absence of streetlights, and other infrastructural and building-specific factors.
Table 4.
Analysis of SDG social indicators against Maturity Matrix Score (MMS) and categorisation into research topics.
Table 4.
Analysis of SDG social indicators against Maturity Matrix Score (MMS) and categorisation into research topics.
| Main Application | Research Themes | Social SDG Indicator | MMS 2.0 Score | Reference Assessed |
|---|---|---|---|---|
| Human and economic aspects | Poverty evaluation | 1.1.1.; 1.2.1. | 3.33 | [42] |
| 1.2.2. | 1.66 | [88] | ||
| 1.3.1. | 1.83 | [204] | ||
| Inequality | 10.2.1 | 2 | [90] | |
| Education inequality | 4.1.2.; 4.a.1. | 1.66 | [92] | |
| 4.4.1. | 1.83 | [71] | ||
| Energy supply/energy consumption | 7.1.1. | 4.18 | [203] | |
| 7.3.1. | 1.83 | [203] | ||
| Rural electrification cover | 7.1.1. | 4.18 | [95] | |
| 7.3.1. | 1.83 | [95] | ||
| Renewable energy | 12.a.1; 7.b.1. | 2.33 | [97] | |
| 7.1.2. | 1.66 | [96] | ||
| 7.2.1. | 2.33 | [96] | ||
| Socioeconomic features | Urban economic development (e.g., GDP, income, unemployment rates) | 8.5.2. | 2.33 | [205] |
| 8.3.1. | 1.83 | [206] | ||
| Rural economic development (e.g., GDP, income, unemployment rates) | 8.5.2. | 2.33 | [205] | |
| 8.3.1. | 1.83 | [206] | ||
| Housing vacancy | n/a | |||
| “Ghost” cities | n/a | |||
| Freight traffic and road density | 9.1.2. | 2.33 | [101] | |
| Road lighting | 16.1.4. | 2.33 | [207] | |
| Copper/steel stock | n/a | n/a | ||
| Urbanisation | Long-term urbanisation | 11.3.1. | 2.33 | [208] |
| Urban functional zone | 11.1.1. | 2.33 | [209] | |
| Scaling city expansion | n/a | |||
| Impervious surface area detection/distribution | 11.7.1. | 2.33 | [201] | |
| Urban settlement | 11.3.1. | 2.33 | [208] | |
| Rural settlement | 11.3.1. | 2.33 | [208] | |
| 9.1.1. | 3 | [124] | ||
| Urban surface temperature | n/a | n/a | ||
| Urban impacts on habitat/soil | n/a | n/a | ||
| Dynamics of urban agglomeration | n/a | n/a | ||
| Conflicts and disasters | War/political tensions | 16.1.1.; 16.1.2. | 1.83 | [133] |
| Governmental favouritism | 16.5.1.;16.5.2 | 1.83 | [134] | |
| People’s displacement due to disasters/wars (refugees) | 10.7.4. | 2.33 | [137] | |
| Demographic and socioeconomic information | Population distribution | n/a | n/a | |
| Population migration | n/a | n/a | ||
| Population density | n/a | n/a | ||
| “Ambient population” | n/a | n/a | ||
| Environmental | Gas flares and biomass burning | n/a | n/a | |
| Land use types | n/a | n/a | ||
| Net primary productivity | n/a | n/a | ||
| Water footprint | n/a | n/a | ||
| Aerosol properties | n/a | n/a | ||
| Virtual water | n/a | n/a | ||
| Ecosystem services | n/a | n/a | ||
| Bioluminescence in the sea | n/a | n/a | ||
| Air quality | 11.6.2 | 2.88 | [159] | |
| 3.9.1. | 1.66 | [159] | ||
| Light pollution and its effect on biodiversity and conservation | n/a | n/a | ||
| Lightning flashes | n/a | n/a | ||
| Marine activities | Nocturnal fishing vessel detection | 14.6.1. | 3 | [76] |
| 14.7.1. | 1.83 | [76] | ||
| Disaster and natural hazards | Earthquake destruction | 1.5.1.; 11.5.1;13.1.1. | 2.88 | [170] |
| 1.5.2.; 11.5.2. | 3.66 | [170] | ||
| Natural disasters | 1.5.1.; 11.5.1;13.1.1. 1.5.2.; 11.5.2. | 2.33 | [169] | |
| Flood risk | 1.5.1.; 11.5.1;13.1.1. | 2.88 | [77] | |
| 1.5.2.; 11.5.2. | 3.66 | [77] | ||
| Wildfire | 1.5.1.; 11.5.1;13.1.1. | 1.66 | [176] | |
| 1.5.2.; 11.5.2. | 3.66 | [176] | ||
| Human health | Birth mortality | 3.1.1.; 3.2.1; 3.2.2. | 3.18 | [183] |
| Prostate cancer | n/a | n/a | ||
| COVID-19 outbreak | n/a | n/a | ||
| Circadian rhythms, sleep disruptions | n/a | n/a | ||
| Breast cancer | n/a | n/a | ||
| Obesity/body mass | 3.4.1. | 1.83 | [180] | |
| Other applications with social nuances | Religious/cultural festivals | n/a | n/a | |
| Human lifestyle during COVID-19 lockdown | n/a | n/a | ||
| Tourism/recreational opportunities | 8.9.1.; 11.4.1 | 1.88 | [188] | |
| Public space lighting preferences | n/a | n/a | ||
| Forced labour | 2.3.1; 8.7.1.; 8.8.2.; 10.4.1. | 1.66 | [190] | |
| Voting rights | 10.6.1.; 16.8.1. | 2.66 | [191] | |
| Human trafficking | 16.2.2. | 2 | [192] | |
| Total | Number of indicators 49 indicators out of 192 | 1, 27, 21, 143 |
Indicators colour coded in red, amber and green represents weak, partial and strong respectively from NTL data.
3.2. Case study: Durango, Mexico
Figure 6 and Figure 7 illustrate the NTL brightness average radiance classified into four groups: no lights (≤0), low (0.1–2), medium (2–5) and high light (>5). Figure 6 shows the total population in Santiago Papasquiro (SP) and the 25 localities within the 10 km AOI, overlayed by the average radiance. All localities, except SP city, had low average radiance in both 2014 and 2021. In addition, the average radiance values in SP city slightly increased from 2014 to 2021, but the areas around it remained relatively unlit or unchanged, indicating limited development. In Figure 7, the SGI levels are shown from 2010 and 2020 over the NTL’s brightness in 2014 and 2021, respectively, revealing that most of the deprived localities (medium, high, and very high values of SGI) were unlit or had low radiance values.
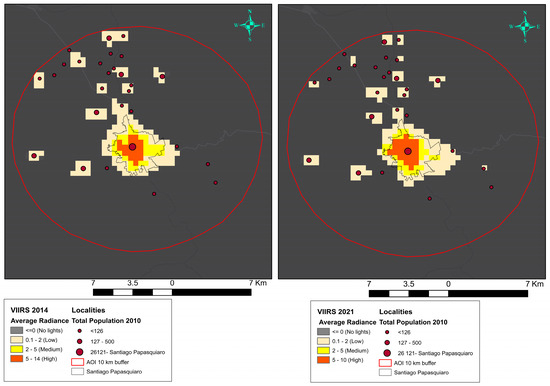
Figure 6.
Average radiance brightness and total population in 2014 and 2021.
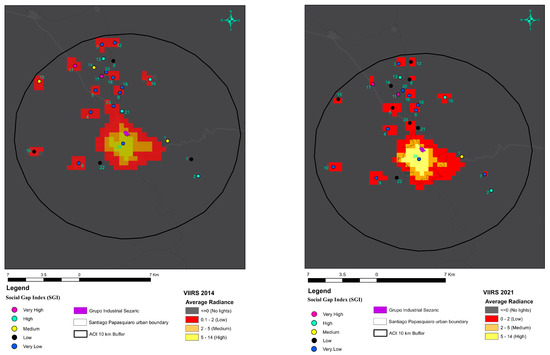
Figure 7.
VIIRS average radiance in 2014 and 2021 and SGI from 2010 and 2020.
For the names of localities represented by the annotations (numbers 1 to 24), please see Table S5.
Table S5 contains information about the SGI and its scaling, and the average radiance taken from the point location of each locality across the AOI. Figure 7 shows that some of the localities with very low or low SGI (i.e., those doing well), such as localities numbered 3, 4, 5, 8, 9, 12 and 18 (Table S5), had a degree of light, whereas localities with very high, high, and medium SGI values (i.e., those not doing well), such as localities 1, 2, 11, 13, 14, 21 (Table S5), had no lights at all (unlit area). The radiance and SGI data from Table S5 are shown plotted below in Figure 8. Table 5 presents the descriptive statistics of the average radiance analysed under the SGI dummies (0 and 1) and SGI years. From the mean values in Table 5, low SGI (0) was represented by higher average radiance, indicating that localities with lower social deprivation had higher radiance, whereas the localities with low average radiance had high social deprivation (1).
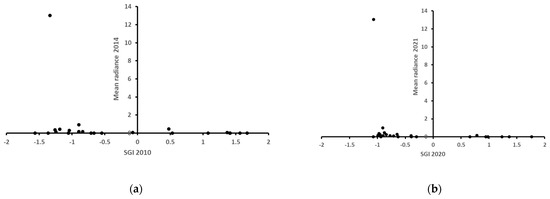
Figure 8.
Average radiance plotted against SGI for the 24 locations in Table S5. (a) Radiance for 2014 and SGI for 2010 and (b) radiance for 2021 and SGI for 2020.
Table 5.
Descriptive statistics of radiance in relation to SGI categories.
The results of an ANOVA (general linear model approach) applied to the radiance data listed in Table S5 are shown in Table 6. The results suggest that location was statistically significant (p < 0.001) as was SGI (p < 0.05). Year was not statistically significant, suggesting that radiance in these places had not changed significantly between 2014 and 2021 (also illustrated in Figure 8). The statistical significance for location is perhaps not surprising, as places clearly do differ in their levels of radiance. More interesting is that these results also suggest that low values of the SGI (representing low levels of social deprivation) are equated with higher radiance, while high values of the SGI (higher levels of social deprivation) equate to lower radiance.
Table 6.
Results of an ANOVA applied to the log-transformed radiance data in Table S5.
Road Quality and Night-Time Satellite Radiance
Figure 9 illustrates the state of roads as paved (concrete/asphalt) (with widths < and > 10 m) and unpaved (no concrete/asphalt) and the night-time average radiance in 2021 classified as described in the methodology section. Except for the paved roads within SP city, only a few paved roads connected the wider localities with the city. Most unpaved roads outside SP city were in localities that also had low or no light, indicating that the localities were underdeveloped. At the SP city level, most unpaved roads were located on the periphery, where night-time radiance was of low or zero intensity.
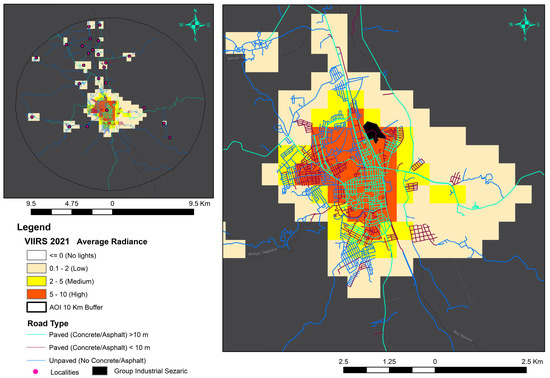
Figure 9.
Roads’ states and VIIRS 2021 average radiance.
4. Discussion
The results of the MMF analysis set out in this paper suggest that NTL data have been widely used in a variety of sustainable development applications and have the potential to populate 49 out of 192 SDG social indicators that are linked to the quality of life, poverty, inequality, education, electrification access, urbanisation, political tensions, armed conflicts, corruption, fishing activities, disasters, human health, human lifestyle, etc., but to date, these have mostly been at large (country and regional) scales, despite the need to measure indicators at the local scale [210]. MMF was chosen for this analysis, as it is the first strongly consolidated framework designed to bridge the field of EO with the SDG indicator framework. It is well known that, in general, frameworks facilitate the use of systematic reviews that are widely used in social studies and also in designing best practices that can be applied in the field of EO. In addition, the results of the MMF assessment can provide untried opportunities for applying EO sourced data, including NTL for SDG. Moreover, the results of such assessment reveal the potential for involving the wide range of current and emerging EO products in indicator monitoring to deliver real support to countries and NSOs, also having an impact on improving the information flow to inform SDG-related decision-making, and to promulgate partnerships between NSOs and geospatial experts. In particular, the MMF allows people to review possible new approaches and new EO-based ways of supporting the SDG indicators. It provides guidance to review novel approaches, and it potentially gives the broader community a reproducible way of evaluating such approaches before introducing them into operational practice.
Higher-resolution NTL data do have the potential for use at smaller, more local scales, and some examples have been published, but there are challenges and limitations involved in this. Therefore, the Durango case study illustrated that it is possible to use NTL data derived from VIIRS (2014 and 2021 monthly composite imagery) to detect differences between the 24 locations in the AOI, but more encouraging than this was the statistical association (using ANOVA) between log-transformed NTL radiances and SGI. Low values of the SGI (areas that are better off) equated with higher radiance, while high values of the SGI (areas that are worse off) equated with lower radiance. The GSV used as a tool for ground truthing is not new in the literature [211], and the results do suggest differences in the quality of the roads and street-lighting, although there are also likely to be differences in the size and lighting of residences. However, it is important to acknowledge that the coverage of GSV imagery can be limited, especially for more remote areas, and updates to GSV imagery are irregular. In addition, SGI is an index with many components that are designed to assess social deprivation without taking into consideration income (often proxied as GDP/capita). Many studies in the literature estimate poverty at different levels, including county [69], but their approaches are typically based on measures of income rather than more diverse measures of deprivation. However, as a further study, point of interest (POI) data can be used for social and economic analysis at the local scale coupled with NTL, and this approach has been taken for assessing recreation resources [187] and public space lighting [188].
In this case study, it was possible to compare good-quality datasets collected via traditional methods (surveys, etc.) with the NTL data, but more studies of this type are needed to provide greater confidence. Nonetheless, while the use of NTL data for assessing factors such as social deprivation at local scales is in its infancy, it does have advantages, as collecting data via traditional surveys has limitations in terms of the time needed and cost [212]. Collecting such data via surveys can also be a security and—following the COVID pandemic—health concern for those involved.
Commercial satellite imagery is often underutilized due to price misconceptions, and there is still a lack of research on the relative costs and benefits of using satellite imagery versus traditional methods. For example, the use of NTL data at a small scale could help guide more local development initiatives, and an example is provided in the AOI by a community electrification project being planned by the Sezaric sawmill located in SP. The Sezaric sawmill manufactures wooden furniture for export as well as plywood and pinewood boards. The sawmill sources its energy only from secondary wood material that remains from their production process, and that cannot be converted into other commercial products, thus applying the principles of biomass cascading. Sezaric is considered one of the best examples of a social enterprise in Durango, since it promotes sustainable forestry and creates income and jobs locally [40]. According to Lopez [213], inter-community forest associations (FA) in Durango have played a crucial role in helping communities solve regional problems such as improving the road infrastructure, preventing and combating forest fires, and improving market access and political representation. Surplus electricity from the mill’s bioenergy generation system and potential upscaling of the capacity of the mill’s installed power generation system could provide a positive socioeconomic impact to the surrounding localities by improving electricity access or providing affordable energy. However, as the sawmill has only a limited capacity for power generation, it is important for the project to target the areas in its immediate surroundings that have the highest levels of social deprivation. This is a common situation in such projects, and there may only be limited funds available to identify potential areas for prioritization.
In comparison with collecting traditional data, the NPP-VIIRS night-time light composite data have been shown in this study to be an effective and efficient data source for examining social deprivation at local scales, at least for more urban contexts. However, the proposed approach still has some limitations: (1) SGI is not available for all localities, as many of those are situated at altitudes above 2000 m, and this can be seen from the lack of road access. (2) While the case study results are encouraging, it does need to be acknowledged that the spatial resolution of VIIRS data allow for only a coarse assessment, and care does need to be taken with interpretation. Further research should be focused on exploring the finer resolution. (3) SGI data equate to a point in space (geographical coordinates) and not to a polygon covering the entire locality, whereas the average radiance derived from VIIRS across AOI has different values at every ~500 m. Our ability to correlate these two variables was hampered by this, but also by the small number of localities within the AOI of the 10 km buffer. Whatever the explanation, it would appear that the use of VIIRS data can help identify priority areas that need to be reached with development initiatives such as that potentially offered by the Sezaric bioenergy plant.
The results of a wide analysis of the literature and the Durango case study suggest that NTL data could be used when evaluating the opportunities and potential benefits for energy infrastructure developments and livelihood enhancement. Such data and approaches can also play a valuable role in the measurement of some of the indicators of SDG 7 (e.g., Indicator 7.1.2: Proportion of population with primary reliance on clean fuels and technology, Indicator 7.2.1: Renewable energy share in the total final energy consumption, Indicator 7.b.1: Installed renewable energy-generating capacity in developing countries (in watts per capita)) and by contributing to the achievement of SDG 1 (No Poverty). Hence, in terms of policy recommendations, the approach set out here can help with planning interventions such as the use of bioenergy, for example from forestry waste, for supporting people living in disadvantaged areas. Likewise, identifying bioenergy benefits and weaknesses in a policy design will enable local solutions that address social deprivation. The approach also can be used in supporting the production and integration of bioenergy into the grid and its usefulness in meeting SDG 7 and SDG 1, including waste management and rural development.
In the context of practicability at the community level, our study could be combined with a participatory approach to further analyse and reflect on the information generated. The information is useful for documenting local realities and can be used to inform policy and practice. In addition, identifying social gaps at the local scale might aim for the empowerment of communities, especially in municipalities with more social deprivation. Finally, and more specifically in terms of interventions designed to explore the use of bioenergy, outcomes for disadvantaged local areas where the potential additional renewable electricity energy is produced by a sawmill are applicable not only for stakeholders of the Durango municipality, the fourth largest community in the state in terms of population but also for Durango state, which is amongst the top five producers of forest products nationwide, in addition to having the first forest reserve in the country.
5. Conclusions
This paper presented a literature evaluation of NTL data for social applications, first by using a systematic search and then applying MMF to the available literature that could populate the SDG indicators with social nuances, mostly at broad scales. We obtained 58 research themes by reviewing 164 peer-reviewed articles, and these were connected with 49 SDG indicators where NTL data can offer support to varying extents. Likewise, we used SGI, VIIRS and other datasets to explore disadvantaged local areas where the potential additional renewable electricity energy produced by a sawmill could be efficiently and fairly distributed in the context of achieving SDG 7.
Supplementary Materials
The following supporting information can be downloaded at: https://www.mdpi.com/article/10.3390/rs15051209/s1, Figure S1: Google Street View (GSV) and different types of roads in Santiago Papasquiaro city, (1) view in Google Earth Pro with GSV availability, (2) Sphere availability on Google Maps, (3) unpaved roads with < 10 m width, (4) paved roads with > 10 m width; Figure S2: Google Earth Pro grid over the AOI; Figure S3. Different types of roads, (A) paved with > 10 m width, (B) paved roads with < 10 m width, and (C) unpaved roads with width < 10 m; Table S1: Social indicators SDG indicators; Table S2: Socio-economic SDG indicators; Table S3: Socio-environmental SDG indicators; Table S4: Indicators used to calculate the Social Gap Index (SGI) in 2010 and 2020; Table S5: SGI and average radiance in the localities across the AOI. Refs. [53,56] are cited in supplementary.
Author Contributions
Conceptualization, A.A., S.M., R.J.M., J.S., E.M.-H., M.A.A.-A. and J.A.; methodology, A.A. and S.M.; software, A.A.; validation, A.A., S.M., R.J.M., J.S., E.M.-H., M.A.A.-A. and J.A.; formal analysis, A.A and S.M.; investigation, A.A.; resources, A.A., S.M., R.J.M., J.S., E.M.-H., M.A.A.-A. and J.A.; data curation, A.A., S.M., R.J.M., J.S., E.M.-H., M.A.A.-A. and J.A.; writing—original draft preparation, A.A.; writing—review and editing, A.A., S.M., R.J.M., J.S., E.M.-H., M.A.A.-A. and J.A.; visualization, A.A. and S.M.; supervision, S.M. and R.J.M.; project administration, R.J.M.; funding acquisition, R.J.M. All authors have read and agreed to the published version of the manuscript.
Funding
This research was funded by EPSRC, grant number “EP/W52427X/1” and The British Council Newton Fund Impact Scheme grant number 540821111. The APC was not applicable for this publication.
Data Availability Statement
Not applicable.
Conflicts of Interest
The authors declare no conflict of interest.
References
- Croft, T.A. Burning Waste Gas in Oil Fields. Nature 1973, 245, 375–376. [Google Scholar] [CrossRef]
- Elvidge, C.D.; Baugh, K.E.; Kihn, E.A.; Kroehl, H.W.; Davis, E.R. Mapping city lights with nighttime data from the DMSP Operational Linescan System. Photogramm. Eng. Remote Sens. 1997, 63, 727–734. [Google Scholar]
- EOG. Download VIIRS and DMSP Products. Available online: https://www.ngdc.noaa.gov/eog/download.html (accessed on 9 September 2022).
- Mines, C.S.O. Download VIIRS and DMSP Products. Available online: https://payneinstitute.mines.edu/eog/ (accessed on 9 September 2022).
- GEE. Google Earth Engine: Data Catalog. Available online: https://developers.google.com/earth-engine/datasets/catalog (accessed on 9 September 2022).
- Huang, Q.; Yang, X.; Gao, B.; Yang, Y.; Zhao, Y. Application of DMSP/OLS Nighttime Light Images: A Meta-Analysis and a Systematic Literature Review. Remote Sens. 2014, 6, 6844–6866. [Google Scholar] [CrossRef]
- Elvidge, C.D.; Baugh, K.; Zhizhin, M.; Hsu, F.C.; Ghosh, T. VIIRS night-time lights. Int. J. Remote Sens. 2017, 38, 5860–5879. [Google Scholar] [CrossRef]
- ISS. Astronauts’ Photographs Taken Onboard the International Space Station (ISS). Available online: http://eol.jsc.nasa.gov (accessed on 9 September 2022).
- De Miguel, S.; Zamorano, J.; Pascual, S.; López Cayuela, M.; Ocaña, F.; Challupner, P.; Gómez Castaño, J.; Fernández-Renau, A.; Gómez, J.; de Miguel, E. ISS nocturnal images as a scientific tool against light pollution: Flux calibration and colors. Highlights Span. Astrophys. VII Springer Berl. Ger. 2013, 1, 916–919. [Google Scholar]
- ISS. NightPod Images bring Earth to Light from Space Station. Available online: https://www.nasa.gov/mission_pages/station/research/news/nightpod.html (accessed on 29 September 2022).
- Zhang, G.; Wang, J.; Jiang, Y.; Zhou, P.; Zhao, Y.; Xu, Y. On-Orbit Geometric Calibration and Validation of Luojia 1-01 Night-Light Satellite. Remote Sens. 2019, 11, 264. [Google Scholar] [CrossRef]
- Wuhan, U.O. Luojia No. 1 01 Star Data. Available online: http://59.175.109.173:8888/app/login.html (accessed on 15 September 2022).
- Ou, J.; Liu, X.; Liu, P.; Liu, X. Evaluation of Luojia 1-01 nighttime light imagery for impervious surface detection: A comparison with NPP-VIIRS nighttime light data. Int. J. Appl. Earth Obs. Geoinf. 2019, 81, 1–12. [Google Scholar] [CrossRef]
- Liu, H.; Luo, N.; Hu, C. Detection of County Economic Development Using LJ1-01 Nighttime Light Imagery: A Comparison with NPP-VIIRS Data. Sensors 2020, 20, 6633. [Google Scholar] [CrossRef]
- Li, X.; Zhao, L.; Li, D.; Xu, H. Mapping Urban Extent Using Luojia 1-01 Nighttime Light Imagery. Sensors 2018, 18, 3665. [Google Scholar] [CrossRef]
- Pack, D.; Hardy, B.; Longcore, T. Studying the Earth at Night from CubeSats. Available online: https://digitalcommons.usu.edu/smallsat/2017/all2017/41/ (accessed on 1 October 2022).
- FECYT. Cities at Night. Available online: https://citiesatnight.org/ (accessed on 15 September 2022).
- Imagesat International. Eros-B. Available online: https://www.imagesatintl.com/wp-content/brochure/EROS-B_Satellite_Brochure.pdf (accessed on 9 September 2022).
- Chang Guang Satellite Technology. Available online: http://www.jl1.cn/ (accessed on 15 September 2022).
- Levin, N.; Johansen, K.; Hacker, J.M.; Phinn, S. A new source for high spatial resolution night time images—The EROS-B commercial satellite. Remote Sens. Environ. 2014, 149, 1–12. [Google Scholar] [CrossRef]
- Böhringer, C.; Jochem, P.E. Measuring the immeasurable—A survey of sustainability indices. Ecol. Econ. 2007, 63, 1–8. [Google Scholar] [CrossRef]
- Estes, R.J. Index of Social Progress (ISP). In Encyclopedia of Quality of Life and Well-Being Research; Michalos, A.C., Ed.; Springer: Dordrecht, The Netherlands, 2014; pp. 3174–3183. [Google Scholar]
- Morris, M.D. Measuring the conditions of the world’s poor: The physical quality of life. In Measuring the Conditions of the World’s Poor: The Physical Quality of Life; Pergamon Press: New York, NY, USA, 1979; p. 176. [Google Scholar]
- Drewnowski, J.; Scott, W. The Level of Living Index, United Nations Research Institute for Social Development; Report; United Nations Research Institute for Social Development: Geneva, Switzerland, 1966. [Google Scholar]
- Sagar, A.D.; Najam, A. The human development index: A critical review. Ecol. Econ. 1998, 25, 249–264. [Google Scholar] [CrossRef]
- Henderson, J.V.; Storeygard, A.; Weil, D.N. A Bright Idea for Measuring Economic Growth. Am. Econ. Rev. 2011, 101, 194–199. [Google Scholar] [CrossRef]
- He, C.; Ma, Q.; Liu, Z.; Zhang, Q. Modeling the spatiotemporal dynamics of electric power consumption in Mainland China using saturation-corrected DMSP/OLS nighttime stable light data. Int. J. Digit. Earth 2013, 7, 993–1014. [Google Scholar] [CrossRef]
- Shi, K.; Yu, B.; Huang, Y.; Hu, Y.; Yin, B.; Chen, Z.; Chen, L.; Wu, J. Evaluating the Ability of NPP-VIIRS Nighttime Light Data to Estimate the Gross Domestic Product and the Electric Power Consumption of China at Multiple Scales: A Comparison with DMSP-OLS Data. Remote Sens. 2014, 6, 1705–1724. [Google Scholar] [CrossRef]
- Zhou, Y.; Ma, T.; Zhou, C.; Xu, T. Nighttime Light Derived Assessment of Regional Inequality of Socioeconomic Development in China. Remote Sens. 2015, 7, 1242–1262. [Google Scholar] [CrossRef]
- Falchetta, G.; Pachauri, S.; Parkinson, S.; Byers, E. A high-resolution gridded dataset to assess electrification in sub-Saharan Africa. Sci. Data 2019, 6, 110. [Google Scholar] [CrossRef] [PubMed]
- Zhuo, L.; Ichinose, T.; Zheng, J.; Chen, J.; Shi, P.J.; Li, X. Modelling the population density of China at the pixel level based on DMSP/OLS non-radiance-calibrated night-time light images. Int. J. Remote Sens. 2009, 30, 1003–1018. [Google Scholar] [CrossRef]
- Kong, W.; Cheng, J.; Liu, X.; Zhang, F.; Fei, T. Incorporating nocturnal UAV side-view images with VIIRS data for accurate population estimation: A test at the urban administrative district scale. Int. J. Remote Sens. 2019, 40, 8528–8546. [Google Scholar] [CrossRef]
- Anderson, S.J.; Tuttle, B.T.; Powell, R.L.; Sutton, P.C. Characterizing relationships between population density and nighttime imagery for Denver, Colorado: Issues of scale and representation. Int. J. Remote Sens. 2010, 31, 5733–5746. [Google Scholar] [CrossRef]
- Sutton, P.; Roberts, D.; Elvidge, C.; Baugh, K. Census from Heaven: An estimate of the global human population using night-time satellite imagery. Int. J. Remote Sens. 2010, 22, 3061–3076. [Google Scholar] [CrossRef]
- Huang, X.; Schneider, A.; Friedl, M.A. Mapping sub-pixel urban expansion in China using MODIS and DMSP/OLS nighttime lights. Remote Sens. Environ. 2016, 175, 92–108. [Google Scholar] [CrossRef]
- Bhandari, L.; Roychowdhury, K. Night lights and economic activity in India: A study using DMSP-OLS night time images. Proc. Asia-Pac. Adv. Netw. 2011, 32, 218. [Google Scholar] [CrossRef]
- Pérez-Sindín, X.S.; Chen, T.-H.K.; Prishchepov, A.V. Are night-time lights a good proxy of economic activity in rural areas in middle and low-income countries? Examining the empirical evidence from Colombia. Remote Sens. Appl. Soc. Environ. 2021, 24, 100647. [Google Scholar] [CrossRef]
- Ivan, K.; Holobâcă, I.-H.; Benedek, J.; Török, I. VIIRS nighttime light data for income estimation at local level. Remote Sens. 2020, 12, 2950. [Google Scholar] [CrossRef]
- Shah, Z.; Klugman, N.; Cadamuro, G.; Hsu, F.-C.; Elvidge, C.D.; Taneja, J. The electricity scene from above: Exploring power grid inconsistencies using satellite data in Accra, Ghana. Appl. Energy 2022, 319, 119237. [Google Scholar] [CrossRef]
- Ivan, K.; Holobâcă, I.-H.; Benedek, J.; Török, I. Potential of Night-Time Lights to Measure Regional Inequality. Remote Sens. 2019, 12, 33. [Google Scholar] [CrossRef]
- Elvidge, C.D.; Sutton, P.C.; Ghosh, T.; Tuttle, B.T.; Baugh, K.E.; Bhaduri, B.; Bright, E. A global poverty map derived from satellite data. Comput. Geosci. 2009, 35, 1652–1660. [Google Scholar] [CrossRef]
- Jean, N.; Burke, M.; Xie, M.; Davis, W.M.; Lobell, D.B.; Ermon, S. Combining satellite imagery and machine learning to predict poverty. Science 2016, 353, 790–794. [Google Scholar] [CrossRef] [PubMed]
- Waluda, C. Quantifying light-fishing for Dosidicus gigas in the eastern Pacific using satellite remote sensing. Remote Sens. Environ. 2004, 91, 129–133. [Google Scholar] [CrossRef]
- Straka, W.; Seaman, C.; Baugh, K.; Cole, K.; Stevens, E.; Miller, S. Utilization of the Suomi National Polar-Orbiting Partnership (NPP) Visible Infrared Imaging Radiometer Suite (VIIRS) Day/Night Band for Arctic Ship Tracking and Fisheries Management. Remote Sens. 2015, 7, 971–989. [Google Scholar] [CrossRef]
- Lavers, C.; Bishop, C.; Hawkins, O.; Grealey, E.; Cox, C.; Thomas, D.; Trimel, S. Application of satellite imagery to monitoring human rights abuse of vulnerable communities, with minimal risk to relief staff. J. Phys. Conf. Ser. 2009, 178, 012039. [Google Scholar] [CrossRef]
- Pauley, S.M. Lighting for the human circadian clock: Recent research indicates that lighting has become a public health issue. Med. Hypotheses 2004, 63, 588–596. [Google Scholar] [CrossRef]
- Rybnikova, N.; Portnov, B.A. Population-level study links short-wavelength nighttime illumination with breast cancer incidence in a major metropolitan area. Chronobiol. Int. 2018, 35, 1198–1208. [Google Scholar] [CrossRef]
- Rybnikova, N.A.; Portnov, B.A. Outdoor light and breast cancer incidence: A comparative analysis of DMSP and VIIRS-DNB satellite data. Int. J. Remote Sens. 2016, 38, 5952–5961. [Google Scholar] [CrossRef]
- Agnew, J.; Gillespie, T.W.; Gonzalez, J.; Min, B. Baghdad nights: Evaluating the US military ‘surge’using nighttime light signatures. Environ. Plan. A 2008, 40, 2285–2295. [Google Scholar] [CrossRef]
- Wang, W.; Cheng, H.; Zhang, L. Poverty assessment using DMSP/OLS night-time light satellite imagery at a provincial scale in China. Adv. Space Res. 2012, 49, 1253–1264. [Google Scholar] [CrossRef]
- Sutton, P.; Roberts, D.; Elvidge, C.; Meij, H. A comparison of nighttime satellite imagery and population density for the continental United States. Photogramm. Eng. Remote Sens. 1997, 63, 1303–1313. [Google Scholar]
- Levin, N.; Kyba, C.C.M.; Zhang, Q.; Sánchez de Miguel, A.; Román, M.O.; Li, X.; Portnov, B.A.; Molthan, A.L.; Jechow, A.; Miller, S.D.; et al. Remote sensing of night lights: A review and an outlook for the future. Remote Sens. Environ. 2020, 237, 111443. [Google Scholar] [CrossRef]
- Andries, A.; Morse, S.; Murphy, R.J.; Lynch, J.; Woolliams, E.R. Using Data from Earth Observation to Support Sustainable Development Indicators: An Analysis of the Literature and Challenges for the Future. Sustainability 2022, 14, 1191. [Google Scholar] [CrossRef]
- Andries, A.; Morse, S.; Murphy, R.; Lynch, J.; Woolliams, E. Seeing Sustainability from Space: Using Earth Observation Data to Populate the UN Sustainable Development Goal Indicators. Sustainability 2019, 11, 5062. [Google Scholar] [CrossRef]
- INEGI. Census of Population and Housing. Available online: https://en.www.inegi.org.mx/programas/ccpv/2020/ (accessed on 10 June 2022).
- CONEVAL. Indice Regazo Social. Available online: https://www.coneval.org.mx/Medicion/IRS/Paginas/Indice_Rezago_Social_2020.aspx (accessed on 10 June 2022).
- GEE. Google Earth Engine. Available online: https://developers.google.com/earth-engine/datasets/catalog/NOAA_VIIRS_DNB_MONTHLY_V1_VCMCFG (accessed on 10 June 2022).
- Google Earth Pro. Available online: https://earth.google.com/web/ (accessed on 31 January 2023).
- Wu, Q. geemap: A Python package for interactive mapping with Google Earth Engine. J. Open Source Softw. 2020, 5, 2305. [Google Scholar] [CrossRef]
- GEE. Statistics of an Image Region. Available online: https://developers.google.com/earth-engine/guides/reducers_reduce_region (accessed on 16 June 2022).
- Chang, A.Y.; Parrales, M.E.; Jimenez, J.; Sobieszczyk, M.E.; Hammer, S.M.; Copenhaver, D.J.; Kulkarni, R.P. Combining Google Earth and GIS mapping technologies in a dengue surveillance system for developing countries. Int. J. Health Geogr. 2009, 8, 49. [Google Scholar] [CrossRef]
- Mena, J.B.; Malpica, J.A. An automatic method for road extraction in rural and semi-urban areas starting from high resolution satellite imagery. Pattern Recognit. Lett. 2005, 26, 1201–1220. [Google Scholar] [CrossRef]
- ENVI. ENVI User Guide. Available online: https://www.l3harrisgeospatial.com/portals/0/pdfs/envi/envi_zoom_user_guide.pdf (accessed on 31 January 2023).
- Cadamuro, G.; Muhebwa, A.; Taneja, J. Assigning a grade: Accurate measurement of road quality using satellite imagery. arXiv 2018, arXiv:1812.01699. [Google Scholar]
- Mansourmoghaddam, M.; Ghafarian Malamiri, H.R.; Arabi Aliabad, F.; Fallah Tafti, M.; Haghani, M.; Shojaei, S. The Separation of the Unpaved Roads and Prioritization of Paving These Roads Using UAV Images. Air Soil Water Res. 2022, 15, 1–10. [Google Scholar] [CrossRef]
- Medhi, A.; Saha, A.K. Rural Road Extraction using Object Based Image Analysis (OBIA): A case study from Assam, India. Adv. Cartogr. GIScience ICA 2019, 1, 1–8. [Google Scholar] [CrossRef]
- Myint, S.W.; Gober, P.; Brazel, A.; Grossman-Clarke, S.; Weng, Q. Per-pixel vs. object-based classification of urban land cover extraction using high spatial resolution imagery. Remote Sens. Environ. 2011, 115, 1145–1161. [Google Scholar] [CrossRef]
- Li, X.; Liu, Z.; Chen, X.; Sun, J. Assessing the Ability of Luojia 1-01 Imagery to Detect Feeble Nighttime Lights. Sensors 2019, 19, 3708. [Google Scholar] [CrossRef]
- Yu, B.; Shi, K.; Hu, Y.; Huang, C.; Chen, Z.; Wu, J. Poverty Evaluation Using NPP-VIIRS Nighttime Light Composite Data at the County Level in China. IEEE J. Sel. Top. Appl. Earth Obs. Remote Sens. 2015, 8, 1217–1229. [Google Scholar] [CrossRef]
- Kuffer, M.; Pfeffer, K.; Sliuzas, R.; Taubenböck, H.; Baud, I.; Maarseveen, M.V. Capturing the Urban Divide in Nighttime Light Images from the International Space Station. IEEE J. Sel. Top. Appl. Earth Obs. Remote Sens. 2018, 11, 2578–2586. [Google Scholar] [CrossRef]
- Ru, Y.; Li, X.; Belay, W.A. Tracking Spatiotemporal Patterns of Rwanda’s Electrification Using Multi-Temporal VIIRS Nighttime Light Imagery. Remote Sens. 2022, 14, 4397. [Google Scholar] [CrossRef]
- Zhang, G.; Guo, X.; Li, D.; Jiang, B. Evaluating the Potential of LJ1-01 Nighttime Light Data for Modeling Socio-Economic Parameters. Sensors 2019, 19, 1465. [Google Scholar] [CrossRef] [PubMed]
- Zhao, M.; Zhou, Y.; Li, X.; Cheng, W.; Zhou, C.; Ma, T.; Li, M.; Huang, K. Mapping urban dynamics (1992–2018) in Southeast Asia using consistent nighttime light data from DMSP and VIIRS. Remote Sens. Environ. 2020, 248, 111980. [Google Scholar] [CrossRef]
- Wang, Y.; Liu, Z.; He, C.; Xia, P.; Liu, Z.; Liu, H. Quantifying urbanization levels on the Tibetan Plateau with high-resolution nighttime light data. Geogr. Sustain. 2020, 1, 233–244. [Google Scholar] [CrossRef]
- Sarangi, R.K.; Nagendra Jaiganesh, S.N. VIIRS boat detection (VBD) product-based night time fishing vessels observation in the Arabian Sea and Bay of Bengal Sub-regions. Geocarto Int. 2022, 37, 3504–3519. [Google Scholar] [CrossRef]
- Zhong, L.; Liu, X.; Yang, P.; Lin, R. Explore the application of high-resolution nighttime light remote sensing images in nighttime marine ship detection: A case study of LJ1-01 data. Open Geosci. 2020, 12, 1169–1184. [Google Scholar] [CrossRef]
- Levin, N.; Phinn, S. Assessing the 2022 Flood Impacts in Queensland Combining Daytime and Nighttime Optical and Imaging Radar Data. Remote Sens. 2022, 14, 5009. [Google Scholar] [CrossRef]
- Ye, C.; Xu, Z.; Lei, X.; Liao, W.; Ding, X.; Liang, Y. Assessment of urban flood risk based on data-driven models: A case study in Fuzhou City, China. Int. J. Disaster Risk Reduct. 2022, 82, 103318. [Google Scholar] [CrossRef]
- Zhang, C.; Pei, Y.; Li, J.; Qin, Q.; Yue, J. Application of luojia 1-01 nighttime images for detecting the light changes for the 2019 spring festival in western cities, China. Remote Sens. 2020, 12, 1416. [Google Scholar] [CrossRef]
- Tan, Z.; Wei, D.; Yin, Z. Housing Vacancy Rate in Major Cities in China: Perspectives from Nighttime Light Data. Complexity 2020, 2020, 5104578. [Google Scholar] [CrossRef]
- Shi, L.; Wurm, M.; Huang, X.; Zhong, T.; Leichtle, T.; Taubenböck, H. Urbanization that hides in the dark—Spotting China’s “ghost neighborhoods” from space. Landsc. Urban Plan. 2020, 200, 103822. [Google Scholar] [CrossRef]
- Wang, L.; Zhang, H.; Xu, H.; Zhu, A.; Fan, H.; Wang, Y. Extraction of City Roads Using Luojia 1-01 Nighttime Light Data. Appl. Sci. 2021, 11, 10113. [Google Scholar] [CrossRef]
- Katz, Y.; Levin, N. Quantifying urban light pollution—A comparison between field measurements and EROS-B imagery. Remote Sens. Environ. 2016, 177, 65–77. [Google Scholar] [CrossRef]
- Huang, X.; Yang, J.; Li, J.; Wen, D. Urban functional zone mapping by integrating high spatial resolution nighttime light and daytime multi-view imagery. ISPRS J. Photogramm. Remote Sens. 2021, 175, 403–415. [Google Scholar] [CrossRef]
- Fryskowska, A.; Wojtkowska, M.; Delis, P.; Grochala, A. Some aspects of satellite imagery integration from Eros b and Landsat 8. Int. Arch. Photogramm. Remote Sens. Spat. Inf. Sci. 2016, 41, 647–652. [Google Scholar] [CrossRef]
- Xu, N.; Xu, Y.; Yan, Y.; Guo, Z.; Wang, B.; Zhou, X. Evaluating Road Lighting Quality Using High-Resolution JL1-3B Nighttime Light Remote Sensing Data: A Case Study in Nanjing, China. Remote Sens. 2022, 14, 4497. [Google Scholar] [CrossRef]
- Wang, F.; Zhou, K.; Wang, M.; Wang, Q. The Impact Analysis of Land Features to JL1-3B Nighttime Light Data at Parcel Level: Illustrated by the Case of Changchun, China. Sensors 2020, 20, 5447. [Google Scholar] [CrossRef] [PubMed]
- Yong, Z.; Li, K.; Xiong, J.; Cheng, W.; Wang, Z.; Sun, H.; Ye, C. Integrating DMSP-OLS and NPP-VIIRS Nighttime Light Data to Evaluate Poverty in Southwestern China. Remote Sens. 2022, 14, 600. [Google Scholar] [CrossRef]
- Lin, J.; Luo, S.; Huang, Y. Poverty estimation at the county level by combining LuoJia1-01 nighttime light data and points of interest. Geocarto Int. 2022, 37, 3590–3606. [Google Scholar] [CrossRef]
- Elvidge, C.D.; Baugh, K.E.; Anderson, S.J.; Sutton, P.C.; Ghosh, T. The Night Light Development Index (NLDI): A spatially explicit measure of human development from satellite data. Soc. Geogr. 2012, 7, 23–35. [Google Scholar] [CrossRef]
- Wu, R.; Yang, D.; Dong, J.; Zhang, L.; Xia, F. Regional Inequality in China Based on NPP-VIIRS Night-Time Light Imagery. Remote Sens. 2018, 10, 240. [Google Scholar] [CrossRef]
- Qi, B.; Wang, X.; Sutton, P. Can Nighttime Satellite Imagery Inform Our Understanding of Education Inequality? Remote Sens. 2021, 13, 843. [Google Scholar] [CrossRef]
- Amaral, S.; Câmara, G.; Monteiro, A.M.V.; Quintanilha, J.A.; Elvidge, C.D. Estimating population and energy consumption in Brazilian Amazonia using DMSP night-time satellite data. Comput. Environ. Urban Syst. 2005, 29, 179–195. [Google Scholar] [CrossRef]
- Cheng, B.; Chen, Z.; Yu, B.; Li, Q.; Wang, C.; Li, B.; Wu, B.; Li, Y.; Wu, J. Automated Extraction of Street Lights From JL1-3B Nighttime Light Data and Assessment of Their Solar Energy Potential. IEEE J. Sel. Top. Appl. Earth Obs. Remote Sens. 2020, 13, 675–684. [Google Scholar] [CrossRef]
- Dugoua, E.; Kennedy, R.; Urpelainen, J. Satellite data for the social sciences: Measuring rural electrification with night-time lights. Int. J. Remote Sens. 2018, 39, 2690–2701. [Google Scholar] [CrossRef]
- Coscieme, L.; Pulselli, F.M.; Bastianoni, S.; Elvidge, C.D.; Anderson, S.; Sutton, P.C. A thermodynamic geography: Night-time satellite imagery as a proxy measure of emergy. Ambio 2014, 43, 969–979. [Google Scholar] [CrossRef]
- Lopez-Ruiz, H.G.; Blazquez, J.; Vittorio, M. Assessing residential solar rooftop potential in Saudi Arabia using nighttime satellite images: A study for the city of Riyadh. Energy Policy 2020, 140, 111399. [Google Scholar] [CrossRef]
- Hartojo, N.; Ikhsan, M.; Dartanto, T.; Sumarto, S. A Growing Light in the Lagging Region in Indonesia: The Impact of Village Fund on Rural Economic Growth. Economies 2022, 10, 217. [Google Scholar] [CrossRef]
- Zou, S.; Wang, L. Mapping individual abandoned houses across cities by integrating VHR remote sensing and street view imagery. Int. J. Appl. Earth Obs. Geoinf. 2022, 113, 103018. [Google Scholar] [CrossRef]
- Lu, H.; Zhang, C.; Liu, G.; Ye, X.; Miao, C. Mapping China’s Ghost Cities through the Combination of Nighttime Satellite Data and Daytime Satellite Data. Remote Sens. 2018, 10, 1037. [Google Scholar] [CrossRef]
- Tian, J.; Zhao, N.; Samson, E.L.; Wang, S. Brightness of Nighttime Lights as a Proxy for Freight Traffic: A Case Study of China. IEEE J. Sel. Top. Appl. Earth Obs. Remote Sens. 2014, 7, 206–212. [Google Scholar] [CrossRef]
- Shi, K.; Yu, B.; Hu, Y.; Huang, C.; Chen, Y.; Huang, Y.; Chen, Z.; Wu, J. Modeling and mapping total freight traffic in China using NPP-VIIRS nighttime light composite data. GIScience Remote Sens. 2015, 52, 274–289. [Google Scholar] [CrossRef]
- Levin, N.; Duke, Y. High spatial resolution night-time light images for demographic and socio-economic studies. Remote Sens. Environ. 2012, 119, 1–10. [Google Scholar] [CrossRef]
- Min, B.; Gaba, K. Tracking Electrification in Vietnam Using Nighttime Lights. Remote Sens. 2014, 6, 9511–9529. [Google Scholar] [CrossRef]
- Ma, T.; Zhou, C.; Pei, T.; Haynie, S.; Fan, J. Responses of Suomi-NPP VIIRS-derived nighttime lights to socioeconomic activity in China’s cities. Remote Sens. Lett. 2014, 5, 165–174. [Google Scholar] [CrossRef]
- Kuffer, M.; Sliuzas, R.; Maarseveen, M.v.; Pfeffer, K.; Baud, I. City nighttime light variations using ISS images. In Proceedings of the 2017 Joint Urban Remote Sensing Event (JURSE), Dubai, United Arab Emirates, 6–8 March 2017; pp. 1–4. [Google Scholar]
- Takahashi, K.I.; Terakado, R.; Nakamura, J.; Daigo, I.; Matsuno, Y.; Adachi, Y. In-Use Stock of Copper Analysis Using Satellite Nighttime Light Observation Data. Mater. Trans. 2009, 50, 1871–1874. [Google Scholar] [CrossRef]
- Hattori, R.; Horie, S.; Hsu, F.-C.; Elvidge, C.D.; Matsuno, Y. Estimation of in-use steel stock for civil engineering and building using nighttime light images. Resour. Conserv. Recycl. 2014, 83, 1–5. [Google Scholar] [CrossRef]
- Xu, P.; Lin, M.; Jin, P. Spatio-temporal dynamics of urbanization in China Using DMSP/OLS nighttime light data from 1992–2013. Chin. Geogr. Sci. 2021, 31, 70–80. [Google Scholar]
- Feng, Z.; Peng, J.; Wu, J. Using DMSP/OLS nighttime light data and K–means method to identify urban–rural fringe of megacities. Habitat Int. 2020, 103, 102227. [Google Scholar] [CrossRef]
- Song, J.; Tong, X.; Wang, L.; Zhao, C.; Prishchepov, A.V. Monitoring finer-scale population density in urban functional zones: A remote sensing data fusion approach. Landsc. Urban Plan. 2019, 190, 103580. [Google Scholar] [CrossRef]
- Li, K.; Chen, Y.; Li, Y. The Random Forest-Based Method of Fine-Resolution Population Spatialization by Using the International Space Station Nighttime Photography and Social Sensing Data. Remote Sens. 2018, 10, 1650. [Google Scholar] [CrossRef]
- Zhou, Q.; Zhang, Y.; Gao, D.; Sun, B. Recognition of Urban Functional Regions at Street Scale Based on LJ1-01 Night-Time Light Remote Sensing and Mobile Big Data. ISPRS Ann. Photogramm. Remote Sens. Spat. Inf. Sci. 2019, 4, 119–124. [Google Scholar] [CrossRef]
- Huang, Q.; He, C.; Gao, B.; Yang, Y.; Liu, Z.; Zhao, Y.; Dou, Y. Detecting the 20 year city-size dynamics in China with a rank clock approach and DMSP/OLS nighttime data. Landsc. Urban Plan. 2015, 137, 138–148. [Google Scholar] [CrossRef]
- Liu, X.; de Sherbinin, A.; Zhan, Y. Mapping Urban Extent at Large Spatial Scales Using Machine Learning Methods with VIIRS Nighttime Light and MODIS Daytime NDVI Data. Remote Sens. 2019, 11, 1247. [Google Scholar] [CrossRef]
- Wicht, M.; Kuffer, M. The continuous built-up area extracted from ISS night-time lights to compare the amount of urban green areas across European cities. Eur. J. Remote Sens. 2019, 52, 58–73. [Google Scholar] [CrossRef]
- Guo, W.; Lu, D.; Kuang, W. Improving Fractional Impervious Surface Mapping Performance through Combination of DMSP-OLS and MODIS NDVI Data. Remote Sens. 2017, 9, 375. [Google Scholar] [CrossRef]
- Guo, W.; Zhang, Y.; Gao, L. Using VIIRS-DNB and landsat data for impervious surface area mapping in an arid/semiarid region. Remote Sens. Lett. 2018, 9, 587–596. [Google Scholar] [CrossRef]
- Kotarba, A.Z.; Aleksandrowicz, S. Impervious surface detection with nighttime photography from the International Space Station. Remote Sens. Environ. 2016, 176, 295–307. [Google Scholar] [CrossRef]
- Tang, P.; Du, P.; Lin, C.; Guo, S.; Qie, L. A Novel Sample Selection Method for Impervious Surface Area Mapping Using JL1-3B Nighttime Light and Sentinel-2 Imagery. IEEE J. Sel. Top. Appl. Earth Obs. Remote Sens. 2020, 13, 3931–3941. [Google Scholar] [CrossRef]
- Li, Q.; Lu, L.; Weng, Q.; Xie, Y.; Guo, H. Monitoring Urban Dynamics in the Southeast U.S.A. Using Time-Series DMSP/OLS Nightlight Imagery. Remote Sens. 2016, 8, 578. [Google Scholar] [CrossRef]
- Dou, Y.; Liu, Z.; He, C.; Yue, H. Urban Land Extraction Using VIIRS Nighttime Light Data: An Evaluation of Three Popular Methods. Remote Sens. 2017, 9, 175. [Google Scholar] [CrossRef]
- Guk, E.; Levin, N. Analyzing spatial variability in night-time lights using a high spatial resolution color Jilin-1 image—Jerusalem as a case study. ISPRS J. Photogramm. Remote Sens. 2020, 163, 121–136. [Google Scholar] [CrossRef]
- Ji, H.; Li, X.; Wei, X.; Liu, W.; Zhang, L.; Wang, L. Mapping 10-m resolution rural settlements using multi-source remote sensing datasets with the Google Earth Engine platform. Remote Sens. 2020, 12, 2832. [Google Scholar] [CrossRef]
- Cai, D.; Fraedrich, K.; Guan, Y.; Guo, S.; Zhang, C. Urbanization and the thermal environment of Chinese and US-American cities. Sci. Total Environ. 2017, 589, 200–211. [Google Scholar] [CrossRef]
- Yao, R.; Wang, L.; Huang, X.; Sun, L.; Chen, R.; Wu, X.; Zhang, W.; Niu, Z. A Robust Method for Filling the Gaps in MODIS and VIIRS Land Surface Temperature Data. IEEE Trans. Geosci. Remote Sens. 2021, 59, 10738–10752. [Google Scholar] [CrossRef]
- Chang, Y.; Xiao, J.; Li, X.; Middel, A.; Zhang, Y.; Gu, Z.; Wu, Y.; He, S. Exploring diurnal thermal variations in urban local climate zones with ECOSTRESS land surface temperature data. Remote Sens. Environ. 2021, 263, 112544. [Google Scholar] [CrossRef]
- Chen, D.; Zhang, F.; Zhang, M.; Meng, Q.; Jim, C.Y.; Shi, J.; Tan, M.L.; Ma, X. Landscape and vegetation traits of urban green space can predict local surface temperature. Sci. Total Environ. 2022, 825, 154006. [Google Scholar] [CrossRef]
- Pandey, B.; Joshi, P.; Seto, K.C. Monitoring urbanization dynamics in India using DMSP/OLS night time lights and SPOT-VGT data. Int. J. Appl. Earth Obs. Geoinf. 2013, 23, 49–61. [Google Scholar] [CrossRef]
- Zhao, Y.; Qu, Z.; Zhang, Y.; Ao, Y.; Han, L.; Kang, S.; Sun, Y. Effects of human activity intensity on habitat quality based on nighttime light remote sensing: A case study of Northern Shaanxi, China. Sci. Total Environ. 2022, 851, 158037. [Google Scholar] [CrossRef]
- Li, J.; Wang, F.; Fu, Y.; Guo, B.; Zhao, Y.; Yu, H. A novel SUHI referenced estimation method for multicenters urban agglomeration using DMSP/OLS nighttime light data. IEEE J. Sel. Top. Appl. Earth Obs. Remote Sens. 2020, 13, 1416–1425. [Google Scholar] [CrossRef]
- Li, X.; Li, D.; Xu, H.; Wu, C. Intercalibration between DMSP/OLS and VIIRS night-time light images to evaluate city light dynamics of Syria’s major human settlement during Syrian Civil War. Int. J. Remote Sens. 2017, 38, 5934–5951. [Google Scholar] [CrossRef]
- Li, X.; Liu, S.; Jendryke, M.; Li, D.; Wu, C. Night-Time Light Dynamics during the Iraqi Civil War. Remote Sens. 2018, 10, 858. [Google Scholar] [CrossRef]
- Hodler, R.; Raschky, P.A. Regional Favoritism. Q. J. Econ. 2014, 129, 995–1033. [Google Scholar] [CrossRef]
- Martinez, L.R. How Much Should We Trust the Dictator’s GDP Growth Estimates? J. Political Econ. 2022, 130, 2731–2769. [Google Scholar] [CrossRef]
- Li, X.; Zhang, R.; Huang, C.; Li, D. Detecting 2014 Northern Iraq Insurgency using night-time light imagery. Int. J. Remote Sens. 2015, 36, 3446–3458. [Google Scholar] [CrossRef]
- Enenkel, M.; Shrestha, R.M.; Stokes, E.; Román, M.; Wang, Z.; Espinosa, M.T.M.; Hajzmanova, I.; Ginnetti, J.; Vinck, P. Emergencies do not stop at night: Advanced analysis of displacement based on satellite-derived nighttime light observations. IBM J. Res. Dev. 2020, 64, 8:1–8:12. [Google Scholar] [CrossRef]
- Lo, C. Modeling the population of China using DMSP operational linescan system nighttime data. Photogramm. Eng. Remote Sens. 2001, 67, 1037–1047. [Google Scholar]
- Chen, X.; Nordhaus, W. A Test of the New VIIRS Lights Data Set: Population and Economic Output in Africa. Remote Sens. 2015, 7, 4937–4947. [Google Scholar] [CrossRef]
- Sun, L.; Wang, J.; Chang, S. Population Spatial Distribution Based on Luojia 1–01 Nighttime Light Image: A Case Study of Beijing. Chin. Geogr. Sci. 2021, 31, 966–978. [Google Scholar] [CrossRef]
- Sutton, P.C. A scale-adjusted measure of “urban sprawl” using nighttime satellite imagery. Remote Sens. Environ. 2003, 86, 353–369. [Google Scholar] [CrossRef]
- Chen, X. Nighttime Lights and Population Migration: Revisiting Classic Demographic Perspectives with an Analysis of Recent European Data. Remote Sens. 2020, 12, 169. [Google Scholar] [CrossRef]
- Sutton, P.C.; Elvidge, C.; Obremski, T. Building and evaluating models to estimate ambient population density. Photogramm. Eng. Remote Sens. 2003, 69, 545–553. [Google Scholar] [CrossRef]
- Cole, T.A.; Wanik, D.W.; Molthan, A.L.; Román, M.O.; Griffin, R.E. Synergistic Use of Nighttime Satellite Data, Electric Utility Infrastructure, and Ambient Population to Improve Power Outage Detections in Urban Areas. Remote Sens. 2017, 9, 286. [Google Scholar] [CrossRef]
- Casadio, S.; Arino, O.; Serpe, D. Gas flaring monitoring from space using the ATSR instrument series. Remote Sens. Environ. 2012, 116, 239–249. [Google Scholar] [CrossRef]
- Elvidge, C.D.; Zhizhin, M.; Hsu, F.C.; Baugh, K. What is so great about nighttime VIIRS data for the detection and characterization of combustion sources. Proc. Asia-Pac. Adv. Netw. 2013, 35, 33. [Google Scholar] [CrossRef]
- Pack, D.W.; Hardy, B.S. CubeSat Nighttime Lights. Available online: https://digitalcommons.usu.edu/smallsat/2016/S4LEOMis/1/ (accessed on 29 September 2022).
- Zheng, Q.; Weng, Q.; Huang, L.; Wang, K.; Deng, J.; Jiang, R.; Ye, Z.; Gan, M. A new source of multi-spectral high spatial resolution night-time light imagery—JL1-3B. Remote Sens. Environ. 2018, 215, 300–312. [Google Scholar] [CrossRef]
- Gu, Y.; Qiao, X.; Xu, M.; Zou, C.; Liu, D.; Wu, D.; Wang, Y. Assessing the Impacts of Urban Expansion on Bundles of Ecosystem Services by Dmsp-Ols Nighttime Light Data. Sustainability 2019, 11, 5888. [Google Scholar] [CrossRef]
- Zhao, N.; Ghosh, T.; Currit, N.A.; Elvidge, C.D. Relationships between satellite observed lit area and water footprints. Water Resour. Manag. 2011, 25, 2241–2250. [Google Scholar] [CrossRef]
- Cinzano, P.; Falchi, F.; Elvidge, C.; Baugh, K. The artificial sky brightness in Europe derived from DMSP satellite data. In Proceedings of the Symposium-International Astronomical Union, Pucón, Chile, 12–16 March 2001; pp. 95–102. [Google Scholar]
- Johnson, R.S.; Zhang, J.; Hyer, E.J.; Miller, S.D.; Reid, J.S. Preliminary investigations toward nighttime aerosol optical depth retrievals from the VIIRS Day/Night Band. Atmos. Meas. Tech. 2013, 6, 1245–1255. [Google Scholar] [CrossRef]
- Zhao, N.; Samson, E.L. Estimation of virtual water contained in international trade products using nighttime imagery. Int. J. Appl. Earth Obs. Geoinf. 2012, 18, 243–250. [Google Scholar] [CrossRef]
- Zhang, L.; Peng, J.; Liu, Y.; Wu, J. Coupling ecosystem services supply and human ecological demand to identify landscape ecological security pattern: A case study in Beijing–Tianjin–Hebei region, China. Urban Ecosyst. 2017, 20, 701–714. [Google Scholar] [CrossRef]
- Wang, W.; Wu, T.; Li, Y.; Xie, S.; Han, B.; Zheng, H.; Ouyang, Z. Urbanization Impacts on Natural Habitat and Ecosystem Services in the Guangdong-Hong Kong-Macao “Megacity”. Sustainability 2020, 12, 6675. [Google Scholar] [CrossRef]
- Caruana, A.M.; Malin, G. The variability in DMSP content and DMSP lyase activity in marine dinoflagellates. Prog. Oceanogr. 2014, 120, 410–424. [Google Scholar] [CrossRef]
- Miller, S.D.; Haddock, S.H.D.; Straka, W.C.; Seaman, C.J.; Combs, C.L.; Wang, M.; Shi, W.; Nam, S. Honing in on bioluminescent milky seas from space. Sci. Rep. 2021, 11, 15443. [Google Scholar] [CrossRef] [PubMed]
- Oda, T.; Maksyutov, S.; Elvidge, C.D. Disaggregation of national fossil fuel CO2 emissions using a global power plant database and DMSP nightlight data. In Proceedings of the 30th Asia-Pacific Advanced Network Meeting, Sydney, Australia, 7–11 February 2010; pp. 220–229. [Google Scholar]
- Wang, J.; Aegerter, C.; Xu, X.; Szykman, J.J. Potential application of VIIRS Day/Night Band for monitoring nighttime surface PM2.5 air quality from space. Atmos. Environ. 2016, 124, 55–63. [Google Scholar] [CrossRef]
- Zhang, G.; Shi, Y.; Xu, M. Evaluation of LJ1-01 Nighttime Light Imagery for Estimating Monthly PM2.5 Concentration: A Comparison With NPP-VIIRS Nighttime Light Data. IEEE J. Sel. Top. Appl. Earth Obs. Remote Sens. 2020, 13, 3618–3632. [Google Scholar] [CrossRef]
- Mu, H.; Li, X.; Du, X.; Huang, J.; Su, W.; Hu, T.; Wen, Y.; Yin, P.; Han, Y.; Xue, F. Evaluation of light pollution in global protected areas from 1992 to 2018. Remote Sens. 2021, 13, 1849. [Google Scholar] [CrossRef]
- Levin, N.; Kark, S.; Crandall, D. Where have all the people gone? Enhancing global conservation using night lights and social media. Ecol. Appl. 2015, 25, 2153–2167. [Google Scholar] [CrossRef]
- Mazor, T.; Levin, N.; Possingham, H.P.; Levy, Y.; Rocchini, D.; Richardson, A.J.; Kark, S. Can satellite-based night lights be used for conservation? The case of nesting sea turtles in the Mediterranean. Biol. Conserv. 2013, 159, 63–72. [Google Scholar] [CrossRef]
- Xue, X.; Lin, Y.; Zheng, Q.; Wang, K.; Zhang, J.; Deng, J.; Abubakar, G.A.; Gan, M. Mapping the fine-scale spatial pattern of artificial light pollution at night in urban environments from the perspective of bird habitats. Sci. Total Environ. 2020, 702, 134725. [Google Scholar] [CrossRef]
- Bankert, R.L.; Solbrig, J.E.; Lee, T.F.; Miller, S.D. Automated lightning flash detection in nighttime visible satellite data. Weather Forecast. 2011, 26, 399–408. [Google Scholar] [CrossRef]
- Zhang, X.-R.; Huang, Y.-X.; Yan, W.; Ma, S.; Jiang, J. Study on a lightning flash detection algorithm based on VIIRS/DNB. In Materials, Manufacturing Technology, Electronics and Information Science; Word Scientific: Singapore, 2016; pp. 295–306. [Google Scholar]
- Blakeslee, R.J.; Lang, T.J.; Koshak, W.J.; Buechler, D.; Gatlin, P.; Mach, D.M.; Stano, G.T.; Virts, K.S.; Walker, T.D.; Cecil, D.J.; et al. Three Years of the Lightning Imaging Sensor Onboard the International Space Station: Expanded Global Coverage and Enhanced Applications. J. Geophys. Res. Atmos. 2020, 125, e2020JD032918. [Google Scholar] [CrossRef]
- Huang, R.; Wu, W.; Yu, K. Building consistent time series night-time light data from average DMSP/OLS images for indicating human activities in a large-scale oceanic area. Int. J. Appl. Earth Obs. Geoinf. 2022, 114, 103023. [Google Scholar] [CrossRef]
- Kohiyama, M.; Hayashi, H.; Maki, N.; Higashida, M.; Kroehl, H.W.; Elvidge, C.D.; Hobson, V.R. Early damaged area estimation system using DMSP-OLS night-time imagery. Int. J. Remote Sens. 2004, 25, 2015–2036. [Google Scholar] [CrossRef]
- Fan, X.; Nie, G.; Deng, Y.; An, J.; Zhou, J.; Li, H. Rapid detection of earthquake damage areas using VIIRS nearly constant contrast night-time light data. Int. J. Remote Sens. 2019, 40, 2386–2409. [Google Scholar] [CrossRef]
- Gillespie, T.W.; Frankenberg, E.; Fung Chum, K.; Thomas, D. Night-time lights time series of tsunami damage, recovery, and economic metrics in Sumatra, Indonesia. Remote Sens. Lett. 2014, 5, 286–294. [Google Scholar] [CrossRef]
- Cao, C.; Shao, X.; Uprety, S. Detecting Light Outages After Severe Storms Using the S-NPP/VIIRS Day/Night Band Radiances. IEEE Geosci. Remote Sens. Lett. 2013, 10, 1582–1586. [Google Scholar] [CrossRef]
- Fang, J.; Zhang, C.; Fang, J.; Liu, M.; Luan, Y. Increasing exposure to floods in China revealed by nighttime light data and flood susceptibility mapping. Environ. Res. Lett. 2021, 16, 104044. [Google Scholar] [CrossRef]
- Aubrecht, C.; Elvidge, C.; Baugh, K.; Hahn, S.; Jorge, N. Identification of wildfire precursor conditions: Linking satellite based fire and soil moisture data. Comput. Vis. Med. Image Process. VipIMAGE 2011, 347–353. Available online: https://books.google.co.uk/books?hl=en&lr=&id=rr7LBQAAQBAJ&oi=fnd&pg=PA347&dq=Identification+of+wildfire+precur-sor+conditions:+Linking+satellite+based+fire+and+soil+moisture+data&ots=wtwEQyzy_9&sig=aEGZhEya8FS93dboJMY4ummJ-ew&redir_esc=y#v=onepage&q=Identification%20of%20wildfire%20precursor%20conditions%3A%20Linking%20satellite%20based%20fire%20and%20soil%20moisture%20data&f=false (accessed on 10 June 2022).
- Polivka, T.N.; Wang, J.; Ellison, L.T.; Hyer, E.J.; Ichoku, C.M. Improving Nocturnal Fire Detection With the VIIRS Day–Night Band. IEEE Trans. Geosci. Remote Sens. 2016, 54, 5503–5519. [Google Scholar] [CrossRef]
- Feng, Y.; Liu, S.; Tang, L. Automatic extraction and change monitoring of fire disaster event based on high-resolution nighttime light remote sensing images. In Proceedings of the Image and Signal Processing for Remote Sensing XXVI, Online, 21–25 September 2020; pp. 57–65. [Google Scholar]
- Kloog, I.; Haim, A.; Stevens, R.G.; Barchana, M.; Portnov, B.A. Light at night co-distributes with incident breast but not lung cancer in the female population of Israel. Chronobiol. Int. 2008, 25, 65–81. [Google Scholar] [CrossRef]
- Rybnikova, N.A.; Haim, A.; Portnov, B.A. Is prostate cancer incidence worldwide linked to artificial light at night exposures? Review of earlier findings and analysis of current trends. Arch. Environ. Occup. Health 2017, 72, 111–122. [Google Scholar] [CrossRef]
- Khan, Z.A.; Yumnamcha, T.; Mondal, G.; Devi, S.D.; Rajiv, C.; Labala, R.K.; Sanjita Devi, H.; Chattoraj, A. Artificial light at night (ALAN): A potential anthropogenic component for the COVID-19 and HCoVs outbreak. Front. Endocrinol. 2020, 11, 622. [Google Scholar] [CrossRef] [PubMed]
- Koo, Y.S.; Song, J.-Y.; Joo, E.-Y.; Lee, H.-J.; Lee, E.; Lee, S.-K.; Jung, K.-Y. Outdoor artificial light at night, obesity, and sleep health: Cross-sectional analysis in the KoGES study. Chronobiol. Int. 2016, 33, 301–314. [Google Scholar] [CrossRef]
- Hu, K.; Li, W.; Zhang, Y.; Chen, H.; Bai, C.; Yang, Z.; Lorenz, T.; Liu, K.; Shirai, K.; Song, J.; et al. Association between outdoor artificial light at night and sleep duration among older adults in China: A cross-sectional study. Environ. Res. 2022, 212, 113343. [Google Scholar] [CrossRef]
- Lin, G. Urban Forms, Physical Activity and Body Mass Index: A Cross-City Examination Using ISS Earth Observation Photographs; NASA Summer Faculty Fellowship Program 2004, Volumes 1 and 2: 2005. Available online: https://ntrs.nasa.gov/api/citations/20050202018/downloads/20050202018.pdf (accessed on 10 June 2022).
- Roychowdhury, K.; Jones, S. Nexus of health and development: Modelling crude birth rate and maternal mortality ratio using nighttime satellite images. ISPRS Int. J. Geo-Inf. 2014, 3, 693–712. [Google Scholar] [CrossRef]
- Singhania, S.; Tupakula, S.; Manocha, P.; Susarla, R.; Kapur, P. Evolution of Cognitive Connectivity in India: Evidence from Internal Religious Tourism. 2021. Available online: https://papers.ssrn.com/sol3/papers.cfm?abstract_id=3905179 (accessed on 9 September 2022).
- Liu, S.; Li, X.; Levin, N.; Jendryke, M. Tracing cultural festival patterns using time-series of VIIRS monthly products. Remote Sens. Lett. 2019, 10, 1172–1181. [Google Scholar] [CrossRef]
- Alahmadi, M.; Mansour, S.; Dasgupta, N.; Abulibdeh, A.; Atkinson, P.M.; Martin, D.J. Using Daily Nighttime Lights to Monitor Spatiotemporal Patterns of Human Lifestyle under COVID-19: The Case of Saudi Arabia. Remote Sens. 2021, 13, 4633. [Google Scholar] [CrossRef]
- Liu, J.; Deng, Y.; Wang, Y.; Huang, H.; Du, Q.; Ren, F. Urban Nighttime Leisure Space Mapping with Nighttime Light Images and POI Data. Remote Sens. 2020, 12, 541. [Google Scholar] [CrossRef]
- Zeng, W.; Zhong, Y.; Li, D.; Deng, J. Classification of Recreation Opportunity Spectrum Using Night Lights for Evidence of Humans and POI Data for Social Setting. Sustainability 2021, 13, 7782. [Google Scholar] [CrossRef]
- Wei, S.; Jiao, W.; Liu, H.; Long, T.; Liu, Y.; Ji, P.; Hou, R.; Zhang, N.; Xiao, Y. Research on Comfort Evaluation Model of Urban Residents’ Public Space Lighting Integrating Public Perception and Nighttime Light Remote Sensing Data. Remote Sens. 2022, 14, 655. [Google Scholar]
- McDonald, G.G.; Costello, C.; Bone, J.; Cabral, R.B.; Farabee, V.; Hochberg, T.; Kroodsma, D.; Mangin, T.; Meng, K.C.; Zahn, O. Satellites can reveal global extent of forced labor in the world’s fishing fleet. Proc. Natl. Acad. Sci. USA 2021, 118, e2016238117. [Google Scholar] [CrossRef] [PubMed]
- Kitschelt, H. Brian Min, Power and the vote: Elections and electricity in the developing world. Camb. Rev. Int. Aff. 2016, 29, 786–791. [Google Scholar] [CrossRef]
- Ernst, M. Satellite Data, Women Defectors and Black Markets in North Korea: A Quantitative Study of the North Korean Informal Sector Using Night-Time Lights Satellite Imagery; McFarland: Jefferson, NC, USA, 2016. [Google Scholar]
- Elvidge, C.D.; Safran, J.; Tuttle, B.; Sutton, P.; Cinzano, P.; Pettit, D.; Arvesen, J.; Small, C. Potential for global mapping of development via a nightsat mission. GeoJournal 2007, 69, 45–53. [Google Scholar] [CrossRef]
- Bruederle, A.; Hodler, R. Nighttime lights as a proxy for human development at the local level. PLoS ONE 2018, 13, e0202231. [Google Scholar] [CrossRef]
- Watmough, G.R.; Atkinson, P.M.; Saikia, A.; Hutton, C.W. Understanding the Evidence Base for Poverty–Environment Relationships using Remotely Sensed Satellite Data: An Example from Assam, India. World Dev. 2016, 78, 188–203. [Google Scholar] [CrossRef]
- Engstrom, R.; Hersh, J.; Newhouse, D. Poverty from Space: Using High Resolution Satellite Imagery for Estimating Economic Well-being. World Bank Econ. Rev. 2022, 36, 382–412. [Google Scholar] [CrossRef]
- Watmough, G.R.; Marcinko, C.L.J.; Sullivan, C.; Tschirhart, K.; Mutuo, P.K.; Palm, C.A.; Svenning, J.C. Socioecologically informed use of remote sensing data to predict rural household poverty. Proc. Natl. Acad. Sci. USA 2019, 116, 1213–1218. [Google Scholar] [CrossRef]
- SDG. SDG Indicator 4.4.1. Available online: https://unstats.un.org/sdgs/metadata/files/Metadata-04-04-01.pdf (accessed on 20 September 2022).
- Kuek, S.C.; Paradi-Guilford, C.; Fayomi, T.; Imaizumi, S.; Ipeirotis, P.; Pina, P.; Singh, M. The Global Opportunity in Online Outsourcing. 2015. Available online: http://hdl.handle.net/10986/22284 (accessed on 15 September 2022).
- Rey-Moreno, C.; Sabiescu, A.G.; Siya, M.J. Towards self-sustaining community networks in rural areas of developing countries: Understanding local ownership. In Proceedings of the 8th International Development Informatics Association Conference, Port Elizabeth, South Africa, 3–4 November 2014; pp. 63–77. Available online: https://www.researchgate.net/publication/267869600_Towards_self-sustaining_community_networks_in_rural_areas_of_developing_countries_Understanding_local_ownership (accessed on 15 September 2022).
- Liu, X.; Hu, G.; Chen, Y.; Li, X.; Xu, X.; Li, S.; Pei, F.; Wang, S. High-resolution multi-temporal mapping of global urban land using Landsat images based on the Google Earth Engine Platform. Remote Sens. Environ. 2018, 209, 227–239. [Google Scholar] [CrossRef]
- Esch, T.; Heldens, W.; Hirner, A.; Keil, M.; Marconcini, M.; Roth, A.; Zeidler, J.; Dech, S.; Strano, E. Breaking new ground in mapping human settlements from space—The Global Urban Footprint. ISPRS J. Photogramm. Remote Sens. 2017, 134, 30–42. [Google Scholar] [CrossRef]
- Falchetta, G.; Pachauri, S.; Byers, E.; Danylo, O.; Parkinson, S.C. Satellite Observations Reveal Inequalities in the Progress and Effectiveness of Recent Electrification in Sub-Saharan Africa. One Earth 2020, 2, 364–379. [Google Scholar] [CrossRef]
- Ghosh, T.; Anderson, S.; Elvidge, C.; Sutton, P. Using Nighttime Satellite Imagery as a Proxy Measure of Human Well-Being. Sustainability 2013, 5, 4988–5019. [Google Scholar] [CrossRef]
- Gibson, J.; Olivia, S.; Boe-Gibson, G.; Li, C. Which night lights data should we use in economics, and where? J. Dev. Econ. 2021, 149, 102602. [Google Scholar] [CrossRef]
- Guo, F.; Huang, Y.; Wang, J.; Wang, X. The informal economy at times of COVID-19 pandemic. China Econ. Rev. 2022, 71, 101722. [Google Scholar] [CrossRef]
- Svechkina, A.; Trop, T.; Portnov, B.A. How Much Lighting is Required to Feel Safe When Walking Through the Streets at Night? Sustainability 2020, 12, 3133. [Google Scholar] [CrossRef]
- Goldblatt, R.; Stuhlmacher, M.F.; Tellman, B.; Clinton, N.; Hanson, G.; Georgescu, M.; Wang, C.; Serrano-Candela, F.; Khandelwal, A.K.; Cheng, W.-H.; et al. Using Landsat and nighttime lights for supervised pixel-based image classification of urban land cover. Remote Sens. Environ. 2018, 205, 253–275. [Google Scholar] [CrossRef]
- McCallum, I.; Kyba, C.C.M.; Bayas, J.C.L.; Moltchanova, E.; Cooper, M.; Cuaresma, J.C.; Pachauri, S.; See, L.; Danylo, O.; Moorthy, I. Estimating global economic well-being with unlit settlements. Nat. Commun. 2022, 13, 2459. [Google Scholar] [CrossRef]
- Moallemi, E.A.; Malekpour, S.; Hadjikakou, M.; Raven, R.; Szetey, K.; Ningrum, D.; Dhiaulhaq, A.; Bryan, B.A. Achieving the sustainable development goals requires transdisciplinary innovation at the local scale. One Earth 2020, 3, 300–313. [Google Scholar] [CrossRef]
- Bell, W.D.; Visser, V.; Kirsten, T.; Hoffman, M.T. An evaluation of different approaches which use Google Street View imagery to ground truth land degradation assessments. Environ. Monit. Assess. 2022, 194, 732. [Google Scholar] [CrossRef]
- Avendano, R.; Jütting, J.; Kuhm, M. Counting the Invisible: The Challenges and Opportunities of the SDG Indicator Framework for Statistical Capacity Development. In The Palgrave Handbook of Development Cooperation for Achieving the 2030 Agenda: Contested Collaboration; Chaturvedi, S., Janus, H., Klingebiel, S., Li, X., Mello e Souza, A.D., Sidiropoulos, E., Wehrmann, D., Eds.; Springer International Publishing: Cham, Switzerland, 2021; pp. 329–345. [Google Scholar]
- López, G.A.G. Scaling Up from the Top Down and the Bottom Up: The Impacts and Governance of Inter-Community Forest Associations in Durango, Mexico. Ph.D. Thesis, Indiana University, Indianapolis, IN, USA, 2012. [Google Scholar]

Disclaimer/Publisher’s Note: The statements, opinions and data contained in all publications are solely those of the individual author(s) and contributor(s) and not of MDPI and/or the editor(s). MDPI and/or the editor(s) disclaim responsibility for any injury to people or property resulting from any ideas, methods, instructions or products referred to in the content. |
© 2023 by the authors. Licensee MDPI, Basel, Switzerland. This article is an open access article distributed under the terms and conditions of the Creative Commons Attribution (CC BY) license (https://creativecommons.org/licenses/by/4.0/).