Abstract
As very fragile natural ecological areas, the spatiotemporal ecological environment (EE) analysis of World Natural Heritage Sites (WNHSs) is particularly important for their conservation and sustainable development. Timely, objective and quantitative evaluation of the spatiotemporal EE change characteristics of WNHSs is of great significance for ecological, environmental protection and government policy formulation. This study quantitatively evaluates the spatiotemporal distribution characteristics of the EE of the Kalajun–Kuerdening WNHS by selecting the Remote Sensing Ecological Environment Index (RSEI) for 2006, 2011, 2016 and 2021. We studied the spatiotemporal differences of the EE in buffer zones and nominated sites in the heritage sites and their change patterns and trends. The EE changes and land use changes from 2006–2011, 2011–2016 and 2016–2021 were overlaid and analyzed to explore the relationship between EE evolution and land use changes in the heritage site. The results show that (1) the heritage site was in a state of ecological change equilibrium from 2006 to 2011, and a form of slight decline in EE quality from 2011 to 2016 under the influence of natural factors, but it maintained a stable state with a small degree of fluctuation, and a state of ecological change recovery from 2016 to 2021. The areas with better EE grades were located in the northwest region (Kalajun) and northeast region (Kuerdening) of the heritage site. (2) The EE grade change in the heritage site shows the characteristics of neighborhood change without a large number of leap changes. (3) From 2006 to 2021, the EE quality in the nominated site was better than that of the buffer zone, but from 2016 onward, the difference between the two gradually decreased until 2021. The average EE quality was basically the same until 2021, but, spatially, the EE quality of most areas in the buffer zone was better than that in the nominated area. (4) The types of land use transformation that caused EE enhancement in the heritage sites were barren–grassland, snow/ice–barren and barren–snow/ice, while the types of land use transformation that caused EE quality reduction were grassland–barren and barren–snow/ice. The results of this study help improve the knowledge of the EE background of the WNHS and its evolutionary process and provide scientific guidance for ecologically related decision making and management of global natural heritage sites. The change in snow and ice cover is an essential factor in the shift of the EE of the Kalajun–Kuerdening World Natural Heritage Site.
1. Introduction
World Natural Heritage Sites (WNHSs) have geological, hydrological and ecological features that distinguish them from other natural areas in the world, are habitats and refuges for many endangered plants and animals, are important areas for ecosystem service functions and are natural areas of outstanding universal value worldwide [,]. They are also an essential component of global ecosystem conservation []. Over the years, there have been a number of conflicts between the development of heritage resource use and conservation in WNHSs [], which have manifested in the gradual transition from anthropogenic threats such as overexploitation and the neglect of conservation in the early years to threats to the WNHSs from invasive species, climate change and geological hazards in recent years [,,,]. These threats have seriously affected the structure and processes of WNHSs’ ecosystems and coerced global ecosystems’ sustainable development []. The research on threats and conservation strategies facing natural World Heritage sites in China’s academia has been in line with international standards. The main research contents include the comparison and management of World Natural Heritage value assessments [,,], the development and conservation of World Natural Heritage resources [], the evaluation and analysis of the landscape health of Natural World Heritage Sites [], the monitoring and evaluation of ecological environment (EE) of heritage sites [,,] and others.
On 2 December 2020, IUCN released the World Heritage Outlook (3rd edition) [], which states that one-third of the world’s natural World Heritage Sites are threatened by climate change. In order to effectively respond to the changes in ecosystem structure and processes caused by the multiple threat factors to which heritage sites are exposed, regular monitoring and assessment of the EE quality status of natural World Heritage Sites is a crucial aspect []. Rapid and accurate assessment of the EE is a prerequisite and fundamental task for EE protection and restoration studies of natural World Heritage Sites. Monitoring and assessment provide clear guidance for managing natural World Heritage Sites [,]. However, in the monitoring process of WNHSs, the comprehensive limitation of human, material and financial resources has led to a lot of labor and time being spent in collecting data and information on heritage sites in the past. Some work has even been difficult to be carried out due to the need for more professional equipment and tools. Therefore, a rapid and economical method of monitoring and ecological quality evaluation is essential to promote the Sustainable Development Goals (SDG) under the premise of satisfying monitoring and ecological quality evaluation, considering various constraints [,].
The Kalajun–Kuerdening region is an integral part of the Tianshan WNHS in Xinjiang, listed as a WNHS in 2013 due to its outstanding bio-ecological value []. It is also the region with the highest biodiversity in the Tianshan Mountains of China and has excellent natural heritage value. This heritage site is significant in protecting regional biodiversity, maintaining regional ecological balance and promoting the harmonious development of humans and the environment. The ecological security of the heritage site, the ecological health of the landscape and the good or bad quality of the EE directly or indirectly affect the regional ecological security and the realization of the regional ecosystem service function []. Objectively understanding, recognizing and studying the spatial and temporal changes in the regional EE and the driving factors can provide basic research work to support the ecosystem regulation and management of heritage sites []. Moreover, it is related to the evaluation of the quality of the construction of nature reserves in China. In addition, there are relatively few international studies on this region, mainly focusing on landscape pattern characteristics and its health [], and landscape connectivity studies []. Therefore, a long-term and high spatial resolution EE background study of the region is necessary. At the same time, an ecological and environmental quality assessment of heritage sites is a prerequisite for objective and dynamic research and the analysis of land use efficiency and the tourism suitability development of heritage sites [,,].
For the construction and development of the ecosystem evaluation and management system of the WNHSs, this paper is dedicated to the basic principles of multi-target, multi-conditions and multi-criteria, and the monitoring and analysis of the long-term dynamic changes in the EE of the nature reserves utilizing the latest remote sensing technology (RS) and geographic information technology (GIS). By constructing the EE index of the heritage site from 2006 to 2021, the spatial and temporal characteristics of its dynamic evolution and EE in different zones and their change patterns are analyzed. The primary purpose is to investigate the characteristics and trends of EE changes caused by land cover changes in the sites and to provide scientific reference for the conservation management and sustainable development of WNHSs.
Compared to previous studies, our scientific contributions are as follows.
Firstly, we reveal the difference in ecological quality between buffer zones and nominated World Natural Heritage Sites from the perspective of different conservation areas (buffer zones and nominated sites) divided by different conservation degrees in the sites’ early years. There are very few relevant studies internationally.
Secondly, from the perspective of land use and EE analysis, the previous studies only analyzed the EE differences between different land uses. At the same time, we reveal the relationship between land use changes and EE changes in this World Natural Heritage Site from the perspective of long-term and multi-period dynamic changes.
2. Materials and Methods
2.1. Study Site
The Kalajun–Kuerdening heritage site is located in the central part of the Tianshan Mountains, in the Middle Tianshan Mountains in Xinjiang, with the overall topography being high in the south and low in the north. It is an integral part of the wild fruit forests in Central Asia as well as the origin and concentrated distribution area of wild apples, walnuts, European plums and other species. It is also a suitable habitat and source of global Schrenk spruce (Picea schrenkiana Fisch. et Mey.) []. Kalajun is the most prototypical representative of the Tianshan coniferous forest bioregion in the Central Asian Mountain Steppe and Woodland Ecoregions in Global 200 Ecoregions. Kuerdening is the most prototypical representative of the Tianshan Mountain Steppe Meadow bioregion (Figure 1).
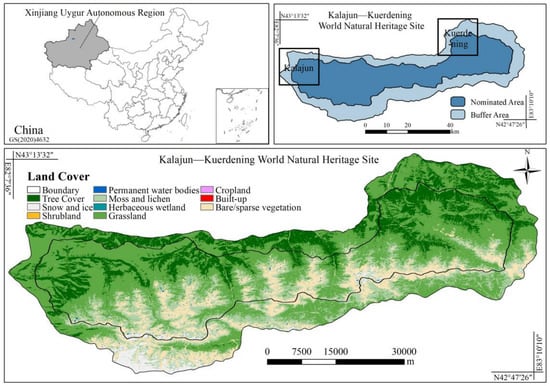
Figure 1.
The location of the Kalajun–Kuerdening World Natural Heritage Site.
Kuerdening is the area with the most abundant precipitation in the Tianshan Mountains. The unique natural ecological and geographical environment has created suitable living conditions for wild flora and fauna, becoming a refuge for many ancient remnant species, rich in biological resources and endemic species, and a key area of biodiversity in Tianshan. There are 1594 wild vascular plants in the Kalajun–Kuerdening nominated heritage site. Twelve species are listed in the International Union for Conservation of Nature Red Book of Threatened Species IUCN (2010), and 10 are listed in the National List of Key Protected Wild Plants. Additionally, the Kalajun–Kuerdening nominated heritage site is an integral part of China’s biodiversity key area and is an essential habitat for many rare and endangered animal species, with 55 species of various rare and endangered animals. It also has 15 species of wild animals endemic to Tianshan, which is of great significance to the scientific research on the genetics of wild plant and animal species in China and the world, and the systematic evolution of key taxa of wild animals and plants in the desert mountains of temperate arid zones.
2.2. Data and Source
This study retrieved the ecological and environmental index with the USGS Landsat 5 Level 2, Collection 2, Tier 1 and USGS Landsat 8 Level 2, Collection 2, Tier 1 datasets integrated in Google Earth Engine to measure the regional ecological and environmental quality changes. It also used the land cover products by Xin Huang [] for the follow-up study (Table 1). The overall accuracy of the land cover product is 79.31%.

Table 1.
List of data used in the research.
2.3. Method
Ecological evaluation primarily uses comprehensive coupled methods or indices to meet the needs of integrated ecosystem complexity [], such as environmental quality index (EQI), forest affinity index (FAI), ecological index (EI) of Chinese ecological standards, environmental stress index (ESI), and energy security and environmental sustainability index (ESESI) [,] and others. However, for various reasons, such as ecological differences, ease of data acquisition, policy support, and the flourishing development of RS, GIS, and computer science and technology, Remote Sensing Ecological Environment Index (RSEI) has emerged []. The previously used methods have great difficulty acquiring data for some of the indicators, and the spatial resolution of the data cannot reach the accuracy of RSEI. RSEI is based on remote sensing information and adopts the principal component analysis (PCA) method, which has the advantages of stability, objectivity and visualization in the calculation of the index and has been proven by several scholars [,]. It is likewise easier to compare in the time dimension. It has been applied to a variety of evaluation objects, such as regions [,,], cities [,], watersheds and basins [,], World Heritage Sites [] and others.
Although the four leading indices of heat, dryness, humidity and greenness that need to be used in RSEI are correlated in spatial dimensions, after the PCA spatial base system change, there is no correlation among the transformed measurements of all four indices. It facilitates the subsequent comparative use and multi-perspective analysis of the remote sensing index of EE. RSEI is an index proposed to optimally characterize the quality of the regional EE from data acquisition, calculation method and practicality perspectives. The calculation framework, calculation method and interpretation of RSEI are shown in Figure 2 and Table 2.
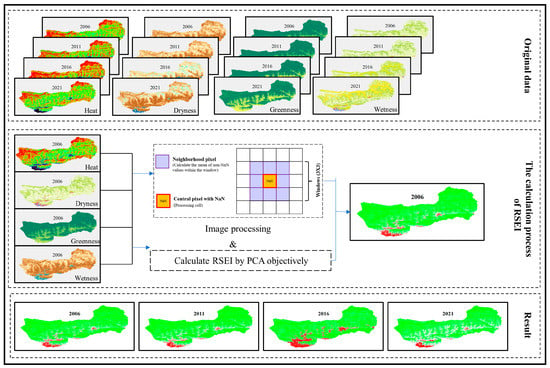
Figure 2.
Schematic diagram of Remote Sensing Ecological Environment Index calculation.

Table 2.
WET, NDVI, NDBSI, LST and RSEI formula calculation and explanation.
2.4. Data Processing
From the Google Earth Engine, the mean values of all available images from June to September within the corresponding years of 2006, 2011, 2016 and 2021 that met the cloudiness criteria required for the study were synthesized into four periods of images as the base image data for the study. Considering the spatial autocorrelation in geography, we used valid image elements to estimate invalid pixel values in the data preprocessing process []. Some of the missing image elements in the four indices of each image inversion were made up using the mean values of non-NaN values within the 3X3 domain window. Because the study site does not contain a large number of water bodies, there was no need to use the Modified Normalized Difference Water Index (MNDWI) for water body mask removal from the original images []. All four indices were normalized to be homogenized and dimensionless. Python 3.9 was used to calculate the required ecological indices and compare each period’s ecological evaluation results. Then the relationship between EE change and land cover change was calculated and analyzed by programming. The resolution of all geographical images was 30 m.
3. Results
3.1. Factor Attributes
The detailed statistics of the four normalized impact factors of the EE index of the Kalajun–Kuerdening World Natural Heritage Site from 2006 to 2021 are shown in Table 3, and Figure 3 and Figure 4a. The normalized LST mean value representing the heat index decreases from 0.70 to 0.62, 0.65 and 0.60 in 2006, 2011, 2016 and 2021, respectively, indicating a decreasing trend of heat within the heritage site from June to September each year from 2006 to 2021. The high and cold weather is not conducive to vegetation growth [], validating the reasonableness of the decreasing RSEI values from 2006 to 2021. The high geothermal area in 2006 was mainly concentrated in the northeast (Kalajun) and northwest (Kuerdening) of the study site, and it was expanding by 2016. By 2021, the geothermal high-value area had decreased rapidly and remain concentrated in the study area’s northeast and northwest regions. From 0.57 in 2006 to 0.27 in 2021, the mean surface dryness decreased by 52.6%, showing a pronounced decreasing pattern overall. This indicator also fully justifies the obvious temporal variation pattern of the RSEI in the study. In contrast, the mean value of LSM decreased from 0.32 in 2006 to 0.22 in 2011. It increased to 0.34 in 2016 and 2021, showing a stable state. The average value of greenness decreased from 0.78 in 2006 to 0.75 in 2011 and then expanded to 0.77 in 2016 and 2021, demonstrating that plant growth in the study site remained stable and healthy from 2006 to 2021 with less fluctuation (Figure 3).

Table 3.
Statistics of used factors from 2006 to 2021.
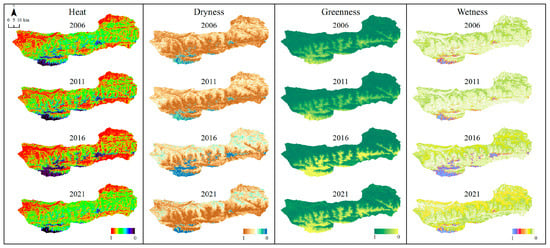
Figure 3.
Normalized index of heat, dryness, greenness and humidity from 2006 to 2021.
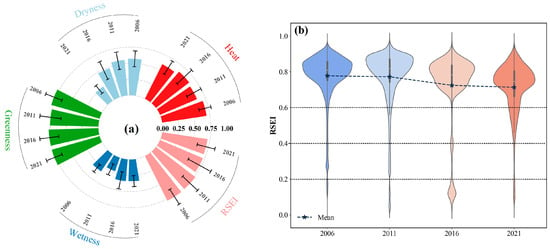
Figure 4.
(a) Four factors and (b) RSEI statistics for 2006–2021.
The four-year RSEI values in 2006, 2011, 2016 and 2021 were 0.78, 0.77, 0.72 and 0.71, respectively (Figure 4b). The results show that the mean RSEI values in the study site from 2006 to 2021 showed a significant decreasing trend, but the decreasing trend was slow. The distribution of RSEI values in the study area from 2006 to 2016 was above 0.60, the distribution below 0.4 increased in 2016, and the distribution in the range of 0.40–0.60 increased in 2021. Since 2016, there has been a significant downward trend in the ecosystem quality in the study site, but it has maintained a more stable state. The fluctuations are relatively small.
3.2. Spatiotemporal Ecological Environment Changes
To further analyze the spatial distribution of the EE in the Kalajun–Kuerdening WNHS, the RSEI in the study site was divided into five classes [,,,]. Each level was in increments of 0.2, poor (level 1): 0 < RSEI ≤ 0.2; fair (level 2): 0.2 < RSEI ≤ 0.4; medium (level 3): 0.4 < RSEI ≤ 0.6; good (level 4): 0.6 < RSEI ≤ 0.8; excellent (level 5): 0.8 < RSEI ≤ 1.0.
The results show (Figure 5b) that the spatial area with a poor EE (RSEI ≤ 0.4) in the heritage site from 2006 to 2021 is located in the southwest region, which is covered with glacial snow all year round and is not favorable to the growth of ecological vegetation under very cold temperatures. The areas with a good EE (RSEI > 0.6) are in the northwest (Kalajun) and northeast (Kuerdening) regions, mainly because of the large number of Schrenk spruces in the region, which have dense vegetation and a beautiful EE. The spatial distribution of the medium-grade EE is concentrated in the central part of the study site, the core of the heritage site, where many alpine meadows are distributed.
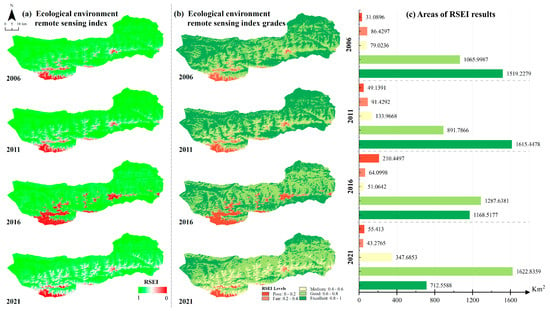
Figure 5.
RSEI raw data and its classification results in 2006, 2011, 2016, 2021.
The area with the poorest class of EE in the study site was smaller in 2006, 2011 and 2021, 31.0896 km2, 49.1391 km2 and 55.413 km2, respectively, while it was 210.4497 km2 in 2016, which was a significant increase compared to the other three years. The area with the fair EE had a weakening trend, firstly increasing from 86.4297 km2 in 2006 to 91.4292 km2 in 2011. Then it had a decreasing trend, decreasing to 64.0998 km2 in 2016 and 43.2765 km2 in 2021. The area with a medium EE had a higher characteristic in 2021, being 347.6853 km2, while it was only 79.0236 km2, 133.9668 km2 and 51.0642 km2 in 2006, 2011 and 2016, respectively. The ecologically good areas showed a decreasing trend from 2006 to 2011, and decreased from 1065.9987 km2 to 891.7866 km2 in 2016. The trend of the area of excellent and good EE in the heritage site from 2006 to 2021 showed opposite results, first increasing from 1519.2279 km2 in 2006 to 1615.4478 km2 in 2011 and then showing a decreasing trend. The area of ecologically excellent areas in the heritage site decreased to 1168.5177 km2 in 2016, while it was only 712.5588 km2 in 2021 (Figure 5c).
From 2006 to 2021, the change in the EE level in the study site shows the trend of neighboring level change; that is, the pattern of EE change (increase or decrease) within the natural heritage sites mainly to neighboring levels, without the characteristics of a large number of leap changes. For example, the change process of the area with good EE quality from 2006 to 2011 mainly transformed to medium and excellent ecological quality. The area with excellent ecological quality in 2011 transformed into a good ecological quality in 2016. Similarly, the area with a good EE in 2016 mainly changed to the same level in 2021 (Figure 6). Side by side, it reflects that under the influence of natural laws, the EE in the Kalajun–Kuerdening Natural Heritage Site is less variable and more ecologically resilient.
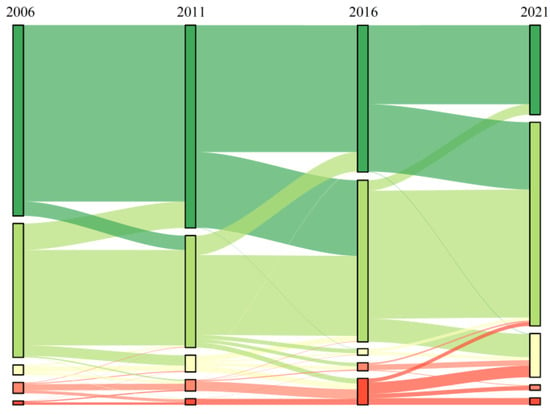
Figure 6.
Changes in ecological quality from 2006 to 2021.
3.3. Spatial Ecological Change and Regional Ecological Change Statistics
To assess the reasonableness of the RSEI changes, we used World Imagery (https://livingatlas.arcgis.com/wayback/ (accessed on 6 February 2023)) historical image comparison to verify the results of the changes. The results are shown in Figure 7. It is clear from the figure that building expansion (Figure 7b,e) caused a decrease in the quality of the ecosystem, while the demolition of buildings (Figure 7a) improved the quality of the ecosystem. Some forest areas improved their ecological quality due to the increase in tree density (Figure 7d).
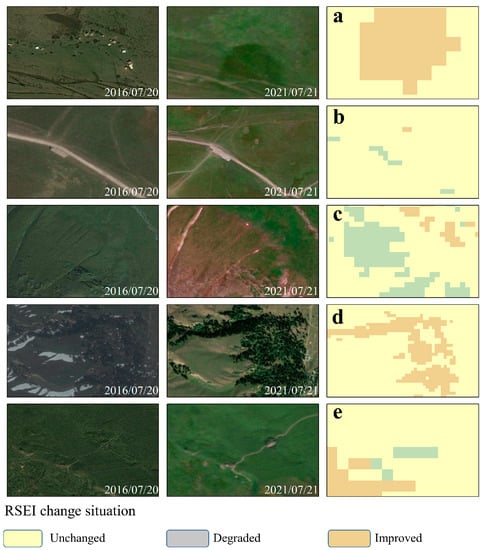
Figure 7.
Case of comparative analysis of RSEI change images combined with World Imagery images. (a,b,e) Ecological changes in building and road areas. (c) Ecological changes in grassland areas. (d) Ecological changes in the forest area.
In order to explore the spatial distribution of EE changes in the Kalajun–Kuerdening WNHS from 2006–2021, based on the outcomes of RSEI grade classification in the study site in 2006, 2011, 2016 and 2021, the graded RSEI results were subjected to different operations to calculate the three change periods’ (2006–2011, 2011–2016, 2016–2021) RSEI variability, and a total of nine change results (−4, −3, −2, −1, 0, 1, 2, 3, 4) were generated. The spatial distribution results obtained are shown in Figure 8a,c,e, and the spatial and temporal area changes are shown in Table 4.
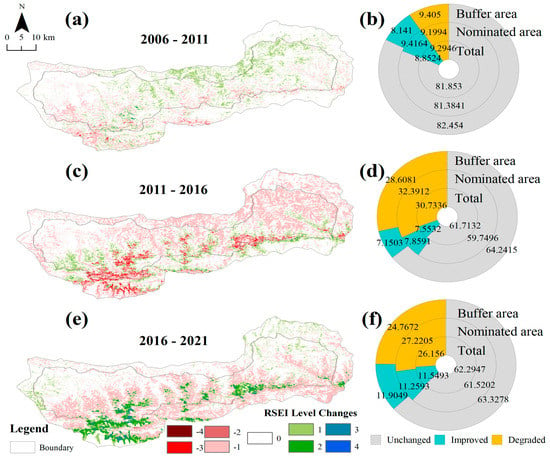
Figure 8.
Spatial distribution of RSEI grade changes and statistics of changes in buffer area and nominated area. (a,c,e) Spatial distribution of RSEI grade changes, 2006–2011, 2011–2016 and 2016–2021. (b,d,f) The proportion of ecological environment.

Table 4.
Percentage of RSEI grade change statistics, 2006–2011, 2011–2016 and 2016–2021.
The study results show that during 2006–2011, 8.8523% of the study site was improved, distributed in the north and northeast of the site (Kuerdening). The percentage of areas with decreasing ecological quality was 9.2945%, located in the southwest and central scattered areas of the site. The study area was in ecological balance, and 99.1674% of the ecological change levels were concentrated within ±1. The percentage of ecological improvement areas during 2011–2016 was 7.5532% and distributed in the site’s central part. The percentage of the area with decreasing EE quality was 30.7336%, distributed in the southern and southwestern regions of the heritage site. Excluding the areas with a slight degree of change (±1) in the study area, about 3.9098% of the areas with decreasing EE quality were the glacier and snow-covered areas in the study area, and there were sizeable EE change conditions in this area.
The percentage of EE improvement area in the study site during 2016–2021 was 11.5493%, which is 52.9061% higher than that during 2011–2016. The improved EE increased significantly and was located in the southwestern part of the heritage site in the glacial snow region, in the western part of the Kalajun region, and the northeastern part of the Kuerdening region. The area of EE quality decreased by 26.156%. However, the leading EE quality decreased by −1 grade, showing a slight ecological EE decrease, distributed in the central part of the heritage site. No EE quality decreased by −2, −3 and −4 grades. The above reflects that the decline in EE quality in the study area has been curbed, and the EE has shown a recovery trend.
To distinguish the difference in the ecological transformation between the buffer site and the nominated area and explain the distinction in the transformation between each area, we separately counted the percentage of changes in RSEI within the buffer zone and the nominated area at 5-year intervals and classified the results into nine categories (−4~4). The findings are displayed in Table 5 and Figure 9.

Table 5.
Percentage of RSEI grade change statistics in buffer zone and nominated area, 2006–2011, 2011–2016 and 2016–2021.
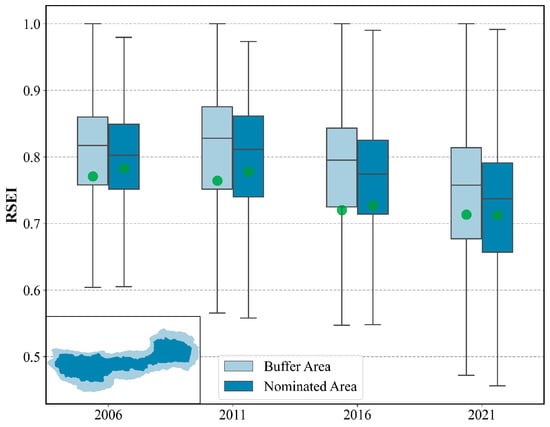
Figure 9.
RSEI boxplot of buffer zone and nominated area from 2006 to 2021.
Between 2006 and 2011, the ecological grade of the entire heritage site showed a decline, but it was only −0.4422%. Whether in the buffer zone, the nominated area or the entire heritage site, the percentage of the site with the same ecological level (0) was above 80% and remained stable. The EE grade increase percentage was 8.8524%, and the decrease was 9.2946%. The change in EE grade in the buffer zone was −1.2640% and in the nominated zone was 0.2170%. The EE quality in the whole heritage site area showed a decreasing trend (−23.1804%) between 2011 and 2016, and the EE grade decreased by 30.7336% and increased by 7.5532%. The EE changes were mainly concentrated in the grade change of −2, −1, 0 and 1, where the percentage of buffer areas, nominated areas and the overall EE with the same grade (0) were all around 60%, and the degree of EE changes fluctuated considerably compared to the period from 2006 to 2011.
The percentage of areas with reduced ecological quality within the nomination area (32.3912%) was higher than that of the buffer zone (28.6081%). Considering that there are no excessive human activities in the nominated area, natural influence is the most dominant factor causing EE changes in the region. During 2016–2021, the EE grade changes in the heritage sites were mainly concentrated in −1, 0, 1, 2 and 3, and the percentages of the buffer zone, nominated area and the whole heritage site with the EE grade remaining unchanged (grade 0) were greater than 60%. Compared with 2011–2016, the overall EE grade decreased by −14.6067%. The decreasing trend of EE quality was suppressed. The percentage of areas with decreasing EE quality in the nominated area (27.2205%) was still higher than that of the buffer area (24.7672%).
The percentages of change levels in the buffer zone and nominated area during 2006–2011 were 17.546% and 18.6158%, for 2011–2016 they were 35.7584% and 40.2503%, and for 2016–2021 they were 36.6721% and 38.4798%, respectively. From the results of the changes during the three periods, the degree of ecological changes influenced by nature was higher in the nominated area than in the buffer zone, mainly because many grasslands are distributed in the nominated area. They are subject to significant differences in light, heat, water, topography and other sensitive factors, and the growth condition of grasslands is influenced by nature to a greater extent. At the same time, many woodlands are distributed in the buffer zone, which is less influenced by nature than grasslands and is more stable in comparison.
From 2006 to 2021, the average EE quality in the nomination area was better than in the buffer zone. Nevertheless, by 2016, the gap between the average EE quality in the nomination area and buffer zone of the heritage site gradually narrowed until 2021 when the average EE quality was the same. In 2006, 2011, 2016 and 2021, 25–75% of the data distribution of ecological quality in the buffer site was better than that in the nominated site. The EE quality of most areas in the buffer zone was much better than that of the nominated area. However, the average ecological quality of the buffer zone was lower than that of the nominated area, mainly due to the existence of a long-term poor EE in the buffer zone (Figure 5b). A large amount of glacial snow exists in the southern area of the buffer zone, and the EE is poor near the area. However, with the global warming and melting of glacial snow in recent years, against the background of a slight decrease in the EE quality of the entire heritage site, natural ecological restoration has occurred near the area. It resulted in the average EE quality in the buffer zone gradually approaching that of the nominated area. In addition, there is influence from human activity interventions such as those by local governments in the EE restoration work and projects are vigorously carried out in the buffer zone, effectively improving the range of EE quality in the buffer zone.
3.4. Relation between the Land Cover Change and RSEI Change
There is a high correlation between land cover change patterns and EE quality changes. In order to further explore the coupling relationship between land cover change and EE quality changes, based on the image meta-level, combining the spatial change relationships between land use change types in 2006–2011, 2011–2016 and 2016–2021 and the changes in RSEI levels between 2006–2011, 2011–2016 and 2016–2021, the EE quality change level caused by each land cover change type was unearthed.
The results of the EE change caused by land cover change from 2006 to 2011 are shown in Figure 10. In the statistics on the relationship between land use type change and ecological environment quality change from 2006 to 2011, NaN means there are no such observations. Taking the land use as barren in 2006 and as barren in 2011 as an example, we can see the shift area of the ecological class change caused by the barren–barren shift approach in the bar chart. At the same time, we can also see the area proportion of ecological environment improvement or deterioration caused by the change in land use mode in the pie chart (bottom left corner of the figure). The EE quality change levels with the same land cover types are not necessarily the same; for most of the same land cover change types, 80–90% of the EE quality remains the same. Significant differences exist in EE quality in areas with the same snow and ice cover in different years; only 57.5% are unchanged. It indicates a sizeable EE uncertainty in the same snow and ice-covered areas. This uncertainty is mainly due to the variances in climate, soil states and snow and ice cover thickness in different years, leading to considerable differences in regional temperature, humidity and other conditions, causing EE differences. The vast majority of land use change types of snow/ice–snow/ice changed grade between −1 and 1, which indicates that the EE of the year-long snow-and-ice-covered area did not change drastically. Among the EE changes caused by forest–forest land use type change, 77.4% of the EE quality remained unchanged, about 17.5% of the forest ecological quality improved compared to the previous one and 5% of the forest EE quality showed a decrease. For grassland–forest land use type change, all the EE changes were maintained at −1~1. The image element change shows that 90.6% of the EE grade was maintained during grassland transformation into the forest. This is because in the early process of grassland transformation into the forest, the tree growth is in the juvenile stage, which does not cause a sudden change in EE quality. When the grassland is covered by snow and ice, 31.6% of the pixel changes were worse, so the method of land change of grassland–snow/ice cover type explicitly caused the degradation of regional EE quality. Combined with the analysis of snow/ice–grassland land use type change, it can be seen that the EE quality of 20.3% of the areas in the study site covered by snow and ice for a long time was still in a poor state, even after the melting of snow and ice and the growth of grassland. In the process of grassland–barren change, 81% of the changes did not cause drastic ecological changes because this part of grassland has a poor ecological background, and the possibility of changing to the bare ground at an early stage is extremely high. During the grassland–grassland change, about 88% of the percentage of the EE quality did not change, 6.5% of the meadow decreased compared to the EE quality five years ago and 5.5% of the meadow increased. When bare ground was covered with snow and ice, 35.8% of bare ground to the area of ice change showed a trend of decreasing EE quality, but the vast majority of changes were only slight (−1 grade).
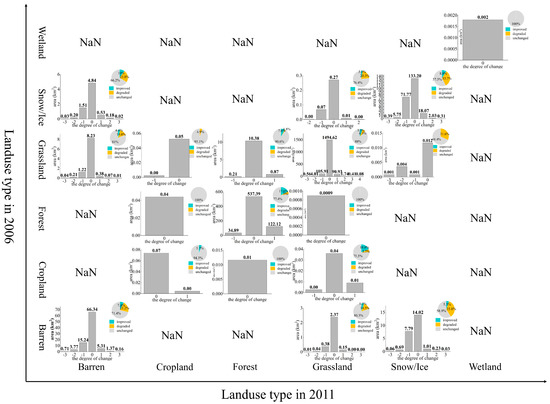
Figure 10.
Statistics on the relationship between land use type change and ecological environment quality change from 2006 to 2011. NaN means there are no such observations. Taking the land use as barren in 2006 and as barren in 2011 as an example, we can see the shift area of the ecological class change caused by the barren–barren shift approach in the bar chart. At the same time, we can see the area proportion of ecological environment improvement or deterioration caused by the change in land use mode in the pie chart (bottom left corner of the figure).
During 2011–2016 (Figure 11), the EE quality change grades with the same land cover type changed more drastically and did not have the invariant characteristics of 2006–2011, among which about 39.2% of the changes that occurred in the EE of barren–barren became better and ecological restoration occurred. However, most of the changes in better grades were concentrated in grade 1. In total, 33.6% of the changes led to worse ecological quality, and the proportion of −2 to −3 grades among the worse grades was more than 50%, indicating that the EE quality of this part of the bare land tended toward severe EE decline. It is necessary to focus on these areas. In the process of the land cover type change of forest–forest, 42.7% of the changes accounted for a slight deterioration trend (−1 grade), indicating that the forest was affected by natural factors in this period with a minor degree of EE quality fluctuation. There may be a situation of forest tree quality decline. The process of the land use type transformation of grassland–grassland remained highly stable, with fundamental changes between grades −1, 0 and 1, and no extensive regional EE change conditions occurred. Compared with 2006–2011, the same snow-and-ice-covered areas showed a tremendous EE change. A total of 60.2% of the changes in the EE quality began to decline. Considering the long years that snow-and-ice-covered areas continued to be covered by snow and ice, the EE quality decline intensified. Grassland decreased in ecological quality in the process of transformation to bare land, removing the influence of weak changes (−1, 0, 1 grade). The main cause of the slight ecological deterioration in the land use transition from grassland to the forest was that the EE quality of trees was not better than that of grassland in the early years. When the bare land was covered by snow and ice, the overall EE showed a decreasing trend, and 66.4% of the change accounted for a decrease in EE quality. Temperature was an essential factor in the quality of the regional EE. After the snow or ice cover, the regional temperature decreased, seriously affecting the EE []. Considering that the area of EE quality changes caused by the remaining land use types changes was tiny, it is not analyzed here.
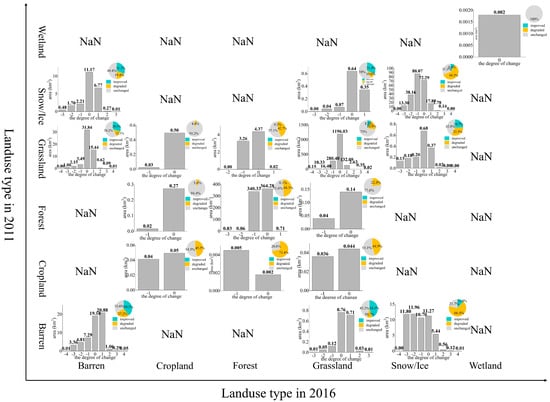
Figure 11.
Statistics on the relationship between land use type change and ecological environment quality change from 2011 to 2016. NaN means there are no such observations. Taking the land use as barren in 2011 and as barren in 2016 as an example, we can see the shift area of the ecological class change caused by the barren–barren shift approach in the bar chart. At the same time, we can see the area proportion of ecological environment improvement or deterioration caused by the change in land use mode in the pie chart (bottom left corner of the figure).
During 2016–2021 (Figure 12), among the types of land use that did not change, grassland and barren showed more extreme situations, where 67.3% of the areas in barren deteriorated in EE from 2016 to 2021, but to a lesser extent. In total, 34.2% of the grassland areas also showed a trend of ecological deterioration, so we should give the EE of grassland in the Kalajun–Kuerdening World Natural Heritage Area special attention in recent years. In the study area, the EE remained stable in the forest and grassland change patterns, except for minor changes, which indicates that the forest had a strong ability to maintain its EE, and no significant ecological changes occurred within the forest. The changing pattern of grassland to barren and forest was similar to that of 2006–2011 and 2011–2016. Ice and snow cover was also an important EE influencing factor in this period, mainly in the conversion between snow/ice and barren and grassland, which showed a sizeable EE change condition.
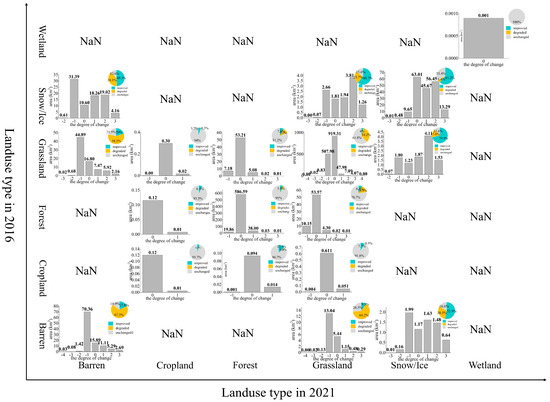
Figure 12.
Statistics on the relationship between land use type change and ecological environment quality change from 2016 to 2021. NaN means there are no such observations. Taking the land use as barren in 2016 and as barren in 2021 as an example, we can see the shift area of the ecological class change caused by the barren–barren shift approach in the bar chart. At the same time, we can see the area proportion of ecological environment improvement or deterioration caused by the change in land use mode in the pie chart (bottom left corner of the figure).
There is a strong correlation between land cover types and EE levels, and changes in land cover types were highly likely to cause changes in the EE. Combining the analysis of land use changes and changes in EE indices in 2006–2011 2011–2016 and 2016–2021, it is clear that after removing the effects of slight change levels (−1 and 1 grade) and unchanged levels (0 grade), the land use types that mainly caused EE elevation were barren-grassland, snow/ice–barren and barren–snow/ice. The change in snow, ice, and bare land in the study site was a fundamental cause of the remarkably induced EE change. The partial interconversion between them could, however, have caused the improvement in EE quality, considering that human activities had less influence in the study area and the degree of land cover type transformation was slight for a long time. Hence, the natural transformation range of snow and ice and bare land under the influence of natural factors is relatively more extensive. It is also effortless to trigger the EE change. The EE quality of the bare land improved during the transformation to grassland, which also provides valuable guidance for the subsequent ecological protection and restoration in the WNHSs.
The land use type shifts that caused a decrease in ecological quality were grassland–barren and barren–snow/ice. During the land use transition from grassland to snow and ice, there was a clear trend of EE quality decrease, which is in line with the traditional conceptual perception. When the bare land is covered by snow and ice, the temperature drops, which is unsuitable for the survival of surrounding plants and animals, and the EE quality decreases. Hence, the long-term snow and ice cover is not conducive to developing the regional EE.
4. Discussion
The ecosystem is a complex and huge system; as well as dryness, heat, humidity and greenness in this method, many factors affect its environmental quality. In the future, when the natural factors are not controllable, the EE quality assessment can be improved by adding relevant human factors to reflect in a more considerable way the EE differences between the World Natural Heritage buffer sites and the nominated sites [].
Based on the previous scholars’ studies on the ecological differences between different land uses [], we further analyze the relationship between land use and the ecological environment in terms of changes. This study uses the overlay analysis of land use pattern changes and EE quality changes for three periods, 2006–2011 2011–2016 and 2016–2021. There are uncertainties in the changes in EE quality caused by land use transformation. Future research should also study the common patterns between land use patterns and EE transformation by combining the characteristics of multi-period transformation.
The algorithm used in RSEI is mainly principal component analysis, which, in matrix theory, uses the first principal component with the highest information content as the representative data by transforming the variables of each dimension into a base system. In the actual research process, considering the problem of spatial heterogeneity, the EE quality in different study sites is significantly different due to the influence of light and heat and other conditions. Although the algorithm is relatively objective, the scientific nature is lacking, and it is entirely data-driven, without scientific experiments to verify the actual EE quality and the weighting relationships between each dimensional variable. In practice, this is also difficult to verify. When we study the relationship between ecology and other factors, it is difficult to give precise verification if the study is not carried out on a smaller scale. However, among the current ecological, and environmental research methods, this method is the better choice among all factors combined. Based on this, various new ecological methods and indices suitable for particular regions have been derived [,,,]. The practical application is also highly instructive.
5. Conclusions
The EE of the WNHSs is an essential issue of common concern for all humanity. Based on the latest research methods on EE quality, this paper analyzes the spatiotemporal distribution of the EE and the characteristics of change distribution in the WNHS of Kalajun–Kuerdening from 2006 to 2021 using the EE index (RSEI). The spatiotemporal differences in EE quality in the nominated and buffer zones in this heritage site were also studied. The coupling relationship between land cover changes and EE quality changes in the study area was explored.
The conclusions are as follows: (1) From 2016, the EE quality in the Kalajun–Kuerdening study site showed a significant decreasing trend but maintained a more stable state with a minor fluctuation. The areas with better EE grades in the heritage site are located in the northwest area (Kalajun) and northeast area (Kuerdening) of the study site. The main cause is that these areas have many Schrenk spruces, dense vegetation and a beautiful EE. The spatial distribution of the medium-grade EE is located in the central area of the study area, the nominated heritage site area, where many alpine meadows are distributed. (2) The change in EE quality level in the study area shows the trend of neighboring level change, i.e., the change (increase or decrease) in EE level within the heritage site mainly proceeds to neighboring levels without the characteristic of a large number of leap changes. Indirectly, it indicates that the EE within the Kalajun–Kuerdening WNHS changes to a lesser extent under the influence of natural laws, and the EE is more resilient. (3) By superimposing the EE changes in 2006, 2011, 2016 and 2021, we analyzed the spatial change distribution pattern and found that: from 2006 to 2011, the percentage of the EE improvement area in the heritage site was 8.8523%, mainly distributed in the north and northeast of the heritage site (Kuerdening), and the percentage of the EE quality decline area was 9.2954%, located in the southwest area of the heritage site and the central scattered area; the study site is in ecological change equilibrium. The main areas of EE quality decline in 2011–2016 were the glacier-and-snow-covered areas in the study area, and the degree of EE changes was noticeable. In 2016–2021 the area of ecological improvement areas increased significantly. The majority of the declining EE quality showed a slight decline, which was distributed in the central grassland area of the heritage site, and the decline in EE quality in the study area was curbed. The EE showed a trend of gradual recovery. (4) Studying the spatiotemporal differences in EE quality between the buffer areas and nominated sites within the heritage site, the results show that there were significant spatial differences in EE conditions between the buffer areas and nominated sites in the Kalajun–Kuerdening WNHS between 2006 and 2021. The average EE quality within the nominated areas of the heritage site was better than that of the buffer areas, but by 2016, the difference in the average EE quality between the buffer areas and the nominated sites gradually decreased until 2021 when the average EE quality was basically the same. The EE quality in most areas within the buffer areas was much better compared to the nominated sites during 2006, 2011, 2016 and 2021, but the average ecological quality in the buffer areas was consistently lower than that of the nominated sites. (5) By studying the correlation between land cover change and EE quality in the heritage site, it was found that the land use types that mainly caused EE enhancement in the heritage site were barren–grassland, snow/ice–barren and barren–snow/ice. The land cover types that caused the decrease in EE quality were grassland–barren and barren–snow/ice. The change in snow and ice cover is an essential factor in the shift of the EE of the Kalajun–Kuerdening World Natural Heritage Site.
Author Contributions
Methodology and writing—original draft preparation, B.H.; data curation, Y.L. and J.H.; review and editing, F.H.; visualization, Q.R. All authors have read and agreed to the published version of the manuscript.
Funding
This research was funded by the National Natural Science Foundation of China, grant number 41971192 and by the Second Tibetan Plateau Scientific Expedition and Research Program, grant number 2019QZKK0401.
Data Availability Statement
All data are publicly available datasets and information can be obtained from Section 2.3 of the paper.
Conflicts of Interest
The authors declare no conflict of interest.
References
- UNESCO. Operational Guidelines for the Implementation of the World Heritage Convention; UNESCO: Paris, France, 2008. [Google Scholar]
- Satake, K.; Inoue, T.; Kasasaku, K.; Nagafuchi, O.; Nakano, T. Monitoring of nitrogen compounds on Yakushima Island, a world natural heritage site. Environ. Pollut. 1998, 102, 107–113. [Google Scholar] [CrossRef]
- Assunção, F.O.; Cravotto, A.; Testoni, H.; Testoni, J. World Heritage; Montevideo: Testoni Studios Ediciones; Ediciones UNESCO: Paris, France, 1996. [Google Scholar]
- Wang, S.-X.; Lu, W.-M.; Hung, S.-W. You gain when you give: Constructing a sustainable development model for world heritage sites. J. Clean Prod. 2021, 328, 129547. [Google Scholar] [CrossRef]
- Osipova, E.; Emslie-Smith, M.; Osti, M.; Murai, M.; Åberg, U.; Shadie, P. IUCN World Heritage Outlook 3; IUCN: Gland, Switzerland, 2020. [Google Scholar]
- Zhou, N.X.; Lin, Z.S.; Huang, Z.F.; Pan, G. Threats on the World Heritage Natural Sites and China’s Conservation Countermeasures. J. Nat. Resour. 2008, 23, 25–32. [Google Scholar]
- Chen, Y.; Liu, C.; Yang, R.; Wang, X. Global-scale risk assessment of sudden geological disasters in world natural heritage sites. J. Nat. Disasters 2020, 29, 87–96. [Google Scholar]
- Kolanuvada, S.R.; Ponpandian, K.L.; Sankar, S. Multi-criteria-based approach for optimal siting of artificial recharge structures through hydrological modeling. Arab. J. Geosci. 2019, 12, 190. [Google Scholar] [CrossRef]
- Liu, J.; Wang, J.; Wang, S.; Wang, J.; Deng, G. Analysis and simulation of the spatiotemporal evolution pattern of tourism lands at the Natural World Heritage Site Jiuzhaigou, China. Habitat Int. 2018, 79, 74–88. [Google Scholar] [CrossRef]
- Chen, P.; Xiong, K.; Xiao, S. Global comparative analysis on the world natural heritage values of Libo cone karst in China. Geogr. Res. 2013, 32, 1517–1527. [Google Scholar]
- Won-Sok, J.; Do-Zun, R.; Ho-Yong, R. Natural Heritage Value of Mt. Kumgang and Global Comparative Analysis. Geoheritage 2020, 12, 32. [Google Scholar]
- Shi, H.; Shi, T.; Han, F.; Liu, Q.; Wang, Z.; Zhao, H. Conservation Value of World Natural Heritage Sites’ Outstanding Universal Value via Multiple Techniques—Bogda, Xinjiang Tianshan. Sustainability 2019, 11, 5953. [Google Scholar] [CrossRef]
- Zhang, C. Ecotourism based on natural World Heritage sites: The role and place of communities. Tour. Trib. 2021, 36, 7–8. [Google Scholar]
- Han, X.; Hu, J.; Liu, C.; Wang, X. Mountain landscape health diagnosis and pattern evolution based on remote sensing: Case study in Xinjiang Tianshan Karajun-Kurdening. Acta Ecol. Sin. 2021, 41, 6451–6465. [Google Scholar]
- Ma, J. Biodiversity Protection Strategy Under the Background of Ecological Environment Threshold and the Tourism Carrying Capacity—According to the Core of the World Natural Heritage Wulingyuan Scenic Area as an Example. Econ. Geogr. 2016, 36, 195–202. [Google Scholar]
- Liu, Q.; Yang, Z.; Han, F.; Shi, H.; Wang, Z.; Chen, X. Ecological Environment Assessment in World Natural Heritage Site Based on Remote-Sensing Data. A Case Study from the Bayinbuluke. Sustainability 2019, 11, 6385. [Google Scholar] [CrossRef]
- Wang, Z.; Yang, Z.; Shi, H.; Han, F.; Liu, Q.; Qi, J.; Lu, Y. Ecosystem Health Assessment of World Natural Heritage Sites Based on Remote Sensing and Field Sampling Verification: Bayanbulak as Case Study. Sustainability 2020, 12, 2610. [Google Scholar] [CrossRef]
- Du, X.; Wang, Z. Optimizing monitoring locations using a combination of GIS and fuzzy multi criteria decision analysis, a case study from the Tomur World Natural Heritage site. J. Nat. Conserv. 2018, 43, 67–74. [Google Scholar] [CrossRef]
- UNESCO; ICCROM; ICOMOS; IUCN. Managing Disaster Risks for World Heritage; UNESCO: Paris, France, 2010. [Google Scholar]
- Haasnoot, M.; van’t Klooster, S.; Van Alphen, J. Designing a monitoring system to detect signals to adapt to uncertain climate change. Glob. Environ. Chang.-Human Policy Dimens. 2018, 52, 273–285. [Google Scholar] [CrossRef]
- Zheng, Z.; Wu, Z.; Chen, Y.; Guo, C.; Marinello, F. Instability of remote sensing based ecological index (RSEI) and its improvement for time series analysis. Sci. Total Environ. 2022, 814, 152595. [Google Scholar] [CrossRef]
- Wu, H.; Guo, B.; Fan, J.; Yang, F.; Han, B.; Wei, C.; Lu, Y.; Zang, W.; Zhen, X.; Meng, C. A novel remote sensing ecological vulnerability index on large scale: A case study of the China-Pakistan Economic Corridor region. Ecol. Indic. 2021, 129, 107955. [Google Scholar] [CrossRef]
- Yang, Z.; Zhang, X.; Xu, X.; Han, F.; Zhang, Y.; Yang, W.; Yan, S.; Hai, Y.; Yin, L.; Zhao, X. World Natural Heritage of Xinjiang Tianshan; Science Press: Beijing, China, 2017. [Google Scholar]
- Costanza, R.; dArge, R.; deGroot, R.; Farber, S.; Grasso, M.; Hannon, B.; Limburg, K.; Naeem, S.; ONeill, R.V.; Paruelo, J.; et al. The value of the world’s ecosystem services and natural capital. Nature 1997, 387, 253–260. [Google Scholar] [CrossRef]
- An, M.; Xie, P.; He, W.; Wang, B.; Huang, J.; Khanal, R. Spatiotemporal change of ecologic environment quality and human interaction factors in three gorges ecologic economic corridor, based on RSEI. Ecol. Indic. 2022, 141, 109090. [Google Scholar] [CrossRef]
- Han, L.; Wang, Z.; Wei, M.; Wang, M.; Shi, H.; Ruckstuhl, K.; Yang, W.; Alves, J. Small patches play a critical role in the connectivity of the Western Tianshan landscape, Xinjiang, China. Ecol. Indic. 2022, 144, 109542. [Google Scholar] [CrossRef]
- Shan, W.; Jin, X.; Ren, J.; Wang, Y.; Xu, Z.; Fan, Y.; Gu, Z.; Hong, C.; Lin, J.; Zhou, Y. Ecological environment quality assessment based on remote sensing data for land consolidation. J. Clean. Prod. 2019, 239, 118126. [Google Scholar] [CrossRef]
- Rasoolimanesh, S.M.; Jaafar, M.; Ahmad, A.G.; Barghi, R. Community participation in World Heritage Site conservation and tourism development. Tour. Manag. 2017, 58, 142–153. [Google Scholar] [CrossRef]
- Jiang, Y.; Liu, S.; Liu, M.; Peng, X.; Liao, X.; Wang, Z.; Gao, H. A systematic framework for continuous monitoring of land use and vegetation dynamics in multiple heterogeneous mine sites. Remote Sens. Ecol. Conserv. 2022, 8, 793–807. [Google Scholar] [CrossRef]
- Zhang, R.; Yuan, Y.; Gou, X.; Zhang, T.; Zou, C.; Ji, C.; Fan, Z.; Qin, L.; Shang, H.; Li, X. Intra-annual radial growth of Schrenk spruce (Picea schrenkiana Fisch. et Mey) and its response to climate on the northern slopes of the Tianshan Mountains. Dendrochronologia 2016, 40, 36–42. [Google Scholar] [CrossRef]
- Yang, J.; Huang, X. 30 m annual land cover and its dynamics in China from 1990 to 2019. Earth Syst. Sci. Data Discuss. 2021, 2021, 1–29. [Google Scholar]
- Wang, Z.; Chen, T.; Zhu, D.; Jia, K.; Plaza, A. RSEIFE: A new remote sensing ecological index for simulating the land surface eco-environment. J. Environ. Manag. 2023, 326, 116851. [Google Scholar] [CrossRef] [PubMed]
- Zhu, D.; Chen, T.; Wang, Z.; Niu, R. Detecting ecological spatial-temporal changes by Remote Sensing Ecological Index with local adaptability. J. Environ. Manag. 2021, 299, 113655. [Google Scholar] [CrossRef]
- Xiong, Y. Assessment of spatial–temporal changes of ecological environment quality based on RSEI and GEE: A case study in Erhai Lake Basin, Yunnan province, China. Ecol. Indic. 2021, 125, 107518. [Google Scholar] [CrossRef]
- Xu, H. A remote sensing index for assessment of regional ecological changes. China Environmental Science 2013, 33, 889–897. [Google Scholar]
- Xu, H.; Li, C.; Shi, T. Is the z-score standardized RSEI suitable for time-series ecological change detection? Comment on Zheng et al. (2022). Sci. Total Environ. 2022, 853, 158582. [Google Scholar] [CrossRef] [PubMed]
- Xu, H.; Wang, Y.; Guan, H.; Shi, T.; Hu, X. Detecting Ecological Changes with a Remote Sensing Based Ecological Index (RSEI) Produced Time Series and Change Vector Analysis. Remote Sens. 2019, 11, 2345. [Google Scholar] [CrossRef]
- Xu, D.; Yang, F.; Yu, L.; Zhou, Y.; Li, H.; Ma, J.; Huang, J.; Wei, J.; Xu, Y.; Zhang, C.; et al. Quantization of the coupling mechanism between eco-environmental quality and urbanization from multisource remote sensing data. J. Clean. Prod. 2021, 321, 128948. [Google Scholar] [CrossRef]
- Zheng, Z.; Wu, Z.; Chen, Y.; Yang, Z.; Marinello, F. Exploration of eco-environment and urbanization changes in coastal zones: A case study in China over the past 20 years. Ecol. Indic. 2020, 119, 106847. [Google Scholar] [CrossRef]
- Boori, M.S.; Choudhary, K.; Paringer, R.; Kupriyanov, A. Spatiotemporal ecological vulnerability analysis with statistical correlation based on satellite remote sensing in Samara, Russia. J. Environ. Manag. 2021, 285, 112138. [Google Scholar] [CrossRef] [PubMed]
- Ariken, M.; Zhang, F.; Liu, K.; Fang, C.; Kung, H.-T. Coupling coordination analysis of urbanization and eco-environment in Yanqi Basin based on multi-source remote sensing data. Ecol. Indic. 2020, 114, 106331. [Google Scholar] [CrossRef]
- Wu, Q.; Wang, X.Y.; Luo, L. Ecological Environment Assessment of Huangshan World Heritage Site Based on Remote-Sensing Ecological Index. Bull. Soil Water Conserv. 2020, 40, 142–146. [Google Scholar]
- Hu, Y.; Yang, R.; Shao, Y.; Chen, G. CRC and NHPWM method for test bench based on cascaded converter. IET Power Electron. 2019, 12, 11–21. [Google Scholar] [CrossRef]
- Tucker, C.J.; Fung, I.Y.; Keeling, C.D.; Gammon, R.H. Relationship between atmospheric CO2 variations and a satellite-derived vegetation index. Nature 1986, 319, 195–199. [Google Scholar] [CrossRef]
- Hu, X.; Xu, H. A new remote sensing index for assessing the spatial heterogeneity in urban ecological quality: A case from Fuzhou City, China. Ecol. Indic. 2018, 89, 11–21. [Google Scholar] [CrossRef]
- Estoque, R.C.; Murayama, Y.; Myint, S.W. Effects of landscape composition and pattern on land surface temperature: An urban heat island study in the megacities of Southeast Asia. Sci. Total Environ. 2017, 577, 349–359. [Google Scholar] [CrossRef] [PubMed]
- Xu, H. A remote sensing urban ecological index and its application. Acta Ecol. Sin. 2013, 33, 7853–7862. [Google Scholar]
- Yang, X.; Meng, F.; Fu, P.; Wang, Y.; Liu, Y. Time-frequency optimization of RSEI: A case study of Yangtze River Basin. Ecol. Indic. 2022, 141, 109080. [Google Scholar] [CrossRef]
- Firozjaei, M.K.; Kiavarz, M.; Homaee, M.; Arsanjani, J.J.; Alavipanah, S.K. A novel method to quantify urban surface ecological poorness zone: A case study of several European cities. Sci. Total Environ. 2021, 757, 143755. [Google Scholar] [CrossRef]
- Wang, J.; Ding, Y.; Wang, S.; Watson, A.E.; He, H.; Ye, H.; Ouyang, X.; Li, Y. Pixel-scale historical-baseline-based ecological quality: Measuring impacts from climate change and human activities from 2000 to 2018 in China. J. Environ. Manag. 2022, 313, 114944. [Google Scholar] [CrossRef]
- Cao, J.; Wu, E.; Wu, S.; Fan, R.; Xu, L.; Ning, K.; Li, Y.; Lu, R.; Xu, X.; Zhang, J. Spatiotemporal Dynamics of Ecological Condition in Qinghai-Tibet Plateau Based on Remotely Sensed Ecological Index. Remote. Sens. 2022, 14, 4234. [Google Scholar] [CrossRef]
- Chen, A.; Yang, X.; Guo, J.; Xing, X.; Yang, D.; Xu, B. Synthesized remote sensing-based desertification index reveals ecological restoration and its driving forces in the northern sand-prevention belt of China. Ecol. Indic. 2021, 131, 108230. [Google Scholar] [CrossRef]
Disclaimer/Publisher’s Note: The statements, opinions and data contained in all publications are solely those of the individual author(s) and contributor(s) and not of MDPI and/or the editor(s). MDPI and/or the editor(s) disclaim responsibility for any injury to people or property resulting from any ideas, methods, instructions or products referred to in the content. |
© 2023 by the authors. Licensee MDPI, Basel, Switzerland. This article is an open access article distributed under the terms and conditions of the Creative Commons Attribution (CC BY) license (https://creativecommons.org/licenses/by/4.0/).