
Lightweight Landslide Detection Network for Emergency Scenarios

Abstract
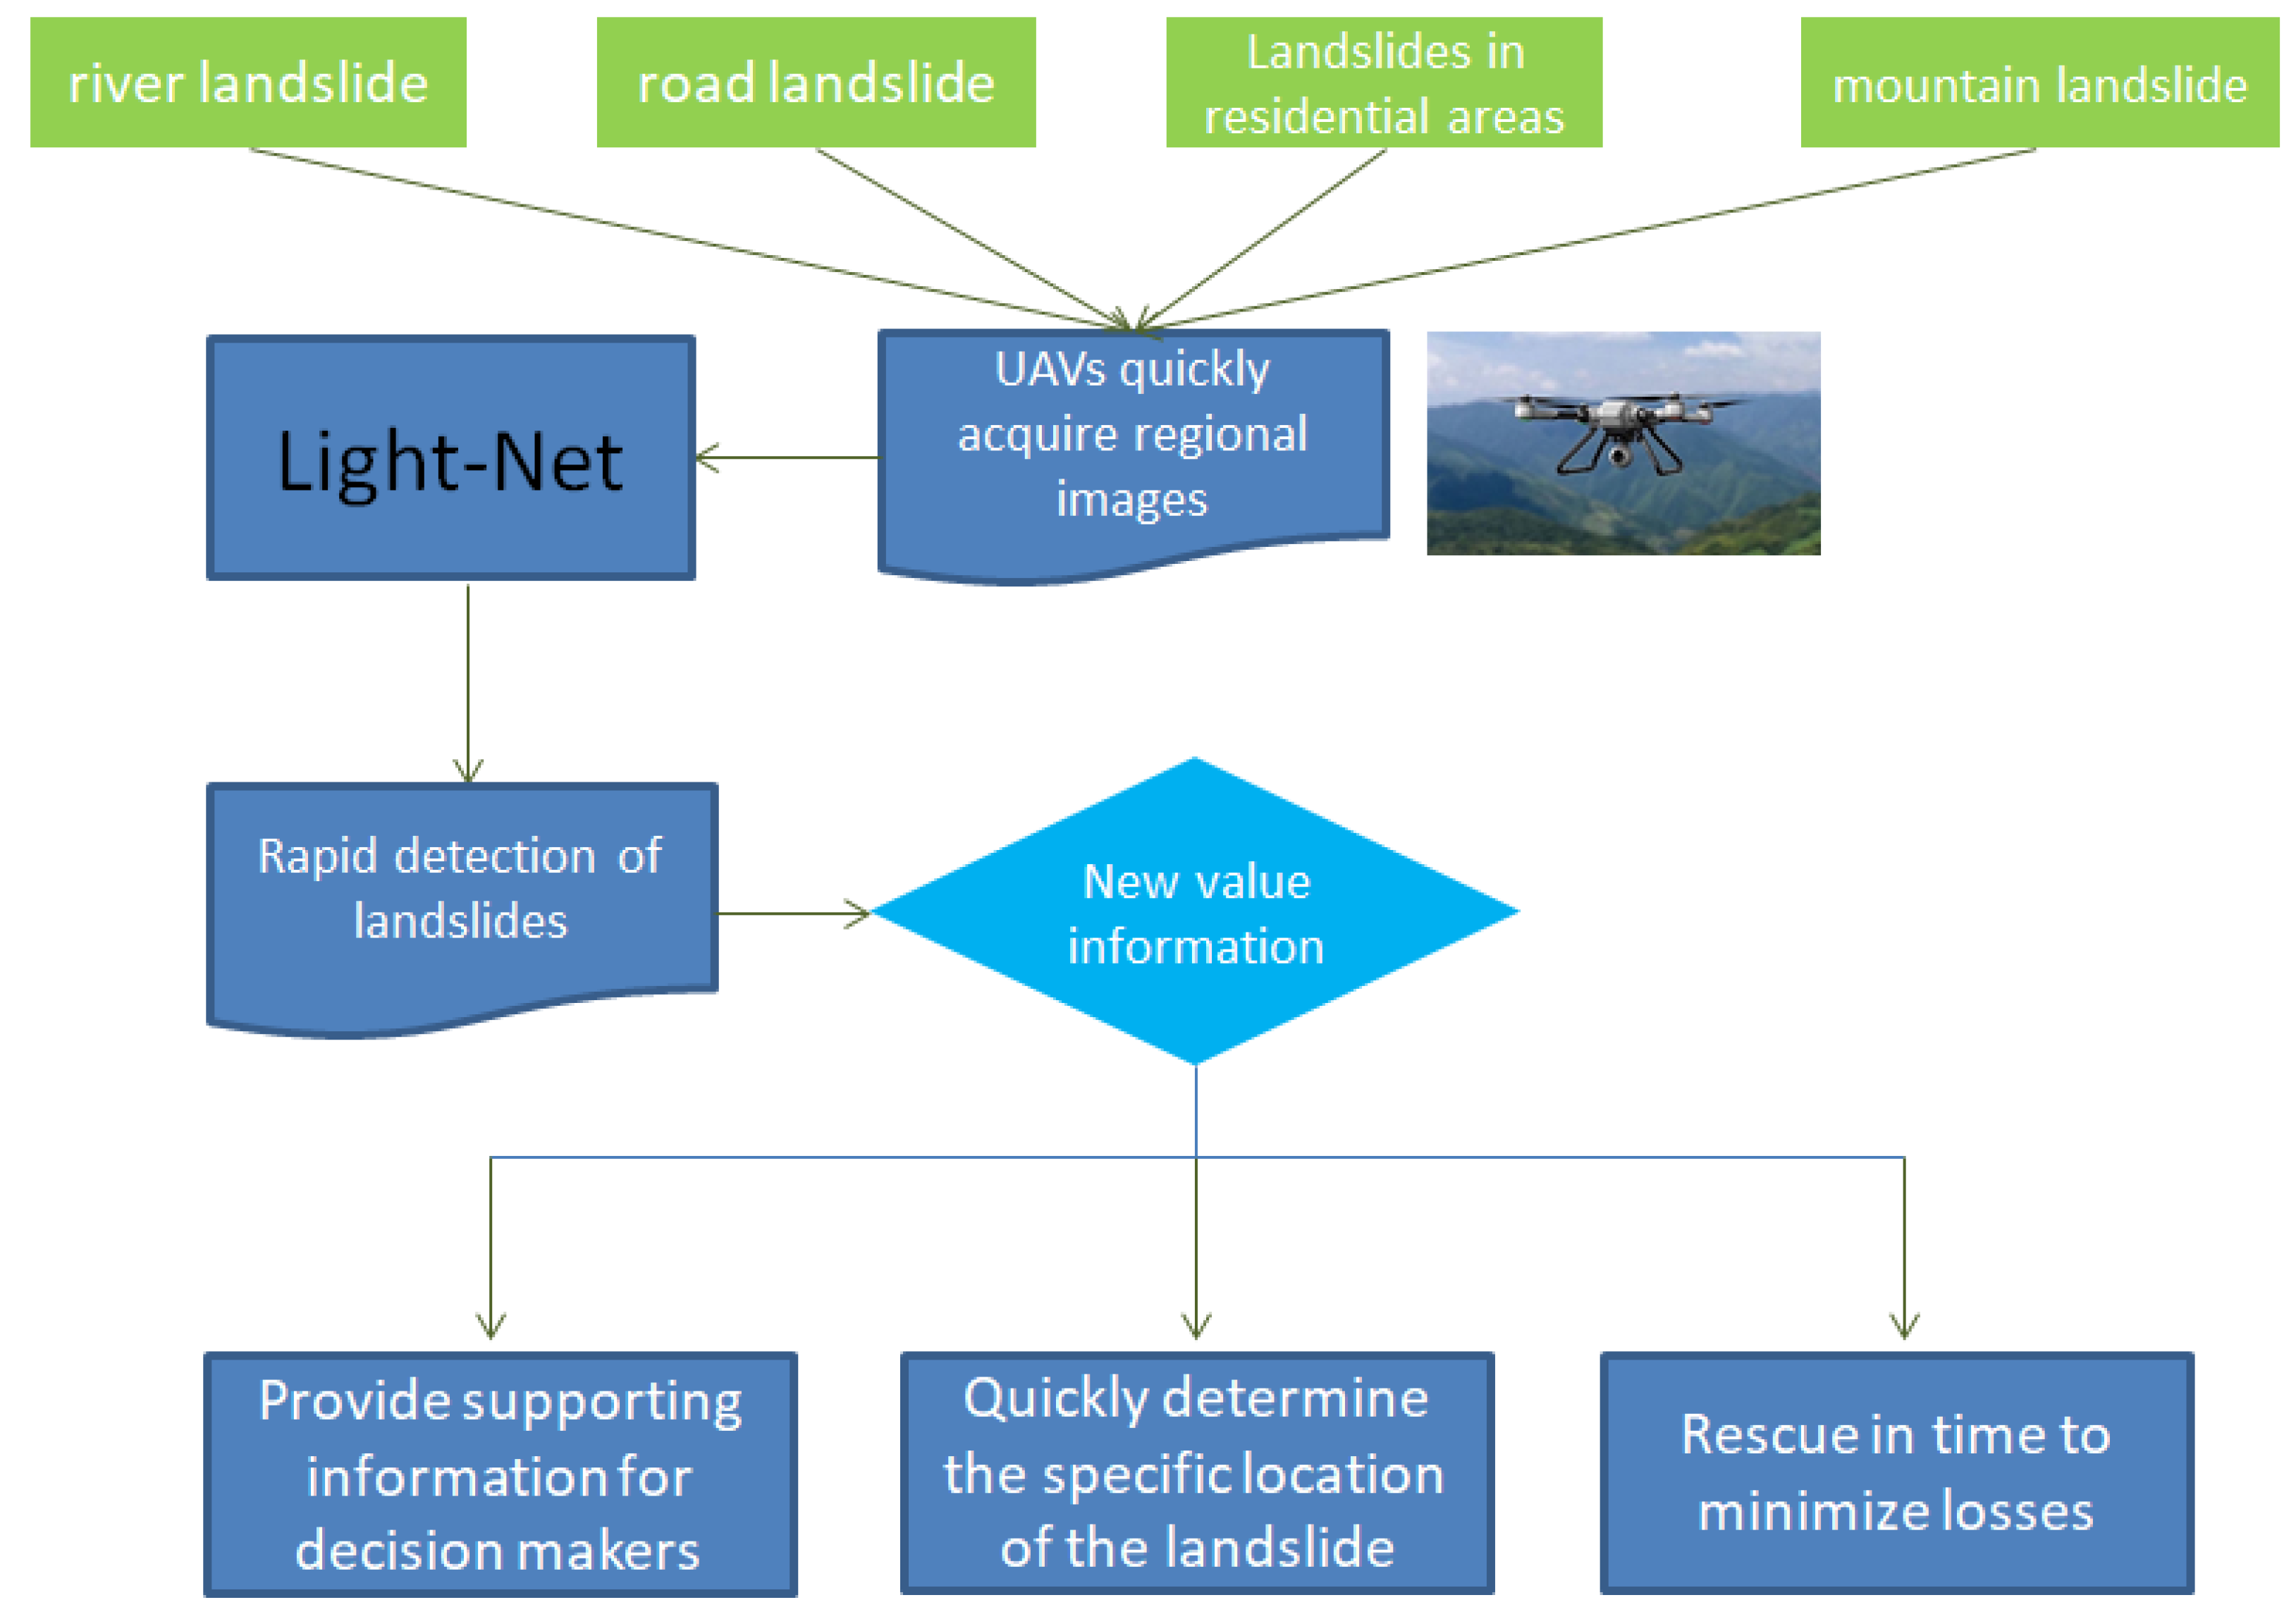
1. Introduction
- (1)
- The feature extraction ability of traditional landslide detection networks is often improved by increasing the depth of the model. However, while improving the accuracy of detection, this will also increase the number of model parameters. Large deep neural networks are limited by their operating memory footprint, making it difficult to apply in emergency response scenarios.
- (2)
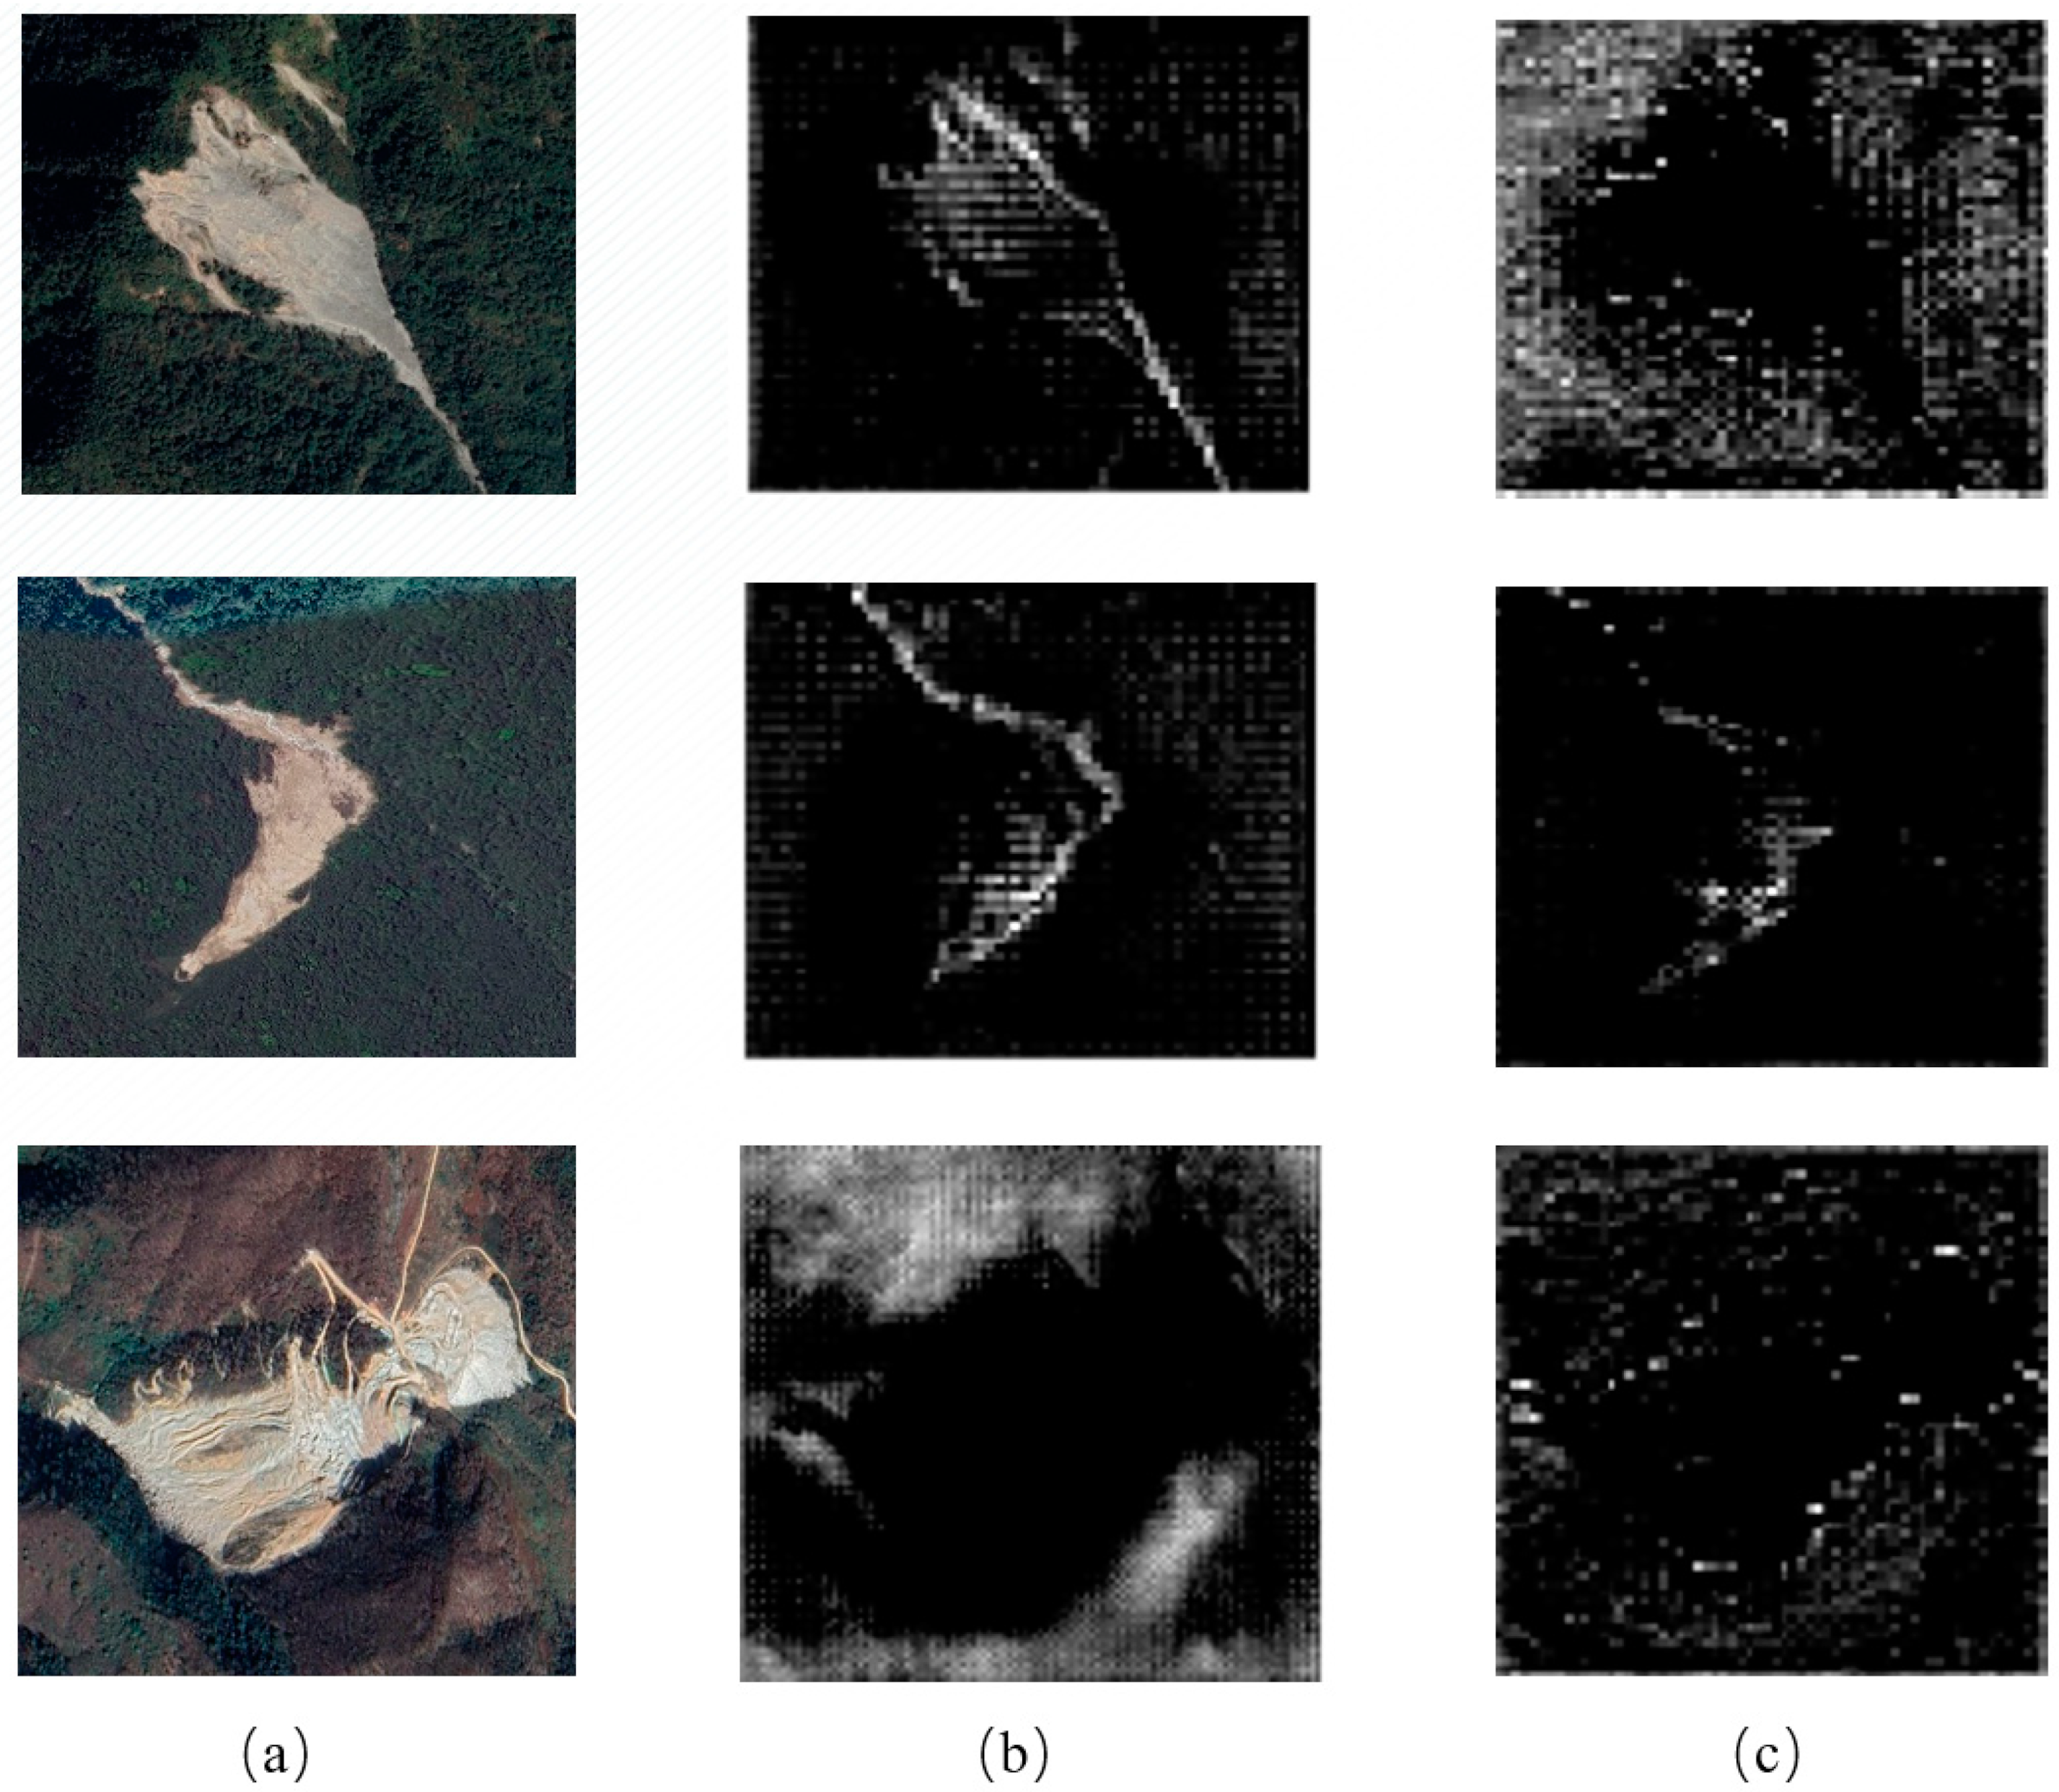
- Lightweight landslide detection models have a reduced accuracy because the network depth and the number of parameters are both reduced. Figure 1 shows the error detection results for a lightweight network, which includes missing detection (Figure 1a), false detection (Figure 1b), failure to detect (Figure 1c), and a detection range that is too small (Figure 1d).
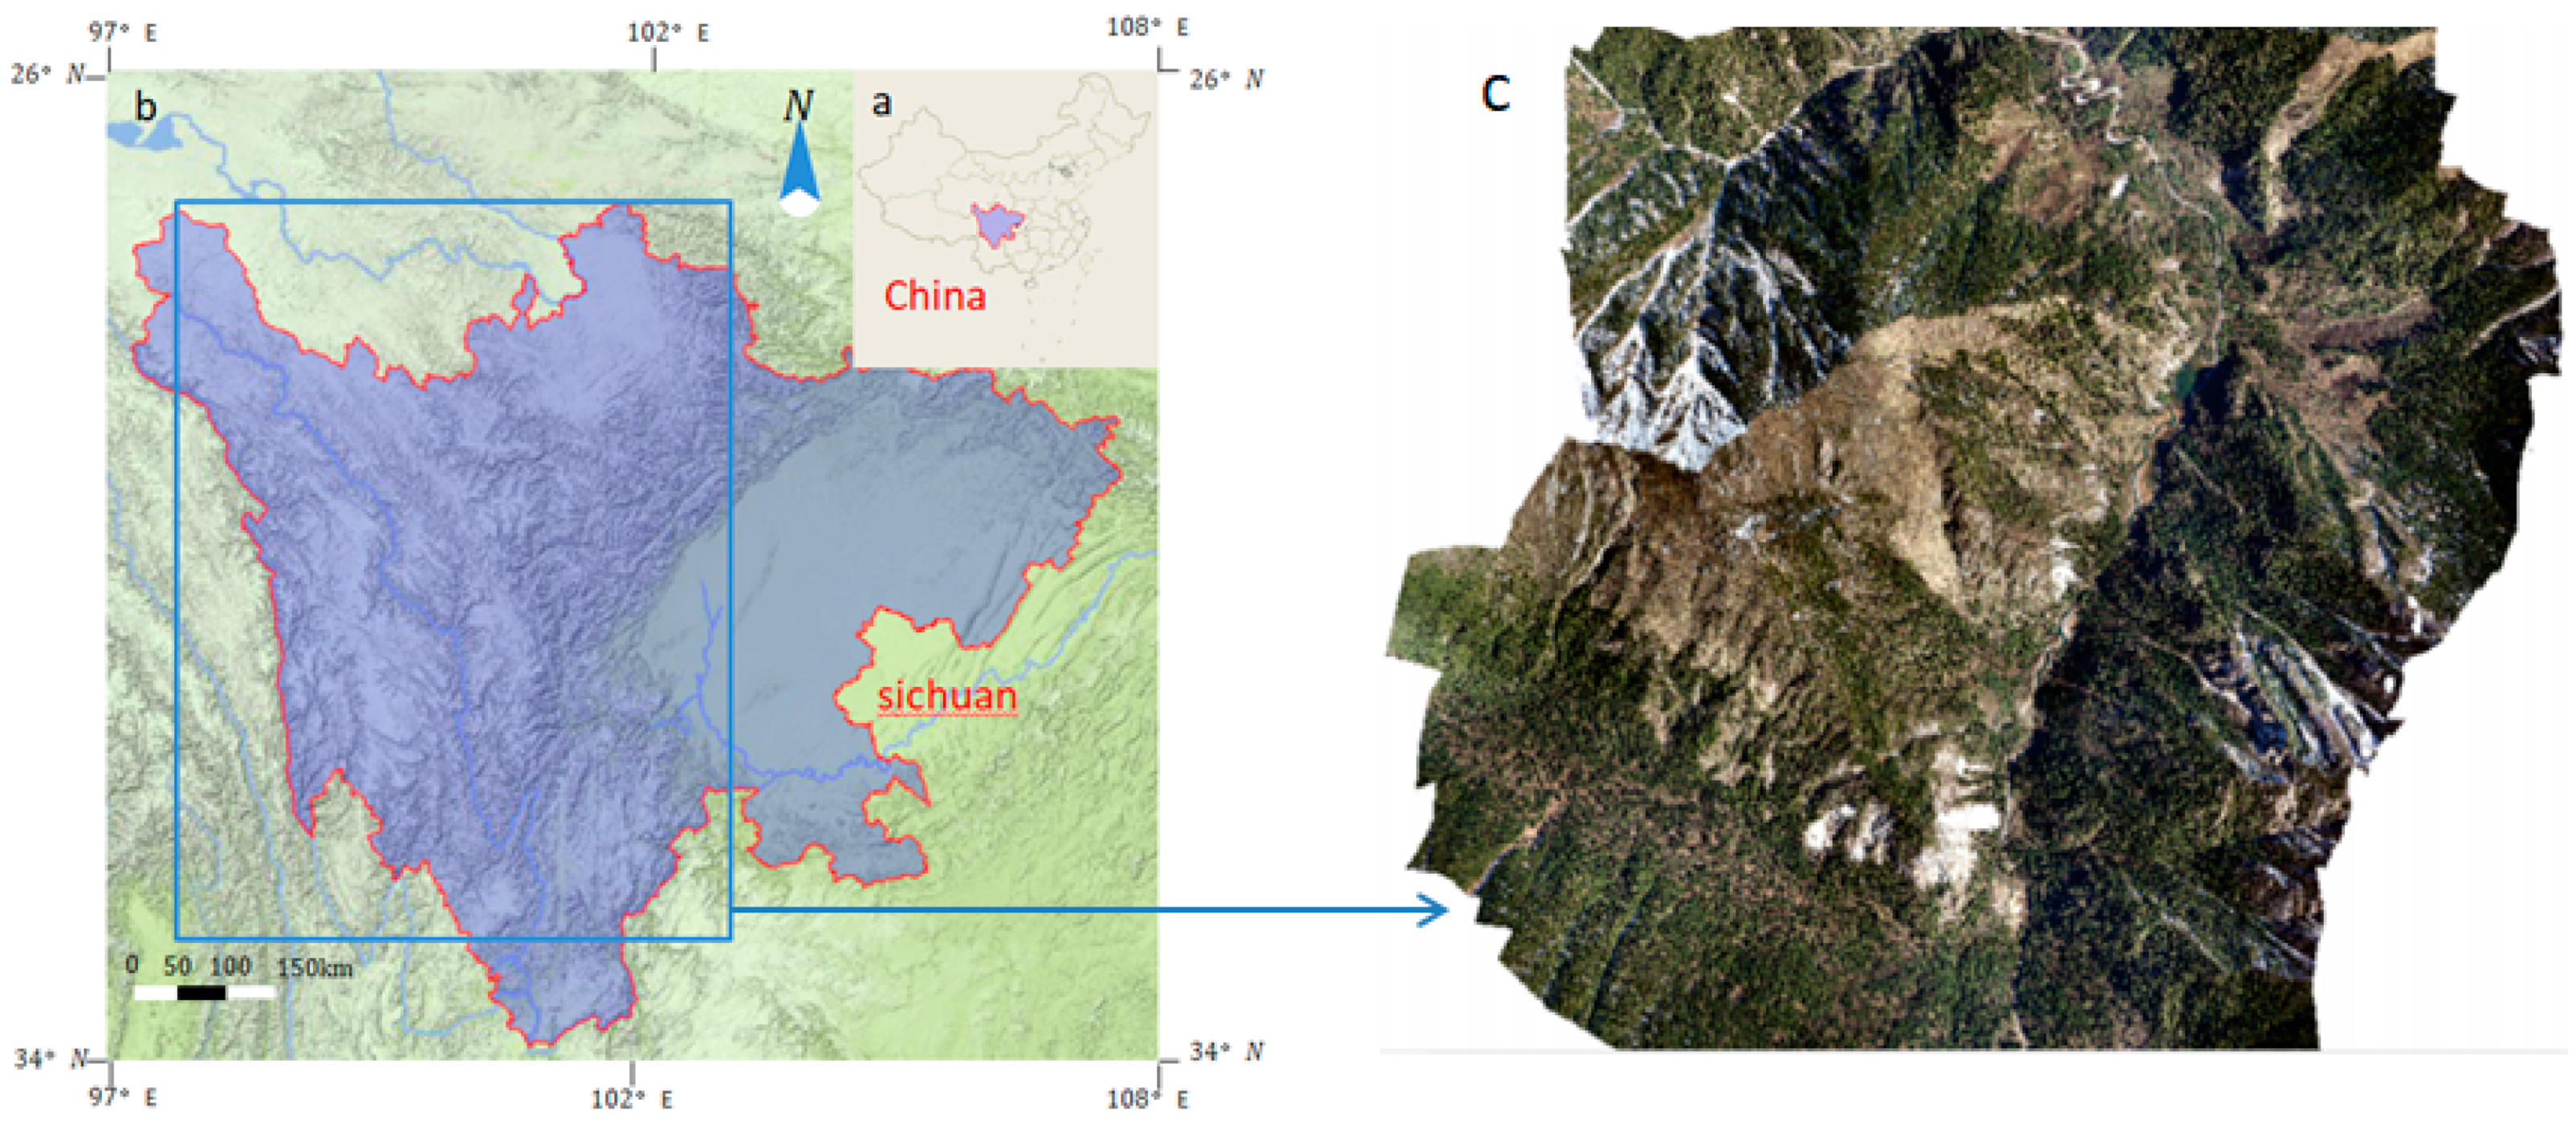
2. Study Area
3. Methods
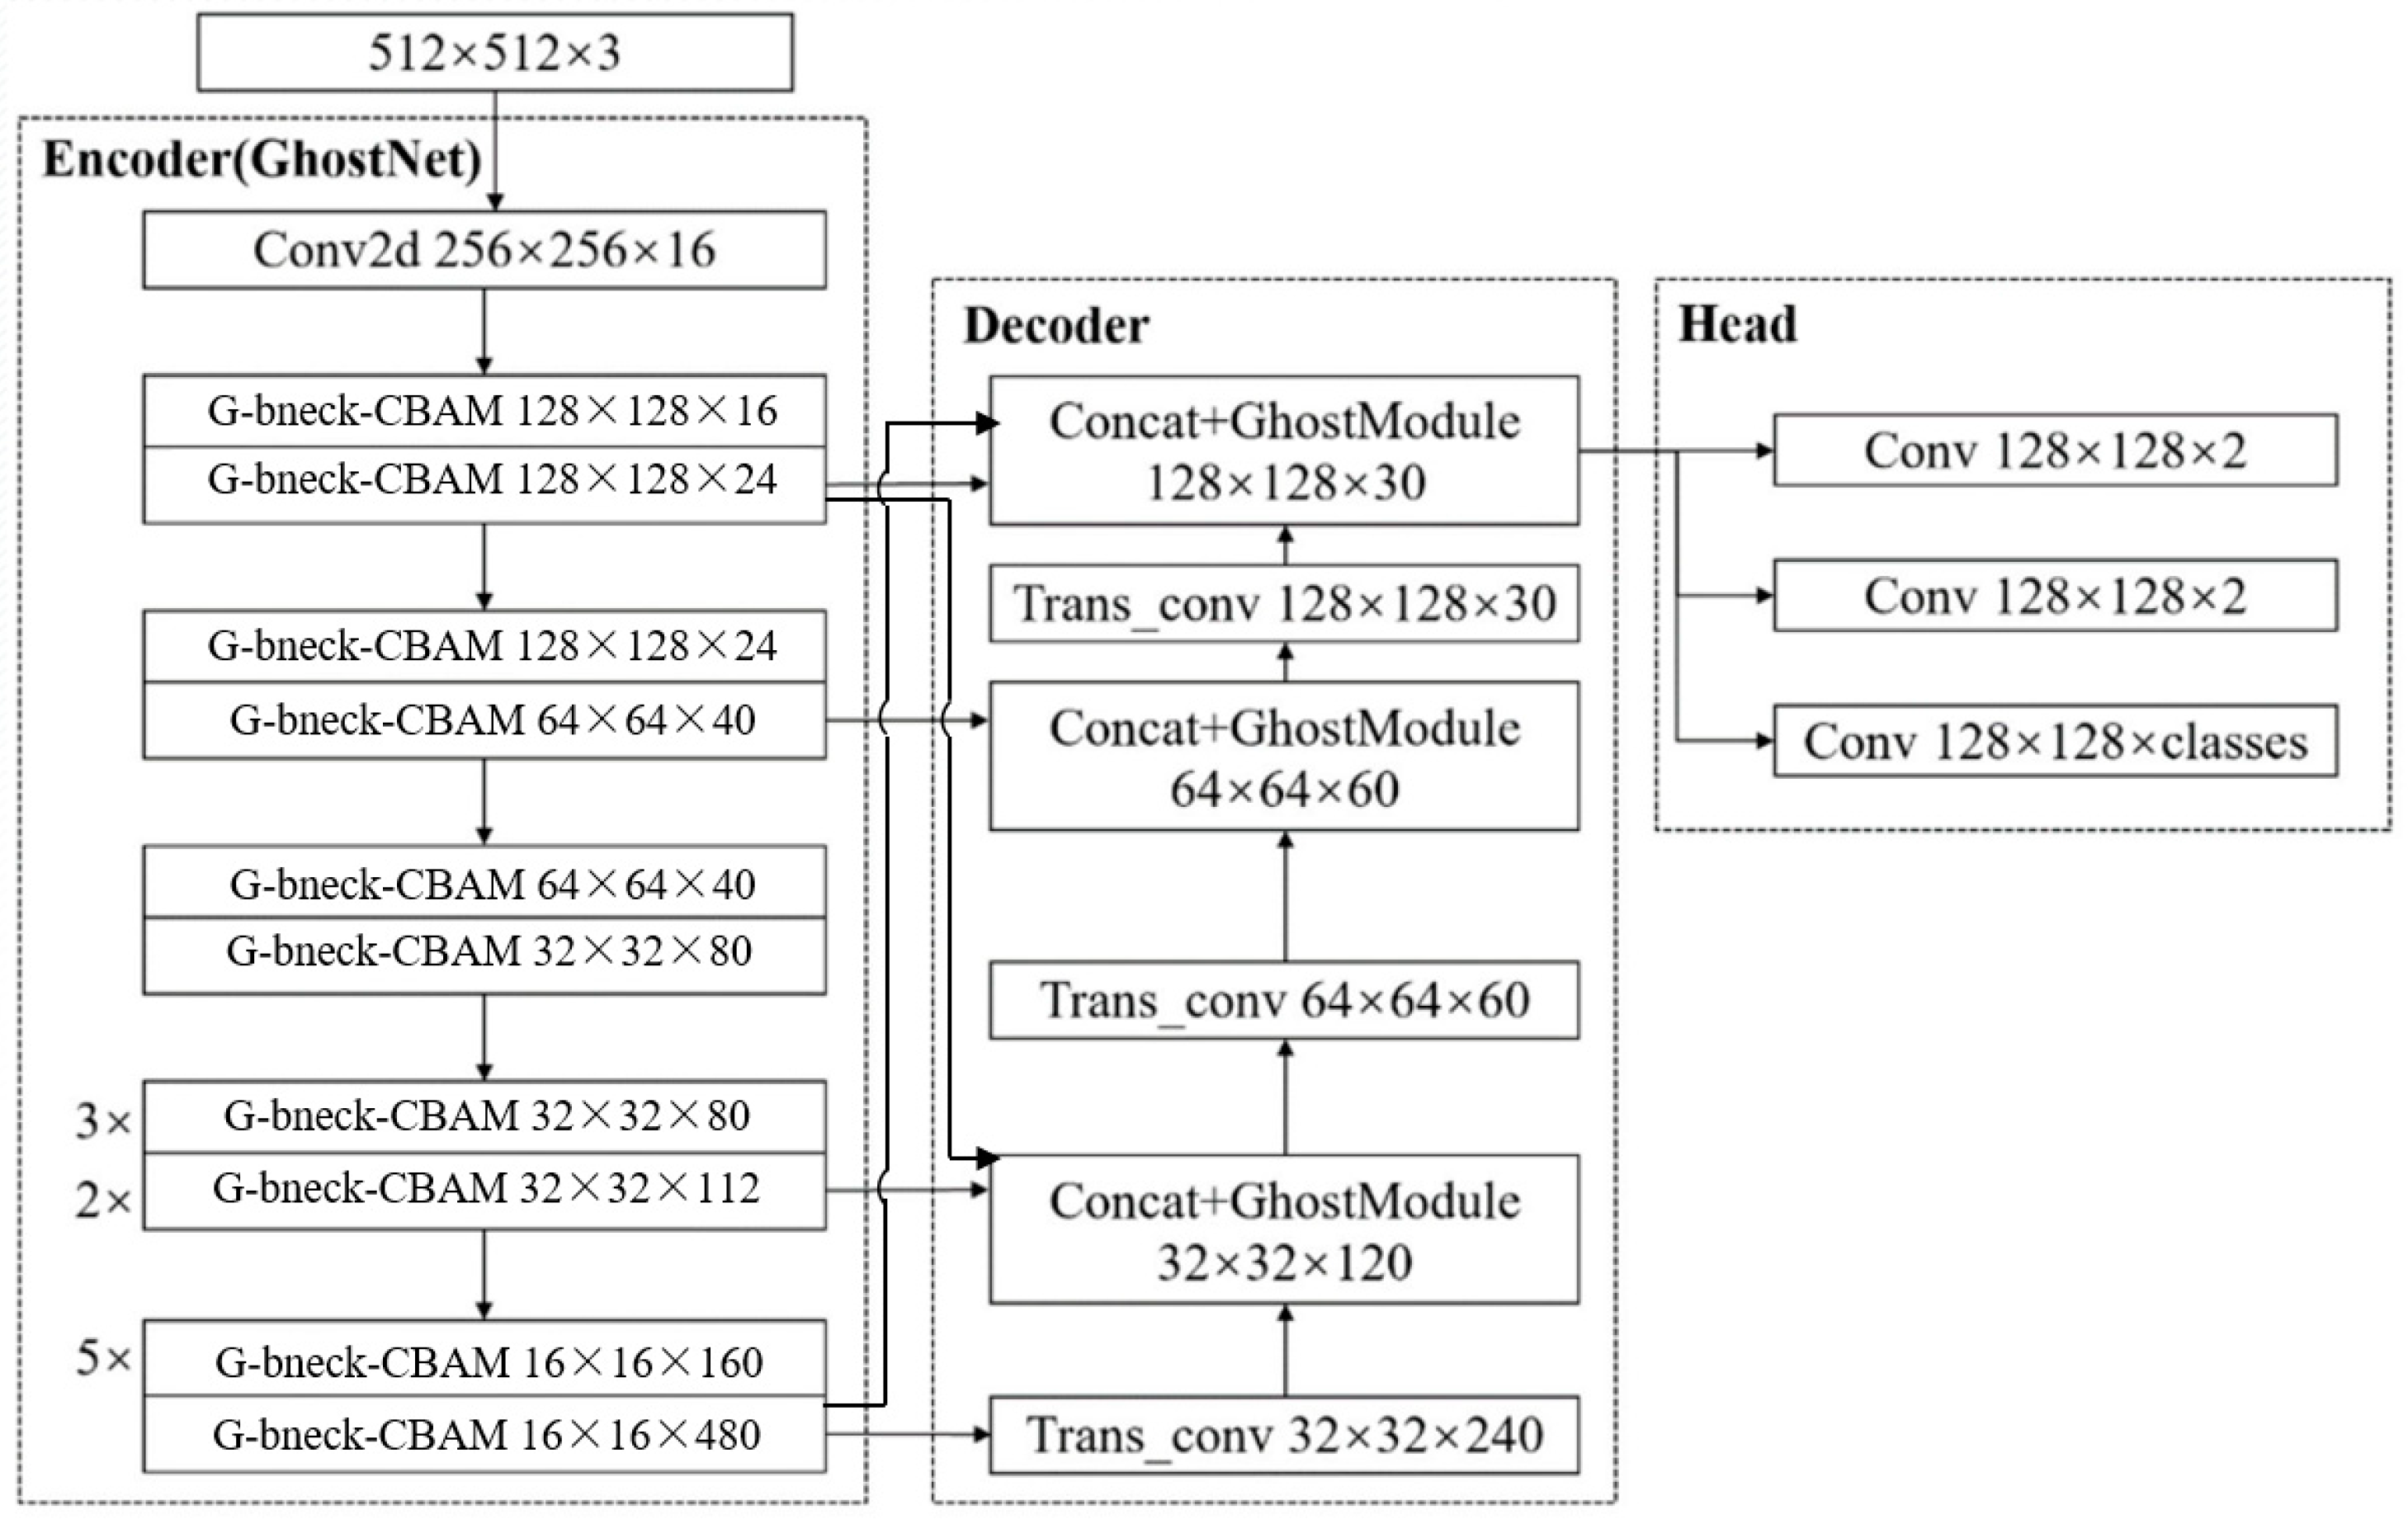
3.1. Architecture Overview
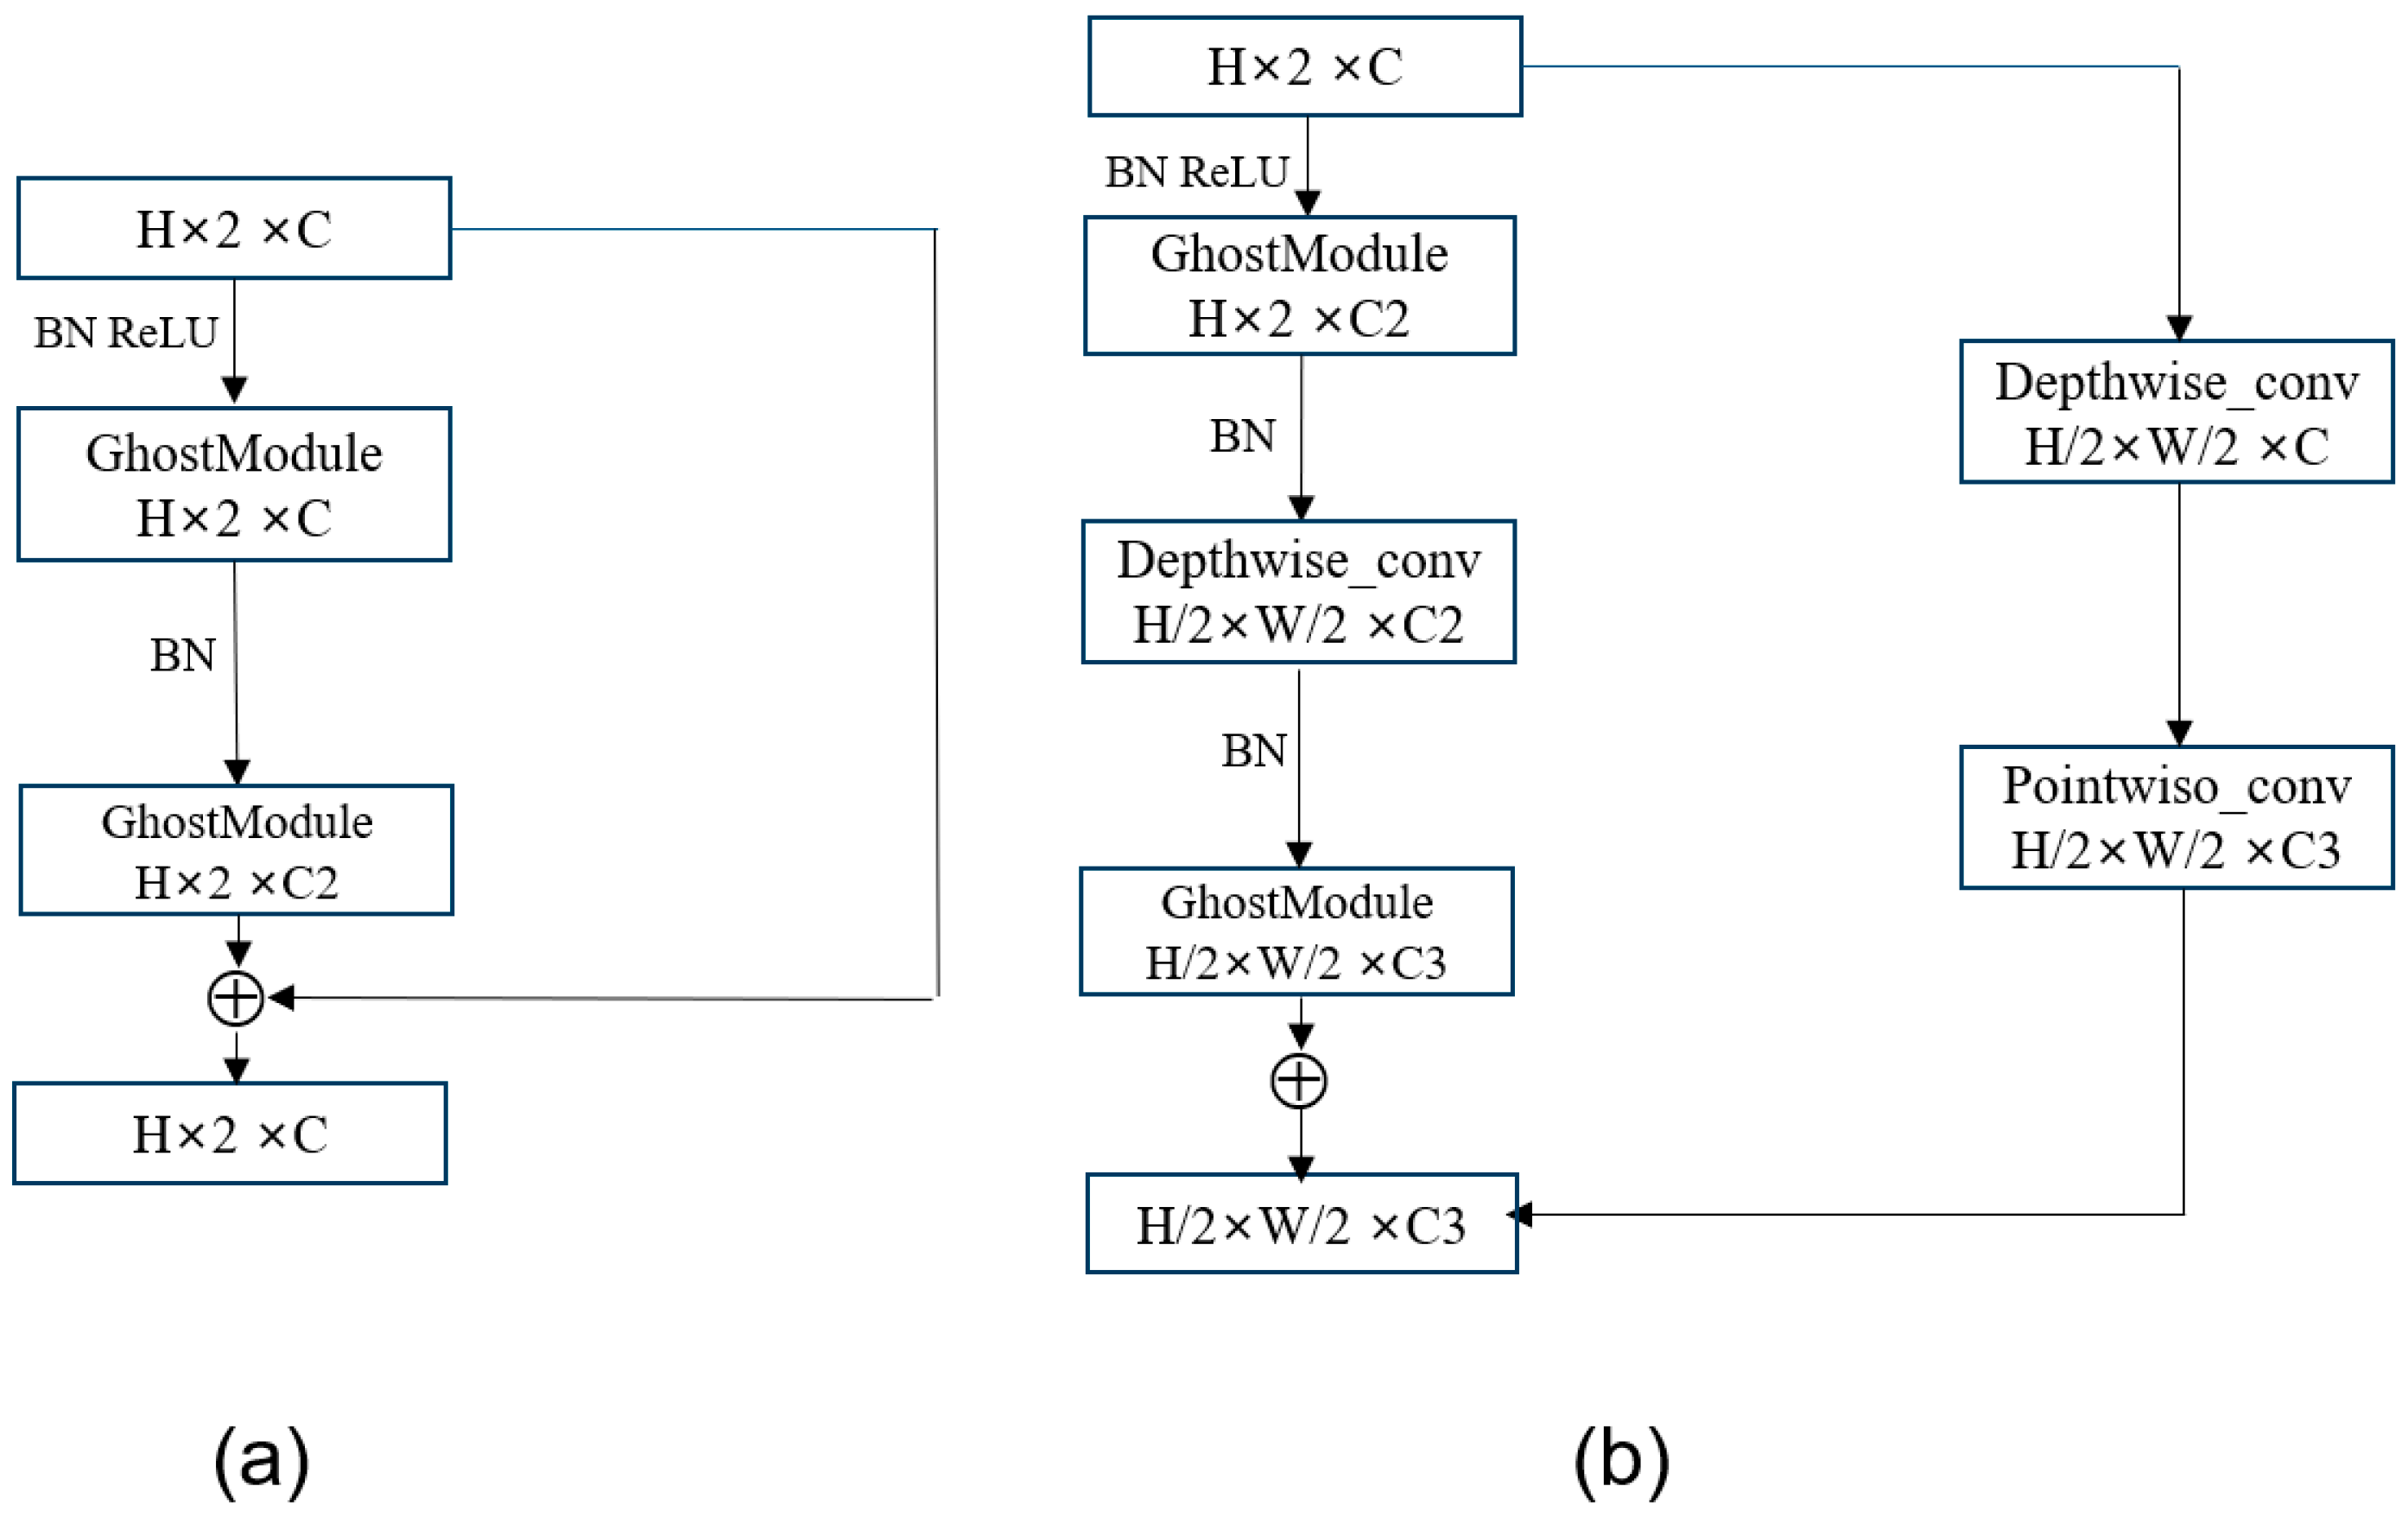
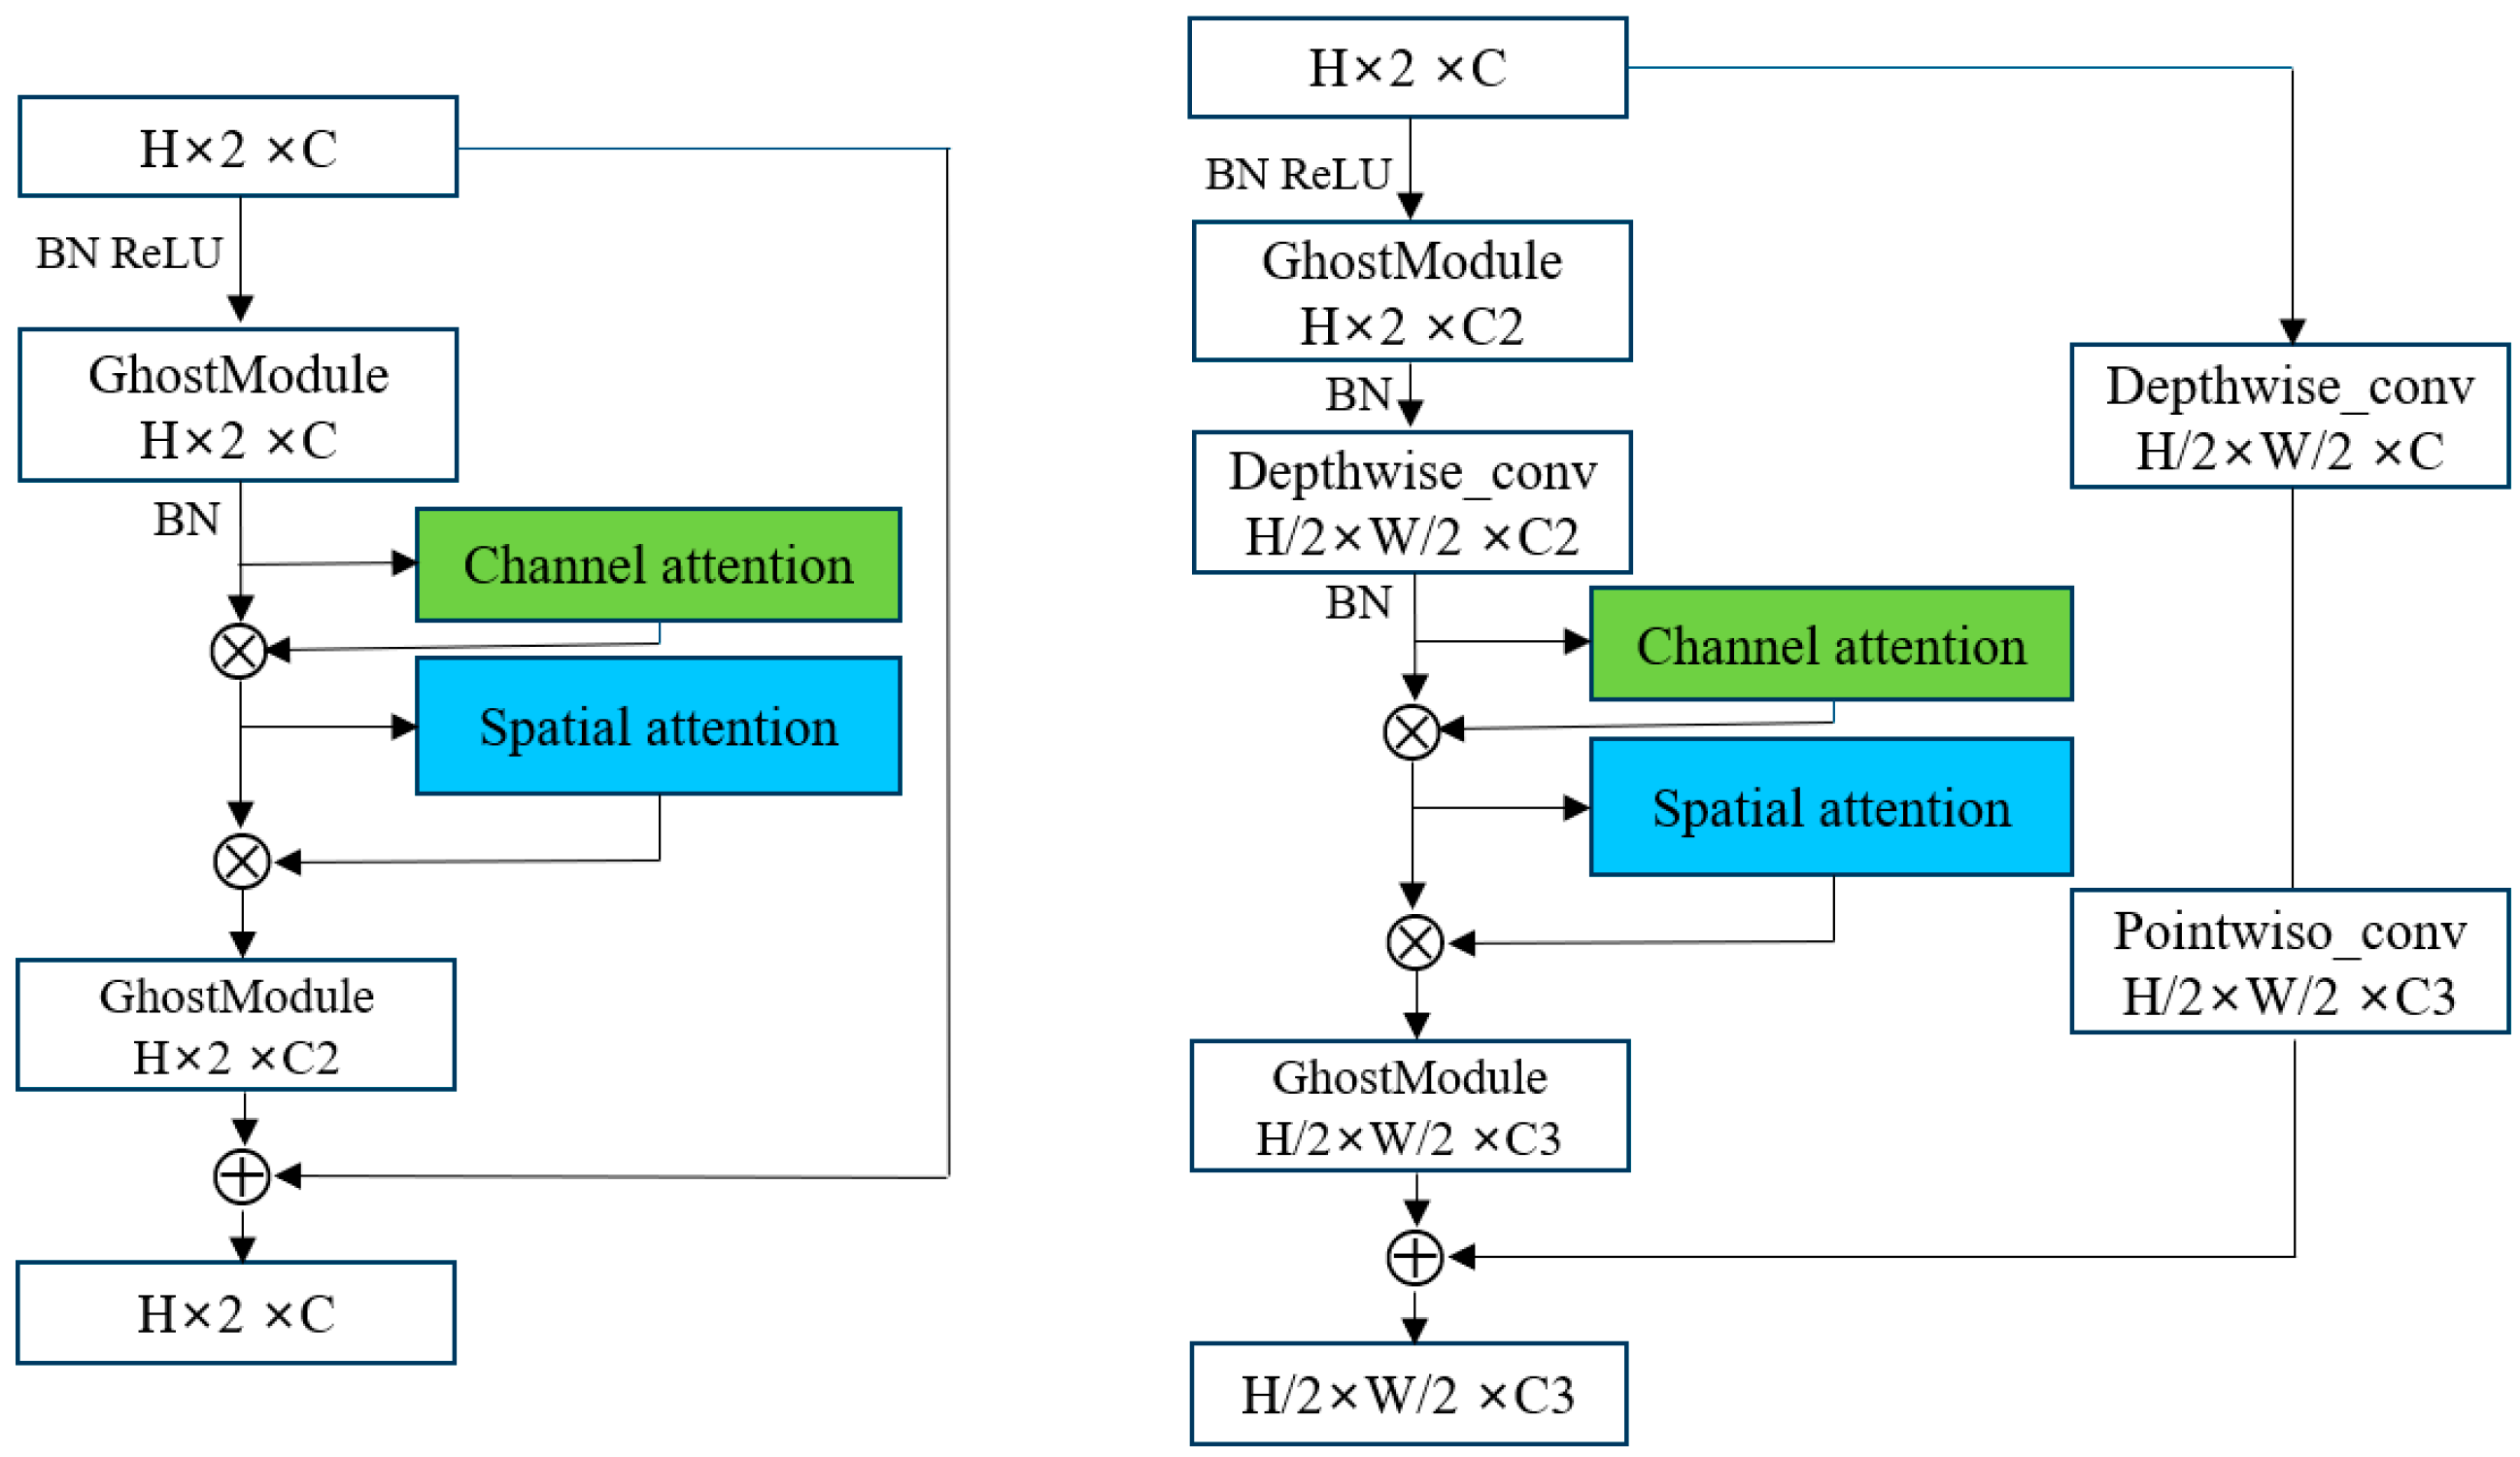
3.2. Mini Network Backbone of Attention Mechanism
3.3. Lightweight Network Accuracy Improvement Module
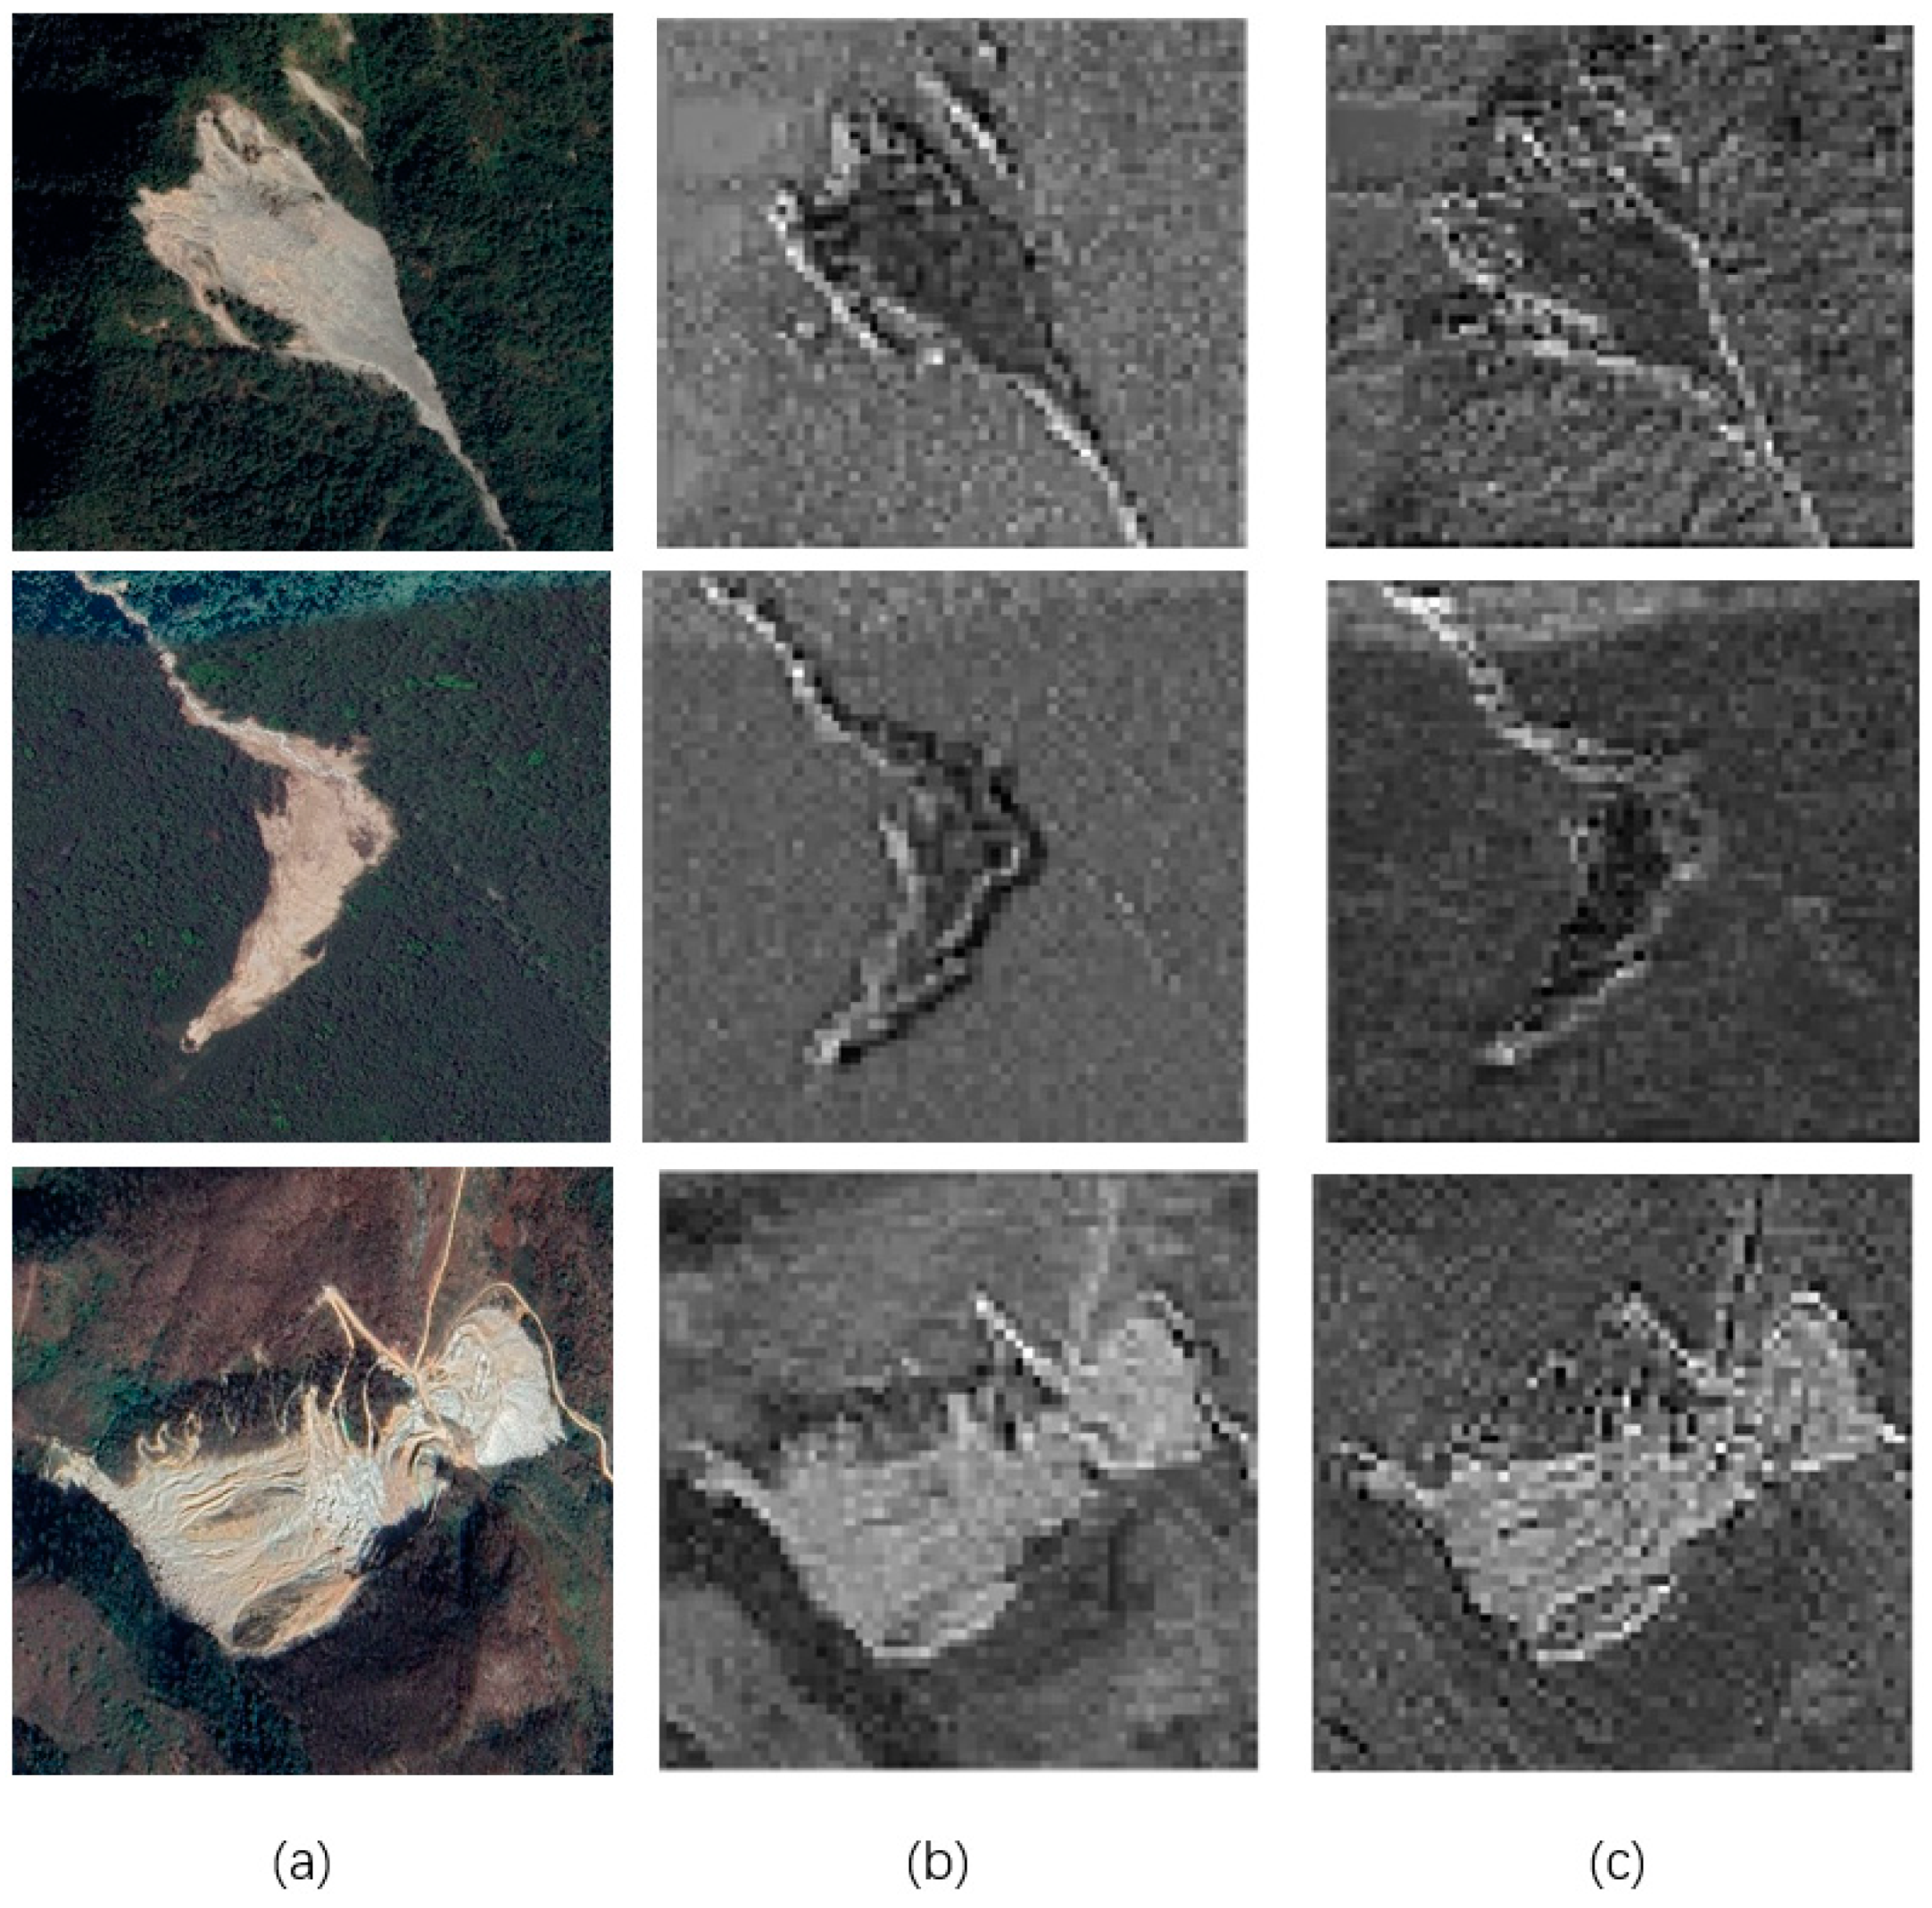
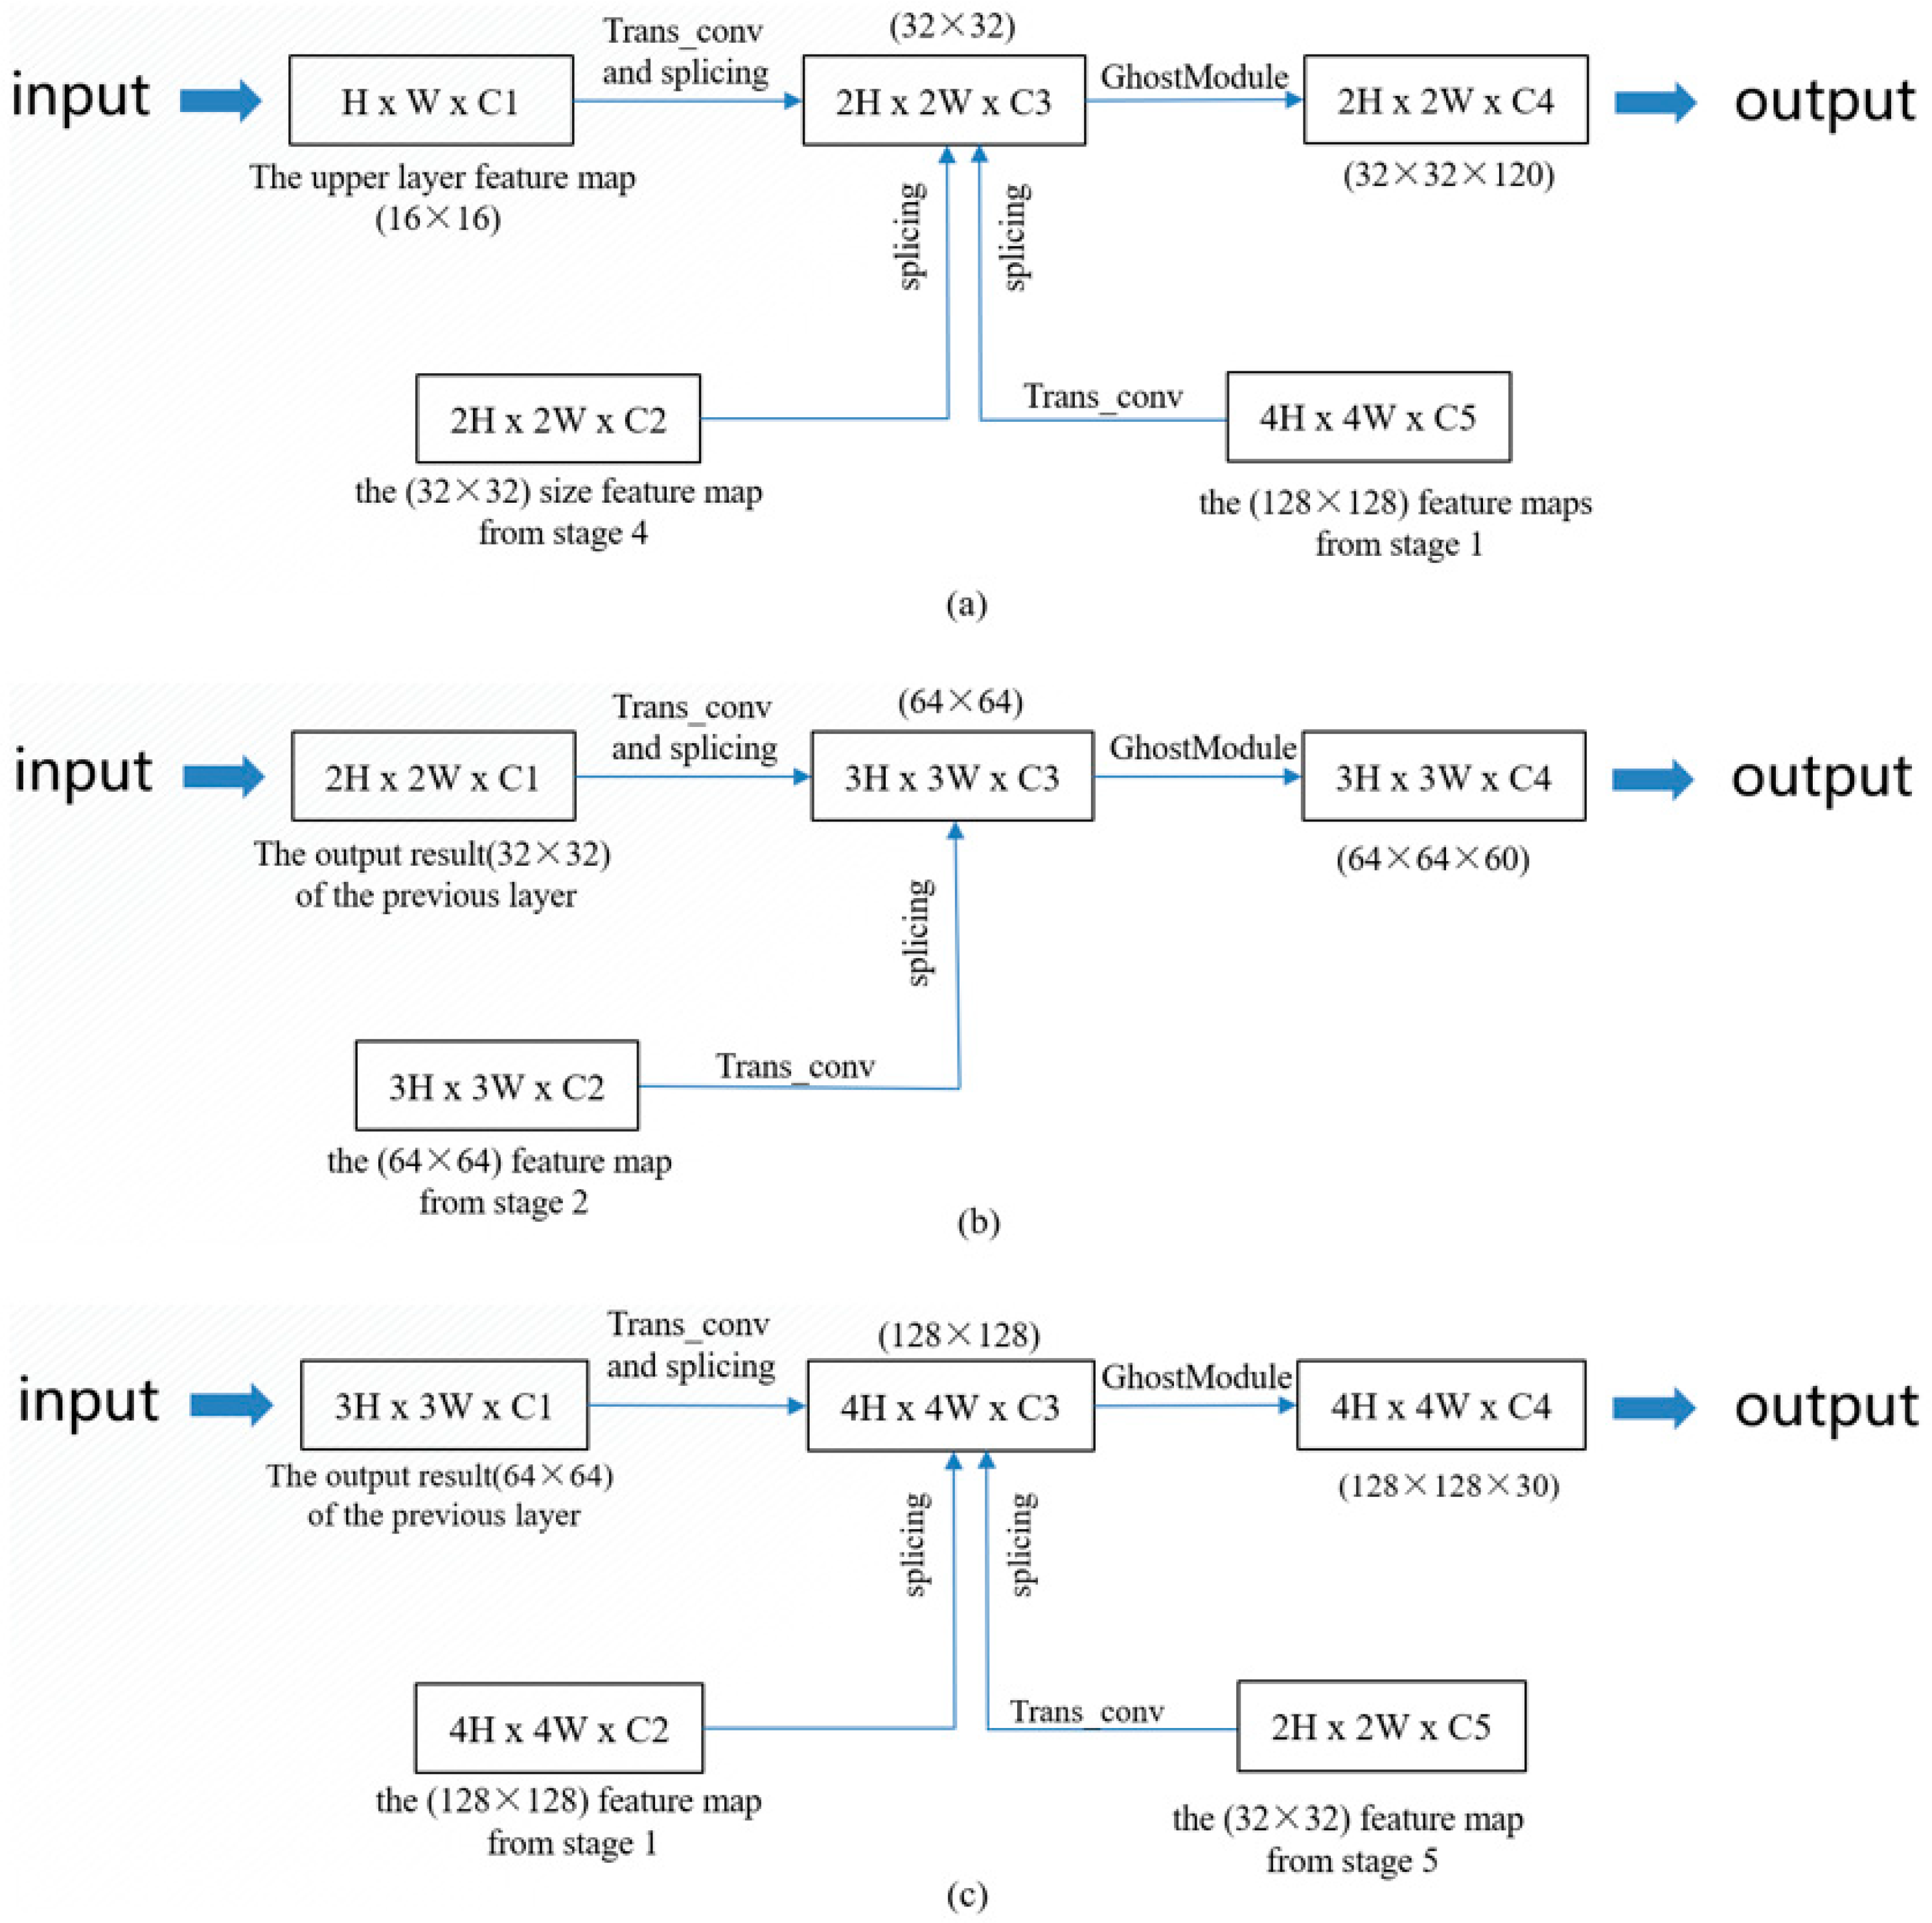
3.3.1. Lightweight Multiscale Feature Fusion
3.3.2. Feature-Based Knowledge Distillation
3.4. Evacuation Metrics
- Precision and recall:
- P-R curve:
- Average accuracy:
4. Results and Discussion
4.1. Experimental Platform
4.2. Experimental Settings and Datasets
4.3. Experimental Analysis
4.4. Model Comparison
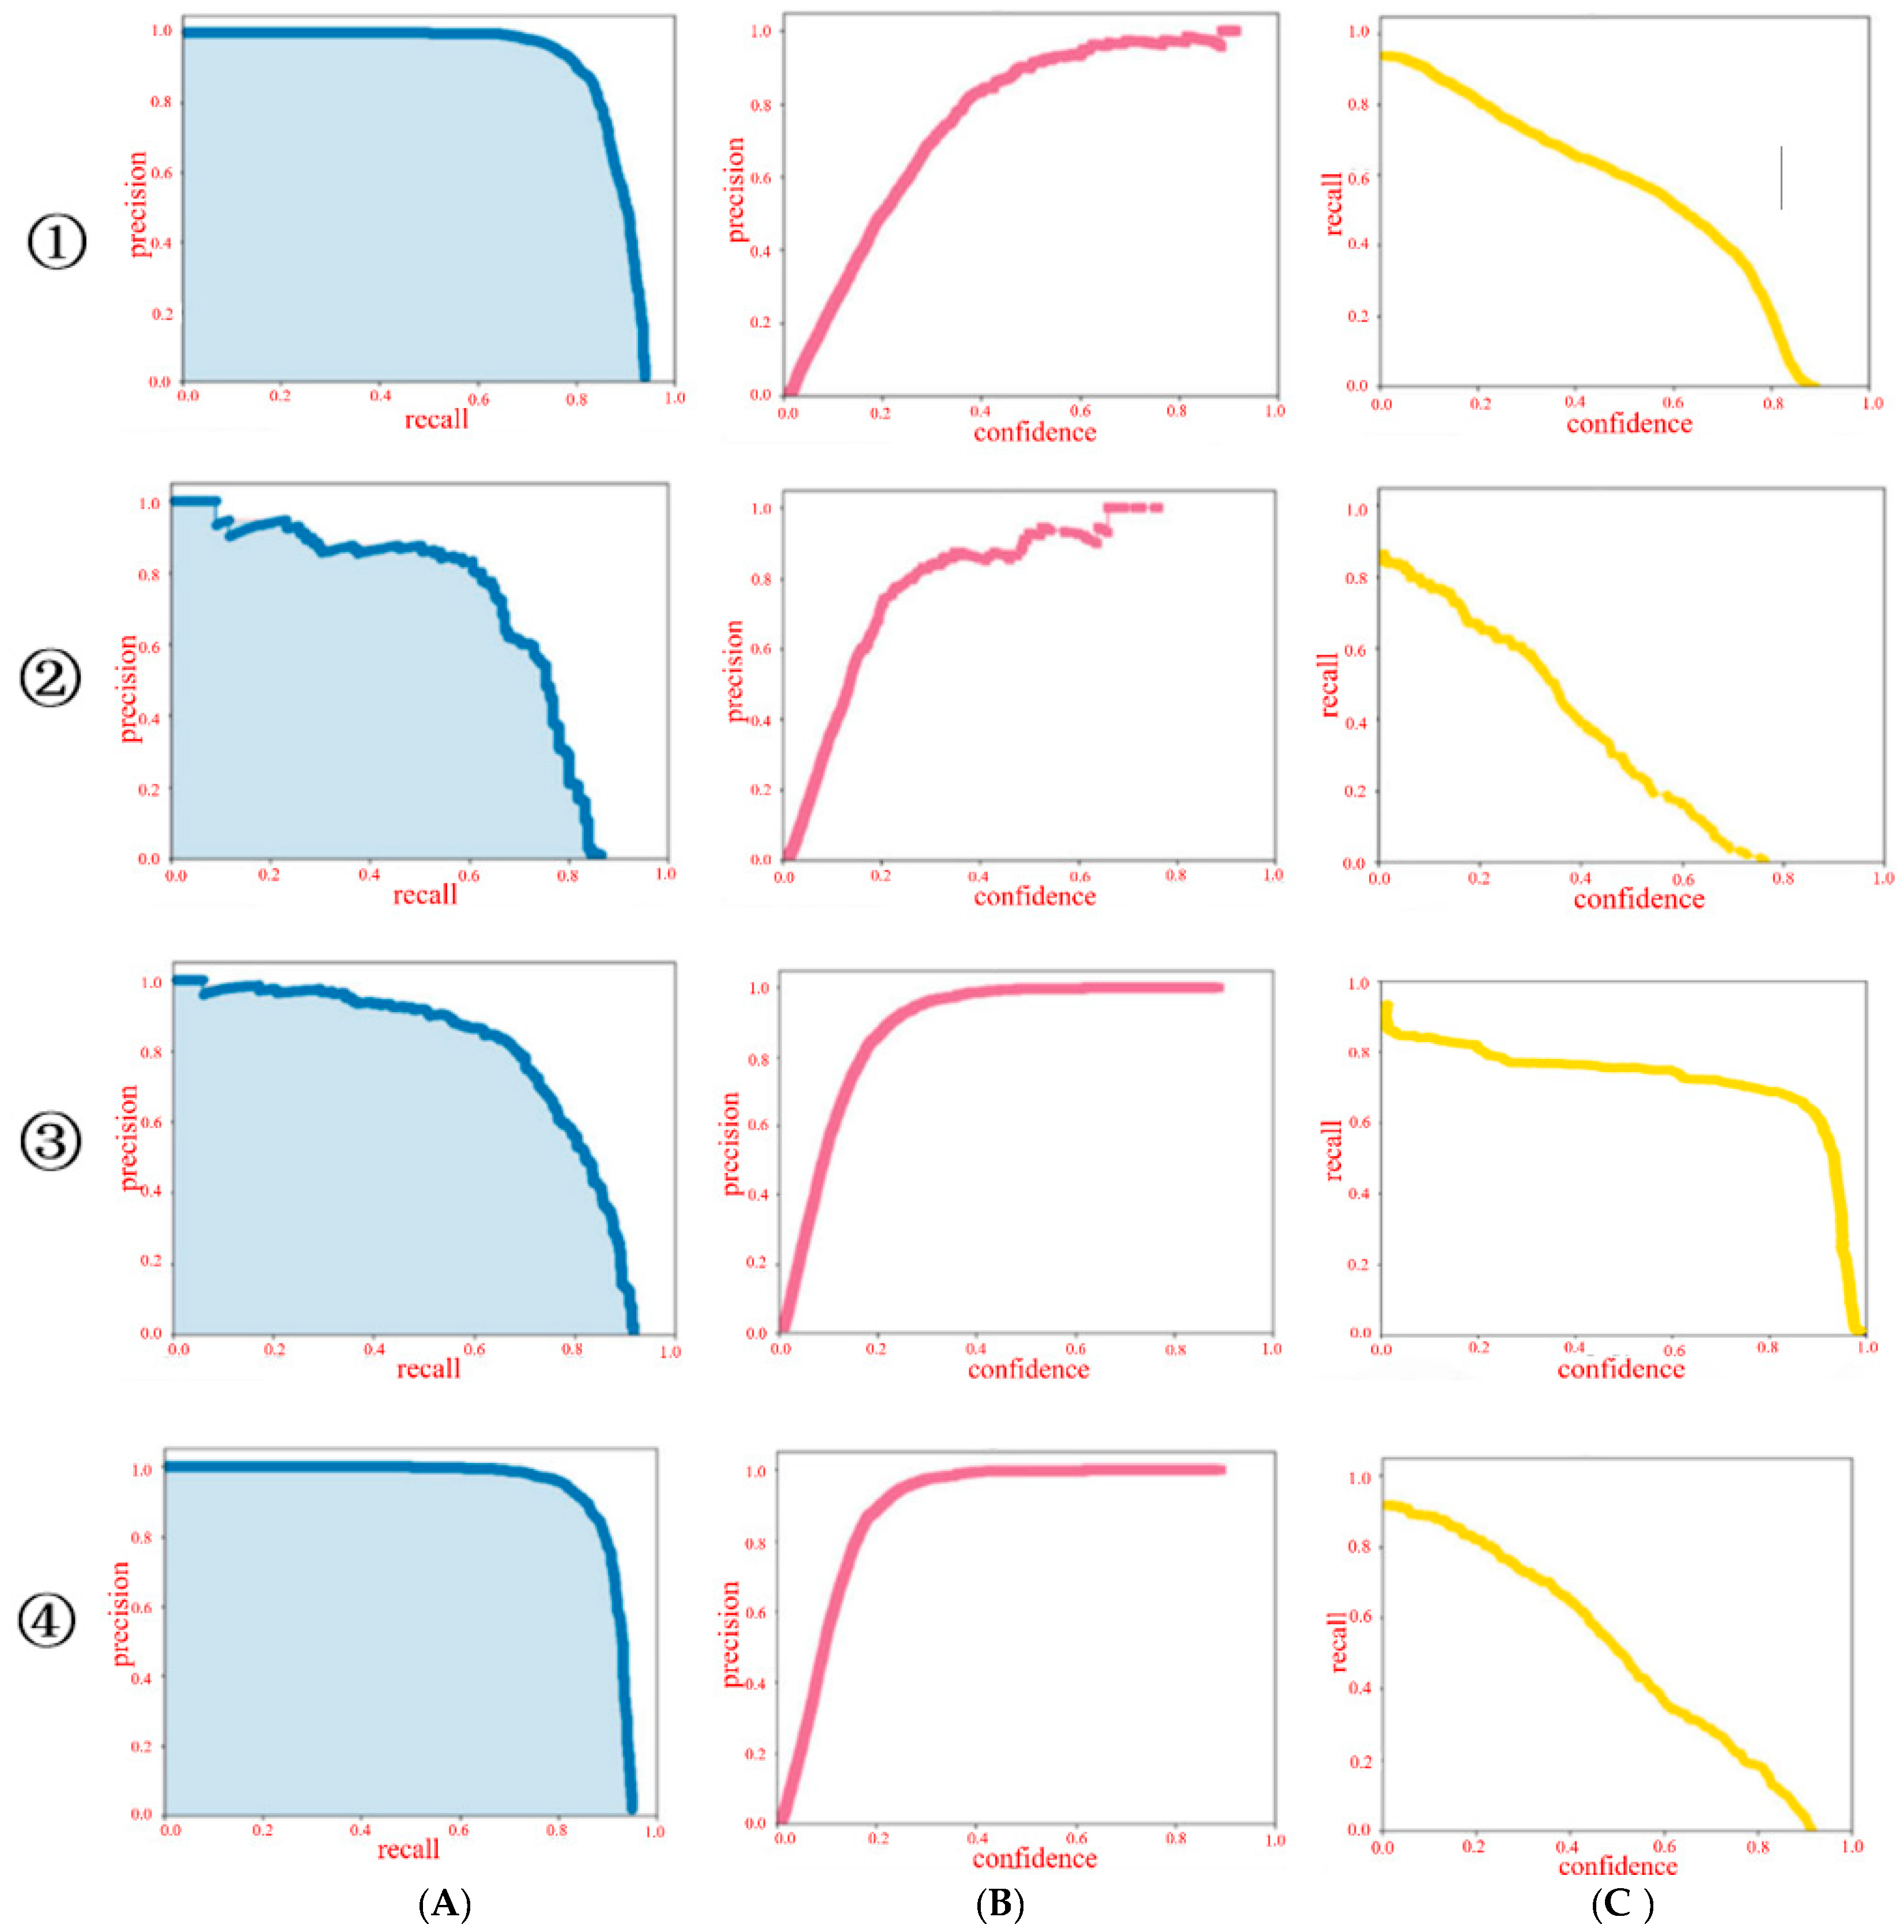
- Comparison of precision and recall curves:
4.5. Model Size, Calculation Amount, and Comparison of Accuracy
4.6. Landslide Emergency Detection
5. Conclusions
- The lightweight backbone feature extraction network constructed by GhostModule can reduce the number of parameters by 80–90% compared with traditional large networks such as ResNet50.
- The use of the CBAM module increased the robustness of the extracted features. Instead of using CenterNet with ResNet50 decoding for direct up-sampling, we spliced the features of the decoding part with the feature maps of different modules of the encoding part. We then used Yolov5x for knowledge distillation, thus improving the prediction effect of the model. These operations improved the detection accuracy of the model.
- The lightweight model is used directly, which leads to a large loss of accuracy because of the poor feature extraction ability. However, after combining lightweight feature enhancement modules and knowledge distillation modules, the feature extraction ability of the lightweight model can be improved without affecting the number of parameters—even achieving a higher precision than the original large model.
Author Contributions
Funding
Conflicts of Interest
References
- Zhou, Y.; Wang, H.; Yang, R.; Yao, G.; Xu, Q.; Zhang, X. A Novel Weakly Supervised Remote Sensing Landslide Semantic Segmentation Method: Combining CAM and cycleGAN Algorithms. Remote Sens. 2022, 14, 3650. [Google Scholar] [CrossRef]
- Lukić, T.; Bjelajac, D.; Fitzsimmons, K.E.; Marković, S.B.; Basarin, B.; Mlađan, D.; Micić, T.; Schaetzl, R.J.; Gavrilov, M.B.; Milanović, M.; et al. Factors Triggering Landslide Occurrence on the Zemun Loess Plateau, Belgrade Area, Serbia. Environ. Earth Sci. 2018, 77, 519. [Google Scholar] [CrossRef]
- Luino, F.; De Graff, J.; Biddoccu, M.; Faccini, F.; Freppaz, M.; Roccati, A.; Ungaro, F.; D’Amico, M.; Turconi, L. The Role of Soil Type in Triggering Shallow Landslides in the Alps (Lombardy, Northern Italy). Land 2022, 11, 1125. [Google Scholar] [CrossRef]
- Grima, N.; Edwards, D.; Edwards, F.; Petley, D.; Fisher, B. Landslides in the Andes: Forests Can Provide Cost-Effective Landslide Regulation Services. Sci. Total Environ. 2020, 745, 141128. [Google Scholar] [CrossRef] [PubMed]
- Tonini, M.; Cama, M. Spatio-temporal pattern distribution of landslides causing damage in Switzerland. Landslides 2019, 16, 2103–2113. [Google Scholar] [CrossRef]
- Al-Umar, M.; Fall, M.; Daneshfar, B. GIS based assessment of rainfall-induced landslide susceptibility of sensitive marine clays: A case study. Geomech. Geoeng.-Int. J. 2021, 17, 1458–1484. [Google Scholar] [CrossRef]
- Ma, Z.; Mei, G.; Piccialli, F. Machine learning for landslides prevention: A survey. Neural Comput. Appl. 2020, 33, 10881–10907. [Google Scholar] [CrossRef]
- Xia, W.; Chen, J.; Liu, J.; Ma, C.; Liu, W. Landslide Extraction from High-Resolution Remote Sensing Imagery Using Fully Convolutional Spectral–Topographic Fusion Network. Remote Sens. 2021, 13, 5116. [Google Scholar] [CrossRef]
- Chen, S.; Xiang, C.; Kang, Q.; Wu, T.; Liu, K.; Feng, L.; Tao, D. Multi-Source Remote Sensing Based Accurate Landslide Detection Leveraging Spatial-Temporal-Spectral Feature Fusion. J. Comput. Res. Dev. 2020, 57, 1877–1887. [Google Scholar]
- Hu, Q.; Zhou, Y.; Wang, S.; Wang, F.; Wang, H. Improving the Accuracy of Landslide Detection in “Off-site” Area by Machine Learning Model Portability Comparison: A Case Study of Jiuzhaigou Earthquake, China. Remote Sens. 2019, 11, 2530. [Google Scholar] [CrossRef]
- Long, L.; He, F.; Liu, H. The use of remote sensing satellite using deep learning in emergency monitoring of high-level landslides disaster in Jinsha River. J. Supercomput. 2021, 77, 8728–8744. [Google Scholar] [CrossRef]
- Tanatipuknon, A.; Aimmanee, P.; Watanabe, Y.; Murata, K.T.; Wakai, A.; Sato, G.; Hung, H.V.; Tungpimolrut, K.; Keerativittayanun, S.; Karnjana, J. Study on Combining Two Faster R-CNN Models for Landslide Detection with a Classification Decision Tree to Improve the Detection Performance. J. Disaster Res. 2021, 16, 588–595. [Google Scholar] [CrossRef]
- Ren, S.; He, K.; Girshick, R.; Sun, J. Faster R-CNN: Towards real-time object detection with region proposal networks. IEEE Trans. Pattern Anal. Mach. Intell. 2017, 39, 1137–1149. [Google Scholar] [CrossRef] [PubMed]
- Cheng, L.; Li, J.; Duan, P.; Wang, M. A small attentional YOLO model for landslide detection from satellite remote sensing images. Landslides 2021, 18, 2751–2765. [Google Scholar] [CrossRef]
- Ji, S.; Yu, D.; Shen, C.; Li, W.; Xu, Q. Landslide detection from an open satellite imagery and digital elevation model dataset using attention boosted convolutional neural networks. Landslides 2020, 17, 1337–1352. [Google Scholar] [CrossRef]
- Ullo, S.; Mohan, A.; Sebastianelli, A.; Ahamed, S.; Kumar, B.; Dwivedi, R.; Sinha, G.R. A New Mask R-CNN-Based Method for Improved Landslide Detection. IEEE J. Sel. Top. Appl. Earth Obs. Remote Sens. 2021, 14, 3799–3810. [Google Scholar] [CrossRef]
- Girshick, R.; Donahue, J.; Darrell, T.; Malik, J. Rich Feature Hierarchies for Accurate Object Detection and Semantic Segmentation. In Proceedings of the 2014 IEEE Conference on Computer Vision and Pattern Recognition, Columbus, OH, USA, 23–28 June 2014; pp. 580–587. [Google Scholar]
- Redmon, J.; Divvala, S.; Girshick, R.; Farhadi, A. You only look once: Unified, real-time object detection. In Proceedings of the IEEE Conference on Computer Vision and Pattern Recognition, Las Vegas, NV, USA, 27–30 June 2016; pp. 779–788. [Google Scholar]
- Zhao, H.; Li, Z.W.; Zhang, T.Q. Attention Based Single Shot Multibox Detector. J. Electron. Inf. Technol. 2021, 43, 2096–2104. [Google Scholar]
- Ge, D.H.; Li, H.S.; Zhang, L.; Liu, R.Y.; Shen, P.Y.; Miao, Q.G. Survey of Lightweight Neural Network. J. Softw. 2020, 31, 2627–2653. [Google Scholar]
- Mehta, R.; Ozturk, C. Object detection at 200 Frames Per Second. arXiv 2018, arXiv:1805.06361. [Google Scholar]
- Redmon, J.; Farhadi, A. YOLO9000: Better, Faster, Stronger. In Proceedings of the 2017 IEEE Conference on Computer Vision and Pattern Recognition (CVPR), Honolulu, HI, USA, 21–26 June 2017; pp. 6517–6525. [Google Scholar]
- Zhang, L.F.; Dong, R.P.; Tai, H.S.; Ma, K.S. PointDistiller: Structured Knowledge Distillation towards Efficient and Compact 3D Detection. arXiv 2022, arXiv:2205.11098. [Google Scholar]
- Zhang, J.; Ma, K. Improve object detection with feature-based knowledge distillation:towards accurate and efficient detectors. In Proceedings of the International Conference on Learning Representations, Online, 3–7 May 2021. [Google Scholar]
- Liu, Y.F.; Shu, C.Y.; Wang, J.D.; Shen, C.H. Structured knowledge distillation for dense prediction. arXiv 2019, arXiv:1903.0419. [Google Scholar] [CrossRef] [PubMed]
- Wang, T.; Yuan, L.; Zhang, X.; Feng, J. Distilling object detectors with fine-grained feature imitation. In Proceedings of the IEEE/CVF Conference on Computer Vision and Pattern Recognition, Long Beach, CA, USA, 15–20 June 2019; IEEE: Piscataway, NJ, USA, 2019; pp. 4933–4942. [Google Scholar]


| Input | Convolution | Output Channels | Stride | |
|---|---|---|---|---|
| 512 × 512 × 3 | Conv2d 3 × 3 | 16 | 2 | |
| Stage one | 256 × 256 × 16 | G-bneck-CBAM | 16 | 1 |
| 256 × 256 × 16 | G-bneck-CBAM | 24 | 2 | |
| Stage two | 128 × 128 × 24 | G-bneck-CBAM | 24 | 1 |
| 128 × 128 × 24 | G-bneck-CBAM | 40 | 2 | |
| Stage three | 64 × 64 × 40 | G-bneck-CBAM | 40 | 1 |
| 64 × 64 × 40 | G-bneck-CBAM | 80 | 2 | |
| Stage four | 32 × 32 × 80 | G-bneck-CBAM | 80 | 1 |
| 32 × 32 × 80 | G-bneck-CBAM | 80 | 1 | |
| 32 × 32 × 80 | G-bneck-CBAM | 80 | 1 | |
| 32 × 32 × 112 | G-bneck-CBAM | 112 | 1 | |
| 32 × 32 × 112 | G-bneck-CBAM | 112 | 1 | |
| 32 × 32 × 112 | G-bneck-CBAM | 112 | 2 | |
| Stage five | 16 × 16 × 160 | G-bneck-CBAM | 160 | 1 |
| 16 × 16 × 160 | G-bneck-CBAM | 160 | 1 | |
| 16 × 16 × 160 | G-bneck-CBAM | 160 | 1 | |
| 16 × 16 × 160 | G-bneck-CBAM | 160 | 1 | |
| 16 × 16 × 160 | Conv2d 1 × 1 | 480 | 1 | |
| Output | 16 × 16 × 480 |
| Number | Method | Params (MB) | Precision (%) | Recall (%) | AP (%) | Inference Time (ms) |
|---|---|---|---|---|---|---|
| ① | ResNet50 | 127.9 | 80.5 | 67.8 | 67.55 | 100 |
| ② | CBAM-Mini | 12.7 | 65.43 | 52.86 | 53.4 | 40 |
| ③ | Yolov5x | 86.7 | 91 | 94 | 92.01 | 67.8 |
| ④ | Light-Net | 18.7 | 82.8 | 78.1 | 76.25 | 52 |
Disclaimer/Publisher’s Note: The statements, opinions and data contained in all publications are solely those of the individual author(s) and contributor(s) and not of MDPI and/or the editor(s). MDPI and/or the editor(s) disclaim responsibility for any injury to people or property resulting from any ideas, methods, instructions or products referred to in the content. |
© 2023 by the authors. Licensee MDPI, Basel, Switzerland. This article is an open access article distributed under the terms and conditions of the Creative Commons Attribution (CC BY) license (https://creativecommons.org/licenses/by/4.0/).
Share and Cite
Ge, X.; Zhao, Q.; Wang, B.; Chen, M. Lightweight Landslide Detection Network for Emergency Scenarios. Remote Sens. 2023, 15, 1085. https://doi.org/10.3390/rs15041085
Ge X, Zhao Q, Wang B, Chen M. Lightweight Landslide Detection Network for Emergency Scenarios. Remote Sensing. 2023; 15(4):1085. https://doi.org/10.3390/rs15041085
Chicago/Turabian StyleGe, Xuming, Qian Zhao, Bin Wang, and Min Chen. 2023. "Lightweight Landslide Detection Network for Emergency Scenarios" Remote Sensing 15, no. 4: 1085. https://doi.org/10.3390/rs15041085
APA StyleGe, X., Zhao, Q., Wang, B., & Chen, M. (2023). Lightweight Landslide Detection Network for Emergency Scenarios. Remote Sensing, 15(4), 1085. https://doi.org/10.3390/rs15041085