Abstract
Migratory shorebirds are currently at significant risk, with populations of multiple species dropping globally, often due to habitat disruption and loss. The coast of northern Brazil, along the states of Pará and Maranhão, encompasses one of the broadest expanses of shorebird overwintering habitat for many shorebird species in the Atlantic Americas Flyway. Delineating how current management protects shorebird habitat is an important first step to identifying gaps in protections that then need to be prioritized. Different frameworks of conservation decision-making, such as focusing on flagship, umbrella, or biodiversity, can be used to prioritize what habitat needs to be protected. Understanding the effects of these different conservation perspectives is key to making informed management decisions. Multiple dates of Landsat 8 imagery at different tidal stages were used to identify intertidal habitats for further analysis. MaxEnt species distribution models were derived for each species using remote sensing and landscape metrics, as well as point-count survey data collected during the winters of 2016 and 2017. Landsat 8 and Sentinel 2 image data were included as direct inputs to the model rather than interpreted and mapped first into different habitat types. The resulting Maxent models successfully delineated between presence and absence locations for five of the eight target shorebird species. The model outputs were combined to map the intertidal habitat covered under several different management scenarios. These scenarios included using red knots as a flagship species, semipalmated sandpipers as an umbrella species, and species richness as a metric of shorebird diversity. Slightly more than 25% of delineated intertidal habitat was found to be included within a designated Marine Extractive Reserve, with three major gaps in current protections identified. The flagship, umbrella, and biodiversity perspectives result in different prioritizations of these distinct locations. While umbrella and diversity approaches are successful at protecting diverse communities, community assemblages of rarer or specialist species, such as the red knots, may fall outside their protective shadows. A hybrid approach that uses both diversity and the extent of rare flagship species produces results that best meet the management goals of identifying gaps in existing conservation to protect the most at-risk species while conserving the diverse assemblages they coexist with.
1. Introduction
Shorebird species along the Atlantic American coastline, such as Red Knots (Canutus rufa rufa) and Semipalmated Sandpipers (Calidris pusilla), make annual migrations from breeding grounds in the high Canadian Arctic to overwintering grounds across South America, including the northern coast of Brazil [1,2,3,4]. Due to their reliance on numerous, widely dispersed geographic regions for migratory and breeding success [5,6], disruption to any component of their migratory route could lead to dramatic population declines. This vulnerability makes shorebirds important indicator species, where population declines at any stage of their migration may indicate problems or disruption elsewhere [7]. Unfortunately, the current evidence indicates that Nearctic migratory shorebirds are imperiled, with population numbers dropping globally [8,9]. The Atlantic Americas Flyway is no exception, with significant population declines observed during the 1980s and 1990s; more recent population estimates suggest a deceleration of this trend but still with numbers falling well below conservation targets [10,11].
The population declines of several Nearctic migrant shorebird species closely linked to disruption at a key stopover location, Delaware Bay U.S.A. [12], have been intensely studied and managed to address the problem [13,14,15]. Other key sites along the Atlantic Americas flyway are less thoroughly understood, including northern Brazil, which hosts among the largest populations of overwintering shorebirds [1,16]. Understanding the distribution, protection levels, and gaps in the current protection of shorebird habitat at these key migratory locations is critical to conservation planning and decision-making for these at-risk species that utilize northern Brazil.
As might be expected, conservation planning for a whole suite of species can be more complex than for one species alone. Several different frameworks for multi-species conservation planning have been developed, including umbrella species, flagship species, and biodiversity approaches. Umbrella species conservation focuses on a single species with a wide geographic range that encompasses the distributions of other valued and important species. Conservation efforts can focus on protecting a single umbrella species, with the understanding that a variety of other species will tangentially be protected [17,18,19]. In a similar approach, flagship species generate significant public interest, which is useful when drumming up support for conservation and management efforts [20]. Typically, it is the large, showy, charismatic vertebrate species that have already garnered some level of public interest. Flagship species can serve as umbrella species if they have wide geographic ranges that encompass other, less charismatic species. However, this is not necessarily the case, as their primary merit is their public appeal [20]. Finally, prioritizing maximum biological diversity in the form of diversity hot spots has also been proposed as an approach to conservation [21]. Areas with the highest diversity of species would be given priority, regardless of the composition of the prioritized areas.
Semipalmated sandpipers are the most ubiquitous shorebirds across the Atlantic Americas flyway, occupying the breadth of available habitat [1,22], making them an ideal umbrella species. Red knots have received significant attention from both the conservation community and the public with their dramatic life history [12], a PBS documentary made about their conservation issues [23], and their addition to the Endangered Species Act [24]. However, red knots are significantly less abundant than semipalmated sandpipers, potentially covering much less with their “umbrella” [1,22]. The northern Brazil migratory stopover site provides an opportunity to quantify the implications of applying an umbrella species, flagship species, vs. a biodiversity approach for the conservation of local shorebird assemblages.
The challenge of developing effective conservation strategies for wildlife requires consideration of the needs of local human communities. In an effort to sustainably manage the northern Brazilian coast, a series of Marine Extractive Reserves (MER) have been designated and managed by the Brazilian federal Chico Mendes Institute for Biological Diversity Conservation (ICMBio). Extractive Reserves (also referred to as Reserva Extrativistas or Resex) are a type of protected area that differ from classic “fortress” conservations, which aims to prevent any use or disruption to the ecosystem. Instead, they “explicitly aim to safeguard the livelihoods and cultures of traditional human populations” that subsist within the region [25]. They do this by allowing the extraction of resources by local populations, with the regulation coming not from the top-down, but bottom-up in the form of local community-based control systems. The organization for community participation is the essence of this management model and has become a great challenge since the creation of Extractive Reserves [26]. Originating in the Amazon in 1990, the ER strategy quickly expanded to the marine environment, with the first Marine Extractive Reserve (MER) established in 1992; there are currently 22 MERs along the Brazilian coast [26,27]. The primary intention of the MERs is to protect the fisheries and livelihood of the local fishing communities through regulations on fishing practices, catch limits, or exclusion zones [25].
The intertidal mud- and sand-flat habitats that are critical to overwintering shorebirds along the northern Brazilian coast partially fall within the MERs’ boundaries [28,29]. While the primary intention of the MERs is to protect the fisheries and livelihood of the resident fishermen [25,26,27], they may present an opportunity to provide de facto protection of the habitat of migratory shorebirds. However, the effectiveness of MERs as areas of protection for the habitat of shorebirds is not necessarily clear. Identifying and characterizing the habitat of shorebirds was undertaken as a first step in elucidating the potential role of these MERs in shorebird conservation. Subsequent comparison and analysis of the species distribution model results were conducted to address three major questions:
- To what extent is the habitat of migratory shorebirds currently protected by existing Marine Extractive Reserves?
- Where are important shorebird habitat sites that exist outside current protections?
- How does shifting the conservation priorities between umbrella, flagship, and biodiversity lenses shift the selection of new protected sites?
2. Study Area and Methods
2.1. Study Area: Northern Coast of Brazil
The northern coast of Brazil (Figure 1), along the states of Pará and Maranhão, encompasses three Ramsar sites: the Baixada Maranhense site, the Reentrâncias Maranhenses site and the Amazon River and its Mangroves Ramsar site (Ramsar Convention, https://www.ramsar.org/wetland/brazil, accessed on 1 December 2022). These sites consist of “complex estuarine system[s] of extensive islands, bays, coves, and rugged coastline covered mainly by mangrove forest.” The Amazon River and its Mangrove site contain one of the largest contiguous mangrove formations in the world, consisting of 8900 km2 of mangrove forest, or approximately 70% of all mangroves in Brazil. The Reentrâncias Maranhenses, located northwest of Sao Luis, is a convoluted series of bays and inlets, critically important for migratory shorebirds, fish, manatees, and the fishing communities that subsist within the region. The Baixada Maranhenses present a complex range of ecosystems, including rivers, their floodplains and estuaries, riverine forests, swamps and lagoons. There are twelve Marine Extractive Reserves along this stretch of the northern Brazil coastline (Figure 1).
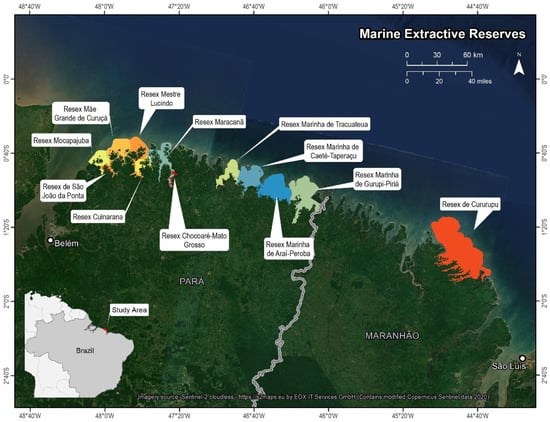
Figure 1.
Study area located on the northern coast of Brazil (area in red on insert map, bottom left), straddling the states of Pará to the west and Maranhão to the east. The 12 Extractive Reserves (MERs) or Reserva Extrativistas (Resex) are depicted in a separate color and labelled. Imagery Source: Copernicus Sentinel 2 cloudless mosaic https://s2maps.eu by EOX IT services GmbH.
2.2. Survey Methods
Wading shorebird presence and abundance surveys were conducted during the migratory stopover period between January 2016 and 2017 in northern Brazil. Survey methods consisted of point counts conducted by pairs of observers and recorders, using fixed radius plots positioned along transects, with all wading birds counted within an approximately 250 m radius of the observers (Figure 2). A 250 m radius was chosen as the maximum distance for consistently and accurately detecting and identifying shorebirds using high-power binoculars or spotting scope. Prior to the survey, observers were trained to estimate the 250 m distance using a range finder. A GPS was used to record starting point locations and record distance between subsequent points. During the survey, observers kept track of birds’ locations to reduce double counting. Transects were conducted by either walking or by boat when the shoreline was inaccessible or untraversable. Transect length and duration were determined largely by accessibility and tidal conditions during survey periods. Efforts were made to distribute transects across tidal stages and a variety of habitat types, including mangrove creeks, sand flats, mudflats and beaches. A total of 700 survey points were recorded across the study region between the two survey periods, with 60% randomly selected for model calibration and the remaining 40% for model validation (Table 1).
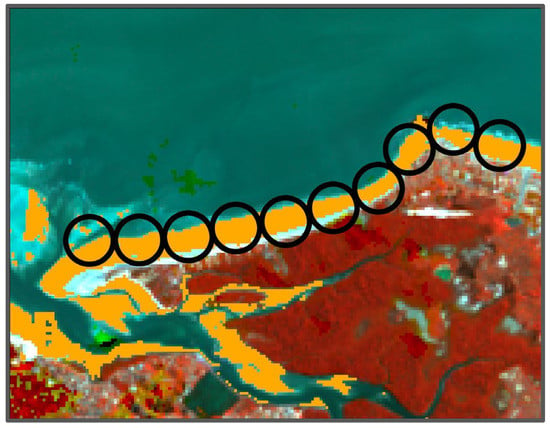
Figure 2.
Surveys consisted of 250 m radius (500 m diameter) areas (depicted as black circles) conducted along transects across beach and mud flats accessed either by boat or foot. To ensure that environmental variables sampled for plot characteristics only represented the intertidal zone, a mask (orange) was utilized to limit plot statistics to the intertidal zone.

Table 1.
Common name, four-letter alpha code, and Latin name of the eight modeled migratory shorebird species. Listed for each species is the number of presence points used in model calibration, validation, and in total, as well as the number of reserved absence points used in validation.
2.3. Environmental Parameters
Remote sensing has been utilized to map the intertidal zone and to characterize sediment type using a variety of platforms and analytical methods [30,31,32,33,34,35,36,37]. The resulting intertidal habitat maps then serve as input to shorebird species distribution models. Rather than employing this two-step process, the remotely sensed reflectance values were used as direct inputs to the species distribution models. Two sources of remote sensing data were utilized to characterize the intertidal sediment: Landsat 8 Surface Reflectance Code (LaSRC) imagery products (https://www.usgs.gov/media/files/landsat-8-surface-reflectance-code-lasrc-product-guide, accessed on 1 December 2022), and the vertical-vertical (VV) and vertical-horizontal (VH) polarized C-band images from the Sentinel 1 C-SAR Level-1 Ground Range Detected products (https://sentinels.copernicus.eu/web/sentinel/home, accessed on 1 December 2022).
Landsat 8 imagery selection was limited due to significant cloud cover over northern equatorial Brazil. Because of this, no preference was given to the date or time of year for each image, only for cloud percentage and tidal stage, with dates ranging from 2013 to 2018. To compensate, multiple images for each scene were acquired, with clouds and cloud shadows removed using methods outlined by Martinuzzi et al. [38] and subsequent gaps filled by additional imagery. Composite images were created for both high tide and low tide imagery for each scene in the Brazilian study region, then mosaicked together to create a site-wide image for an analysis that encompassed seven Landsat reference tiles, or approximately 207,000 square kilometers. Three low-tide Sentinel 1 images from 2017 were acquired for each scene across the study area. A 3 × 3 mean filter was used for noise reduction, and then images were coarsened to 30 m pixels to match the resolution of the Landsat data. The mean and standard deviation of pixel values for each remote sensing band were extracted for use in the Maxent species distribution model.
For each scene, the mean pixel value of the three processed images was used to account for minor variations in tidal stage, orthorectified to the Landsat 8 data, then mosaicked together, resulting in a low tide vertical-vertical image and vertical-horizontal image for the study region. For all images, the tidal stage was determined by the methods outlined by Murray et al. [39], using Oregon State University’s Tidal Model [40], the date and time of each image’s acquisition, and a user-established reference point for each scene. The Oregon State University Tidal Model is a generalized inverse model of barotropic ocean tides, with versions designed for both global and select regional scales (http://volkov.oce.orst.edu/tides/, accessed on 1 December 2022). One of the regions with a specifically calibrated tidal model was the Amazonian drainage basin, where the Brazil study is located. Methods developed by Murray et al. [39] using optical remote sensing data, Normalized Difference Water Index, and differencing between high-tide and low-tide images were used to extract the intertidal zone.
Climate variables were extracted from the WorldClim data set [41,42]. These included mean average temperature, lowest minimum temperature, highest maximum temperature, mean average solar radiation, mean average precipitation and mean average wind speed.
A series of landscape metrics thought to potentially influence shorebird habitat quality were derived for inclusion as independent variables in the Maxent models (Figure 3). These variables included raster grid cell maps of distance to a river mouth, distance to human development, distance to mangroves, degree of tidal exposure and year-to-year permanence of the intertidal habitat. For more information on the rationale as well as the methods employed to derive these landscape metrics, please refer to Appendix A.
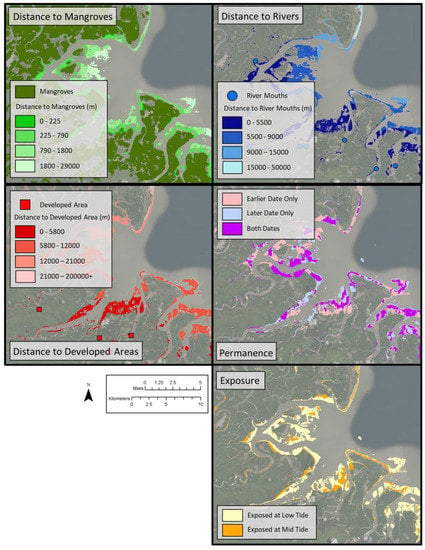
Figure 3.
Sample area illustrating the five landscape metrics within the intertidal zone.
2.4. Species Distribution Modeling
Developing a species distribution model (SDM) begins with observations of species occurrences and incorporates environmental variables thought to influence habitat suitability and, therefore, species distribution [43,44]. The objective of the SDM is to predict the potential geographical distribution of the species in the form of a predictive map. Presence-only-based distribution models for the intertidal foraging habitat of each of the eight species were derived using a maximum entropy modeling approach via the MaxEnt software package (version 3.4.1) (https://biodiversityinformatics.amnh.org/open_source/maxent/, accessed on 1 December 2022). MaxEnt estimates the probability of presence conditioned on the environment using presence-only data [45]. Environmental variables for the models consisted of landscape metrics (distance to rivers, distance to developed areas, distance to mangroves, tidal exposure, and tidal permanence), remote sensing metrics that characterized the intertidal sediment (seven bands of optical, near-infrared, and short wave infrared from the Landsat 8 platform, and two bands of vertical-horizontal and vertical-vertical polarized C-band synthetic aperture radar from the Sentinel 1 platform), as well as climatic variables from the WorldClim data set for a total of twenty-nine input variables. To match the scale of survey plots and input data to projected data, environmental layers were generated using 250 m radius moving window filters and the original layers. For example, each remote sensing band had two layers, one where each 30 m pixel represented the mean of all 30 m pixels within a 250 m radius in the original raster; another where each 30 m pixel represented the standard deviation of all 30 m pixels within a 250 m radius.
MaxEnt estimates the probability of presence starting with the ratio of the conditional density of the covariates at the presence sites and the unconditional density of covariates across the whole landscape using an exponential model. The output is transformed into a logistic model, with the transformed prevalence value (transformed to “Tau”) arbitrarily set to a constant of 0.5 [46]. We used a leave-one-out cross-validation approach where the calibration occurrence data (60% of all data) is randomly split into 10 equal-sized “folds”; the model is run 10 times with a different fold left out each time for evaluation, and then the average of all runs is used in the final evaluation. To reduce the overfitting of the model, a ‘bias’ file was generated using the 250 m buffered survey points. Bias layers act as exclusionary regions by MaxEnt when generating the background samples where the background data is sampled from within the surveyed areas so that the pseudo-absence background data has the same sample biases as the survey data itself.
MaxEnt evaluates each variable within the model based on the metrics of “percent contribution” and “permutation importance”. Percent contribution is derived during the iterative model training process, where variables contribute either negatively or positively to model response each iteration, with these contributions summarized by the percent contribution value. Permutation importance is derived when training presence and background variable data are randomly permutated, with subsequent models evaluated based on the drop in training area under the curve (AUC) scores, normalized as percentages. In other words, each variable is evaluated by assigning a random value to it and seeing how poorly the models function with the randomly assigned value compared to the actual data. The two metrics, percent contribution and permutation importance can then be used to interpret the importance of different variables for model function [44,45,46].
A common approach to overall model evaluation uses measures of predictive success, specifically the AUC scores generated by MaxEnt. Receiver operator curves (ROC) are generated by plotting model sensitivity (proportion of correctly classified presence) as a function of commission error using not true absences but pseudo-absences generated from background data. AUC scores serve as summaries of these plots, indicating the probability that true presence will have a higher model output than a true absence or, in the case of MaxEnt, a pseudo-absence [45]. AUC scores can be useful tools for discriminating between models, though some criticism points out that, unlike other metrics of model performance (e.g., AIC, BIC), AUC does not penalize models for the numbers of variables it uses [47]. In other words, AUC scores do not prioritize parsimony and can result in exceptionally complex models whose biological significance is difficult to determine. Elith et al. [46] suggest that AUC scores should be greater than 0.75 for models to serve as a useful discrimination of presence.
2.5. Validation
Outputs of Maxent models were summarized for the area within each of the 40% of survey records reserved as validation points. For most species, validation data was split into presence points, where the respective species were observed, and absence points, where the species was not observed (Table 1). Welch’s t-test was used to determine if the mean predicted probability of presence (the Maxent output) values for the presence points were significantly different from the mean Maxent values for the absence point. Welch’s t-test is designed for populations with unequal variances but does assume a normal distribution of values within the population. This approach to validation was repeated for each species model, with their respective presence and absence points. Because of its small sample size, the red knot was the only species that did not have separate validation presence data. Instead, all of the presence data was used as a calibration and was tested against the absence validation data.
2.6. Thresholding Predicted Specie Presence
The predicted probability of presence derived by MaxEnt is not an absolute value but rather relative to the model itself. The pixel with a value of 0.3 for “Species A” may not be as important as the same pixel value for a model of “Species B” [45]. In order to more directly compare the predicted distributions, the continuous model output can be converted into the binary categories of “predicted presence” (1) or “predicted absence” (0) using thresholds based on model performance metrics. There are a number of metrics used, but the most common is the equal training sensitivity and specificity metric derived by MaxEnt. Equal training sensitivity and specificity aim to balance errors of commission and omission with model outputs above the threshold considered presence pixels (1), while values below are considered absence pixels (0) [48]. Predicted presence raster maps were created for each of the eight shorebird species of interest using a 30 m grid cell size. A species richness map was generated by compositing all eight individual species models to determine how many species were predicted to be present for each grid cell (i.e., the number of target shorebird species for which that grid cell was designated as a suitable habitat) [49].
2.7. Comparing Conservation Strategies
The areal amount and spatial pattern of habitat that would be prioritized for shorebird conservation were determined for three different approaches to conservation prioritization, namely flagship species, umbrella species, and biodiversity. The threshold-derived binary raster map for the presence of the red knot was used for the flagship species strategy. Similarly, the threshold-derived binary raster map of presence for the semipalmated sandpiper served as the basis for the umbrella species strategy. The species richness map served as the basis for evaluating the locations that served as habitats for the greatest diversity of shorebird species. Grid cells with five or more species were classified as a high priority. These layers were then used to assess how much habitat was protected underneath each scenario across the whole landscape and within the Marine Extractive Reserves. Due to its special conservation status as a threatened species, the amount of predicted red knot habitat under the umbrella and biodiversity conservation strategies were also assessed (note that as red knot served as the flagship species, this was already quantified under the flagship conservation strategy).
2.8. Identifying New Conservation Zones
Overlaying the coverages of each conservation approach resulted in rasters for each modeling method where each pixel represents whether or not one, two, or all three approaches designated that pixel as an important habitat, as well as the specific combination of conservation scenarios. Using these rasters and image interpretation, a gap analysis [50] was undertaken to identify areas outside of existing Marine Extractive Reserve protections (Figure 2) that appeared to have a high proportion of protected area based on the flagship, umbrella, and/or biodiversity conservation strategies. An area-weighted species richness was calculated by multiplying the area of each richness category by the richness value and dividing it by the total intertidal area within the delineated conservation zone boundary.
3. Results
3.1. Model AUC and Validation Results
Four of the species models (BBPL, RUTU, WHIM, WILL; Table 2) had AUC scores above the suggested minimum for useful discrimination of 0.75 [51]. The remaining four species had AUC scores just below the threshold (0.718–0.744). Seven out of the eight models, with the exception of BBPL, passed Welch’s t-test validation test with a mean predicted probability of presence higher in presence points compared to absence points of the reserved validation data (Table 2).
Table 2.
AUC scores and t-test comparing presence and absence points of reserved validation data. Shaded boxes indicate models with AUC scores greater than the 0.75 threshold suggested for useful discrimination of presence. Shaded boxes in the t-test column indicate models that passed the validation test with a mean predicted probability of presence higher in presence points compared to absence points of the reserved validation data.
3.2. Analysis of Shorebird Habitat within Marine Extractive Reserves
The MERs cover 347 km2 out of a total of 1337 km2 of mapped intertidal habitat (Table 3), which equates to approximately 26%. Approximately 20% of the area (261 km2) was not identified as a habitat for any of the target shorebird species (Table 3). As might be expected, the area predicted as shorebird habitat declined with species number, i.e., areas predicted to serve as habitat for all eight species were much rarer than areas predicted to serve as habitat for only one or two species. MERs protected approximately ~25% of the area for each level of species richness (one through seven) and somewhat higher for a richness of eight (Table 3). The weighted species richness for the MERs was calculated to be 2.89 as compared to 1.89 for the broader intertidal habitat area as a whole.
Table 3.
Number of Shorebird species habitat present as predicted from Maxent models. Zero indicates that zero species had the pixel designated as habitat, while eight indicates eight species had the pixel designated as habitat.
3.3. Comparison of Conservation Strategies
Marine Extractive Reserves protected approximately 44%, 17%, and 22% of the areas designated as important by the flagship, umbrella, and biodiversity approaches, respectively (Table 4). The High Biodiversity approach had a weighted species richness of 5.83 compared to the 4.35 and 3.23 for the Umbrella and Flagship approaches, respectively (Table 4). The Umbrella approach protected slightly more red knot habitats than the High Biodiversity approach, at 35% vs. 27%, respectively. The different conservation strategies resulted in different, often overlapping, coverages. The categories with the broadest spatial extent were solely designated as habitat by the umbrella approach (223 km2 or 35.5%, Figure 4), followed by areas designated as important by both richness and umbrella (197 km2 or 31.3%, Figure 4) and finally flagship (121 km2 or 19.4%, Figure 4). Only 7.2% (45 km2) of habitat was considered important by all three conservation strategies (Figure 4).
Table 4.
Area of habitat inside and outside the Marine Extractive Reserves (MERs) that would be designated as important based on either the flagship approach (red knots, REKN), the umbrella species approach (semipalmated sandpipers, SESA), or a biodiversity approach (species richness ≥ 5). Total predicted red knot (REKN) intertidal foraging habitat covered and area-weighted species richness under each approach, both in and out of MER.
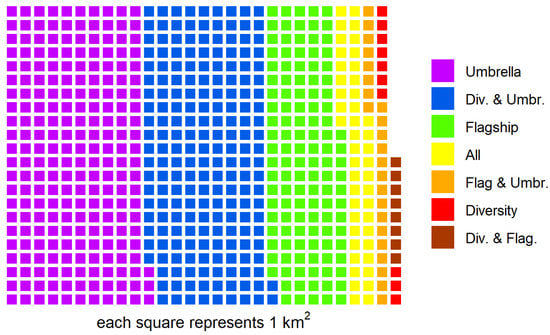
Figure 4.
Relative composition of the sum total intertidal habitat area designated by the different management approaches.
3.4. Identifying New Conservation Zones
A gap analysis identified three areas outside of the existing Marine Extractive Reserves that contained significant shorebird habitat under the different management scenarios. Baía do Cumã is found between the municipalities of Guimaraes and Alcantara in Maranhão state and has approximately 35.5 km2 of intertidal habitat. Though only a small portion is designated as important habitat by flagship red knot models, the species richness for the region is high (Table 5). Baía de São José is found to the southeast of São Luís, the state capital of Maranhão, and has approximately 90 km2 of total intertidal habitat. Baía do Cumã, has a significant amount of habitat valued for the umbrella species, the semipalmated sandpiper (Table 5). Finally, directly adjacent to the largest existing marine extractive reserve, Resex Cururupu, is an area consisting of several islands that have a significant portion, 98 km2, of intertidal area designated as important habitat by the flagship red knot model (approximately 31 km2, or 32%, Table 5).
Table 5.
Area of each potential conservation zone delineated by conservation strategy.
4. Discussion
The two metrics of model efficacy, AUC and t-test comparing presence-absence validation points, did not always corroborate each other. For example, black-bellied plover models had reasonably high AUC scores but failed to distinguish between presence and absence validation data (Table 2). While only four of the eight species had AUC scores above the 75% threshold, seven of the eight had significant t-test scores. One possible explanation for the discrepancy in the two metrics of model efficacy is the bias layer that was utilized to prevent overfitting. A bias mask layer can be used in the Maxent package to compensate for areas that were oversampled by the survey effort, typically a mask of the survey area itself or occurrence data of taxonomically related species. In this case, surveys were typically conducted in areas that were easier to access via boat or walking. Areas outside the mask are then excluded from the background sampling, ensuring that the background pseudoabsences have the same sample biases as the occurrence data [52]. It is possible that our bias file may be overcompensating, as models run without the bias file had much higher AUC scores that more closely aligned with the t-test of the validation points.
With the goal of presence-only models accurately predicting the presence of a species, we more heavily weighted Welch’s t-test as our primary model evaluation metric as this metric more closely reflected the effectiveness of models in discriminating between presence and absence points. Given the challenges around model evaluation, further external validation of these models would be advisable and possible with reference to previously conducted aerial surveys [53] or even data from geolocators used in tracking migration patterns [54]. However, there may be challenges matching the scale of models based on point-count surveys with that of aerial surveys or geolocators designed for tracking continent-spanning movement. Confirmation of modeled distributions with independent, spatially explicit point count surveys may be advisable before significant resources are dedicated to conservation decisions based on this approach. Despite this caution, it can be said with confidence that the delineated extents of shorebird distributions demonstrate significant differences between presence and absence points for most species, making a strong case for any inferences regarding shorebird distributions under different conservation scenarios across northern Brazil.
Evaluating simple coverage under the umbrella, flagship and biodiversity strategies is necessary before addressing the primary research questions: the extent of habitat protected by existing MERs, important sites outside of current protections, and how changing between strategies changes site selection. Very little of the total landscape was highly species-rich, with areas achieving a predicted species richness of seven covering approximately 48 km2 (less than 4%, Table 3), even less so for all eight species (less than 1%, Table 3). Similar patterns of coverage emerge between the three conservation scenarios across both modeling regimes. The flagship approach is the most restrictive (~225 km2), the umbrella the widest (~470 km2), and the biodiversity approach is similar to the flagship (~250 km2) (Table 4). This generally follows the convention that the relatively small population of flagship red knots would have a more restrictive range than a high-population, generalist species such as the umbrella semipalmated sandpipers [1,22]. The extent of these coverages differs significantly, particularly when considering the overlap between all three. A majority of flagship (61% in both models) and a significant portion of umbrella coverage (~43% for both models) is found in isolation from the other management regimes. Less than 10% of the total area designated by any of the regimes is protected by all three (Figure 4). This is problematic when considering how the umbrella species and biodiversity approaches protect the numerically sensitive red knots. Umbrella species protect only ~35% of the delineated red knot habitat, with biodiversity even more restricted to ~27% (Table 4).
Only a small proportion of the intertidal landscape was predicted to be species-rich, with pixels of species richness of seven or more covering slightly 4% of the intertidal landscape (Table 3). All conservation strategies (flagship, umbrella, and biodiversity) disproportionately protected more species-rich habitats (Table 4). While not surprising for a biodiversity approach, it may be less obvious for the single species approaches. As richness increases, it would be more likely for the focal species (flagship red knot or umbrella semipalmated sandpipers) to be included in the richness count. However, the umbrella approach had an even higher preference for species richness than the biodiversity approach, which explicitly preferred species-rich habitats (richness > 4). This may be a product of semipalmated sandpipers’ broad niche and ability to utilize a wide range of habitats and resources [55]. Furthermore, previous research within the northern Brazil study site indicates that food scarcity may be a limiting factor [28], resulting in greatly overlapping niches between shorebirds. Limited resources result in more overlapping niches as species utilize the same resources, while abundant resources can lead to more distinct niches or specialization [56,57,58]. Semipalmated sandpipers’ broad use of a diversity of otherwise limited resources may result in them regularly co-occurring with more specialist species.
Evaluating the response of Maxent variables gives some insights regarding these differences in coverage based on the habitat characteristics predicted as suitable for the different species. Red knot models had higher responses to lower values of vertical-horizontal radar backscatter and higher model response closer to river mouths. Semipalmated sanderlings had a higher model response to high vertical-horizontal radar backscatter and no clear preference for distance to rivers. Radar backscatter has been shown to inversely correlate with sediment size, with increasing backscatter response as sediment size decreases in this study area [37]. This suggests that red knots prefer sand substrate (lower vertical-horizontal backscatter) with relatively frequent tidal inundation, while semipalmated sandpipers prefer mud-dominated substrates (higher vertical-horizontal backscatter). Discrepancies in habitat preference may explain the widely differing areal footprints mapped by each management perspective. These differences highlight how evaluating existing protections or identifying and prioritizing new sites solely on the spatial extent of either umbrella or biodiversity frameworks may leave more numerically and spatially restricted species, such as the flagship red knot, at risk.
Addressing the first research question regarding the extent of current protections, Marine Extractive Reserves do not cover a majority of the identified important shorebird habitats (Table 3 and Table 4). Less than a quarter of the most shorebird species-rich (i.e., five or more species) habitat areas fell within the bounds of a MER (Table 3). Less than twenty percent of the umbrella species (SESA) and somewhat better 44% of our flagship species (REKN) fell within a MER. This level of conservation protection is similar to other important stopover locations found in other flyways. In the East Asian-Australasian Flyway, approximately 23% of tidal flats in China and only 12% of flats in South Korea are protected by existing management [59]. Australia has slightly better protection continent-wide (39%), though areas most used by shorebirds may also be the least protected [60]. While a not insignificant portion of northern Brazil’s intertidal habitats fall within MERs, the MERs do not have shorebird conservation as their primary consideration.
Although MERs include important shorebird habitats, the success and effectiveness of the MER model depends on the role of local leaders and the grassroots work that institutional managers must carry out. The central issue is the recognition of territorialities and the strengthening of the social movement of extractivists (i.e., local people who live in or near and their livelihood depends on the MER) for the conservation of natural resources [26]. Current management regulations are designed to protect the local artisanal fisheries [25] such that areas currently within a MER may not be adequately managed for shorebird-centric conservation. Management designed without shorebirds in mind may leave significant risks in place to local and migratory shorebird populations. For example, shorebirds can be particularly susceptible to interruptions to foraging due to human disturbance during migratory stops [61,62]. More directly, subsistence hunting is a serious pressure on shorebird populations in the Caribbean and neighboring regions of South America, with significant annual harvests [63,64].
Ensuring cooperation with diverse stakeholders, such as local fishing communities that use beaches for vehicle transport or supplementally hunt shorebirds, is critical for the success of biodiversity conservation [65]. Furthermore, economic sustainability, particularly regarding alternative sources of income for local fishing communities, remains one of the biggest shortfalls of the MER system [27]. Education activities on the importance and needs of birds, actions to strengthen the social organization of extractivists and financial investment in sustainable economic activities based on traditional knowledge are ways to strengthen MERS, increasing their effectiveness and protecting birds. Ecotourism in other contexts has successfully provided viable, stable, and long-term alternative sources of income for communities [66,67]. Incorporation of shorebird conservation management into existing MER regulations, such as seasonal limits to vehicle use or hunting, managed and enforced by the local communities, will be an important step to protecting shorebird habitat already under the wing of current MERs and future conservation sites outside of existing protections.
Identifying and protecting important shorebird habitat areas outside of the existing MER system constitutes a complementary approach to enhancing shorebird conservation. Using the three conservation strategies (flagship, umbrella, and biodiversity), three potential areas for shorebird conservation prioritization (i.e., conservation gaps) were identified: Baía do Cumã, Baía de São José, and a region directly adjacent to the largest existing MER, Resex Cururupu. The Baía do Cumã, and Baía de São José regions stood out as having high proportions of the area identified by the umbrella and/or the biodiversity strategies but only minimal habitat for the flagship species (6.1 and 0% for Baía do Cumã, Baía de São José respectively) (Table 5). The area adjacent to Resex Cururupu stood out as containing a significant proportion of habitat designated by the flagship red knot model (32%) with only a comparatively modest percent area valued under the umbrella and biodiversity strategies (Table 5). This third area is illustrated in Figure 5 as an example; maps of the other two conservation gap areas are included in the Supplementary Materials. The intertidal habitat areas identified as suitable habitat for the flagship species, the red knot, generally consists of more exposed offshore flats, while the other two strategies identified more sheltered locations closer to the mangrove islands (Figure 5).
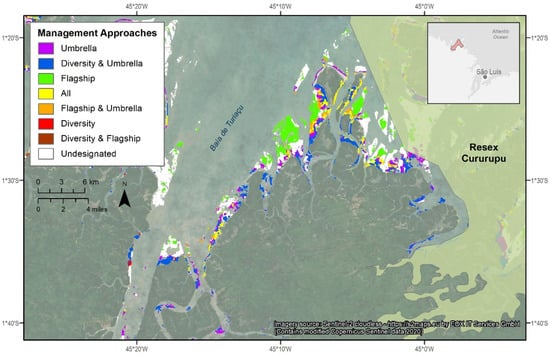
Figure 5.
The area adjacent to the existing marine extractive reserve, Resex Cururupu shown as an example of a potential shorebird conservation zone. An inset map in the bottom right shows approximate location of the conservation zone and Resex Cururupu northeast of the state capital of Maranhão, São Luís. Imagery Source: Copernicus Sentinel 2 cloudless mosaic https://s2maps.eu by EOX IT services GmbH.
Using these three locations as case study examples of locations under the different conservation strategies, we address the final question: How does shifting conservation priorities between umbrella, flagship, and biodiversity lenses shift the protected site selection? Both Baía do Cumã and Baía de São José have high coverage by the umbrella semipalmated sandpipers (86.7 and 72.3%, respectively), though Baía do Cumã has a higher species richness with 64% of its extent valued by the biodiversity approach as compared to 40% for Baía de São José (Table 5). In this example, an umbrella-only approach does not differentiate between the locations as well as the high biodiversity approach does. Neither of these sites would be considered a high priority under the flagship strategy. Under a flagship conservation priority, the area adjacent to Resex Cururupu stands out as containing significant amounts of flagship habitat but only more modest amounts of umbrella or high biodiversity habitat (Table 5). Efforts specific to protecting the red knot may prioritize similar areas at the potential cost of protecting more diverse shorebird assemblages. A hybrid approach utilizing both flagship and high biodiversity approaches could compensate for these issues. The total area covered by the hybrid approach (430 km2) is more inclusive than either flagship (248 km2) or high biodiversity (246 km2) alone, though slightly more conservative than the umbrella species perspective (460 km2). A hybrid flagship-biodiversity approach still results in considerably higher weighted species richness than the landscape as a whole (4.1 vs. 1.89), as well as 100% coverage of the species-rich areas and the rarer flagship red knots. Using this hybrid approach, the Baía do Cumã, Baía de São José, and the area west of Resex Cururupu clearly stand out as important gaps in the existing MER system.
5. Conclusions
Distribution modeling of migratory shorebird foraging habitat based on remote sensing and landscape habitat metrics successfully delineated between presence and absence locations for five of the eight target species. Marine Extractive Reserves, the current conservation paradigm in northern Brazil, protect ~25% of the intertidal habitat, comparable to other important migratory shorebird locations globally (23% in China, 12% in South Korea, 39% in Australia). Three major gaps in current protections were identified. The flagship, umbrella, and biodiversity perspectives result in different prioritizations of these distinct locations as well as more broadly across the study area. Between the three conservation strategies, the expansive umbrella approach covered the most habitat and captured reasonably high diversity; the diversity approach effectively produced diverse, if slightly more restricted areas and the flagship red knots generally protected less, both in terms of area and diversity. While umbrella and diversity approaches are successful at protecting diverse communities, community assemblages of rarer or specialist species, such as the red knots, may fall outside their protective shadows. A hybrid approach that uses both diversity and the extent of rarer species produces results that best meet the management goals of identifying gaps in existing conservation to protect the most at-risk species while conserving the diverse assemblages they coexist with.
Supplementary Materials
The following supporting information can be downloaded at: https://www.mdpi.com/article/10.3390/rs15020452/s1, Figure S1: Map of potential conservation zone, Baía do Cumã. Figure S2: Map of potential conservation zone, Baía de São José.
Author Contributions
The authors’ key contributions to this paper are as follows: conceptualization, D.M. and R.G.L.; methodology, D.M. and R.G.L.; software, D.M.; validation, D.M.; formal analysis, D.M.; investigation, L.N., S.F., D.P., C.D.S., J.A.M.S., A.D., R.G.L., D.M.; resources, D.P.; data curation, D.M.; writing—original draft preparation, D.M.; writing—review and editing, R.G.L., C.D.S., D.P., L.N. and J.A.M.S.; visualization, D.M.; project administration, S.F.; funding acquisition, L.N. All authors have read and agreed to the published version of the manuscript.
Funding
This research was funded by Neotropical Migratory Bird Conservation Act of 2000, Grant #F15AP00964, with additional support from the National Fish and Wildlife Foundation and the Conserve Wildlife Foundation of New Jersey. C.D.S. was supported by the Portuguese Foundation for Science and Technology through funds attributed to CESAM (grants: UIDP/50017/2020, UIDB/50017/2020 and LA/P/0094/2020). Research work in Brazil was carried out under PORTARIA MCT no. 162 de 25/fev/2016 and SISBIO 42418.
Data Availability Statement
The data presented in this study are accessible through the Rutgers University Library SOAR: Scholarly Open Access at Rutgers https://soar.libraries.rutgers.edu/, accessed on 1 December 2022.
Acknowledgments
We would like to acknowledge the invaluable assistance of Mark Peck, Humphrey Sitters, Yann Rochepault, Christophe Buidin, and the staff ICMBio (Brazil) in conducting the bird and habitat surveys. John Bognar, Jim Trimble and Rachael Sacatelli of the Rutgers University Center for Remote Sensing and Spatial Analysis provided help in the data and image processing and graphics production. We greatly appreciate the comments provided by four reviewers helping to strengthen this manuscript.
Conflicts of Interest
The authors declare no conflict of interest. The funders had no role in the design of the study; in the collection, analyses, or interpretation of data; in the writing of the manuscript; or in the decision to publish the results.
Appendix A
Further information on the landscape metrics derived for inclusion as independent variables in the Maxent models:
- Distance to rivers
Rivers can influence both the nutrient content [68] and sediment composition [69] of coastal ecosystems. The freshwater, nutrient and sediment inputs can influence invertebrate distributions, subsequently, shorebird distributions [70,71,72]. To account for this possibility, a point was digitized for every river that empties into the study region, determined using hydrological data and visual interpretation of satellite data, resulting in 228 points representing different river mouths. Using these points, a Euclidean distance raster was generated to estimate the distance from a river mouth.
- Distance to developed areas
Disturbance from human activities could influence shorebird foraging behavior and subsequent distributions across intertidal flats [61,62,73]. As a proxy for disturbance potential, a raster of Euclidean distance to developed areas was generated. Developed areas were determined through satellite image interpretation, aided by Brazilian census data. Regions with significant populations and noticeable footprints, typically villages with a number of buildings and permanent infrastructure like docks and powerlines, were represented by digitized points where developed areas intersected with coastal habitat. The mean distance of each plot was used in the model.
- Distance to mangroves
Mangroves are often utilized by a variety of shorebird species as a refuge or roosting habitat. Proximity to mangroves has been demonstrated in previous research as an important component in habitat choice for some shorebird species in some migratory locations [74,75]. Mangroves are a dominant component of the landscape in northern Brazil, and earlier work in the region indicates that they may play an important role there as well [28]. The mean distance was calculated for each plot and utilized in the Maxent model.
- Tidal exposure
How often different segments of a tidal flat are exposed throughout a tidal period may also influence shorebird foraging patterns [76,77]. To estimate what portions of flats are exposed at low and mid tides, additional imagery taken at mid-tide was acquired and processed in the same fashion as described above to isolate the intertidal zone. This, combined with the low tide intertidal area already isolated, resulted in a raster where the intertidal zone was differentiated into two categories: areas exposed at low tide and areas exposed at mid-tide. The most common value of each plot was then used as the habitat metric.
- Permanence
Permanence, or the approximate likelihood of any given patch of intertidal zone existing from one year to the next, may be an important characteristic that species use to determine habitat value. Site fidelity, or individuals using the same location from one year to the next, is highly prevalent in some overwintering locations for some species of migratory shorebirds [78,79]. A crude metric of permanence was developed based on the intertidal imagery accrued for this project. For each pixel, the intertidal zone was delineated in two images, one from an earlier date and one from a later date. Because of the challenges associated with cloud-free, tide-specific image acquisition at the site, replicating consistent dates or even date ranges was impossible. As such, “old” and “new” imagery ranged between 1 and 3 years apart in age. Each pixel was then categorized as: present only in the earlier image (1), present only in the later image (2), or present in both earlier and later images (3). The mode or most common value was then calculated for each plot.
References
- Colwell, M.A. Shorebird Ecology, Conservation, and Management; University of California Press: Berkeley, CA, USA, 2010. [Google Scholar]
- Niles, L.J.; Burger, J.; Porter, R.R.; Dey, A.D.; Minton, C.D.; González, P.M.; Baker, A.J.; Fox, J.W.; Gordon, C. First results using light level geolocators to track Red Knots in the Western Hemisphere show rapid and long intercontinental flights and new details of migration pathways. Wader Study Group Bull. 2010, 117, 123–130. [Google Scholar]
- Gratto-Trevor, C.; Morrison, R.I.G.; Mizrahi, D.; Lank, D.B.; Hicklin, P.; Spaans, A.L. Migratory Connectivity of Semipalmated Sandpipers: Winter Distribution and Migration Routes of Breeding Populations. Waterbirds 2012, 35, 83–95. [Google Scholar] [CrossRef]
- Brown, S.; Gratto-Trevor, C.; Porter, R.; Weiser, E.; Mizrahi, D.; Bentzen, R.; Boldenow, M.; Clay, R.; Freeman, S.; Giroux, M.-A.; et al. Migratory connectivity of Semipalmated Sandpipers and implications for conservation. Condor 2017, 119, 207–224. [Google Scholar] [CrossRef]
- Warnock, N. Stopping vs. staging: The difference between a hop and a jump. J. Avian Biol. 2010, 41, 621–626. [Google Scholar] [CrossRef]
- Mizrahi, D.S.; Peters, K.A.; Hodgetts, P.A. Energetic Condition of Semipalmated and Least Sandpipers during Northbound Migration Staging Periods in Delaware Bay. Waterbirds 2012, 35, 135–145. [Google Scholar] [CrossRef]
- Piersma, T.; Lindström, Å. Migrating shorebirds as integrative sentinels of global environmental change: Shorebirds integrate global environmental information. Ibis 2004, 146, 61–69. [Google Scholar]
- Clemens, R.; Rogers, D.I.; Hansen, B.D.; Gosbell, K.; Minton, C.D.T.; Straw, P.; Bamford, M.; Woehler, E.J.; Milton, D.A.; Weston, M.A.; et al. Continental-scale decreases in shorebird populations in Australia. Emu-Austral Ornithol. 2016, 116, 119–135. [Google Scholar] [CrossRef]
- Studds, C.E.; Kendall, B.E.; Murray, N.J.; Wilson, H.B.; Rogers, D.I.; Clemens, R.S.; Gosbell, K.; Hassell, C.J.; Jessop, R.; Melville, D.S.; et al. Rapid population decline in migratory shorebirds relying on Yellow Sea tidal mudflats as stopover sites. Nat. Commun. 2017, 8, 14895. [Google Scholar] [CrossRef]
- Bart, J.; Brown, S.; Harrington, B.; Morrison, R.I.G. Survey trends of North American shorebirds: Population declines or shifting distributions? J. Avian Biol. 2007, 38, 73–82. [Google Scholar] [CrossRef]
- Andres, B.A.; Gratto-Trevor, C.; Hicklin, P.; Mizrahi, D.; Morrison, R.I.G.; Smith, P.A. Status of the Semipalmated Sandpiper. Waterbirds 2012, 35, 146–148. [Google Scholar] [CrossRef]
- Baker, A.J.; González, P.M.; Piersma, T.; Niles, L.J.; Nascimento, I.D.L.S.D.; Atkinson, P.; Clark, N.A.; Minton, C.D.T.; Peck, M.K.; Aarts, G. Rapid population decline in red knots: Fitness consequences of decreased refuelling rates and late arrival in Delaware Bay. Proc. R. Soc. B Biol. Sci. 2004, 271, 875–882. [Google Scholar] [CrossRef]
- Burger, J.; Niles, L.J.; Porter, R.R.; Dey, A.D.; Koch, S.L.; Gordon, C. Migration and Over-Wintering of Red Knots (Calidris canutus rufa) along the Atlantic Coast of the United States. Condor 2012, 114, 302–313. [Google Scholar] [CrossRef]
- Smith, J.A.M.; Niles, L.J.; Hafner, S.; Modjeski, A.; Dillingham, T. Beach restoration improves habitat quality for American horseshoe crabs and shorebirds in the Delaware Bay, USA. Mar. Ecol. Prog. Ser. 2020, 645, 91–107. [Google Scholar] [CrossRef]
- Burger, J.; Niles, L.; Jeitner, C.; Gochfeld, M. Habitat risk: Use of intertidal flats by foraging red knots (Calidris canutus rufa), ruddy turnstones, (Arenaria interpres), semipalmated sandpipers (Calidris pusilla), and sanderling (Calidris alba) on Delaware Bay beaches. Environ. Res. 2018, 165, 237–246. [Google Scholar]
- Niles, L.; Cooper Ornithological Society. Status of the Red Knot (Calidris canutus rufa) in the Western Hemisphere; Cooper Ornithological Society: Camarillo, CA, USA, 2008. [Google Scholar]
- Shrader-Frechette, K.S.; McCoy, E.D. Method in Ecology: Strategies for Conservation; Cambridge University Press: Cambridge, UK; New York, NY, USA, 1993. [Google Scholar]
- Wilcove, D. Getting Ahead of the Extinction Curve. Ecol. Appl. 1993, 3, 218–220. [Google Scholar] [CrossRef]
- Simberloff, D. Flagships, umbrellas, and keystones: Is single-species management passé in the landscape era? Biol. Conserv. 1998, 83, 247–257. [Google Scholar]
- Caro, T.M.; O’Doherty, G. On the Use of Surrogate Species in Conservation Biology. Conserv. Biol. 1999, 13, 805–814. [Google Scholar] [CrossRef]
- Myers, N.; Mittermeier, R.A.; Mittermeier, C.G.; da Fonseca, G.A.B.; Kent, J. Biodiversity hotspots for conservation priorities. Nature 2000, 403, 853–858. [Google Scholar] [CrossRef]
- Rodrigues, A.A.F. Seasonal Abundance Of Neartic Shorebirds In The Gulf Of Maranhão, Brazil. J. Field Ornithol. 2000, 71, 665–675. [Google Scholar] [CrossRef]
- Argo, A. Crash: A Tale of Two Species; Public Broadcasting Service: Crystal City, VA, USA, 2008. [Google Scholar]
- US Fish and Wildlife Service. Endangered and Threatened Wildlife and Plants; Proposed Threatened Status for the Rufa Red Knot (Calidris canutus rufa). 2013. Available online: https://www.gpo.gov/fdsys/pkg/FR-2013-09-30/pdf/2013-22700.pdf (accessed on 1 December 2022).
- De Moura, R.L.; Minte-Vera, C.V.; Curado, I.B.; Francini-Filho, R.B.; Rodrigues, H.D.C.L.; Dutra, G.F.; Alves, D.C.; Souto, F.J.B. Challenges and Prospects of Fisheries Co-Management under a Marine Extractive Reserve Framework in Northeastern Brazil. Coast. Manag. 2009, 37, 617–632. [Google Scholar] [CrossRef]
- Pimentel, M.A.S. Comunidades tradicionais em reservas extrativistas marinhas no estado do Pará: Conflitos e resistências. Ambientes 2019, 1, 191–218. [Google Scholar]
- Santos, C.Z.; Schiavetti, A. Assessment of the management in Brazilian Marine Extractive Reserves. Ocean Coast. Manag. 2014, 93, 26–36. [Google Scholar] [CrossRef]
- Kober, K.; Bairlein, F. Habitat Choice and Niche Characteristics Under Poor Food Conditions. A Study on Migratory Nearctic Shorebirds in the Intertidal Flats of Brazil. Ardea 2009, 97, 31–42. [Google Scholar] [CrossRef]
- Mu, T.; Wilcove, D.S. Upper tidal flats are disproportionately important for the conservation of migratory shorebirds. Proc. R. Soc. B Boil. Sci. 2020, 287, 20200278. [Google Scholar] [CrossRef]
- Yates, M.; Jones, A.; McGrorty, S.; Goss-Custard, J. The Use of Satellite Imagery to Determine the Distribution of Intertidal Surface Sediments of The Wash, England. Estuarine Coast. Shelf Sci. 1993, 36, 333–344. [Google Scholar] [CrossRef]
- Rainey, M.; Tyler, A.; Gilvear, D.; Bryant, R.; McDonald, P. Mapping intertidal estuarine sediment grain size distributions through airborne remote sensing. Remote Sens. Environ. 2003, 86, 480–490. [Google Scholar] [CrossRef]
- van der Wal, D.; Herman, P.M.; Dool, A.W.-V.D. Characterisation of surface roughness and sediment texture of intertidal flats using ERS SAR imagery. Remote Sens. Environ. 2005, 98, 96–109. [Google Scholar] [CrossRef]
- van der Wal, D.; Herman, P.M.J. Regression-based synergy of optical, shortwave infrared and microwave remote sensing for monitoring the grain-size of intertidal sediments. Remote Sens. Environ. 2007, 111, 89–106. [Google Scholar] [CrossRef]
- Gade, M.; Melchionna, S.; Stelzer, K.; Kohlus, J. Multi-frequency SAR data help improving the monitoring of intertidal flats on the German North Sea coast. Estuarine Coast. Shelf Sci. 2014, 140, 32–42. [Google Scholar] [CrossRef]
- Zhang, K.; Dong, X.; Liu, Z.; Gao, W.; Hu, Z.; Wu, G. Mapping Tidal Flats with Landsat 8 Images and Google Earth Engine: A Case Study of the China’s Eastern Coastal Zone circa 2015. Remote Sens. 2019, 11, 924. [Google Scholar] [CrossRef]
- Henriques, M.; Catry, T.; Belo, J.R.; Piersma, T.; Pontes, S.; Granadeiro, J.P. Combining Multispectral and Radar Imagery with Machine Learning Techniques to Map Intertidal Habitats for Migratory Shorebirds. Remote Sens. 2022, 14, 3260. [Google Scholar] [CrossRef]
- Lathrop, R.G.; Merchant, D.; Niles, L.; Paludo, D.; Santos, C.D.; Larrain, C.E.; Feigin, S.; Smith, J.; Dey, A. Multi-Sensor Remote Sensing of Intertidal Flat Habitats for Migratory Shorebird Conservation. Remote Sens. 2022, 14, 5016. [Google Scholar] [CrossRef]
- Martinuzzi, S.; Gould, W.A.; Gonzalez, O.M.R. Creating Cloud-Free Landsat ETM+ Data Sets in Tropical Landscapes: Cloud and Cloud-Shadow Removal; U.S. Department of Agriculture, Forest Service, International Institute of Tropical Forestry Gen. Tech. Rep.: Washington, DC, USA, 2007.
- Murray, N.J.; Phinn, S.R.; Clemens, R.S.; Roelfsema, C.M.; Fuller, R.A. Continental Scale Mapping of Tidal Flats across East Asia Using the Landsat Archive. Remote Sens. 2012, 4, 3417–3426. [Google Scholar] [CrossRef]
- Egbert, G.D.; Erofeeva, S.Y. Efficient Inverse Modeling of Barotropic Ocean Tides. J. Atmos. Ocean. Technol. 2002, 19, 183–204. [Google Scholar] [CrossRef]
- Harris, I.; Jones, P.D.; Osborn, T.J.; Lister, D.H. Updated high-resolution grids of monthly climatic observations—The CRU TS3.10 Dataset. Int. J. Climatol. 2014, 34, 623–642. [Google Scholar] [CrossRef]
- Fick, S.E.; Hijmans, R.J. WorldClim 2: New 1-km spatial resolution climate surfaces for global land areas. Int. J. Climatol. 2017, 37, 4302–4315. [Google Scholar] [CrossRef]
- Guisan, A.; Zimmermann, N.E. Predictive habitat distribution models in ecology. Ecol. Model. 2000, 135, 147–186. [Google Scholar] [CrossRef]
- Elith, J.; Leathwick, J.R. Species Distribution Models: Ecological Explanation and Prediction Across Space and Time. Annu. Rev. Ecol. Evol. Syst. 2009, 40, 677–697. [Google Scholar] [CrossRef]
- Phillips, S.J.; Anderson, R.P.; Schapire, R.E. Maximum entropy modeling of species geographic distributions. Ecol. Model. 2006, 190, 231–259. [Google Scholar] [CrossRef]
- Elith, J.; Phillips, S.J.; Hastie, T.; Dudík, M.; Chee, Y.E.; Yates, C.J. A statistical explanation of MaxEnt for ecologists: Statistical explanation of MaxEnt. Divers. Distrib. 2011, 17, 43–57. [Google Scholar] [CrossRef]
- Golicher, D.; Ford, A.; Cayuela, L.; Newton, A. Pseudo-absences, pseudo-models and pseudo-niches: Pitfalls of model selection based on the area under the curve. Int. J. Geogr. Inf. Sci. 2012, 26, 2049–2063. [Google Scholar] [CrossRef]
- Cao, Y.; DeWalt, R.E.; Robinson, J.L.; Tweddale, T.; Hinz, L.; Pessino, M. Using Maxent to model the historic distributions of stonefly species in Illinois streams: The effects of regularization and threshold selections. Ecol. Model. 2013, 259, 30–39. [Google Scholar] [CrossRef]
- Holmes, I.; McLaren, K.; Wilson, B. Niche modeling for management-ready information in little-studied, threatened frog species assemblages. J. Nat. Conserv. 2015, 28, 26–34. [Google Scholar] [CrossRef]
- Scott, J.M.; Davis, F.; Csuti, B.; Noss, R.; Butterfield, B.; Groves, C.; Anderson, H.; Caicco, S.; D’Erchia, F.; Edwards, T.C.; et al. Gap Analysis: A Geographic Approach to Protection of Biological Diversity. Wildl. Monogr. 1993, 123, 3–41. [Google Scholar]
- Elith, J.H.; Graham, C.P.H.; Anderson, R.P.; Dudík, M.; Ferrier, S.; Guisan, A.; Hijmans, R.J.; Huettmann, F.; Leathwick, J.R.; Lehmann, A.; et al. Novel methods improve prediction of species’ distributions from occurrence data. Ecography 2006, 29, 129–151. [Google Scholar] [CrossRef]
- Phillips, S.J.; Dudík, M.; Elith, J.; Graham, C.; Lehmann, A.; Leathwick, J.; Ferrier, S. Sample selection bias and presence-only distribution models: Implications for background and pseudo-absence data. Ecol. Appl. 2009, 19, 181–197. [Google Scholar] [CrossRef]
- Morrison, R.I.G.; Mizrahi, D.S.; Ross, R.K.; Ottema, O.H.; de Pracontal, N.; Narine, A. Dramatic Declines of Semipalmated Sandpipers on their Major Wintering Areas in the Guianas, Northern South America. Waterbirds 2012, 35, 120–134. [Google Scholar] [CrossRef]
- Smith, J.A.M.; Regan, K.; Cooper, N.W.; Johnson, L.; Olson, E.; Green, A.; Tash, J.; Evers, D.C.; Marra, P.P. A green wave of saltmarsh productivity predicts the timing of the annual cycle in a long-distance migratory shorebird. Sci. Rep. 2020, 10, 20658. [Google Scholar] [CrossRef]
- Baker, M.C.; Baker, A.E.M. Niche Relationships Among Six Species of Shorebirds on Their Wintering and Breeding Ranges. Ecol. Monogr. 1973, 43, 193–212. [Google Scholar] [CrossRef]
- Emlen, J.M. The Role of Time and Energy in Food Preference. Am. Nat. 1966, 100, 611–617. [Google Scholar] [CrossRef]
- MacArthur, R.H.; Pianka, E.R. On Optimal Use of a Patchy Environment. Am. Nat. 1966, 100, 603–609. [Google Scholar] [CrossRef]
- Zwarts, L.; Wanink, J.H. How the food supply harvestable by waders in the Wadden Sea depends on the variation in energy density, body weight, biomass, burying depth and behaviour of tidal-flat invertebrates. Neth. J. Sea Res. 1993, 31, 441–476. [Google Scholar] [CrossRef]
- Murray, N.J.; Fuller, R.A. Protecting stopover habitat for migratory shorebirds in East Asia. J. Ornithol. 2015, 156, 217–225. [Google Scholar] [CrossRef]
- Dhanjal-Adams, K.L.; Hanson, J.O.; Murray, N.J.; Phinn, S.R.; Wingate, V.R.; Mustin, K.; Lee, J.R.; Allan, J.R.; Cappadonna, J.L.; Studds, C.E.; et al. The distribution and protection of intertidal habitats in Australia. Emu-Austral Ornithol. 2016, 116, 208–214. [Google Scholar] [CrossRef]
- Burger, J.; Carlucci, S.A.; Jeitner, C.W.; Niles, L. Habitat Choice, Disturbance, and Management of Foraging Shorebirds and Gulls at a Migratory Stopover. J. Coast. Res. 2007, 23, 1159. [Google Scholar] [CrossRef]
- Burger, J.; Niles, L. Shorebirds and stakeholders: Effects of beach closure and human activities on shorebirds at a New Jersey coastal beach. Urban Ecosyst. 2012, 16, 657–673. [Google Scholar] [CrossRef]
- Ottema, O.H.; Spaans, A.L. Challenges and advances in shorebird conservation in the Guianas, with a focus on Suriname. Ornitol. Neotrop. 2008, 19, 339–346. [Google Scholar]
- Andres, B.; Ydenberg, R.C.; Lank, D.B. Shorebird hunting in the Caribbean. In Proceedings of the Western Hemisphere Shorebird Group: Fourth Meeting, Vancouver, BC, Canada, 11–15 August 2011; pp. 11–15. [Google Scholar]
- Gavin, M.C.; McCarter, J.; Berkes, F.; Mead, A.T.P.; Sterling, E.J.; Tang, R.; Turner, N.J. Effective Biodiversity Conservation Requires Dynamic, Pluralistic, Partnership-Based Approaches. Sustainability 2018, 10, 1846. [Google Scholar] [CrossRef]
- de Vasconcellos Pegas, F.; Stronza, A. Ecotourism and sea turtle harvesting in a fishing village of Bahia, Brazil. Conserv. Soc. 2020, 8, 15–25. [Google Scholar] [CrossRef]
- Cusack, C.; Sethi, S.A.; Rice, A.N.; Warren, J.D.; Fujita, R.; Ingles, J.; Flores, J.; Garchitorena, E.; Mesa, S.V. Marine ecotourism for small pelagics as a source of alternative income generating activities to fisheries in a tropical community. Biol. Conserv. 2021, 261, 109242. [Google Scholar] [CrossRef]
- Riera, P.; Stal, L.; Nieuwenhuize, J. Heavy δ15N in Intertidal Benthic Algae and Invertebrates in the Scheldt Estuary (The Netherlands): Effect of River Nitrogen Inputs. Estuarine Coast. Shelf Sci. 2000, 51, 365–372. [Google Scholar] [CrossRef]
- Yamada, F.; Kobayashi, N.; Shirakawa, Y.; Watabe, Y.; Sassa, S.; Tamaki, A. Effects of Tide and River Discharge on Mud Transport on Intertidal Flat. J. Waterw. Port Coastal Ocean Eng. 2012, 138, 172–180. [Google Scholar] [CrossRef]
- Colwell, M.A.; Landrum, S.L. Nonrandom Shorebird Distribution and Fine-Scale Variation in Prey Abundance. Condor 1993, 95, 94–103. [Google Scholar] [CrossRef]
- Thrush, S.; Hewitt, J.; Norkko, A.; Nicholls, P.; Funnell, G.; Ellis, J. Habitat change in estuaries: Predicting broad-scale responses of intertidal macrofauna to sediment mud content. Mar. Ecol. Prog. Ser. 2003, 263, 101–112. [Google Scholar] [CrossRef]
- Kober, K.; Bairlein, F. Shorebirds of the Bragantinian Peninsula I. Prey Availability and Shorebird Consumption at a Tropical Site in Northern Brazil. Ornitol. Neotrop. 2006, 17, 531–548. [Google Scholar]
- Burger, J. The Effect of Human Activity on Shorebirds in Two Coastal Bays in Northeastern United States. Environ. Conserv. 1986, 13, 123–130. [Google Scholar] [CrossRef]
- Lunardi, V.O.; Macedo, R.H.; Granadeiro, J.P.; Palmeirim, J.M. Migratory flows and foraging habitat selection by shorebirds along the northeastern coast of Brazil: The case of Baía de Todos os Santos. Estuar. Coast. Shelf Sci. 2012, 96, 179–187. [Google Scholar] [CrossRef]
- Zwarts, L. Numbers and distribution of coastal waders in Guinea-Bissau. Ardea 1988, 76, 42–55. [Google Scholar]
- Granadeiro, J.P.; Dias, M.; Martins, R.C.; Palmeirim, J. Variation in numbers and behaviour of waders during the tidal cycle: Implications for the use of estuarine sediment flats. Acta Oecologica 2006, 29, 293–300. [Google Scholar] [CrossRef]
- Burger, J.; Howe, M.A.; Hahn, D.C.; Chase, J. Effects of Tide Cycles on Habitat Selection and Habitat Partitioning by Migrating Shorebirds. Ornithology 1977, 94, 743–758. [Google Scholar] [CrossRef]
- Leyrer, J.; Spaans, B.; Camara, M.; Piersma, T. Small home ranges and high site fidelity in red knots (Calidris c. canutus) wintering on the Banc d’Arguin, Mauritania. J. Ornithol. 2006, 147, 376–384. [Google Scholar] [CrossRef]
- Warnock, S.E.; Takekawa, J.Y. Wintering site fidelity and movement patterns of Western Sandpipers Calidris mauri in the San Francisco Bay estuary. Ibis 1996, 138, 160–167. [Google Scholar] [CrossRef]
Disclaimer/Publisher’s Note: The statements, opinions and data contained in all publications are solely those of the individual author(s) and contributor(s) and not of MDPI and/or the editor(s). MDPI and/or the editor(s) disclaim responsibility for any injury to people or property resulting from any ideas, methods, instructions or products referred to in the content. |
© 2023 by the authors. Licensee MDPI, Basel, Switzerland. This article is an open access article distributed under the terms and conditions of the Creative Commons Attribution (CC BY) license (https://creativecommons.org/licenses/by/4.0/).