Abstract
The southeastern Tibetan Plateau (SETP) is well known for its large strike–slip faults with high slip rates and a high potential for seismic hazards. However, little is known about its thrust faults and associated seismic hazards, even though they can produce devastating earthquakes despite their relatively low slip rate. Here we investigated the thrust faults and the recent tectonic uplift pattern in the SETP on a regional scale by combining geomorphic analysis and geodetic data. We quantify the potential differential uplift in the SETP recorded in the long-term landscape evolution with geomorphic indices and compare them with differential uplift derived from decadal leveling data and millennial-scale fluvial terrace incision rates. The results show that the northwest of the SETP underwent higher uplift rates compared to its southeast areas, which is in agreement with the GPS-based leveling. Essentially, the geomorphic indices build two value ranges that are spatially clustered and separated by the Muli thrust fault system, a transverse fault system, which is orientated oblique/perpendicular to the large strike–slip fault. The geomorphic indices indicating rapid uplift rates spatially correspond with high rates derived from leveling data on the northwest side of the Muli thrust fault. The Muli thrust fault, therefore, acted as an important topographic and tectonic boundary absorbing partial southeast crustal movement. Hence, further detailed studies, such as seismological investigations, are suggested to be conducted on the Muli fault for seismic hazards evaluation.
1. Introduction
The southeast of the Tibetan Plateau (SETP) is located next to the stable south China block in the east and the Sichuan Basin (SB) in the northeast (Figure 1). It is characterized by complex Cenozoic structures due to the Indo-Asian collision [1,2,3]. For decades, the deformation of the SETP has been controversial. Multiple deformation models were proposed to explain the mechanism of the uplift of the region. The “channel flow” model suggested that the uplift is due to the outward channel flow from the center of the plateau, pushing up the overlying crust and making deformation between the upper crust and mantle “decoupled” [4,5]. Therefore, northward advancement of the Indian plate results in the thickening of the lower crust and evenly distributed deformation [6,7,8]. Alternatively, geological investigations tend to favor the mountain build-up as a result of crustal faulting and shortening [9], which suggests that the collision zone is composed of a collage of lithospheric blocks, and deformation takes place mainly along the block boundaries delineated by large-scale, rapidly slipping strike–slip faults [10,11,12]. The prominent difference between these models is whether tectonic deformation takes place only along the block boundaries or whether it is evenly distributed. In the past decades, Global Positioning System (GPS) has been used to measure the crustal motion across tectonic deformation zones [13,14,15,16,17,18,19,20,21]. However, GPS data were both used to argue against [21] and for [22] the block-like deformation of the Tibetan Plateau. Therefore, there is still no consensus on the deformation style in the SETP.
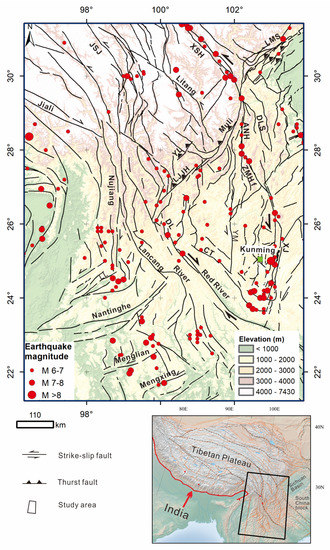
Figure 1.
Major faults and seismicity on the southeastern margin of the Tibetan Plateau [23,24]. Instrumentally recorded earthquakes are from the USGS, and historical earthquakes are from China Earthquake Administration (1995, 1999). The shaded topography is derived from 30-m resolution Shuttle Radar Topography Mission data (USGS). Abbreviations are ANH: Anninghe fault, CT: Chuxiong Tonghai fault, DL: Dali fault, DLS: Daliangshan fault, LJJH: Lijiang Jinhe fault, JSJ: Jinshajiang fault, XSH: Xianshuihe fault, XJ: Xiaojiang fault, LL: Longling fault, LMS: Longmenshan, YM: Yuanmou fault, YL: Yulong fault, and ZMH: Zemuhe fault..
Geomorphological evidence has been central in revealing active fault system deformation rates and spatial distribution [25]. Quantitative analyses of geomorphic evidence make it possible to detect landform responses to deformation processes within intermediate timescales of 10 ka to 300–400 ka, which is why these analyses have been widely used to investigate recent active tectonism [26,27,28,29,30,31]. However, the SETP is located in the tropical wet zone with strong weathering and high erodibility with an average annual rainfall of about 1100 mm/year [32]. Therefore, the usual geomorphometric markers (e.g., fault scarps or knickpoints along rivers) may have been eroded, thus failing to highlight recent uplift induced by weak tectonic activity [33]. In addition, the poor accessibility of faults in the mountainous region and the limited acquaintance with the paleoseismic record cause great uncertainty in assessing the regional seismic hazards.
In this paper, we aim to use fluvial indices, especially river channel indices and hypsometry, the decadal leveling, and long-term river incision rates to (1) reveal recent differential uplift rates, (2) identify thrust faulting with relative rapid uplift rates, and (3) discuss which deformation model is supported by our data. Following a brief overview of major fault zones in the region, we present the recent relative vertical uplift in the southeast of Tibet. We compare the relative uplift rates with long-term geological rates and short-term geodetic rates and discuss the crustal deformation pattern along the eastern margin of the Tibetan Plateau and the potential seismic hazards. Our approach has the potential to reveal the recent uplift pattern of the SETP. The data provide geomorphic constraints on which deformation model is more likely, but also add important aspects to evaluate the seismic hazards on the active thrust faults within the SETP.
2. Study Area, General Physiography, and Previous Studies
The SETP is a region of rugged topography with well-developed drainage and valley networks [34]. The relatively smooth topography across the SETP has been deeply incised by large rivers following nearly parallel courses from the high plateau across this region. The mean elevation decreases gradually southeastward from 4–5 km to 2–3 km [34].
The region experienced long-lasting orogenesis and hosts evidence of a multiphase tectonic activity, from the archipelago orogenic stage of arc–arc and arc–continent subduction in the late Paleozoic–early Mesozoic to continental subduction and collision in the late Mesozoic, and finally, to intracontinental transpressional deformation in the Cenozoic [3,9,35,36,37]. During the Cenozoic, the region was subjected to an oblique collision between India and Eurasia, with evidence of large-scale shortening, transpressional double thrusting, fault duplexing, strike–slip faulting, and pull-apart basins [9,35,36,38,39]. Based on GPS data (1998–2002), the regional horizontal movement is generally considered higher in the northwest and lower in the southeast [1]. The Quaternary tectonic movement in the region produces frequent seismicity along the large strike–slip faults [9,35,40] (Figure 1). The Xianshuihe (XSH)–Xiaojiang fault (XJ) fault system is one of the most active faults in the region (Figure 1) [40]. The NW–SE to N–S trending XSH–XJ fault system is a lithospheric penetrative, intracontinental transform fault with a total length of about 1200 km [41,42,43]. The central section of the XSH is split into two major branches: the NW–SE trending Daliangshan fault (DLS) and the N–S trending Anninghe fault (ANH) that steps over along the NW–SE trending Zemuhe fault (ZMH) into the N–S trending XJ fault. The fault system was active from at least the late Pliocene to the early Quaternary [40] and is seismically active at present (Figure 1). The XSH–XJ fault system shows a left-lateral strike–slip movement and is usually situated in deeply incised valleys separating high mountain ranges [44,45]. Another major right-lateral strike–slip fault is the NW–SE trending Red River fault, which has long been recognized as a profound geological discontinuity marking the southwestern margin of the South China block with a total length of ~900 km [46]. The Red River fault has so far produced no significant earthquakes within the historical record. The Red River fault caused Holocene displacements and is considered “active” in a geologic sense with the recurrent interval of major earthquakes of thousands of years [42]. In accord, a recent study suggests a low-slip rate and rare large seismic events [46]. The total right-lateral offset, initiated 13–15 Ma ago, is estimated between ~6 and ~60 km [40,42,43,47]. The Red River fault truncates the southward extension of the left-slip XSH–XJ fault system in a complex zone of distributed faulting [48,49,50]. The Red River fault system connects to the Dali fault (DL) at its northwestern end and merges into a group of N–S trending faults, such as the Jinshajiang fault (JSJ) and the Lancang River faults (Figure 1). To the south, the Nujiang fault splits into a group of faults trending NE–SW, represented by the Longling fault (LL). The Lancang River fault bends and splits into the Nantinghe and south Lancang Rivers. To the north, two parallel thrust faults nearly perpendicular to the Red River fault are the Lijiang Jinhe fault (LJJH) and the Yulong fault (YL), which are trending NE–SW. To the northeast of the LJJH, the Muli fault system is another NE–SW trending complex fault system. The Muli fault system has multiple fault branches in the southwest bending to the northwest and connecting with the YL fault. The main orientation of the Mulif fault is perpendicular to the major strike–slip fault, the XSH fault. In the region north of the XSH fault, the Longmenshan (LMS) thrust fault system, also trending northeast–southwest, is parallel to the Muli fault. The elevation of LMS rises from ~500 m in the Sichuan Basin (SC) to ~6500 m over a horizontal distance of ~50 km, creating one of the steepest topography in the world [51,52,53].
3. Data and Methods
Geomorphic indices, such as the stream length-gradient index, normalized channel steepness (Ksn), and hypsometry, are commonly used to distinguish structural segments along active faults and potentially identify the most active segments [54]. These methods have been widely applied in tectonically active regions (e.g., Taiwan, Iran, and Eastern Tibet) and tested to be useful to identify areas that are experiencing rapid tectonic uplift.
In this investigation, we use the fluvial parameters: stream-length gradient (SL), normalized channel steepness (Ksn), and hypsometric integral (HI), which proved particularly useful in reflecting the differential uplift in active tectonic areas [55,56,57,58]. The SL reflects the ability of a stream to transport its load as well as the channel shape, such as the channel gradient [59]. The Ksn provides a quantitative comparison between different channels in a drainage area, erosion rate, and rock uplift rate [60,61,62].
We calculate the SL and HI values following Gao et al. [56]. We analyzed normalized channel steepness (Ksn) by following the procedures and Matlab toolbox developed by Schwanghart and Scherler [63]. We further analyze and discuss four potential factors that could influence the three indices values: (i) lithological contrasts, (ii) drainage basin area, (iii) precipitation [56], and (iv) tectonic forcing that can induce differential uplift. Combining the published leveling data and the compiled river incision rates [64], we revealed the spatial variations of geomorphic indices values in SETP. The drainage network was extracted from 90-m resolution data from the Shuttle Radar Topography Mission (SRTM), using Rivertool 3.0. Data processing artifacts were manually removed, and the network was validated to avoid DEM-associated errors. The channels were ordered following Strahler [65]. Digitized regional geological maps at the scale of 1:500,000 published by the Chinese Geological Survey were used for lithological classification (Figure 2). In addition, we used Tropical Rainfall Measuring Mission (TRMM) data (1997–2006) to analyze the impact of climate on geomorphic indices.
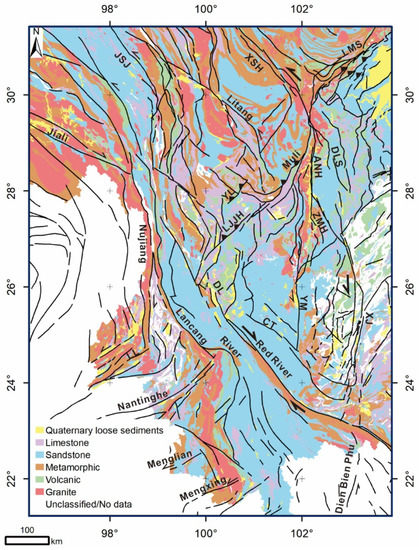
Figure 2.
Lithological classification based on the regional 1:500,000 geological map, the rock properties, and hardness levels (Table 1).

Table 1.
Description of classified lithological groups and of the Rock Strength Levels that increase from “Quaternary” to “Granite” 1.
Table 1.
Description of classified lithological groups and of the Rock Strength Levels that increase from “Quaternary” to “Granite” 1.
| Lithological Group | Description of Dominant Sediments/Rock Type |
|---|---|
| 1. Quaternary loose sediments | Unconsolidated very weak sedimentary |
| 2. Limestone | Weak sedimentary (Non-Clastic) |
| 3. Sandstone | Medium-strong sedimentary (Clastic) |
| 4. Metamorphic | Strong |
| 5. Volcanic rock | Very strong |
| 6. Granite | Extremely strong |
1 Modified after Hoek and Brown [66].
3.1. Stream Length Gradient (SL)
The SL is a quantitative geomorphic parameter that facilitates detecting abnormal steepness along a river channel. While SL values increase as rivers and streams flow over the hanging wall of an active thrust fault [55,56], they tend to be lower when rivers and streams flow in areas without topographic changes, such as along strike–slip faults [26,29]. The SL was defined as [55].
where ΔH/ΔL is the slope of each channel segment, and L is the total channel length from the divide to the midpoint of the channel reach. We calculated the SL with the topology analysis tools in ArcGIS Desktop 10.6, following the procedures of Gao et al. [29]. We converted the DEM into contour lines with an interval of 50 m based on the size of the study area and the relief. The calculated SL values were classified as very low (<1000 m), green—low (1000–2000 m), yellow—moderate (2000–4000 m), orange—high (4000–8000 m), and red—very high (>8000 m) (Figure 3).
SL = (ΔH/ΔL) L,
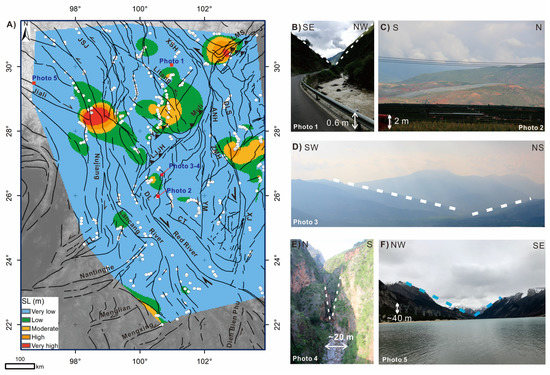
Figure 3.
(A) Interpolation of stream length gradient (SL) values and the locations of SL points indicated by the white dots. The colors represent the following values: Blue—very low (<1000 m), green—low (1000–2000 m), yellow—moderate (2000–4000 m), orange—high (4000–8000 m), and red—very high (>8000 m). (B) shows a V-shaped incised valley with moderate SL values. (C) shows low-relief topography with very low SL values. (D) shows low-relief topography with moderate SL values. (E) shows a deep valley on the surface rupture of the 1515 AD M 7.8 Yongsheng earthquake. (F) shows a gentle incised valley with very low SL values. See the locations of the photos in (A).
3.2. Normalized Channel Steepness (Ksn)
Stream profiles carry information on tectonic and/or climatic perturbations. Across a wide variety of natural settings, a river channel tends to follow an empirical, power law relationship between local channel slope S (m/m) and upstream drainage area A (m2) and can be represented as [67]:
where ks is the channel steepness index, a function of uplift rate (U), and erosion coefficient (K):
and θ is the concavity index which is decided by the area index (m) and gradient index (n):
S = ksA−θ,
ks = (U/K)1/n,
Θ = m/n,
For evaluation of regional differential uplift of a large area, which consists of multiple different channels, the comparison between multiple different channels from the drainage area, erosion rate, and rock uplift rate is required [60,61,62]. In such cases, the normalized channel steepness index (Ksn) is used as a proxy for the uplift rate, given the lithology and climate are uniform across the region [54,60,61,62,67,68,69]. We use TopoToolbox, developed by Schwanghart and Scherler [63] and Schwanghart et al. [70], to calculate Ksn for multiple ninth Strahler order rivers across the SETP. The results are shown in Figure 4.
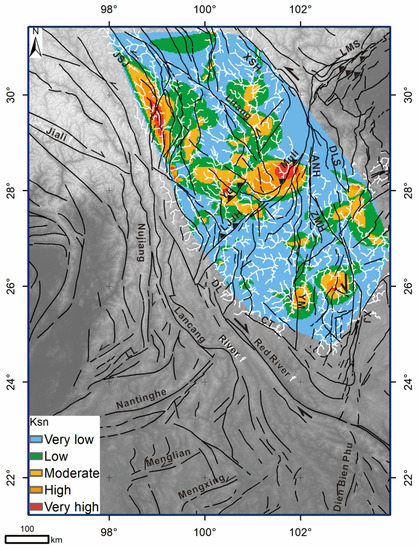
Figure 4.
Map of channel steepness indexes that are normalized (Ksn) to a reference concavity (θref) of 0.45. Note that we only selected streams of the same order for comparison throughout the Yangtze river drainage, calculated using the stream profiler tool (www.geomorphtools.org, accessed on 3 April 2021) with a smoothing window of 1000 m. The colors represent the following values: Blue—very low (2–631), green—low (631–1361), yellow—moderate (1361–2463), orange—high (2463–4301), and red—very high (>4301).
3.3. Hypsometry
Basin hypsometry (hypsometric curves/hypsometric integral value) is a quantitative parameter that describes the stage of a watershed [65]: young, with a convex-upward curve (hypsometric integral value close to 1); mature, with a sigmoidal curve (hypsometric integral value close to 0.5); or senile, with a concave-upward curve (hypsometric integral values close to 0) [26]. A hypsometric integral value (HI) is calculated based on the topography of a watershed using the function below:
HI = (mean elevation − minimum elevation)/(maximum elevation − minimum elevation),
Here, we selected the eighth Strahler-order watersheds and calculated the hypsometric integral (HI) values (Figure 5).
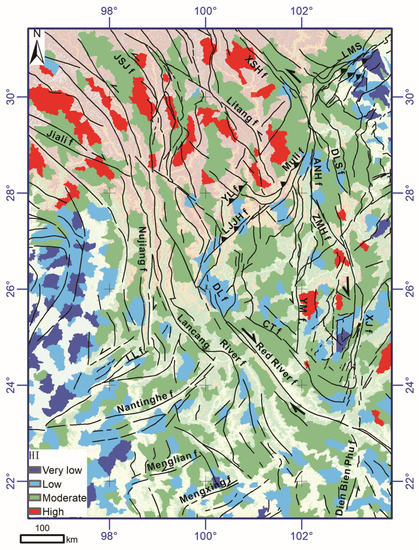
Figure 5.
Spatial distribution of the hypsometric integrals of the eighth Strahler-order drainage basins. The catchment colors represent the following values: deep blue—very low (<0.2), light blue—low (0.2–0.4), green—moderate (0.4–0.6), and red—high (>0.6).
3.4. Compilation of the Leveling Data and River Incision Rates Derived from the Fluvial Terrace
Present uplift rates can be recorded and determined with modern geodetic techniques such as GPS and leveling. Multiple repetitive measures on the same benchmark can provide the most precise data to demonstrate vertical motion [71]. The precise leveling data observed around the eastern margin of the Tibetan Plateau were collected from two leveling networks surveyed between 1970 and 2012 [72,73] (Figure 5). By comparing the successive measurements of the same benchmark, vertical movement within recent decades in SETP can be determined (Figure 6). Based on the vertical rates derived from leveling, we interpolated the data within SETP into a map view.
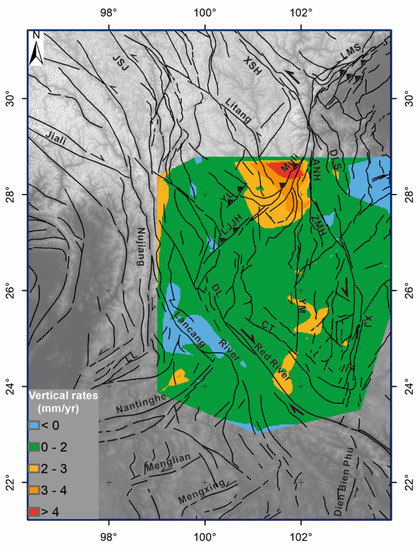
Figure 6.
Interpolated vertical rates derived from the leveling survey from 1970 to 2012 in SETP were shown with arrows (Modified after Hao et al. [73]). Vertical velocities are relative to ITRF 2008.
The age and position of a fluvial terrace with respect to a reference level provide a good approximation of the river incision rate. In certain occasions, this is a valid time-averaged proxy for the surface uplift rate [74]. This is especially true for the fluvial terraces that formed during the late Quaternary. Terrace formation represents a change in fluvial activity from lateral erosion or aggradation to vertical incision and abandonment of the former riverbed [64]. The incision is caused primarily by an increase in the stream power of the river, which may be a result of either (1) an increase in the ratio of water to sediment supply, which might occur during a period of climate change, (2) an increase in gradient due to tectonic uplift, or (3) a combination of the two [75,76,77]. Here we compared Quaternary incision rates derived from fluvial terrace dating data from SETP (Figure 7), which are closer to the geomorphic indices’ time relevance. Based on the erosion rates (see the location of the white dots), we interpolated the data within SETP into a map view.
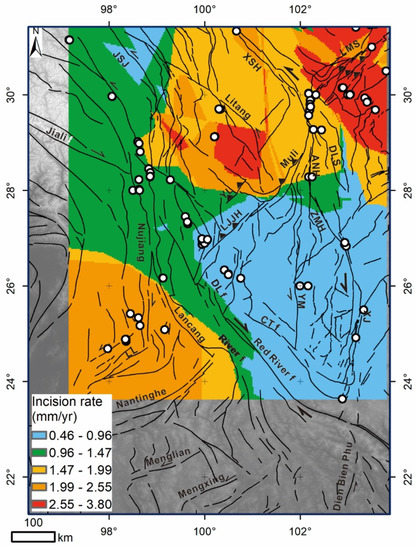
Figure 7.
Interpolated incision rates derived from fluvial terrace dating (Data compiled from Tao et al. [63]).
3.5. Statistical Analysis
To analyze the relationship between the two geomorphic indices values and their potential controlling factors, we apply several different statistical tests. Given that drainage area variation can potentially influence geomorphic indices values [78], we used Kendall’s rank correlation, which measures the ordinal association between two measured quantities (and which has a coefficient value between −1 and 1), to explore the relationship between basin size and the geomorphic indices (SL, Ksn and HI). A Kendall’s rank correlation coefficient of 1 would indicate complete agreement between two rankings; a coefficient of −1 would indicate complete disagreement between the rankings, and a coefficient near zero would indicate that the two quantities are independent. In a separate test, we again used Kendall’s rank correlation to explore the relationship between the geomorphic indexes and mean precipitation, as derived from TRMM (Tropical Rainfall Measuring Mission) data for 1997–2006 (Figure 8). Lastly, we selected the indices that are weakly associated with either drainage area or precipitation for further statistical analysis. We investigated the potential correlation between these selected geomorphic indexes and lithology. We apply the Kruskal–Wallis test to examine whether different lithologies have a significant impact on geomorphic indices values. The Kruskal–Wallis test, a non-parametric method for testing whether two or more samples originate from the same distribution, is used for comparing two or more independent samples of equal or different sample sizes. If the statistic is not significant, then there is no evidence of stochastic dominance between the samples. However, if the test is significant, then at least one sample stochastically dominates another sample.
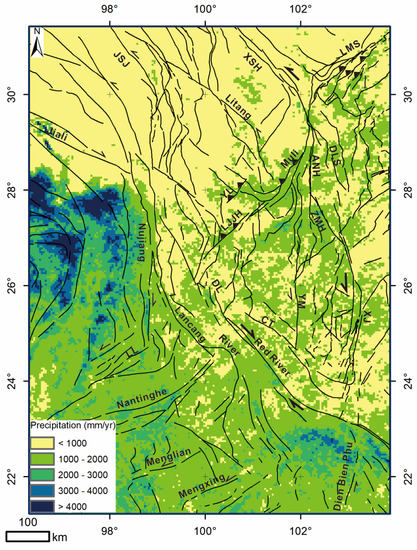
Figure 8.
Mean precipitation derived from TRMM data (1997–2006). The maximum rainfall was blocked by the high topography of the Tibetan Plateau and occurred mainly in the west of the Nujiang fault and the southeast of the Red River fault. Topography also plays an important role as the precipitation decrease to less than 1000 mm/year in the high plateau area.
4. Results
4.1. Stream Length Gradient (SL)
The SL value in the study area ranges from 205 to 64,763. Individual values were grouped into five ranges (Figure 3) from very low (<1000 m), low (1000–2000 m), moderate (2000–4000 m), high (4000–8000 m), and very high (>8000 m). The two patches of very high values of the index are located near the eastern end of the Jiali fault and the LMS (Figure 3). Areas around the DL fault, the Red River fault (except for the southern end), the XSH fault, the central DLS fault, the northern LJJH fault, the central Lancang River fault, the northern JSJ fault, western Jiali fault, and northern Litang fault are dominated by very low values.
The SL values are not significantly correlated with the drainage area (Figure 9A). Kendall’s rank correlation between SL and the mean precipitation derived from the TRMM data (1997–2006 http://pmm.nasa.gov/, accessed on 6 August 2019) is also weak (Figure 9B).
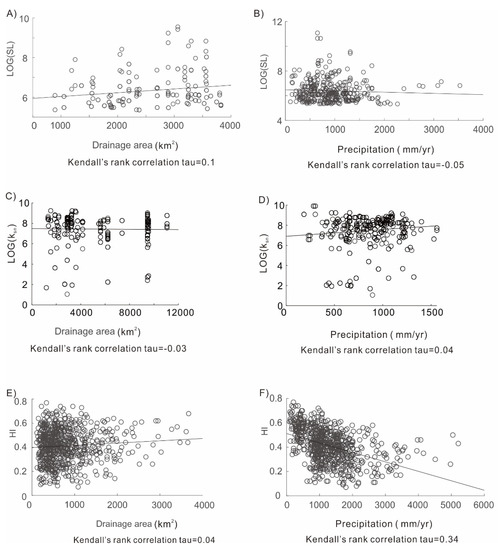
Figure 9.
(A) Kendall’s rank correlation shows SL values slightly increase with drainage basin area; (B) Kendall’s rank correlation shows near zero relationship between SL and precipitation; (C) Kendall’s rank correlation shows near zero relationship between Ksn and drainage basin area; (D) Kendall’s rank correlation shows Ksn values slightly increase with precipitation. (E) Kendall’s rank correlation shows HI values slightly increase with drainage basin area; (F) Kendall’s rank correlation shows HI values are significantly influenced by precipitation. Mean precipitation derived from TRMM data (1997–2006). The maximum rainfall was blocked by the high topography of the Tibetan Plateau and occurred mainly in the west of the Nujiang fault and the southeast of the Red River fault.
The Kruskal–Wallis test shows that the lowest SL value is associated with Quaternary loose sediment, while the highest SL value is associated with limestone rather than high erosion-resistant lithology (Figure 10A). The previous study also suggests that the SL value is very sensitive to changes in lithology and/or tectonic uplift [79]. To further test the impact of lithology, we analyzed denser SL values by adding points from smaller streams on exposed sandstone for the Muli fault (Figure 11A). The results show that the very high SL values are near the eastern end of the Litang fault. The high SL values are distributed along the different segments of the Muli fault, the southern LMS fault, and the southern DLS fault.

Figure 10.
(A) Statistical correlation between SL values and their underlying lithological groups. (B) Statistical correlation between Ksn values and their underlying lithological groups. Lithology groups: 1. Quaternary unconsolidated sediments, 2. Limestone, 3. Sandstone, 4. Metamorphic rock, 5. Volcanic rock, and 6. Granite (See Table 1 for details of the classification of each lithological group).
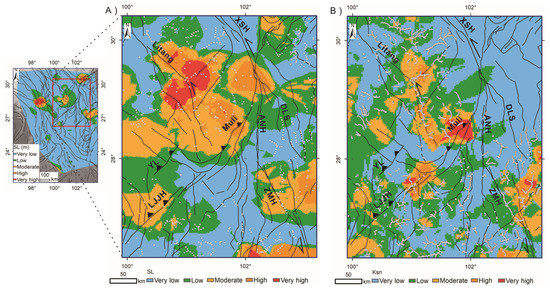
Figure 11.
(A) Interpolation of SL points underlain by sandstone. The colors represent the following values: Blue—very low (44–181 m), green—low (181–288 m), yellow—moderate (288–407 m), orange—high (407–581 m), and red—very high (>581 m). (B) Interpolation of Ksn points underlain by sandstone. The colors represent the following values: Blue—very low (8–427), green—low (427–847), yellow—moderate (847–1546), orange—high (1546–2833), and red—very high (>2833). White dots are SL/Ksn points within the sandstone. The range of B)/C) is indicated by a red rectangle in the inset map.
4.2. Normalized Channel Steepness (Ksn)
The Ksn value of the ninth Strahler order streams in the study area ranges from 2 to 17,167. Individual values were grouped into five ranges (Figure 4) from very low (2–631), low (631–1361), moderate (1361–2463), high (2463–4301), and very high (>4301). The two large patches of very high values of the index are located near the eastern end of the JSJ fault, and west of the Muli fault (Figure 4). Areas around the XSH–ANH–ZMH fault, the LJJH fault, and the northern DLS fault are dominated by very low or very low values.
The Ksn values are not significantly correlated with the drainage area (Figure 9C). Kendall’s rank correlation between Ksn and the mean precipitation derived from the TRMM data (1997–2006 http://pmm.nasa.gov/, accessed on 6 August 2019)) is also weak (Figure 9D).
The Kruskal–Wallis test shows that the lowest Ksn value is associated with metamorphic rock, while the highest Ksn value is associated with sandstone rather than with high erosion-resistant lithology (Figure 10B).
The previous study also suggests that the Ksn value is sensitive to changes in lithology and/or tectonic uplift [80]. To further tease out the impact of lithology, we analyzed denser Ksn values by adding points from smaller streams on exposed sandstone for the Muli fault (Figure 11B). The results show a similar pattern as exhibited in Figure 4.
4.3. Hypsometric Integral
In the SETP, the mean HI value is 0.41, which demonstrates that the majority of the drainage systems in the study area are near the mature stage. The HI distribution shows a complex pattern, with “high” values (red color) present in the northwest of the LJJH-Muli fault and a few patches located east of YM f (Figure 5). The “very low” values (blue color) are absent from the northwest of the region and are present densely in the SC basin and the west of Nujiang (Figure 5).
We analyzed 723 watersheds with areas from 109 to 3672 km2 (Figure 5). Kendall’s rank correlation shows a near-zero ordinal association between HI and the basin area (Figure 9E). However, Kendall’s rank correlation shows a clear association between HI and the mean precipitation derived from the TRMM data (Figure 9F).
4.4. Interploated Present Uplift Rates and the River Incision Rates
The leveling data indicate that the surface uplift rates are not evenly distributed over the entire region (Figure 6). The map view of the interpolated results shows that the moderate uplift rates (2–3 mm/year) are distributed in the broad deformation zone between the east of the Red River fault and the XJ faults (Figure 6). There are also areas of subsidence, such as the central segment of the Lancang River fault and the ZMH fault. However, the present highest uplift rates are on the northwest side of the Muli fault, which is more than 4 mm/year (Figure 6).
The formation of the fluvial terraces responds to regional/global climate change. However, the short-term incision derived from fluvial terrace dating contains differential rock-uplift information. We compiled 248 data points for the dated fluvial terraces in SETP (Figure 7). We took the incision rate as a proxy to reflect the regional recent uplift from 100 ka B.P. to the present. The interpolated results show that the three patches of very high values of the incision rates are located near the northwestern YL and the LMS faults. Areas around the ZMH–XJ fault, the LJJH fault, the DL fault, and the Red River fault are dominated by low or very low values. Therefore, the regional incision rate variations are spatially associated with the thrust fault systems.
5. Field Evidence for Fluvial Incision and Differential Tectonic Uplift
We have evaluated whether the calculated geomorphic indices match the actual geological and geomorphic settings through field observations. We have observed deeply incised streams with moderate SL values in the northwestern part of the SETP (Figure 3A,B), while in the southeastern part of the SETP, low-relief topography has very low SL values (Figure 3A,C). At regions where active strike–slip faults with normal components bounded the sedimentary basins, such as areas on the southeast of the LJJH fault, the topography is smooth (Figure 3A,D); however, SL values can be moderate (Figure 3) due to extreme deep valleys were formed due to the frequent earthquakes along the active faults, which increase the mean SL value of the area along the active faults (Figure 3E). For example, the 1515 AD Yongsheng earthquake ripped a 30–50 m-wide, hundreds-meter-long crack, with a maximum depth of 30–50 m [81,82,83]. In addition, river captures can happen in the surface rupture zone due to surface deformation. This is in accordance with the research results from Yang et al. [84], that the rivers in SETP have been frequently disrupted by the tectonic deformation, consequently forming the deep valleys incise into the low relief surfaces. In general, strike–slip fault, i.e., Jiali fault, topography shows a gentle relief with low SL values (Figure 3F). Overall, the calculated geomorphic indices values correspond to the observed tectonic landforms, with high values distributed on the active uplift areas, and moderate to low values located in areas that are either dominated by strike–slip faulting or are tectonic relatively stable.
6. Discussion
6.1. Factors Potentially Influencing SL, Ksn, and HI
Drainage basin size has only a slightly positive correlation with SL, Ksn, and HI (Figure 9A,C,E). The next factor, precipitation, may also influence the SL, Ksn, and HI. This is because precipitation can influence erosional processes via adding or decreasing runoff, which are the principal agents for the removal and transport of eroded sediments [85]. The statistical analysis between TRMM precipitation data and the three geomorphic indices shows that SL decreases significantly with the increase of precipitation in the SETP, while Ksn slightly increases with precipitation (Figure 9B,D). These results suggest that precipitation is not the main controlling factor of the SL or Ksn values but has a different influence (one negative and another positive) on both values. While HI values and the mean precipitation shows a clear association (Figure 9F). Hence, SL and Ksn values are selected for further statistical analysis. Third, the lithological contrast between the soft Quaternary sediments and granite in our study area is influencing SL and Ksn (Figure 10). This result corresponds with the fact that lithology is an important factor in determining erosion processes [86,87]. Pedrera et al. [57] suggest that SL is sensitive to active folds in areas with outcropping hard rocks and insensitive in sedimentary basins. Therefore, we analyzed the SL and Ksn in areas with a uniform lithology, the sandstone. To ensure sufficient data points, we calculated a relatively small area where the focus is on the Muli fault (Figure 11). We used all stream-order rivers to calculate the SL and Ksn values. Our detailed analysis revealed that the very high SL and Ksn values are spatially located on the northwestern side of the Muli fault, and the junction area of the DLS–ZMH faults. The high-resolution analysis revealed the same pattern as the indices calculation for SETP (Figure 3 and Figure 4).
The main boundary separating very high SL and Ksn values from lower values are the Muli fault. In the swath profile (Figure 12) across the Muli fault line, the SL and Ksn values show maximum values. Leveling data also shows maximum uplift rates (>4 mm/year) on the hanging wall of the Muli fault (Figure 6). However, along the strike–slip fault, the SL and ksn values vary, for example, both SL and Ksn show high values at the southern end of the DLS fault, which could be explained by the convergence or jointing with the ZMH fault. Overall, the geomorphic indices values are higher in the northwest of the Muli fault compared to the southeast areas. This finding corresponds with results derived from the GPS [88,89]. The Muli fault is a transverse fault perpendicular to the southeastward extrusion. The Muli fault clearly absorbed partial SE-directed horizontal motion and transferred it to vertical motion. Consequently, the eastward extrusion of the blocks or “flow” of the mass is a constraint [90,91,92]. The previous study also believes that the LJJH fault, which is located south of the Muli fault, also plays the same role as the Muli fault [91]. However, Figure 11 revealed along-strike variations between the LJJH fault and the Muli fault. Specifically, geomorphic indices values are higher around the Muli fault compared to the LJJH fault (Figure 11).
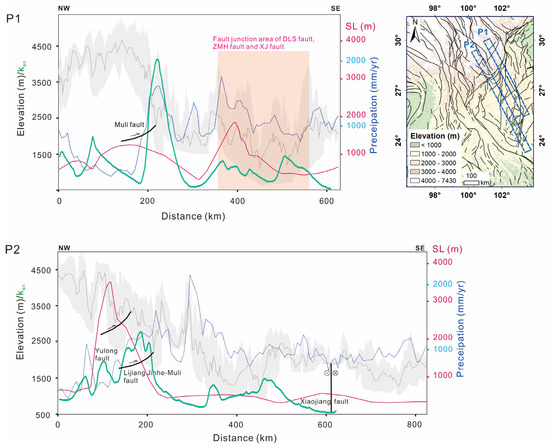
Figure 12.
Swath profiles of topography, SL, and precipitation, averaged over a 20-km width of each profile. The grey area marks the boundaries of maximum and minimum elevation. The grey line represents the mean elevation. The red line represents SL values, the green line represents the Ksn values, and the blue dots are mean annual precipitation (1997–2006). The locations of the swath profiles are marked as blue dashed rectangle in the inset map.
6.2. Regional Seismic Hazards
Frequent seismicity along large strike–slip faults is common in the SETP [9,35,40] (Figure 1). For example, 14 M > 7.0 earthquakes have been recorded since 814 along the XSH–XJ fault, including an M8.0 event in 1833 [92] with a maximum focal depth of ~20 km [93]. Two M > 7 events occurred along the fault system during the last century [94] (Figure 1). In comparison, large earthquakes on thrust faults in the SETP have rarely been recorded. However, active faults with no historically recorded event can also produce disastrous earthquakes. One of the best examples is the unanticipated 2008 Mw 7.9 Wenchuan earthquake on the Longmenshan fault, which caused more than 80,000 deaths [53,95,96,97,98,99,100,101]. Therefore, active faults with low-slip rates and no historically recorded earthquake still need to be thoroughly assessed for their seismic hazard potential. Although vertical rates of up to 3.5 mm/year [90] have been documented on the Lijiang Jinhe (LJJH), and 0.35–1.07 mm/year uplift rate since Holocene has been reported on the XJ fault [102], thrust faults in the SETP have not been given sufficient attention.
Based on our comparison of absolute SL values with rapidly uplifting regions around the margins of the Tibetan Plateau (Table 2), the maximum uplift rate of the SETP is higher than at the northeastern and eastern margins of the Tibetan Plateau. The maximum SL value in the SETP is more than four times higher than the maximum values in the northeastern and eastern margins of the Tibetan Plateau. The above evidence suggests that seismic hazard assessment in the SETP due to uplift requires more quantitative constraints on the vertical uplift. We, therefore, suggest future high-resolution geomorphic investigations concentrating especially on the Muli fault, a transverse fault with significant variation in geomorphic values on both sides of the fault. Moreover, the hanging wall of the Muli fault has the highest present uplift rates revealed by leveling data; hence, the Muli fault may pose a higher seismic risk compared to the rest of the thrust faults in the region.

Table 2.
Comparison of SL values in the SETP with other parts of the Tibetan Plateau: the northeastern Tibetan Plateau (China) (NETP), and the Longmenshan thrust belts (LMS) in the eastern Tibetan Plateau (China).
Additionally, we infer that the Muli fault is an important tectonic and topographic boundary in the SETP. This structure may have been connected to the LMS earlier but was offset by the XSH fault in the Late Miocene [103]. Thermochronological data also suggests the approximate synchronicity of exhumation of the Yulong and Longmen Shan thrust systems, which indicates that widespread crustal shortening and thickening took place in southeastern and eastern Tibet [104].
Based on a topographic analysis, Liu-Zeng et al. [34] proposed that the drainage systems caused the topographic differences between the two sides of Yulong and that fluvial erosion efficiently lowered the topography. Our results do not exclude this explanation but demonstrate that the topographic differences may be induced by late Quaternary vertical deformation. Furthermore, we have found that the remnants of high-elevation planation surface at the southern tip of the DLS fault correspond to the high SL/Ksn, which can be explained by the jointing or convergence of two large strike–slip faults DLS and ZMH faults. Alternatively, the high values in this area could be explained due to the tectonic deformation that disrupted rivers, such as river capture proposed by Yang et al. [84]. Our results demonstrated significant variations in geomorphic indices values and leveling-derived uplift rates, which indicates that the recent vertical deformation is not uniform across SETP.
7. Conclusions
In this study, we have quantitatively analyzed and compared the results of SL, Ksn and HI in the SETP. We provide new constraints on the recent uplift pattern of the region by integrating geomorphic indices with published leveling data and river incision rates.
- (1)
- Kendall’s rank correlation shows that the HI values are clearly influenced by the precipitation. The Statistical analysis between geomorphic indices and various impact factors shows that lithology contrast has a significant impact on SL and Ksn. SL shows the lowest value in soft Quaternary sediments and the highest value in limestone (highest SL), while the lowest Ksn values correspond with metamorphic rock, and the highest Ksn values associate with sandstone.
- (2)
- The geomorphic indices confirmed that the differential vertical uplift in the SETP is associated with the NE trending thrust-fault system. West of the Muli fault, geomorphic indices values are significantly higher compared to the east. We, therefore, conclude that the Muli fault is the most prominent tectonically active boundary of the SETP. Seismic hazards due to the uplift of the Muli fault requires further detailed studies.
- (3)
- The northwestern SETP is experiencing a higher uplift compared to the southeastern SETP, which is in agreement with GPS results. The significant variation in the recent uplift pattern refutes the distributed deformation model. Instead, the observed recent uplift pattern argues for tectonic deformation along or across discrete zones such as the Muli thrust system.
Author Contributions
Conceptualization, M.G. and G.Z.; validation, G.Z.; formal analysis, M.G.; investigation, M.G. and M.H.; resources, X.X.; data curation, M.G. and M.H.; writing—original draft preparation, M.G.; writing—review and editing, M.G. and G.Z.; visualization, M.G.; supervision, X.X.; project administration, X.X.; funding acquisition, M.G., and X.X. All authors have read and agreed to the published version of the manuscript.
Funding
This research was funded by “the Natural Science Foundation of the Science and Technology department of Xinjiang, grant number 2022D01C361)”, “the National Natural Science Foundation of China, grant number 41888101, 41874017”, “the National Key Research and Development Program of China, grant number 2018YFC1503403”, “the Startup research fund of Xinjiang University, grant number 620320044”, and “the Tianchi Talents Program fund, grant number TCBR202105”.
Data Availability Statement
TRMM 2B31 Data is provided by NASA Goddard Space Flight Center (http://pmm.nasa.gov/, accessed on 6 August 2019). SRTM 90-m DEMs are available from USGS (https://earthexplorer.usgs.gov/, accessed on 23 September 2019).
Acknowledgments
We thank Paul Tapponnier for the discussion on the Red River fault. We benefited from a discussion with Philippe Hervé Leloup on regional tectonic evolution during the field trip. We thank the language specialist Pavel Adamek who revised the English version of the manuscript.
Conflicts of Interest
The authors declare no conflict of interest.
References
- Shen, Z.; Lü, J.; Wang, M.; Bürgmann, R. Contemporary crustal deformation around the southeast borderland of the Tibetan Plateau. J. Geophys. Res. 2005, 110, B11409. [Google Scholar] [CrossRef]
- Molnar, P.; Tapponnier, P. Cenozoic tectonics of Asia: Effects of a continental collision. Science 1975, 189, 419–426. [Google Scholar] [CrossRef] [PubMed]
- Yin, A.; Harrison, T.M. Geologic evolution of the Himalayan-Tibetan orogeny. Annu. Rev. Earth Planet Sci. 2000, 28, 211–280. [Google Scholar] [CrossRef]
- Royden, L.H.; Burchfiel, B.C.; King, R.W.; Wang, E.; Chen, Z.; Shen, F.; Liu, Y. Surface deformation and lower crustal flow in eastern Tibet. Science 1997, 276, 788–790. [Google Scholar] [CrossRef] [PubMed]
- Clark, M.K.; House, M.A.; Royden, L.H.; Whipple, K.X.; Burchfiel, B.C.; Zhang, X.; Tang, W. Late Cenozoic uplift of southeastern Tibet. Geology 2005, 33, 525–528. [Google Scholar] [CrossRef]
- England, P.; McKenzie, D.P. A thin viscous sheet model for continental deformation. Geophys. J. R. Astron. Soc. 1982, 70, 295–321. [Google Scholar] [CrossRef]
- Vilotte, J.P.; Madariaga, R.; Daignieres, M.; Zienkiewicz, O. Numerical study of continental collision: Influence of buoyancy forces and initial stiff inclusion. Geophys. J. R. Astron. Soc. 1986, 84, 279–310. [Google Scholar] [CrossRef]
- Houseman, G.; England, P. A lithospheric thickening model for the Indo-Asian collision. In The Tectonic Evolution of Asia; Yin, A., Harrison, T.M., Eds.; Cambridge University Press: New York, NY, USA, 1996; pp. 3–17. [Google Scholar]
- Tapponnier, P.; Xu, Z.; Roger, F.; Meyer, B.; Arnaud, N.; Wittlinger, G.; Yang, J. Oblique stepwise rise and growth of the Tibet Plateau. Science 2001, 294, 1671–1677. [Google Scholar] [CrossRef]
- Tapponnier, P.; Peltzer, G.; Le Dain, A.Y.; Armijo, R.; Cobbold, P. Propagating extrusion tectonics in Asia: New insights from simple experiments with plasticine. Geology 1982, 10, 611–616. [Google Scholar] [CrossRef]
- Peltzer, G.; Tapponnier, P. Formation and evolution of strike slip faults, rifts, and basins during the India-Asia collision: An experimental approach. J. Geophys. Res. 1988, 93, 15085–15117. [Google Scholar] [CrossRef]
- Avouac, J.P.; Tapponnier, P. Kinematic model of active deformation in central Asia. Geophys. Res. Lett. 1993, 20, 895–898. [Google Scholar] [CrossRef]
- Bilham, R.; Larson, K.; Freymueller, J.; Idylhim, P. GPS measurements of present-day convergence across the Nepal Himalaya. Nature 1997, 386, 61–64. [Google Scholar] [CrossRef]
- King, R.W.; Shen, F.; Burchfiel, B.C.; Royden, L.H.; Wang, E.; Chen, Z.; Liu, Y.; Zhang, X.; Zhao, J.; Li, Y. Geodetic measurement of crustal motion in southwest China. Geology 1997, 25, 179–182. [Google Scholar] [CrossRef]
- Larson, K.M.; Burgmann, R.; Bilham, R.; Freymueller, J.T. Kinematics of the India-Eurasia collision zone from GPS measurements. J. Geophys. Res. 1999, 104, 1077–1093. [Google Scholar] [CrossRef]
- Chen, Z.; Burchfiel, B.C.; Liu, Y.; King, R.W.; Royden, L.H.; Tang, W.; Wang, E.; Zhao, J.; Zhang, X. Global Positioning System measurements from eastern Tibet and their implications for India/Eurasia intercontinental deformation. J. Geophys. Res. 2000, 105, 16215–16227. [Google Scholar] [CrossRef]
- Shen, Z.; Wang, M.; Li, Y.; Jackson, D.D.; Yin, A.; Dong, D.; Fang, P. Crustal deformation along the Altyn Tagh fault system, western China, from GPS. J. Geophys. Res. 2001, 106, 30607–30622. [Google Scholar] [CrossRef]
- Wang, Q.; Zhang, P.; Freymueller, J.T.; Bilham, R.; Larson, K.M.; Lai, X.; You, X.; Niu, Z.; Wu, J.; Li, Y.; et al. Present-day crustal deformation in China constrained by Global Positioning System measurements. Science 2001, 294, 574–577. [Google Scholar] [CrossRef]
- Vigny, C.; Socquet, A.; Rangin, C.; Chamot-Rooke, N.; Pubellier, M.; Bouin, M.N.; Becker, G. Present-day crustal deformation around Sagaing fault, Myanmar. J. Geophys. Res. 2003, 108, 2533. [Google Scholar] [CrossRef]
- Chen, Q.; Freymueller, J.; Wang, Q.; Yang, Z.; Xu, C.; Liu, J. A deforming block model for the present-day tectonics of Tibet. J. Geophys. Res. 2004, 109, B01403. [Google Scholar] [CrossRef]
- Zhang, P.Z.; Shen, Z.K.; Wang, M.; Gan, W.J.; Bürgmann, R.; Molnar, P.; Wang, Q.; Niu, Z.; Sun, J.; Wu, J.; et al. Continuous deformation of the Tibetan Plateau from global positioning system data. Geology 2004, 32, 809–812. [Google Scholar] [CrossRef]
- Thatcher, W. Microplate model for the present-day deformation of Tibet. J. Geophys. Res. 2007, 112, B01401. [Google Scholar] [CrossRef]
- Deng, Q.D. Map of Active Tectonics in China; Seismological Press: Beijing, China, 2007. [Google Scholar]
- Sun, H.; He, H.; Ikeda, Y.; Wei, Z.; Chen, C.; Xu, Y.; Shi, F.; Bi, L.; Shirahama, Y.; Okada, S.; et al. Paleoearthquake history along the southern segment of the Daliangshan fault zone in the southeastern Tibetan Plateau. Tectonics 2019, 38, 2208–2231. [Google Scholar] [CrossRef]
- Kirby, E.; Whipple, K.X. Expression of active tectonics in erosional landscapes. J. Struct. Geol. 2012, 44, 54–75. [Google Scholar] [CrossRef]
- Burbank, D.W.; Anderson, S.R. Tectonic Geomorphology; Blackwell Scientific: Oxford, UK, 2001. [Google Scholar]
- Brookfield, M.E. The evolution of the great river systems of southern Asia during the Cenozoic India–Asia collision: Rivers draining southwards. Geomorphology 1998, 22, 285–312. [Google Scholar] [CrossRef]
- Keller, E.A.; Pinter, N. Active Tectonics: Earthquakes, Uplift and Landscape; Prentice Hall: Upper Saddle River, NJ, USA, 2002. [Google Scholar]
- Chen, Y.C.; Sung, Q.; Cheng, K.Y. Along-strike variations of morphotectonic features in the Western Foothills of Taiwan: Tectonic implications based on stream gradient and hypsometric analysis. Geomorphology 2003, 56, 109–137. [Google Scholar] [CrossRef]
- El Hamdouni, R.; Irigaray, C.; Fernández, T.; Chacόn, J.; Keller, E.A. Assessment of relative active tectonics, southwest border of the Sierra Nevada (southern Spain). Geomorphology 2008, 96, 150–173. [Google Scholar] [CrossRef]
- Gao, M.; Zeilinger, G.; Xu, X.; Wang, Q.; Hao, M. DEM and GIS analysis of geomorphic indices for evaluating recent uplift of the northeastern margin of the Tibetan Plateau, China. Geomorphology 2013, 190, 61–72. [Google Scholar] [CrossRef]
- Peng, X.F.; Huang, F.Z.; Zhou, R.L. Comparison of spatial interpolation mimic method for the mean annual precipitation in Yunnan Province. J. Southwest For. Univ. 2010, 30, 25–28. (In Chinese) [Google Scholar]
- Font, M.; Amorese, D.; Lagarde, J.L. DEM and GIS analysis of the stream gradient index to evaluate effects of tectonics: The Normandy intraplate area (NW France). Geomorphology 2010, 119, 172–179. [Google Scholar] [CrossRef]
- Liu-Zeng, J.; Tapponnier, J.P.; Gaudemer, Y.; Ding, L. Quantifying landscape differences across the Tibetan plateau: Implications for topographic relief evolution. J. Geophys. Res. 2008, 113, F04018. [Google Scholar] [CrossRef]
- Tapponnier, P.; Peltzer, G.; Armijo, R. On the mechanics of the collision between India and Asia. In Collision Tectonics; Coward, M.P., Ries, A.C., Eds.; Geological Society Special Publication: London, UK; Geological Society of London: London, UK, 1986; pp. 115–157. [Google Scholar]
- Pan, G.; Wang, L.; Zhu, D. Thoughts on some important scientific problems in regional geological survey of the Qinghai–Tibet Plateau. Geol. Bull. China 2004, 23, 12–19. [Google Scholar]
- Morley, C.K. Nested strike-slip duplexes, and other evidence for Late Cretaceous–Palaeogene transpressional tectonics before and during India–Eurasia collision, in Thailand, Myanmar and Malaysia. J. Geol. Soc. Lond. 2004, 161, 799–812. [Google Scholar] [CrossRef]
- Lacassin, R.; Schärer, U.; Leloup, P.H.; Arnaud, N.; Tapponnier, P.; Liu, X.; Zhang, L. Tertiary deformation and metamorphism SE of Tibet: The folded Tiger-leap décollement of NW Yunnan, China. Tectonics 1996, 15, 605–622. [Google Scholar] [CrossRef]
- Zhong, D.; Ding, L.; Liu, F.; Liu, J.; Zhang, J.; Ji, J.; Chen, H. Multi-oriented and layered structures of lithosphere in erogenic belt and their effects on Cenozoic magmatism–A case study of western Yunnan and Sichuan. China. Sci. China 2000, 43, 122–133. [Google Scholar] [CrossRef]
- Wang, E.; Burchfiel, B.C.; Royden, L.H.; Chen, L.; Chen, J.; Li, W.; Chen, Z. Late Cenozoic Xianshuihe-Xiaojiang, Red River, and Dali fault systems of southwestern Sichuan and central Yunnan, China. Spec. Pap. Geol. Soc. Am. 1998, 327, 1–108. [Google Scholar]
- Tapponnier, P.; Molnar, P. Active faulting and tectonics in China. J. Geophys. Res. 1977, 82, 2905–2930. [Google Scholar] [CrossRef]
- Allen, C.R.; Gillespie, A.R.; Han, Y.; Sieh, K.E.; Zhang, B.; Zhu, C. Red River and associated faults, Yunnan province, China: Quaternary geology, slip rate and Seismic hazard. Geol. Soc. Am. Bull. 1984, 95, 686–700. [Google Scholar] [CrossRef]
- Leloup, P.H.; Arnaud, N.; Lacassin, R.; Kienast, J.R.; Harrison, T.M.; Phan Trong, T.T.; Replumaz, A.; Tapponnier, P. New constraints on the structure, thermochronology, and timing of the Ailao Shan-Red River shear zone, SE Asia. J. Geophys. Res. 2001, 106, 6683–6732. [Google Scholar] [CrossRef]
- Ma, X. Lithospheric Dynamics Atlas of China; China Cartographic Publishing House: Beijing, China, 1989. [Google Scholar]
- Wang, E.; Burchfiel, B.C. Late Cenozoic to Holocene deformation in southwestern Sichuan and adjacent Yunnan, China, and its role in formation of the southeastern part of the Tibetan Plateau. Geol. Soc. Am. Bull. 2000, 112, 413–423. [Google Scholar] [CrossRef]
- Shi, X.; Sieh, K.; Weldon, R.; Zhu, C.; Han, Y.; Yang, J.; Robinson, S. Slip rate and rare large prehistoric earthquakes of the Red River fault, southwestern China. Geochem. Geophys. Geosystems 2018, 19, 2014–2031. [Google Scholar] [CrossRef]
- Replumaz, A.; Lacassin, R.; Tapponnier, P.; Leloup, P.H. Large river offsets and Plio-Quaternary dextral slip rate on the Red River fault (Yunnan, China). J. Geophys. Res. 2001, 106, 819–836. [Google Scholar] [CrossRef]
- Le Dain, A.Y.; Tapponnier, P.; Molnar, P. Active faults and tectonics of Burma and surrounding regions. J. Geophys. Res. 1984, 89, 453–472. [Google Scholar] [CrossRef]
- Wang, E.; Burchfiel, B.C. Interpretation of Cenozoic tectonics in the right-lateral accommodation zone between the Ailao Shan shear zone and the eastern Himalayan syntaxis. Int. Geol. Rev. 1997, 39, 191–219. [Google Scholar] [CrossRef]
- Lacassin, R.; Replumaz, A.; Leloup, P.H. Hairpin river loops and slip-sense inversion on southeast Asian strike-slip faults. Geology 1998, 26, 703–706. [Google Scholar] [CrossRef]
- Chen, S.; Wilson, C.; Deng, Q.; Zhao, X.; Luo, Z. Active faulting and block movement associated with large earthquakes in the Min Shan and Longmen mountains, northeastern Tibetan Plateau. J. Geophys. Res. 1994, 99, 24025–24038. [Google Scholar] [CrossRef]
- Tang, R.; Huang, Z.; Ma, S.; Gong, Y.; Zou, R. Basic characteristics of active fault zones in Sichuan Province. Seismol. Geol. 1995, 17, 390–396. [Google Scholar]
- Burchfiel, B.C.; Chen, Z.; Liu, Y.; Royden, L.H. Tectonics of the Longmen Shan and adjacent regions. Int. Geol. Rev. 1995, 37, 661–735. [Google Scholar] [CrossRef]
- Kirby, E.; Whipple, K.X.; Tang, W.Q.; Chen, Z.L. Distribution of active rock uplift along the eastern margin of the Tibetan Plateau: Inferences from bedrock channel longitudinal profiles. J. Geophys. Res. Solid Earth 2003, 108, 2217. [Google Scholar] [CrossRef]
- Hack, J.T. Stream-profile analysis and stream-gradient index. US Geol. Surv. J. Res. 1973, 1, 421–429. [Google Scholar]
- Gao, M.; Zeilinger, G.; Xu, X.; Tan, X.; Wang, Q.; Hao, M. Active tectonics evaluation from geomorphic indices for the central and the southern Longmenshan range on the Eastern Tibetan Plateau, China. Tectonics 2016, 35, 1812–1826. [Google Scholar] [CrossRef]
- Dehbozorgi, M.; Pourkermani, M.; Arian, M.; Matkan, A.A.; Motamedi, H.; Hosseiniasl, A. Quantitative analysis of relative tectonic activity in the Sarvestan area, central Zagros, Iran. Geomorphology 2010, 121, 329–341. [Google Scholar] [CrossRef]
- Pedrera, A.; Pérez-Peña, J.V.; Galindo-Zaldívar, J.; Azañόn, J.M.; Azor, A. Testing the sensitivity of geomorphic indices in areas of low-rate active folding (eastern Betic Cordillera, Spain). Geomorphology 2009, 105, 218–231. [Google Scholar] [CrossRef]
- Yeats, R.S.; Sieh, K.; Allen, C.R. The Geology of Earthquakes; Oxford University Press: New York, NY, USA, 1997; 568p. [Google Scholar]
- Kirby, E.; Whipple, K.X. Quantifying differential rock-uplift rates via stream profile analysis. Geology 2001, 29, 415–418. [Google Scholar] [CrossRef]
- Snyder, N.P.; Whipple, K.X.; Tucker, G.E.; Merritts, D.M. Landscape response to tectonic forcing: Digital elevation model analysis of stream profiles in the Mendocino triple junction region, northern California. Geol. Soc. Am. Bull 2000, 112, 1250–1263. [Google Scholar] [CrossRef]
- Wobus, C.W.; Whipple, K.X.; Kirby, E.; Snyder, N.; Johnson, J.; Spyropolou, K.; Crosby, B.; Sheehan, D. Tectonics from topography: Procedures, promise, and pitfalls. In Tectonics, Climate, and Landscape Evolution; Willett, S.D., Hovius, N., Brandon, M.T., Fisher, D.M., Eds.; The Geological Society of America: Boulder, CO, USA, 2006; pp. 55–74. [Google Scholar]
- Schwanghart, W.; Scherler, D. Short Communication: TopoToolbox 2—MATLAB-Based Software for Topographic Analysis and Modeling in Earth Surface Sciences. Earth Surf. Dyn. 2014, 2, 1–7. [Google Scholar] [CrossRef]
- Tao, Y.L.; Xiong, J.; Zhang, H.; Chang, H.; Li, L. Climate-driven formation of fluvial terraces across the Tibetan Plateau since 200 ka: A review. Quat. Sci. Rev. 2020, 237, 106303. [Google Scholar] [CrossRef]
- Strahler, A.N. Hypsometric (area-altitude) analysis of erosional topography. Geol. Soc. Am. Bull. 1952, 63, 1117–1141. [Google Scholar] [CrossRef]
- Hoek, E.; Brown, E.T. Practical estimates of rock mass strength. Int. J. Rock Mech. Min. Sci. 1997, 34, 1165–1186. [Google Scholar] [CrossRef]
- Whipple, K.X. Fluvial landscape response time: How plausible is steady-state denudation? Am. J. Sci. 2001, 301, 313–325. [Google Scholar] [CrossRef]
- Whipple, K.X. Bedrock rivers and the geomorphology of active orogens. Annu. Rev. Earth Planet. Sci. 2004, 32, 151–185. [Google Scholar] [CrossRef]
- Azañón, J.M.; Galve, J.P.; Pérez-Peña, J.V.; Giaconia, F.; Carvajal, R.; Booth-Rea, G.; Jabaloy, A.; Vazquez, M.; Azor, A.; Roldán, F.J. Relief and drainage evolutionduring the exhumation of the Sierra Nevada (SE Spain): Is denudation keeping pace with uplift? Tectonophysics 2015, 663, 19–32. [Google Scholar] [CrossRef]
- Schwanghart, W.; Kuhn, N.J. TopoToolbox: A set of Matlab functions for topographic analysis. Environ. Model. Softw. 2010, 25, 770–781. [Google Scholar] [CrossRef]
- Chen, K.; Yang, M.; Huang, Y.; Ching, K.; Rau, R. Vertical displacement rate field of Taiwan from geodetic levelling data 2000–2008. Surv. Rev. 2011, 43, 296–302. [Google Scholar] [CrossRef]
- Hao, M. Present Vertical Velocity Field in the Eastern Margin of Tibetan Plateau Derived from Precise Leveling. Ph.D. Thesis, Institute of Geology, China Earthquake Administration, Beijing, China, 2012. [Google Scholar]
- Hao, M.; Wang, Q.; Shen, Z.; Cui, D.; Ji, L.; Li, Y.; Qin, S. Present day crustal vertical movement inferred from precise leveling data in eastern margin of Tibetan Plateau. Tectonophysics 2014, 632, 281–292. [Google Scholar] [CrossRef]
- Ruszkiczay-Rüdiger, Z.; Braucher, R.; Novothny, A.; Csillag, G.; Fodor, L.; Molnar, G.; Madarasz, B.; ASTER Team. Tectonic and climatic control on terrace formation: Coupling in situ produced 10Be depth profiles and luminescence approach, Danube River, Hungary, Central Europe. Quat. Sci. Rev. 2016, 131, 127–147. [Google Scholar] [CrossRef]
- Davis, W.M. The geographical cycle. Geogr. J. 1899, 14, 481–504. [Google Scholar] [CrossRef]
- Mueller, E.R.; Pitlick, J. Sediment supply and channel morphology in mountain river systems: 1. Relative importance of lithology, topography, and climate. J. Geophys. Res. Earth Surf. 2013, 118, 2325–2342. [Google Scholar] [CrossRef]
- Harel, M.-A.; Mudd, S.M.; Attal, M. Global analysis of the stream power law parameters based on worldwide 10Be denudation rates. Geomorphology 2016, 268, 184–196. [Google Scholar] [CrossRef]
- Hurtrez, J.E.; Sol, C.; Lucazeau, F. Effect of drainage area on hypsometry from an analysis of small-scale drainage basins in the Siwalik hills (Central Nepal). Earth Surf. Process. Landf. 1999, 24, 799–808. [Google Scholar] [CrossRef]
- Pérez-Peña, J.V.; Azañόn, J.M.; Azor, A.; Delgado, J.; González-Lodeiro, F. Spatial analysis of stream power using GIS: SLK anomaly maps. Earth Surf. Process. Landf. 2009, 34, 16–25. [Google Scholar] [CrossRef]
- Bernard, T.; Sinclair, H.; Gailleton, B.; Mudd, S.; Ford, M. Lithological control on the post-orogenic topography and erosion history of the Pyrenees. Earth Planet. Sci. Lett. 2019, 518, 53–66. [Google Scholar] [CrossRef]
- Guo, S.; Xiang, H.; Zhang, J.; Hu, R.; Zhang, G. Discussion on the deformation band and magnitude of the 1515 Yongsheng earthquake in Yunnan province. J. Seismol. Res. 1988, 11, 153–162. [Google Scholar]
- Huang, X.; Wu, Z.; Wu, K. Surface Rupture of the 1515 Yongsheng Earthquake in Northwest Yunnan, and Its Seismogeological Implications. Acta Geol. Sin. 2018, 92, 1324–1333. [Google Scholar] [CrossRef]
- Chang, Z. Relics of the Yunnan Yongsheng M 73/4 earthquake in 1515. Seismol. Geomagn. Obs. Res. 2021, 42, 176–178. [Google Scholar]
- Yang, R.; Willett, S.D.; Goren, L. In situ low-relief landscapeformation as a result of river network disruption. Nature 2015, 520, 526–529. [Google Scholar] [CrossRef]
- Weissel, J.K.; Pratson, L.F.; Malinverno, A. The length-scaling properties of topography. J. Geophys. Res. 1994, 99, 13997–14012. [Google Scholar] [CrossRef]
- Nadeu, E.; Quiñonero-Rubio, J.M.; de Vente, J.; Boix-Fayos, C. The influence of catchment morphology, lithology and land use on soil organic carbon export in a Mediterranean mountain region. Catena 2015, 126, 117–125. [Google Scholar] [CrossRef]
- Harkins, N.W.; Anastasio, D.J.; Pazzaglia, F.J. Tectonic geomorphology of the Red Rock fault, insights into segmentation and landscape evolution of a developing range front normal fault. J. Struct. Geol. 2005, 27, 1925–1939. [Google Scholar] [CrossRef]
- Qiao, X.J.; Wang, Q.; Du, R.L. Characteristics of current crustal deformation of active blocks in the Sichuan-Yunnan region. Chin. J. Geophys. 2004, 47, 805–811. [Google Scholar] [CrossRef]
- Wang, Y.; Wang, E.; Shen, Z.; Wang, M.; Gan, W.; Qiao, X.; Meng, G.; Li, T.; Tao, W.; Yang, Y.; et al. GPS-constrained inversion of present-day slip rates along major faults of the Sichuan-Yunnan region, China. Sci. China Ser. D Earth Sci. 2008, 51, 1267–1283. [Google Scholar] [CrossRef]
- Xiang, H.; Xu, X.; Guo, S.; Zhang, W.; Li, H.; Yu, G. Sinistral thrusting along the Lijiang-Xiaojinhe fault since Quaternary and its geologic-tectonic significance-Shielding effect of transverse structure of intracontinental active block. Seismol. Geol. 2002, 24, 188–198. [Google Scholar]
- Xu, X.; Wen, X.; Zheng, R.; Ma, W.; Song, F.; Yu, G. Pattern of latest tectonic motion and dynamics of faulted blocks in Yunnan and Sichuan. Sci. China 2003, 33, 151–162. [Google Scholar]
- Zhang, C.; Xie, F.; Zhang, S. A modeling study on the controlling factors of seismic source distribution and their strength index—Practical analyses of the seismic environmental factors of the Red River fault. Acta Seismol. Sin. 2001, 23, 125–135. [Google Scholar]
- Tang, R.; Han, W.; Huang, Z.; Zian, H.; Zhang, Y. Active Faults and Earthquakes in Sichuan Province; Seismology Publishing House: Beijing, China, 1993. [Google Scholar]
- Holt, W.E.; Li, M.; Haines, A.J. Earthquake strain rates and instantaneous relative motions within central and eastern Asia. Geophys. J. Int. 1995, 122, 569–593. [Google Scholar] [CrossRef]
- Burchfiel, B.C.; Royden, L.H.; Van Der Hilst, R.D.; Hager, B.H.; Chen, Z.; King, R.W.; Li, C.; Lü, J.; Yao, H. A geological and geophysical context for the Wenchuan earthquake of 12 May 2008, Sichuan, People’s Republic of China. GSA Today 2008, 18, 4–11. [Google Scholar] [CrossRef]
- Gan, W.; Zhang, P.; Shen, Z.; Niu, Z.; Wang, M.; Wan, Y.; Zhou, D.; Cheng, J. Present-day crustal motion within the Tibetan Plateau inferred from GPS measurements. J. Geophys. Res. 2007, 112, B08416. [Google Scholar] [CrossRef]
- Liang, S.M.; Gan, W.J.; Shen, C.Z.; Xiao, G.R.; Liu, J.; Chen, W.T.; Ding, X.; Zhou, D. Three-dimensional velocity field of present-day crustal motion of the Tibetan Plateau derived from GPS measurements. J. Geophys. Res. Solid Earth 2013, 118, 5722–5732. [Google Scholar] [CrossRef]
- Wen, X.Z.; Zhang, P.Z.; Du, F. The background of historical and modern seismic activities of the occurrence of the 2008 Ms 8.0 Wenchuan, Sichuan, earthquake. Chin. J. Geophys. 2009, 52, 444–454. [Google Scholar]
- Zhang, P. Beware of slowly slipping faults. Nat. Geosci. 2013, 6, 323–324. [Google Scholar] [CrossRef]
- Zhang, P.Z.; Xu, X.W.; Wen, X.Z. Slip rates and recurrence intervals of the Longmen Shan active fault zone, and tectonic implications for the mechanism of the May 12 Wenchuan earthquake, 2008, Sichuan, China. Chin. J. Geophys. 2008, 51, 1066–1073. [Google Scholar]
- Zhang, P.Z.; Wen, X.Z.; Shen, Z.K.; Chen, J.H. Oblique, high-angle, listric-reverse faulting and associated development of strain: The Wenchuan earthquake of May 12, 2008, Sichuan, China. Annu. Rev. Earth Planet. Sci. 2010, 38, 353–382. [Google Scholar] [CrossRef]
- Song, F.; Wang, Y.; Yu, W.; Cao, Z.; Shen, X.; Shen, J. The Xiaojiang Active Fault Zone; Seismological Press: Beijing, China, 1998. [Google Scholar]
- Xu, Z.; Li, H.; Hou, L.; Fu, X. Uplift of the Longmen-Jinping orogenic belt along the eastern margin of the Qinghai-Tibet Plateau: Large-scale detachment faulting and extrusion mechanism. Geol. Bull. China 2007, 26, 1262–1276. [Google Scholar]
- Cao, K.; Wang, G.; Leloup, P.H.; Mahéo, G.; Xu, Y.; van der Beek, P.A.; Replumaz, A.; Zhang, K. Oligocene-Early Miocene topographic relief generation of southeastern Tibet triggered by thrusting. Tectonics 2019, 38, 374–391. [Google Scholar] [CrossRef]
Disclaimer/Publisher’s Note: The statements, opinions and data contained in all publications are solely those of the individual author(s) and contributor(s) and not of MDPI and/or the editor(s). MDPI and/or the editor(s) disclaim responsibility for any injury to people or property resulting from any ideas, methods, instructions or products referred to in the content. |
© 2023 by the authors. Licensee MDPI, Basel, Switzerland. This article is an open access article distributed under the terms and conditions of the Creative Commons Attribution (CC BY) license (https://creativecommons.org/licenses/by/4.0/).