Abstract
Deep learning (DL)-based object detection algorithms have gained impressive achievements in natural images and have gradually matured in recent years. However, compared with natural images, remote sensing images are faced with severe challenges due to the complex backgrounds and difficult detection of small objects in dense scenes. To address these problems, a novel one-stage object detection model named MDCT is proposed based on a multi-kernel dilated convolution (MDC) block and transformer block. Firstly, a new feature enhancement module, MDC block, is developed in the one-stage object detection model to enhance small objects’ ontology and adjacent spatial features. Secondly, we integrate a transformer block into the neck network of the one-stage object detection model in order to prevent the loss of object information in complex backgrounds and dense scenes. Finally, a depthwise separable convolution is introduced to each MDC block to reduce the computational cost. We conduct experiments on three datasets: DIOR, DOTA, and NWPU VHR-10. Compared with the YOLOv5, our model improves the object detection accuracy by 2.3%, 0.9%, and 2.9% on the DIOR, DOTA, and NWPU VHR-10 datasets, respectively.
1. Introduction
As sensor manufacturing technology advances, many professional-grade remote sensing satellites regularly launch, allowing us to collect considerable remote sensing data. Remote sensing images (RSIs) have comprehensive image coverage and a lengthy shooting distance [1]. While RSIs convey a variety of helpful features and information for object detection, they also provide considerable redundant data, making it more difficult to find small objects. Furthermore, the shape and angle of the object are variable, making analyzing and processing long-range RSIs more difficult. However, compared to natural images, RSIs have many challenges in object detection owing to their unique properties [2].
- RSIs frequently contain many small-sized objects that occupy fewer pixels in the image. Due to the layer-by-layer feature extraction in the convolutional neural network, some small and medium-sized objects are hard to maintain in the feature map of the highest layer. As a result, the model cannot collect enough information about object features, so it is prone to ignore small objects during the detection process.
- Many scenes in RSIs have dense objects, which cause overlapping of object candidate frames during the object detection process. Overlapping candidate boxes interfere with each other. In processing, it is common to erroneously eliminate the candidate frame containing the object.
- RSIs have different shooting angles, and the object’s size varies widely. Images often contain objects of various scales and sizes, which may be different sizes than the objects detected in stock photos. As a result, the shooting angles and size of the object can have a negative impact on remote sensing object detection (RSOD).
- RSIs have complex backgrounds since they are usually taken from a wide viewing angle, and the images contain backgrounds of different colors. During the detection process, the object is easily disturbed by the background, making object detection difficult.
Deep learning (DL) algorithms have advanced rapidly in recent years, and due to producing outstanding results in many fields, such as image classification [3], object detection [4], and so on [5], the task of RSOD has received significant interest from scholars [6]. With the high-resolution and massive data of RSIs, remote sensing data are no longer a barrier to study and application in RSI analysis. Therefore, RSIs are utilized successfully in a variety of industries, such as urban construction [7], environmental monitoring [8], and military reconnaissance [9]. Dong et al. [10] proposed Sig-NMS-based Faster R-CNN [11], which achieved attractive detection capabilities. In order to solve the problem of limited labels on SAR images, Liao et al. [12] proposed a modified fast region with CNN features (R-CNN) method, which has a decoding module and a domain adaptation module called FDADA for semi-supervised SAR object detection. The R-CNN-based algorithms first obtained region predictions and then forecasted the category and refined its bounds. Therefore, the method is usually known as a two-stage RSI object detection algorithm. Additionally, several experts have concentrated on investigating the one-stage RSI object detection algorithm, which can complete the entire detection in just one step. For example, Liu et al. [13] proposed the YOLO-small detection method. The method abandoned the process of seeking region proposals and directly predicted ground truth positions and categories, significantly speeding up the judicial process and providing an additional method to complement various object detection algorithm demands. To address the impact of adversarial examples on object detection from remote sensing data, Zhang et al. [14] proposed an adversarial attack method. Qu et al. [15] proposed a single-shot multibox detector with dilated convolution and feature fusion. The model utilized dilated convolutional and pyramidal feature networks to enhance the receptive field and combine a low-level feature map with a high-resolution and a high-level feature map by enhancing semantic information. Zhang et al. [16] proposed the remote sensing transformer (RST), which incorporates self-attention into ResNet and connects multiple transformer encoders. Zheng et al. [17] integrated knowledge into geospatial object detection to improve object detection accuracy. In remote sensing, the RSOD model has made significant progress by modifying and transferring one-stage and two-stage models. However, it is still unable to satisfy the demands of some practical application areas; particularly, small object detection is more likely to bring false detection results in complex backgrounds and dense scenes. Because the background is complex in RSIs, the model easily detects background interfering objects as actual objects, and the objects are densely arranged, so the model can detect dense objects as a single object.
In conclusion, in order to solve the difficulty of detecting small objects in dense scenes and complex backgrounds while maintaining relatively high accuracy, a novel one-stage object detection model called MDCT for RSOD based on multi-kernel dilated convolution (MDC) and a transformer block is proposed in this paper. First, we propose a feature enhancement module named MDC block in the one-stage object detection model to improve small objects’ ontology and adjacent spatial features. Second, we integrate a transformer block into the neck of a one-stage object detection model to precisely pinpoint objects in complex backgrounds and dense scenes. To resolve the issue of high computational costs, the depthwise separable convolution has been introduced in the MDC block. Our proposed model can handle RSIs better than the state-of-the-art one-stage object detection model. Our work makes the following contributions:
- We propose a feature enhancement module called MDC block, which combines multiple convolution kernels and dilated convolutions to improve the performance of small object feature extraction and increase the receptive field. This module is integrated into the one-stage object detection model, considering both the ontology and adjacent spatial features of small objects. It extracts high-resolution images from low-resolution images, significantly enhancing RSI detection accuracy.
- We add the transformer block into the neck of a one-stage object detection model for the problems of dense sense and complex backgrounds in RSIs. The model can utilize adequate information from shallow to deep layers. The multi-head attention mechanism attaches importance to the relevant details among many image pixels. Therefore, the block prevents the loss of object information in complex backgrounds and dense scenes.
- To solve the problem of high computational costs, we use depthwise separable convolution instead of the conventional convolution in the MDC block. This means maintaining a balance between accuracy and speed.
The remainder of this paper is structured as follows. In Section 2, we discuss related work to RSOD. In Section 3, we show the purpose of the MDCT structure and algorithm. Section 4 presents the experimental results, including comparisons with existing mainstream methods and ablation studies. Finally, we summarize our paper and discuss future work in Section 5.
2. Related Work
Due to the requirements of autonomous embedding platforms (drones or satellites), object detection algorithms must be accurate and efficient for practical applications (i.e., ship search and rescue and intelligent traffic control). As a result, numerous scientists have focused extensive attention on RSOD.
2.1. Traditional Remote Sensing Object Detection Methods
Template matching [18] includes template creation and similarity calculation. The first step is to create a template from one similar place on the reference image. Second, the floating image is searched for the most similar region to the template, and the similarity is calculated. Then, the coordinate offset of the calculated point is used to determine the object’s category. A template matching method based on a more efficient particle swarm optimization procedure and similarity calculation was proposed by An et al. [19]. This approach is sensitive to changes in the shape and density of objects and has poor stability and robustness. Therefore, it is unsuitable for large-scale applications.
Object-based image analysis (OBIA) [20] extracts features from the object and abstracts the object into an object model, object background, or environment model. This method consists of two parts: image segmentation and object categorization. First, the process divides the RSI into different regions. The regions are then classified to determine whether they included objects. Lucchese et al. [21] proposed algorithms to segment an image into areas using specific properties such as texture, color, shape, size, and grayscale. The OBIA contains much professional information on determining the segmentation area, and its algorithm is not universal.
Prior to the development of deep learning, machine learning was the focus of RSOD [22]. The idea based on the machine learning method first obtains the region of interest through the sliding window or other candidate frame extraction methods. The second stage captures the image’s middle-level semantic properties, such as a histogram of gradients (HOG) [23] and a bag of words (BOW) [24]. The method uses these properties to generate classifier models, such as the support vector machine (SVM) [25] classifier. Finally, the trained classifier model is used to identify whether an object was present in the region of interest. Cheng G et al. [26] used sliding windows for object detection in RSIs. Shi Z et al. [27] proposed a histogram of oriented gradient (HOG) feature for ship detection. It is computationally expensive because feature extractors and classifiers cannot be trained end-to-end.
2.2. Remote Sensing Object Detection Based on DL
In recent years, encouraged by the outstanding results of DL object detection algorithms, professionals and scholars have increasingly attempted to adopt them in RSOD. Thus, Cao et al. [28] introduced R-CNN into RSIs, significantly improving the RSI detection efficiency compared to traditional approaches. Following that, by adding the multiangle anchor point technique into the Faster R-CNN framework, Li et al. [29] successfully solved the rotation change problem of ground objects in RSIs. To detect airplanes in RSIs, Zhang et al. [30] proposed a multi-model approach that integrated the properties of multiple models. Furthermore, Ma et al. [31] designed a YOLO-based vessel detection network that directly predicted rotated and oriented bounding boxes. Li et al. [32] proposed a lightweight object-oriented RSI detector for complex backgrounds based on key points. Lu et al. [33] suggested an improved SSD-based detection algorithm and Laplace-NMS method to solve tiny and crowded objects in RSIs. To detect remote sensing objects of various scales while maintaining detection performance and enhancing accuracy, Xu et al. [34] developed a detection method based on YOLOv3. Furthermore, based on one-stage detection approaches, R3Det [35] and RSDet [36] focused on the tradeoff between detection speed and quality. Quadrilateral regression prediction was used by a gliding vertex [37] and RSDet to improve the object detection accuracy. Recently, axis learning [38] and O-DNet [39] were integrated with the most popular anchor-free box idea to solve many anchors in anchor-based detection methods. Huang et al. [40] proposed the RepVGG-YOLO network, which simultaneously considered model accuracy, inference speed, and object detection from any angle. To deal with small instances with limited features and complex backgrounds, Lang et al. [41] proposed a neck attention block (NAB) to improve the performance of one-stage detectors.
2.3. Remote Sensing Object Detection Based on Transformer
The breakthrough of the transformer [42] in the field of natural language processing (NLP) has aroused great interest among scholars in computer vision. The model uses visual data to create a new training network, which is successfully used for image recognition, object detection, and other tasks. The transformer’s first fundamental concept is the self-attention mechanism, which captures long-term interdependence between sequence pieces. The second benefit is used to self-train large datasets and fine-tune the object. Dosovitskiy et al. [43] proposed the vision transformer. The model splits the image into equal-sized patches, linearly embeds each patch, and adds positional embeddings before feeding the resulting sequence to a standard transformer encoder. Wu et al. [44] proposed a convolutional vision transformer, introducing convolution into the vision transformer module. It has the advantages of both convolutional neural networks and transformers, which greatly simplifies vision task design. To solve the dense distribution of objects in images and imbalance in categories problems, Zheng et al. [45] proposed an adaptive dynamic refinement one-stage transformer detector ADT-Det. Hang et al. [46] improved YOLOv5 by incorporating feature fusion and prediction heads in shallow layers and replacing the original predictions with Swin transformer predictions. Zhou et al. [47] proposed a transformer-based correlation learning detector (CLT-Det) in RSIs for object detection in dense scenes. Li et al. [48] offered transformer-based remote sensing object detection (TRD), combining multilayer transformers and CNNs.
2.4. Remote Sensing Object Detection Based on Context Information
Contextual information is widely used in various vision tasks, such as object detection [29], image segmentation [49] and video object segmentation [50]. Many researchers have tried various approaches to use context to improve object detection performance, especially for small objects, occluded objects, or complex backgrounds in RSIs. For example, Li et al. [51] developed a new object detection model called attention to context convolutional neural network (AC-CNN). The AC-CNN effectively integrates global and local contextual information into a two-stage object detection framework and provides better object detection performance. Further, Bell et al. [52] proposed an object detector utilizing information inside and outside the region of interest, called the Inside-Outside Net (ION). The network utilizes a spatial recurrent neural network to integrate contextual information beyond the region of interest. Wang et al. [53] proposed a lightweight convolutional layer called the context transformation layer (CLT), which efficiently generated and richly extracted contextual features through a contextual feature extraction module and a transformation module. To accurately identify objects in complex backgrounds, Wang et al. [54] proposed a novel context-informed refinement few-shot detector (CIR-FSD) for RSIs. To address the diversity and complexity of the appearance of geospatial objects and the lack of understanding of the spatial structure information of geospatial objects, Ma et al. [55] proposed a new multi-model decision fusion framework that takes into account contextual information and multi-region features.
In summary, these works focus on solving the unbalanced detection and classification problems of remote sensing images, complex backgrounds, and many dense scenes. However, small objects in dense scenes and complex backgrounds are not considered. Therefore, our work focuses on small objects in dense scenes and complex backgrounds, and we propose a novel one-stage object detection model based on multi-kernel dilated convolution and a transformer.
3. Methodology
3.1. Proposed Model Overview
Considering that the RSI objects are small and the features are not obvious in the complex background, it is difficult for the model to extract and preserve features. In addition, the main cascading method has nothing to do with the context in the one-stage object detection model, which easily leads to the loss of feature information and makes it difficult to distinguish between the object and background features in dense scenes and complex backgrounds.
The MDCT framework is shown in Figure 1. Two new modules are integrated to improve the detection accuracy of the one-stage object detection model. In the backbone, a feature enhancement module called MDC block is developed to enhance small objects’ ontology and adjacent spatial features, making key features distinguishable. In the neck, the transformer block is integrated to make it fully capture the context features in the object and prevent the loss of information. To further reduce the computational cost of the model, standard convolutions are replaced by depthwise separable convolutions in the MDC block.
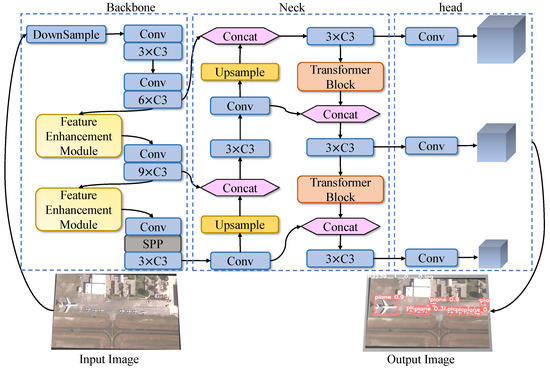
Figure 1.
The MDCT framework. We propose a feature enhancement module to improve the features of small objects in the backbone. In addition, we integrate a transformer block to capture the context features of the object in the neck.
3.2. Feature Enhancement Module
The fundamental component of the feature enhancement module is the fusion of different dilated rate convolutions [56] and various convolution kernel size features. In comparison to conventional convolution, dilated convolution introduces the dilated rate parameter, which can effectively increase the convolution kernel’s receptive field. When extracting convolution features from RSIs, dilated convolution can extract more global features than standard convolution. The process does not increase the parameters and obtains more helpful information. The receptive field of the dilated convolution is dilated from 3 × 3 to 5 × 5 compared to the conventional convolution operation. It can collect more feature information about objects and complement and enhance adjacent spaces in RSOD.
In addition to improving object detection with dilated convolutions, this module uses a sparse connection structure similar to the inception structure. Its purpose is to extract features from images using convolution kernels of different sizes. Using convolution kernels of various sizes can improve the model’s detection at multiple resolutions and extend the model’s receptive field. The convolution differs from the dilated convolution in that the pixels in the convolution are continuous and focus on the convolution’s features. The fusion of multiscale features is achieved by splicing the characteristics of different convolution kernels.
This module also employs MobileNet’s [57] depthwise separable convolution to reduce high computational costs generated by fusing different dilation rates and convolution kernels. The structure is shown in Figure 2. Depthwise separable convolution is the division of a convolution operation into two stages: depthwise convolution and pointwise convolution (also known as 1 × 1 convolution).
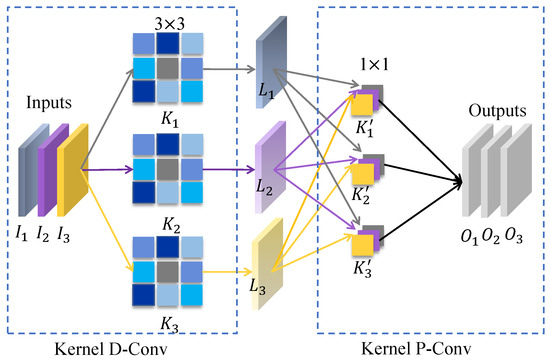
Figure 2.
Depthwise separable convolution architecture, where ,, represent inputs, ,,, and , , represent convolution kernels, , , represent intermediate layer outputs, , , represent outputs.
When compared to conventional convolutions, depthwise convolution only convolves one stream of the source, significantly reducing the number of model parameters. The pointwise convolution performs typical convolution operations, but its convolution kernel has a size of 1 × 1. It has fewer parameters than large-sized convolution kernels. Depthwise separable convolution can significantly reduce the number of calculations without losing accuracy, thereby accelerating the detection speed. The computational cost of depthwise separable convolution is as follows:
where L represents the size of the input image, k represents the convolution kernel size, and and are denoted as the convolution kernel and input channel numbers, respectively. The computational complexity is decreased:.
We propose the feature enhancement module by combining the characteristics of dilated convolution, multi-kernel convolution, and depthwise separable convolution. The feature enhancement module structure is depicted in Figure 3.
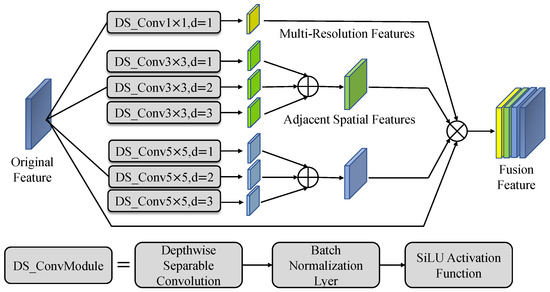
Figure 3.
The feature enhancement module with multi-kernel dilated convolution (MDC).
Define x as the original feature input to the feature enhancement module. is the convolution operation used to acquire the features of the adjacent space, with a convolution kernel of k and a dilation rate of d. This module accumulates the convolution features of different dilation rates under the same convolution kernel. It obtains the multi-resolution features of each convolution kernel’s object as follows:
Because the size of the convolution kernel is 1, the size of the convolution receptive field is always 1, and dilated convolution cannot extend the receptive field. The final fusion features are as follows:
Accumulating different convolution kernels produces multi-resolution features. It effectively enhances the object features in the corresponding region and the global features of the adjacent space around the object. The convolution block in the convolution process consists of three components: a depthwise separable convolution layer with specified parameters, a batch normalization layer, and a nonlinear SiLU activation function. Depthwise separable convolutional layers lower the number of computations utilized in convolution operations while enhancing representation efficiency. The role of the batch normalization layer is to normalize the data obtained by convolution, which can effectively accelerate training convergence, reduce regularization processes such as dropout, L1, and L2, and prevent overfitting. In addition, it can also improve the accuracy of model training. The nonlinear unit uses the SiLU activation function, which has no upper and lower bounds and is very smooth, making it perform very well in object detection and classification tasks. Most of the current mainstream detection frameworks use the SiLU activation function.
The feature enhancement module combines multi-resolution features with adjacent spatial features. Then, the multi-resolution features are fused to enhance the fusion features of RSOD information. They can assist in increasing object detection precision. The difference is in the number of multi-resolution features. Specifically, the larger the number of multi-resolution features, the greater the detection accuracy improves, but the computational cost requires increases. Therefore, depthwise separable convolution is introduced, reducing the computational cost.
3.3. Transformer Block
Some objects in RSIs are in dense scenes and complex backgrounds, and the end of the model has relatively poor feature mapping capabilities for low-resolution images, which easily leads to the loss of feature information. Therefore, inspired by visual transformers, we add a transformer block to the neck of the one-stage object detection model. The end of each stage enables the model to learn local and global representations in shallow layers. The inner structure transformer block is described in Figure 4.
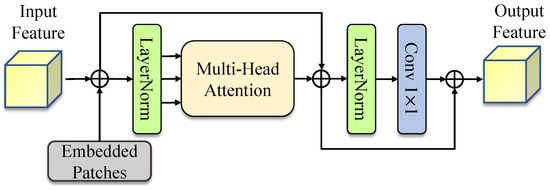
Figure 4.
The inner structure of the transformer block.
The image is built hierarchically by the transformer block, and each layer models the local and global relationship while expanding the receptive field. Each transformer block consists of two sublayers: the first is a multi-head attention layer. The structural design of multi-head attention allows each attention mechanism to optimize different feature parts of each image and balance the possible deviations of the exact attention mechanism. Furthermore, it enables the object to have feature representations from more diversity. The second sublayer is composed of LayerNorm and a 1 × 1 convolution. In this way, it not only has a global receptive field similar to the transformer-like structure but also generates position-sensitive features such as local convolution, which can overcome the problem of relying on the self-attention structure to extract global features. Each sublayer is connected using residual connections. In addition, each sublayer normalizes the layer. After passing through the multilayer computations, the parameters may become too large or too small as the number of network layers rises. The learning process is abnormal during the training process, and the model convergence is poor. As a result, the normalization layer has several layers to normalize the results within an acceptable range. The transformer block improves the ability to capture different local information and prevents the loss of object information in complex backgrounds and dense scenes.
3.4. One-Stage Multiscale Detection Network
One-stage object detection models are an excellent choice for tasks that require high real-time performance, such as object detection in RSIs. For accurate object detection, multiscale feature pyramids are also essential. Therefore, we propose an MDCT model based on the current mainstream one-stage object detection framework YOLOv5 [58]. The YOLOv5 framework comprises three parts: the backbone network, the neck network, and the detection head.
3.4.1. Backbone Network
The backbone network is the foundation of the detection network, which is used for feature extraction on the object image. The framework first performs slice downsampling on the object image and completes twice as much downsampling on the input image without losing any information. The sampled feature image will go through the feature extraction modules four times consisting of a convolution module and C3 bottleneck block. The C3 bottleneck block structure is depicted in Figure 5. This layer structure adopts the design of the residual block similar to ResNet, which can effectively avoid overfitting while performing deep convolution on the features. This module also assumes the form of separable convolution and decreasing computational cost.
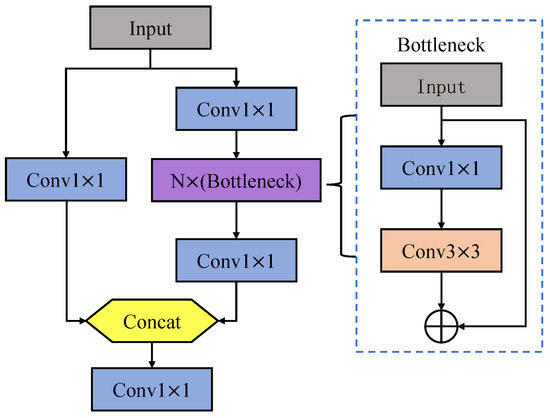
Figure 5.
C3 bottleneck block structure.
The backbone network extracts three layers of features in total. Before the C3 bottleneck block of the last feature extraction, the spatial pyramid pooling method [59] is used to adjust the size of the features. The spatial pyramid pooling module expands the receptive field and promotes feature stacking. Its structure is shown in Figure 6.

Figure 6.
Spatial pyramid pooling module.
3.4.2. Neck Network
The backbone network extracts three different scale features and then transmits them to the neck network feature pyramid for multiscale feature fusion. The fusion method of the feature pyramid adopts the PANet network pyramid structure [60], which is first top-down, and then bottom-up bidirectional fusion. Compared with the traditional top-down feature pyramid, the fusion method of the bidirectional pyramid has more obvious performance improvement for object detection, especially for small-area objects.
3.4.3. Detection Head
The bidirectional feature pyramid extracts and merges multiscale features to produce three-scale features. Based on these three characteristics, the object detection head will detect and classify them. The anchor frame-based detection approach utilizes the YOLOv5 framework. The object consists of several predetermined previous frames with different aspect ratios centered on the anchor point. The predicted anchor frames are then regressed using a loss function. Finally, we obtain the exact position of the object in the image.
3.5. Loss Function
Related to the structure of YOLOv5, the loss function of the object frame is determined using the CIoU method so that the MDCT model converges smoothly. Here, b and are defined as the predicted frame and the actual object frame, respectively, and is the Euclidean distance between the two frames’ center coordinates. c is the diagonal distance of the most diminutive frame that can wrap the two edges. The formula for CIoU is as follows:
where is the weight rate, and v denotes the consistency parameter, quantifying the aspect relationship between the two boxes. The specific calculation is as follows:
The final loss function is as follows:
Furthermore, the BCEWithLogitsLoss loss function is utilized to limit the object’s confidence loss and classification loss. The formula is as follows:
where M represents the number of batches, m represents the number of labels to forecast in every batch, and represents the sigmoid function used to map x to the interval of (0, 1).
From this, the final loss function of RSOD can be obtained as follows:
where N represents the number of detection layers, and B represents the number of objects whose labels are assigned to the last frame. represents the number of networks divided into each scale, , , and indicate the loss of the object bounding box, confidence, and classification, respectively, and , and are the weights of the three loss functions. The parameters of the loss function are adjusted many times during the training stage as the features are retrieved layer by layer. Then, the result is a trained object detection weight model. The MDCT first-level object detection model enhances detection performance and boosts detection efficiency. Algorithm 1 exhibits the pseudocode of the one-stage RSI object detection algorithm combining with the feature enhancement module and transformer block.
| Algorithm 1 One-stage RSOD algorithm. |
|
4. Experiments
In this section, the experiments of the RSOD algorithm are carried out on three commonly used remote sensing datasets: DIOR [61], DOTA [62], and NWPU VHR-10 [63]. We display the comprehensive process of our experiments, including the experimental design and parameter configuration, comparing our model with the current mainstream models and experimental results. Furthermore, ablation studies on the DIOR dataset were used to demonstrate the effectiveness of each component. Our algorithm was implemented in torch 1.8.1 with a Python wrapper, and it runs on an Intel Core i7-10700CPU, NVIDIA GeForce RTX 3090 GPU. In training, on all three datasets, the SGD optimizer was used. The learning rate is 0.01, the weight decay is 0.0005, and the momentum is 0.937.
4.1. Dataset Introduction
- DIOR Dataset.The DIOR dataset is a massive object detection benchmark dataset for RSIs. The dataset includes 23,463 optical images and 192,472 instances from 20 different item classes. The 20 object classes are airplane, airport, baseball field (BF), basketball court (BC), bridge, chimney, dam, expressway service area (ESA), expressway toll station (ETS), golf court (GC), ground track field (GF), harbor, overpass, ship, stadium, storage tank (ST), tennis court (TC), train station (TS), vehicle, windmill.
- DOTA Dataset. The DOTA dataset is one of the large datasets for object detection in RSIs. There are 2806 RSIs in total from a range of sensors and platforms. Each image features items of various sizes, orientations, and shapes and ranges in resolution from 800 × 800 to 4000 × 4000 pixels. Experts annotated these DOTA images using 15 common object categories, including plane, baseball diamond (BD), bridge, ground track field (BF), small vehicle (SV), large vehicle (LV), ship, tennis court (TC), basketball court (BC), storage tank (ST), soccer ball field (SF), roundabout (RA), harbor, swimming pool (SP), helicopter.
- NWPU VHR-10 Dataset. The NWPU VHR-10 dataset consists of 800 high-resolution images selected from the Google Earth and Vaihingen databases. The experts then manually annotated 10 common object categories, including airplane, ship, storage tank (ST), baseball diamond (BD), tennis court (TC), basketball court (BC), ground track field (GF), harbor, bridge, and vehicle.
4.2. Evaluation Metrics
Some commonly used RSOD metrics are utilized in the experiments to analyze the effectiveness of the proposed model. Precision (P): the probability of the actual positive sample among all predicted positive samples. Precision helps to highlight the relevance of results. Recall (R): the likelihood of being anticipated to be positive among actual positive examples. The following is the calculating formula:
where , ,, and represent true positives, false positives, false negatives, and true negatives, respectively, stands for the number of BBoxes, and stands for the total number of objects to be detected. The AP metric considers precision and recall, and the calculation formula is as follows:
This formula expresses the average precision with recall between 0 and 1. The average value of AP for each category is mAP, and the above is the computation formula:
where N refers to the number of object categories, mAP@.5 refers to the mAP of all classes at IoU = 0.5, and mAP@.5:.95 refers to the average mAP of IOU between 0.5 and 0.95. IoU is the intersection ratio, and the index quantity used to determine the level of overlap between two regions. The above is the computational formula:
where X denotes the object frame predicted by the model, and Y denotes the real object frame of the image.
4.2.1. Experiments on the DIOR Dataset
In the DIOR dataset, we compare with SOTA methods: TRD, the end-to-end cross-scale feature fusion network [64], MFPNet [65], FRPNet [66], FSoD-Net [67], the generating anchor boxes based on an attention mechanism network [68], and CANet [69]. Table 1 displays the results.

Table 1.
The results of various detection algorithms on the DIOR dataset. The highest AP in each category is highlighted. The mAP () represents IOU = 0.5. The Dataset Set represents the training set and test set.
Table 1 shows that our proposed MDCT method outperforms other methods, and the mAP can reach 80.5%. The mAP numbers reflect the best experimental performance of our model compared to other models. When analyzing DIOR-specific kinds of APs, the following conclusions can be drawn: our model improves AP in detecting 10 categories such as airplanes, airports, baseball fields, etc. We can see that the ground track field and overpass categories, easily disturbed by the background, reach 92.9% and 83.8%. For the shape-variable chimney category, our proposed model achieves 90.2%. Furthermore, the proposed method has outstanding performance for small objects: airplane mAP0.5 achieves 92.5%, which is 3.6% higher than the second-best approach. Part of the reason is that the feature enhancement module can consider both object ontology and adjacent spatial features. Another reason is that it benefits from the transformer’s use of attention to capture the global context information, thereby favorably distinguishing the object from the background.
Figure 7 further illustrates the prediction representation outcomes of particular remote sensing objects on DIOR to show the forecasting outcomes of our suggested model. As observed in Figure 7, the dataset contains many RSIs with high-density small objects, which obscures some objects, such as the top right plot accurately detecting the ship. Our model can capture different local information and accurately localize objects in high-density scenes. Additionally, our model can successfully grasp features surrounding the center of distant sensing objects and precisely pinpoint them.
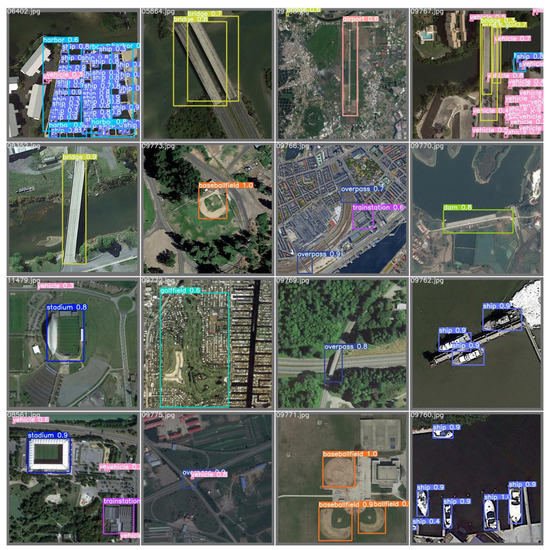
Figure 7.
Results predicted by MDCT on DIOR, which contains the ship, harbor, bridge, vehicle, baseball field, overpass, dam, golf field, stadium, and train station.
4.2.2. Experiments on the DOTA Dataset
In the DOTA dataset, we compare with the SOTA methods: SE-SSD [70], the multiscale spatial and channel-wise attention network [71], FSoD-Net [67], HyNet [72], and the baseline YOLOv5. Table 2 displays the AP and mAP of each method’s distinct categories.

Table 2.
Results of different detection methods on the DOTA dataset, the highest AP in each category is shown in bold. The mAP () represents IOU = 0.5. The Dataset Set represents the training set, validation set, and test set.
Table 2 demonstrates that our proposed MDCT model is evaluated on the DOTA dataset, and mAP can obtain 75.7%, indicating that our proposed model outperforms other baseline methods. When considering DOTA-specific APs, the following outcomes are observed: our model improves AP detection in nine categories, including plane, baseball diamond, bridge, and so on. Among these, the baseball diamond category is 14.0% higher than the current best model, while the ground track field category is 12.7% higher. We can see that MDCT can accurately detect small objects and objects disturbed by the background, including small objects (plane and vehicle) and objects disturbed by the background (ground track field and roundabout).
Figure 8 shows some examples of the visual prediction results. It can be seen in Figure 8 that the MDCT can detect small objects (plane) and objects that are prone to background interference (ground track field and tennis court). By adding a feature enhancement module and a transformer block to the one-stage object detection model, the proposed model overcomes the difficulty of detecting small objects in dense fields and interference of background and achieves accurate detection.
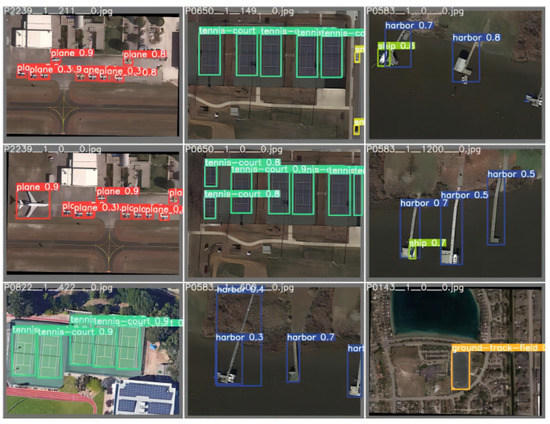
Figure 8.
Results predicted by MDCT on DOTA, which includes the plane, tennis court, harbor, and ground track field.
4.2.3. Experiments on the NWPU VHR-10 Dataset
We divide the NWPU VHR-10 dataset into training and test sets at a ratio of 3:1. We compare with the SOTA approaches: the rotation-insensitive and context-augmented network [29], CAD-Net [73], LFPNet [74], CANet [69] and the baseline YOLOv5. Table 3 displays the results.

Table 3.
The outcomes of various detection algorithms on the NWPU VHR-10 dataset. The highest AP in each category is highlighted in bold. The mAP () represents IOU = 0.5. The Dataset Set represents the training set and test set.
As shown in Table 3, our suggested MDCT model achieves 95.7% mAP on NWPU VHR-10. This mAP value indicates that our model outperforms other baseline methods in experimental performance. The following conclusions can be reached by analyzing NWPU VHR-10 particular types of APs: our model achieved AP improvements in the detection of the baseball diamond, tennis court, and vehicle, and the AP numbers were 98.1%, 99.0%, and 94.9%, respectively.
Figure 9 illustrates the prediction depiction outcomes of particular remote sensing objects on NWPU VHR-10 to further highlight the forecasting outcomes of the proposed model. Figure 9 shows some not apparent objects easily disturbed by the background. For example, the look of these bridges is quite similar to the appearance of the road, and basketball and baseball grounds are sometimes confused with grass fields. However, the MDCT instructs our model to accurately capture the features around the core of the remote sensing object. In this case, the high-resolution middle features exclude background effects.
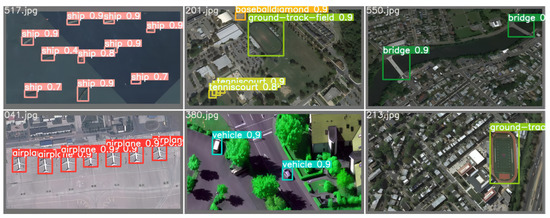
Figure 9.
MDCT predicted the results for NWPU VHR-10, including the ship, baseball diamond, ground track field, tennis court, bridge, airplane, and vehicle.
In conclusion, the experimental results on these three datasets show that MDCT outperforms other SOTA methods in terms of detection performance. The model has good generalization and robustness and achieves good results on multiple datasets.
4.3. Ablation Study
We undertake ablation studies using the DIOR dataset to evaluate the effectiveness of each component in our proposed MDCT. Table 4 displays the results. Table 4 contains baselines added to each module mAP.05, mAP.5:.95, precision, recall, parameter, and GFLOPs. The inference time is the final average of the 100-times test.

Table 4.
Ablation study on DIOR, the highest AP in each category is shown in bold.
The effect of multiple convolution kernels:
Figure 10 shows the MDC-K module containing only multi-kernel fusion features. This component adds to the baseline YOLOv5 object detection model. Table 4 illustrates the detection results in the third column: the parameters changed from 7.1 to 10.3, the GFLOPs changed from 16.5 to 32.9, the inference time is also increased by 10.8 ms, and the model performance changed slightly.
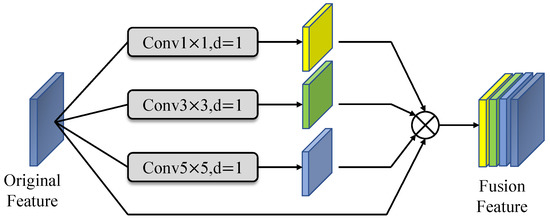
Figure 10.
Multiconvolution kernel fusion structure (MDC-K).
The effect of multiple dilated rate convolutions: Figure 11 shows the MDC-D module containing only multi-dilation rate convolutional fusion features. Add this module to the baseline YOLOv5 object detection model. Table 4 shows the detection results in the fourth column: while the parameters changed from 7.1 to 9.65 and the GFLOPs changed from 16.5 to 29.6, the inference time only increased by 0.8 ms, and the model mAP.5 and mAP.5:.95 both improved by 1.6% and 1.5%, respectively.
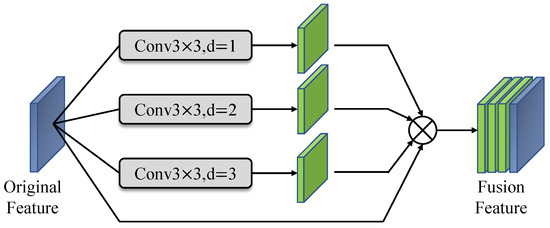
Figure 11.
Multidilated rate convolution fusion structure (MDC-D).
The effects of feature enhancement module: The MDC block replaces standard convolutions with depthwise separable convolutions. The fifth column of Table 4 displays the detection results. The feature enhancement module integrating multiple convolution kernels and various dilation rates dramatically enhanced the AP of the airplane and chimney in the experiment, which strengthens the ontology features and adjacent features of small objects. Table 5 compares several metrics before and after adopting depthwise separable convolution. The number of parameters is reduced by 49.4%, the GFLOPs are decreased by 60.9%, and the inference time only increased by 2.9% while producing the same result as conventional convolution.

Table 5.
Comparison of metrics without and with depthwise separable convolution (DWS).
Effect of the transformer block: To address the issue that RSIs contain high-density and complex background objects, which obscure particular objects, we add a transformer block to each prediction head. The last column in Table 4 includes the detection results: mAP.5 improved by 2.3%, mAP.5:.95 improved by 2.2%, precision improved by 3.4%, recall improved by 0.7%, and the inference time is 12.8 ms. A ship category is a high-density object, but its AP is significantly increased owing to the feature enhancement module and transformer block capacity to gather global and rich relevant information. In the experiments, the AP of the golf court and overpass categories improve because it is simple to identify grass and roads in these categories. The feature enhancement module and transformer block are added to enhance the object feature, overcome background interference, and achieve accurate detection.
In order to verify the performance of our proposed model MDCT in detecting small objects in dense scenes and the ability to overcome background interference, we tested in YOLOv5, YOLOv5+MDC, YOLOv5+MDC+Transformer Block (MDCT) on DIOR. Figure 12 shows the example detection results for small objects in dense scenes. We can see that although YOLOv5 can fully detect the ship, it mistakenly detects the vehicle as a ship and only detects four harbors. YOLOv5+MDC can accurately detect ships and harbors, but there is still one less vehicle. Our MDCT can correctly detect all ships, vehicles, and harbors without errors. Figure 13 shows example detection results in background interference. We can see that the stadium is easily affected by the surrounding grass. Therefore, YOLOv5 only detects one vehicle, while YOLOv5+MDC can detect two vehicles. Our MDCT can correctly detect stadiums and vehicles. The above examples confirm that our proposed MDCT can accurately detect small objects in dense scenes and overcome background interference.
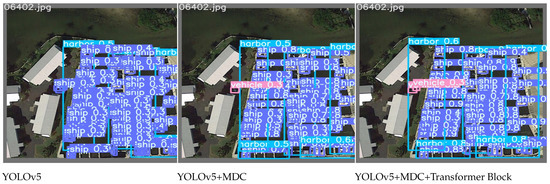
Figure 12.
The detection results of small object instances in dense scenes.
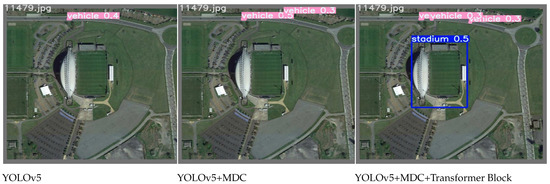
Figure 13.
The example detection results in background interference.
5. Conclusions
In this paper, a novel one-stage object detection model, MDCT, based on multi-kernel dilated convolution and a transformer is proposed to solve the problem of difficult detection of small objects in dense scenes and complex backgrounds. To enhance small objects’ features and make key features distinguishable, we first propose a new feature enhancement module named the MDC block, which is integrated into the backbone network of the one-stage object detection model. Second, we add a transformer block to the neck network of the one-stage object detection model, which can capture the contextual features of small objects and prevent the loss of object information in complex backgrounds and dense scenes. Finally, we use depthwise separable convolution instead of standard convolution in each MDC block to reduce the computational cost of the model. We conduct research on three remote sensing image datasets DIOR, DOTA, and NWPU VHR-10 to verify the performance of the MDCT model. In particular, our model achieves the mAP of 80.5%, 75.7%, and 95.7% on DIOR, DOTA, and NWPU VHR-10, respectively. The results of the experiments reveal that this approach outperforms SOTA methods. Further, we undertake ablation studies on the DIOR dataset to validate the effectiveness of each module. The experimental results indicate that each module considerably enhances RSOD’s accuracy.
In our future work, we will concentrate on the issue of RSIs being difficult to detect due to variable shooting angles to further improve the performance of RSOD. In addition, we will further study accelerated methods for small object detection in RSIs in dense scenes and complex backgrounds so that it can achieve a balance between accuracy and inference time.
Author Contributions
Conceptualization, J.C., B.S. and C.C.; methodology, J.C., H.H. and J.X.; experiments, J.C. and J.G.; resources, H.H. and B.S.; writing—original draft preparation, J.C. and J.X.; writing—review and editing, J.C., J.G., C.C. and J.X.; supervision, H.H. and B.S. All authors have read and agreed to the published version of the manuscript.
Funding
This work has been supported by the National Natural Science Foundation of China (Nos. 62071354, 62201419), the Key Research and Development Program of Shaanxi (Program No. 2023-YBGY-218) and also supported by the ISN State Key Laboratory.
Data Availability Statement
No applicable.
Conflicts of Interest
The authors declare no conflict of interest.
References
- Zhang, Q.; Cong, R.; Li, C.; Cheng, M.M.; Fang, Y.; Cao, X.; Zhao, Y.; Kwong, S. Dense Attention Fluid Network for Salient Object Detection in Optical Remote Sensing Images. IEEE Trans. Image Process. 2020, 30, 1305–1317. [Google Scholar] [CrossRef] [PubMed]
- Zhong, P.; Wang, R. A multiple conditional random fields ensemble model for urban area detection in remote sensing optical images. IEEE Trans. Geosci. Remote Sens. 2007, 45, 3978–3988. [Google Scholar] [CrossRef]
- He, Z. Deep Learning in Image Classification: A Survey Report. In Proceedings of the 2020 2nd International Conference on Information Technology and Computer Application (ITCA), Guangzhou, China, 18–20 December 2020; pp. 174–177. [Google Scholar]
- Lim, J.-S.; Astrid, M.; Yoon, H.-J.; Lee, S.-I. Small object detection using context and attention. In Proceedings of the 2021 International Conference on Artificial Intelligence in Information and Communication (ICAIIC), Jeju Island, Republic of Korea, 13–16 April 2021; pp. 181–186. [Google Scholar]
- Zhang, H.; Luo, G.; Li, J.; Wang, F.-Y. C2FDA: Coarse-to-Fine Domain Adaptation for Traffic Object Detection. IEEE Trans. Intell. Transp. Syst. 2022, 23, 12633–12647. [Google Scholar] [CrossRef]
- Li, Z.; Wang, Y.; Zhang, N.; Zhang, Y.; Zhao, Z.; Xu, D.; Ben, G.; Gao, Y. Deep Learning-Based Object Detection Techniques for Remote Sensing Images: A Survey. Remote Sens. 2022, 14, 2385. [Google Scholar] [CrossRef]
- Lin, A.; Sun, X.; Wu, H.; Luo, W.; Wang, D.; Zhong, D.; Wang, Z.; Zhao, L.; Zhu, J. Identifying Urban Building Function by Integrating Remote Sensing Imagery and POI Data. IEEE J. Sel. Top. Appl. Earth Obs. Remote Sens. 2021, 14, 8864–8875. [Google Scholar] [CrossRef]
- Chen, Z.; Zhou, Q.; Liu, J.; Wang, L.; Ren, J.; Huang, Q.; Deng, H.; Zhang, L.; Li, D. Charms—China agricultural remote sensing monitoring system. In Proceedings of the 2011 IEEE International Geoscience and Remote Sensing Symposium (IGARSS), Vancouver, BC, Canada, 24–29 July 2011; pp. 3530–3533. [Google Scholar]
- Shimoni, M.; Haelterman, R.; Perneel, C. Hypersectral imaging for military and security applications: Combining myriad processing and sensing techniques. IEEE Geosci. Remote Sens. Mag. 2019, 7, 101–107. [Google Scholar] [CrossRef]
- Dong, R.; Xu, D.; Zhao, J.; Jiao, L.; An, J. Sig-NMS-Based Faster R-CNN Combining Transfer Learning for Small Target Detection in VHR Optical Remote Sensing Imagery. IEEE Trans. Geosci. Remote Sens. 2019, 57, 8534–8545. [Google Scholar] [CrossRef]
- Ren, S.; He, K.; Girshick, R.; Sun, J. Faster r-cnn: Towards real-time object detection with region proposal networks. Adv. Neural Inf. Process. Syst. 2015, 28, 91–99. [Google Scholar] [CrossRef]
- Liao, L.; Du, L.; Guo, Y. Semi-Supervised SAR Target Detection Based on an Improved Faster R-CNN. Remote Sens. 2021, 14, 143. [Google Scholar] [CrossRef]
- Liu, X.; Yang, Z.; Hou, J.; Huang, W. Dynamic Scene’s Laser Localization by NeuroIV-Based Moving Objects Detection and LiDAR Points Evaluation. IEEE Trans. Geosci. Remote Sens. 2022, 60, 5230414. [Google Scholar] [CrossRef]
- Zhang, Y.; Zhang, Y.; Qi, J.; Bin, K.; Wen, H.; Tong, X.; Zhong, P. Adversarial Patch Attack on Multi-Scale Object Detection for UAV Remote Sensing Images. Remote Sens. 2022, 14, 5298. [Google Scholar] [CrossRef]
- Qu, J.; Su, C.; Zhang, Z.; Razi, A. Dilated convolution and feature fusion SSD network for small object detection in remote sensing images. IEEE Access 2020, 8, 82832–82843. [Google Scholar] [CrossRef]
- Zhang, J.; Zhao, H.; Li, J. TRS: Transformers for Remote Sensing Scene Classification. Remote Sens. 2021, 13, 4143. [Google Scholar] [CrossRef]
- Zheng, K.; Dong, Y.; Xu, W.; Su, Y.; Huang, P. A Method of Fusing Probability-Form Knowledge into Object Detection in Remote Sensing Images. Remote Sens. 2022, 14, 6103. [Google Scholar] [CrossRef]
- Kim, T.; Park, S.R.; Kim, M.G.; Jeong, S.; Kim, K.O.J.P.E.; Sensing, R. Tracking Road Centerlines from High Resolution Remote Sensing Images by Least Squares Correlation Matching. Photogramm. Eng. Remote Sens. 2004, 70, 1417–1422. [Google Scholar] [CrossRef]
- An, R.; Gong, P.; Wang, H.; Feng, X.; Xiao, P.; Chen, Q.; Yan, P. A modified PSO algorithm for remote sensing image template matching. Photogramm. Eng. Remote Sens. 2010, 76, 379–389. [Google Scholar]
- Rizvi, I.A.; Mohan, K.B. Object-Based Image Analysis of High-Resolution Satellite Images Using Modified Cloud Basis Function Neural Network and Probabilistic Relaxation Labeling Process. IEEE Trans. Geosci. Remote Sens. 2011, 49, 4815–4820. [Google Scholar] [CrossRef]
- Luccheseyz, L.; Mitray, S.K. Color image segmentation: A state-of-the-art survey. Proc. Indian Natl. Sci. Acad. 2001, 67, 207–221. [Google Scholar]
- Huang, Y.; Wu, Z.; Wang, L.; Tan, T. Feature Coding in Image Classification: A Comprehensive Study. IEEE Trans. Softw. Eng. 2013, 36, 493–506. [Google Scholar]
- Dalal, N.; Triggs, B. Histograms of Oriented Gradients for Human Detection. In Proceedings of the IEEE Computer Society Conference on Computer Vision & Pattern Recognition, San Diego, CA, USA, 20–25 June 2005. [Google Scholar]
- Fei-Fei, L.; Perona, P. A Bayesian hierarchical model for learning natural scene categories. In Proceedings of the 2005 IEEE Computer Society Conference on Computer Vision and Pattern Recognition (CVPR05), San Diego, CA, USA, 20–25 June 2005. [Google Scholar]
- Melgani, F.; Bruzzone, L. Classification of hyperspectral remote sensing images with support vector machines. IEEE Trans. Geosci. Remote Sens. 2004, 42, 1778–1790. [Google Scholar] [CrossRef]
- Cheng, G.; Han, J.; Guo, L.; Qian, X.; Zhou, P.; Yao, X.; Hu, X. Object detection in remote sensing imagery using a discriminatively trained mixture model. ISPRS J. Photogramm. Remote Sens. 2013, 85, 32–43. [Google Scholar] [CrossRef]
- Shi, Z.W.; Yu, X.R.; Jiang, Z.G.; Li, B. Ship Detection in High-Resolution Optical Imagery Based on Anomaly Detector and Local Shape Feature. IEEE Trans. Geosci. Remote Sens. 2014, 52, 4511–4523. [Google Scholar]
- Cao, Y.; Niu, X.; Dou, Y. Region-based convolutional neural networks for object detection in very high resolution remote sensing images. In Proceedings of the 12th International Conference on Natural Computation, Fuzzy Systems and Knowledge Discovery (ICNC-FSKD), Changsha, China, 13–15 August 2016. [Google Scholar]
- Li, K.; Cheng, G.; Bu, S.; You, X. Rotation-Insensitive and Context-Augmented Object Detection in Remote Sensing Images. IEEE Trans. Geosci. Remote Sens. 2018, 56, 2337–2348. [Google Scholar] [CrossRef]
- Zhang, Y.H.; Fu, K.; Sun, H.; Sun, X.; Zheng, X.W.; Wang, H.Q. A multi-model ensemble method based on convolutional neural networks for aircraft detection in large remote sensing images. Remote Sens. Lett. 2018, 9, 11–20. [Google Scholar] [CrossRef]
- Liu, W.; Ma, L.; Chen, H. Arbitrary-Oriented Ship Detection Framework in Optical Remote-Sensing Images. IEEE Geosci. Remote Sens. Lett. 2018, 15, 937–941. [Google Scholar] [CrossRef]
- Li, Y.; Mao, H.; Liu, R.; Pei, X.; Jiao, L.; Shang, R. A Lightweight Keypoint-Based Oriented Object Detection of Remote Sensing Images. Remote Sens. 2021, 13, 2459. [Google Scholar] [CrossRef]
- Lu, X.; Ji, J.; Xing, Z.; Miao, Q. Attention and feature fusion SSD for remote sensing object detection. IEEE Trans. Instrum. Meas. 2021, 70, 5501309. [Google Scholar] [CrossRef]
- Xu, D.; Wu, Y. Improved YOLO-V3 with DenseNet for multi-scale remote sensing target detection. Sensors 2020, 20, 4276. [Google Scholar] [CrossRef]
- Yang, X.; Liu, Q.; Yan, J.; Li, A. R3Det: Refined Single-Stage Detector with Feature Refinement for Rotating Object. arXiv 2019, arXiv:1908.05612. [Google Scholar] [CrossRef]
- Qian, W.; Yang, X.; Peng, S.; Guo, Y.; Yan, J. Learning Modulated Loss for Rotated Object Detection. arXiv 2019, arXiv:1911.08299. [Google Scholar] [CrossRef]
- Xu, Y.; Fu, M.; Wang, Q.; Wang, Y.; Chen, K.; Xia, G.S.; Bai, X. Gliding vertex on the horizontal bounding box for multi-oriented object detection. IEEE Trans. Pattern Anal. Mach. Intell. 2020, 43, 1452–1459. [Google Scholar] [CrossRef] [PubMed]
- Xiao, Z.; Qian, L.; Shao, W.; Tan, X.; Wang, K. Axis learning for orientated objects detection in aerial images. Remote Sens. 2020, 12, 908. [Google Scholar] [CrossRef]
- Wei, H.; Zhang, Y.; Chang, Z.; Li, H.; Wang, H.; Sun, X. Oriented objects as pairs of middle lines. ISPRS J. Photogramm. Remote Sens. 2020, 169, 268–279. [Google Scholar] [CrossRef]
- Qing, Y.; Liu, W.; Feng, L.; Gao, W. Improved YOLO network for free-angle remote sensing target detection. Remote Sens. 2021, 13, 2171. [Google Scholar] [CrossRef]
- Lang, K.; Yang, M.; Wang, H.; Wang, H.; Wang, Z.; Zhang, J.; Shen, H. Improved One-Stage Detectors with Neck Attention Block for Object Detection in Remote Sensing. Remote Sens. 2022, 14, 5805. [Google Scholar] [CrossRef]
- Vaswani, A.; Shazeer, N.; Parmar, N.; Uszkoreit, J.; Jones, L.; Gomez, A.N.; Kaiser, Ł.; Polosukhin, I. Attention Is All You Need. In Proceedings of the 31st Conference on Neural Information Processing Systems (NIPS 2017), Long Beach, CA, USA, 4–9 December 2017; Volume 30. [Google Scholar]
- Dosovitskiy, A.; Beyer, L.; Kolesnikov, A.; Weissenborn, D.; Zhai, X.; Unterthiner, T.; Houlsby, N. An image is worth 16x16 words: Transformers for image recognition at scale. arXiv 2020, arXiv:2010.11929. [Google Scholar]
- Wu, H.; Xiao, B.; Codella, N.; Liu, M.; Dai, X.; Yuan, L.; Zhang, L. CvT: Introducing Convolutions to Vision Transformers. arXiv 2021, arXiv:2103.15808. [Google Scholar]
- Zheng, Y.; Sun, P.; Zhou, Z.; Xu, W.; Ren, Q. ADT-Det: Adaptive Dynamic Refined Single-Stage Transformer Detector for Arbitrary-Oriented Object Detection in Satellite Optical Imagery. Remote Sens. 2021, 13, 2623. [Google Scholar] [CrossRef]
- Gong, H.; Mu, T.; Li, Q.; Dai, H.; Li, C.; He, Z.; Wang, B. Swin-Transformer-Enabled YOLOv5 with Attention Mechanism for Small Object Detection on Satellite Images. Remote Sens. 2022, 14, 2861. [Google Scholar] [CrossRef]
- Zhou, Y.; Chen, S.; Zhao, J.; Yao, R.; Xue, Y.; El Saddik, A. CLT-Det: Correlation Learning Based on Transformer for Detecting Dense Objects in Remote Sensing Images. IEEE Trans. Geosci. Remote Sens. 2022, 60, 4708915. [Google Scholar] [CrossRef]
- Li, Q.; Chen, Y.; Zeng, Y. Transformer with Transfer CNN for Remote-Sensing-Image Object Detection. Remote Sens. 2022, 14, 984. [Google Scholar] [CrossRef]
- Zhou, T.; Li, L.; Bredell, G.; Li, J.; Konukoglu, E. Volumetric memory network for interactive medical image segmentation. Med. Image Anal. 2022, 83, 102599. [Google Scholar] [CrossRef] [PubMed]
- Zhou, T.; Li, J.; Wang, S.; Tao, R.; Shen, J. Matnet: Motion-attentive transition network for zero-shot video object segmentation. IEEE Trans. Image Process. 2020, 29, 8326–8338. [Google Scholar] [CrossRef]
- Li, J.; Wei, Y.; Liang, X.; Dong, J.; Xu, T.; Feng, J.; Yan, S. Attentive Contexts for Object Detection. IEEE Trans. Multimed. 2017, 19, 944–954. [Google Scholar] [CrossRef]
- Bell, S.; Zitnick, C.L.; Bala, K.; Girshick, R. Inside-Outside Net: Detecting Objects in Context with Skip Pooling and Recurrent Neural Networks. In Proceedings of the IEEE Conference on Computer Vision and Pattern Recognition, Las Vegas, NV, USA, 26 June–1 July 2016; pp. 2874–2883. [Google Scholar]
- Wang, S.; Zhou, T.; Lu, Y.; Di, H. Contextual Transformation Network for Lightweight Remote-Sensing Image Super-Resolution. IEEE Trans. Geosci. Remote Sens. 2021, 60, 5615313. [Google Scholar] [CrossRef]
- Wang, Y.; Xu, C.; Liu, C.; Li, Z. Context Information Refinement for Few-Shot Object Detection in Remote Sensing Images. Remote Sens. 2022, 14, 3255. [Google Scholar] [CrossRef]
- Ma, W.; Guo, Q.; Wu, Y.; Zhao, W.; Zhang, X.; Jiao, L. A Novel Multi-Model Decision Fusion Network for Object Detection in Remote Sensing Images. Remote Sens. 2019, 11, 737. [Google Scholar] [CrossRef]
- Wei, Y.; Xiao, H.; Shi, H.; Jie, Z.; Feng, J.; Huang, T.S. Revisiting dilated convolution: A simple approach for weakly-and semi-supervised semantic segmentation. In Proceedings of the IEEE Conference on Computer Vision and Pattern Recognition, Salt Lake City, UT, USA, 18 June 2018; pp. 7268–7277. [Google Scholar]
- Howard, A.G.; Zhu, M.; Chen, B.; Kalenichenko, D.; Wang, W.; Weyand, T.; Andreetto, M.; Adam, H. Mobilenets: Efficient convolutional neural networks for mobile vision applications. arXiv 2017, arXiv:1704.04861. [Google Scholar]
- Ultralytics-Yolov5. Available online: https://github.com/ultralytics/yolov5 (accessed on 1 January 2021).
- He, K.; Zhang, X.; Ren, S.; Sun, J. Spatial pyramid pooling in deep convolutional networks for visual recognition. IEEE Trans. Pattern Anal. Mach. Intell. 2015, 37, 1904–1916. [Google Scholar] [CrossRef]
- Liu, S.; Qi, L.; Qin, H.; Shi, J.; Jia, J. Path Aggregation Network for Instance Segmentation. In Proceedings of the 2018 IEEE/CVF Conference on Computer Vision and Pattern Recognition, Salt Lake City, UT, USA, 18–23 June 2018; pp. 8759–8768. [Google Scholar]
- Li, K.; Wan, G.; Cheng, G.; Meng, L.; Han, J. Object detection in optical remote sensing images: A survey and a new benchmark. ISPRS J. Photogramm. Remote Sens. 2020, 159, 296–307. [Google Scholar] [CrossRef]
- Xia, G.-S.; Bai, X.; Ding, J.; Zhu, Z.; Belongie, S.; Luo, J.; Datcu, M.; Pelillo, M.; Zhang, L. DOTA: A large-scale dataset for object detection in aerial images. In Proceedings of the IEEE Conference on Computer Vision and Pattern Recognition, Salt Lake City, UT, USA, 18–22 June 2018; pp. 3974–3983. [Google Scholar]
- Cheng, G.; Han, J.; Zhou, P.; Guo, L. Multi-class geospatial object detection and geographic image classification based on collection of part detectors. ISPRS J. Photogramm. Remote Sens. 2014, 98, 119–132. [Google Scholar] [CrossRef]
- Cheng, G.; Si, Y.; Hong, H.; Yao, X.; Guo, L. Cross-Scale Feature Fusion for Object Detection in Optical Remote Sensing Images. IEEE Trans. Geosci. Remote Sens. Lett. 2021, 18, 431–435. [Google Scholar] [CrossRef]
- Yuan, Z.; Liu, Z.; Zhu, C.; Qi, J.; Zhao, D. Object Detection in Remote Sensing Images via Multi-Feature Pyramid Network with Receptive Field Block. Remote Sens. 2021, 13, 862. [Google Scholar] [CrossRef]
- Wang, J.; Wang, Y.; Wu, Y.; Zhang, K.; Wang, Q. FRPNet: A Feature-Reflowing Pyramid Network for Object Detection of Remote Sensing Images. IEEE Trans. Geosci. Remote Sens. Lett. 2021, 19, 8004405. [Google Scholar] [CrossRef]
- Wang, G.; Zhuang, Y.; Chen, H.; Liu, X.; Zhang, T.; Li, L.; Dong, S.; Sang, Q. FSoD-Net: Full-Scale Object Detection From Optical Remote Sensing Imagery. IEEE Trans. Geosci. Remote Sens. Lett. 2021, 60, 5602918. [Google Scholar] [CrossRef]
- Tian, Z.; Zhan, R.; Hu, J.; Wang, W.; He, Z.; Zhuang, Z. Generating Anchor Boxes Based on Attention Mechanism for Object Detection in Remote Sensing Images. Remote Sens. 2020, 12, 2416. [Google Scholar] [CrossRef]
- Shi, L.; Kuang, L.; Xu, X.; Pan, B.; Shi, Z. CANet: Centerness-Aware Network for Object Detection in Remote Sensing Images. IEEE Trans. Geosci. Remote Sens. Lett. 2021, 60, 5603613. [Google Scholar] [CrossRef]
- Wang, G.; Zhuang, Y.; Wang, Z.; Chen, H.; Shi, H.; Chen, L. Spatial Enhanced-SSD For Multiclass Object Detection in Remote Sensing Images. In Proceedings of the IGARSS 2019–2019 IEEE International Geoscience and Remote Sensing Symposium, Yokohama, Japan, 28 July–2 August 2019; pp. 318–321. [Google Scholar]
- Chen, J.; Wan, L.; Zhu, J.; Xu, G.; Deng, M. Multi-Scale Spatial and Channel-wise Attention for Improving Object Detection in Remote Sensing Imagery. IEEE Trans. Geosci. Remote Sens. Lett. 2020, 17, 681–685. [Google Scholar] [CrossRef]
- Zheng, Z.; Zhong, Y.; Ma, A.; Han, X.; Zhao, J.; Liu, Y.; Zhang, L. HyNet: Hyper-scale object detection network framework for multiple spatial resolution remote sensing imagery. ISPRS J. Photogramm. Remote Sens. 2020, 166, 1–14. [Google Scholar] [CrossRef]
- Zhang, G.; Lu, S.; Zhang, W. CAD-Net: A Context-Aware Detection Network for Objects in Remote Sensing Imagery. IEEE Trans. Geosci. Remote Sens. 2019, 57, 10015–10024. [Google Scholar] [CrossRef]
- Zhang, W.; Jiao, L.; Li, Y.; Huang, Z.; Wang, H. Laplacian Feature Pyramid Network for Object Detection in VHR Optical Remote. IEEE Trans. Geosci. Remote Sens. 2021, 60, 5604114. [Google Scholar] [CrossRef]
Disclaimer/Publisher’s Note: The statements, opinions and data contained in all publications are solely those of the individual author(s) and contributor(s) and not of MDPI and/or the editor(s). MDPI and/or the editor(s) disclaim responsibility for any injury to people or property resulting from any ideas, methods, instructions or products referred to in the content. |
© 2023 by the authors. Licensee MDPI, Basel, Switzerland. This article is an open access article distributed under the terms and conditions of the Creative Commons Attribution (CC BY) license (https://creativecommons.org/licenses/by/4.0/).