Article

Assessing the Vegetation Dynamics and Its Influencing Factors in Central Asia from 2001 to 2020

1
National Ecosystem Science Data Center, Institute of Geographic Sciences and Natural Resources Research, Chinese Academy of Sciences, Beijing 100101, China
2
Key Laboratory of Ecosystem Network Observation and Modeling, Institute of Geographic Sciences and Natural Resources Research, Chinese Academy of Sciences, Beijing 100101, China
3
University of Chinese Academy of Sciences, Beijing 100049, China
4
State Key Laboratory of Desert and Oasis Ecology, Xinjiang Institute of Ecology and Geography, Chinese Academy of Sciences, Urumqi 830011, China
5
College of Resources and Environment, University of Chinese Academy of Sciences, Beijing 100190, China
6
Technical Centre for Soil, Agriculture and Rural Ecology and Environment, Ministry of Ecology and Environment, Beijing 100012, China
7
School of Environment and Resources, Zhejiang Agriculture and Forestry University, Hangzhou 311300, China
*
Author to whom correspondence should be addressed.
Remote Sens. 2023, 15(19), 4670; https://doi.org/10.3390/rs15194670
Submission received: 4 July 2023 / Revised: 12 September 2023 / Accepted: 16 September 2023 / Published: 23 September 2023

Abstract

:
As vegetation plays a critical role in terrestrial ecosystems, understanding its status and variation is vital for preserving the stability of an ecosystem. Central Asia serves as a representative example of an arid and semi-arid region characterized by sparse vegetation and poor soils, making its vegetation particularly fragile and sensitive. To investigate the vegetation condition in the region, this study examined the spatial and temporal characteristics of vegetation variation from 2001 to 2020, utilizing the normalized difference vegetation index (NDVI) as an indicator. Meanwhile, trend analysis, Mann–Kendall abrupt change point test, geodetector, and correlation analysis were used to quantitatively analyze the natural and anthropogenic drivers of these variations over the past two decades. The results suggest that vegetation coverage in Central Asia was relatively low, with an annual average NDVI of 0.16 over the past 20 years. Moreover, the spatial distribution of NDVI in Central Asia exhibited significant spatial heterogeneity, with vegetation coverage declining from north to south and from east to west. Furthermore, the NDVI exhibited a slightly increasing trend during the period of 2001 to 2020 with an increased rate of 0.00025/yr. However, we detected an abrupt change point in vegetation dynamics in Central Asia around 2010, which indicated a significant shift in vegetation variation in the region. Land-use type has a great influence on the spatial heterogeneity of NDVI in Central Asia, which can explain 46% of the vegetation distribution in this region. Moisture factors such as precipitation and soil water content followed with 35% and 32% contributions, respectively. Regarding the temporal variation of NDVI, it is mainly driven by the fluctuation in precipitation, with the degree of influence of precipitation on NDVI varying for different regions in various geographical conditions. This study offers a more comprehensive insight into the spatial and temporal dynamics of NDVI in Central Asia and indicates that precipitation plays a significant role in driving the spatial heterogeneity and temporal variation of NDVI. These findings are essential for predicting vegetation changes in arid regions under future environmental conditions and formulating effective strategies to prevent and alleviate vegetation degradation.

Graphical Abstract

1. Introduction

Vegetation plays a vital role in the terrestrial ecological system by serving as a crucial connection between the pedosphere, hydrosphere, atmosphere, and biosphere [1]. It plays a key role in the global circulation of materials and energy, contributing to the maintenance of the carbon balance, mitigating the increase in greenhouse gas emissions, and stabilizing the climate [2,3]. The degradation of vegetation can potentially pose a significant threat to the ecological environment, with significant implications for the economy and society [4]. Therefore, it is imperative to investigate the condition of vegetation, dissect the spatial and temporal dynamics, and the underlying driving factors of vegetation change, thereby facilitating the development of effective strategies for the prevention of degradation and vegetation restoration.
Central Asia is widely recognized as a representative of an arid and semi-arid region, covering approximately 30% of the world’s arid zones [5]. The ecosystems in this region are characterized by fragility and sensitivity due to harsh soil conditions and sparse vegetation, making them more susceptible to natural and anthropogenic factors [6,7,8], which can increase the risk of desertification, hindering socioeconomic sustainability and development. Previous studies have shown that the environment in Central Asia has deteriorated as a result of both natural and anthropogenic influences such as population growth, excessive water resource use, and land-use change [9]. Hence, investigating the vegetation status and spatial and temporal dynamics in the current context is imperative to protect the fragile ecosystems and ensure the sustainable development of the economy and society in Central Asia.
With the advancement of remote sensing technology, the NDVI, defined as the normalized ratio of red and near-infrared (NIR) reflectance, has become a reliable indicator for characterizing vegetation conditions, especially over large areas and extended periods [10,11]. Due to its wide coverage and high accuracy, using NDVI as an indicator to study vegetation conditions and changes has been widespread [12,13]. Based on NDVI products, recent studies have provided an overview of vegetation conditions in the region, dominated by grasslands with relatively lower NDVI values compared to other regions [14]. Furthermore, the vegetation status in this region showed obvious spatial distribution characteristics and exhibited an increasing trend from south to north. Meanwhile, the eastern mountainous areas exhibit lower NDVI values compared to the western plain regions [15,16]. Additionally, recent investigations indicate that vegetation in this region has exhibited a fluctuating and increasing trend in recent years, with significant differences in the variation trend of NDVI across different regions and periods [5,11,17]. While the dynamics of vegetation in the region demonstrated an upward trend towards the end of the 20th century, this trend gradually shifted to a downward trend at the beginning of the 21st century [5,11,16]. Moreover, Luo et al. [5] identified a significant abrupt change point in the region’s vegetation in 1987, while Chen et al. [18] detected another significant abrupt change point in the grassland of the region in 1999, suggesting that vegetation dynamics in the region may consist of multiple periods [19]. However, the interannual variation in vegetation over the past two decades remains uncertain.
In terms of the driving factors on temporal variation in vegetation, previous research has primarily focused on the influence of climate change. Precipitation was detected as the dominant factor of vegetation change in the arid and semi-arid regions of Central Asia. In most areas of the region, increased precipitation has been observed to promote vegetation changes [5,10,11,16,17]. However, the majority of investigations have primarily focused on the temporal variation of NDVI. Regarding the factors driving spatial distribution, the investigations by Jiang et al. [14], Formica et al. [20], Berdimbetov et al. [13] and Peng et al. [16] have examined climate-related influences on the spatial distribution of NDVI. Nevertheless, it is worth noting that additional aspects, such as topography and anthropogenic factors, can also impact temporal and spatial vegetation changes [5,14,21]. Furthermore, there is still a knowledge gap regarding their effects on the spatial distribution of vegetation. Therefore, it is essential to conduct a comprehensive investigation of both the spatial and temporal dynamics of vegetation over the past two decades, as well as the factors influencing them in Central Asia, to provide theoretical support for tackling the challenges arising from climate change and human activities.
In this paper, we employed NDVI as a proxy for vegetation and selected a series of easily accessible drivers to investigate the spatial and temporal dynamics of vegetation and its influencing factors in recent years in Central Asia. The ultimate goals of this study are as follows: (1) investigate the temporal and spatial variation in NDVI in Central Asia from 2001 to 2020 and examine whether there are any change points in the region’s temporal variation using the Mann–Kendall test; (2) quantitatively differentiate and evaluate the effects of driving factors on NDVI spatial distribution; (3) determine the drivers of the interannual variation of NDVI over the past two decades through correlation analysis. The findings of this research can offer valuable insights for effective pastoral management and help prevent grassland degradation in Central Asia.

2. Materials and Methods
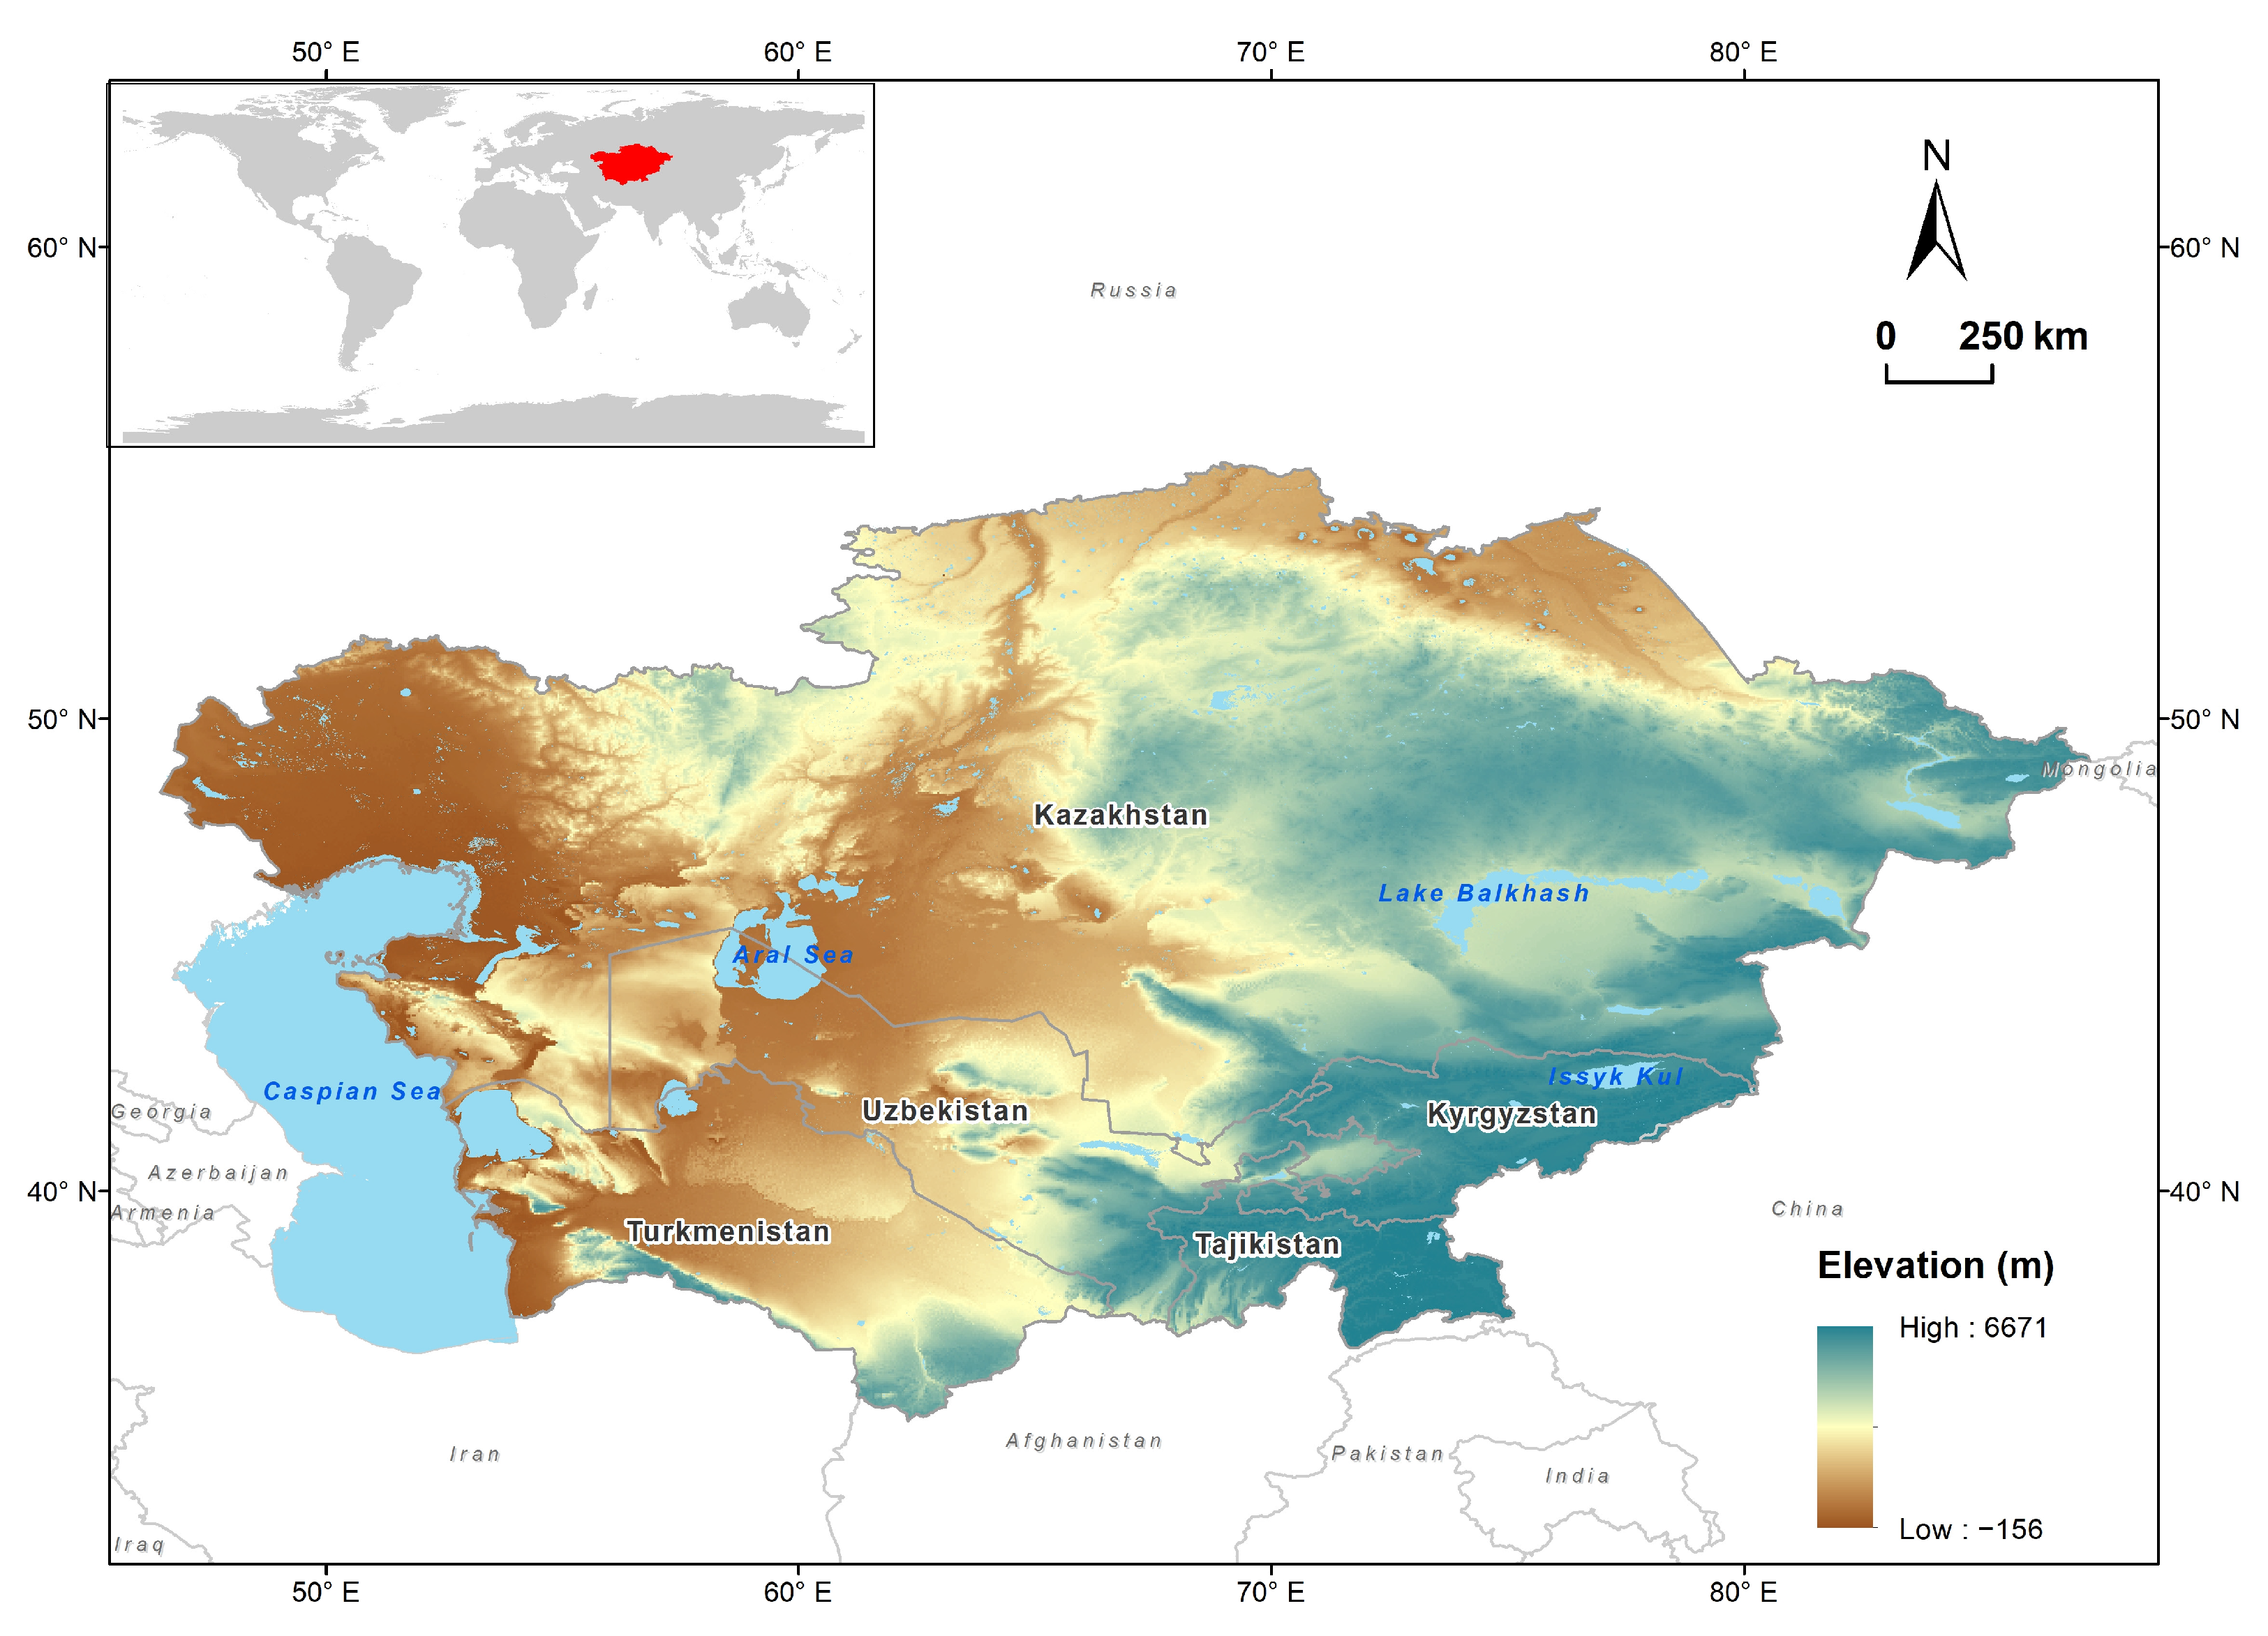
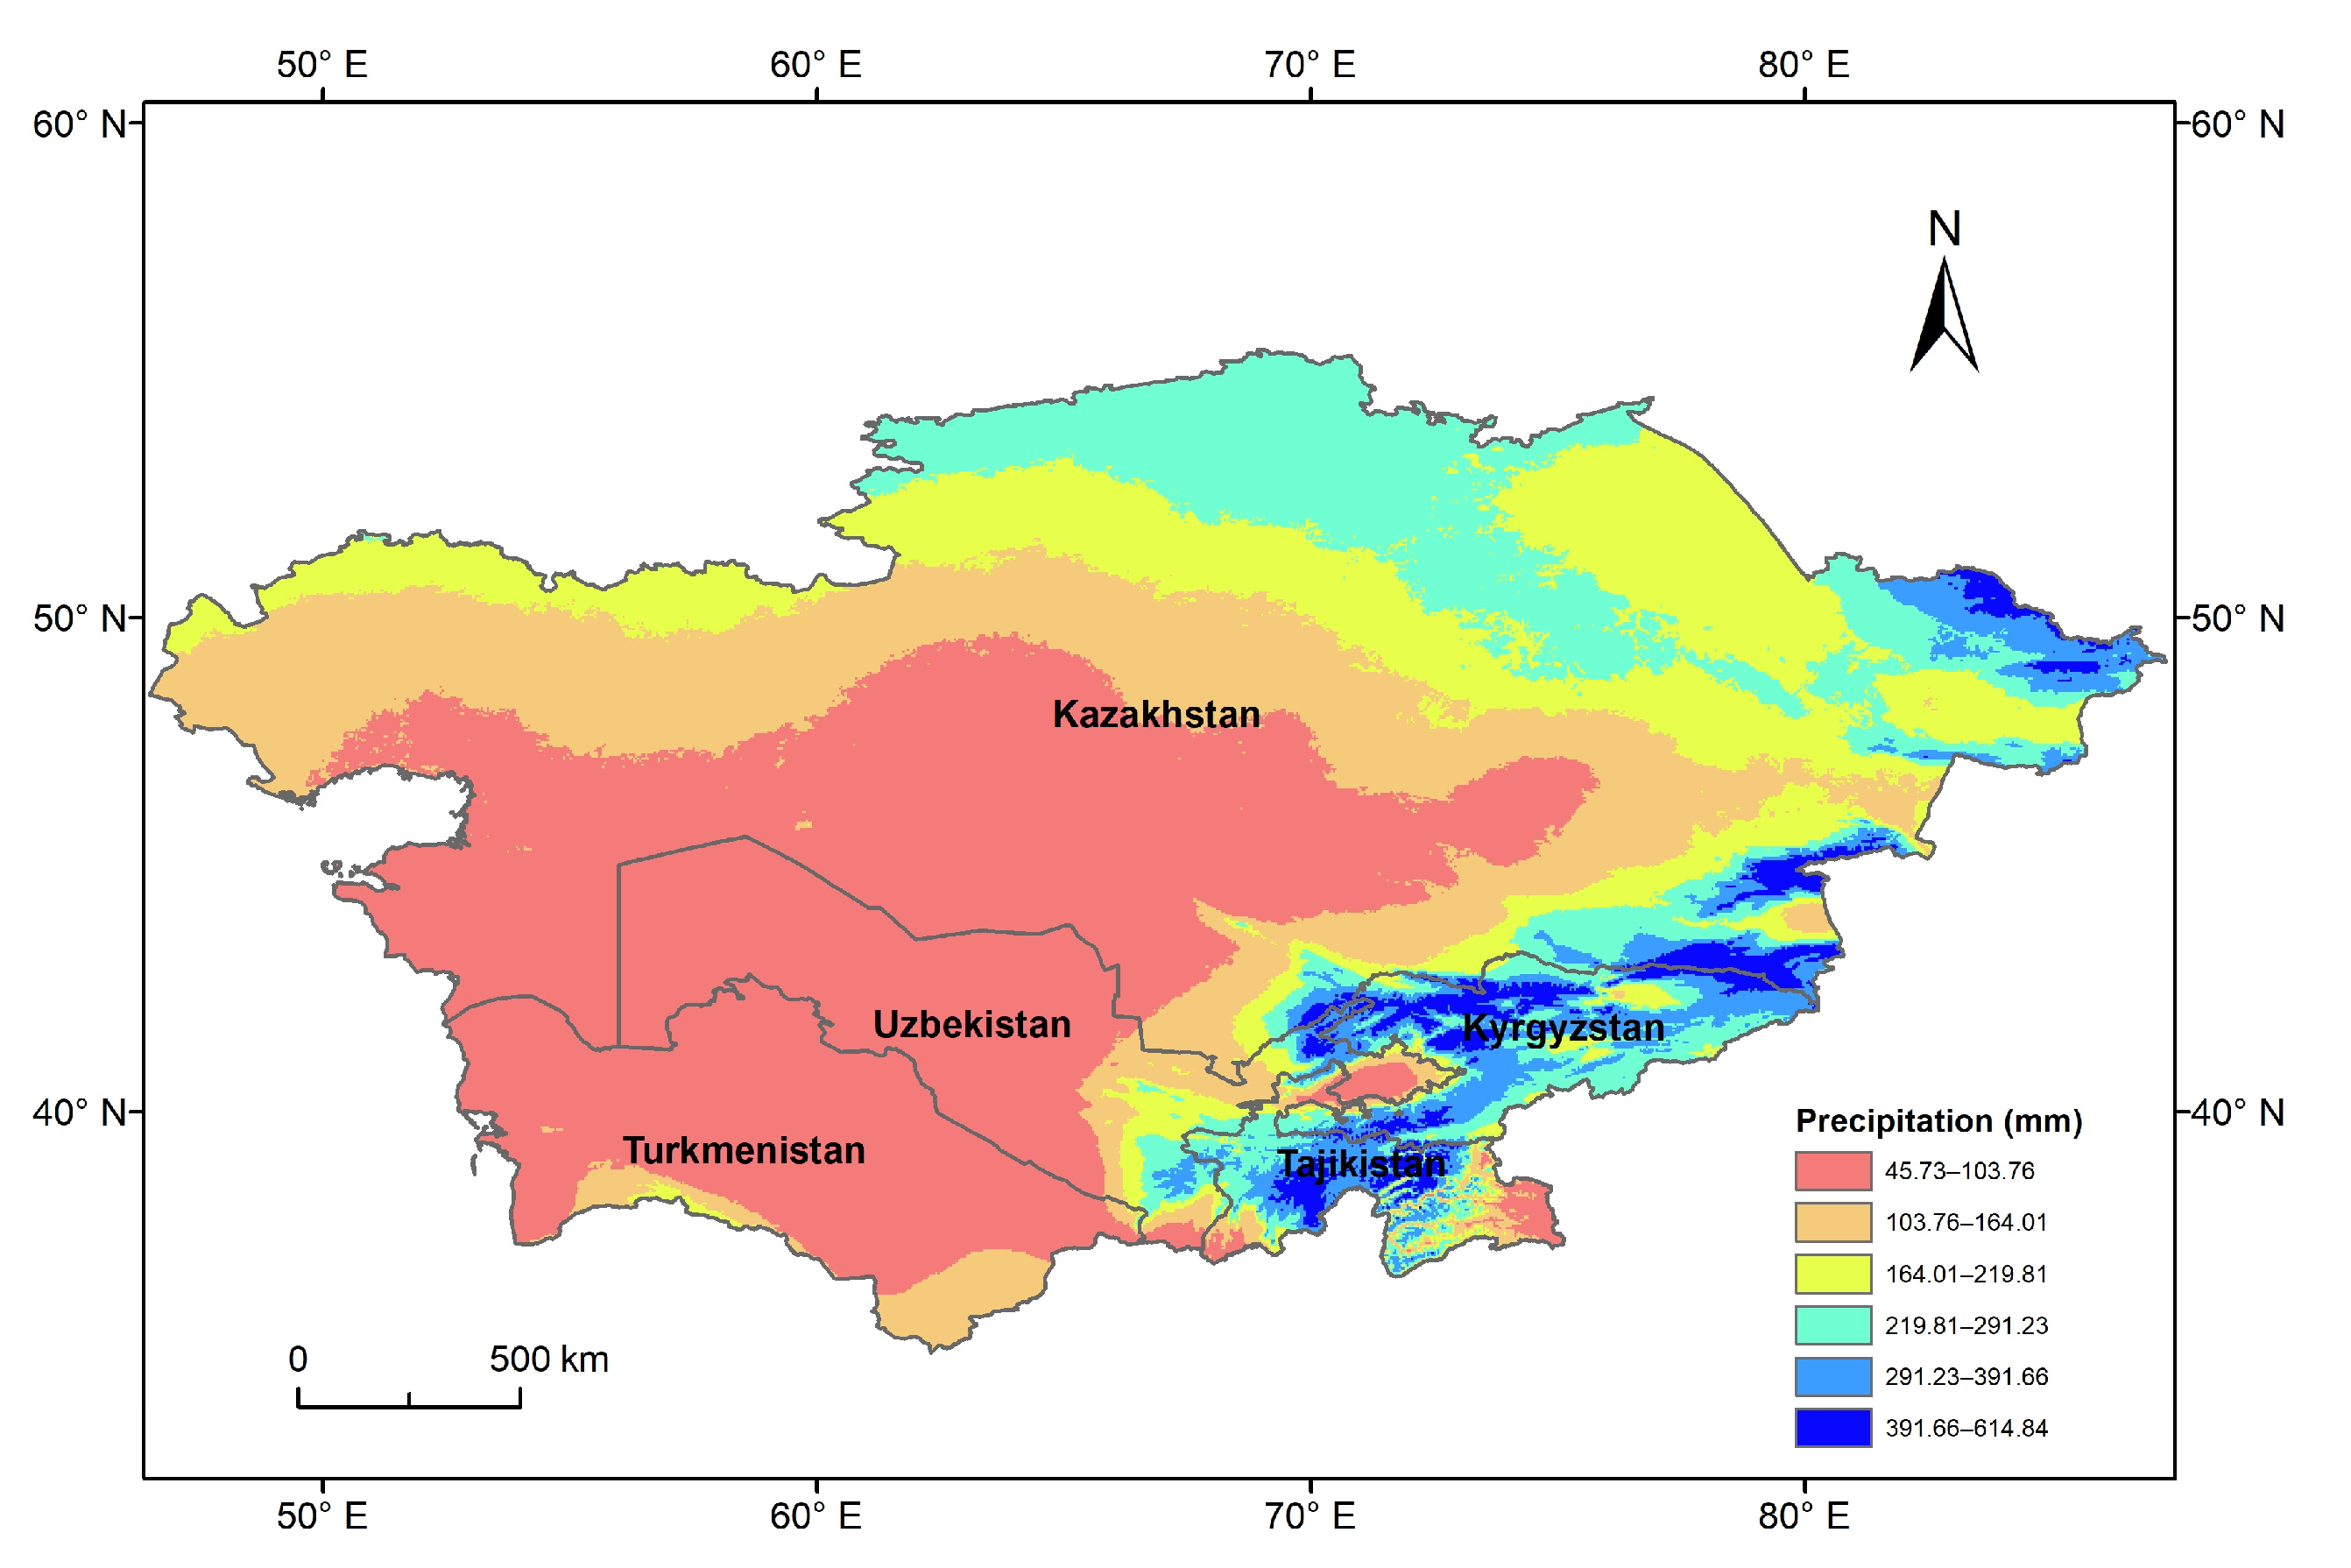
2.1. Study Areas

Central Asia, situated in the heart of the Eurasian continent, encompasses five independent countries, including Kazakhstan, Kyrgyzstan, Turkmenistan, Uzbekistan, and Tajikistan. The expansive region spans an area of around 5.64 × 10⁶ km2, with latitudes ranging from 35.13°N to 55.44°N and longitudes extending from 46.50°E to 87.32°E. Meanwhile, the topographic pattern of the study region is characterized by higher elevation in the southeast and lower elevation in the northwest [14,22] (Figure 1).
As a typically temperate continental climate region, Central Asia is characterized by hot-dry summers and cold-moist winters. The perennial average temperature in the region is around 6.65 °C, but there are significant seasonal and spatial variations in temperature [5]. The average annual temperature displays a decline from southern to northern regions, as well as from the plains to the mountainous areas, ranging from 2 °C in northern parts of Kazakhstan to over 18 °C in southern Uzbekistan and Turkmenistan, while in the eastern mountains, the annual temperature drops below 0 °C [14,23]. The average annual precipitation across the entire region is approximately 211 mm [5]. Except for mountainous areas receiving a mean precipitation of 600–800 mm, the precipitation varies from less than 100 mm in northern Turkmenistan and southern Uzbekistan to around 400 mm in northern Kazakhstan [24].
Influenced by various factors, including topography and climate, Central Asia’s vegetation and land cover types are known for their diversity. The predominant vegetation types in the region include grassland, cropland, and forest, which respectively account for 74.4%, 6.7%, and 0.5% of the vegetation types. Other land-use types, such as water bodies and sparse grassland, make up the remaining 18.4% [18].

2.2. Data Source

In the paper, we used NDVI data and 12 representative drivers selected from climate, topography, soil, and human activities. These drivers are easily quantifiable and data-accessible and have been classified into three types: climate factors, geographic factors, and anthropogenic factors (Table 1).
The NDVI dataset was sourced from the NASA website (earthdata.nasa.gov/, accessed on 7 December 2021) and consisted of 1840 images with a 16-day composite MODIS NDVI product having a spatial resolution of 250 m from Terra (MODIS13Q1). The images covered the study region between 2001 and 2020.
Gridded climate data of multiple types, including temperature, precipitation, saturated water vapor pressure, radiation, etc., were used in the research and obtained from various sources. The highest temperature, lowest temperature, accumulated precipitation, saturated water vapor pressure, wind speed, and soil moisture were sourced from the TerraCimate database generated by the climatology Lab at the University of California, Merced (www.climatologylab.org/, accessed on 18 May 2022). TerraClimate used climatically aided interpolation techniques, integrating high-spatial resolution climatological data with the temporally varying data at coarser spatial resolutions to generate the climate data whose spatial resolution is 1/24. The annual average temperature dataset utilized in our work with a spatial resolution of 0.5° × 0.5° was obtained from the CRU dataset (www.cru.uea.ac.uk/, accessed on 9 June 2022). The surface shortwave radiation data was sourced from MERRA-2 products, the reanalyzed meteorological datasets established by GMAO with a spatial resolution of 0.5° × 0.667° (disc.sci.gsfc.nasa.gov/, accessed on 7 September 2022).
Regarding the geographic factors, in this study, we obtained the DEM data from the SRTM dataset, which was freely downloaded from the Geospatial Data Cloud (www.gscloud.cn/, accessed on 12 May 2022). The soil type data were obtained from the Harmonized World Soil Database (HWSD), which was established by FAO (webarchive.iiasa.ac.at/, accessed on 17 May 2022). The land cover dataset was the land cover type products of MODIS (MCD12Q1), which described the type of land cover by processing the data sourced from Terra and Aqua (ladsweb.modaps.eosdis.nasa.gov/, accessed on 22 May 2022). Based on the IGBP, there are 17 primary land cover categories contained in the dataset, which encompass 11 distinct natural vegetation types, three land classes of land development and Mosaic, and three non-vegetation land types.
Furthermore, to represent the anthropogenic factors, the difference between the land cover categories data of 2001 and 2020 was calculated to obtain the land-use type conversion dataset. Population data in Central Asia were sourced from the LandScan dataset produced by Oak Ridge National Laboratory, whose spatial resolution is 1 km, where each grid point represented the total population of the corresponding area.

2.3. Methods

2.3.1. Trend Analysis of NDVI

To investigate the temporal dynamics of NDVI in Central Asia, the linear regression analysis method was adopted in this study. The formula for the trend of NDVI was defined as follows:
s l o p e = n × i = 1 n i × N D V I i i = 1 n i i = 1 n N D V I i n × i = 1 n i 2 i = 1 n i 2   ,
where n denotes the number of years in the study period; N D V I i denotes the value of NDVI in the i th year; s l o p e denotes the trend of NDVI variation in the region. If the s l o p e > 0 , it represents an upward trend; otherwise, it is a downward trend. When s l o p e = 0 , it indicates that there is no obvious interannual change in NDVI. In order to analyze the trend of vegetation in different regions of Central Asia, we calculated the slope at the pixel level.

2.3.2. Abrupt Change Point Test

This study employed the Mann–Kendall abrupt change point tests in order to investigate whether significant trend changes occurred in the temporal dynamics of NDVI in Central Asia from 2001 to 2020. As a nonparametric test, the Mann–Kendall test has the advantage of not relying on a certain distribution and being less disturbed by outliers [5,25,26]. Consequently, the M-K test has gained significant popularity in investigating trends and abrupt changes in ecological and hydrological data. The formula for computing the abrupt change point of NDVI is defined as follows:
S k = n j = 1 r j    k = 1,2 , , n   ,  
r j = 1    X j > X i 0    X j < X i    i = 1,2 , , k   ,  
where n denotes the length of the time series. For a given series X ( X 1 , X 2 , X n ) , the variable S k is a statistical variable, which is the cumulant of the situation where X j > X i ( 1 i j ) . Assuming that the variables conform to independent, random, and identically distributed, the mathematical expectation and variance of S k can be defined, respectively, as follows:
E S k = n ( n + 1 ) 4   ,  
V a r S k = n ( n 1 ) ( 2 n + 5 ) 72    ,
Based on the E S k and V a r S k , S k can be normalized to obtain another statistical variable U F k :
U F k = | S k E S k | V a r S k   ,
where U F 1 = 0 . Next, reversing the order of time series ( X n , X n 1 , X 1 ) of X and repeat the above steps, U B k can be calculated. The abrupt change point of the time sequence is indicated by determining the year corresponding to the intersection point between the sequence curves of U F k and U B k . If the point falls in the range of U α and − U α (the value of U α is 1.96 when α is 0.05), the abrupt change point is considered statistically significant.

2.3.3. Correlation Analysis
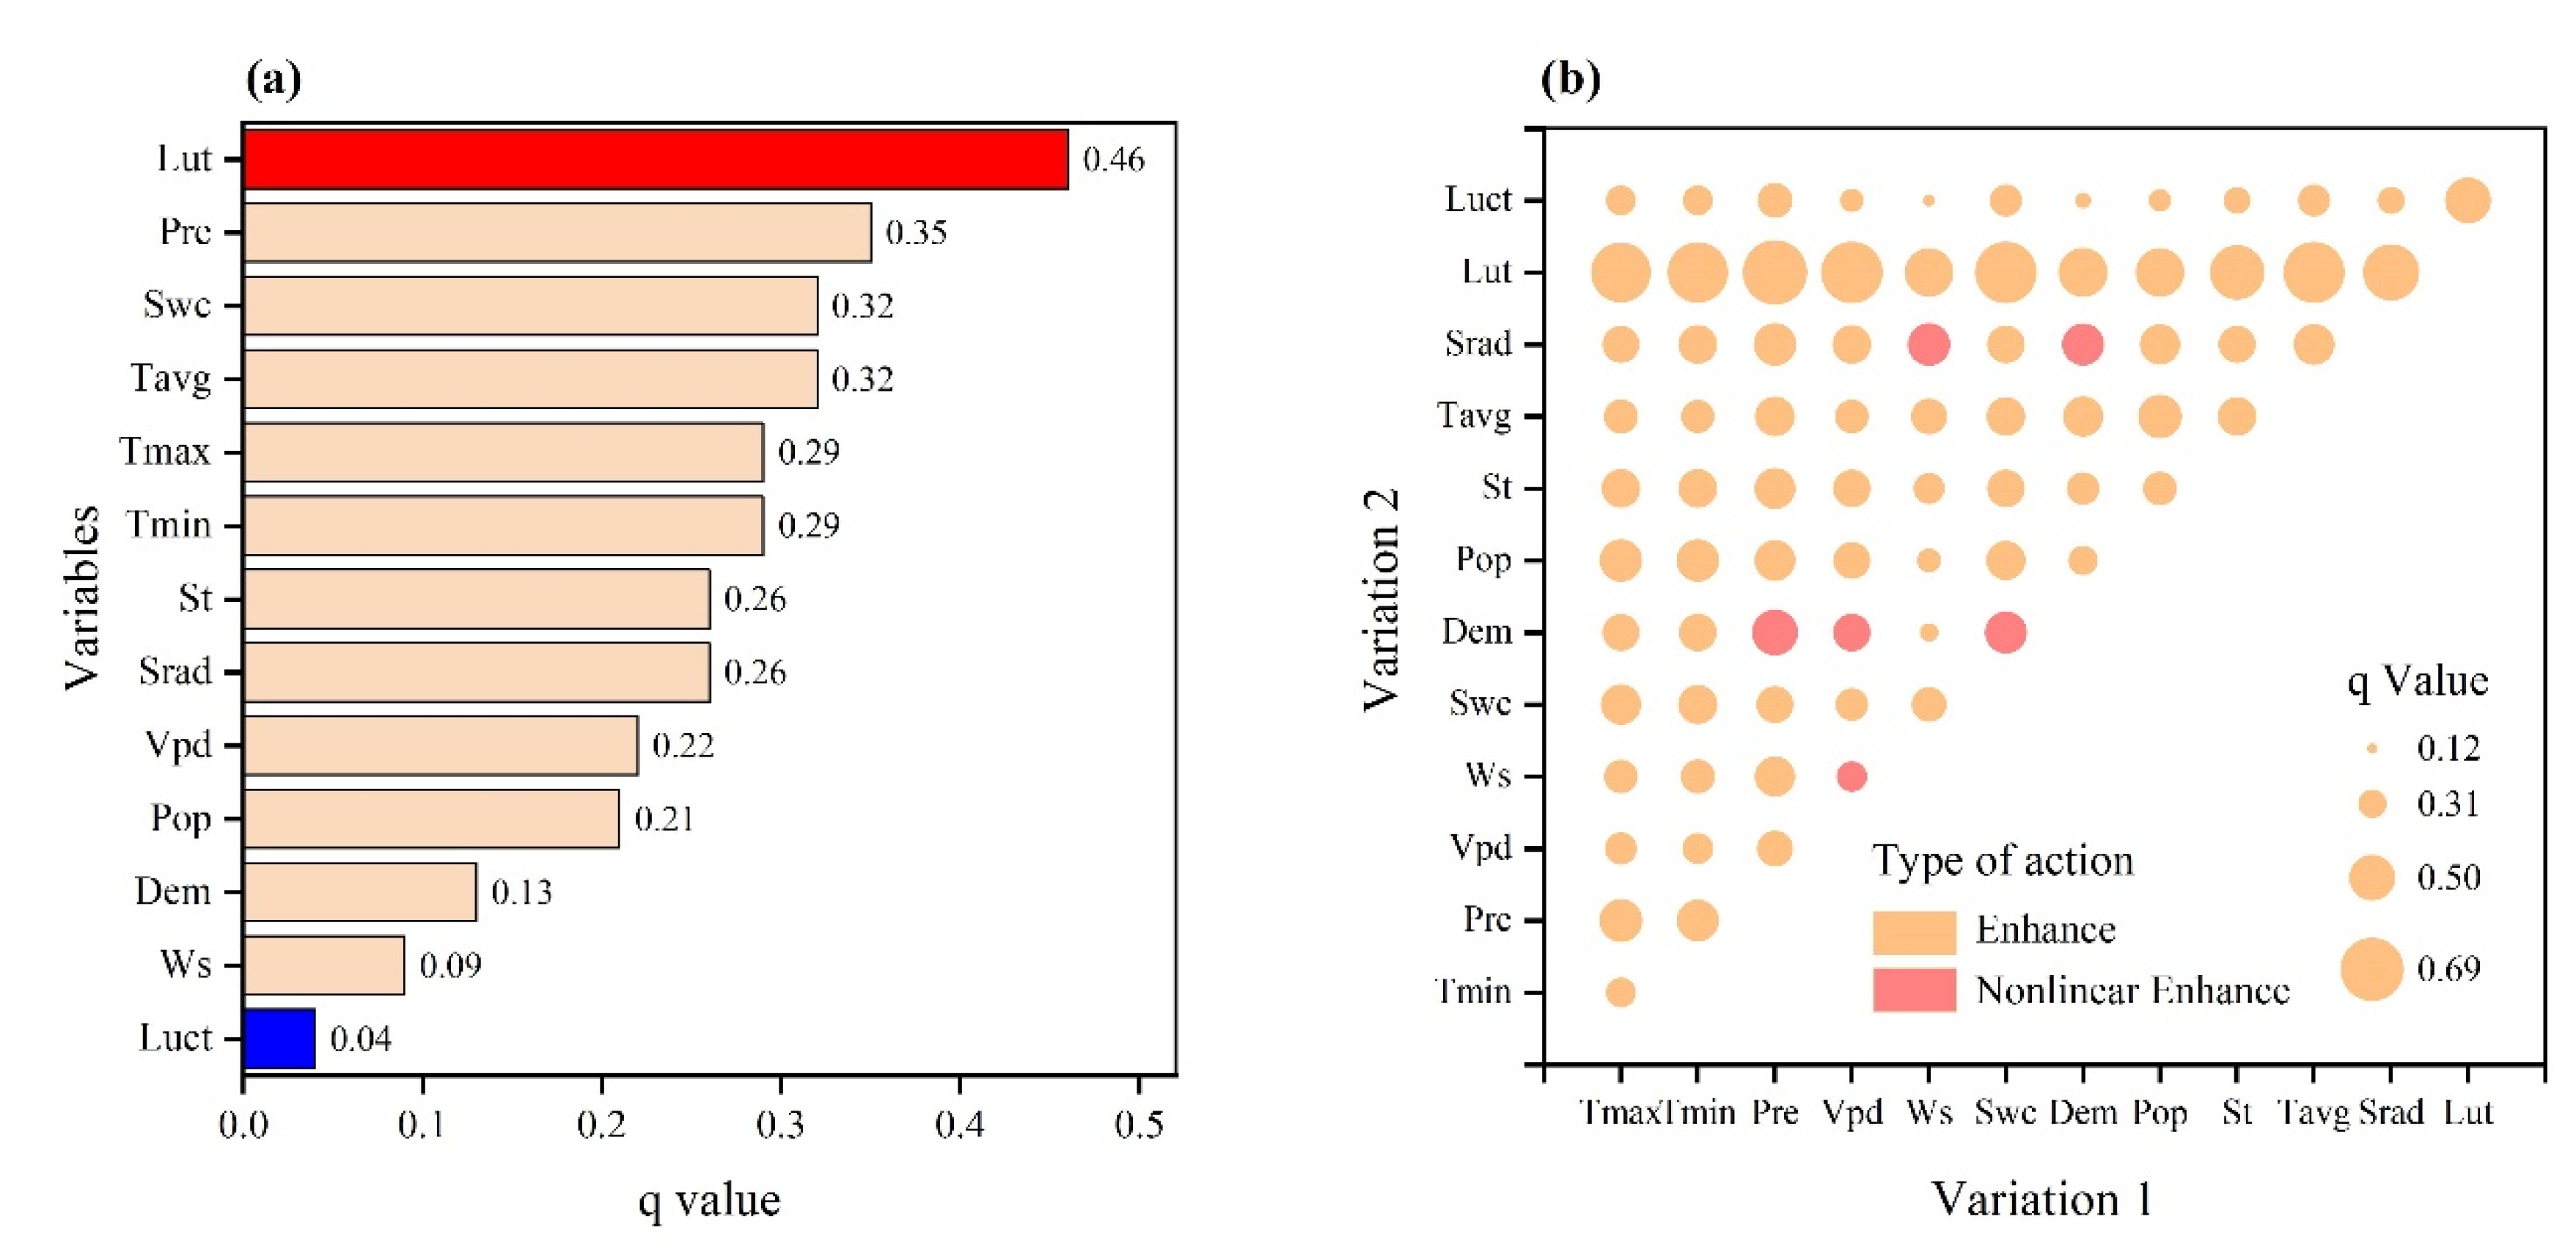
We employed Pearson correlation analysis to quantify the similarity between the variation of NDVI and climate factors, aiming to assess the degree of influence of climate factors on the variation trend of NDVI, which is performed as follows:
r = n i = 1 n X i Y i i = 1 n X i i = 1 n Y i i = 1 n X i 2 n X ¯ 2 i = 1 n Y i 2 n Y ¯ 2    ,
where n denotes the number of years in the study periods; X and Y represent the variates that we aim to analyze. r denotes the correlation coefficient, with a higher absolute value of r indicating a stronger correlation; when r = 0 , the two variables exhibit no significant correlation. For the positive and negative values of r , if r > 0 represents the positive correlation; otherwise, it is the negative correlation.

2.3.4. Geodetector

To examine the influence of various drivers on the spatial pattern of NDVI in Central Asia, geodetector, a robust and widely used method, was utilized to detect the spatial relationship between NDVI and the driving factors. It has the advantage of exploring the influence of single factors as well as the interaction of different factors without the need for strict adherence to traditional statistical assumptions and complex parameter-setting processes [27,28]. The fundamental concept of geodetector is that if an independent variable significantly affects a dependent variable, its spatial distribution will exhibit similarities [27,29,30]. The principle of this method is to partition the independent variable into multiple subregions, calculate the sum of the variance of the independent variable for each subregion, and then compare it to the overall variance of the dependent variable.
To investigate the correlation between driving factors and the characteristics of spatial distribution and temporal variation of vegetation in Central Asia, this study selected 13 variables from three types of driving factors, namely climatic factors, geographical factors, and anthropogenic factors. Since the geodetector is primarily designed for discrete variables, we first used the natural break point method in ArcGIS 10.6 to discretize continuous data, such as precipitation, temperature, and elevation. Subsequently, a series of random points within the study area were generated using Python 3.9, and the NDVI values, along with the discretized values of influencing factors, were collectively assigned to these random points. Finally, we evaluated the influence of these variables on the spatial heterogeneity of NDVI during the growing season in Central Asia using the geodetector method, predominantly through the R language package (‘geodetector’) [28,29].
In this method, the correlation of two variables can be quantified by the q -value. The calculation process is as follows:
q = 1 i = 1 n N i σ i 2 N σ 2    ,   
where i represents the number of classifications or partitions of variable X , N i represents the total number of samples in the i t h subregion, and N is the entire region; σ i 2 and σ 2 are the variance of dependent variable Y for the samples in the i t h subregion and the overall region, respectively; the meaning of the q -value is the contribution of the driving factors on the distribution of NDVI. The range of q -value is from 0 to 1, with a higher value indicating a stronger explanatory power of the driving factor on the dependent variable.
Not only the influence of individual factors but also the interaction of two drivers on the dependent variable can be detected by the geodetector. Another tool of geodetector called the interaction detector can accomplish the purpose. Its principle is to calculate q ( V a r 1 V a r 2 ) , which represents the q -value of the new layer formed by the intersection of independent variables V a r 1 and V a r 2 to the dependent variable ( Y ). Then compare the q ( V a r 1 V a r 2 ) with q ( V a r 1 ) and q ( V a r 2 ) to determine the interaction type between two variables. The specific types are shown in Table 2.

3. Results

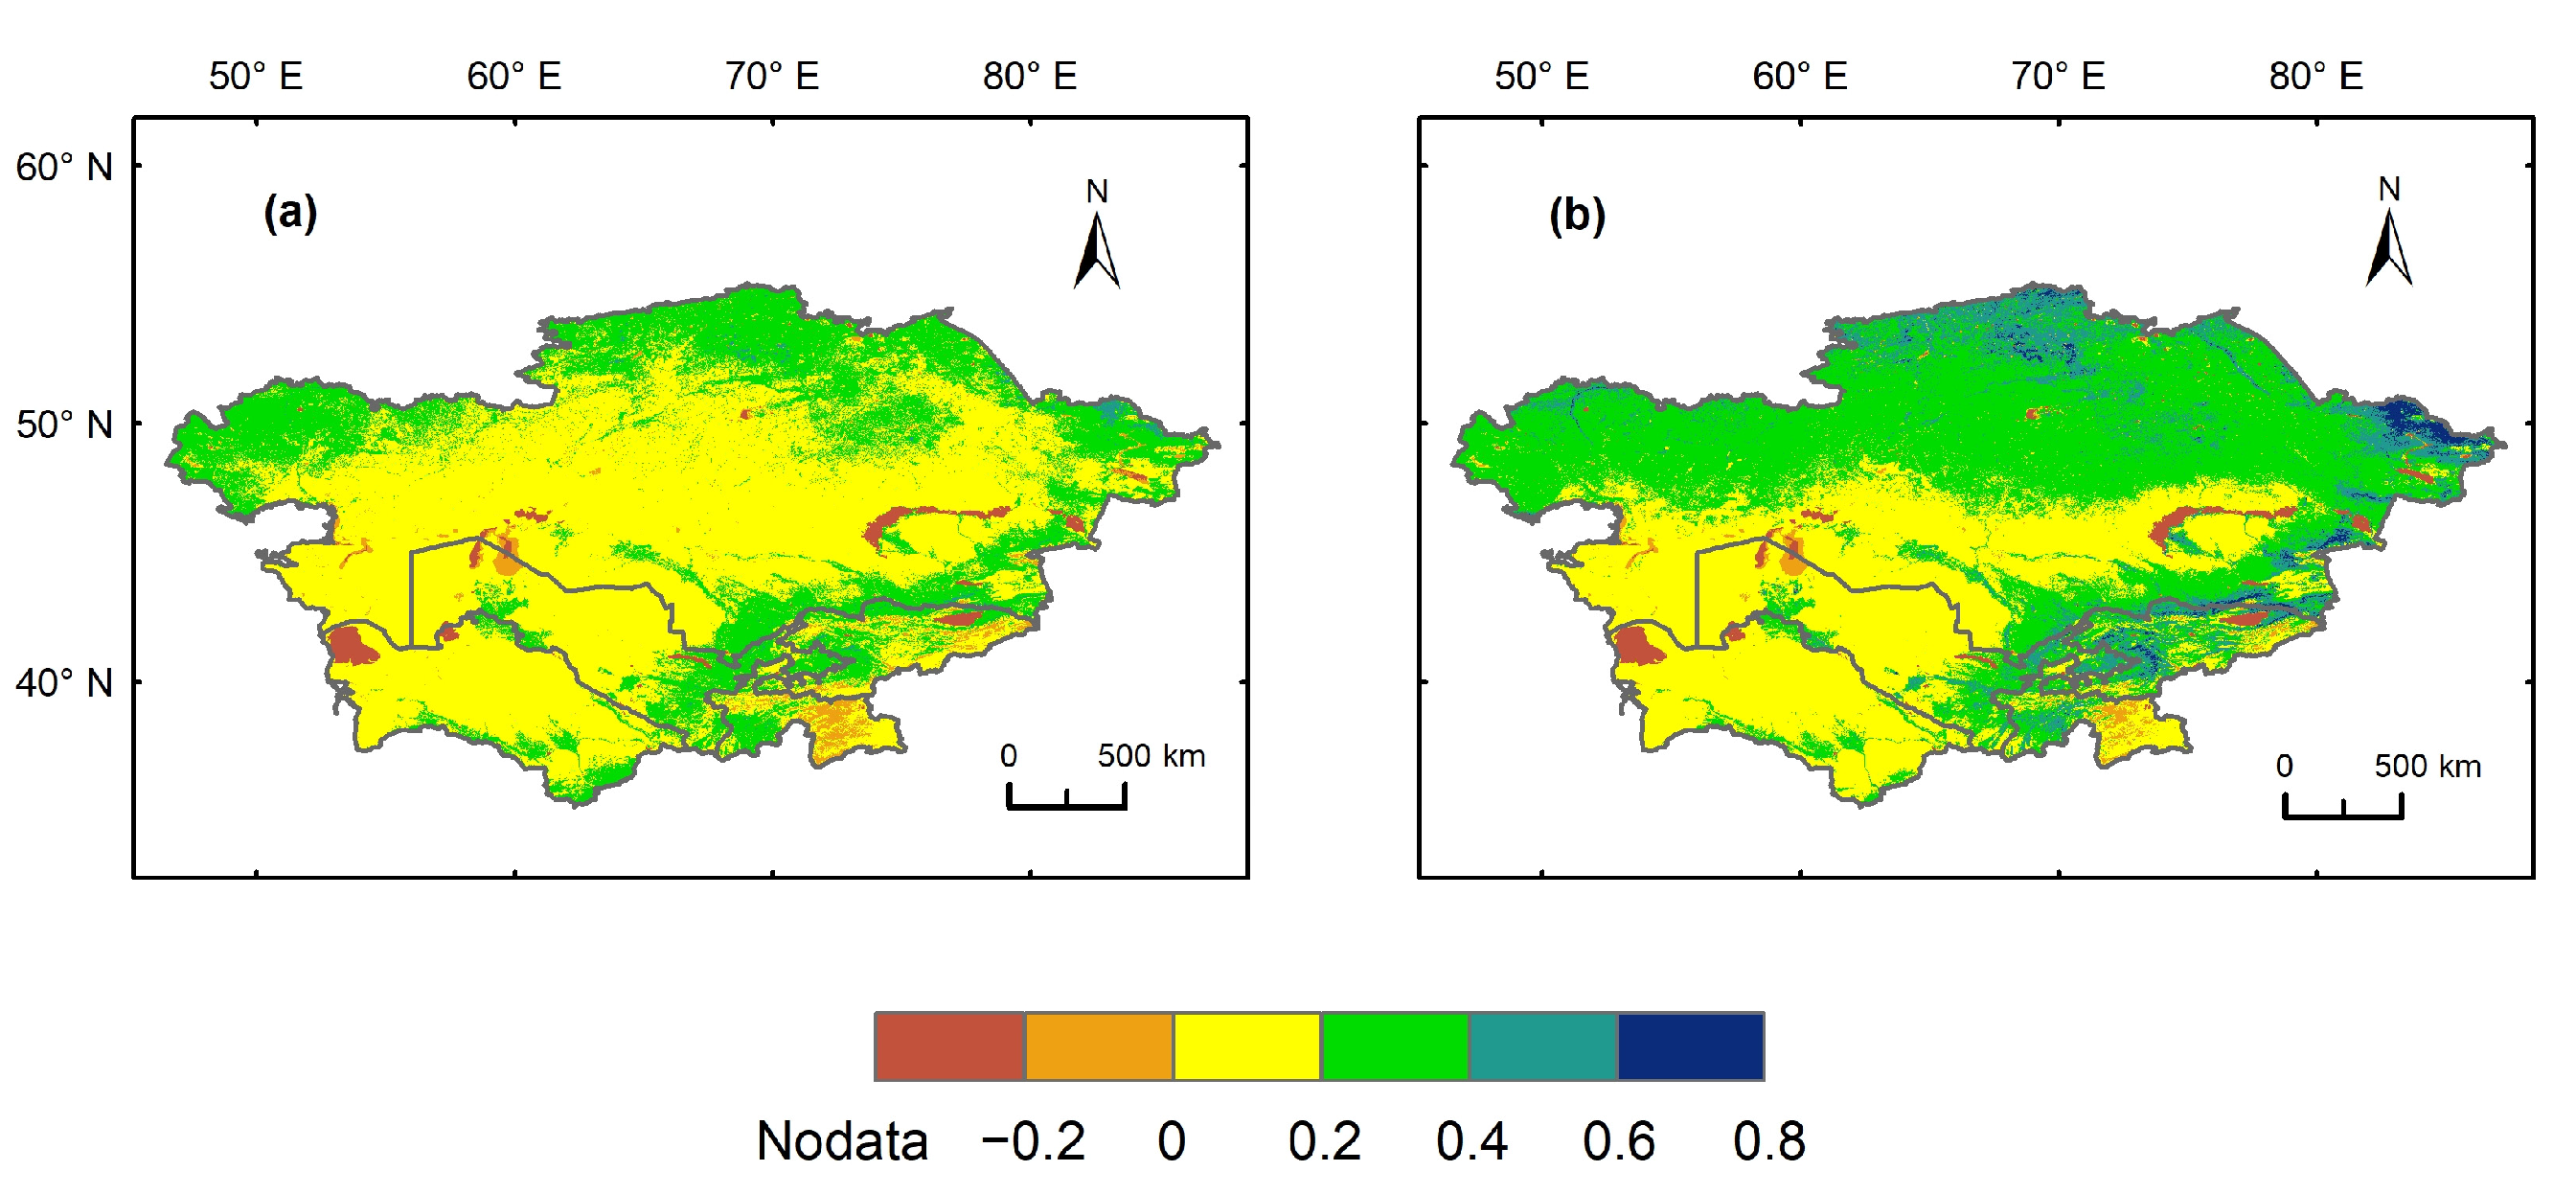
3.1. The Vegetation Condition in Central Asia

Overall, the vegetation coverage in Central Asia was relatively low, with an annual average NDVI of 0.16 in the past 20 years and only 0.24 during the growing season. Since the main vegetation in Central Asia is grassland, NDVI exhibited clear seasonality, with the highest value observed during summer (0.24), followed by spring (0.19) and autumn (0.16), and the lowest NDVI during winter (0.03).
Moreover, the vegetation coverage in Central Asia exhibited significant spatial heterogeneity. Specifically, NDVI in northern Kazakhstan and along the border between the five countries is relatively high (Figure 2). Conversely, in the southwest of Central Asia, regions such as the Karakum Desert, Kyzylkum Desert, and Ustyurt Plateau exhibited sparse vegetation coverage, with scattered farmland being the only exception to this trend. Additionally, the vegetation coverage in the Pamir Plateau region of eastern Tajikistan was extremely low due to the unfavorable geographical and climatic conditions that are not conducive to plant survival.

3.2. The Characteristics of Vegetation Change in Central Asia

In the past two decades, the vegetation has shown a weakly fluctuating growth trend, with an annual NDVI increase of only 0.00025/yr and a growing season NDVI increase of 0.00031/yr in Central Asia (Figure 3a,b). Moreover, significant differences in the trend of NDVI changes were observed between the year and growing season around 2004 and 2010, largely due to relatively high NDVI values during the winter of those years (Figure S1).
This study revealed that the lowest NDVI value over the past two decades occurred in 2008 (annual mean NDVI: 0.15, growing season mean NDVI: 0.22), while the highest value was observed in 2016 (annual mean NDVI: 0.19, growing season mean NDVI: 0.28). Additionally, the study identified a potential reversal in the NDVI trend in the region during the last two decades (Figure 3a,b). To verify this finding, a Mann–Kendall test was conducted on this trend. The results presented in Figure 3c,d indicate a significant abrupt change in the temporal variation of NDVI in Central Asia around 2010. To investigate the reasons for the differences in mutation points between year-round and growing season trends, in this research, the Mann–Kendall test was conducted to analyze the interannual NDVI trends in the four seasons. Our results revealed that the years with NDVI change points displayed some seasonality, but most were concentrated around 2010 (Figure S2). Therefore, we consider 2010 the mutation year and divide the study period into two distinct periods (2001–2010 and 2011–2020) for further analysis. In the first decade, NDVI in Central Asia showed a weak downward trend (annual mean change rate: −0.0013/yr; growing season mean change rate: −0.0028/yr), while in the following decade, the trend turned upward (annual mean change rate: 0.0012/yr; growing season mean change rate: 0.0024/yr).
The trend of NDVI variation in Central Asia was significantly different between the previous and the last decade. In the first decade, the NDVI across most regions of Central Asia mainly decreased (Figure 4). For the annual NDVI change, the decreasing area accounted for 66.4%, and the decreasing area accounted for 70.7% during the growing season. Nevertheless, the vegetation has mainly increased in the last decade. Around 66.8% of the regions displayed an upward trend in annual NDVI, and 78.9% of the regions showed an upward trend in growing season NDVI.
The study found that 45.55% of the total area in Central Asia declined in the first decade and increased in the second decade. The areas of continuous decline and continuous increase accounted for 25.19% and 23.38%, respectively, while the area of increasing in the first decade and decreasing in the second decade was only 5.88%. Over the past two decades, the regions exhibiting continuous vegetation degradation were predominantly situated in the northwest of Central Asia, including the Caspian lowland, Turgay Valley, and the Karakum desert in Turkmenistan. The areas showing continuous vegetation improvement were primarily distributed in several key areas, including the Ustyurt Plateau, the northwest of the Aral Sea, as well as the triangle area formed by the northeast of the Syr Darya and the southwest of Lake Balkhash, and the region near the Caspian Sea in the southwest of Turkmenistan. The majority of regions in Central Asia experienced a decline during the first decade and increased in the last decade. The regions displaying this trend were predominantly situated in the northeastern part of Central Asia, southern Turkmenistan, and the Kazakh–Kyrgyz steppe region in southern Kazakhstan. A few regions in Central Asia showed a slight increase in NDVI in the first decade and a decrease during the last decade, with the southwest of Tajikistan being a typical example (Figure 4).

3.3. Relative Contributions of Natural and Anthropogenic Factors to Spatial and Temporal Dynamics of Vegetation

In order to further explore the influencing factors of spatial and temporal dynamics of vegetation in Central Asia, our study used the mean NDVI of the growing season attributed to the spatial heterogeneity used by the geodetector, while correlation analysis methods were employed to analyze the influence of temporal variation. Our results indicate (Figure 5a) that climatic, geographical, and anthropogenic factors exert significant driving effects on the spatial distribution of NDVI. Among them, land-use type data as geographical factors had the most substantial influence on the spatial distribution of vegetation in Central Asia, with a q-value of 0.46, indicating that 46% of the spatial heterogeneity of NDVI in Central Asia can be explained by land-use types (the red bar in Figure 3a). Although elevation and soil type data significantly influenced vegetation distribution in Central Asia, their degree of impact was not high. Precipitation emerged as the primary driving factor of NDVI in Central Asia, with a q -value of 0.35, indicating that it had significant explanatory power for the spatial heterogeneity of NDVI, besides land-use types. Although human factors also exert influence on the spatial distribution of vegetation, their influence was relatively weaker compared to climatic and geographical factors (the blue bar in Figure 3a).
The vegetation spatial distribution is influenced not only by the individual factors but also by linear or non-linear interactions among them. To explore the non-linear interaction between factors, we calculated the interaction between them using a geodetector. The results (Figure 5b) demonstrate that the q -value of the spatial distribution of NDVI increases when most of the driving factors interact, indicating that there is a certain degree of positive interaction among climatic factors, geographical factors, and anthropogenic factors. Specifically, when wind speed and elevation interact with other factors, the q-value of the spatial distribution of NDVI increases non-linearly. Therefore, it can be concluded that although wind speed and elevation have little influence on the vegetation spatial distribution in Central Asia alone, they interact with climatic factors such as saturated vapor pressure, radiation, precipitation, and soil moisture content and further increase their influence on the spatial heterogeneity with NDVI in a non-linear way.
In terms of the reasons for temporal variations in Central Asian vegetation, we selected variables that exhibited significant changes over the past two decades and calculated Pearson correlation coefficients between the average NDVI and these variables to quantify their influence on the temporal trend of NDVI.
Our findings suggested that moisture-related factors, such as precipitation, soil moisture, and saturated vapor pressure, were the primary drivers of the temporal variation in NDVI (Table 3). A robust correlation between these factors and the variance of NDVI has been detected. Specifically, both precipitation and soil water content displayed a significant positive correlation with NDVI, as evidenced by correlation coefficients R 2 of 0.78 and 0.72, respectively. In contrast, we observed a pronounced negative correlation between the VPD and the change in NDVI, indicated by a correlation coefficient of −0.67. Similarly, surface radiation also displayed a significant negative correlation (−0.62) with NDVI. However, we found that temperature factors and wind speed had no significant influence on the trend of NDVI over the past two decades.
From 2001 to 2010, in addition to water-related factors such as precipitation, saturated water vapor pressure, and soil moisture, temperature had a pronounced increased influence on the change in NDVI compared to the entire two-decade period. During the latter decade period, the primary factor driving the change in NDVI was still water-related. However, the reason for the increased correlation coefficient of radiation may be that increased precipitation led to a decrease in radiation, which indirectly affected the interannual variation trend of vegetation.

4. Discussion

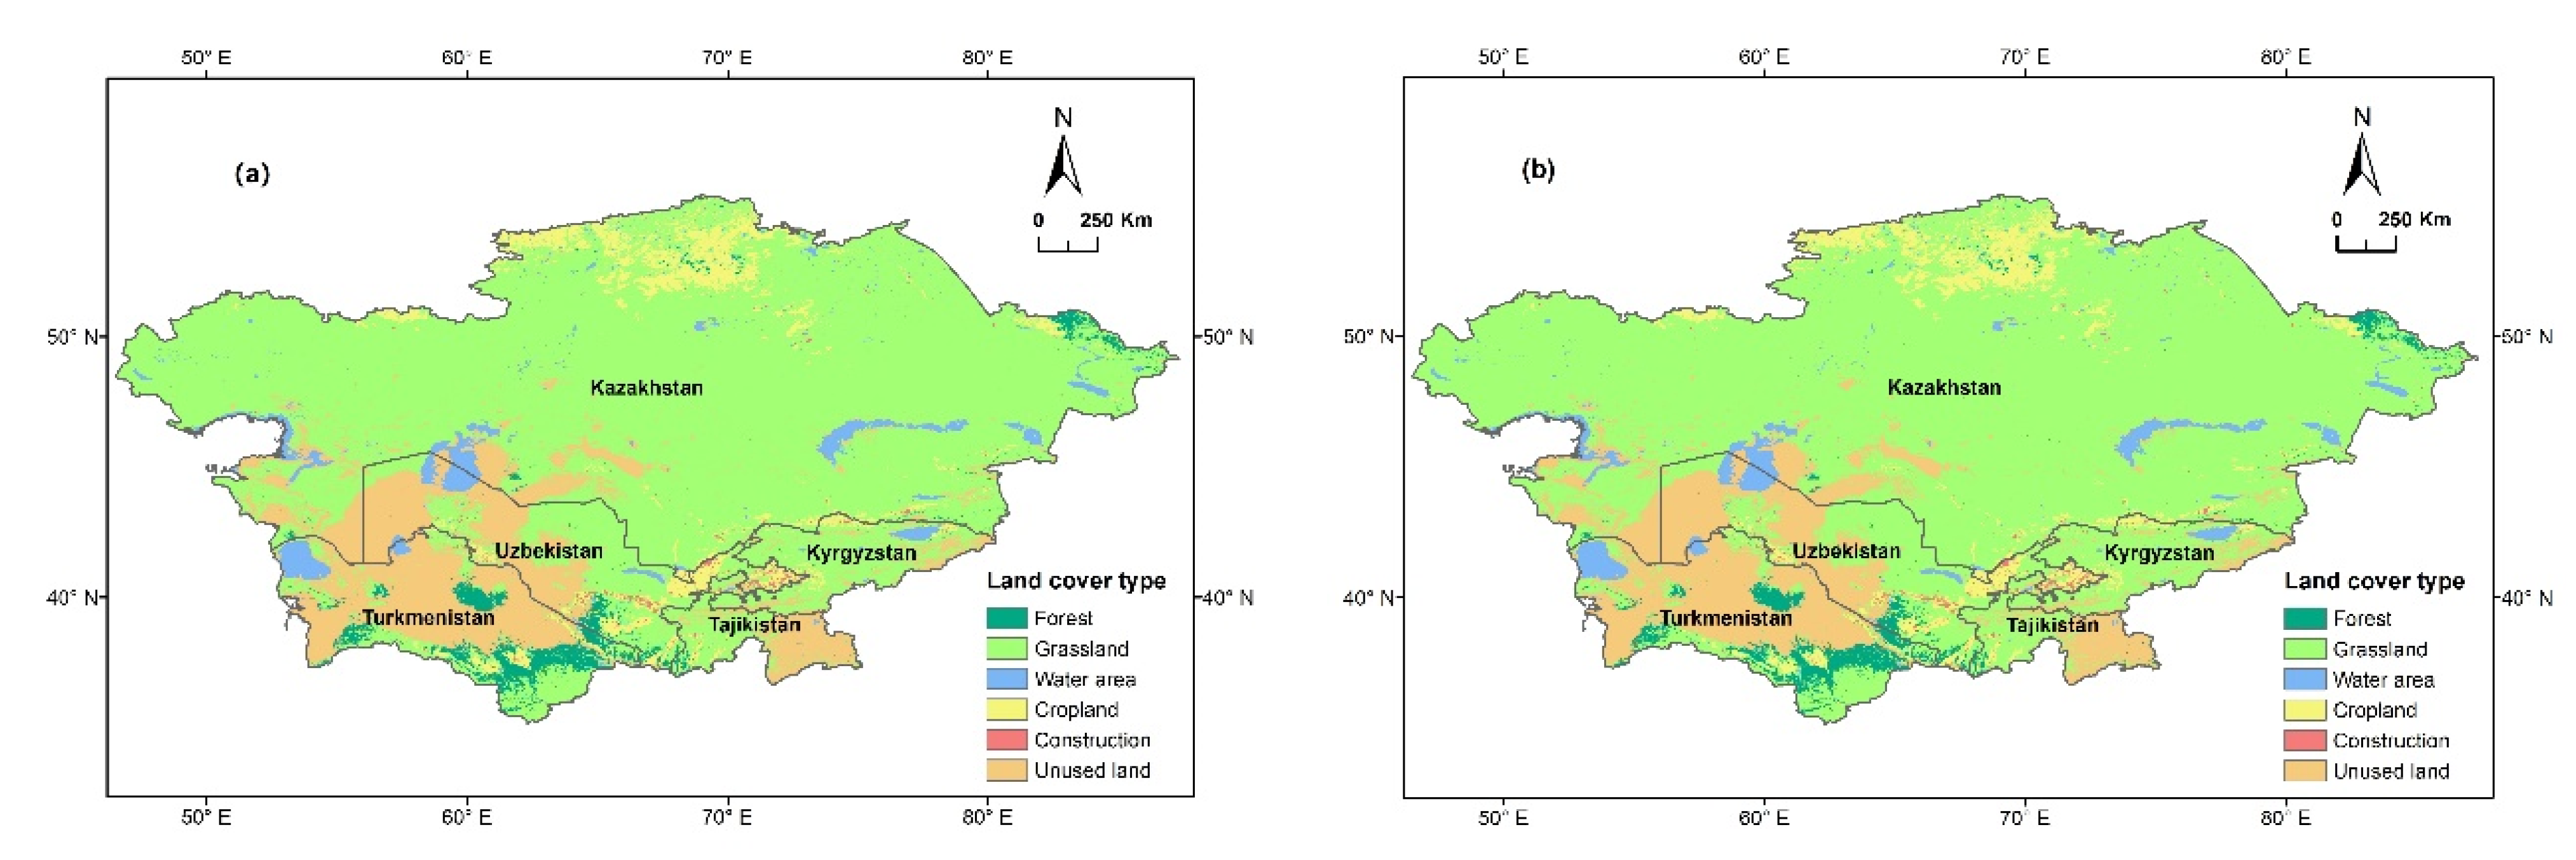
4.1. Causes of Vegetation Spatial Distribution in Central Asia

The findings of our investigation revealed that the vegetation cover in Central Asia is sparse, and its spatial distribution exhibits a significant degree of heterogeneity. Specifically, the NDVI values were found to be higher in the northern and eastern areas while lower in the southern and western plains. The results of this study align with the findings of Han et al. [15] and Yin et al. [11]. The results of the geodetector showed that land-use type is a crucial determinant of vegetation spatial distribution in Central Asia. The vegetation type in this study region was mainly grassland, which covered a significant portion of the area. In the northern part of the region, particularly in Kazakhstan, a substantial area was dedicated to cropland, while in the eastern part of the region, there was a part of woodland consisting of mixed forests. In the southwestern part of the region, there was some bare land and partly sparse scrub woodland. The Pamir Plateau in the eastern region of Tajikistan exhibited predominantly bare land vegetation distribution (Figure 6).
As forest land has a much higher vegetable cover than other types of vegetation, the NDVI in areas covered by mixed forests in the northeastern Kazakhskiy Melkosopochnik is significantly higher than in other areas. Moreover, in Central Asia, regions with high NDVI during the growing season are mainly dominated by farmland and mixed forests, primarily located in the northern Kazakhskiy Melkosopochnik, Kyrgyzstan, and northwest Tajikistan. As farmland can be irrigated during water shortages, it has a higher vegetation cover compared to areas without irrigation. The southwestern part of Central Asia, which includes the Karakum Desert, Kyzylkum Desert, and Ustyurt Plateau, mainly consists of bare land, and due to the harsh environment, most of the region has very low vegetation cover.
The grassland vegetation in Central Asia exhibits a complex coverage pattern influenced by the diverse environments it inhabits. In Central Asia’s Kazakhskiy Melkosopochnik, a windward slope blocks the warm and humid airflow from the Atlantic Ocean, creating an optimal ecological environment for the Kazakh–Kyrgyz Steppe with a relatively high level of vegetation cover. Meanwhile, the Pamir Plateau, Karakorum, Kunlun, Tien Shan, and Altai mountain ranges in the eastern parts of Kyrgyzstan and Tajikistan have splendid grassland vegetation cover on their western side due to water recharge from the melting of plateau glaciers in summer. In contrast, the grasslands in the Ustyurt Plateau, Kyzylkum Desert, and Muyunkun Desert exhibit low vegetation cover due to the arid and water-scarce climate, which is not conducive to vegetation growth.
Based on the geodetector analysis conducted in this study, it was found that precipitation is a significant factor influencing the spatial distribution of NDVI. This finding aligns with the results made in Propastin’s study, where it was observed that in approximately 75% of the Central Asian region, there was a significant correlation between precipitation and NDVI [17]. Figure 7 shows a strong similarity in the spatial distribution between the NDVI precipitation. Regions with high precipitation, such as Tajikistan and western Kyrgyzstan, exhibit higher vegetation coverage. Conversely, the areas in the southwestern part of Central Asia, including the Karakum and Kyzylkum Deserts, show lower vegetation cover due to limited precipitation. However, the southern Aral Sea lowlands maintain relatively high vegetation cover despite low overall rainfall. This can be attributed to its location in the Amu Darya River basin, with abundant water resources and groundwater content, resulting in weaker dependence on precipitation and more favorable conditions for vegetation growth.
In addition to topographic and climatic factors, anthropogenic factors also exhibited a certain impact on the spatial distribution of NDVI. Over the 20-year period from 2001 to 2020, land-use types in Central Asia have changed to some extent, but the changes are not significant, with the area of land-use types changing accounting for only 5.87% of the entire Central Asian area. Although land-use change occurs locally, it does not exert a substantial influence on the overall vegetation distribution pattern in Central Asia since the proportion of areas where land-use change occurs is limited compared to the overall area of Central Asia. As a result, the type of land-use change has little impact on the distribution of NDVI in Central Asia as a whole. However, humans tend to settle and graze in environmentally suitable areas. Therefore, the geodetector results reveal a certain degree of alignment between the spatial distribution of population size and NDVI in Central Asia.
Furthermore, we have incorporated grazing data and conducted one more geodetector experiment to further investigate the effects of human activities on vegetation spatial heterogeneity. The results indicate that while grazing can influence the spatial distribution of vegetation in Central Asia, its impact on the overall spatial heterogeneity of vegetation across the entire region is much less significant compared to climatic factors ( q = 0.01). However, while grazing may have a limited impact on NDVI spatial heterogeneity across the entire Central Asia region, there could still be some influence on local areas [14,31].
The spatial distribution of vegetation in this study region is not solely influenced by an individual factor but rather by the combined effect of various drivers. As demonstrated by the results of the geodetector, the combined influence of precipitation and land-use type can determine 69% of the NDVI distribution in Central Asia. This observation aligns with the study conducted by Jiang et al. [14], which indicated that shrubland, grassland, and sparse vegetation are more sensitive to natural precipitation due to a lack of irrigation. Therefore, the vegetation in the Kyzylkm Desert and the Ustyurt Plateau in this area showed a higher correlation to the precipitation. In addition, this study found that elevation and wind speed can have non-linear effects on precipitation, temperature and other factors, thereby further influencing the spatial distribution of vegetation. Previous research has indicated temperature and precipitation exhibit variations at different elevations [5]. These variations in vegetation response to climate change at different altitudes ultimately influence the distribution of vegetation in the study area. For example, temperature can play a crucial role in limiting vegetation growth in some high-altitude areas, while for plain areas, precipitation has been identified as the dominant factor affecting the spatial distribution of NDVI [11,23]. Additionally, the influence of extreme climate in mountain areas on vegetation is much greater than that in plain areas, according to Luo et al. [5]. Therefore, elevation can interact with climatic factors to influence the spatial distribution of vegetation.
Furthermore, wind speed can impact vegetation both directly and indirectly. Indirectly, it can cause material and energy exchange in the surface boundary layer, leading to changes in the surface microclimate that affect vegetation growth. Directly, wind can affect vegetation by altering leaf morphology, transpiration rate, and soil moisture, thus impacting vegetation development. Therefore, areas with higher perennial wind speeds tend to have lower vegetation cover [32,33].

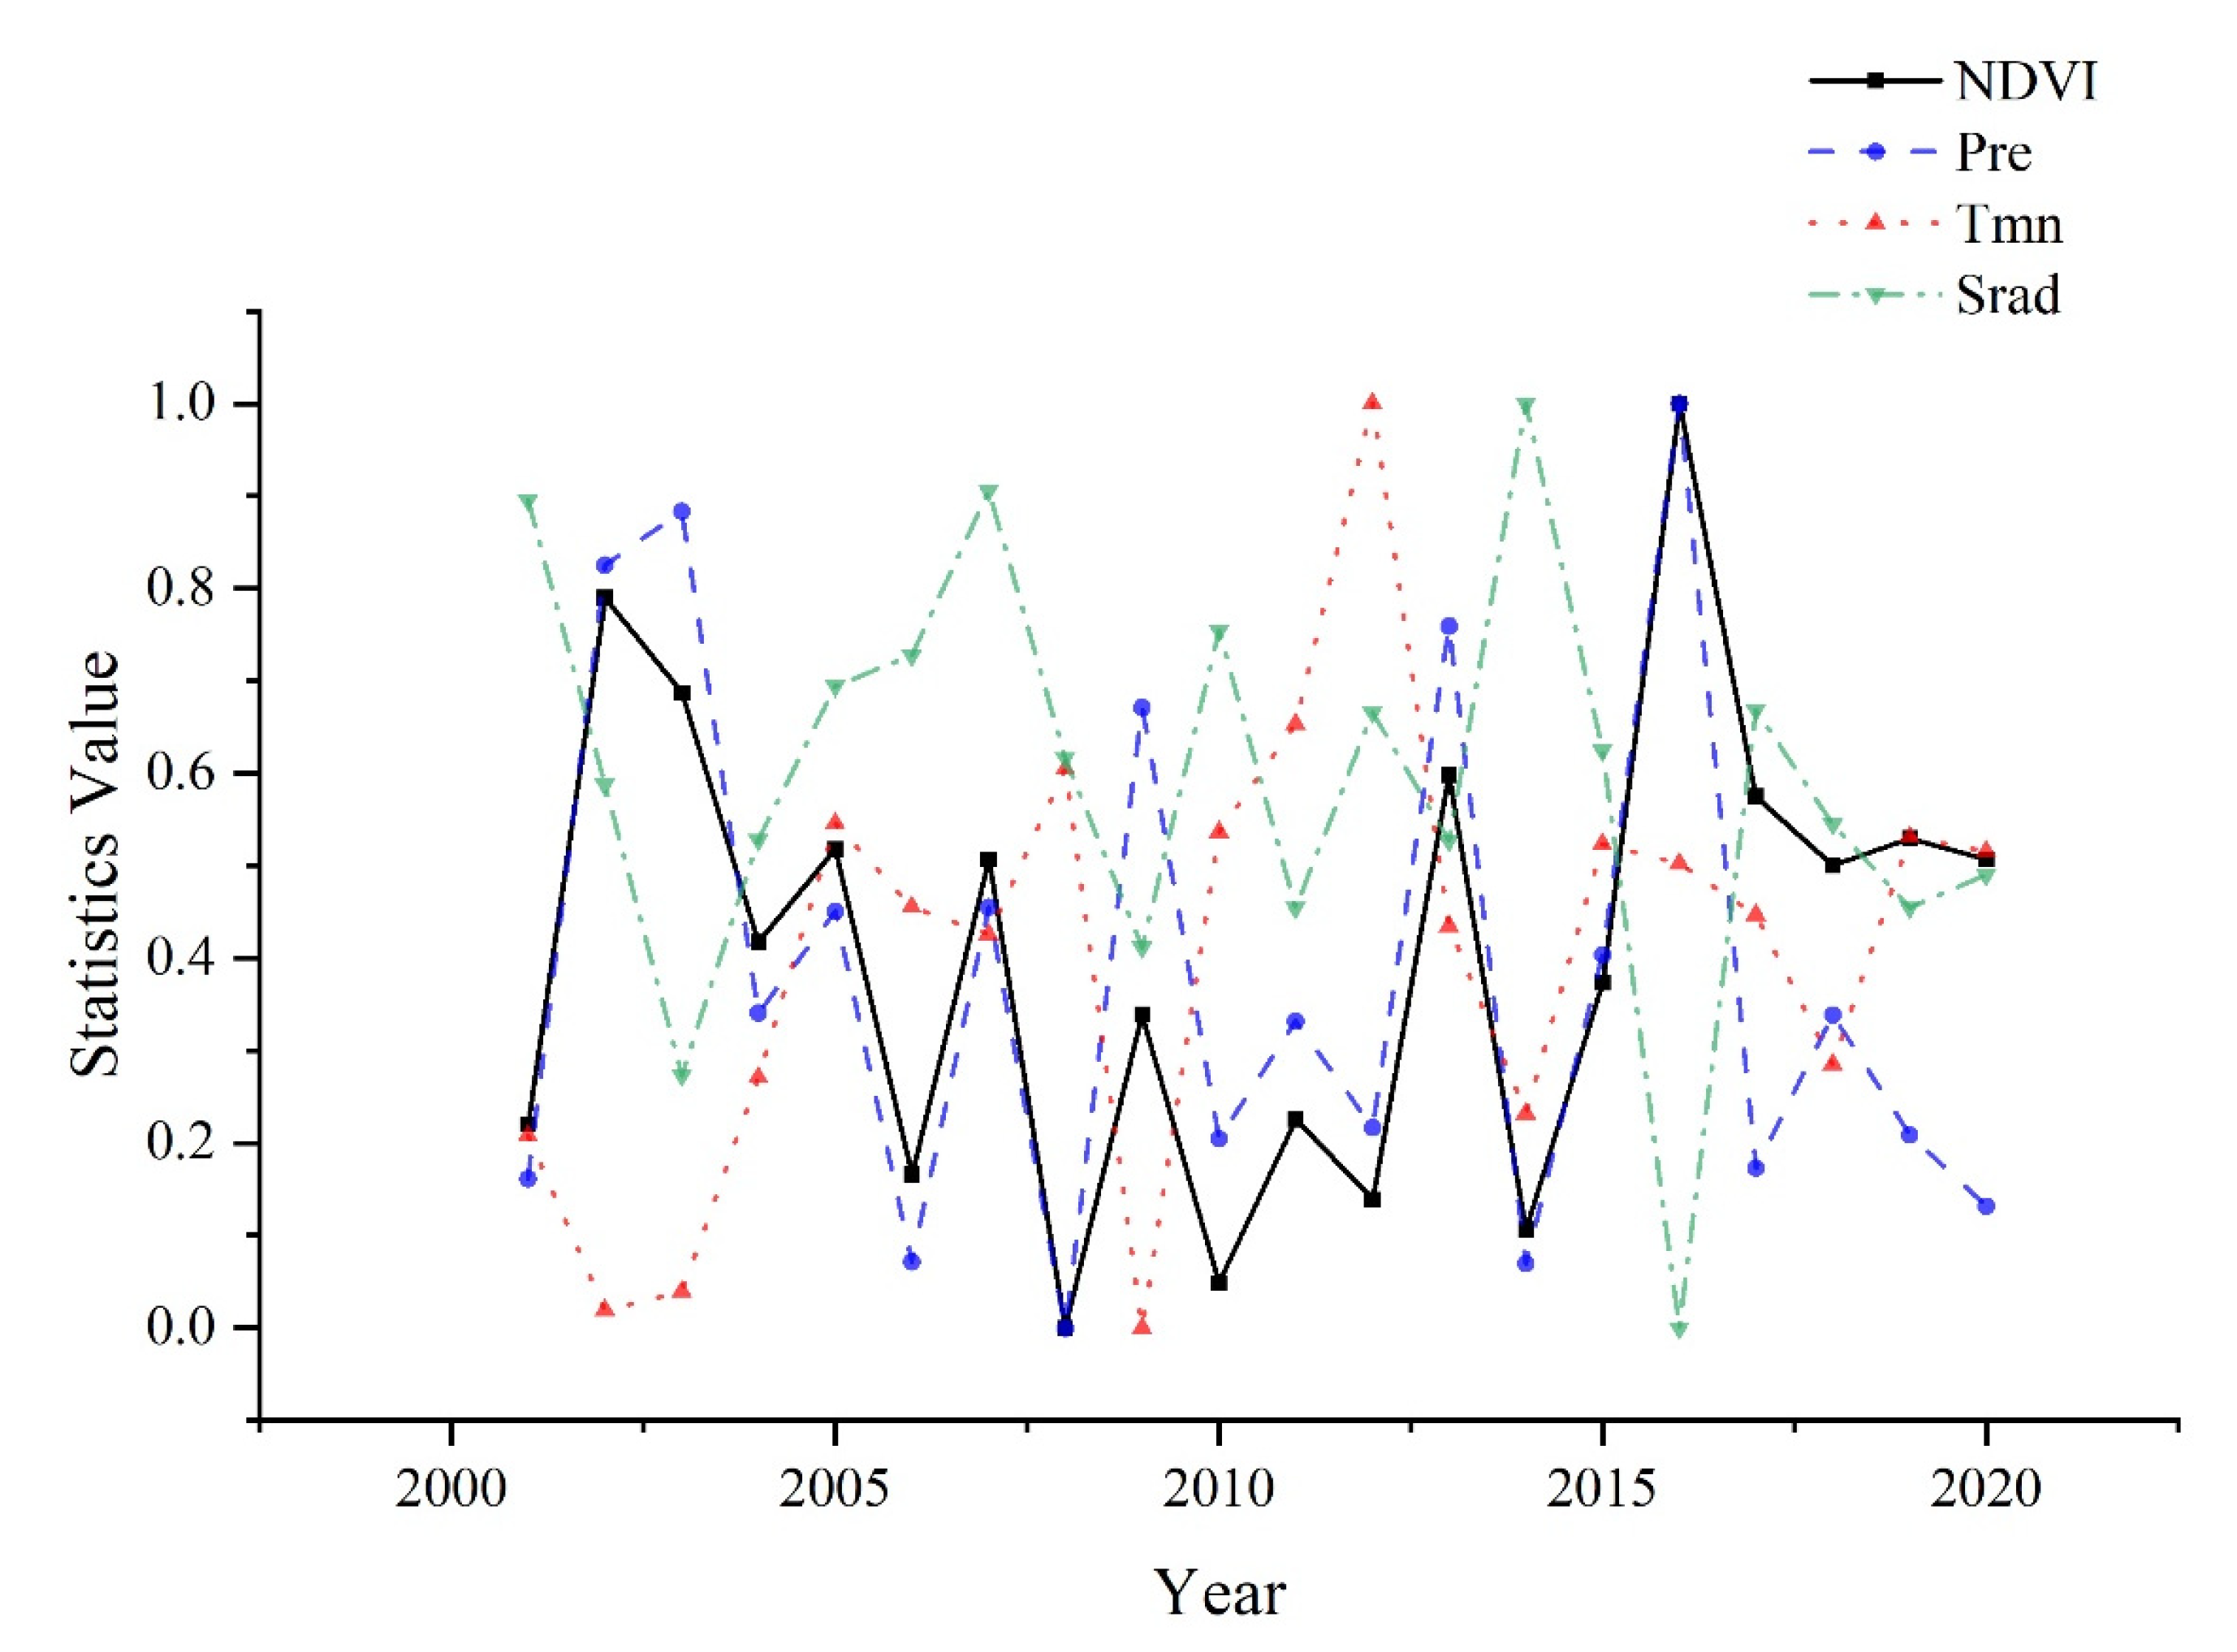
4.2. Causes of Vegetation Temporal Changes in Central Asia

The study showed a slight upward trend in the vegetation of Central Asia, but the NDVI trends (Figure 3a,b) did not meet the significance criterion ( p > 0.05 ). Nevertheless, it is noteworthy that the results of the change point analysis passed the significance threshold. This indicates a significant turning point in NDVI over the past two decades. As for the influence factors of interannual vegetation variation, this study revealed a strong correlation between interannual vegetation variation in Central Asia and changes in moisture, temperature, and radiation. Among these factors, moisture was found to be the primary driver of interannual NDVI variation. The result is consistent with the findings of Propastin et al., who reported a strong correlation ( R 2 = 0.60) between rainfall variability and NDVI variability during the growing season in Central Asia from 1982 to 2003 [21]. Given the arid and semi-arid region of Central Asia, precipitation is the main factor dominating ecosystem structure and function in this region [34,35]. To further understand the reasons behind vegetation interannual changes, we conducted a grid-level correlation analysis of NDVI and climate variables across the Central Asian region. The results indicate that precipitation is highly positively correlated with NDVI across most of Central Asia, which further supports the above conclusion (Figure S3). In addition, this research reveals the indirect influence of temperature on the vegetation trend in Central Asia. The findings suggest that there might be a negative response of NDVI to interannual temperature variations ( r = −0.32). Although temperature is essential for plant growth, high temperatures can limit plant growth. When the temperature is within a suitable range, plant growth is proportional to the temperature until it reaches the optimum value. If the temperature exceeds the optimum value, plants close their stomata or reduce their aperture, which hinders photosynthesis and reduces vegetation cover [21]. Similarly, radiation variation also affects the interannual variation of NDVI. Adequate radiation promotes photosynthesis and increases chlorophyll, leading to vegetation growth, whereas excessive radiation causes increased transpiration and excessive water consumption, ultimately leading to the wilting of vegetation and a decrease in vegetation index [36].
To further investigate the reasons behind the changes in NDVI trends in the past two decades, this study utilized precipitation data to represent the moisture factor, mean temperature data to represent the temperature factor, and radiation data to represent the light factor. The trends of these factors in the past two decades were plotted, and their relationship with the NDVI trend was analyzed. As depicted in Figure 8, the NDVI trend showed a high degree of consistency with the interannual variation of precipitation, while a significant negative correlation was observed with the temperature and radiation data. The lowest point of NDVI was recorded in 2008, which could be attributed to the low precipitation and unfavorable climatic conditions in that year, leading to a decline in vegetation cover. However, in 2016, the precipitation was more abundant, the temperature was relatively mild, and the environment was more conducive to vegetation growth.
Due to the complex topography, land-use conditions, and climatic conditions in Central Asia, the extent of vegetation changes varies significantly across different regions and land-use types. Specifically, regions with continuous vegetation decline in this region are primarily concentrated in northern Kazakhstan, covering the Turgay Plateau, the Turgay Valley, and the northern part of the Kazakhskiy Melkosopochnik, which is consistent with the findings of de Beurs et al. [22]. Moreover, in these regions, cropland and grassland are the predominant vegetation types. Figure 9 also reveals that the precipitation in this region has also shown a continuous decline. The vegetation in this region is particularly vulnerable to the reduction in precipitation due to the relatively small root system of grassland and shrubs, which cannot retain water for a long time [21]. On the other hand, the western side of the Aral Sea, the area in Turkmenistan, and the area near Lake Balkhash have shown a continuous increase in vegetation cover over the past two decades. This could be attributed to their proximity to water bodies, which have abundant groundwater content and are less sensitive to precipitation changes compared to other regions. In the case of Turkmenistan and Uzbekistan, the vegetation in the Syr Darya and Amu Darya basins declined in the first decade and increased in the second decade. This region mainly consists of grassland and sparse vegetation, and therefore, the change in vegetation cover could be mainly due to changes in precipitation, as depicted in Figure 9.
Subsequently, based on different NDVI change classes (Figure 9), we conducted analyses of the influencing factors within each class. The outcomes demonstrate that, across various change patterns, precipitation remains a predominant factor (Table S2). Particularly, regions with consistent vegetation decrease are notably affected by precipitation. Furthermore, we can also observe that the turning point in Central Asian vegetation around 2010 can be primarily attributed to changes in precipitation. This finding further reinforces our perspective on the significance of precipitation in the vegetation dynamics of Central Asia.

4.3. Implications and Limitations

The results of this study help us to understand the spatial and temporal variation of vegetation, the factors driving its distribution, and the trends in vegetation evolution in Central Asia. This provides a scientific basis for estimating ecosystem changes and the carbon cycle in the arid zone of Central Asia. In addition, the study of the vegetation change in Central Asia can play an important role in promoting the sustainable development of the ecosystem and economy in the region and provide a spatial and large-scale ecological reference.
Nevertheless, limitations are still present. Firstly, although this study considered climatic, geographical, and anthropogenic factors as drivers of spatial and temporal variation in NDVI, due to the complexity of ecosystems, there are many other factors that may have significant effects on vegetation growth, such as CO2 fertilization effect and nitrogen deposition [37,38]. However, due to the difficulty and accuracy of obtaining spatial and temporal data for these factors, they were not included in this study. Instead, typical and representative drivers for which spatial and temporal data are readily available were selected. Further analysis of these influencing factors and vegetation dynamics is needed for future studies. Secondly, the method used in this study to attribute temporal variation trends of NDVI was correlation analysis. As a classical statistical analysis method, correlation analysis is highly reliable and stable, can quickly quantify the relationship between variables, and has high interpretability [39]. However, the significance of the correlation analysis results may not fully prove a causal relationship between variables, where correlations may be caused by the common trend, cycles, and other phenomena of variables [30]. Therefore, further research on the drivers of vegetation dynamics is necessary, such as controlled experiments or analysis through observational data.

5. Conclusions

This research analyzed the spatial and temporal changes in vegetation and their influencing factors in Central Asia over the past two decades using NDVI as an indicator. The results showed that NDVI exhibited significant spatial heterogeneity, with higher values observed in northern Kazakhstan and the boundary between the five countries and extremely sparse vegetation coverage in the northwest. The study revealed a weak, increasing trend in NDVI from 2001 to 2020, with a significant abrupt change observed around 2010. Based on the geodetector, we have identified that the overall spatial heterogeneity pattern of NDVI in Central Asia can be influenced by land-use types, but its main driving force remains moisture factors. Furthermore, precipitation was identified as the main driver for the temporal variation of NDVI. Notably, the noteworthy inflection point observed around 2010 in NDVI is significantly associated with precipitation changes. This conclusion emphasizes the importance of moisture factors in maintaining the stability of vegetation spatial distribution in Central Asia, offering essential theoretical support for the management and prevention of grassland degradation in Central Asia.

Supplementary Materials

The following supporting information can be downloaded at: https://www.mdpi.com/article/10.3390/rs15194670/s1, Figure S1: Seasonal variation of vegetation in Central Asia from 2001 to 2020, Figure S2: Abrupt change point detection for the seasonal NDVI time series. Figure S3. Correlation analysis of climate variables and NDVI at pixel level. (a,c,e) represent the correlation of temperature, precipitation and solar radiation, respectively. (b,d,f) represent the significant regions identified by a significance test (95%). Table S1. Comprehensive details regarding the data sources for vegetation and the potential driving factors in Central Asia. Table S2. Correlation between different NDVI change regions and Precipitation (Pre), Temperature (Tmn), and Radiation (Srad).

Author Contributions

Conceptualization, C.G. and X.R.; methodology, C.G., X.R., H.H. and Y.L.; software, C.G.; validation, L.Z. and X.Z.; formal analysis, C.G., X.R., N.Z. and X.C.; writing—original draft preparation, C.G.; writing—review and editing, C.G., X.R., L.F. and H.H.; funding acquisition, X.R. All authors have read and agreed to the published version of the manuscript.

Funding

This research was funded by the National Key Research and Development Program of China (2019YFE0126500).

Data Availability Statement

This study was performed based on public-access data. The data that support the findings of this study are available from the corresponding author upon reasonable request.

Conflicts of Interest

The authors declare no conflict of interest.

References

  1. Pan, N.; Feng, X.; Fu, B.; Wang, S.; Ji, F.; Pan, S. Increasing Global Vegetation Browning Hidden in Overall Vegetation Greening: Insights from Time-Varying Trends. Remote Sens. Environ. 2018, 214, 59–72. [Google Scholar] [CrossRef]
  2. Cramer, W.P.; Leemans, R. Assessing Impacts of Climate Change on Vegetation Using Climate Classification Systems. In Vegetation Dynamics & Global Change; Solomon, A.M., Shugart, H.H., Eds.; Springer: Boston, MA, USA, 1993; pp. 190–217. ISBN 978-1-4613-6217-3. [Google Scholar]
  3. Schwartz, M.D. Green-Wave Phenology. Nature 1998, 394, 839–840. [Google Scholar] [CrossRef]
  4. Liu, Y.; Zhou, R.; Wen, Z.; Khalifa, M.; Zheng, C.; Ren, H.; Zhang, Z.; Wang, Z. Assessing the Impacts of Drought on Net Primary Productivity of Global Land Biomes in Different Climate Zones. Ecol. Indic. 2021, 130, 108146. [Google Scholar] [CrossRef]
  5. Luo, M.; Sa, C.; Meng, F.; Duan, Y.; Liu, T.; Bao, Y. Assessing Extreme Climatic Changes on a Monthly Scale and Their Implications for Vegetation in Central Asia. J. Clean. Prod. 2020, 271, 122396. [Google Scholar] [CrossRef]
  6. Lioubimtseva, E.; Henebry, G.M. Climate and Environmental Change in Arid Central Asia: Impacts, Vulnerability, and Adaptations. J. Arid. Environ. 2009, 73, 963–977. [Google Scholar] [CrossRef]
  7. Zhang, C.; Lu, D.; Chen, X.; Zhang, Y.; Maisupova, B.; Tao, Y. The Spatiotemporal Patterns of Vegetation Coverage and Biomass of the Temperate Deserts in Central Asia and Their Relationships with Climate Controls. Remote Sens. Environ. 2016, 175, 271–281. [Google Scholar] [CrossRef]
  8. Feng, R.; Yu, R.; Zheng, H.; Gan, M. Spatial and Temporal Variations in Extreme Temperature in Central Asia. Int. J. Clim. 2018, 38, e388–e400. [Google Scholar] [CrossRef]
  9. Ma, X.; Zhu, J.; Zhang, H.; Yan, W.; Zhao, C. Trade-Offs and Synergies in Ecosystem Service Values of Inland Lake Wetlands in Central Asia under Land Use/Cover Change: A Case Study on Ebinur Lake, China. Glob. Ecol. Conserv. 2020, 24, e01253. [Google Scholar] [CrossRef]
  10. Gessner, U.; Naeimi, V.; Klein, I.; Kuenzer, C.; Klein, D.; Dech, S. The Relationship between Precipitation Anomalies and Satellite-Derived Vegetation Activity in Central Asia. Glob. Planet. Chang. 2013, 110, 74–87. [Google Scholar] [CrossRef]
  11. Yin, G.; Hu, Z.; Chen, X.; Tiyip, T. Vegetation Dynamics and Its Response to Climate Change in Central Asia. J. Arid. Land 2016, 8, 375–388. [Google Scholar] [CrossRef]
  12. Huete, A.; Didan, K.; Miura, T.; Rodriguez, E.P.; Gao, X.; Ferreira, L.G. Overview of the Radiometric and Biophysical Performance of the MODIS Vegetation Indices. Remote Sens. Environ. 2002, 83, 195–213. [Google Scholar] [CrossRef]
  13. Berdimbetov, T.; Ilyas, S.; Ma, Z.; Bilal, M.; Nietullaeva, S. Climatic Change and Human Activities Link to Vegetation Dynamics in the Aral Sea Basin Using NDVI. Earth Syst. Environ. 2021, 5, 303–318. [Google Scholar] [CrossRef]
  14. Jiang, L.; Jiapaer, G.; Bao, A.; Guo, H.; Ndayisaba, F. Vegetation Dynamics and Responses to Climate Change and Human Activities in Central Asia. Sci. Total Environ. 2017, 599–600, 967–980. [Google Scholar] [CrossRef] [PubMed]
  15. Han, X.; Sun, Y.Q.; Chen, Y.; Feng, Z.K.; Gong, Y.X.; Cheng, Y.P. Monitoring in Dynamic Change of Desertification in the Region of Central Asia Based on NOAA/AVHRR Image. Key Eng. Mater. 2012, 500, 592–597. [Google Scholar]
  16. Peng, Q.; Wang, R.; Jiang, Y.; Li, C.; Guo, W. The Change of Hydrological Variables and Its Effects on Vegetation in Central Asia. Theor. Appl. Clim. 2021, 146, 741–753. [Google Scholar] [CrossRef]
  17. Propastin, P.A.; Kappas, M.; Muratova, N.R. A Remote Sensing Based Monitoring System for Discrimination between Climate and Human-induced Vegetation Change in Central Asia. Manag. Environ. Qual. 2008, 19, 579–596. [Google Scholar] [CrossRef]
  18. Chen, T.; Bao, A.; Jiapaer, G.; Guo, H.; Zheng, G.; Jiang, L.; Chang, C.; Tuerhanjiang, L. Disentangling the Relative Impacts of Climate Change and Human Activities on Arid and Semiarid Grasslands in Central Asia during 1982–2015. Sci. Total. Environ. 2019, 653, 1311–1325. [Google Scholar] [CrossRef] [PubMed]
  19. Chen, T.; Tang, G.; Yuan, Y.; Guo, H.; Xu, Z.; Jiang, G.; Chen, X. Unraveling the Relative Impacts of Climate Change and Human Activities on Grassland Productivity in Central Asia over Last Three Decades. Sci. Total. Environ. 2020, 743, 140649. [Google Scholar] [CrossRef]
  20. Formica, A.F.; Burnside, R.J.; Dolman, P.M. Rainfall Validates MODIS-Derived NDVI as an Index of Spatio-Temporal Variation in Green Biomass across Non-Montane Semi-Arid and Arid Central Asia. J. Arid. Environ. 2017, 142, 11–21. [Google Scholar] [CrossRef]
  21. Propastin, P.A.; Kappas, M.; Muratova, N.R. Inter-Annual Changes in Vegetation Activities and Their Relationship to Temperature and Precipitation in Central Asia from 1982 to 2003. J. Environ. Inform. 2008, 12, 75–87. [Google Scholar] [CrossRef]
  22. de Beurs, K.M.; Henebry, G.M.; Owsley, B.C.; Sokolik, I. Using Multiple Remote Sensing Perspectives to Identify and Attribute Land Surface Dynamics in Central Asia 2001–2013. Remote Sens. Environ. 2015, 170, 48–61. [Google Scholar] [CrossRef]
  23. Mohammat, A.; Wang, X.; Xu, X.; Peng, L.; Yang, Y.; Zhang, X.; Myneni, R.B.; Piao, S. Drought and Spring Cooling Induced Recent Decrease in Vegetation Growth in Inner Asia. Agric. For. Meteorol. 2013, 178–179, 21–30. [Google Scholar] [CrossRef]
  24. Klein, I.; Gessner, U.; Kuenzer, C. Regional Land Cover Mapping and Change Detection in Central Asia Using MODIS Time-Series. Appl. Geogr. 2012, 35, 219–234. [Google Scholar] [CrossRef]
  25. Mann, H.B. Nonparametric Tests Against Trend. Econometrica 1945, 13, 245–259. [Google Scholar] [CrossRef]
  26. Kendall, M.G. Rank Correlation Methods; Griffin: Oxford, UK, 1948. [Google Scholar]
  27. Wang, J.; Li, X.; Christakos, G.; Liao, Y.; Zhang, T.; Gu, X.; Zheng, X. Geographical Detectors-Based Health Risk Assessment and Its Application in the Neural Tube Defects Study of the Heshun Region, China. Int. J. Geogr. Inf. Sci. 2010, 24, 107–127. [Google Scholar] [CrossRef]
  28. Wang, J.-F.; Zhang, T.-L.; Fu, B.-J. A Measure of Spatial Stratified Heterogeneity. Ecol. Indic. 2016, 67, 250–256. [Google Scholar] [CrossRef]
  29. Wang, J.F.; Hu, Y. Environmental Health Risk Detection with GeogDetector. Environ. Model. Softw. 2012, 33, 114–115. [Google Scholar] [CrossRef]
  30. Zhu, L.; Meng, J.; Zhu, L. Applying Geodetector to Disentangle the Contributions of Natural and Anthropogenic Factors to NDVI Variations in the Middle Reaches of the Heihe River Basin. Ecol. Indic. 2020, 117, 106545. [Google Scholar] [CrossRef]
  31. Meng, X.; Gao, X.; Li, S.; Lei, J. Spatial and Temporal Characteristics of Vegetation NDVI Changes and the Driving Forces in Mongolia during 1982–2015. Remote Sens. 2020, 12, 603. [Google Scholar] [CrossRef]
  32. Zhang, K.; Qu, J.; Niu, Q.; Jing, Z.; An, Z. Characteristics of Wind-Blown Sand in the Region of the Crescent Moon Spring of Dunhuang, China. Environ. Earth Sci. 2013, 70, 3107–3113. [Google Scholar] [CrossRef]
  33. Zhang, Y.; Zhang, K.; An, Z.; Yu, Y. Quantification of Driving Factors on NDVI in Oasis-Desert Ecotone Using Geographical Detector Method. J. Mt. Sci. 2019, 16, 2615–2624. [Google Scholar] [CrossRef]
  34. Curreli, A.; Wallace, H.; Freeman, C.; Hollingham, M.; Stratford, C.; Johnson, H.; Jones, L. Eco-Hydrological Requirements of Dune Slack Vegetation and the Implications of Climate Change. Sci. Total. Environ. 2013, 443, 910–919. [Google Scholar] [CrossRef] [PubMed]
  35. Jiao, Y.; Lei, H.; Yang, D.; Huang, M.; Liu, D.; Yuan, X. Impact of Vegetation Dynamics on Hydrological Processes in a Semi-Arid Basin by Using a Land Surface-Hydrology Coupled Model. J. Hydrol. 2017, 551, 116–131. [Google Scholar] [CrossRef]
  36. Liu, Q.; Fu, Y.H.; Zeng, Z.; Huang, M.; Li, X.; Piao, S. Temperature, Precipitation, and Insolation Effects on Autumn Vegetation Phenology in Temperate China. Glob. Chang. Biol. 2016, 22, 644–655. [Google Scholar] [CrossRef]
  37. Piao, S.; Yin, G.; Tan, J.; Cheng, L.; Huang, M.; Li, Y.; Liu, R.; Mao, J.; Myneni, R.B.; Peng, S.; et al. Detection and Attribution of Vegetation Greening Trend in China over the Last 30 Years. Glob. Chang. Biol. 2015, 21, 1601–1609. [Google Scholar] [CrossRef]
  38. Zhu, Z.; Piao, S.; Myneni, R.B.; Huang, M.; Zeng, Z.; Canadell, J.G.; Ciais, P.; Sitch, S.; Friedlingstein, P.; Arneth, A.; et al. Greening of the Earth and Its Drivers. Nat. Clim. Chang. 2016, 6, 791–795. [Google Scholar] [CrossRef]
  39. Cui, L.; Wang, L.; Singh, R.P.; Lai, Z.; Jiang, L.; Yao, R. Association Analysis between Spatiotemporal Variation of Vegetation Greenness and Precipitation/Temperature in the Yangtze River Basin (China). Environ. Sci. Pollut. Res. 2018, 25, 21867–21878. [Google Scholar] [CrossRef]
Figure 1. The location of the study area.
Remotesensing 15 04670 g001
Figure 2. Spatial distribution of NDVI in Central Asia from 2001 to 2020. (a) The annual average NDVI, and (b) the growing season average NDVI.
Remotesensing 15 04670 g002
Figure 3. The temporal variation trend of the NDVI and the result of abrupt change point detection. (a,c) display the temporal variation of NDVI and the result of abrupt change point detection, respectively. The dashed black lines represent the trend fits for 2001 to 2020, while the dotted black lines represent the trend fits for different time periods. (b,d) The result of the mean value of the growing season.
Remotesensing 15 04670 g003
Figure 4. Spatial distribution of NDVI changes from 2001 to 2020. (a,b) The is changing trend of the annual NDVI mean, where (a) is 2001–2010 and (b) is 2011–2020. (c,d) The trend distribution of NDVI during the growing season. Based on different slope values, vegetation change types are divided into four categories: dramatically decrease ( s l o p e < 0.05 ), slightly decrease ( 0.05 < s l o p e < 0 ), slightly increase ( 0 < s l o p e < 0.05 ), and dramatically increase ( s l o p e > 0.05 ).
Remotesensing 15 04670 g004
Figure 5. The result of geodetector. (a) The result of the factor detector; (b) the result of the interaction detector.
Remotesensing 15 04670 g005
Figure 6. Land-use types in Central Asia. (a,b) The years 2001 and 2020, respectively.
Remotesensing 15 04670 g006
Figure 7. Spatial distribution of cumulative precipitation during the growing season.
Remotesensing 15 04670 g007
Figure 8. Comparative Analysis of Climate Variables and NDVI Temporal Changes over the Past Two Decades. Here, Tmn represents annual mean temperature data, Pre represents annual accumulated precipitation, and Srad represents annual mean solar radiation—all of which have been standardized.
Remotesensing 15 04670 g008
Figure 9. Variation of NDVI and cumulative precipitation in the last two decades. The changes in the past two decades can be divided into four categories: The values of the two periods, 2001–2010 and 2011–2020, both show a downward trend, which is defined as a “continuing decrease”; otherwise, it is defined as “continuing increase”. If there was an increase in the trend from 2001 to 2010 followed by a decrease from 2011 to 2020, it is defined as “decrease to increase”; otherwise, it is defined as “increase to decrease”. (a,b) The growing season NDVI and growing season cumulative precipitation, respectively.
Remotesensing 15 04670 g009
Table 1. The source of data on vegetation and potential driving factors in Central Asia.
RespectsVariablesAbbreviationDatasetsTime PeriodResolution
VegetationNDVINDVIMODIS13Q12001–2020250 m
ClimateWind speedWsTerraClimate2001–20201/24°
Vapor pressure deficitVpd
PrecipitationPre
Soil water contentSwc
Maximum temperatureTmax
Minimum temperatureTmin
Average temperatureTavgCRU0.5°
Surface shortwave radiationSradMERRA-20.5°
GeographicSoil typeStHWSD20121 km
Land-use typeLutMCD12Q12001, 2020500 m
AnthropogenicLand-use conversion type LuctMCD12Q1/500 m
PopulationPopLandScan2001–20201 km
Table 2. Types of two factors interaction result.
Value ComparisonsTypes of Interaction
q V a r 1 V a r 2 < M i n ( q   V a r 1 , q   ( V a r 2 ) ) Non-linear weakened
M i n ( q   V a r 1 , q   ( V a r 2 ) ) < q V a r 1 V a r 2 < M a x ( q   V a r 1 , q   ( V a r 2 ) ) Weakened
q V a r 1 V a r 2 > M a x ( q   V a r 1 , q   ( V a r 2 ) ) Enhanced
q V a r 1 V a r 2 = q   V a r 1 + q   ( V a r 2 ) Independent
q V a r 1 V a r 2 > q   V a r 1 + q   ( V a r 2 ) Non-linear enhanced
Table 3. Pearson correlation analysis results of NDVI and driving variables.
2001–20202001–20102011–2020
Variable R 2 Variable R 2 Variable R 2
Pre0.78 **Pre0.89 **Vpd−0.82 **
Swc0.72 **Vpd−0.86 **Srad−0.81 **
Vpd−0.67 **Swc0.79 **Swc0.74 *
Srad−0.62 **Tmax−0.74 *Pre0.73 *
Tmax−0.38Tmin−0.62Tmin0.39
Tavg−0.32Tavg−0.62Tavg−0.25
Ws−0.32Ws−0.56Ws−0.18
Tmin−0.11Srad−0.37Tmax0.1
** denote p < 0.01 ; * denote p < 0.05 .
Disclaimer/Publisher’s Note: The statements, opinions and data contained in all publications are solely those of the individual author(s) and contributor(s) and not of MDPI and/or the editor(s). MDPI and/or the editor(s) disclaim responsibility for any injury to people or property resulting from any ideas, methods, instructions or products referred to in the content.

