Article

Global Mean Sea Level Variation on Interannual–Decadal Timescales: Climatic Connections

1
Department of Physics, National Taiwan University, Taipei 10617, Taiwan
2
Institute of Earth Sciences, Academia Sinica, Taipei 115024, Taiwan
*
Author to whom correspondence should be addressed.
Remote Sens. 2022, 14(9), 2159; https://doi.org/10.3390/rs14092159
Submission received: 19 February 2022 / Revised: 16 April 2022 / Accepted: 18 April 2022 / Published: 30 April 2022
(This article belongs to the Special Issue Geodetic Observations for Earth System)

Abstract

:
The global mean sea level (GMSL) has been measured precisely by the space geodetic remote-sensing technique of radar altimetry since the 1990s. Aside from the well-studied seasonality and secular sea level rise, here we focus on GMSL variation on the interannual–decadal (ID) timescales (GMSL-ID) and investigate the influences of the climatic oscillations as physical causes. We conduct correlation analyses on the GMSL-ID time series with several climatic oscillations represented by their respective meteorological indices, including El Niño-Southern Oscillation (ENSO), Pacific Decadal Oscillation (PDO), Atlantic Multidecadal Oscillation (AMO), Arctic Oscillation (AO), and Antarctic Oscillation (AAO). From the time-domain cross-correlation functions and the corresponding frequency-domain cross-coherence spectra, we find the following: (i) high correlation between GMSL-ID and ENSO, primarily befalling on the Central-Pacific (as opposed to the Eastern-Pacific) type of ENSO, on timescales longer than 1.5 years; (ii) moderate correlations of GMSL-ID with PDO on long-period timescales of over 4 years, and with AMO on a timescale of 2–10 years, with AMO leading in phase by 8 months; (iii) weak or practically no correlation of GMSL-ID with either AO or AAO, in the former case given the fact that our GMSL-ID data actually do not cover the Arctic sea. Finally, we least-squares fit the above five indices to GMSL-ID to assess the relative contribution of each oscillation in causing the observed GMSL-ID, for a better understanding of the GMSL under the influences of on-going climate change.

1. Introduction

The sea level varies with time anywhere in the ocean on all timescales for a myriad of reasons. Conventional tide gauges record long-term sea level, but only relative to the local ground at sparse coastal sites. Modern space geodetic techniques of radar altimetry measure absolute sea level uniformly over open oceans on global scales in the terrestrial reference frame. One important product has been the averaged global mean sea level (GMSL) as a single, continuous anomaly time series referenced to the time-mean value.
In terms of time dependence, the most prominent variations in the GMSL are secular sea-level rise and seasonal fluctuations [1]. A subject of active research, secular rise is a consequence of global warming in the form of thermal expansion of the surface water and additional water inflow from land; the latter includes melting glaciers and ice-sheets, along with anthropogenic effects of artificial dam water impoundment and groundwater discharge [2,3]. Seasonal signals follow the climatology of water exchanges of the ocean with land and atmosphere plus ocean steric variations [4,5,6].
In this paper, we turn our attention to the non-secular and non-seasonal variability of GMSL on the interannual-to-decadal timescale, henceforth referred to as GMSL-ID. Studying the GMSL-ID, which reflects processes of global water cycles associated with climate variabilities [7], is a scientific pursuit toward better monitoring and understanding of on-going climatic change. Evidence of such connections has been reported on a specific basis mainly with respect to extreme events. For example, Chambers et al. [8] detected the signature of El Ninos in GMSL along with certain 10~12-year variabilities. Willis et al. [9] examined the anomalous GMSL budget during 2004–2005. Boening et al. [10] found an unequivocal link between GMSL and the strong 2011 La Nina event of the El Nino/Southern Oscillation (ENSO), which retained a great amount of water on land, lowering the GMSL by as much as 5 mm. Cazenave et al. [11] and Haddad et al. [12] assessed the influence of ENSO and identified signatures of several El Nino/La Nina episodes in GMSL. Jin et al. [13] and Zhang and Church [14] reported possible connections of Pacific sea level variations with ENSO and Pacific Decadal Oscillation (PDO); Hamlington et al. [15,16] found a significant contribution of PDO to GMSL; Kuo et al. [17] contrasted the influence of two different episodes of El Nino on GMSL. Conversely, Wahl and Chambers [18] and Rohmer and Le Cozannet [19] made statistical studies on GMSL’s connection and impacts on extreme climatic events. Moreira et al. [20] observed the relation between GMSL and climatic oscillations with multiple linear regression and Empirical Orthogonal Function (EOF).
Here, we aim to “explain” GMSL-ID in a more comprehensive manner via inclusion of known major climatic oscillations and assessing their individual contributions. We do so following the approach of Chao et al. [21] in understanding the variations in Earth’s oblateness J2, based on the natural assumption that, as a global phenomenon, GMSL is the linear superposition of various physical causes. In this way, we separate out and analyze the signals due to climatic oscillations. The primary tool for this analysis is correlation functions in both time and frequency domains.

2. Data: Preparation and Methodology

Figure 1a presents the satellite-altimetric GMSL data series that we shall use, courtesy of U. Colorado. It is the average sea level height at a sampling interval of 10 days (TOPEX/Jason’s orbit repeat cycle), covering between 66°S and 66°N (on account of Topex/Jason’s orbit inclination) for about 95% of the world’s ice-free ocean area. The dataset is chosen for its long timespan (1992.9–2020.75) over other multi-mission datasets that may be desirable in the course of time.
We first model the GMSL time series numerically as a linear superposition of various terms:
GMSL(t) = a + bt + c sinωt + d cosωt + e sin2ωt + f cos2ωt + GMSL-ID(t)
where angular frequency ω = 2π/(365.25 days). The term a + bt represents the secular sea-level rise in the form of the mean + linear trend, while the four sinusoidal terms account for the seasonality at annual and semiannual periods. The coefficients a, b, …, f are solved by linear least-squares regression on the GMSL(t) data (Figure 1a, black curve) by minimizing the variance of the residual GMSL-ID(t). The fit estimates are as follows: the linear rate of sea-level rise is b = 3.28 mm/year, the annual amplitude peaks around October 26 at 5.3 mm, and semiannual amplitude peaks around January 2 at 1.6 mm. Their sum, shown as the overlay in Figure 1a (blue curve), unsurprisingly accounts for the bulk of the GMSL variability.
Figure 1b then gives the broadband residual GMSL-ID(t), which is our target, upon de-trend/de-season of GMSL, i.e., removing the secular trend and the seasonality. Figure 1c gives the time–frequency (real-valued) Morlet wavelet spectrum of GMSL-ID(t) [21], where two quasi-periodic signals stand out: one around 4 years growing in strength after ~2005, and one around 10.5 years, which only sees ~2.5 cycles as limited by the data timespan. Figure 1d gives the Fourier power spectrum of GMSL-ID(t), where the red nature of the power is evident.
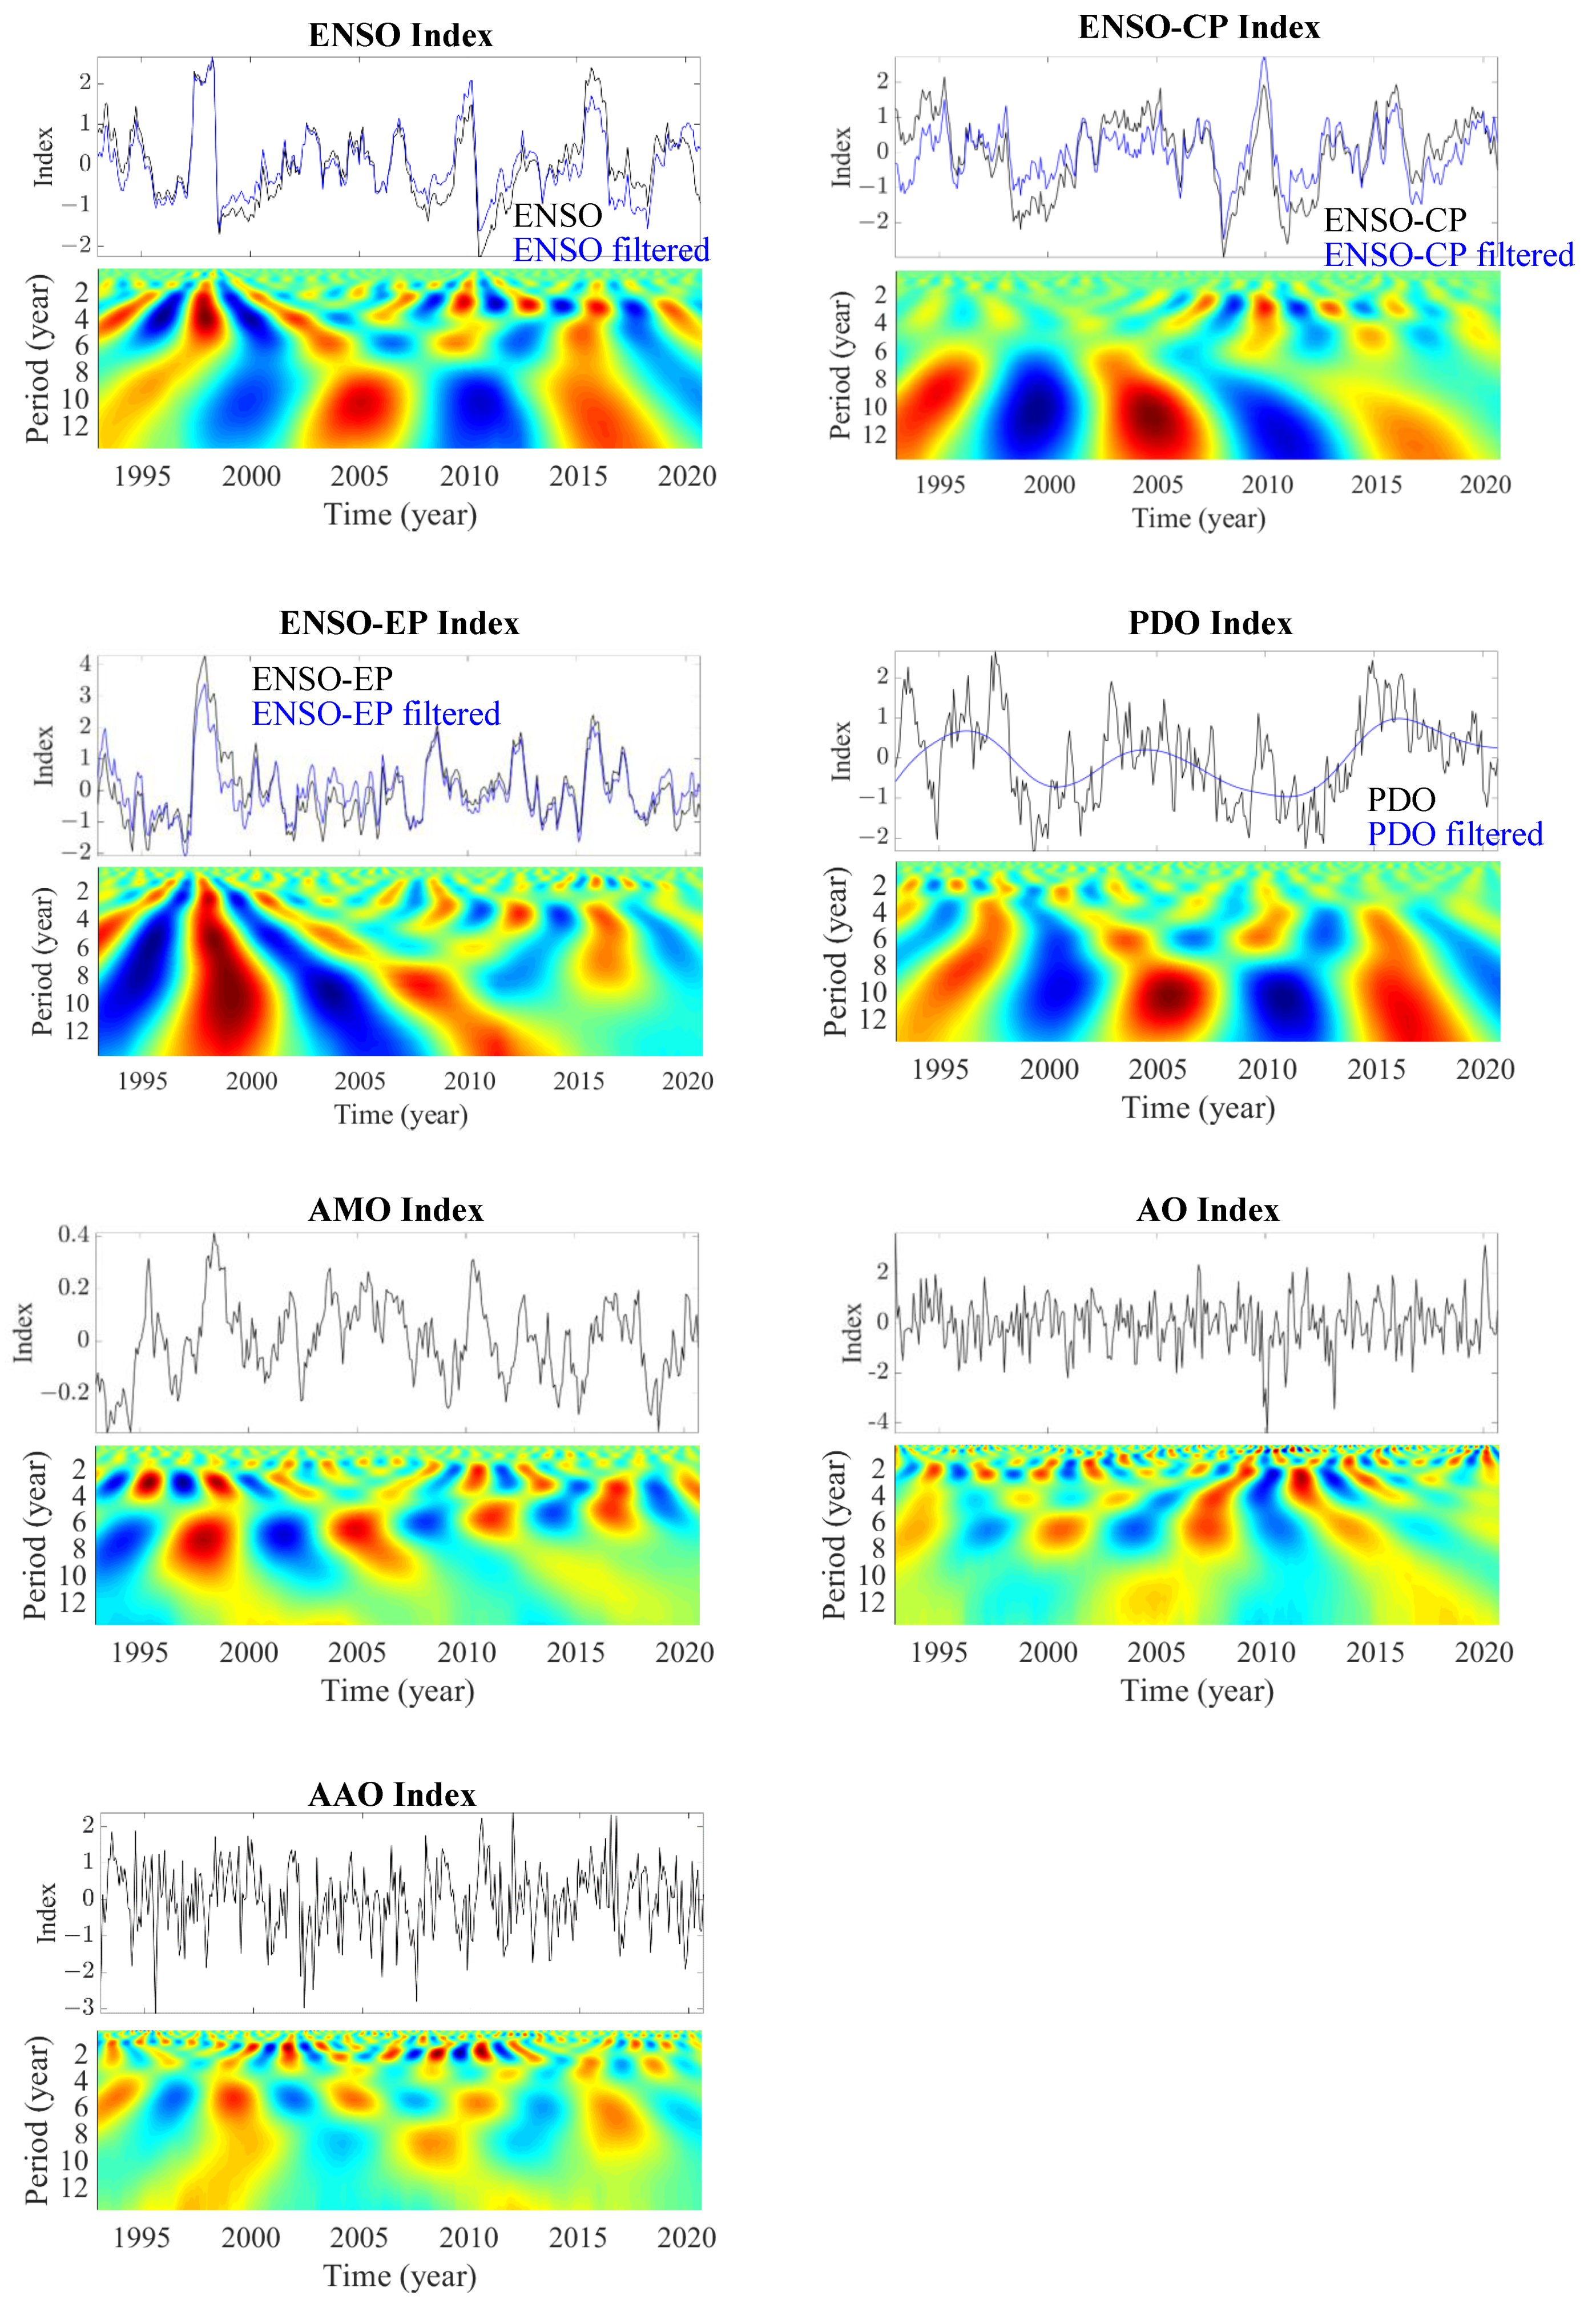
The major climatic oscillations that we shall examine with respect to GMSL-ID are the following: ENSO, PDO, Atlantic Multi-decadal Oscillation (AMO), Antarctic Oscillation (AAO), and Arctic Oscillation (AO). As is typical, the strength of a given climatic oscillation is represented by its (dimensionless) index on a continuous time basis, where the complexities associated with the oscillation have been optimally blended into one single time series. The mentioned index time series at monthly intervals are plotted in Figure 2, along with their respective wavelet spectra on the interannual–decadal timescale.
ENSO is the most prominent climate oscillation pattern involving changes in the water temperature and air pressure in the tropical Pacific Ocean; the MEI (Multivariate ENSO Index) used here is the first unrotated principal component of six main observed climatic variables over the tropical Pacific.
Here, we further distinguish (see below) two types of ENSO that differ in their regional extents as well as timing with respect to seasonality: the ENSO-EP (Eastern Pacific) type and the ENSO-CP (Central Pacific) type. Their indices are defined by the principal component of the sea surface temperature in the Pacific: ENSO-EP excluding the Nino-1 region and ENSO-CP excluding the Nino-4 region [22]. ENSO-CP became more prominent against ENSO-EP from the 21st century, for example, the El Nino-CP event in 2012. Also, the differences are evident between ENSO-CP and ENSO-EP in the wavelet spectrum on ~4-year periodicity before and after year 2000, to be discussed more later.
The PDO Index is defined as the leading principal component of the monthly mean sea-surface temperature variability over the North Pacific sector in the region poleward of 20°N.
The AMO is a coherent mode of natural variability based upon the average anomalies of sea surface temperatures, with AMO Index to reflect the non-secular multi-decadal sea-surface temperature pattern variability in the North Atlantic basin.
The AAO (also known as the Southern Annular Mode) describes the intensity of the westerly wind jet surrounding the Antarctic, quantified by the AAO Index, which is the leading principal component of the 700 hPa atmospheric geopotential height anomalies poleward of 20°S.
As a counterpart to AAO, the AO (also known as the Northern Annular Mode) is closely related to and encompasses the conventional North Atlantic Oscillation (NAO) [23]. It is to be interpreted as the surface signature of modulations in the strength of the polar vertex aloft the Arctic [24], while the AO Index is constructed by projecting the 1000 hPa height anomalies poleward of 20°N.
Despite the difference in their primary timescales, PDO and ENSO carry considerable correlation between their conventional indices because of the geographical juxtaposition in the Pacific Basin. Newman et al. (2016) suggested that PDO is a combinational process and a kind of ‘red noise’ of ENSO [25]. For example, they show corresponding decadal behaviors, as evident in their wavelet spectra in Figure 2. Lacking mathematical orthogonality, identifying the individual contributions to GMSL is troublesome [26]. Therefore, in the processing to be conducted below, we take the filtered version of the indices to accentuate the signal frequency contents as follows: the Indices of ENSO, ENSO-CP, and ENSO-EP are high-pass filtered at the period of 8 years (see Figure 2a–c, the blue curves), whereas the PDO Index are low-pass filtered at 8 years (Figure 2d).
The GMSL–climate connection is to be investigated via correlation analyses. In the time domain, we calculate the linear cross-correlation function as a function of relative time shift between the two data series. The obtained correlation values are assessed against the statistical degrees of freedom [27]. Correspondingly, one can further delineate how the found correlations break down in terms of timescale according to the (complex) cross-coherence spectra in the frequency domain. In evaluating the coherence, we adopt the algorithm of Chao and Eanes [28], where seven orthogonal multi-tapers [29] with a time-bandwidth product of 4π are employed for spectral averaging; again, the confidence level is assessed against the associated degree of freedom [27].

3. Results: GMSL–Climate Correlations

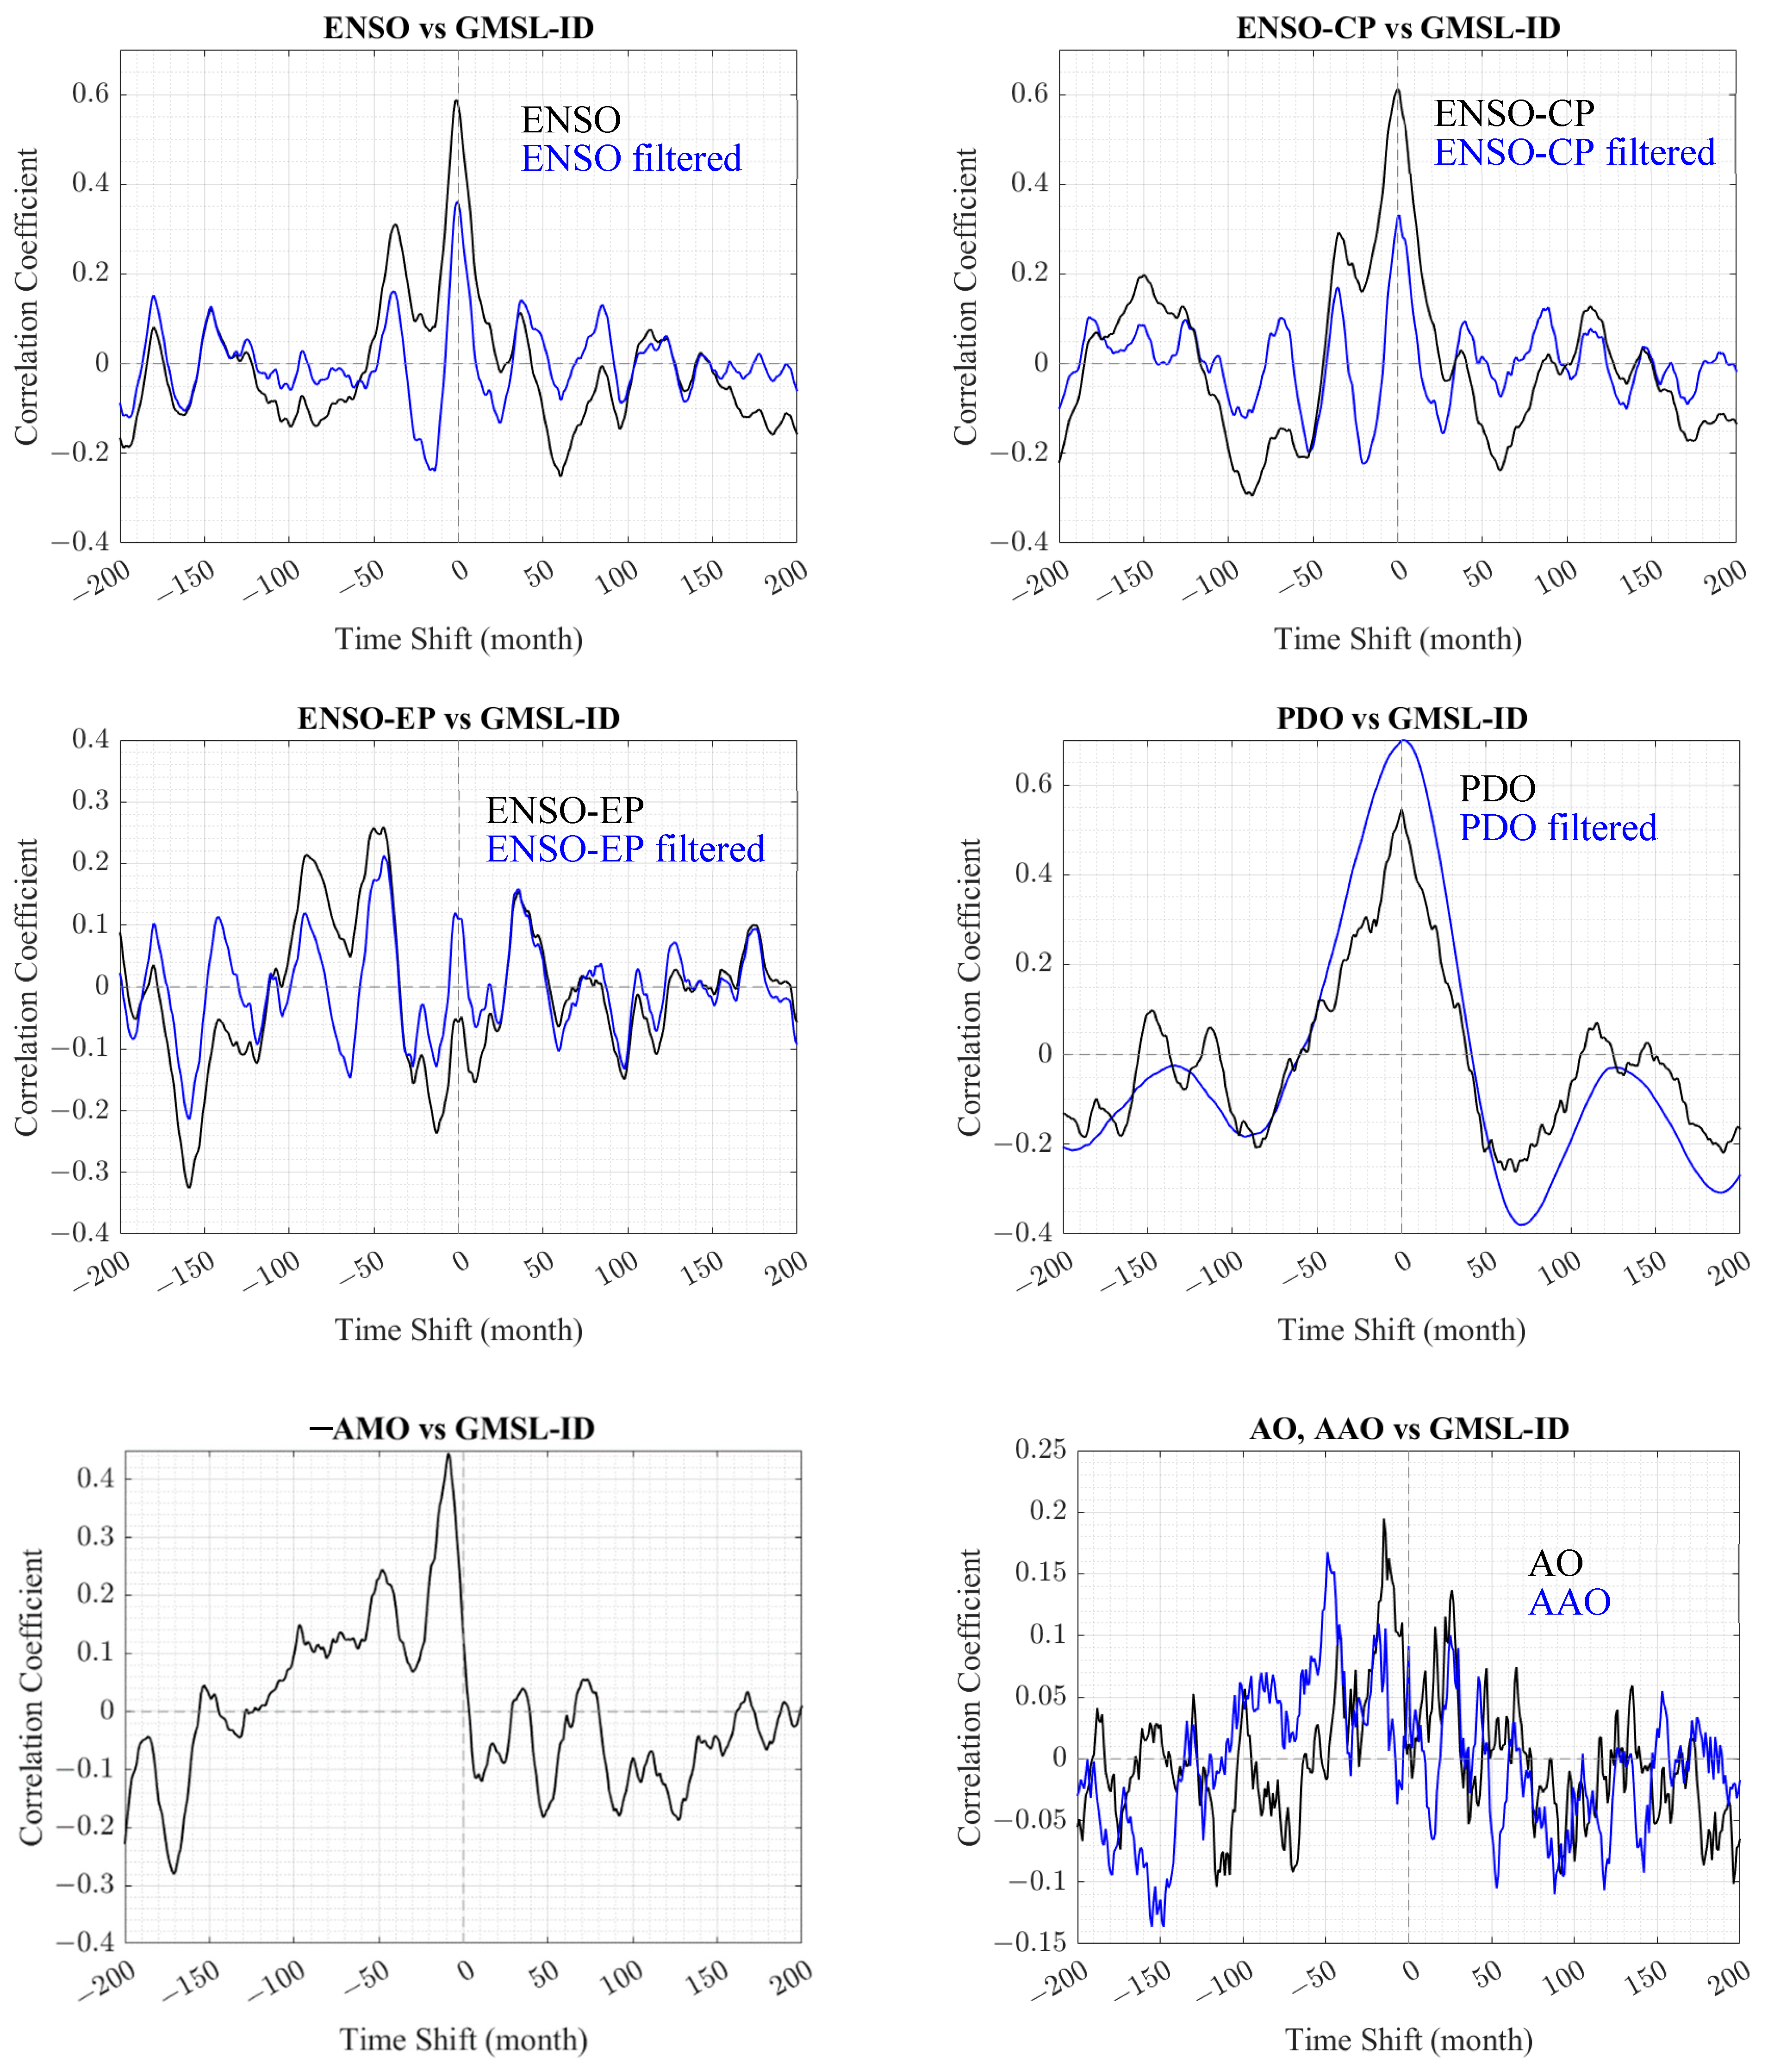
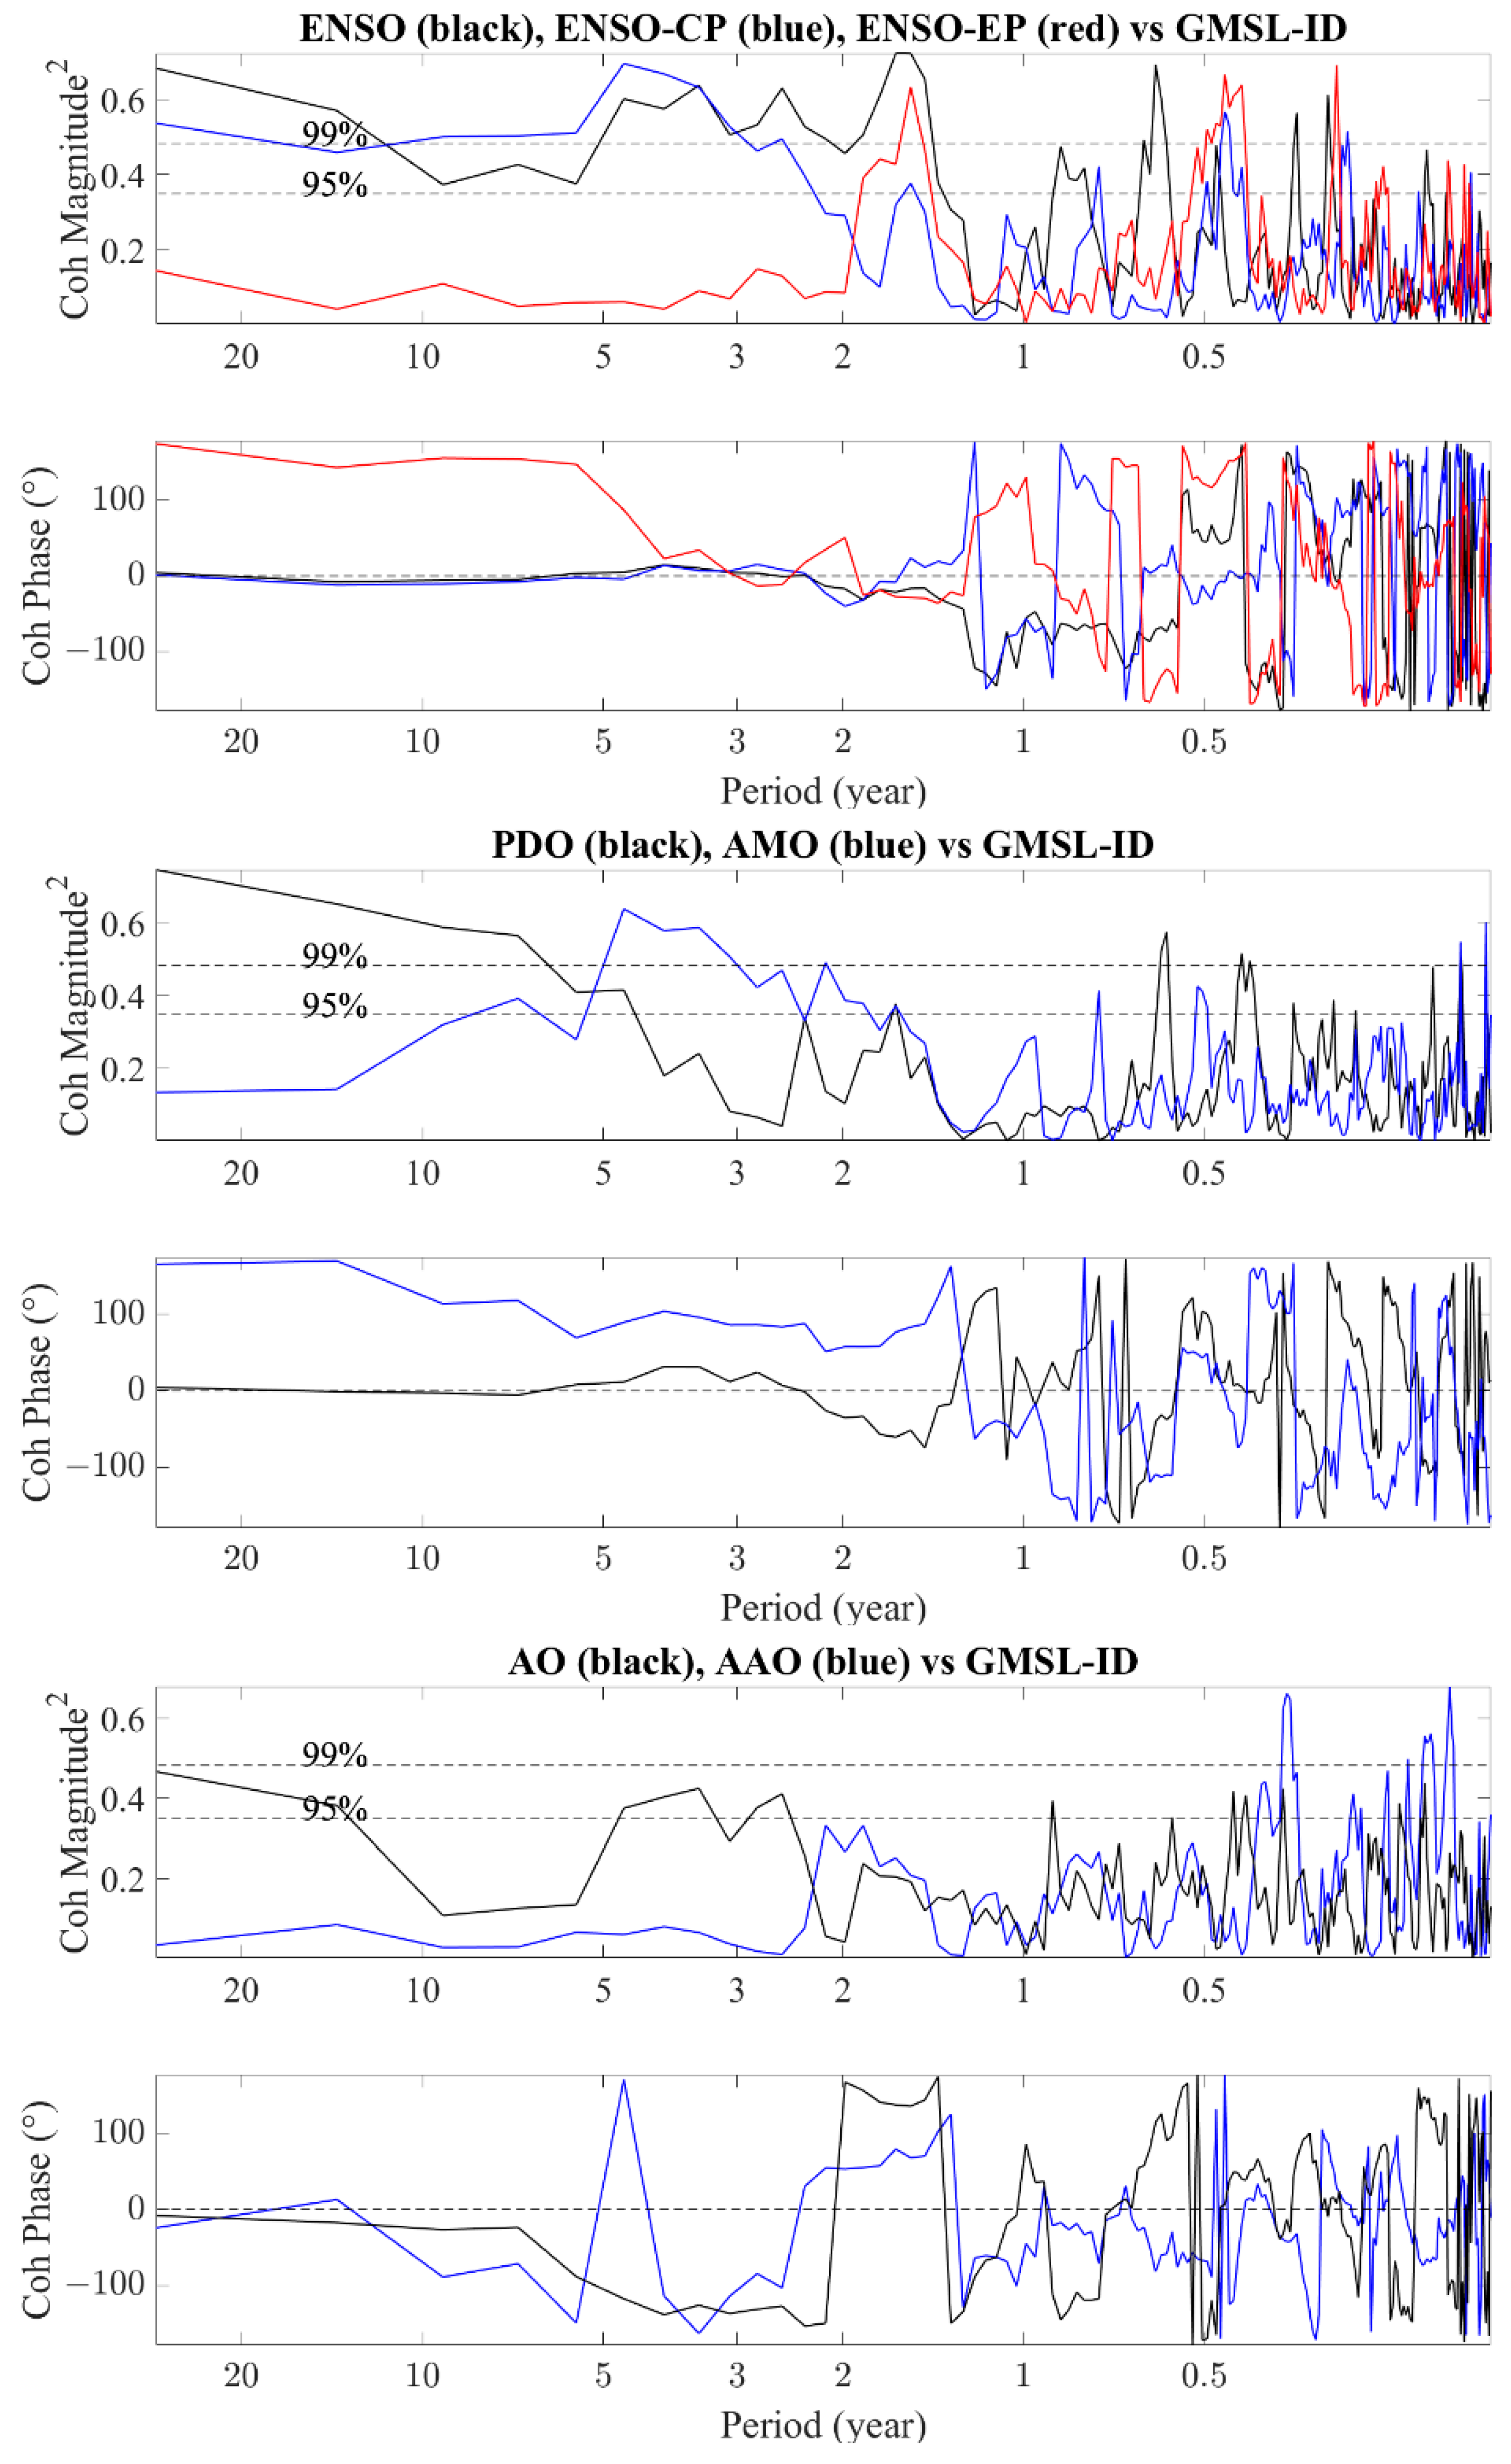
We conduct the correlation analyses of GMSL-ID(t) with respect to the indices of the aforementioned climatic oscillations in Figure 2. Figure 3 shows the time-domain cross-correlation functions, as functions of relative time shift (in months), where positive time shift means the oscillation leading GMSL-ID(t) in phase. Figure 4 shows the corresponding frequency-domain cross-coherence spectra. We shall discuss these results in Section 4.
We next conduct a time-domain least-squares fit to GMSL-ID(t) of the five climatic oscillations (filtered version of ENSO and PDO) in a linear combination of the indices of the form:
GMSL-ID(t) = kENSO × ENSO(t) + kAMO × AMO(t) + kPDO × PDO(t) + kAAO × AAO(t) + kAO × AO(t) + Residual(t)
Here, we choose to take ENSO MEI to represent the overall ENSO, instead of the CP-type and EP-type separately, because of the considerable (negative) correlation (−0.47) found between them, which makes them unconducive for fitting. AMO and AO indices are time shifted by 8 and 14 months, respectively, in light of the cross-correlation and cross-coherence found in Figure 3 and Figure 4. The least-squares (by minimizing the variance of Residual) estimated coefficients k values give the individual contributions to GMSL-ID per unit of the respective index value. The fit results are as follows: kENSO = 1.04, kAMO = −5.59, kPDO = 4.22, kAAO = 0.367, kAO = 0.451. Upon this fit, the standard deviation 4.1 mm (of GMSL-ID) is reduced to 2.3 mm (of Residual), which at face value implies that the oscillations can collectively account for [1 − (2.3/4.1)2] = 69% of the signal energy on the broad intra-seasonal-to-decadal timescales.
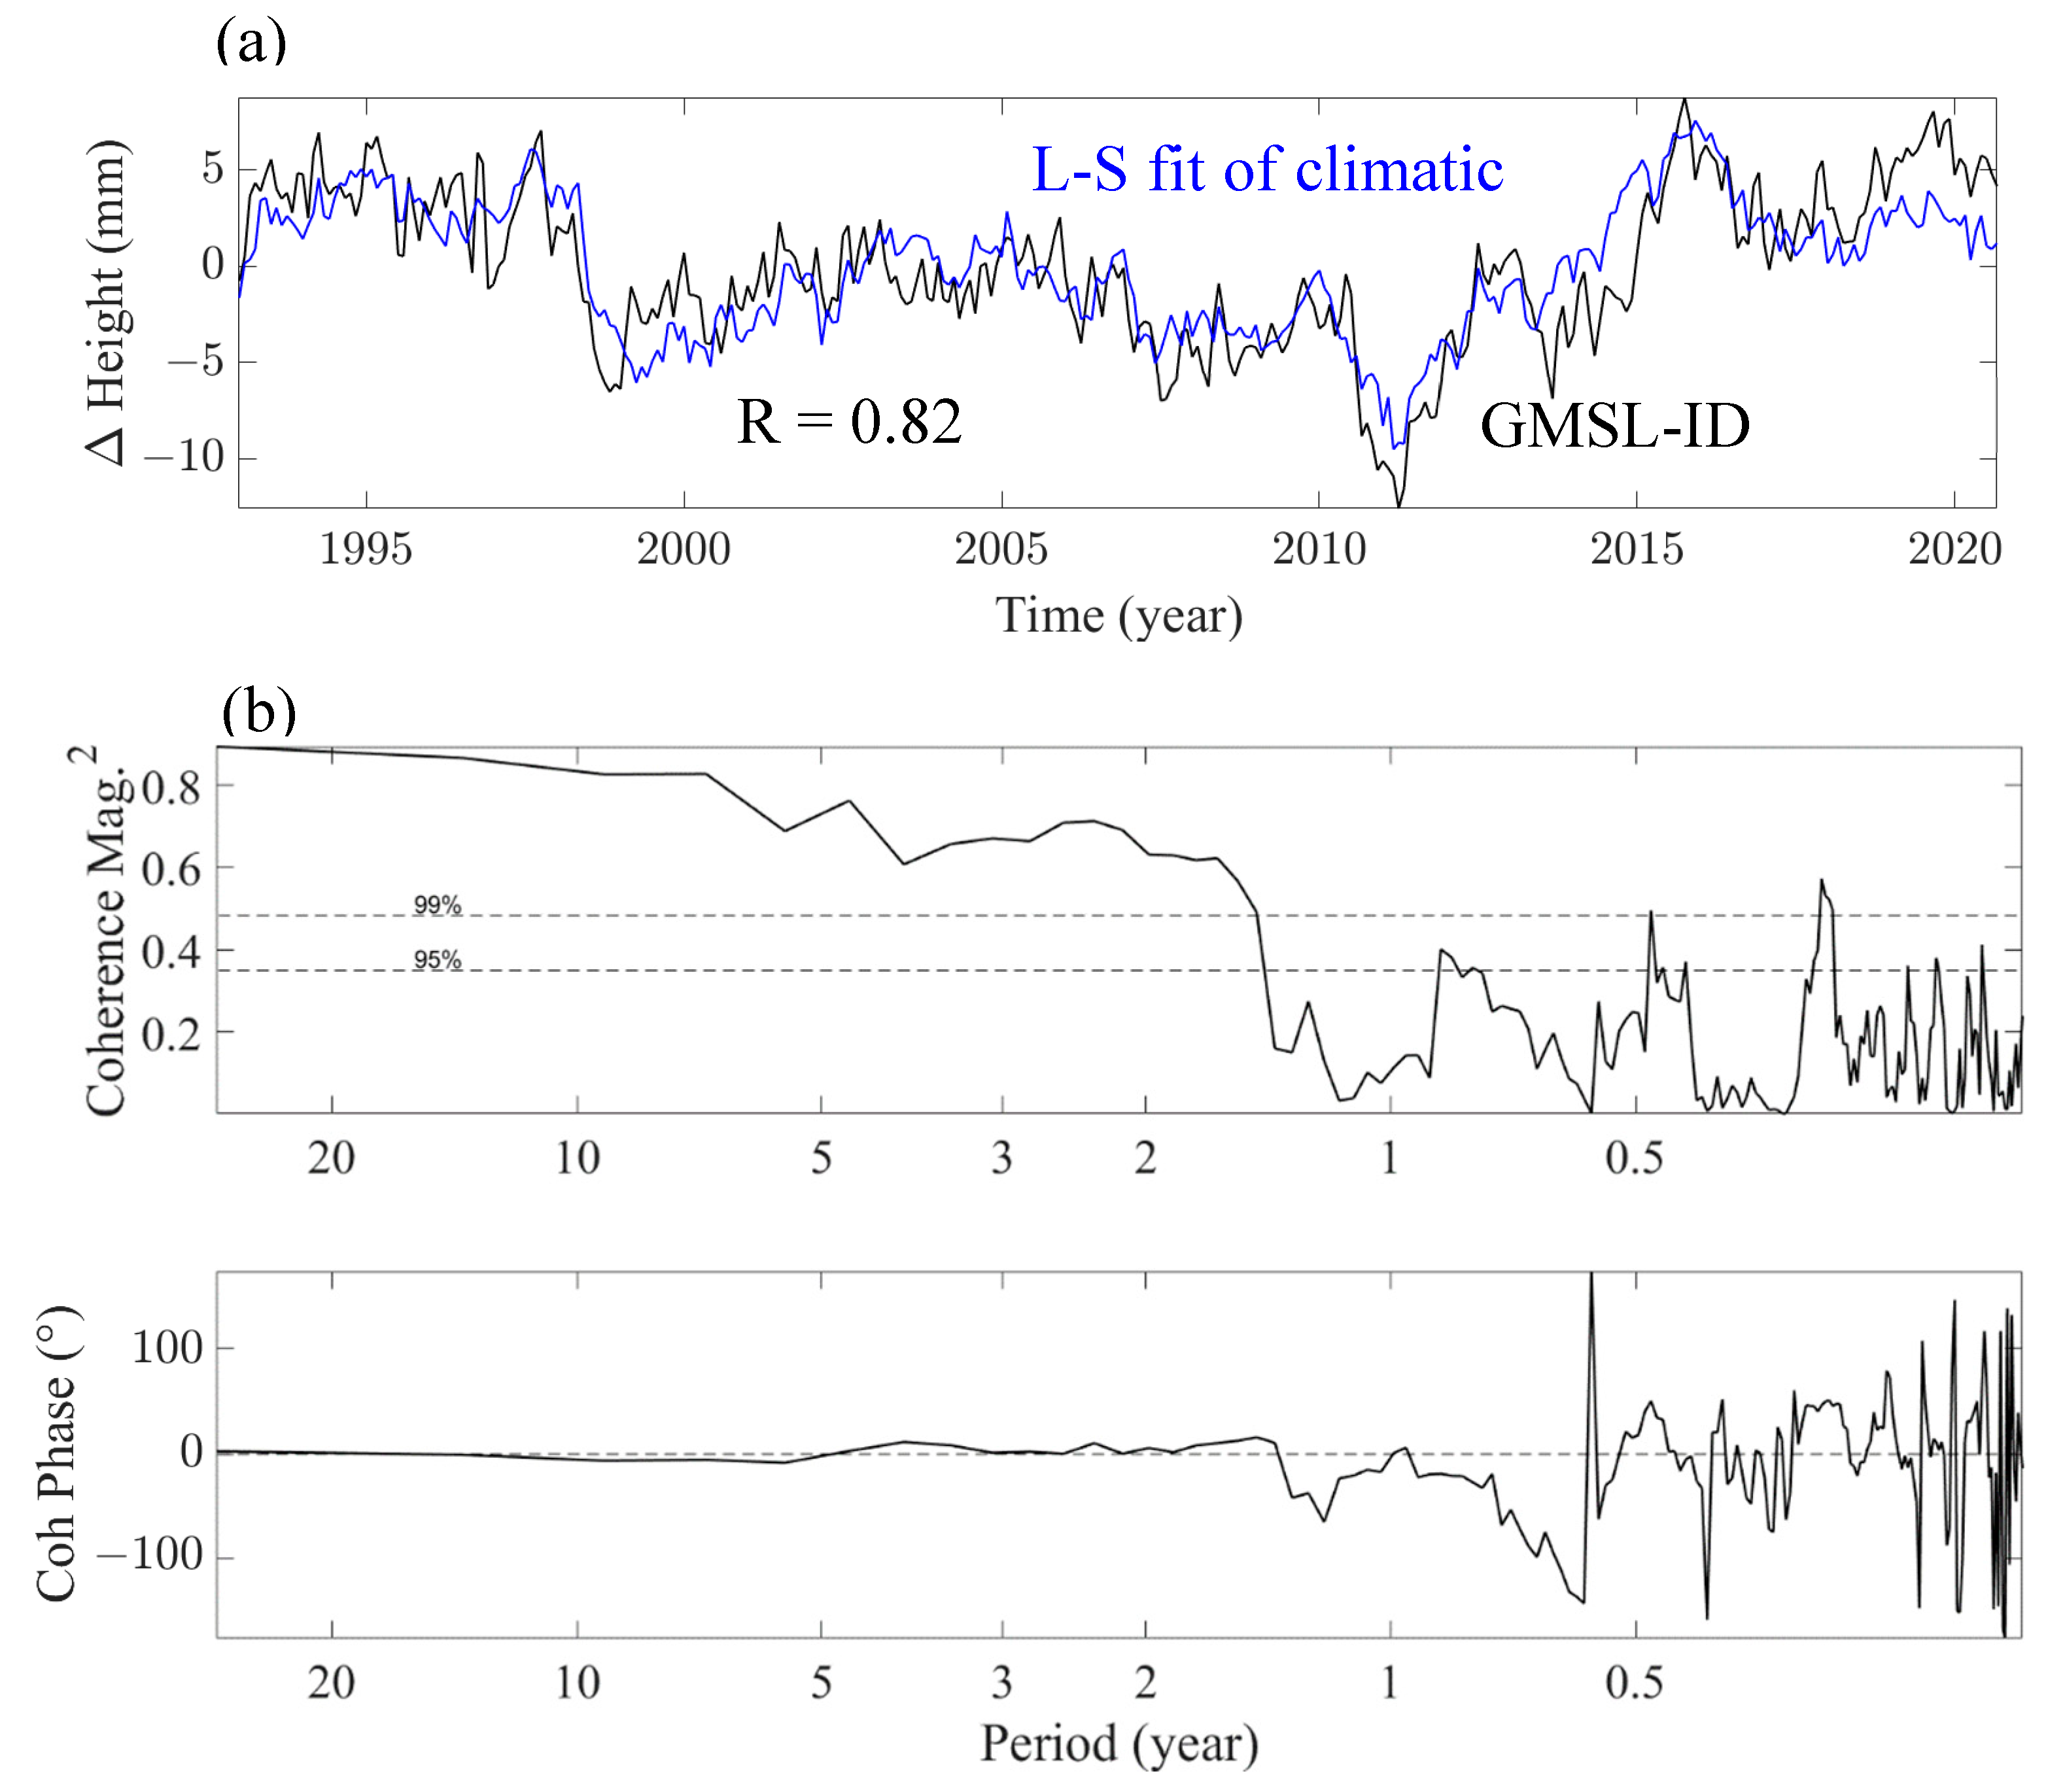
It is realized that the various indices are dimensionless parameters to indicate the undulation strength of the different oscillations, but their definitions differ and are hence of different magnitudes. To assess the relative importance of each oscillation in contributing to GMSL-ID, we normalize them by their respective standard deviations; thus, the fit coefficients become kENSO = 0.862, kAMO = −0.892, kPDO = 2.55, kAAO = 0.353, and kAO = 0.447. The broadband correlation coefficient between GMSL-ID and its five-oscillation fit is found to be as high as 0.82. We shall come back to this in Section 4.

4. Discussion and Conclusions

The GMSL varies on all timescales for various geophysical reasons. Using satellite radar altimetry data since 1992, we investigate the influences of the climatic oscillations on GMSL on interannual–decadal timescales (GMSL-ID), via correlation analyses of GMSL-ID with the major climatic oscillations in the atmosphere–ocean system: ENSO (CP-type and EP-type), PDO, AMO, AO, and AAO. GMSL-ID is obtained upon removing from GMSL the least-squares estimates of the dominant seasonal and secular trend signals.
The correlation results are given in Figure 3 and Figure 4. Significant correlations are found for GMSL with ENSO, PDO (low-pass filtered at 8 years), and AMO (with 8-month lag) on respective timescales. In particular, the high GMSL–ENSO correlation coefficient (at essentially zero time shift) is seen primarily in the CP type, but minimally in the EP type, as consistent with the finding of Kuo et al. [16] and indicating the ENSO-CP’s influence on the ocean mixed-layer temperature as well as land–ocean distribution of precipitation mentioned in Section 1.
The 8-month lag of AMO might be related to the PDO–AMO relationship, in light of the 1-year lag of AMO relative to PDO reported by Wu et al. [30,31].
The lack of GMSL–AAO correlation implies that Antarctica continent’s land ice mass melting does not follow AAO in a linear fashion. On the other hand, the lack of significant GMSL–AO correlation (or at most, a weak correlation of AO at a 14-month lag to GMSL-ID) warrants further mention: excluding the Arctic Ocean (above the 66°N latitude), our GMSL data (including the seasonality and trend) would actually reflect any water exchanges of Arctic Sea with the rest of the oceans. Prandi et al. [31,32] estimated the sea level variations of the Arctic Sea (from multi-satellite altimetry), and found no correlation with climatic indices; our present result is consistent with theirs.
In this regard, our results are also consistent with a finding from Chao et al. [21]: it is the atmospheric, not the oceanic, mass transports that are responsible for the intra-seasonal-to-interannual (non-seasonal) ΔJ2 associated with AAO and AO variability.
The 99.9% confidence level for the correlation coefficient corresponding to degree of freedom of ~300 (for broad-band data series) is 0.188 [27]. This is well below those for the oscillations we model for in Equation (2) (see Figure 3), confirming that ENSO, ENSO-CP, PDO, and AMO are significantly correlated to GMSL-ID.
Even though ENSO presents a strong correlation with GMSL-ID, the apparent correlation is largely reduced when ENSO Index is high-pass filtered (see Figure 3), which signifies that the long-period correlation actually resides elsewhere, namely in PDO. More specifically, this is also true for ENSO-CP, whereas ENSO-EP’s correlation with GMSL-ID remains insignificant. The latter appears to be largely due to the presence of the ~4-year signal in ENSO-CP and GMSL-ID, and the absence thereof for ENSO-EP.
Figure 5 presents the comparison, and evidently good matching, of GMSL-ID(t) with the least-squares combination (2) of the five oscillations, in terms of time series (Figure 5a) and frequency-domain coherence spectrum (Figure 5b). The time-domain broadband correlation is as high as 0.82, with an extremely high confidence level as noted above [27], whereas the corresponding frequency-domain coherence broadly resides well over the 99% confidence level on interannual timescales longer than ~1.5 years, with zero coherence phase (after the time shifts performed in AMO and AO mentioned above).
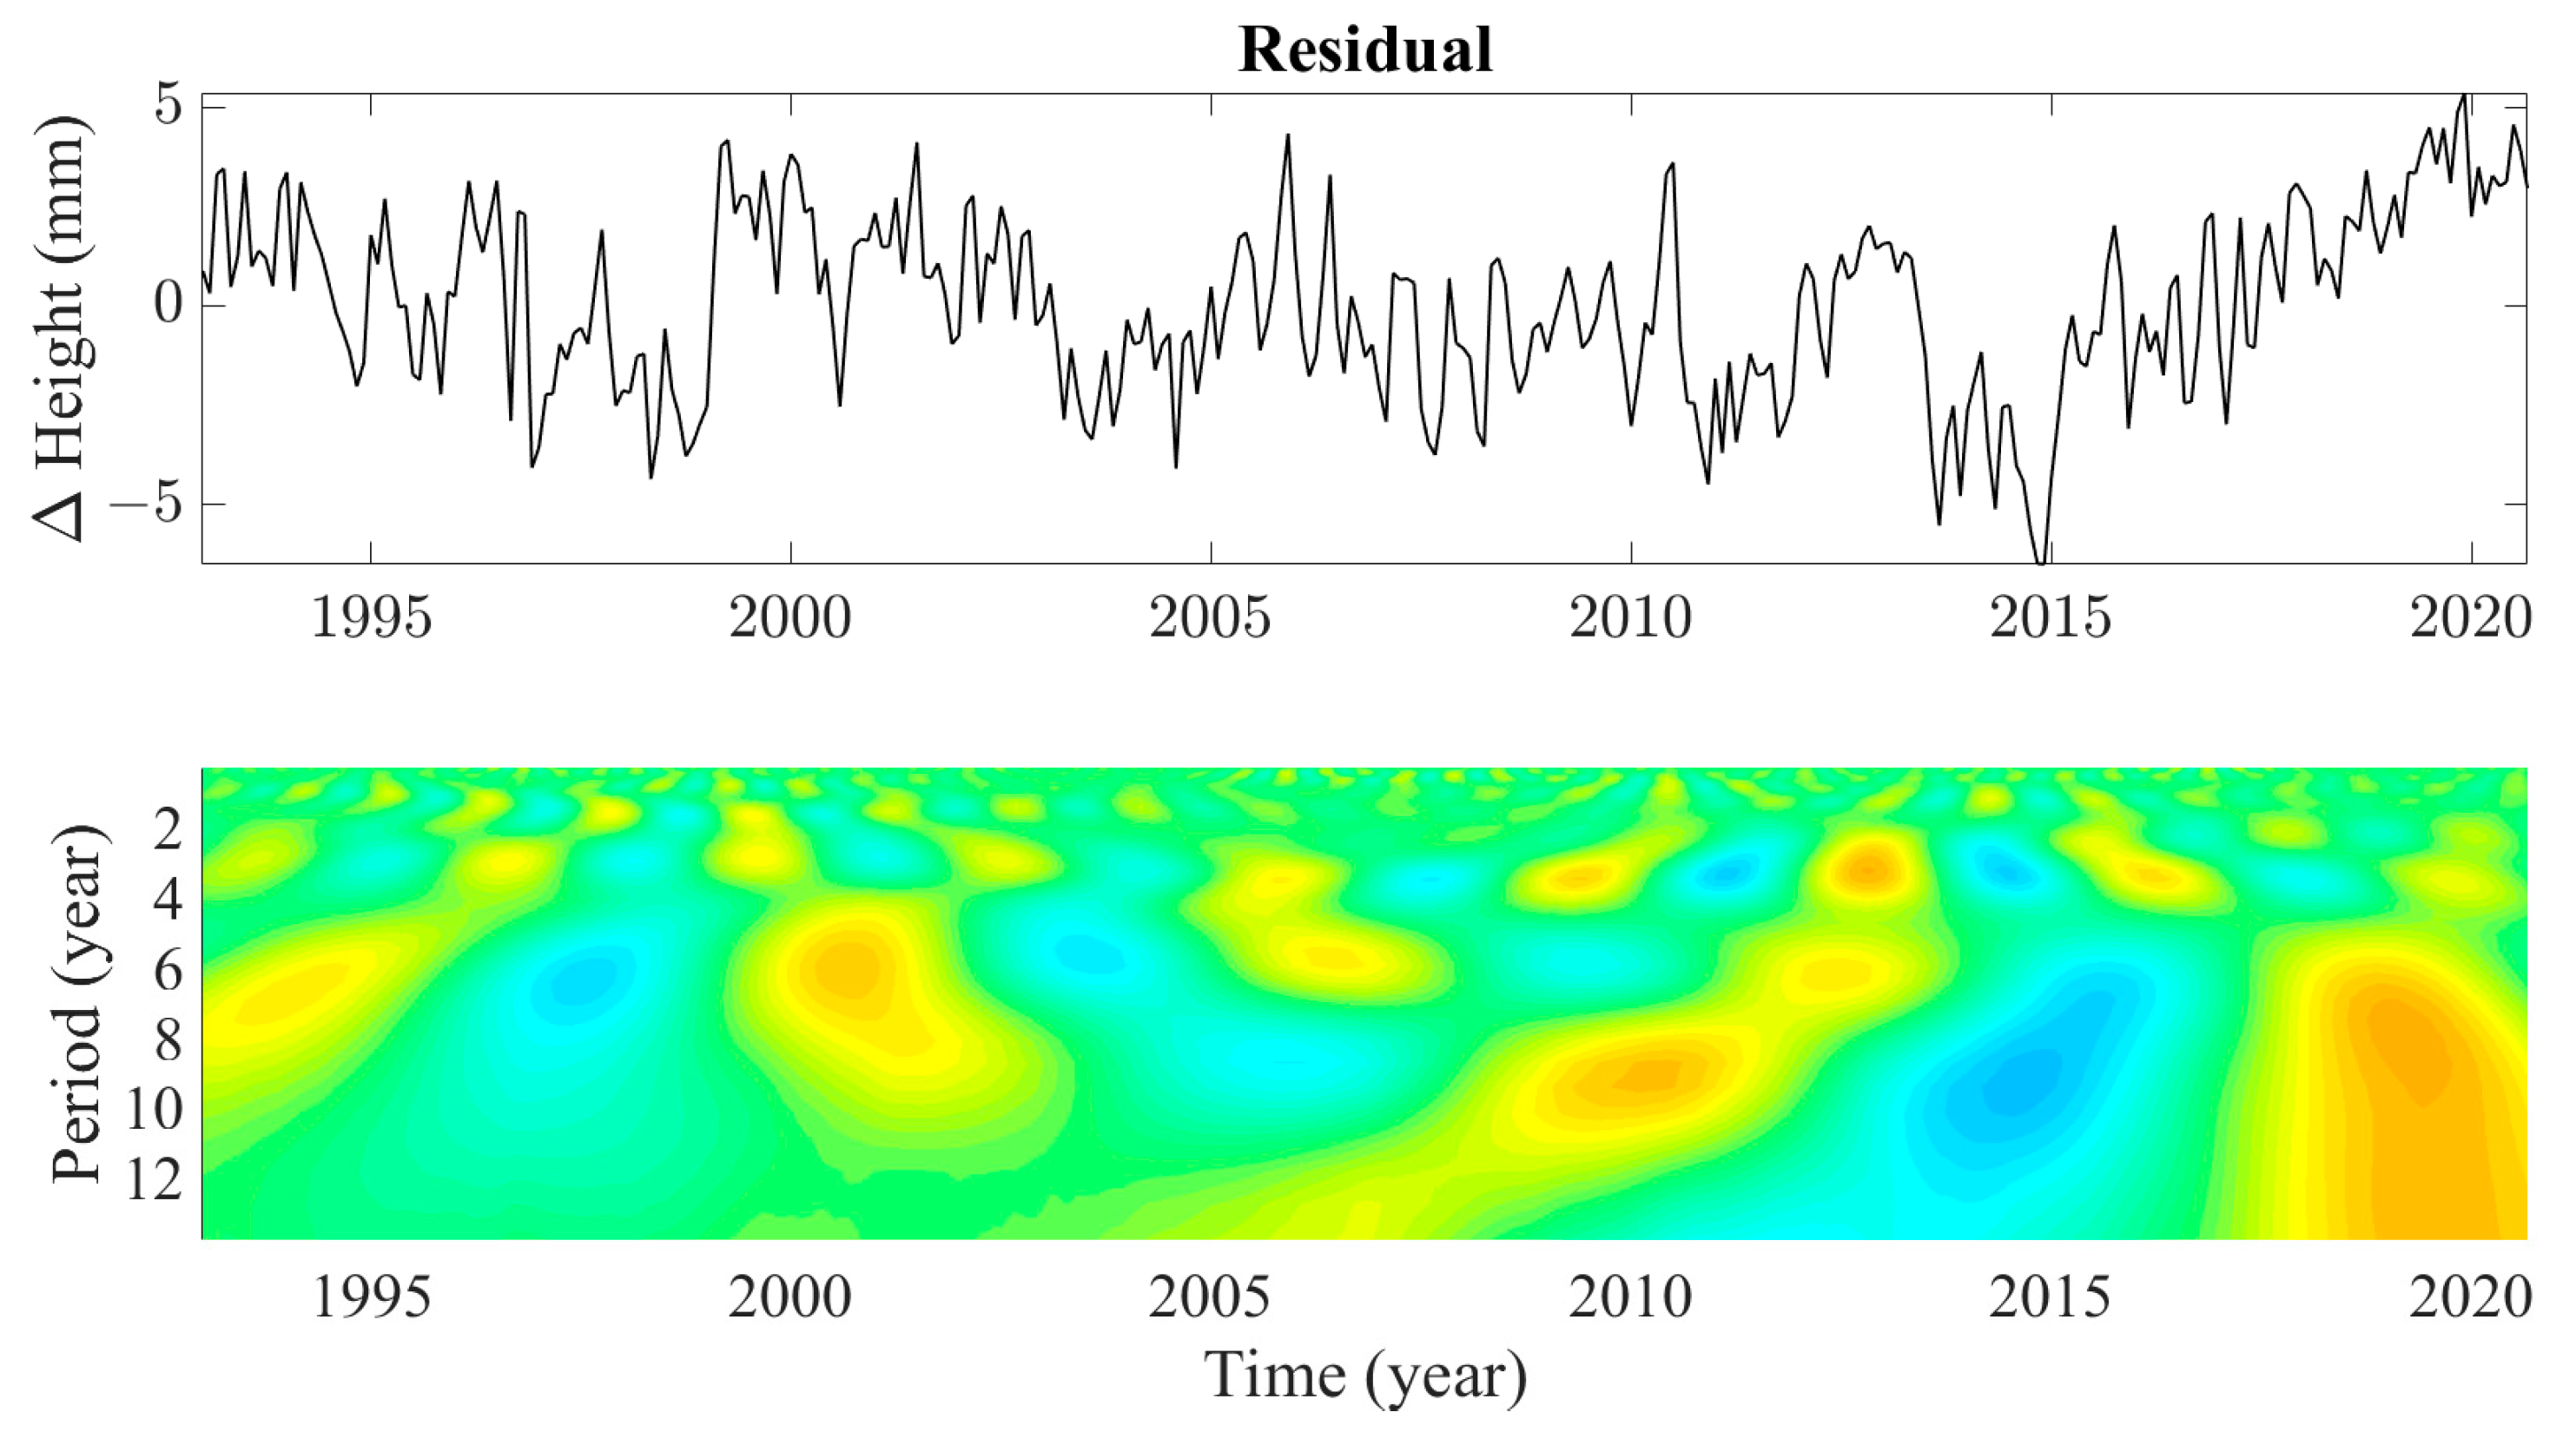
The consequent Residual(t) time series (in Equation (2)) is plotted in Figure 6, along with its time–frequency (real-valued) Morlet wavelet spectra. It represents the remnant after removal of the optimal combination of the known climatic oscillation effects from GMSL. Now buried in relatively high noises, it in principle contains residual signals missed or unaccounted for by the major climatic oscillations, presumably including anthropogenic influences from artificial reservoir water impoundment [33] and underground water withdrawal [34].
At the outset, our analysis has modeled and removed the secular GMSL variation as a linear trend (at rate +3.28 mm/year), as opposed to an accelerating, quadratic trend [35]. We have tried the latter and found that removing the least-squares fit of a quadratic trend would actually significantly deteriorate the fit of Equation (2) compared to that of removing a linear trend: even though the standard deviation of the Residual stays about the same (at 2.3 mm), the above-mentioned correlation coefficient would drop from 0.82 to 0.64, while the difference time series corresponding to Figure 6 would contain a clear curvature. This indicates that the quadratic trend would unduly absorb some of the sought climatic influences. In effect, the apparent acceleration in GMSL is attributed to the climatic oscillations in the present context, particularly AMO, whose fit coefficient would drop to near zero in the case of quadratic fit.
Our treatment of the climatic influences in terms of indices does not distinguish between the steric- and the mass-induced effects, the two main physical contributions to GMSL variations. To that end, in pursuit of more insights into the responsible mechanisms, one would resort to additional global data types to the present ocean altimetry. A general prospective practice is to combine the GRACE satellite time-variable gravity data such as in Llovel et al. [36] and Kuo et al. [17], along with other types of in situ data or numerical model output.

Author Contributions

Conceptualization, B.F.C.; methodology, B.F.C.; software, T.-J.L.; validation, T.-J.L.; formal analysis, T.-J.L.; investigation, B.F.C.; resources, B.F.C.; data curation, T.-J.L.; writing, B.F.C.; visualization, T.-J.L.; project administration, B.F.C.; funding acquisition, B.F.C. All authors have read and agreed to the published version of the manuscript.

Funding

This work is supported by the Taiwan Ministry of Science and Technology under grant #109-2116-M-001028.

Institutional Review Board Statement

Not applicable.

Data Availability Statement

The following organizations provided the datasets used in this paper: sea level data, https://sealevel.colorado.edu/data/2020rel1-global-mean-sea-level-seasonal-signals-retained, accessed on 2 Feburary 2021; ENSO, https://psl.noaa.gov/enso/mei/, accessed on 2 Feburary 2021; PDO, https://www.ncdc.noaa.gov/teleconnections/pdo/, accessed on 2 Feburary 2021; AMO, https://psl.noaa.gov/data/timeseries/AMO/, accessed on 2 Feburary 2021; AO, https://www.ncdc.noaa.gov/teleconnections/ao/, accessed on 2 Feburary 2021; AAO, https://www.cpc.ncep.noaa.gov/products/precip/CWlink/daily_ao_index/aao/aao.shtml, accessed on 2 Feburary 2021.

Acknowledgments

This work was conducted under the first author T.-J.L.’s science project at the Affiliated Senior High School of National Taiwan Normal University, sponsored by the Taiwan Ministry of Education.

Conflicts of Interest

The authors declare no conflict of interest. The funders had no role in the design of the study; in the collection, analyses, or interpretation of data; in the writing of the manuscript; or in the decision to publish the results.

Abbreviations

GMSLGlobal Mean Sea Level
GMSL-IDInterannual–Decadal Variation of GMSL
ENSOEl Niño-Southern Oscillation
ENSO-CPCentral Pacific ENSO
ENSO-EPEastern Pacific ENSO
PDOPacific Decadal Oscillation
AMOAtlantic Multidecadal Oscillation
AOArctic Oscillation
AAOAntarctic Oscillation

References

  1. Cazenave, A.; Dieng, H.B.; Meyssignac, B.; Von Schuckmann, K.; Decharme, B.; Berthier, E. The rate of sea-level rise. Nat. Clim. Chang. 2014, 4, 358–361. [Google Scholar] [CrossRef]
  2. Cazenave, A. The WCRP Global Sea Level Budget Group Global sea-level budget 1993–present. Earth Syst. Sci. Data 2018, 10, 1551–1590. [Google Scholar] [CrossRef] [Green Version]
  3. Frederikse, T.; Landerer, F.; Caron, L.; Adhikari, S.; Parkes, D.; Humphrey, V.W.; Dangedorf, S.; Hogarth, P.; Zanna, L.; Cheng, L.; et al. The causes of sea-level rise since 1900. Nature 2020, 584, 393–397. [Google Scholar] [CrossRef] [PubMed]
  4. Chen, J.L.; Wilson, C.R.; Tapley, B.D.; Famiglietti, J.S.; Rodell, M. Seasonal global mean sea level change from satellite altimeter, GRACE, and geophysical models. J. Geod. 2005, 79, 532–539. [Google Scholar] [CrossRef]
  5. Vinogradov, S.V.; Ponte, R.M.; Heimbach, P.; Wunsch, C. The mean seasonal cycle in sea level estimated from a data-constrained general circulation model. J. Geophys. Res. 2008, 113, C03032. [Google Scholar] [CrossRef]
  6. García-García, D.; Vigo, I.; Trottini, M. Water transport among the world ocean basins within the water cycle. Earth Syst. Dynam. 2020, 11, 1089–1106. [Google Scholar] [CrossRef]
  7. Cazenave, A.; Remy, F. Sea level and climate: Measurements and causes of changes. Wiley Interdiscip. Rev.-Clim. Chang. 2011, 2, 647–662. [Google Scholar] [CrossRef]
  8. Chambers, D.P.; Mehlhaff, C.A.; Urban, T.J.; Fujii, D.; Nerem, R.S. Low-frequency variations in global mean sea level: 1950–2000. J. Geophys. Res. Ocean. 2002, 107, 3026. [Google Scholar] [CrossRef]
  9. Willis, J.K.; Chambers, D.P.; Nerem, R.S. Assessing the globally averaged sea level budget on seasonal to interannual timescales. J. Geophys. Res. Ocean. 2008, 113, C06015. [Google Scholar] [CrossRef] [Green Version]
  10. Boening, C.; Willis, J.K.; Landerer, F.W.; Nerem, R.S.; Fasullo, J. The 2011 La Niña: So strong, the oceans fell. Geophys. Res. Lett. 2012, 39, 19. [Google Scholar] [CrossRef] [Green Version]
  11. Cazenave, A.; Henry, O.; Munier, S.; Delcroix, T.; Gordon, A.L.; Meyssignac, B.; Llovel, W.; Palanisamy, H.; Becker, N. Estimating ENSO Influence on the Global Mean Sea Level 1993–2010. Mar. Geod. 2012, 35, 82–97. [Google Scholar] [CrossRef]
  12. Haddad, M.; Taibi, H.; Arezki, S.M.M. On the recent global mean sea level changes: Trend extraction and El Nino’s impact. Comptes Rendus Geosci. 2013, 345, 167–175. [Google Scholar] [CrossRef]
  13. Jin, T.Y.; Li, J.C.; Jiang, W.P.; Chu, Y.H. Low-frequency sea level variation and its correlation with climate events in the Pacific. Chin. Sci. Bull. 2012, 57, 3623–3630. [Google Scholar] [CrossRef] [Green Version]
  14. Zhang, X.B.; Church, J.A. Sea level trends, interannual and decadal variability in the Pacific Ocean. Geophys. Res. Lett. 2012, 39, L21701. [Google Scholar] [CrossRef]
  15. Hamlington, B.D.; Leben, R.R.; Strassburg, M.W.; Nerem, R.S.; Kim, K. Contribution of the Pacific Decadal Oscillation to global mean sea level trends. Geophys. Res. Lett. 2013, 40, 5171–5175. [Google Scholar] [CrossRef] [Green Version]
  16. Hamlington, B.D.; Reager, J.T.; Lo, M.; Karnauskas, K.B.; Leben, R.R. Separating decadal global water cycle variability from sea level rise. Sci. Rep. 2017, 7, 995. [Google Scholar] [CrossRef] [Green Version]
  17. Kuo, Y.N.; Lo, M.H.; Liang, Y.C.; Tseng, Y.H.; Hsu, C.W. Terrestrial Water Storage Anomalies emphasize interannual variations in global mean sea level during 1997–1998 and 2015–2016 El Niño events. Geophys. Res. Lett. 2021, 48, e2021GL094104. [Google Scholar] [CrossRef]
  18. Wahl, T.; Chambers, D.P. Climate controls multidecadal variability in US extreme sea level records. J. Geophys. Res.-Ocean. 2016, 121, 1274–1290. [Google Scholar] [CrossRef] [Green Version]
  19. Rohmer, J.; Cozannet, L.G. Dominance of the mean sea level in the high-percentile sea levels time evolution with respect to large-scale climate variability: A Bayesian statistical approach. Environ. Res. Lett. 2019, 14, 014008. [Google Scholar] [CrossRef]
  20. Moreira, L.; Cazenave, A.; Palanisamy, H. Influence of interannual variability in estimating the rate and acceleration of present-day global mean sea level. Glob. Planet. Chang. 2021, 199, 103450. [Google Scholar] [CrossRef]
  21. Chao, B.F.; Yu, Y.; Chung, C.H. Variation of Earth’s Oblateness J2 on Interannual-to-Decadal Timescales. J. Geophys. Res. Lett. 2020, 125, e2020JB019421. [Google Scholar] [CrossRef]
  22. Kao, H.Y.; Yu, J.Y. Contrasting Eastern-Pacific and Central-Pacific Types of ENSO. J. Clim. 2009, 22, 615–632. [Google Scholar] [CrossRef]
  23. Wallace, J.M.; Gutzler, D.S. Teleconnections in the geopotential height field during the northern hemisphere winter. Mon. Weather Rev. 1981, 109, 784–812. [Google Scholar] [CrossRef]
  24. Thompson, D.W.J.; Wallace, J.M. Annular Modes in the Extratropical Circulation. Part I: Month-to-Month Variability. J. Clim. 2000, 13, 1000–1016. [Google Scholar] [CrossRef]
  25. Newman, M.; Alexander, M.; Ault, T.R.; Cobb, K.M.; Deser, C.; Di Lorenzo, E.; Mantua, N.J.; Miller, A.J.; Minobe, S.; Nakamura, H.; et al. The Pacific decadal oscillation, revisited. J. Clim. 2016, 29, 4399–4427. [Google Scholar] [CrossRef] [Green Version]
  26. Chen, X.; Wallace, J.M. Orthogonal PDO and ENSO Indices. J. Clim. 2016, 29, 3883–3892. [Google Scholar] [CrossRef]
  27. Chao, B.F.; Chung, C.H. On Estimating the Cross-Correlation and Least-squares Fit of One Dataset to Another with Time Shift. Earth Space Sci. 2019, 6, 1409–1415. [Google Scholar] [CrossRef]
  28. Chao, B.F.; Eanes, R.J. Global gravitational change due to atmospheric mass redistribution as observed by the Lageos’ nodal residual. Geophys. J. Int. 1995, 122, 755–764. [Google Scholar] [CrossRef] [Green Version]
  29. Thomson, D.J. Thomson Spectrum estimation and harmonic analysis. Proc. IEEE 1982, 70, 1055–1096. [Google Scholar] [CrossRef] [Green Version]
  30. Wu, S.; Liu, Z.; Zhang, R.; Delworth, T.L. On the observed relationship between the Pacific Decadal Oscillation and the Atlantic Multi-decadal Oscillation. J. Ocean. 2011, 67, 27–35. [Google Scholar] [CrossRef]
  31. Prandi, P.; Ablain, M.; Cazenave, A.; Picot, N. A New Estimation of Mean Sea Level in the Arctic Ocean from Satellite Altimetry. Mar. Geod. 2012, 35, 61–81. [Google Scholar] [CrossRef] [Green Version]
  32. Cheng, Y.C.; Andersen, O.; Knudsen, P. An Improved 20-Year Arctic Ocean Altimetric Sea Level Data Record. Mar. Geod. 2015, 38, 146–162. [Google Scholar] [CrossRef]
  33. Chao, B.F.; Wu, Y.H.; Li, Y.S. Impact of artificial reservoir water impoundment on global sea level. Science 2008, 320, 212–214. [Google Scholar] [CrossRef] [PubMed] [Green Version]
  34. Wada, Y.; van Beek, L.P.H.; Weiland, F.C.S.; Chao, B.F.; Wu, Y.H.; Bierkens, M.F.P. Past and future contribution of global groundwater depletion to sea-level rise. Geophys. Res. Lett. 2012, 39, L09402. [Google Scholar] [CrossRef] [Green Version]
  35. Yi, S.; Heki, K.; Qian, A. Acceleration in the Global Mean Sea Level Rise: 2005–2015. Geophys. Res. Lett. 2017, 44, 11905–11913. [Google Scholar] [CrossRef] [Green Version]
  36. Llovel, W.; Becker, M.; Cazenave, A.; Cretaux, J.F.; Ramillien, G. Global land water storage change from GRACE over 2002–2009; Inference on sea level. Comptes Rendus Geosci. 2010, 342, 179–188. [Google Scholar] [CrossRef]
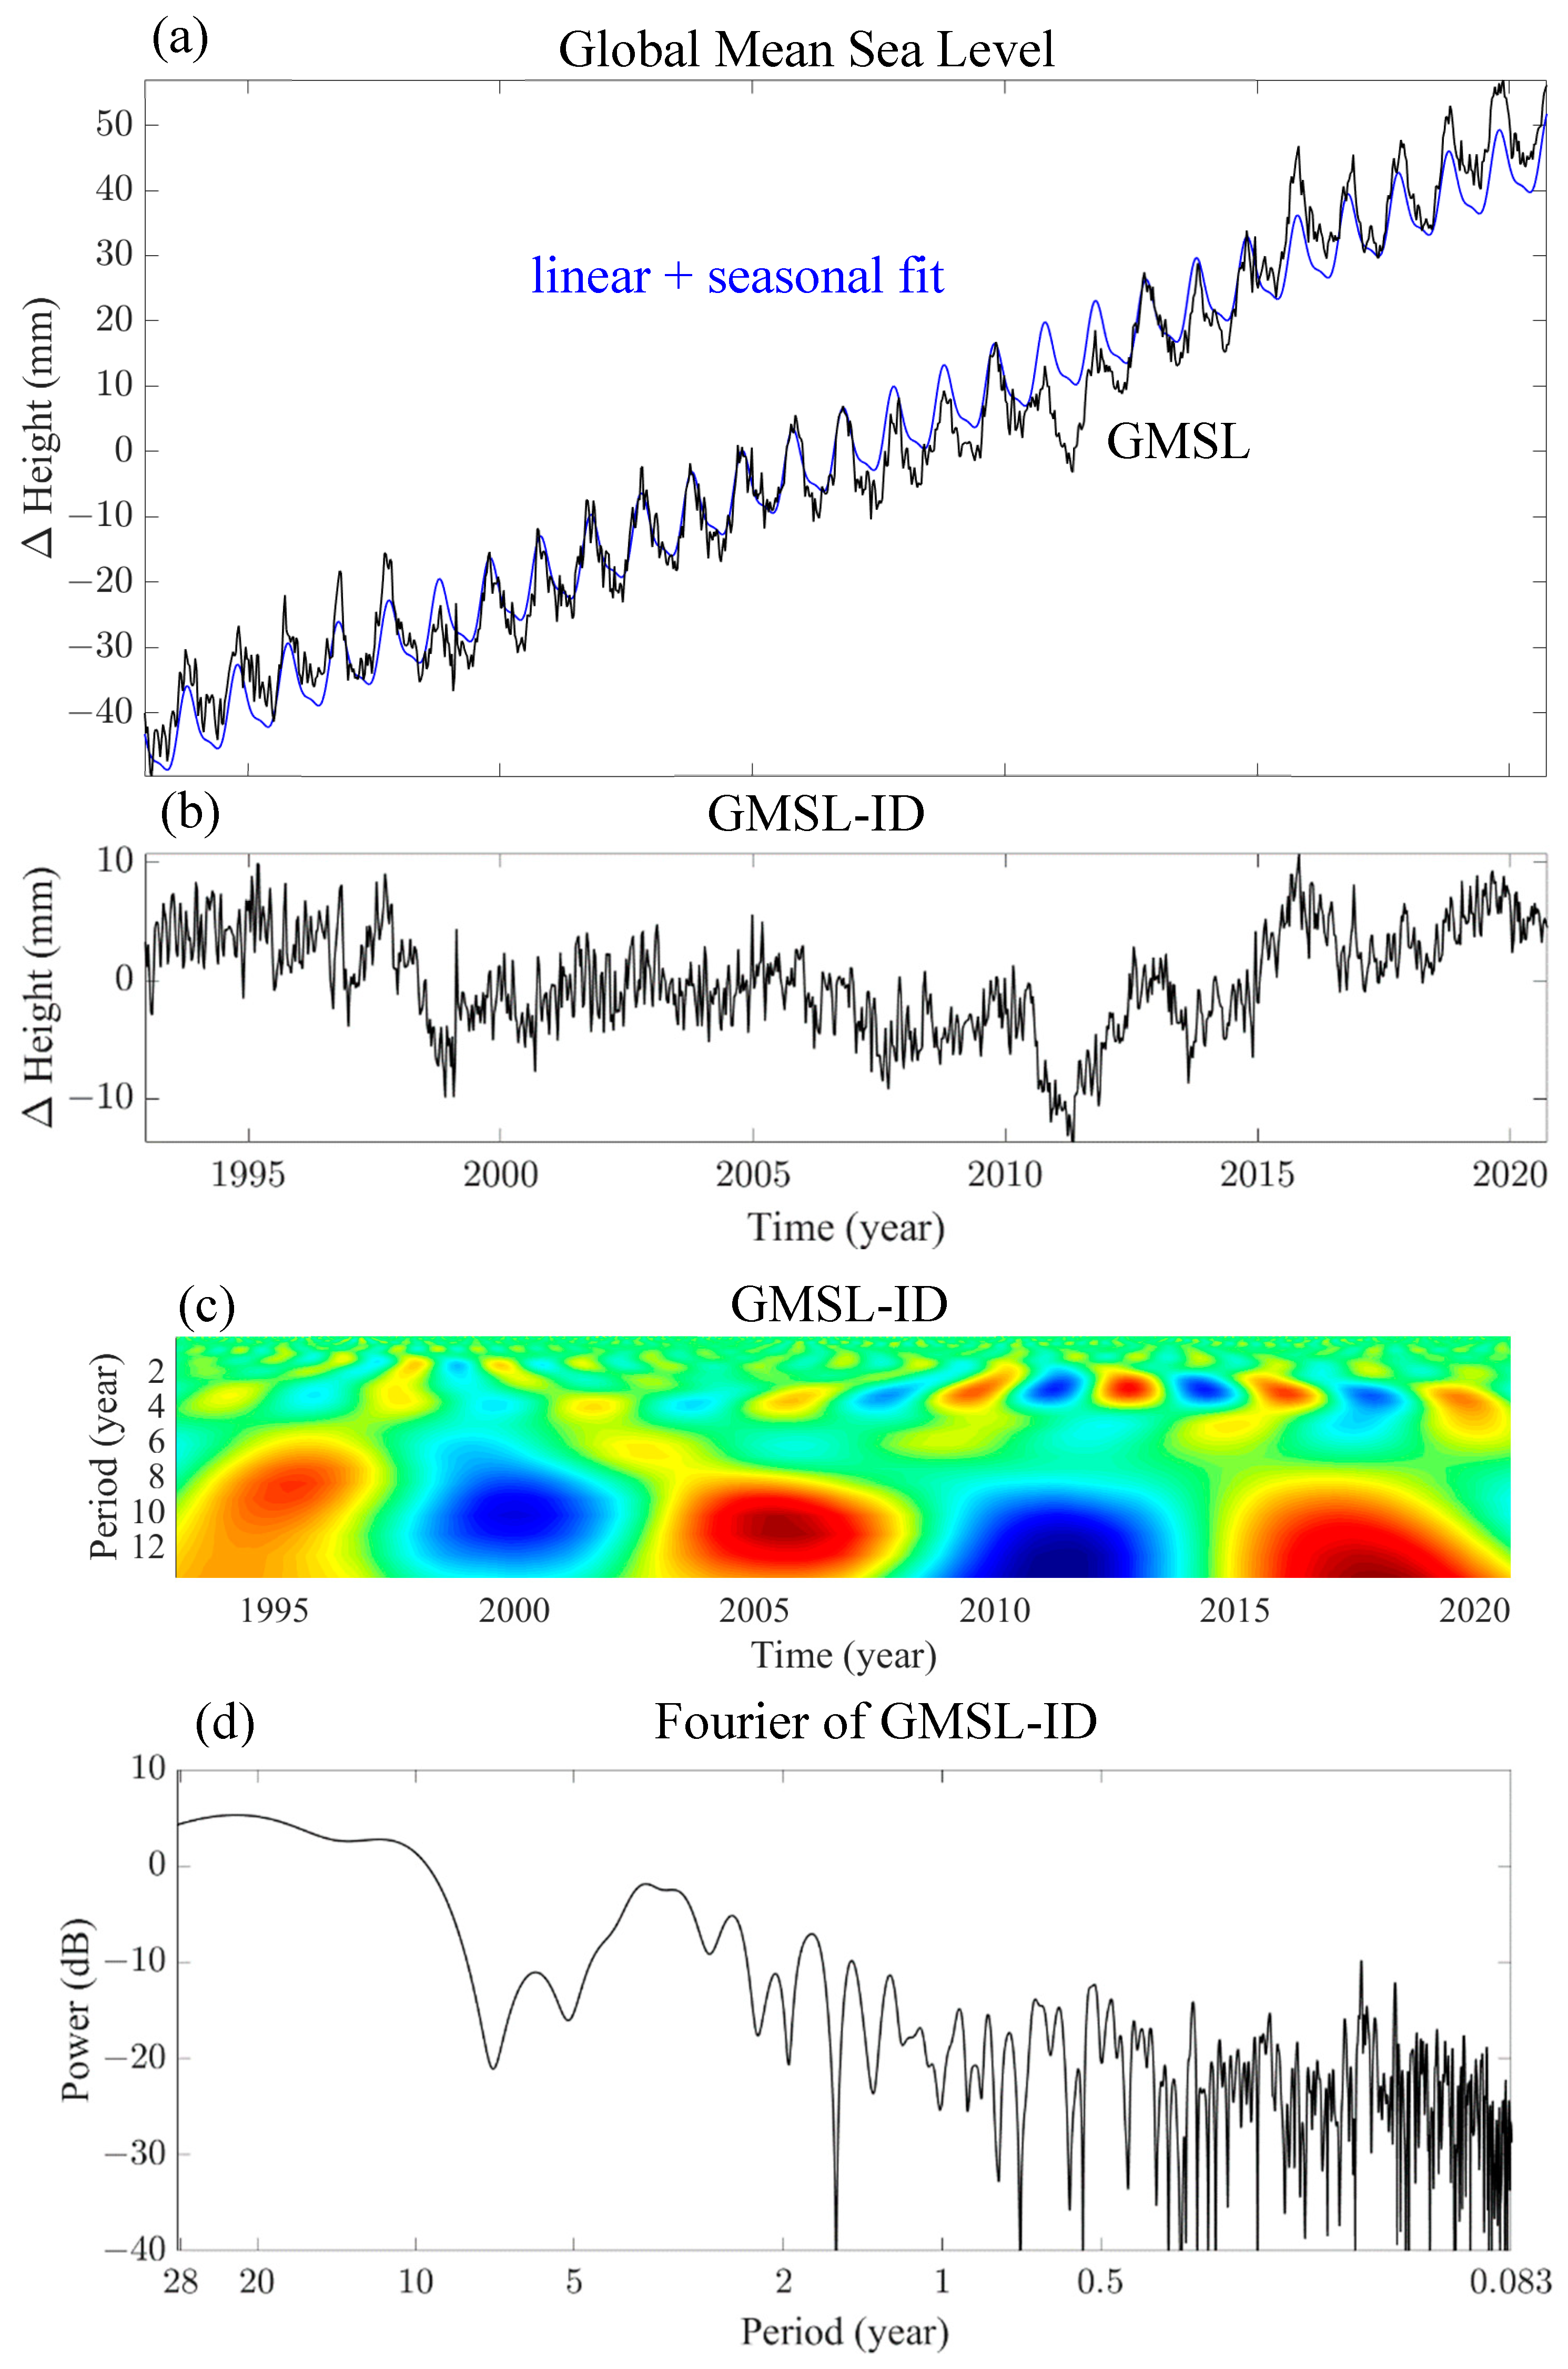
Figure 1. Time series of the altimetry-observed global mean sea level (GMSL), 1992.9–2020.75. (a) The original GMSL data (black) overlaid with the least-squares fit (blue) of a linear + seasonal (annual + semi-annual) terms. (b) The interannual–decadal GMSL-ID time series, i.e., the difference between the two curves in (a); note the different scales. (c) Time–frequency (real-valued) Morlet wavelet spectrum of GMSL-ID in (b) on the interannual–decadal timescale (where red indicates the undulation peaks and blue the troughs). (d) Fourier power spectrum of GMSL-ID, plotted as a function of logarithmic of frequency to accentuate the lower-frequency portion.
Remotesensing 14 02159 g001
Figure 2. Time series of the various climatic oscillation indices used in this study and their (real-valued) Morlet time–frequency wavelet spectra (blue curves are the high- or low-pass filtered versions; see text).
Remotesensing 14 02159 g002
Figure 3. Time-domain cross-correlation functions of GMSL-ID(t) with respect to the indices of the five climatic oscillations (unfiltered and filtered versions; ENSO further separated into the CP- and EP- types) in Figure 2, as functions of relative time shift (in months), where positive time shift means the oscillation leading GMSL-ID(t) in phase.
Remotesensing 14 02159 g003
Figure 4. The frequency-domain cross-coherence spectra (magnitude squares and phase) of GMSL-ID(t) with respect to the indices of the five climatic oscillations in Figure 2 as a function of period (in years), where positive phase means GMSL-ID(t) leading (a) ENSO (black), ENSO-CP (blue), and ENSO-EP (red); (b) PDO (black) and AMO (blue); (c) AAO (black) and AO (blue). The dashed horizontal lines indicate the statistical confidence levels.
Remotesensing 14 02159 g004
Figure 5. (a) Comparison of GMSL-ID(t) (black curve) with the least-squares linear combination of the five oscillation indices (blue curve). (b) Cross-coherence spectrum between the two time series in (a) in terms of magnitude-squared and phase (similar to Figure 4).
Remotesensing 14 02159 g005
Figure 6. The Residual(t) (in Equation (2)) time series after removal of the least-squares fit of the five climatic oscillations from GMSL-ID(t), i.e., the difference between the two curves in Figure 5a, along with its time–frequency (real-valued) Morlet wavelet spectra.
Remotesensing 14 02159 g006
Publisher’s Note: MDPI stays neutral with regard to jurisdictional claims in published maps and institutional affiliations.