
Characteristics of Precipitation and Floods during Typhoons in Guangdong Province


Abstract
:1. Introduction
2. Data and Methods
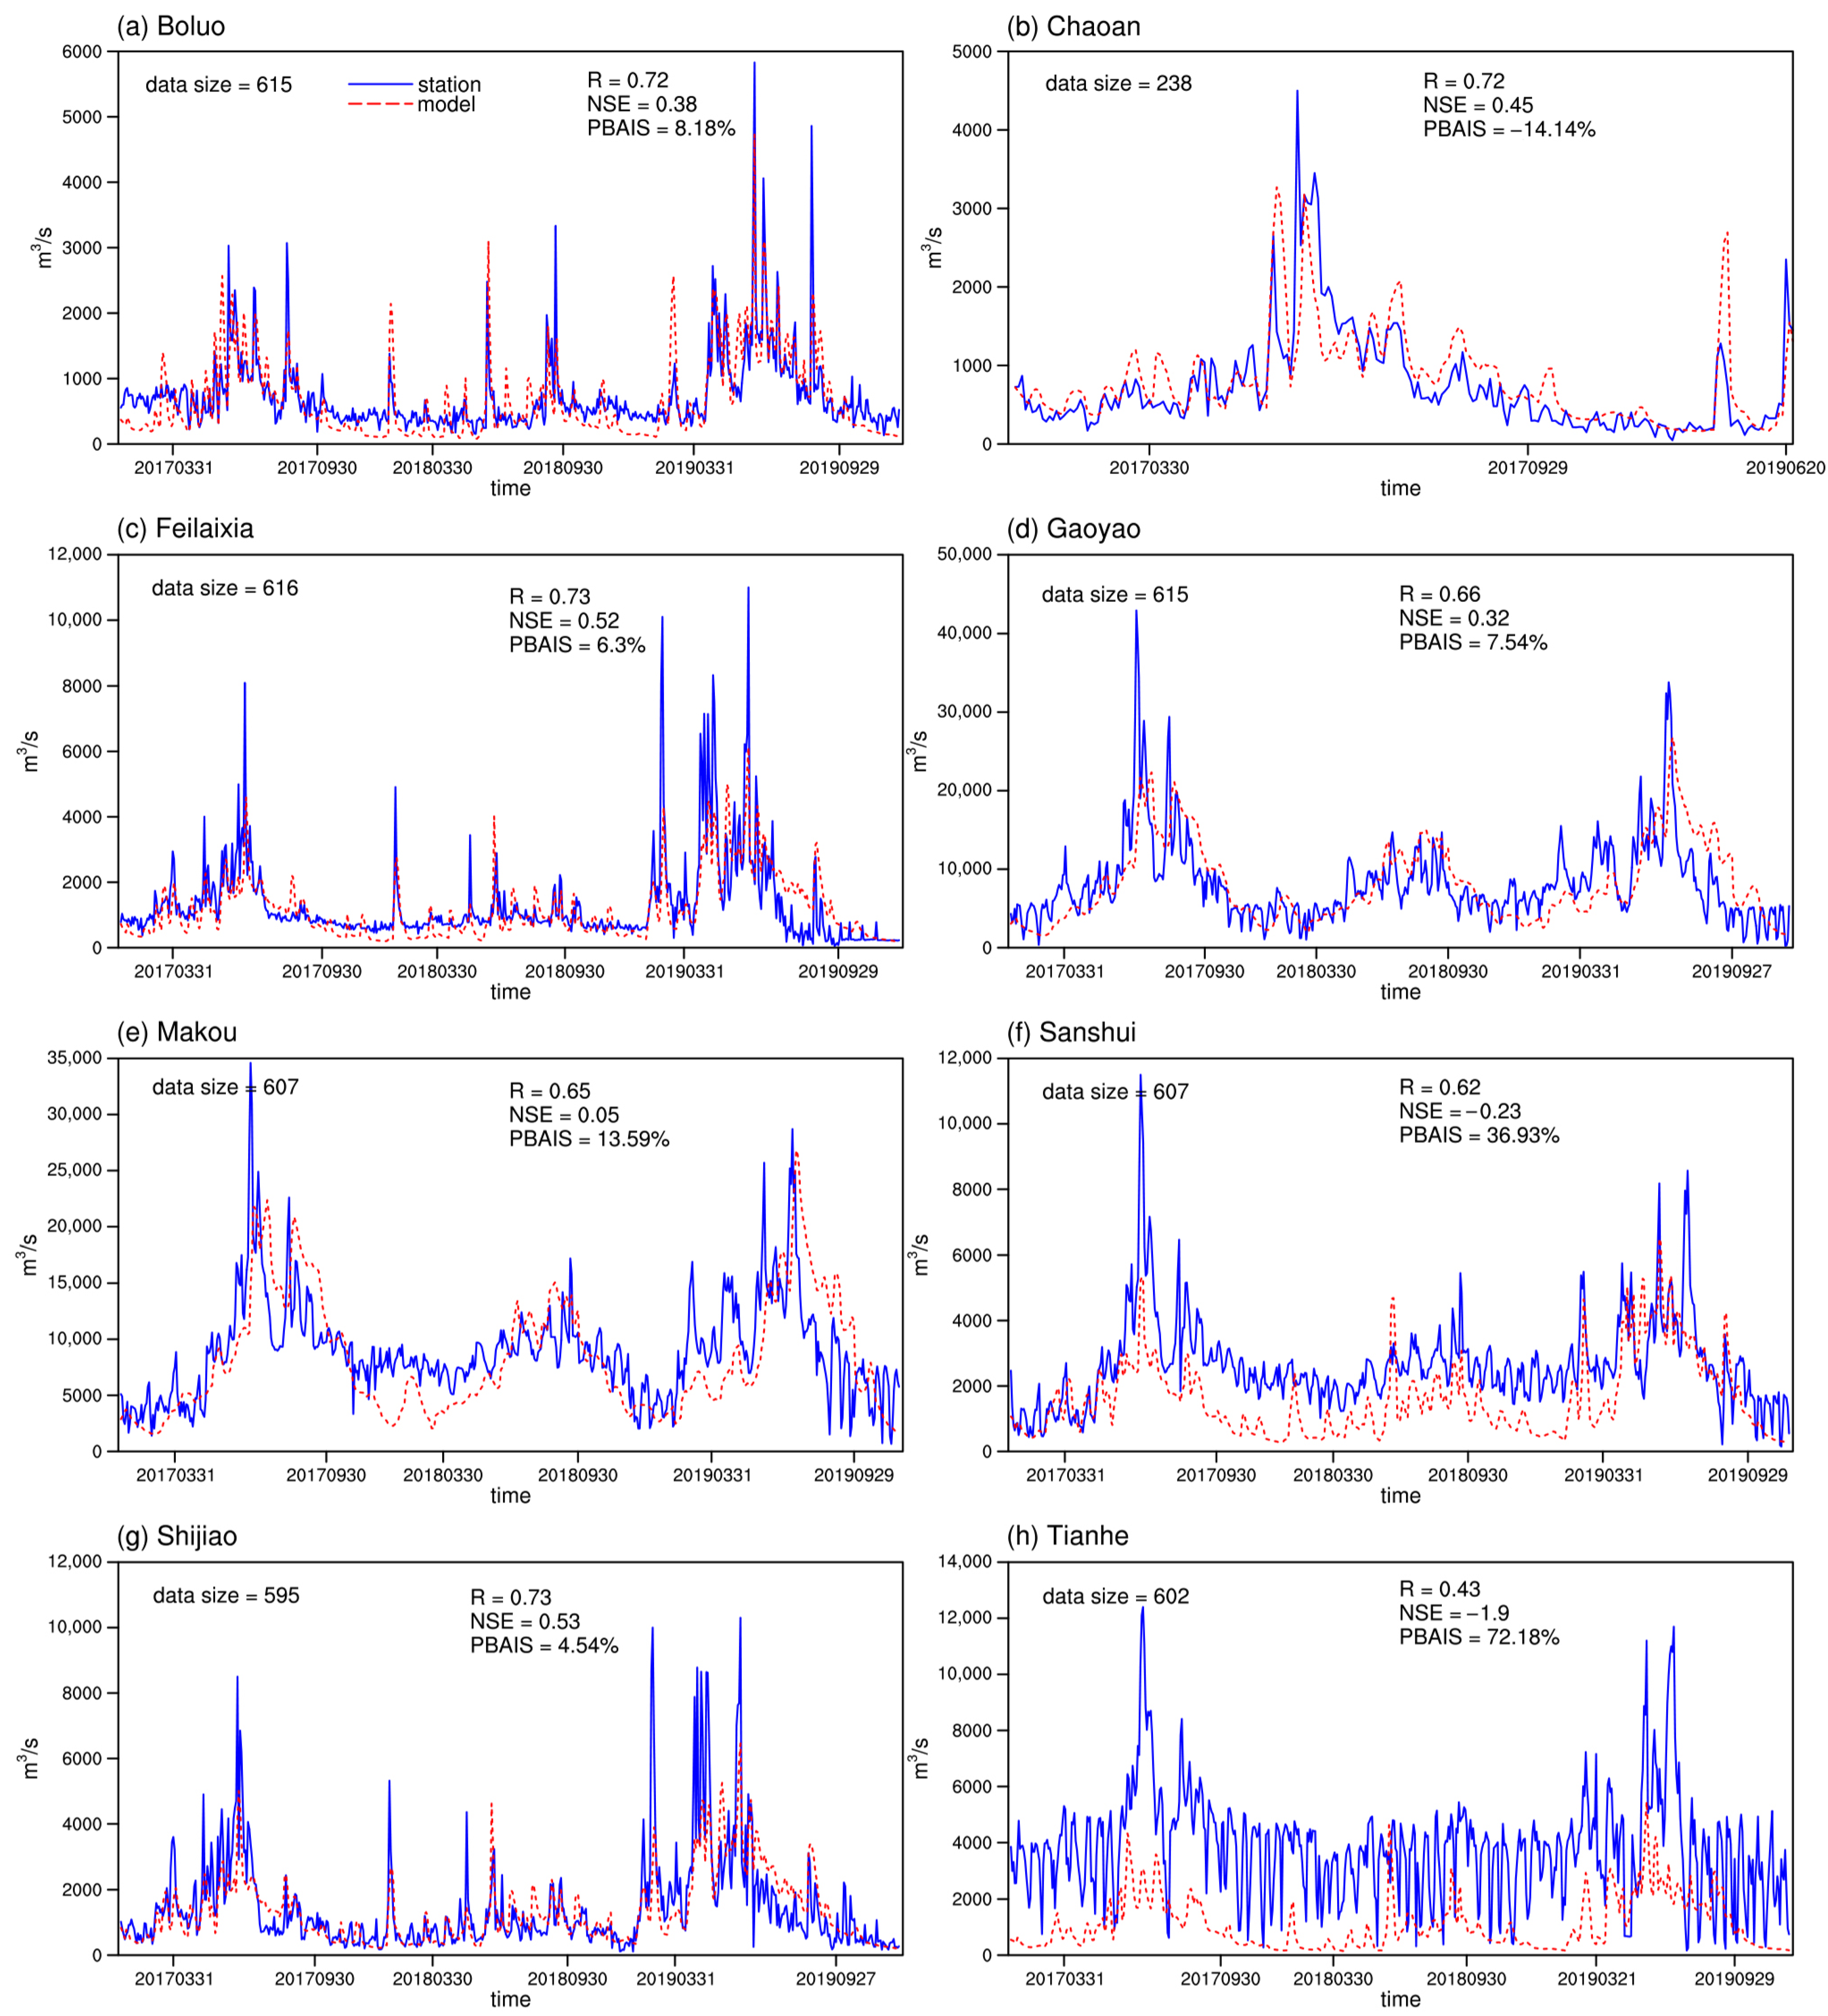
3. Model Validation
4. Results
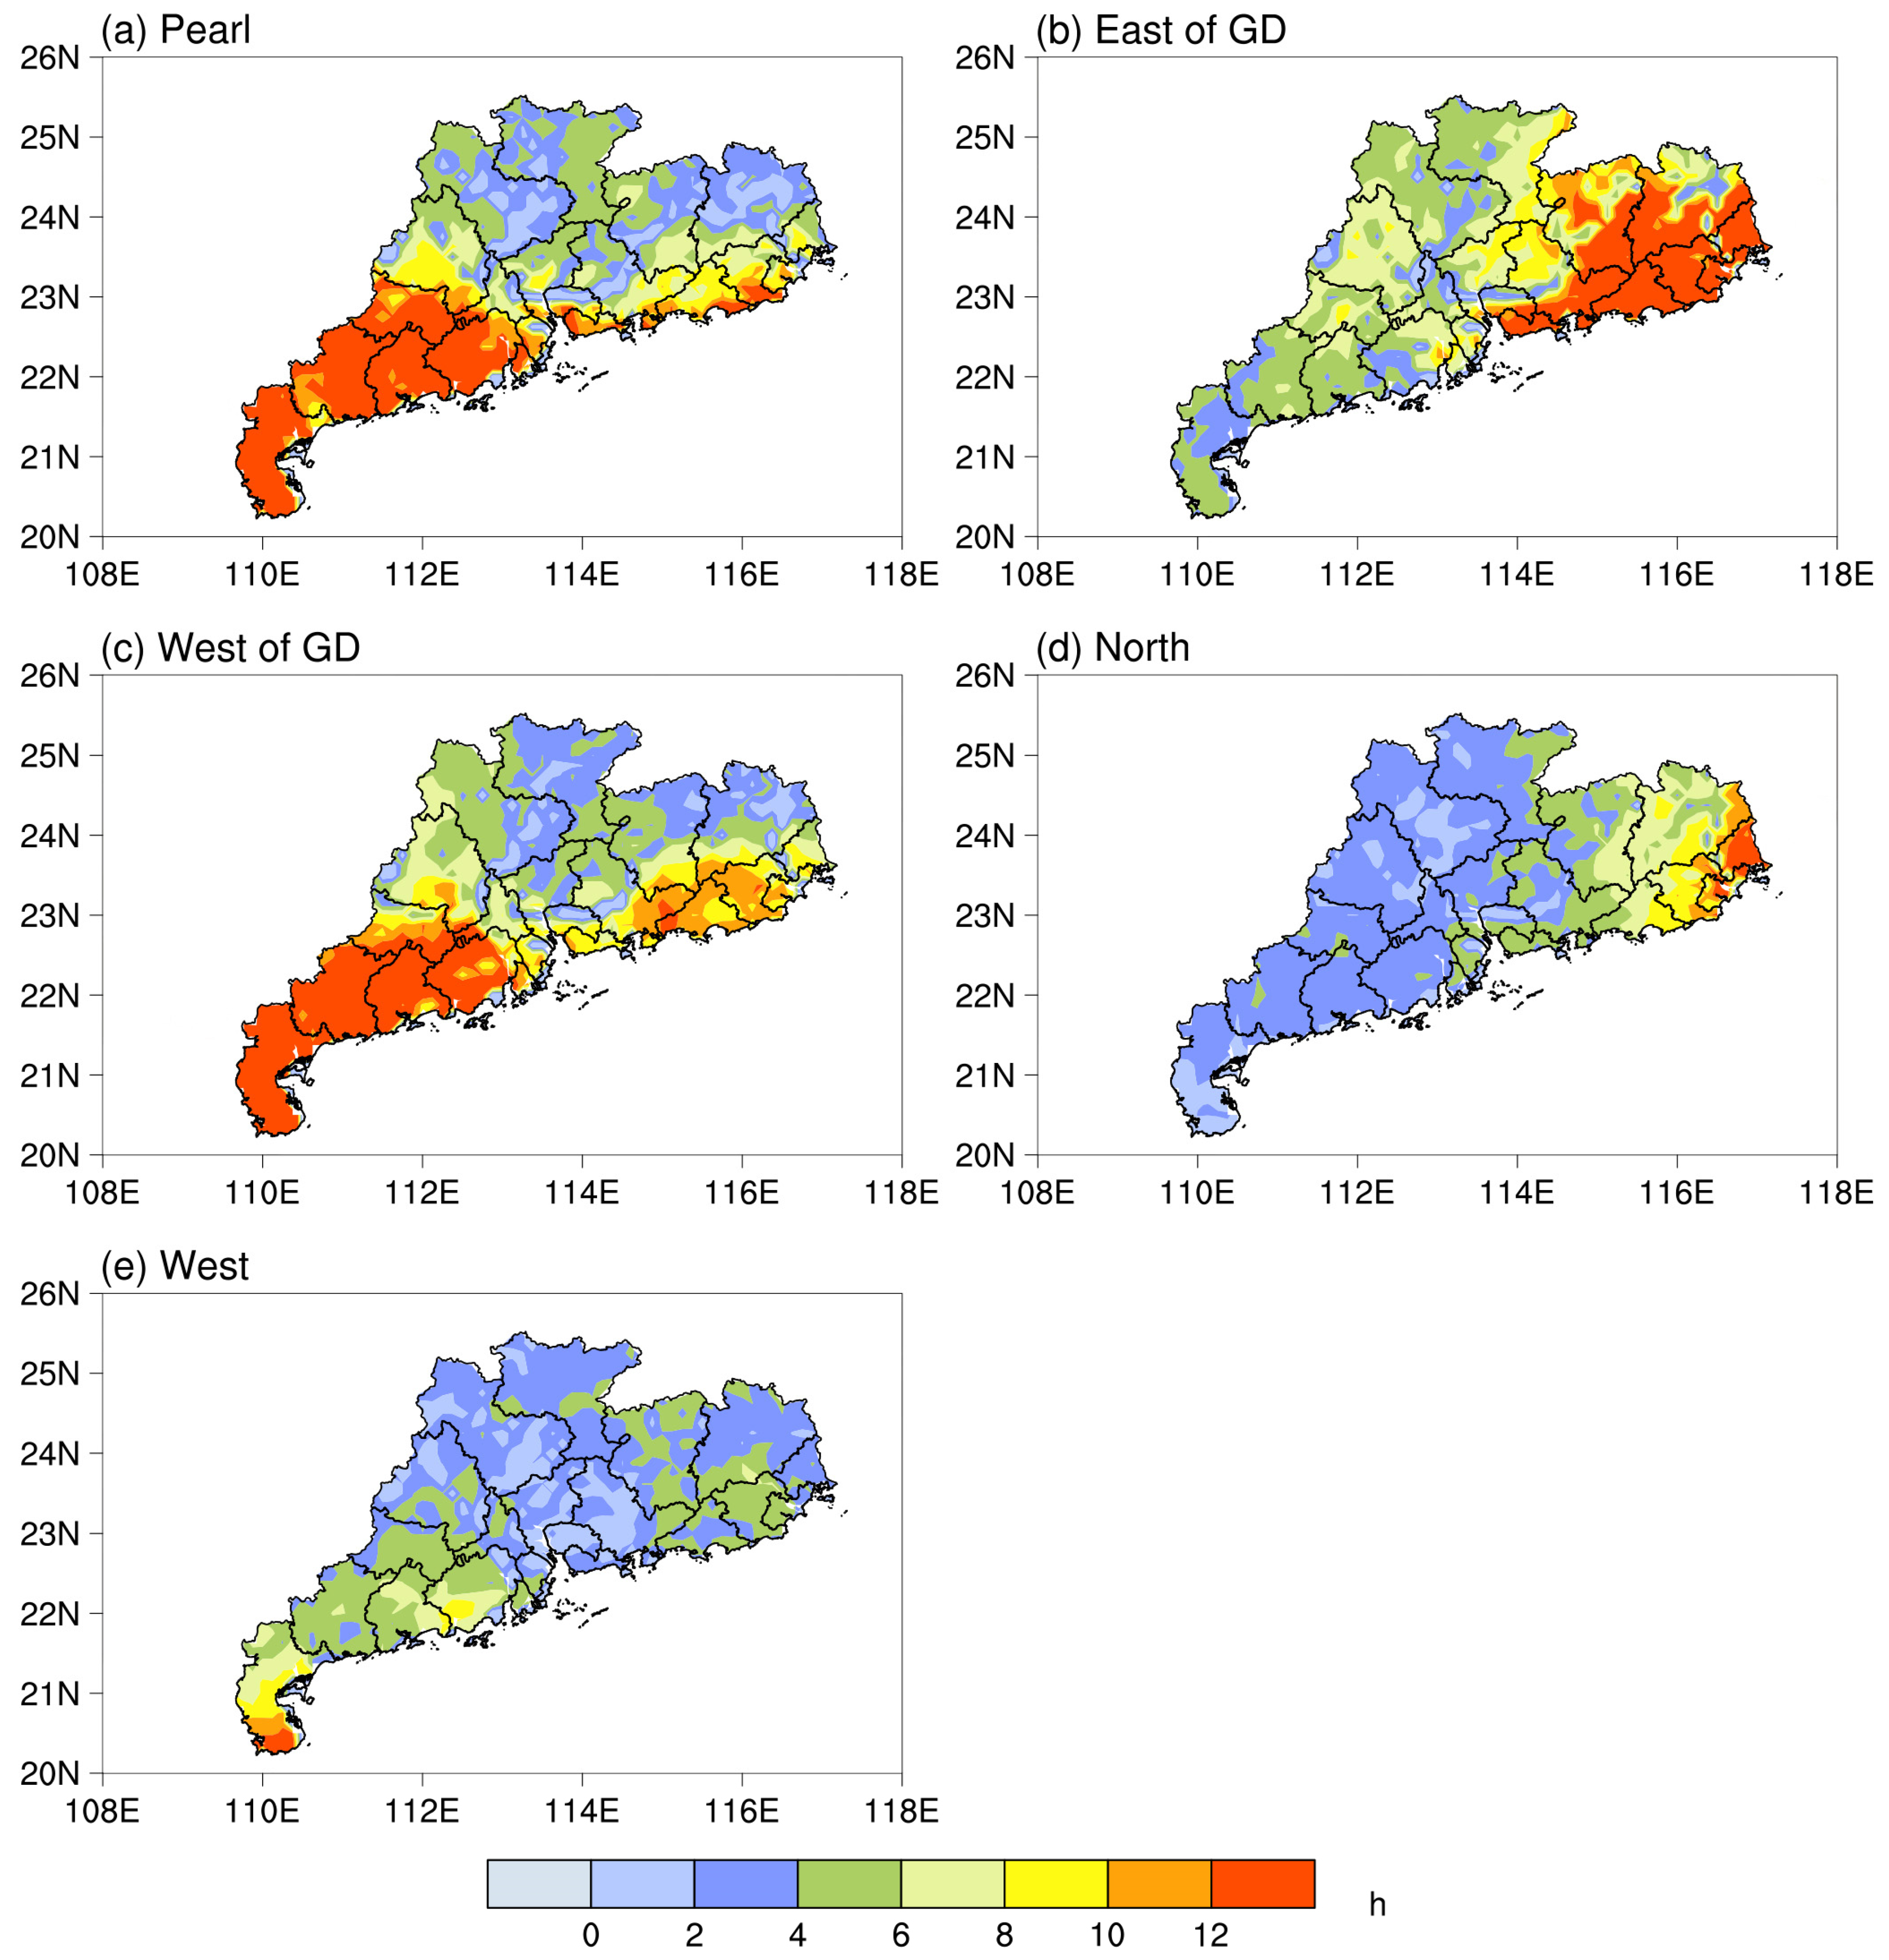
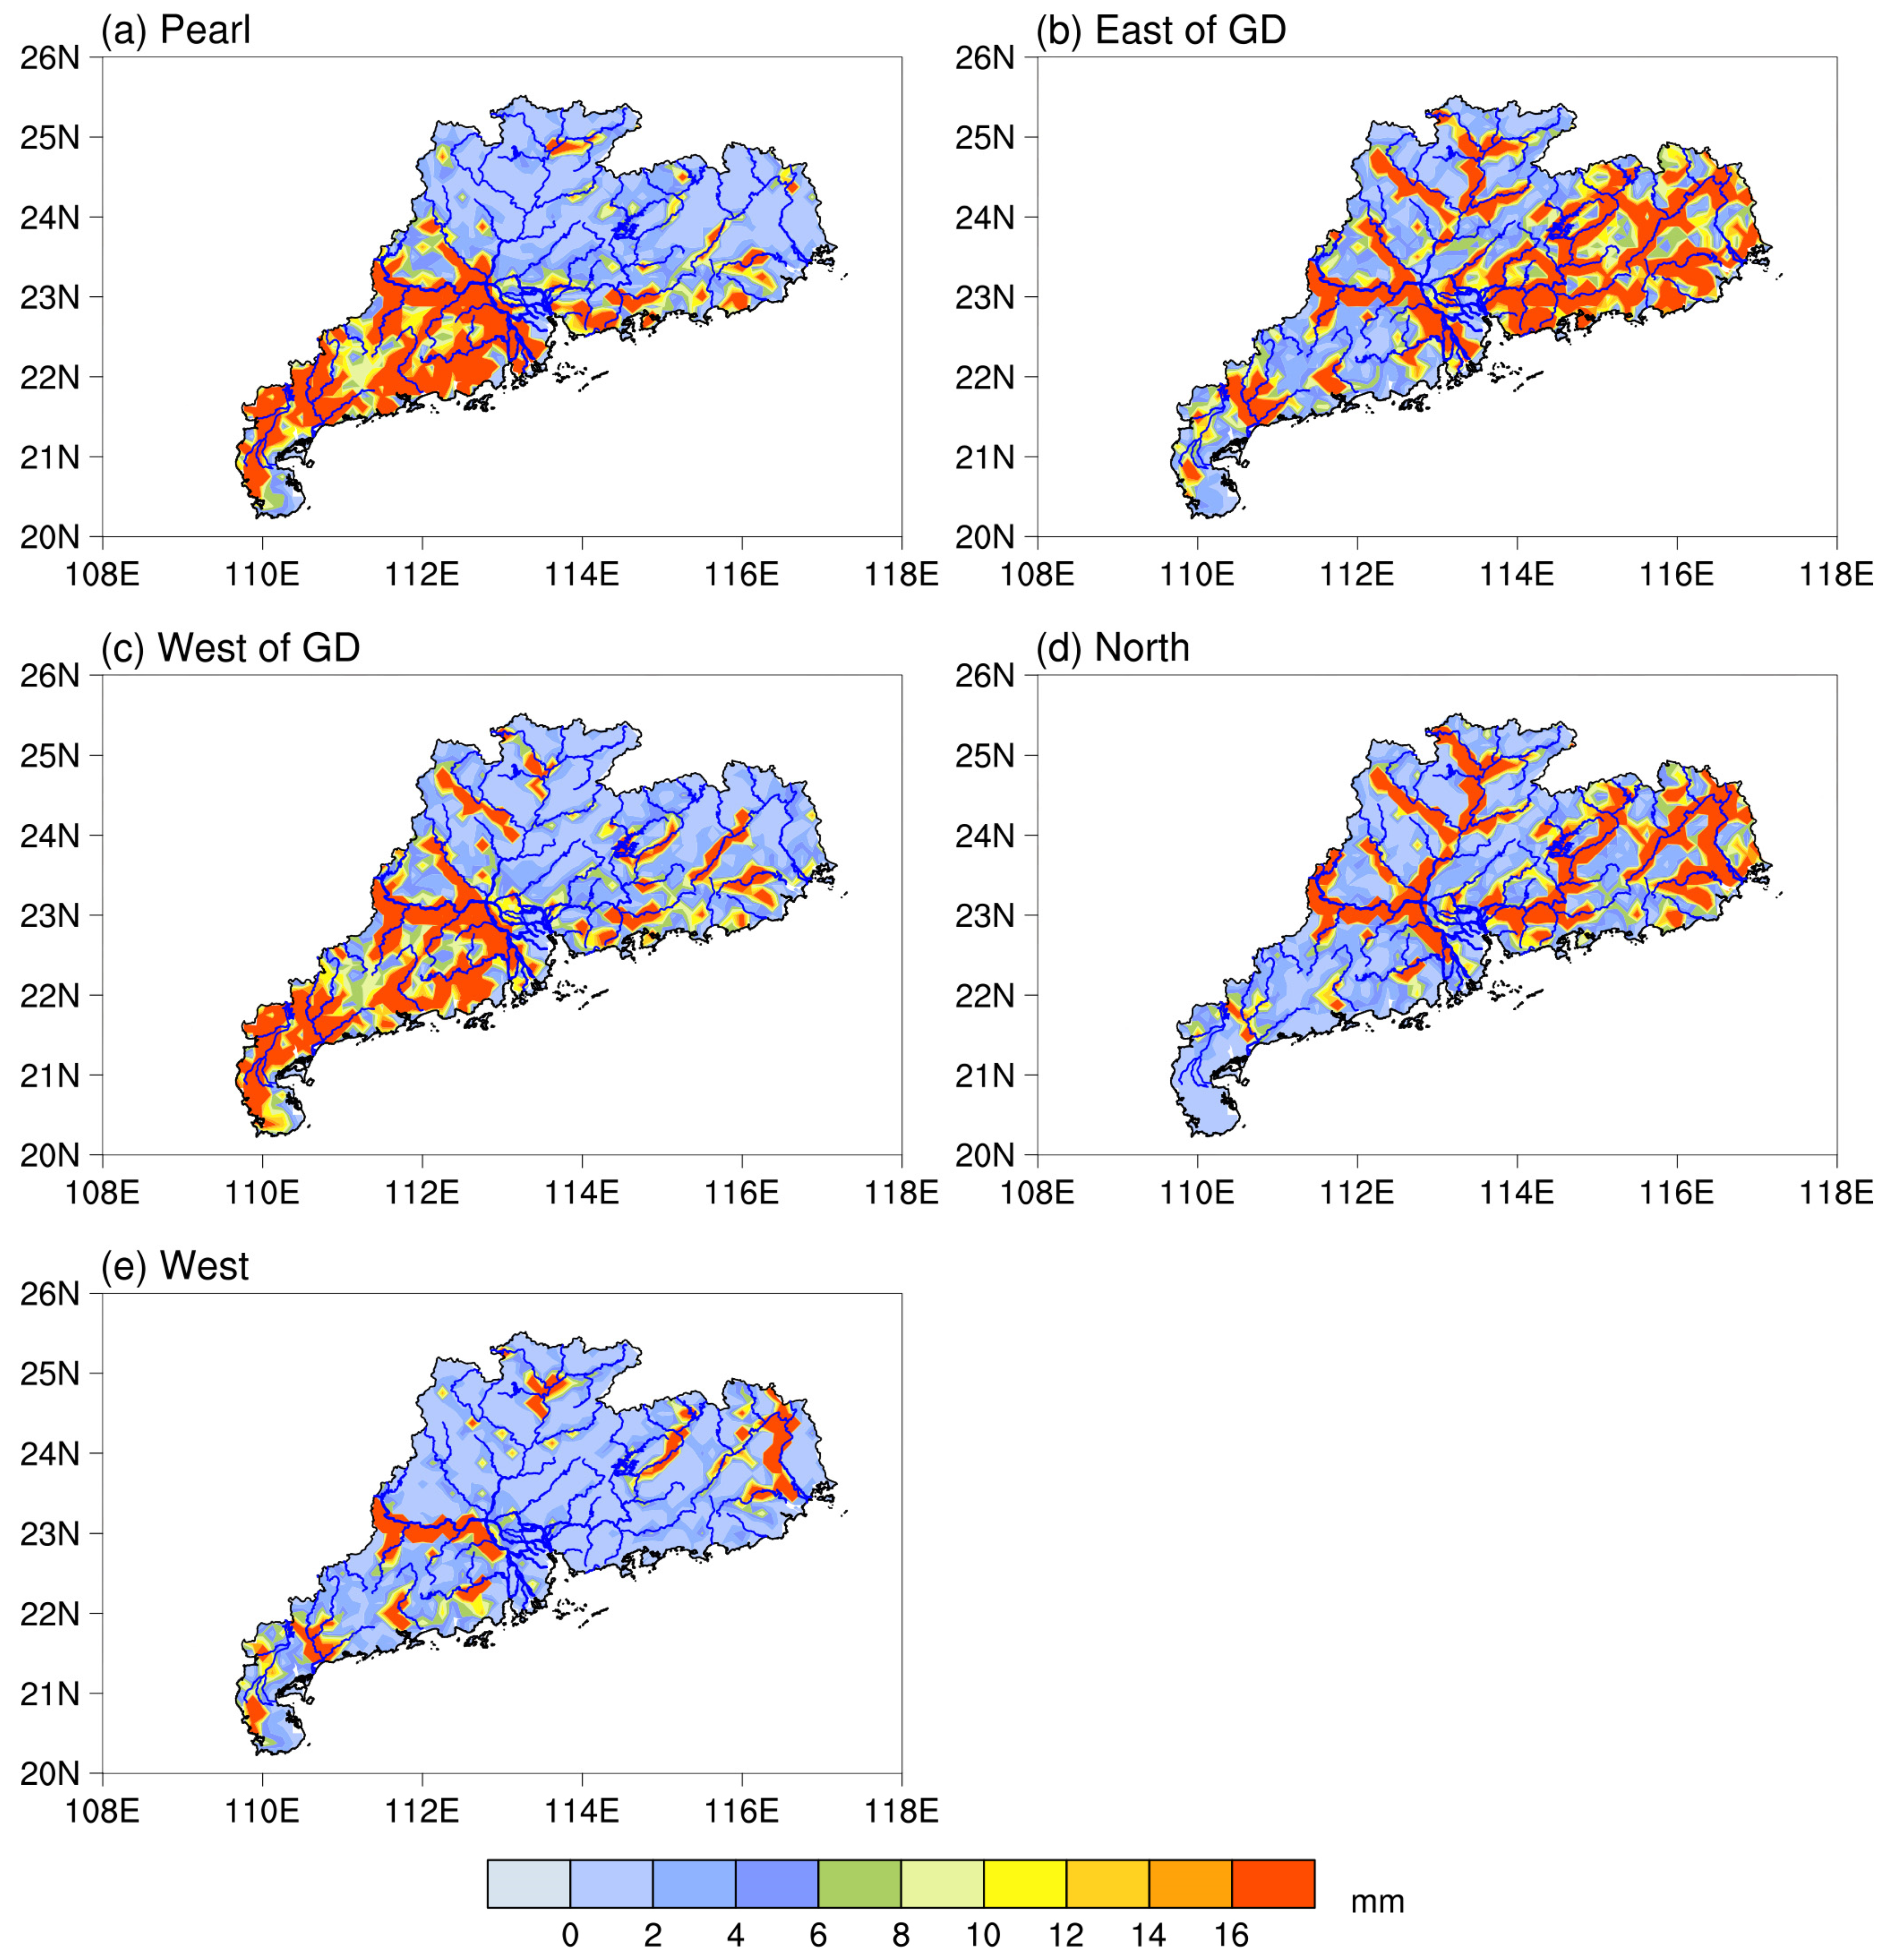
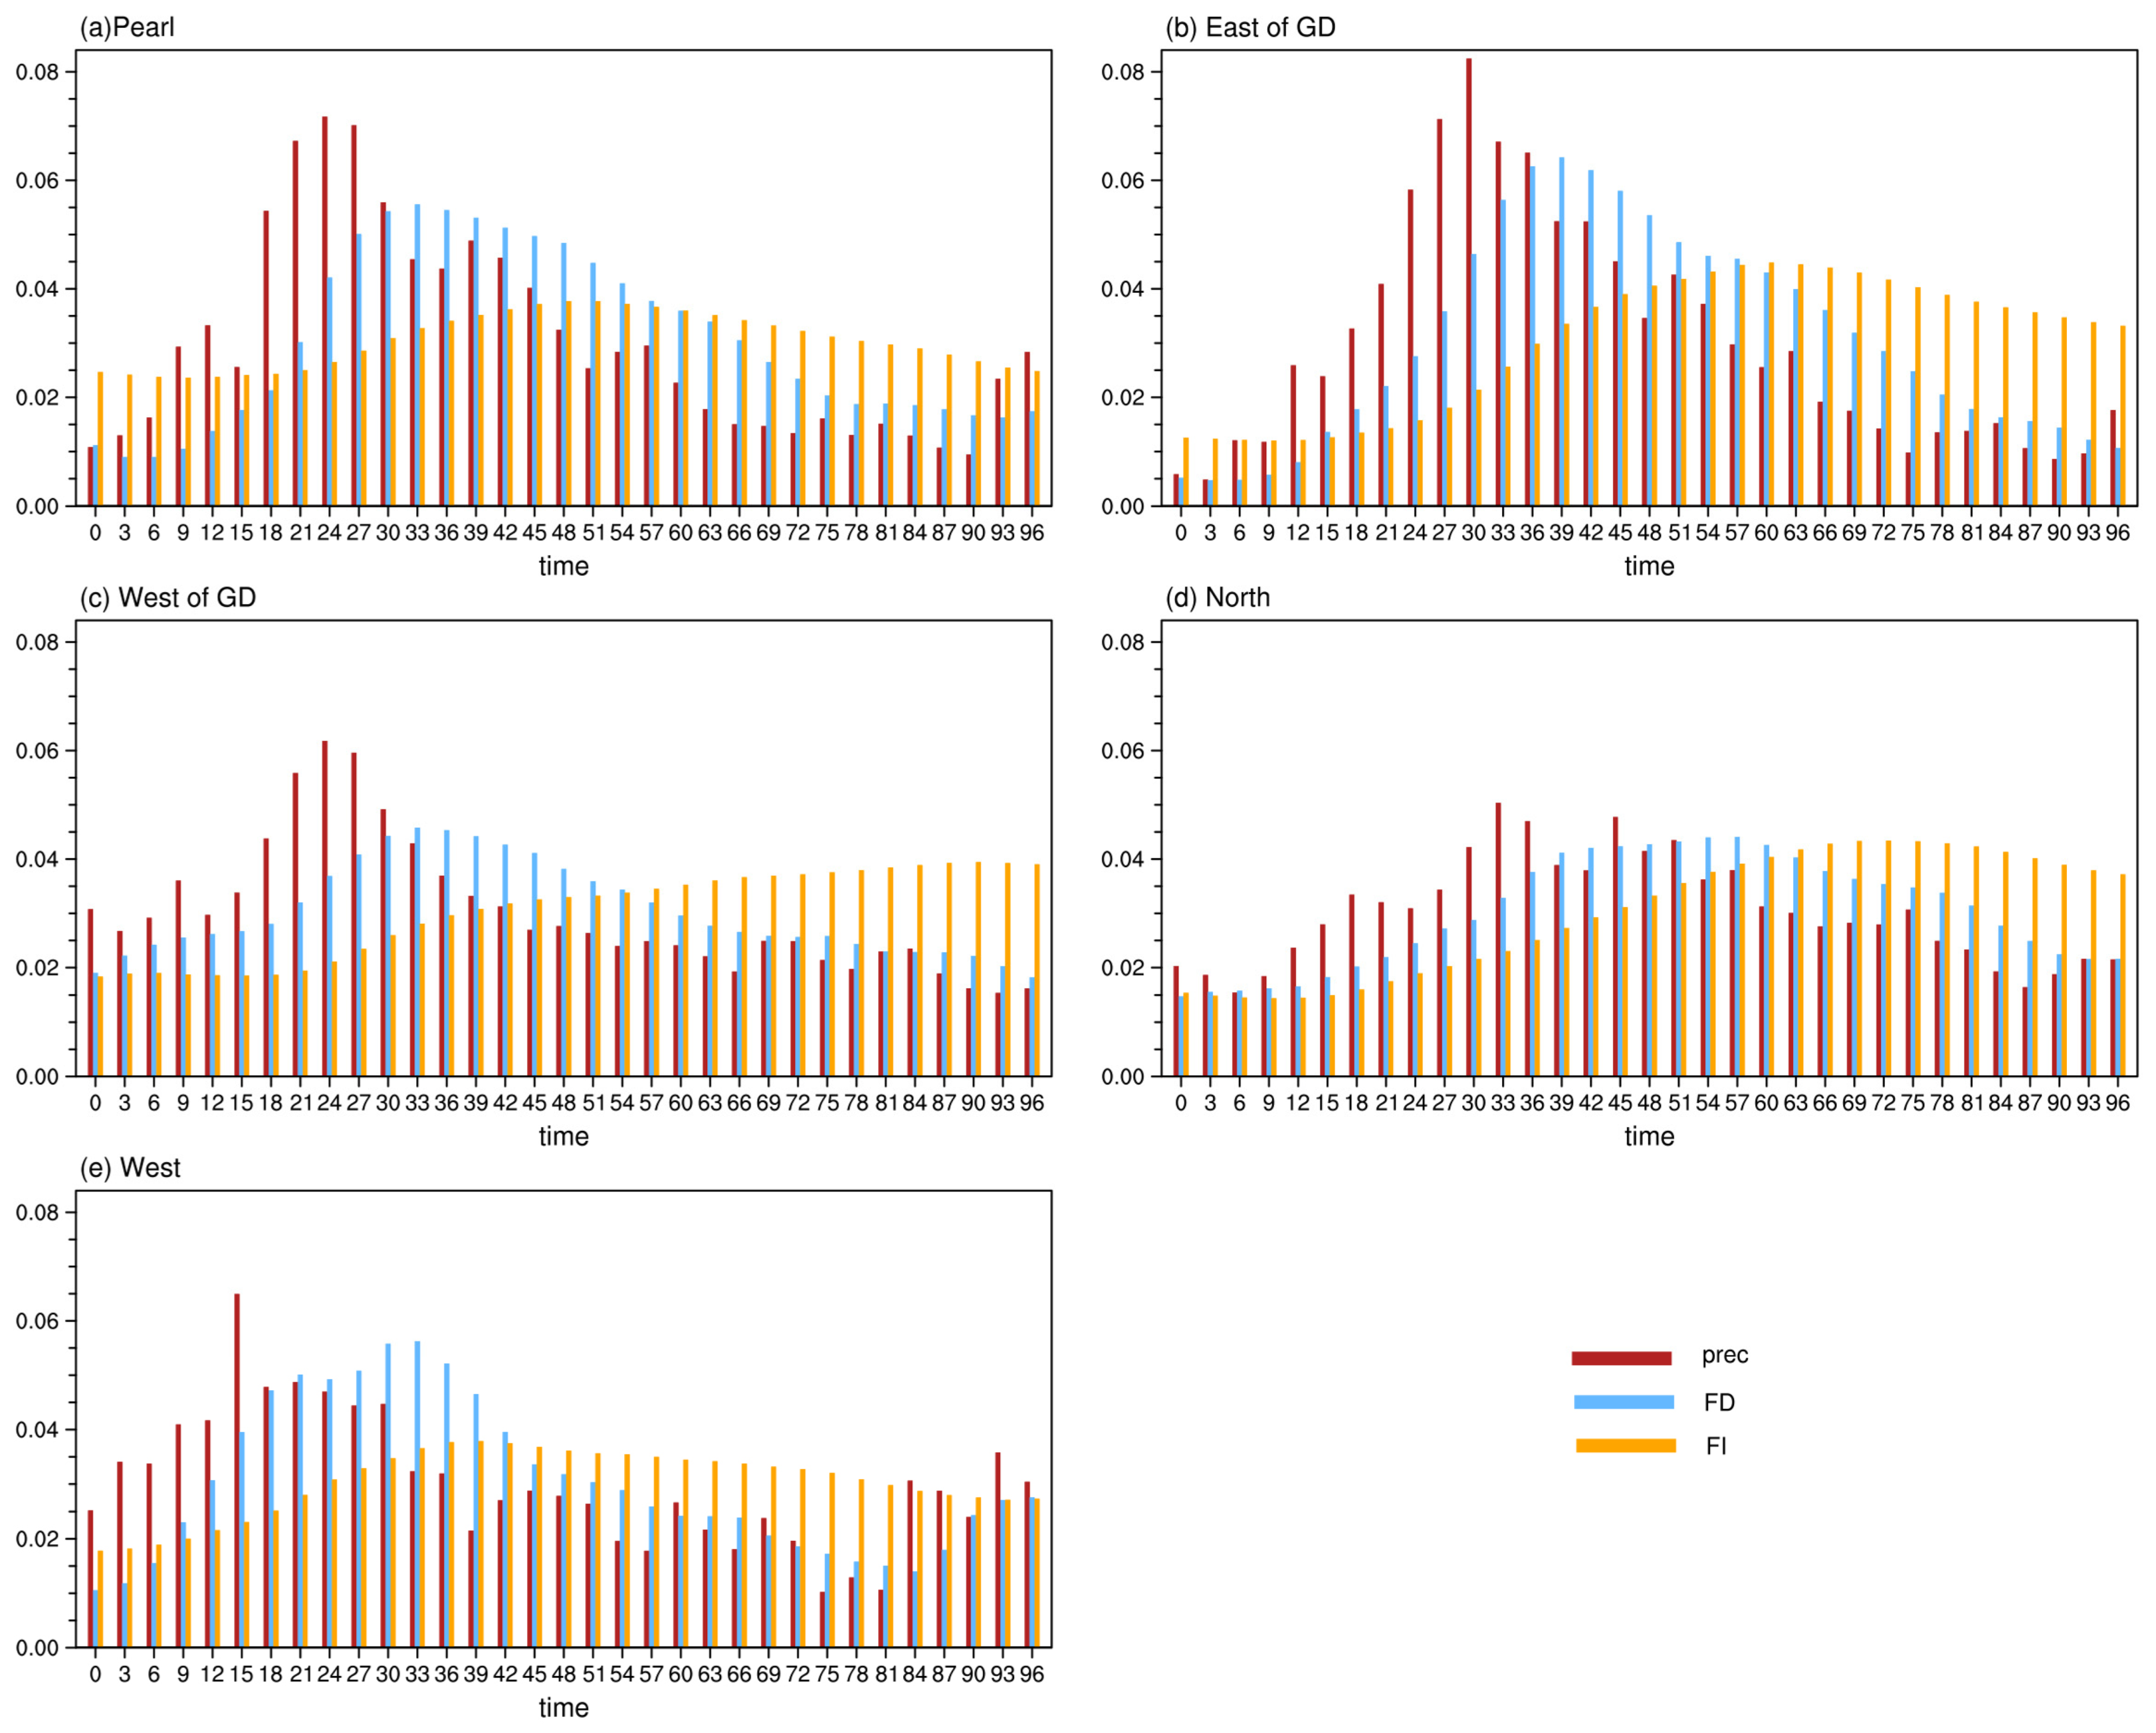
4.1. Spatial and Temporal Distribution of Precipitation and Floods during Typhoon Period
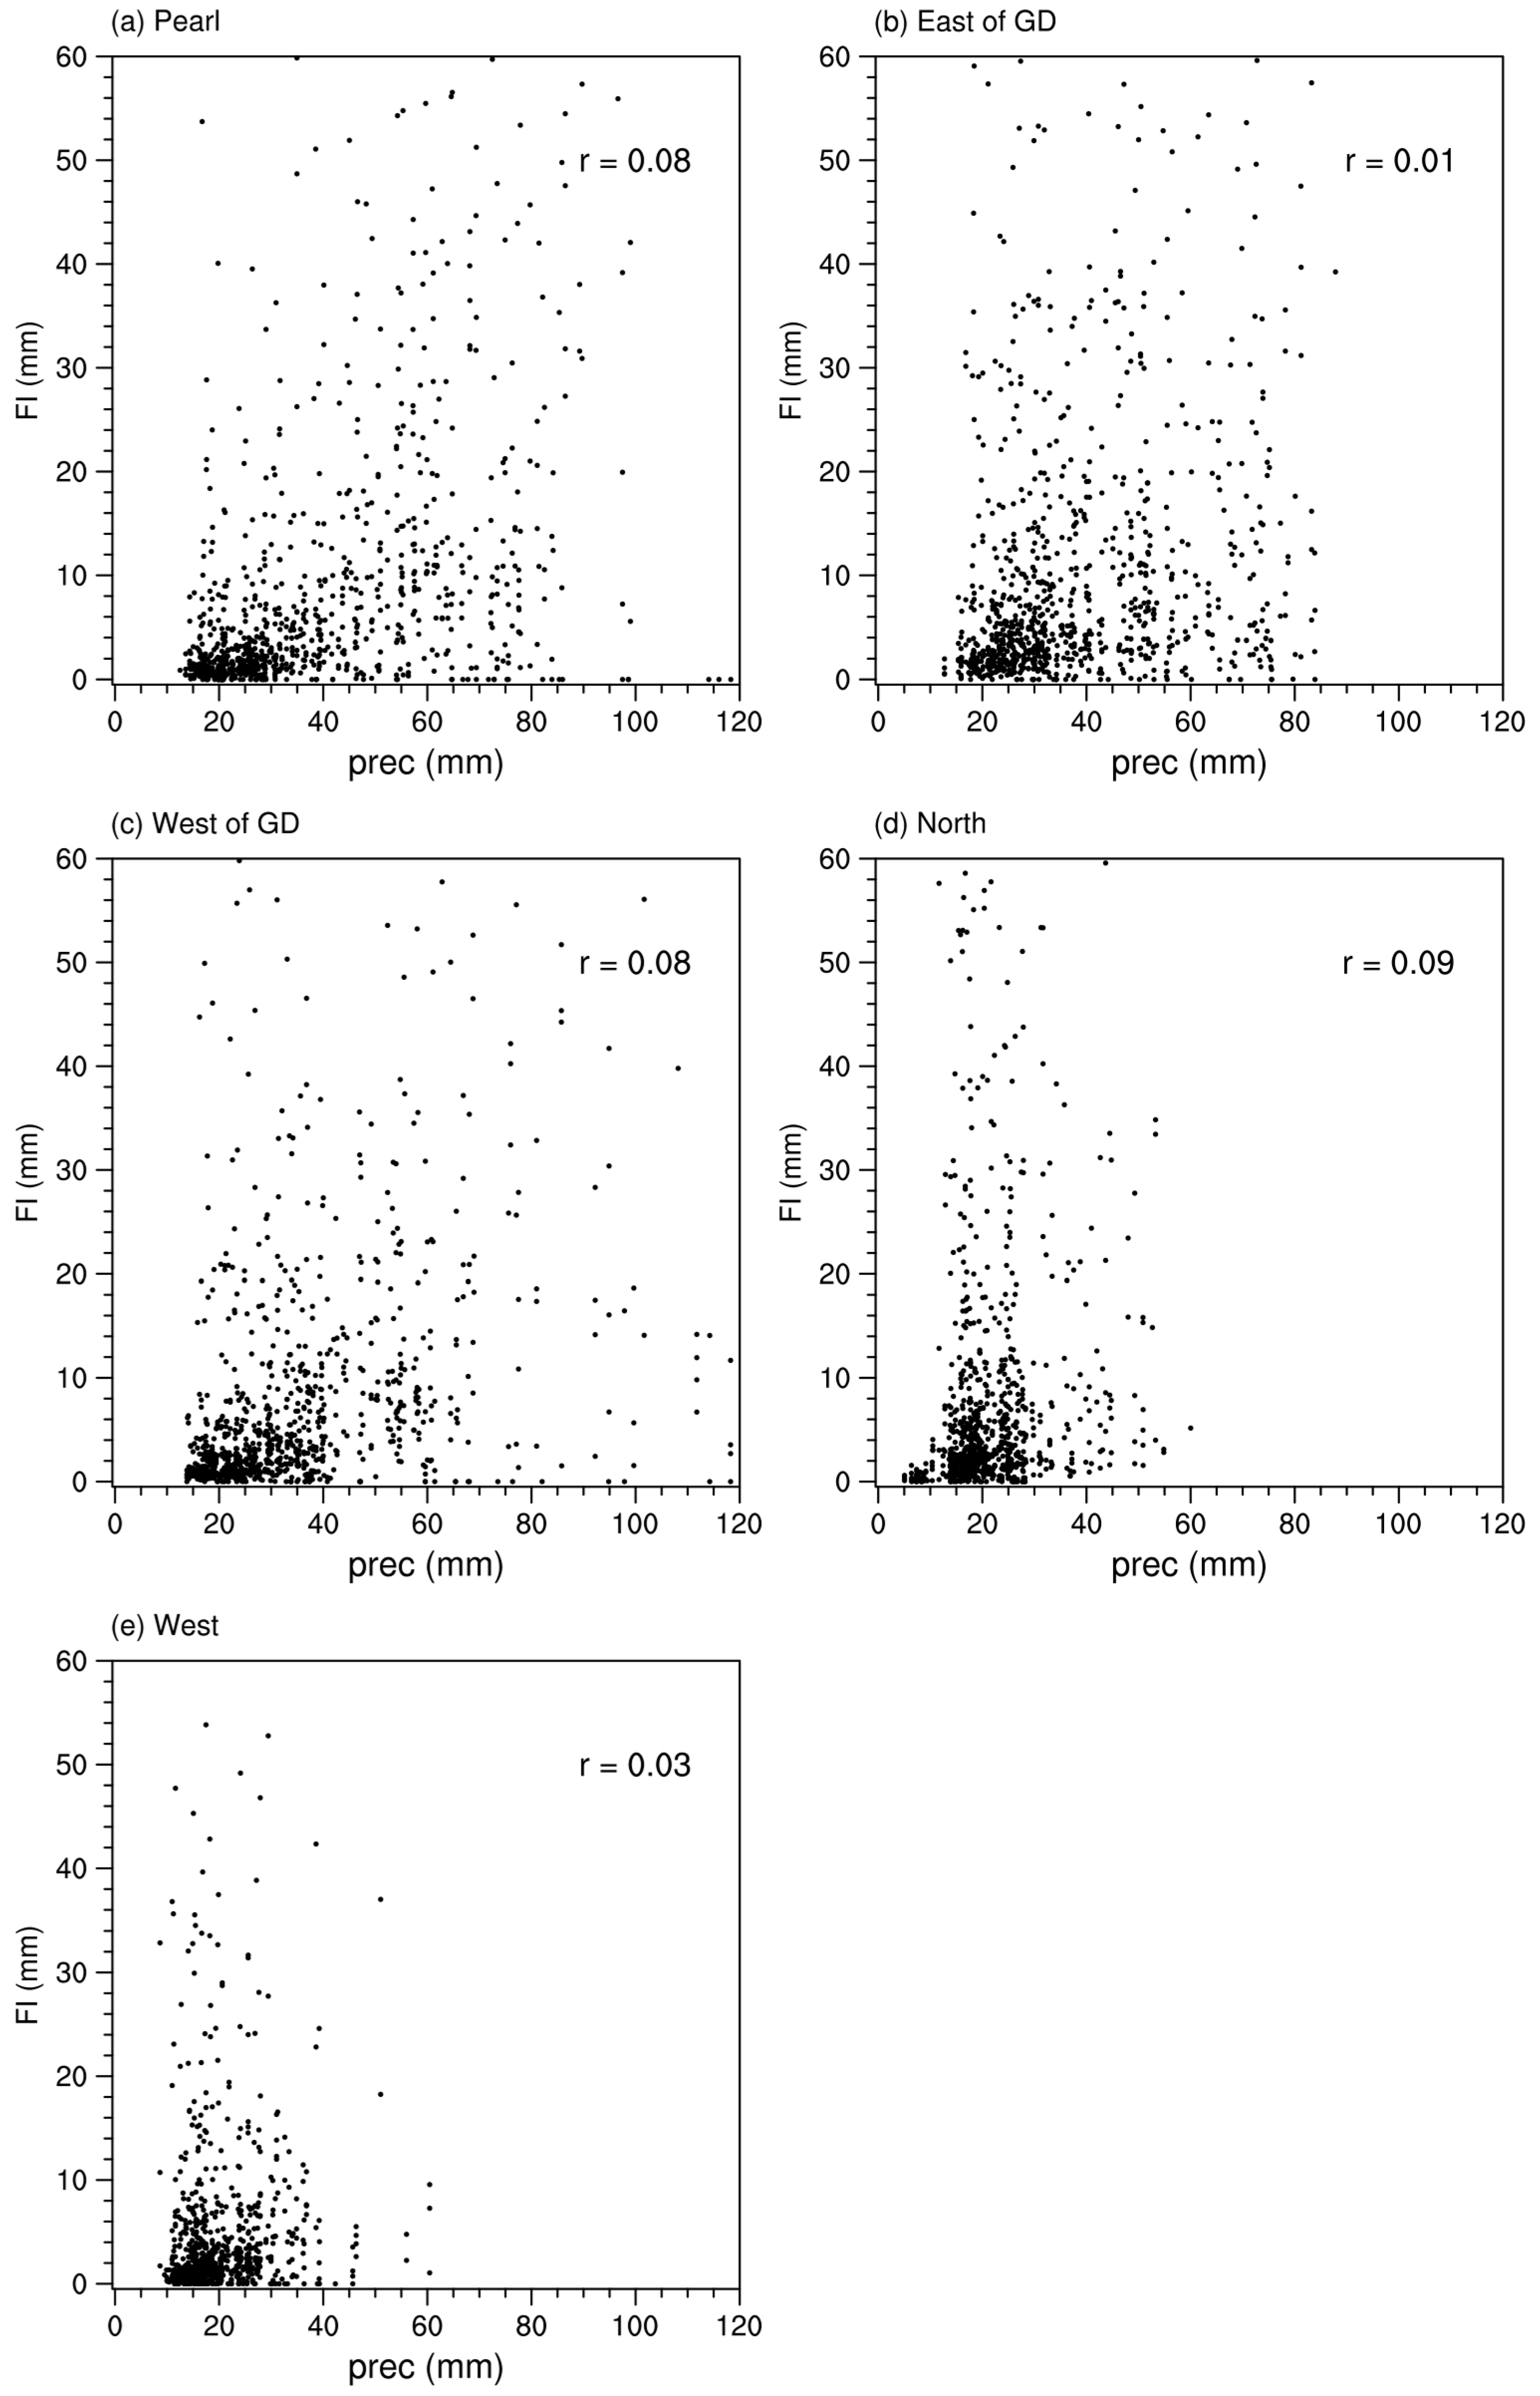
4.2. Correlations of Precipitation and Floods during the Typhoon Period
5. Discussion
6. Conclusions
Author Contributions
Funding
Conflicts of Interest
References
- Hoque, M.A.-A.; Phinn, S.; Roelfsema, C.; Childs, I. Assessing tropical cyclone risks using geospatial techniques. Appl. Geogr. 2018, 98, 22–33. [Google Scholar] [CrossRef]
- Nott, J. Palaeotempestology: The study of and implications Review article prehistoric tropical cyclones—A review for hazard assessment. Environ. Int. 2004, 30, 433–447. [Google Scholar] [CrossRef] [PubMed]
- Rumpf, J.; Weindl, H.; Höppe, P.; Rauch, E.; Schmidt, V. Tropical cyclone hazard assessment using model-based track simulation. Nat. Hazards 2009, 48, 383–398. [Google Scholar] [CrossRef]
- Huang, Y.; Cheng, H. The impact of climate change on coastal geological disasters in southeastern China. Nat. Hazards 2013, 65, 377–390. [Google Scholar] [CrossRef]
- Yu, J.-H.; Xue, H.-X.; Song, J. Tropical cyclone potential hazard in Southeast China and its linkage with the East Asian westerly jet. Asia-Pac. J. Atmos. Sci. 2017, 53, 295–304. [Google Scholar] [CrossRef]
- Yin, J.; Yin, Z.; Xu, S. Composite risk assessment of typhoon-induced disaster for China’s coastal area. Nat. Hazards 2013, 69, 1423–1434. [Google Scholar] [CrossRef]
- Ren, F.; Gleason, B.; Easterling, D. Typhoon impacts on China’s precipitation during 1957–1996. Adv. Atmos. Sci. 2002, 19, 943–952. [Google Scholar] [CrossRef]
- Chan, J.C.L.; Shi, J.E. Frequency of typhoon landfall over Guangdong Province of China during the period 1470–1931. Int. J. Climatol. 2000, 20, 183–190. [Google Scholar] [CrossRef]
- Zhang, Q.; Zhang, W.; Chen, Y.D.; Jiang, T. Flood, drought and typhoon disasters during the last half-century in the Guangdong province, China. Nat. Hazards 2011, 57, 267–278. [Google Scholar] [CrossRef]
- Reed, S.; Schaake, J.; Zhang, Z. A distributed hydrologic model and threshold frequency-based method for flash flood forecasting at ungauged locations. J. Hydrol. 2007, 337, 402–420. [Google Scholar] [CrossRef]
- Dutta, D.; Herath, S.; Musiake, K. Flood inundation simulation in a river basin using a physically based distributed hydrologic model. Hydrol. Processes 2000, 14, 497–519. [Google Scholar] [CrossRef]
- Yilmaz, K.K.; Adler, R.F.; Tian, Y.; Hong, Y.; Pierce, H.F. Evaluation of a satellite-based global flood monitoring system. Int. J. Remote Sens. 2010, 31, 3763–3782. [Google Scholar] [CrossRef]
- Wu, H.; Adler, R.F.; Tian, Y.; Huffman, G.J.; Li, H.; Wang, J. Real-time global flood estimation using satellite-based precipitation and a coupled land surface and routing model. Water Resour. Res. 2014, 50, 2693–2717. [Google Scholar] [CrossRef] [Green Version]
- Wu, H.; Adler, R.F.; Hong, Y.; Tian, Y.; Policelli, F. Evaluation of global flood detection using satellite-based rainfall and a hydrologic model. J. Hydrometeorol. 2012, 13, 1268–1284. [Google Scholar] [CrossRef]
- Wu, H.; Kimball, J.S.; Mantua, N.; Stanford, J. Automated upscaling of river networks for macroscale hydrological modeling. Water Resour. Res. 2011, 47, W03517. [Google Scholar] [CrossRef] [Green Version]
- Wu, H.; Kimball, J.S.; Elsner, M.M.; Mantua, N.; Adler, R.F.; Stanford, J. Projected climate change impacts on the hydrology and temperature of Pacific Northwest rivers. Water Resour. Res. 2012, 48, W11530. [Google Scholar] [CrossRef]
- Wu, H.; Kimball, J.S.; Li, H.; Huang, M.; Leung, L.R.; Adler, R.F. A new global river network database for macroscale hydrologic modeling. Water Resour. Res. 2012, 48, W09701. [Google Scholar] [CrossRef] [Green Version]
- Wu, H.; Adler, R.F.; Tian, Y.; Gu, G.; Huffman, G.J. Evaluation of quantitative precipitation estimations through hydrological modeling in IFloodS river basins. J. Hydrometeorol. 2017, 18, 529–553. [Google Scholar] [CrossRef]
- Li, M.; Shao, Q. An improved statistical approach to merge satellite rainfall estimates and raingauge data. J. Hydrol. 2010, 385, 51–64. [Google Scholar] [CrossRef]
- Zhang, J.; Howard, K.; Langston, C.; Vasiloff, S.; Kaney, B.; Arthur, A.; Van Cooten, S.; Kelleher, K.; Kitzmiller, D.; Ding, F.; et al. National Mosaic and Multi-Sensor QPE (NMQ) system: Description, results, and future plans. Bull. Am. Meteorol. Soc. 2011, 92, 1321–1338. [Google Scholar] [CrossRef] [Green Version]
- Nanding, N.; Rico-Ramirez, M.A. Precipitation Measurement with Weather Radars. In ICT for Smart Water Systems: Measurements and Data Science; Scozzari, A., Mounce, S., Han, D., Soldovieri, F., Solomatine, D., Eds.; Springer International Publishing: Cham, Switzerland, 2020; pp. 235–258. [Google Scholar]
- Nanding, N.; Rico-Ramirez, M.A.; Han, D. Rainfall-runoff modelling using merged rainfall from radar and raingauge measurements. In Proceedings of the Eighth European Conference on Radar in Meteorology and Hydrology (ERAD), Garmisch-Partenkirchen, Germany, 1 September 2014; pp. 1–6. [Google Scholar]
- Nanding, N.; Rico-Ramirez, M.A.; Han, D. Comparison of different radar-raingauge rainfall merging techniques. J. Hydroinformatics 2015, 17, 422–445. [Google Scholar] [CrossRef]
- Nanding, N.; Rico-Ramirez, M.A.; Han, D.; Wu, H.; Dai, Q.; Zhang, J. Uncertainty assessment of radar-raingauge merged rainfall estimates in river discharge simulations. J. Hydrol. 2021, 603, 127093. [Google Scholar] [CrossRef]
- Harris, A.; Rahman, S.; Hossain, F.; Yarbrough, L.; Bagtzoglou, A.; Easson, G. Satellite-based Flood Modeling Using TRMM-based Rainfall Products. Sensors 2007, 7, 3416–3427. [Google Scholar] [CrossRef] [PubMed] [Green Version]
- Su, F.; Gao, H.; Huffman, G.J.; Lettenmaier, D.P. Potential Utility of the Real-Time TMPA-RT Precipitation Estimates in Streamflow Prediction. J. Hydrometeorol. 2011, 12, 444–455. [Google Scholar] [CrossRef] [Green Version]
- Huffman, G.J.; Bolvin, D.T.; Nelkin, E.J.; Wolff, D.B.; Adler, R.F.; Gu, G.; Hong, Y.; Bowman, K.P.; Stocker, E.F. The TRMM Multisatellite Precipitation Analysis (TMPA): Quasi-global, multiyear, combined-sensor precipitation estimates at fine scales. J. Hydrometeorol. 2007, 8, 38–55. [Google Scholar] [CrossRef]
- Liang, X.; Lettenmaier, D.P.; Wood, E.F.; Burges, S.J. A simple hydrologically based model of land surface water and energy fluxes for GSMs. J. Geophys. Res. 1994, 99, 14415–14428. [Google Scholar] [CrossRef]
- Liang, X.; Wood, E.; Lettenmaier, D.P. Surface soil moisture parameterization of the VIC-2L model: Evaluation and modification. Glob. Planet. Chang. 1996, 13, 195–206. [Google Scholar] [CrossRef]
- Storck, P.; Lettenmaier, D.P.; Bolton, S.M. Measurement of snow interception and canopy effects on snow accumulation and melt in a mountainous maritime climate, Oregon, United States. Water Resour. Res. 2002, 38, 5-1–5-16. [Google Scholar] [CrossRef] [Green Version]
- Cherkauer, K.A.; Lettenmaier, D.P. Hydrologic effects of frozen soils in the upper Mississippi River basin. J. Geophys. Res. Earth Surf. 1999, 104, 19599–19610. [Google Scholar] [CrossRef]
- Christensen, N.S.; Wood, A.W.; Voisin, N.; Lettenmaier, D.P.; Palmer, R.N. The Effects of Climate Change on the Hydrology and Water Resources of the Colorado River Basin. Clim. Chang. 2004, 62, 337–363. [Google Scholar] [CrossRef]
- Christensen, N.S.; Lettenmaier, D.P. A multimodel ensemble approach to assessment of climate change impacts on the hydrology and water resources of the Colorado River Basin. Hydrol. Earth Syst. Sci. 2007, 11, 1417–1434. [Google Scholar] [CrossRef] [Green Version]
- Hamlet, A.F.; Mote, P.W.; Clark, M.P.; Lettenmaier, D.P. Effects of Temperature and Precipitation Variability on Snowpack Trends in the Western United States. J. Clim. 2005, 18, 4545–4561. [Google Scholar] [CrossRef]
- Zhao, R.J.; Liu, X.R. The Xinanjiang Model. In Computer Models of Watershed Hydrology; Singh, V.P., Ed.; Water Resources Publication: Denver, CO, USA, 1995; pp. 215–232. [Google Scholar]
- Huang, Z.; Wu, H.; Adler, R.F.; Schumann, G.; Gourley, J.J.; Kettner, A.; Nanding, N. Multisourced Flood Inventories over the Contiguous United States for Actual and Natural Conditions. Bull. Am. Meteorol. Soc. 2021, 102, E1133–E1149. [Google Scholar] [CrossRef]
- Nanding, N.; Wu, H.; Tao, J.; Maggioni, V.; Beck, H.E.; Zhou, N.; Huang, M.; Huang, Z. Assessment of Precipitation Error Propagation in Discharge Simulations over the Contiguous United States. J. Hydrometeorol. 2021, 22, 1987–2008. [Google Scholar] [CrossRef]
- Gelaro, R.; McCarty, W.; Suárez, M.J.; Todling, R.; Molod, A.; Takacs, L.; Randles, C.A.; Darmenov, A.; Bosilovich, M.G.; Reichle, R.; et al. The Modern-Era Retrospective Analysis for Research and Applications, Version 2 (MERRA-2). J. Clim. 2017, 30, 5419–5454. [Google Scholar] [CrossRef]
- Yan, Y.; Wu, H.; Gu, G.; Huang, Z.; Alfieri, L.; Li, X.; Nanding, N.; Pan, X.; Tang, Q. Climatology and Interannual Variability of Floods during the TRMM Era (1998–2013). J. Clim. 2020, 33, 3289–3305. [Google Scholar] [CrossRef]
- Yan, Y.; Wu, H.; Gu, G.; Ward, P.J.; Luo, L.; Li, X.; Huang, Z.; Tao, J. Exploring the ENSO impact on Basin-scale floods using hydrological simulations and TRMM precipitation. Geophys. Res. Lett. 2020, 47, e2020GL089476. [Google Scholar] [CrossRef]
- Ying, M.; Zhang, W.; Yu, H.; Lu, X.; Feng, J.; Fan, Y.; Zhu, Y.; Chen, D. An Overview of the China Meteorological Administration Tropical Cyclone Database. J. Atmos. Ocean. Technol. 2014, 31, 287–301. [Google Scholar] [CrossRef] [Green Version]
- Lu, X.; Yu, H.; Ying, M.; Zhao, B.; Zhang, S.; Lin, L.; Bai, L.; Wan, R. Western North Pacific Tropical Cyclone Database Created by the China Meteorological Administration. Adv. Atmos. Sci. 2021, 38, 690–699. [Google Scholar] [CrossRef]
- Nash, J.E.; Sutcliffe, J.V. River flow forecasting through conceptual models part I—A discussion of principles. J. Hydrol. 1970, 10, 282–290. [Google Scholar] [CrossRef]
- Moriasi, D.N.; Arnold, J.G.; Van Liew, M.W.; Bingner, R.L.; Harmel, R.D.; Veith, T.L. Model evaluation guidelines for systematic quantification of accuracy in watershed simulations. Trans. ASABE 2007, 50, 885–900. [Google Scholar] [CrossRef]
- Gutierrez-Lopez, A. Regionalization of hurricane rainfall in the forests, protected and reserved zones of Mexico. Land Degrad. Dev. 2021, 32, 5203–5215. [Google Scholar] [CrossRef]
- Trošelj, J.; Lee, H.S. Modelling typhoon-induced extreme river discharges: A case study of Typhoon Hagibis in Japan. J. Hydrol. Reg. Stud. 2021, 34, 100776. [Google Scholar] [CrossRef]
- Jaimes, M.A.; Niño, M.; Huerta, B. Hurricane event-based method to create regional hazard maps for heavy rainfall-induced translational landslides. Nat. Hazards 2015, 76, 1143–1161. [Google Scholar] [CrossRef]
- Peng, Y.; Wang, Q.; Wang, H.; Lin, Y.; Song, J.; Cui, T.; Fan, M. Does landscape pattern influence the intensity of drought and flood? Ecol. Indic. 2019, 103, 173–181. [Google Scholar] [CrossRef]
- Fang, X.; Thompson, D.B.; Cleveland, T.G.; Pradhan, P.; Malla, R. Time of concentration estimated using watershed parameters determined by automated and manual methods. J. Irrig. Drain. Eng. 2008, 134, 202–211. [Google Scholar] [CrossRef]
- Dykstra, S.L.; Dzwonkowski, B. The Role of Intensifying Precipitation on Coastal River Flooding and Compound River‐Storm Surge Events, Northeast Gulf of Mexico. Water Resour. Res. 2021, 57, e2020WR029363. [Google Scholar]


Publisher’s Note: MDPI stays neutral with regard to jurisdictional claims in published maps and institutional affiliations. |
© 2022 by the authors. Licensee MDPI, Basel, Switzerland. This article is an open access article distributed under the terms and conditions of the Creative Commons Attribution (CC BY) license (https://creativecommons.org/licenses/by/4.0/).
Share and Cite
Yan, Y.; Wang, G.; Wu, H.; Gu, G.; Nanding, N. Characteristics of Precipitation and Floods during Typhoons in Guangdong Province. Remote Sens. 2022, 14, 1945. https://doi.org/10.3390/rs14081945
Yan Y, Wang G, Wu H, Gu G, Nanding N. Characteristics of Precipitation and Floods during Typhoons in Guangdong Province. Remote Sensing. 2022; 14(8):1945. https://doi.org/10.3390/rs14081945
Chicago/Turabian StyleYan, Yan, Guihua Wang, Huan Wu, Guojun Gu, and Nergui Nanding. 2022. "Characteristics of Precipitation and Floods during Typhoons in Guangdong Province" Remote Sensing 14, no. 8: 1945. https://doi.org/10.3390/rs14081945
APA StyleYan, Y., Wang, G., Wu, H., Gu, G., & Nanding, N. (2022). Characteristics of Precipitation and Floods during Typhoons in Guangdong Province. Remote Sensing, 14(8), 1945. https://doi.org/10.3390/rs14081945