Article

A Lightweight Position-Enhanced Anchor-Free Algorithm for SAR Ship Detection

1
Information Materials and Intelligent Sensing Laboratory of Anhui Province, Anhui University, Hefei 230601, China
2
Key Laboratory of Intelligent Computing and Signal Processing of Ministry of Education, School of Electronics and Information Engineering, Anhui University, Hefei 230601, China
3
38th Research Institute of China Electronics Technology Group Corporation, Hefei 230601, China
4
National Lab of Radar Signal Processing, Xidian University, Xi’an 710071, China
5
Collaborative Innovation Center of Information Sensing and Understanding, Xidian University, Xi’an 710071, China
*
Author to whom correspondence should be addressed.
Jie Chen is Member of IEEE; Zhixiang Huang is Senior Member of IEEE; Mengdao Xing is Fellow of IEEE.
Remote Sens. 2022, 14(8), 1908; https://doi.org/10.3390/rs14081908
Submission received: 6 March 2022 / Revised: 7 April 2022 / Accepted: 13 April 2022 / Published: 15 April 2022
(This article belongs to the Special Issue Synthetic Aperture Radar (SAR) Meets Deep Learning)

Abstract

:
As an active microwave device, synthetic aperture radar (SAR) uses the backscatter of objects for imaging. SAR image ship targets are characterized by unclear contour information, a complex background and strong scattering. Existing deep learning detection algorithms derived from anchor-based methods mostly rely on expert experience to set a series of hyperparameters, and it is difficult to characterize the unique characteristics of SAR image ship targets, which greatly limits detection accuracy and speed. Therefore, this paper proposes a new lightweight position-enhanced anchor-free SAR ship detection algorithm called LPEDet. First, to resolve unclear SAR target contours and multiscale performance problems, we used YOLOX as the benchmark framework and redesigned the lightweight multiscale backbone, called NLCNet, which balances detection speed and accuracy. Second, for the strong scattering characteristics of the SAR target, we designed a new position-enhanced attention strategy, which suppresses background clutter by adding position information to the channel attention that highlights the target information to more accurately identify and locate the target. The experimental results for two large-scale SAR target detection datasets, SSDD and HRSID, show that our method achieves a higher detection accuracy and a faster detection speed than state-of-the-art SAR target detection methods.

1. Introduction

SAR is one of the main ways of imaging Earth’s surface for civilian and military research purposes at any time of day and is not affected by the weather or other imaging characteristics. With rapid updates of tools, information and technology, a large number of SAR images have been obtained. Due to the particularities of SAR imaging, the artificial interpretation of SAR images is a time-consuming and labor-intensive process and so a considerable amount of data have not been fully utilized. SAR image target detection aims to automatically locate and identify specific targets from images and has wide application prospects in real life. For example, in a military context, location detection of specific military targets is conducive to tactical deployment and coastal defense early warning capabilities. In a civil context, the detection of smuggling and illegal fishing vessels is helpful for the monitoring and management of maritime transport.
Since optical images are widely used in daily life, many researchers have developed numerous target detection algorithms based on optical images, but there are relatively few studies on SAR images. Due to the long imaging wavelength and complex imaging mechanism of SAR images, their targets are discontinuous; that is, they are composed of multiple discrete and irregular bright spots of scattering centers. Therefore, SAR images are difficult to interpret intuitively. At the same time, SAR images have the characteristics of an uneven target distribution and great sparsity. These characteristics make SAR image target detection very different from common optical image target detection. When target detection models used for optical images are directly used for SAR image detection without considering the particularity of SAR images, the advantages of the algorithm are not fully manifested. The development of SAR image target detection technology can be introduced via the following two aspects: traditional SAR target detection and SAR ship detection using deep learning.
Traditional SAR image target detection algorithms mainly include the constant false alarm rate (CFAR) [1] detection algorithm based on the background clutter statistical distribution and artificial image texture feature detection algorithms. The method based on the CFAR uses the background units around the target and selects the constant false alarm probability to determine the detection threshold. There are two main reasons for its poor detection rate: one is that the same statistical model is used for all the clutter in the sliding window, which easily leads to a mismatch of the statistical model in the maladaptive regions. Second, the algorithm does not make full use of the feature information in the image, but only uses the statistical distribution characteristics of the image gray values. Huang et al. [2] proposed a CFAR algorithm based on target semantic features, which has a lower false alarm rate when detecting targets in high-resolution SAR images. The detection algorithm based on artificial extraction of image texture features has good performance for some kinds of target detection; however, in the case of large differences in target features, the performance drops significantly. Stein et al. [3] proposed a target detection method based on the rotation-invariant wavelet transform. Compared with the CFAR detection algorithm, the texture feature-based algorithm utilizes more image information and has higher detection accuracy. However, texture features need to be extracted by manual design, and the design process is complicated and time-consuming, so it is difficult to ensure the timeliness of detection.
SAR ship detection methods based on deep learning have become a research priority and a large number of methods based on convolutional neural networks have emerged. Zhang et al. [4] proposed a learning mechanism for marine balanced scenes when the number of SAR image samples was extremely unbalanced and which extracted features from images by establishing a generative adversarial network, using the k-means algorithm for clustering and expansion of the number of samples to train the mode. The model has achieved good results. The lightweight SAR ship detector “ShipDeNet-20” [5] greatly reduces the size of the model and combines the feature fusion, feature enhancement and scale sharing feature pyramid modules to further improve the accuracy, which is conducive to hardware transplantation. HyperLi-Net [6] achieves high accuracy and high speed in SAR image ship detection. The high accuracy is achieved by the multi-receptive field, dilated convolution, channel and spatial attention, feature fusion and feature pyramid modules. High speed is achieved by fusion of region-free models, small kernels, narrow channels, separable convolutions and batch normalization. Its model is also more lightweight, which is more conducive to hardware porting. Tz et al. [7] solved the four imbalance problems in the SAR ship detection process and proposed corresponding solutions, which were combined into the model to obtain a new balanced learning network. Zhang et al. [8] mainly used depth-wise separable convolution to constitute a new SAR ship detection method. By integrating the multi-scale detection, connection and anchor box mechanisms, this method makes the model more lightweight and the detection speed is also improved to a certain extent. Zhang et al. [9] gridded the input image and used depthwise separable convolution operations. The backbone convolutional neural network and the detection convolutional neural network are combined to form a new grid convolutional neural network, which has achieved good results in SAR ship detection. RetinaNet [10] is essentially composed of resnet + FPN + two FCN sub-networks. The design idea is that the backbone selects effective feature extraction networks such as vgg and resnet. FPN is intended to strengthen the use of multi-scale features formed in resnet, to obtain a feature map with stronger expressiveness and include multi-scale target area information, and finally use two FCN sub-networks with the same structure but no shared parameters on the feature map set of FPN so as to complete the target box category classification and bbox position regression tasks. The SSD [11] model completely eliminates proposal generation and subsequent pixel or feature resampling stages and encapsulates all computations in a single network. This makes SSD easy to train and directly integrated into systems that require detection components. The core of the SSD approach is to use small convolutional filters to predict class scores and position offsets for a fixed set of default bounding boxes on the feature map. The network model of YOLOv3 [12] is mainly composed of 75 convolutional layers. Since the fully connected layer is not used, the network can correspond to input images of any size. In addition, the pooling layer does not appear in YOLOv3. Instead, the stride of the convolutional base layer is set to 2 to achieve the effect of down sampling and the scale-invariant features are transferred to the next layer. In addition, YOLOv3 also uses structures similar to ResNet and FPN networks, which are also beneficial for improving detection accuracy. YOLOv3 is mainly aimed at small targets and the accuracy has been significantly improved. YOLOX [13] is the first model to apply the anchor-free mode in the YOLO series. The specific operation is to explicitly define the 3 × 3 region of the truth frame projected to the center of the feature graph as the positive sample region and predict the four values of the target position (the offset distance of the upper left corner and the height and width of the frame). The AFSar [14] network model redesigns the backbone network, replaces the original Darknet-53 with MobileNetV2 and improves it. At the same time, the detection head and neck are newly designed, making it a lightweight network model. The RFB-net [15] algorithm introduces a receptive field block (RFB) into the SSD [11] network and strengthens the feature extraction ability, influenced by the way the human visual system works.
In summary, the following problems still need to be resolved:
(1)
The existing algorithms of SAR image detection are mainly based on the design of anchors. However, setting the hyperparameters of an anchor heavily relies on human experience and a generated anchor greatly reduces model training speed. In addition, a detection algorithm with anchors mostly focuses on the capture of target edge information, while the unclear contour information of SAR images, especially with respect to small- and medium-sized SAR targets, greatly limits its detection efficiency.
(2)
In order to further improve accuracy, most of the existing work blindly adds model structure and skills, resulting in a large number of model parameters, slow inference speed and low efficiency in practical applications, which is not conducive to the deployment of a model using mobile devices and greatly reduces the practicality of the model.
(3)
The existing work does not consider the scattering of SAR images and the unclear target profile, which results in an algorithm being unable to better suppress the background clutter to emphasize the salient information of the target, which greatly reduces model performance.
To this end, we propose a new lightweight position-enhanced anchor-free SAR ship detection algorithm called LPEDet which improves the accuracy and speed of SAR ship detection from a more balanced perspective. The main contributions are as follows:
(1)
To solve the problems that occur because anchor-based detection algorithms are highly dependent on design frameworks based on expert experience and the difficulties that occur in solving problems such as unclear contour information and complex backgrounds of SAR image ship targets, we introduced an anchor-free target detection algorithm. We introduced the latest YOLOX as the base network and, inspired by the latest lightweight backbone, LCNet [16], replaced the backbone Darknet-53 with LCNet and then optimized the design according to the SAR target characteristics.
(2)
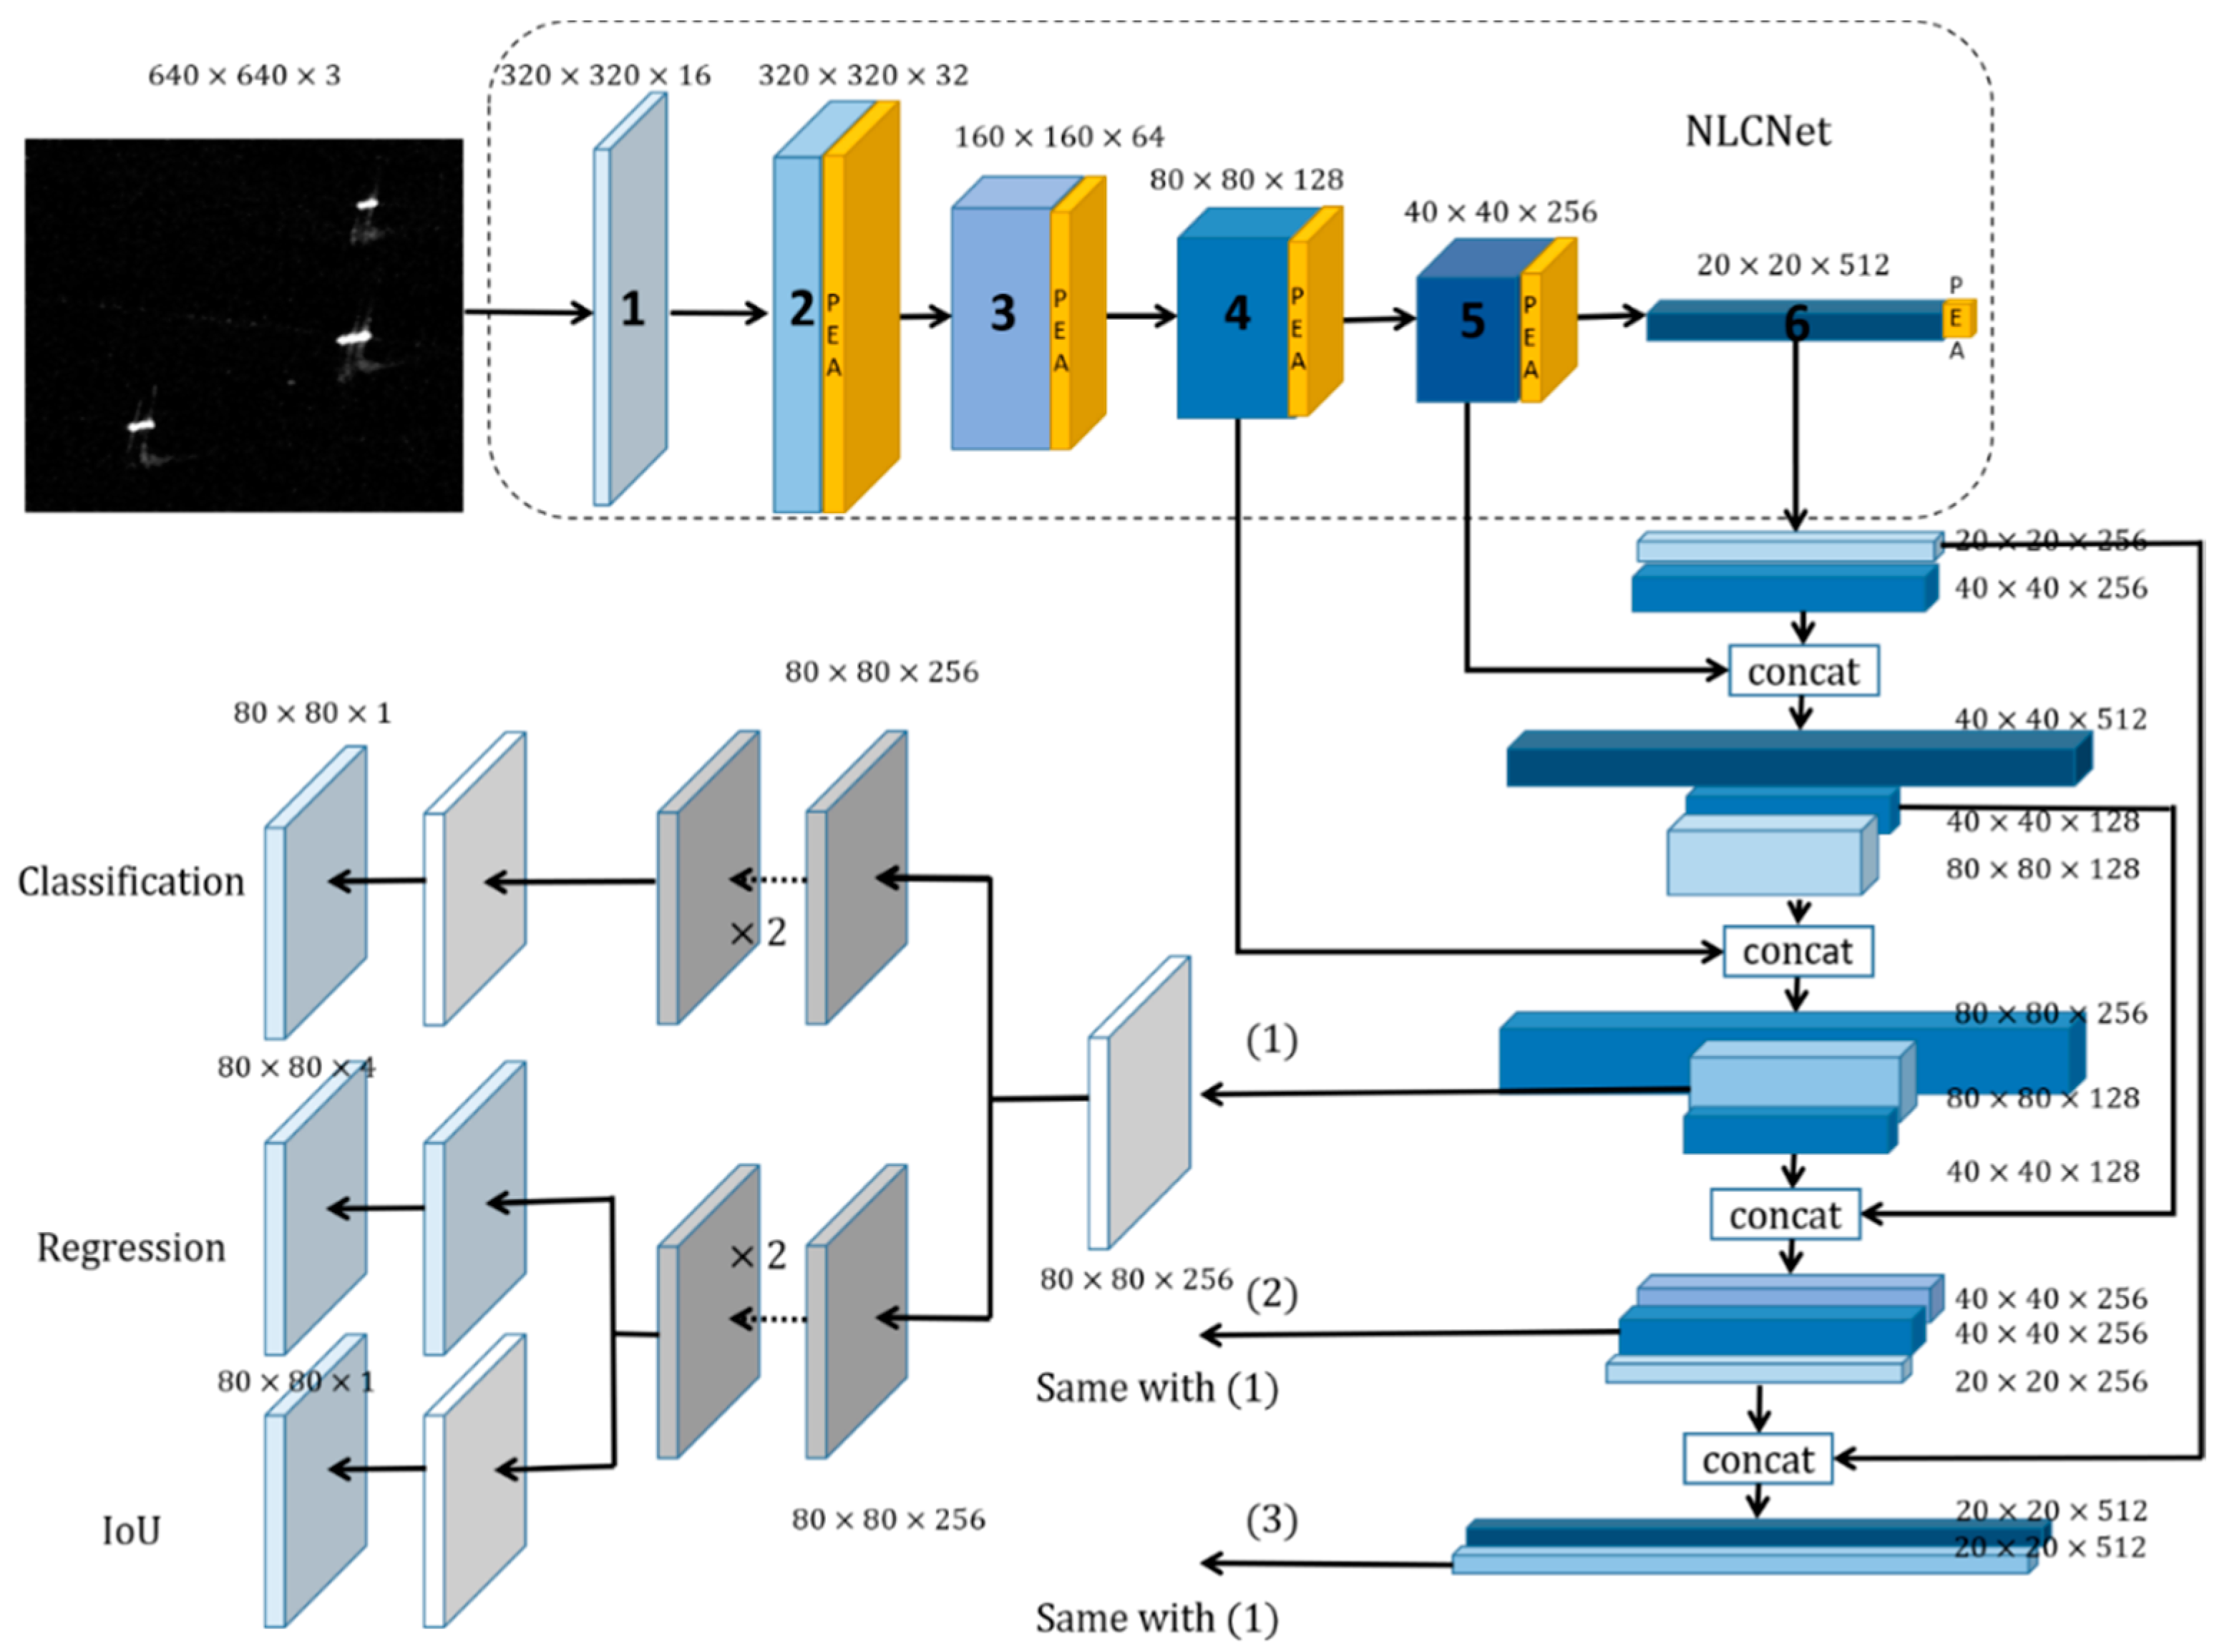
To balance speed and model complexity, we constructed a new lightweight backbone called NLCNet through the ingenious design of depthwise separable convolutional modules and the novel structural construction of multiple modules. Experiments show that our proposed lightweight backbone greatly improved inference speed and detection accuracy.
(3)
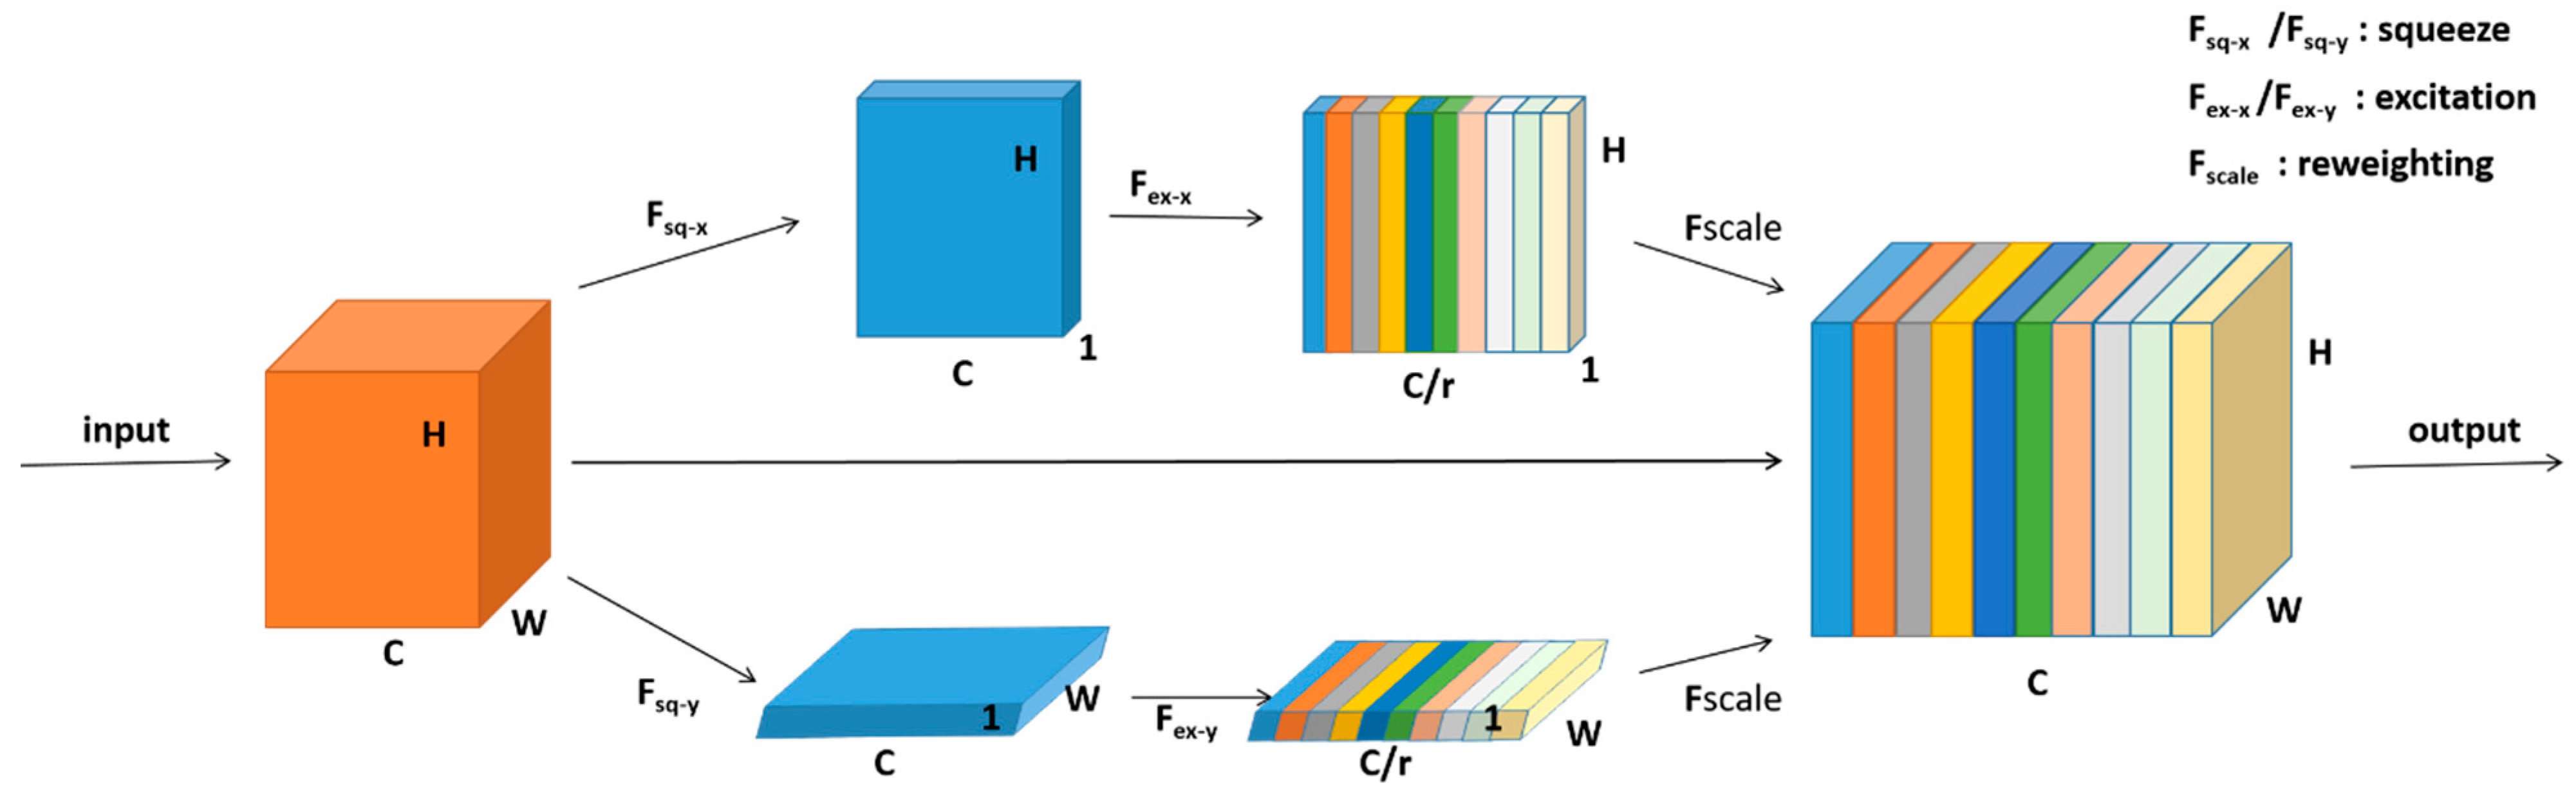
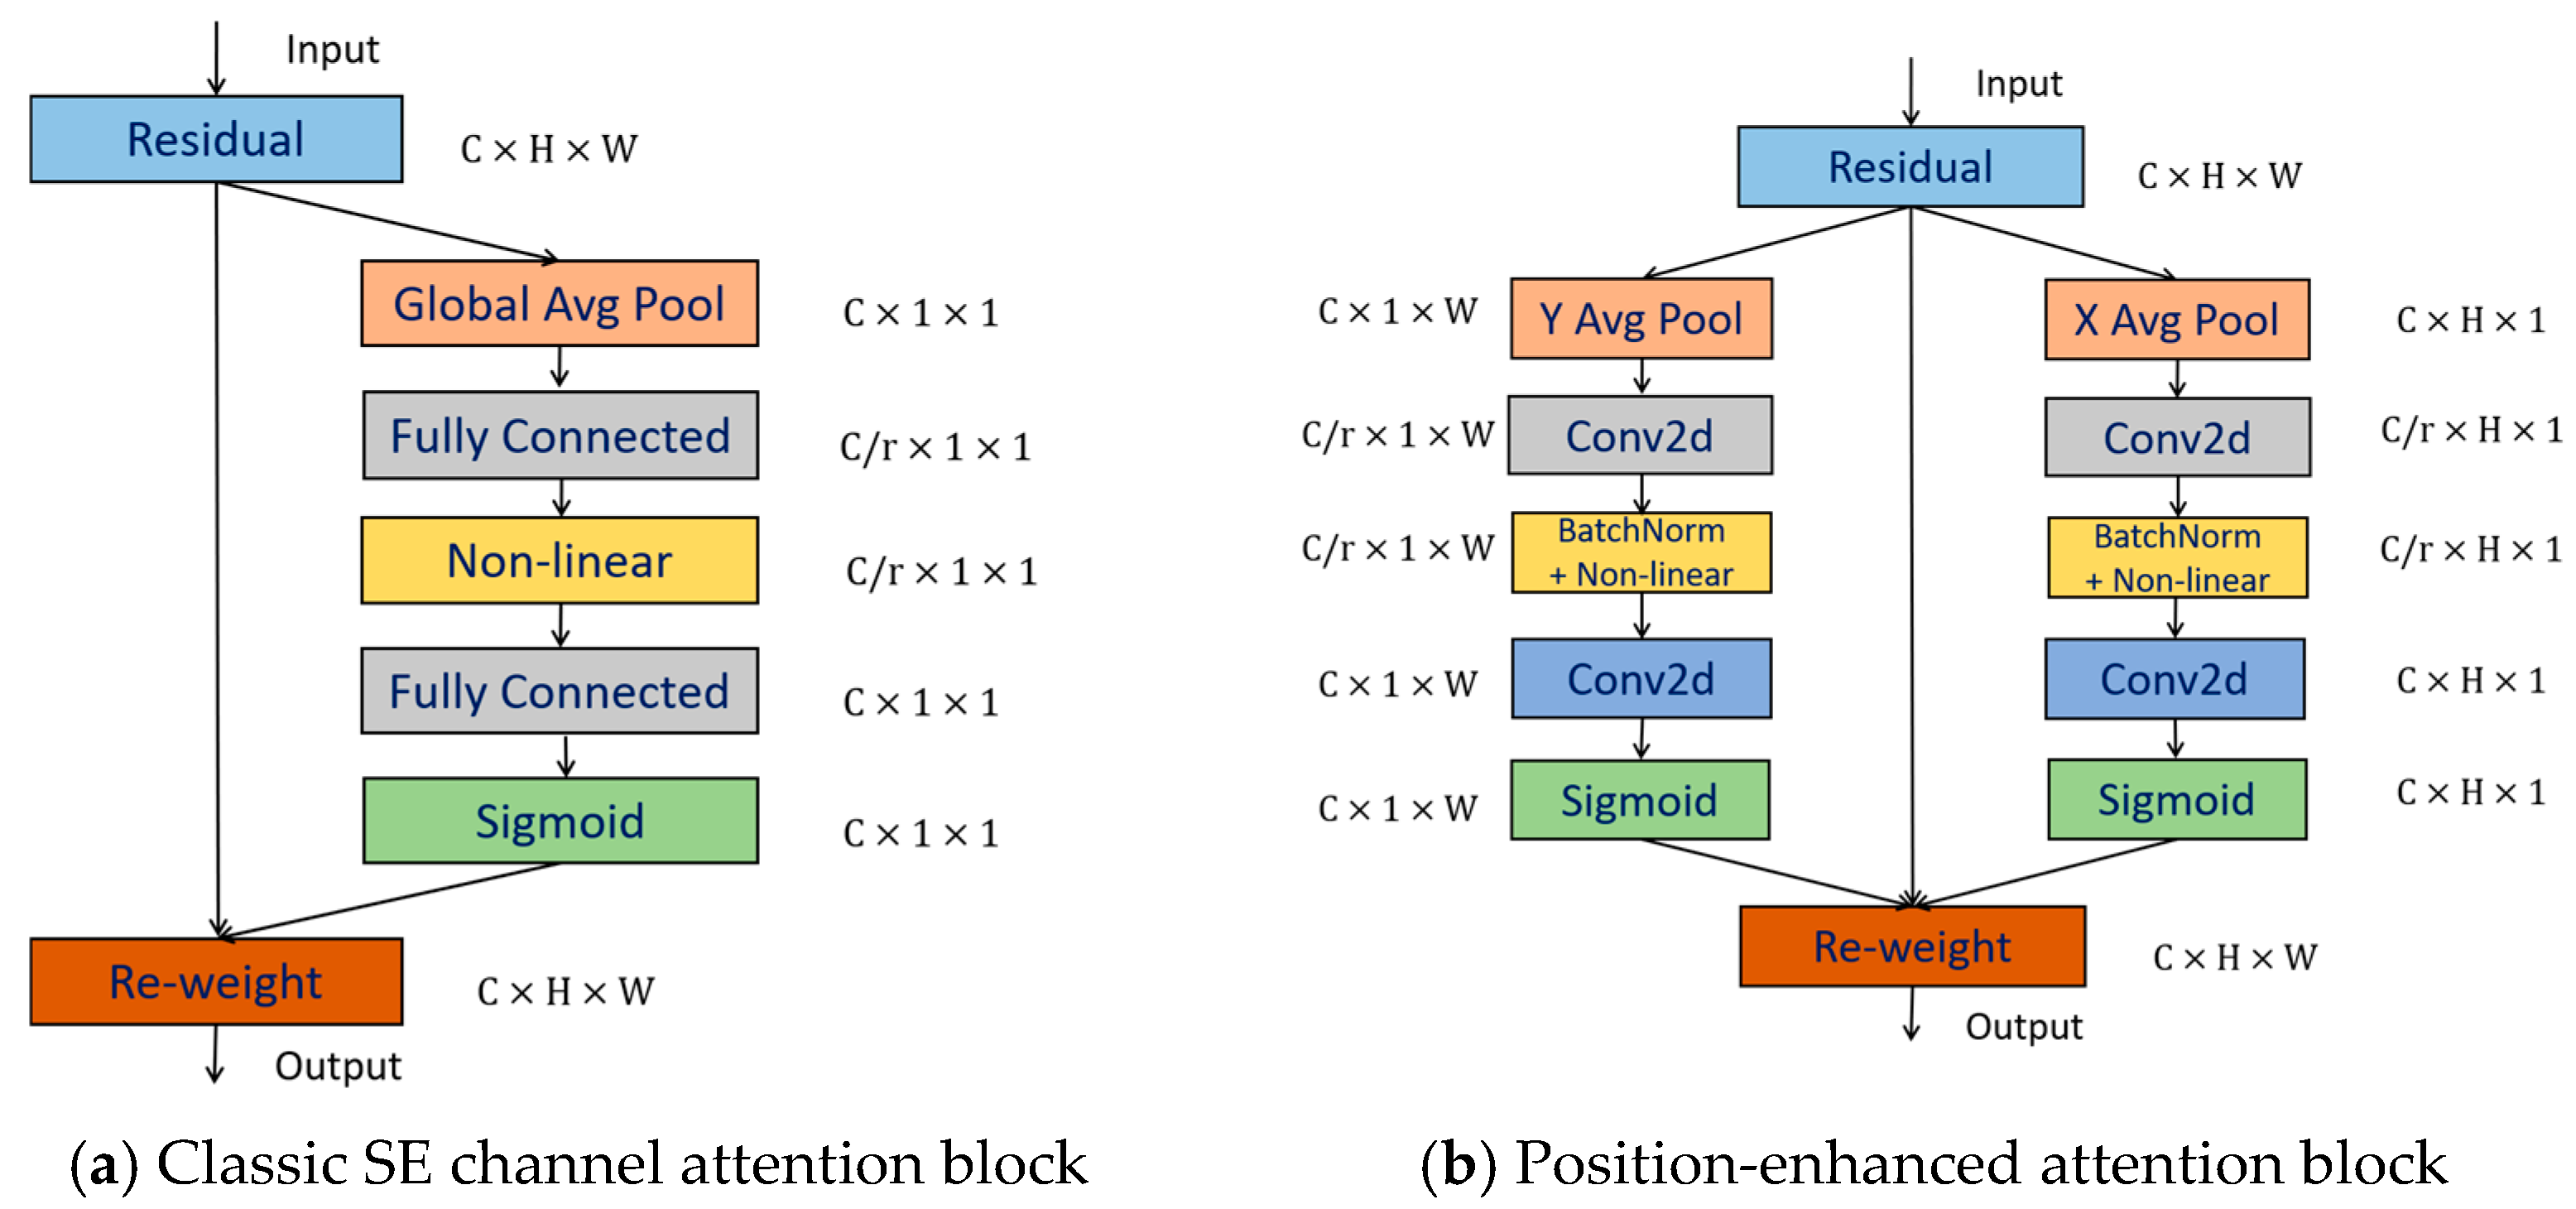
In order to improve the SAR target localization ability against complex backgrounds, inspired by coordinate attention [17], we designed a position-enhanced attention strategy. The strategy is to add target position awareness information to guide attention to better highlight the target area, effectively suppress the problem of insufficient feature extraction caused by SAR target strong scattering and better detect targets against complex backgrounds, thereby improving detection accuracy.

2. Related Work

The development process for SAR image target detection technology ranges from traditional SAR target detection to SAR target detection using deep learning. In the target detection task based on deep learning, the main task of target detection is to take the image as the input and output the characteristic image of the corresponding input image through the backbone network. Therefore, the performance of target detection is closely related to the feature extraction of the backbone network. Many studies have designed different feature extraction backbone networks for different application scenarios and detection tasks.
(1)
Traditional SAR target detection algorithm.
The traditional SAR target detection algorithm is as follows. Ai et al. [18] proposed a joint CFAR detection algorithm based on gray correlation by utilizing the strong correlation characteristics of adjacent pixels inside the target SAR images. The CFAR algorithm only considers the gray contrast and ignores target structure information, which causes poor robustness and anti-interference ability and poor detection performance under complex background clutter. Kaplan et al. [19] used the extended fractal (EF) feature to detect vehicle targets in SAR images. This feature is sensitive not only to the contrast of the target background but also to the target size. Compared with the CFAR algorithm, the false alarm rate of detection is reduced. Charalampidis [20] proposed the wavelet fractal (WF) feature, which can effectively segment and classify different textures in images.
(2)
Common SAR image backbone networks based on deep learning.
It can be seen from VGG [21] that a deeper network can be formed by stacking modules with the same dimension. For a given receptive field, it is shown that compared with using a large convolution kernel for convolution, the effect of using a stacked small convolution kernel is preferable. GoogLeNet [22] adopts a modular structure (inception structure) to enrich network receptive fields with convolutional kernels of different sizes. ShuffleNetV1 [23] and ShuffleNetV2 [24] adopt two core operations: pointwise group convolution and channel shuffling, and they exchange information through channel shuffling. GhostNet [25] divides the original convolution layer into two parts. First, a traditional convolution operation is applied to the input to generate feature maps, then these feature maps are transformed using a linear operation, merging all the features together to get the final result. In DarkNet-53, the poolless layer, the fully connected layer and the reduction of the feature graph are achieved by increasing the step size of the convolution kernel. Using the idea of feature pyramid networks (FPNs), the outputs of three scale feature layers are 13 × 13, 26 × 26 and 52 × 52. Among them, 13 × 13 is suitable for detecting large targets and 52 × 52 is suitable for detecting small targets. Although the above backbone network greatly improves detection accuracy, it also introduces a large number of parameters into the model and the detection speed is relatively slow. MobileNetV1 [26] constructed a network by utilizing depth-separable convolution, which consists of two steps: depthwise convolution and pointwise convolution. MobileNetV2 [27] introduced a residual structure on the basis of MobileNetV1, which first raised the dimension and then reduced the dimension. Although the model is lightweight, it is suitable only for large models and it provides no significant improvement in accuracy in small networks. The characteristic of a remote sensing image target is density and it is difficult to distinguish between target contours and the background environment. A new algorithm [28] is proposed for the above difficulties which can also be used for video target recognition. It mainly uses the visual saliency mechanism to extract the target of the region of interest and experiments show the effectiveness of its results. In addition to SAR image target detection, the research on images captured by UAVs should continue to advance because the use of UAV images for target detection has broad application prospects in real life. The target detection of UAV images is the subject of [29], which combines the deep learning target detection method with existing template matching and proposes a parallel integrated deep learning algorithm for multi-target detection.
(3)
SAR image detection algorithm based on deep learning.
Jiao et al. [30] considered that the multi-scale nature of SAR image ship targets and the background complexity of offshore ship targets were not conducive to monitoring and the authors innovatively proposed a model based on the faster-RCNN framework. Improvements have been made and a new training strategy has also been proposed so that the training process focuses less on simple targets and is more suitable for the detection of ship targets with complex backgrounds in SAR images, improving detection performance and thereby solving the problem of multiple scales and multiple scenes. Chen et al. [31] mainly focused on indistinguishable ships on land and densely arranged ships at sea and combined a model with an attention mechanism. The purpose was to better solve the above two problems frequently encountered in ship target detection. The application of an attention mechanism can better enable the location of the ship targets we need to detect. At the same time, the loss function is also improved, that is, generalized cross loss is introduced, and soft non-maximum suppression is also used in the model. Therefore, the problem of densely arranged ship targets can be better solved and detection performance can be improved. Cui et al. [32] considered the multi-scale problem of ship targets in SAR images and used a densely connected pyramid structure in their model. At the same time, a convolution block attention module was used to refine the feature map, highlight the salient features, suppress the fuzzy features and effectively improve the accuracy of the SAR image ship target. Although the above algorithms generally have high detection accuracy, model size is large, inference speed is slow and they do not take the characteristics of SAR images into account, which greatly limits the performance of these algorithms. Wan et al. [14] proposed an anchor-free SAR ship detection algorithm, the backbone network of which is the more lightweight MobileNetV2S network, and further improved the neck and head, so that the overall model effect is optimal. However, their improved strategy did not fully consider the characteristics of SAR targets against complex backgrounds, which is an issue worthy of further exploration.
Therefore, we propose a new SAR image detection method that comprehensively considers the tradeoff between algorithm accuracy and speed.

3. Methods

This paper proposes a position-enhanced anchor-free SAR ship detection algorithm called LPEDet which generally includes the benchmark anchor-free detection benchmark network YOLOX, the lightweight feature enhancement backbone NLCnet and a position-enhanced attention strategy. The overall framework is shown in Figure 1. The model proposed in this paper will be explained in detail from three aspects.

3.1. Benchmark Network

Considering the unclear edge information of SAR targets and avoiding the shortcomings of traditional anchor-based methods, inspired by the latest anchor-free detection framework YOLOX [13], we use YOLOX as the benchmark network. YOLOX is the first to apply the anchor-free mode in the YOLO series. The specific operation is to explicitly define the 3 × 3 region of the truth frame projected to the center of the feature graph as the positive sample region and predict the four values of the target position (the offset distance of the upper left corner and the height and width of the frame). To better allocate fuzzy samples, YOLOX uses the simOTA algorithm for positive and negative sample matching. The general process of the simOTA algorithm is as follows: First, we calculated the matching degree of each pair. Then, we selected the top k prediction boxes with the smallest cost in a fixed central area. Finally, the grids associated with these positive samples were marked as positive.
Since YOLOX represents various improvements to the YOLO series, including a decoupling head, a new tag allocation strategy and an anchor-free mechanism, it is a high-performance detector subject to a trade-off between accuracy and speed. In the face of the SAR ship detection problem, these characteristics of YOLOX precisely match SAR image target sparsity, small sample characteristics and target scattering, so we chose YOLOX as the baseline of our network. Although YOLOX has achieved the performance of SOTA in optical image detection, its model size is too large and its model complexity is too high such that it cannot be applied in SAR image detection. Therefore, we redesigned the backbone network of YOLOX.

3.2. Lightweight Feature Enhancement Backbone: NLCNet

Most of the existing YOLO series backbones use DarkNet-53 and CSPNet architectures. Such backbones are usually excellent in terms of detection effect, but there is still a possibility for improvement of inference speed. The easiest way is to reduce the size of the model. To this end, according to the characteristics of the SAR target, the backbone network, namely, NLCnet, was designed to be lightweight so as to better balance speed and accuracy.
NLCNet uses the deeply separable convolution mentioned by MobileNetV1 as the basic block. It is generally known that depthwise separable convolution is mainly divided into two processes, namely, depthwise convolution and pointwise convolution. Compared with conventional convolution, the number of parameters for depthwise separable convolution is about one-third of that for conventional convolution. Therefore, given the same number of parameters, the number of neural network layers using separable convolution can be deeper. Based on the LCNet network, a new network design is carried out. We reorganized and stacked these blocks to form a new backbone network which is mainly divided into six blocks. The stem part uses standard convolution, which is activated by the h-swish function. Block2 to block6 all use depthwise separable convolution. The main difference is that the number of superimposed depthwise separable convolutions is different, and in block5 and block6 5 × 5 convolution kernels are used in the depth-level convolution process. The NLCNet network achieved the highest precision with respect to recent work in the following two areas: (1) discarding of the squeeze-and-excitation networks (SE) module and (2) design of the lightweight convolution block. The structural details of NLCNet are shown in Figure 2.

3.2.1. Discarding of the Squeeze-and-Excitation Networks (SE) Module

The SE module [33] is widely used in many networks. It can help the model weight the channels in the network to obtain better features. However, we cannot blindly add the SE module to the model because not all SE modules will be more effective. Recently, through my own thinking and experiments, I found that the SE attention mechanism was added to the network, which resulted in a certain improvement in the classification task, but for target detection the effect is not obvious and sometimes it will affect the results, which may be similar to the network model. There is also a certain correlation. Considering this issue, we removed the SE module on the basis of LCnet in the experiments; the accuracy of the model was not reduced and the parameters of the model were relatively few.

3.2.2. Design of a Lightweight Convolution Block

Experiments showed that convolutional verification of different sizes would have a certain impact on network performance. The larger the convolution kernel, the larger the receptive field will be in the convolution process and the better it will be for constructing the global information of the target. In light of this, we chose to use a larger convolution kernel to balance speed and accuracy. It was found by YOLOX that placing the large convolution kernel at the tail of the network was the best choice because the performance achieved by these two methods was equivalent to replacing all layers of the network. Therefore, this substitution was only performed at the end of the network.
Through simple stacking and the use of corresponding technologies, the lightweight backbone used in this paper achieved a certain improvement in accuracy with respect to the SSDD dataset, while the number of parameters has also significantly decreased. Therefore, the advantages of NLCNet are obvious. The specific network structure is shown in Table 1.

3.3. Position-Enhanced Attention

Squeeze-and-excitation attention is a widely used attention mechanism that significantly enhances network performance and avoids many parameter calculations. Squeeze-and-excitation attention is widely used in various network models to highlight important channel information in features and is mainly used for the differential weighting of different channels through global pooling and a two-layer full connection layer without considering the influence of location information on features. Location information can further help the model to obtain target details in the image, thus improving model performance.
To highlight the key location information of features, we designed a new attention module in the network inspired by coordinate attention [17] called position-enhanced attention. It can embed the location information of the target in the image into the channel attention, which can better capture the interesting position information of the SAR target against a complex background and obtain a good global perception ability. At the same time, the computational cost of this process is relatively low. See Figure 3 for the position-enhanced attention architecture.
Since 2D global pooling does not contain location information, position-enhanced attention makes corresponding changes in 2D global pooling by splitting the original channel attention and forming two 1D global pooling operations. The specific process is that when the feature map is inputted, two 1D global pools are aggregated in a vertical and horizontal direction to form two independent feature maps with orientation awareness. The two generated feature maps with specific direction information are then encoded to form two attention maps. The two attention maps capture the independent and mutually dependent relationship of the input feature maps along a horizontal and vertical direction. From the above process, position information is obtained in the generated attention map and the two attention maps are applied to the input feature map, which can emphasize the target of interest in the image for better recognition.
For the accurate location information obtained, position-enhanced attention can be applied to coding channel relationships and remote dependencies. See Figure 4 for details of the position-enhanced attention architecture.
With channel attention, the spatial information in the image can usually establish the connection between channels through the global pooling operation, but it also causes the loss of position information, which is the result of the compression of the global information by the global pooling. In order to further utilize the location information of the target in the image, we split the 2D global pooling in the SE module to form two 1D global pooling operations. The 1D global pooling can extract the region of interest in the image in the horizontal and vertical directions so as to obtain better global perception ability and the two feature maps generated with specific directions save the position information of the target so the image target can be better identified and located. Specifically, given input X, two 1D global pooling operations are used to encode each channel in a horizontal and vertical direction and the size of the pooling kernel is (H, 1) or (1, W). Therefore, at height h, the output of channel c can be expressed as:
z c h ( h ) = 1 W 0 i W x c ( h , i )
At width w, the output of channel c can also be written as:
z c w ( w ) = 1 H 0 j H x c ( j , w )
Through the above transformation, we can aggregate the input features in two spatial directions and obtain two feature maps with directional perception characteristics. These two feature maps not only enable the corresponding attention module to save the remote dependency relationship between features but also to maintain accurate position information in the spatial direction, thereby helping the network to more accurately detect the target.
As mentioned above, through the extraction process of Equations (1) and (2), the attention branch channel can have a good global receptive field, can well retain global feature information and can encode precise location information.
Further, considering that the strong scattering characteristics of SAR targets against complex backgrounds cause their contours to be unclear and that the SAR target imaging angle changes greatly, we have carefully designed the follow-up attention processing flow. Previous studies have shown that 2D global pooling will lose position information. For this reason, Hou et al. [17] adopted two 1D pooling strategies and then performed channel concatenation. This method has difficulty handling the characteristics of SAR targets, mainly due to the following two problems: first, after the feature extraction and pooling operations of Equations (1) and (2), they are concatenated into a channel for subsequent processing because the feature correlation degrees of SAR targets in different spatial directions are very different, so this method loses the significant feature information of the two spatial directions, which is not conducive to characterizing the unique features of multi-oriented sparse SAR targets; second, this concatenation operation also increases the computational complexity of the channel.
To this end, we designed an attention strategy different from Hou et al.’s [17], namely, position-enhanced attention. Our starting point was to overcome the two problems of the above analysis, namely, directly designing two parallel branches to extract depth feature information in different spatial directions respectively. This operation can better extract salient feature information in two spatial directions and so can better characterize the characteristics of sparse SAR targets with different orientations; in addition, this parallel branch extraction can obtain a wider receptive field area so that better global awareness can be obtained.
Therefore, the aggregated feature maps in the two spatial directions were generated based on Equations (1) and (2). They respectively perform convolution operations along the spatial direction and the convolution function F is used for transformation, thereby generating:
f h = δ ( B n ( F ( z c h ( h ) ) ) )
  f w = δ ( B n ( F ( z c w ( w ) ) ) )
Among these:
h s w i s h ( x ) = x R e L U ( x + 3 ) 6
In the Equations (3) and (4),   δ is the h-swish activation function and x is B n ( F ( · ) ) . B n is the batchnorm. f h   and   f w is the intermediate feature graph. f h and   f w are transformed into tensors by using the other two 1 × 1 convolution transforms   F h   and   F w .
g h = σ ( F h ( f h ) )
g w = σ ( F w ( f w ) )
where σ is the sigmoid function. Then, g h and g w are used in the position-enhanced attention block:
y c ( i , j ) = x c ( i , j ) × g c h ( i ) × g c w ( j )
Position-enhanced attention considers the encoding of spatial information. As mentioned above, attention along both horizontal and vertical directions applies to the input tensor. This coding process allows position-enhanced attention to more accurately locate the target position in the image, thus helping the whole model to achieve better recognition. Experiments show that our method does achieve good results.

4. Experiments

To verify the proposed method, we conducted a series of related experiments to evaluate the model’s detection performance. The content of this section includes details of some settings in the experiment and the main content of the SSDD dataset, followed by the evaluation indicators used in the experimental results, the influence of each module proposed in the ablation experiment on the model and a comparison with other target detection algorithms. Finally, LPEDet is compared with other recent SAR imaging methods.

4.1. Dataset and Experimental Settings

In our experiment, the datasets used were SSDD [34] and HRSID. For each ship, the detection algorithm predicts the frame of the ship target and gives the confidence of the ship target. The SSDD process is based on the PASCALVOC dataset and its data format is algorithmically compatible, making it easier to use with fewer code changes.
SSDD data are obtained by downloading public SAR images from the internet. Figure 5 shows part of the images in the dataset. The target area was cropped to approximately 500 × 500 pixels and the ship target location was manually marked. As long as there is a ship in the dataset, there are no requirements regarding ship type. The data in this dataset mainly include HH, HV, VV and VH polarization modes. There are 1160 images in the dataset and each image contains 2456 ships of different numbers and sizes. Although SSDD has few pictures, for the detection network, the number of targets that only recognize ships is sufficient. The corresponding relationship between the number of pictures and the number of ships in the dataset is shown in Table 2.
In addition, to verify the detection performance of our proposed method in different scenarios, we introduced another large-scale SAR target detection dataset, namely, the HRSID dataset. The images in this dataset are high-resolution SAR images, which are mainly used for ship detection, semantic segmentation and instance segmentation tasks. The dataset contains a total of 5604 high-resolution SAR images and 16,951 ship instances. The HRSID dataset borrows from the construction process of the Microsoft Common Objects in Context (COCO) dataset, including SAR images with different resolutions, polarizations, sea states, sea areas and coastal ports. For HRSID, the resolutions of the SAR images are: 0.5 m, 1 m and 3 m, respectively.
To make a fair comparison with previous work, we attempted to use the same settings that previous workers used. We randomly divided the original SSDD dataset according to the ratio of 8:2 commonly used in existing studies and 80% of the datasets were used for the training of all methods. The remaining 20% was used as a test set to evaluate the detection performance of all methods. The data in the training set and test set were not repeated at all among the methods to ensure the rigor and fairness of the experiment. Other parameters included a batch size of 8 and an image size for the input model of 640, RandomHorizontalFlip was adopted, ColorJitter and multiscale were used for data augmentation, and Mosaic and MixUp enhancement strategies were employed. Using the lr×batchsize/64 learning rate, the cosine lr schedule and initial lr = 0.01 were employed. The weight decayed to 0.0005 and the SGD momentum was 0.9. A total of 600 epochs were trained. In the HRSID [35] dataset, we used a ratio of 6.5:3.5 to split the dataset, with 65% data for training and 35% for testing, the same as the original author split. The image size of the input model was 800. All experiments in this paper were carried out on an Ubuntu 18.04 operating system equipped with a GeForceRTX2060.

4.2. Evaluation Indicators

We used average precision (mAP) to analyze and verify the detection performance of our proposed method. Average accuracy can be derived from accuracy and recall.
Accuracy is the percentage of targets that are correctly identified in the test set. The percentage is defined by true positives (TPs) and false positives (FPs):
P = TP TP + FP
TP means that the prediction of the classifier is positive and the prediction is correct; FP indicates that the prediction of the classifier is positive and the prediction is incorrect.
The recall rate is the probability that all positive samples in the test set are correctly identified, which is derived from true positives (TPs) and false negatives (FNs):
R = TP TP + FN
FN indicates that the prediction of the classifier is negative and the prediction is incorrect.
Based on the accuracy and recall rate, an average accuracy value is also obtained. The graphical meaning can be clearly seen in the coordinate axis, that is, the area under the accuracy and recall rate curve, which is defined as follows:
mAP = 0 1 P ( R ) d R

4.3. Experimental Results and Analysis

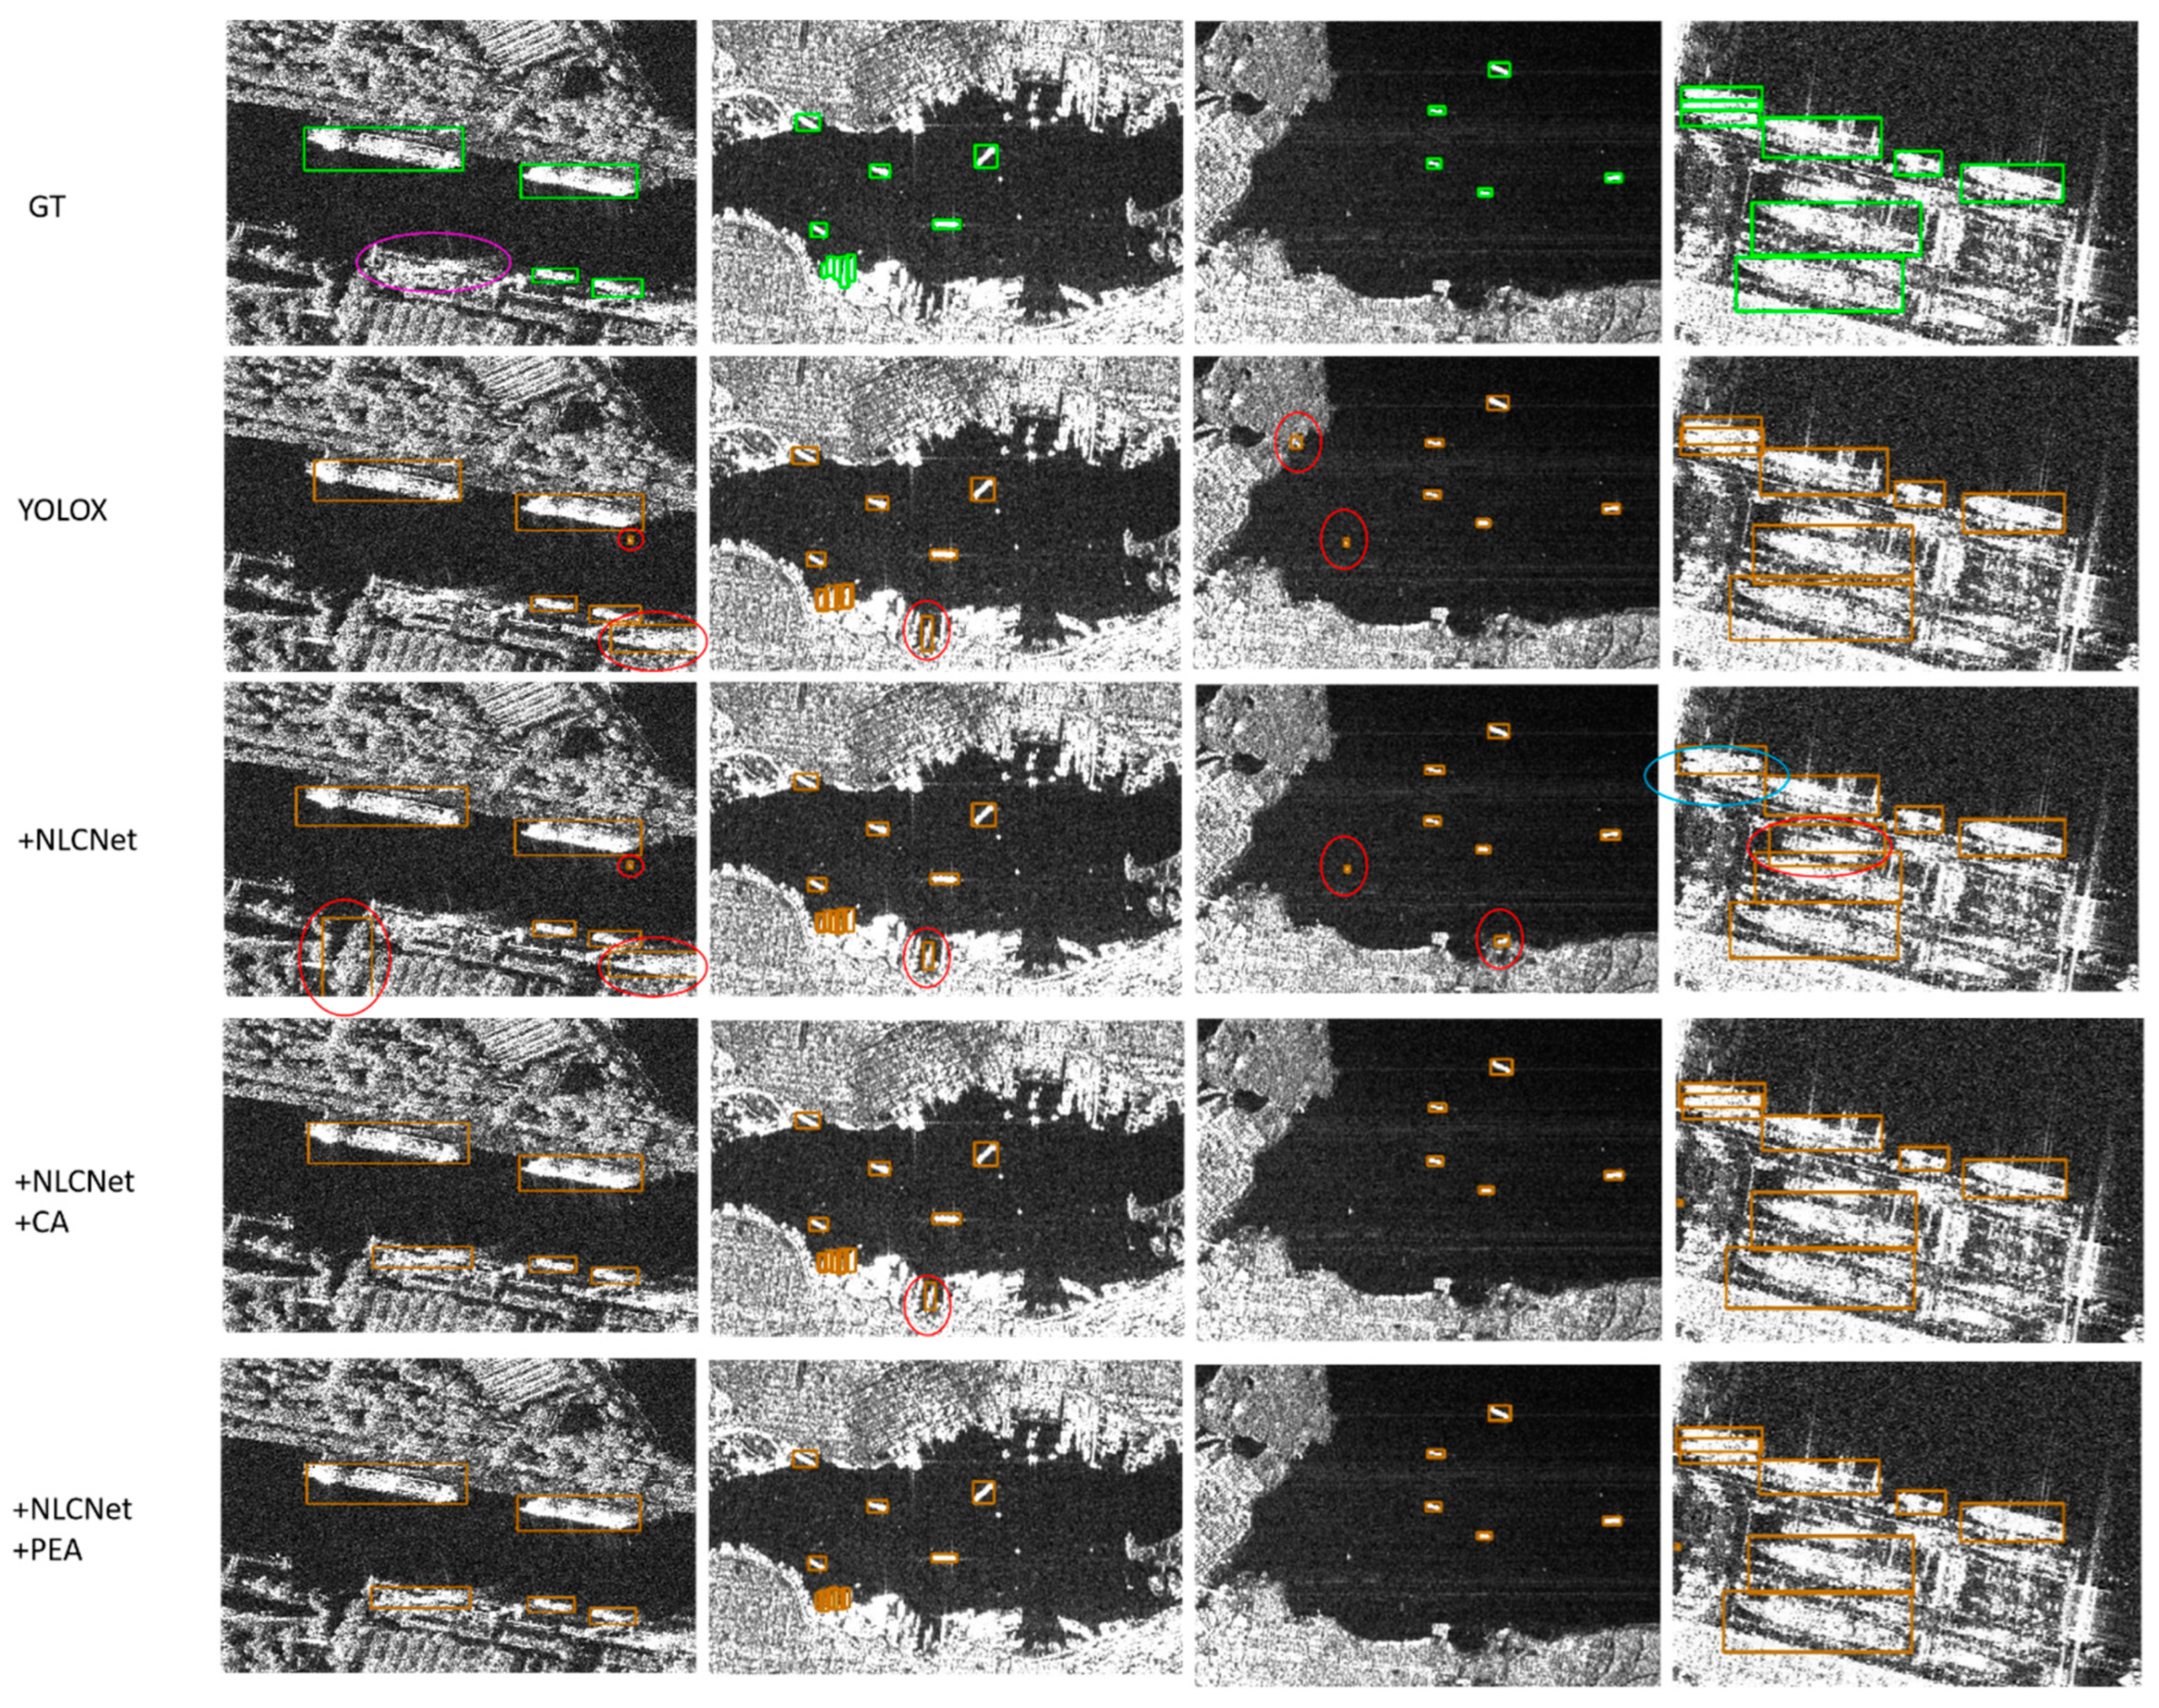
4.3.1. Ablation Experiments on SSDD Datasets

To clearly compare the advantages of the added modules, we conducted the following ablation experiments. The first experiment ensured that other settings remained unchanged while replacing the backbone network Darknet-53 with a lightweight backbone NLCNet. Second, the attention module position-enhanced attention was added on the basis of the original network. This process did not change other settings and parameters.
It should be noted that the methods in the ablation experiment were reproduced according to the official open-source code of the comparison method and applied to the SSDD dataset for experimental comparison. The dataset used by the comparison method was exactly the same as that used by our proposed method; the hyperparameters of the comparison method were all set with standard default settings and the number of training epochs was also consistent with our method.

Influence of the NLCNet Backbone Network on the Experimental Results

The backbone Darknet-53 was replaced with our proposed NLCNet based on YOLOX, as previously shown in Figure 2. The mAP increased by 0.6% from 96.2% to 96.8% and the FLOPs dropped by 8.37 from 26.64 to 18.27. According to the data, our redesigned NLCNet showed advantages in feature extraction with respect to SAR image ship targets, not only improving accuracy but also reducing the number of parameters, making the model more lightweight and easier to transplant in industrial settings.

Influence of Position-Enhanced Attention on Experimental Results

To verify the effectiveness of our proposed position-enhanced attention and its advantages, we conducted ablation experiments with the original network without attention, the network with coordinate attention and the new network with our proposed position-enhanced attention in our dataset, respectively. The experimental results are shown in Table 3. The mAP of the network with our proposed position-enhanced attention was greatly improved compared to the network without attention, which increased from 96.8% to 97.4%. At the same time, the increase in FLOPs and params was negligible. The results show the effectiveness of our proposed position-enhanced attention. Compared with the original network with coordinate attention, the detection accuracy of our proposed model increased from 97.1% to 97.4% with the parameters and FLOPs unchanged. It should be noted that we kept two significant digits after the decimal point when we counted the experimental results. Therefore, it was calculated that the parameters of FLOPs and params of our position-enhanced attention model and the original coordinate attention model were the same size. Thus, the advantages of our designed positional attention are demonstrated by the results. The visualization results are shown in Figure 6.

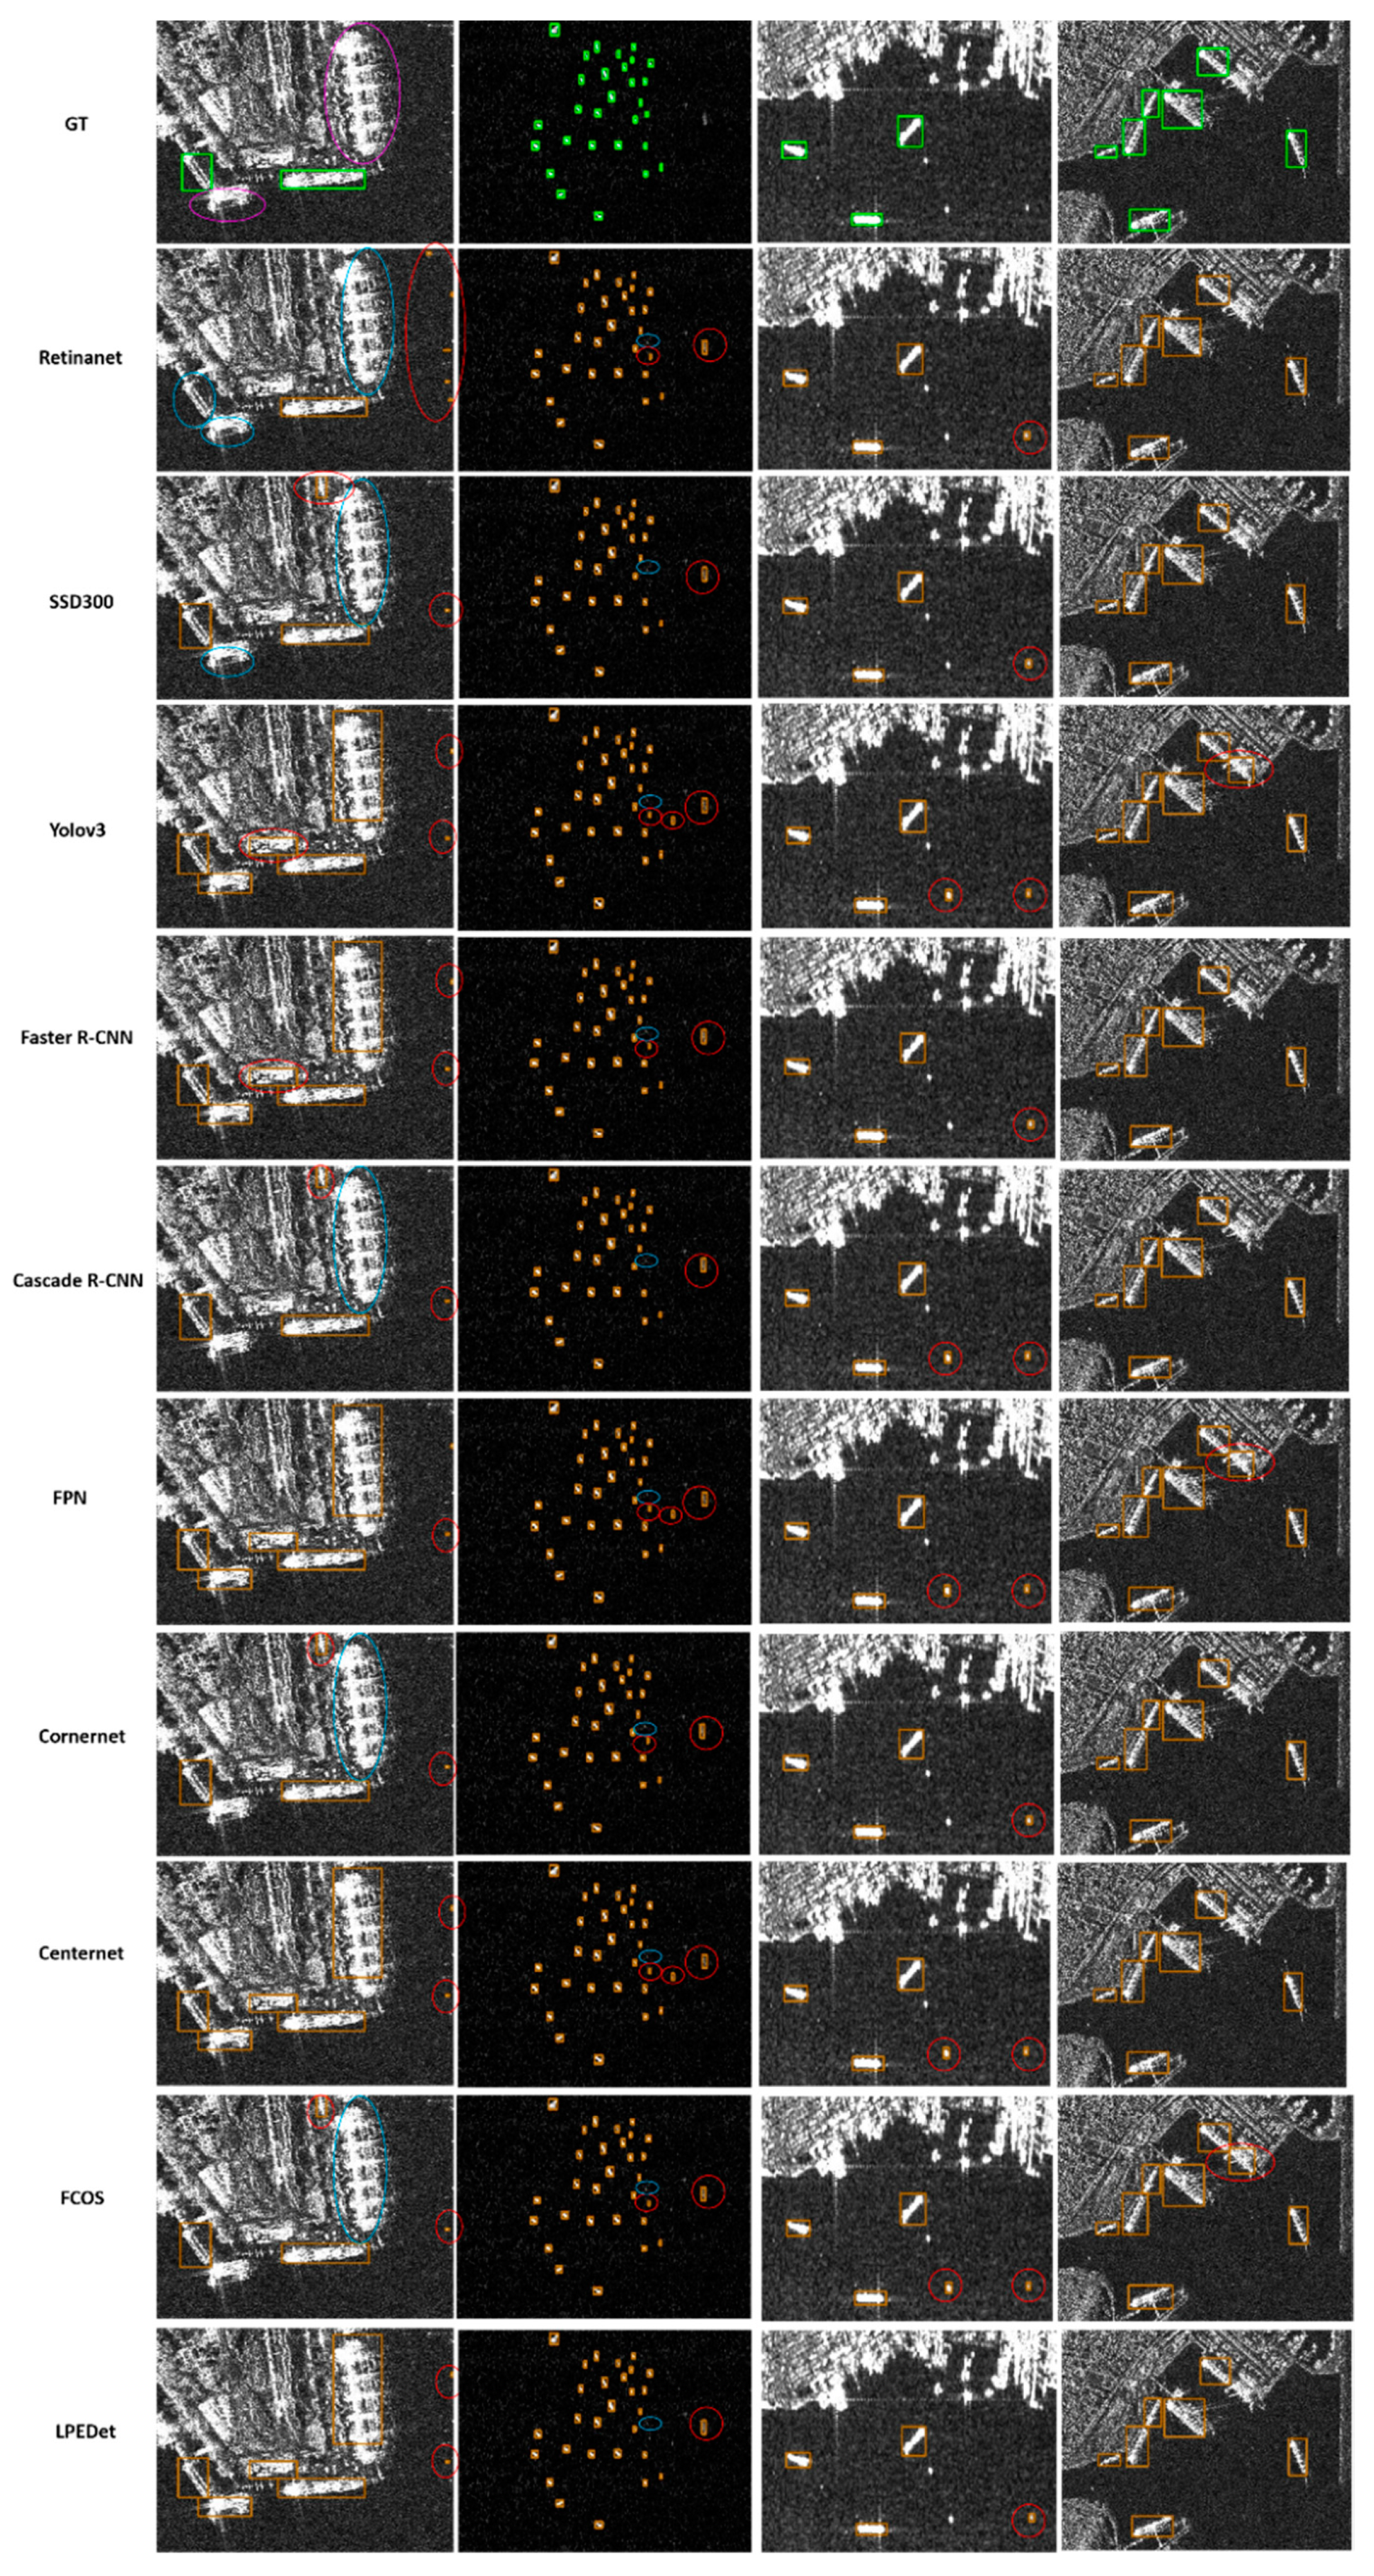
4.3.2. Comparison with the Latest Target Detection Methods Using SSDD Datasets

To further demonstrate the validity of our work, we compared LPEDet with some of the latest target detection methods, including the one-stage RetinaNet, SSD300, YOLOv3, YOLOX, YOLOv5, AFSar, two-stage Faster R-CNN, Cascade R-CNN, FPN and anchor-free CornerNet, CenterNet and FCOS methods. Among them, considering that our model mainly focuses on the lightweight design of the backbone network, for a fair comparison of performance, we cite the results of the backbone ablation experiments of AFSar [14]. The results are shown in Table 4. As seen from the table, our work not only outperformed other methods in terms of precision but also in terms of speed.
It should be noted that, except for AFSar, the methods in the comparison experiments were reproduced according to the official open-source code of the comparison method and applied to the SSDD dataset for experimental comparison. The dataset used by the comparison method was exactly the same as that used by our proposed method; the hyperparameters of the comparison method were all set with standard default settings and the number of training epochs is also consistent with our method.
We also visualized the detection results of these methods. As shown in Figure 7, compared with the proposed LPEDet method, the detection rate of the above methods was significantly higher than that of the proposed LPEDet method. Our method has good performance with small target images, complex backgrounds and intensive target image detection. These findings show the effectiveness of our approach.

4.4. Comparison with the Latest SAR Ship Detection Methods Using SSDD Datasets

To further verify the performance of our method, we also compared it with the latest SAR ship detection methods, as shown in Table 5.
The comparison methods and related experimental results in Table 5 need special explanation. Since none of these comparison methods have open-source original codes, it is difficult for us to completely reproduce the codes and parameter settings of the comparison methods. Therefore, to fairly compare the performance of different detection methods, we directly cite the highest detection results reported in the original reference of the comparison methods. Especially for the two indicators of FLOPs and params, most of the comparison methods have no relevant results. Therefore, we only cite the best experimental results for other indicators published in the references. In addition, the results of the comparison methods listed in Table 5 are mainly from references [42,43].
The results show that not only does our LPEDet achieve SOTA in accuracy but it also has a relatively faster inference speed, which shows the high efficiency of our method.

4.5. Comparison with the Latest SAR Ship Detection Methods Using HRSID Datasets

In order to fully verify the performance stability of the LPEDet method proposed in this paper with respect to different datasets, we introduce a new large-scale SAR target detection dataset, namely, HRSID, and compare a variety of state-of-the-art SAR target detection methods using this dataset. The specific results are shown in Table 6, below. By comparing the experimental results, it was found that, compared with the current latest SAR ship target detection methods, the LPEDet method proposed in this paper is superior in terms of accuracy, while the parametric and computational complexity of the model are also the lowest, which proves the stability of our method in relation to different datasets. As can be seen in Table 6, except for the fact that the data for CenterNet2 on AP, AP75, APM and APL are slightly higher than for our model, the difference is not big, and the number of parameters in our model is almost 1/15 the number of its parameters, such that, considering accuracy and speed, our model still has better performance in comparison.

4.6. The Effect of the Number of Training Sets on Detection Performance

In order to verify the robust performance of our proposed method under the conditions of different training data, we redivided the training and testing ratios of the dataset under the conditions of 33% and 66% of the training set data, respectively, to validate the performance of our model. The results are shown in Table 7 below. We combined the results of Table 4 in the paper for the analysis (the training data volume of all methods in Table 4 is 80% and above): when we only use 66% of the training data volume, mAP can still reaching 96.8%, the performance is still better than most state-of-the-art SAR target detection methods; and when we use only 33% of the training data volume, mAP can still reach 94.6%, outperforming RetinaNet and SSD300, such that, compared to other state-of-the-art SAR target detection methods, the results are not much different. The analysis of the above results shows that the proposed LPEDet method can still achieve better performance than the latest SAR target detection methods with fewer training data, that it still has good robustness and that it can greatly reduce the labor costs involved in manual labeling of data.

5. Conclusions

Multi-platform SAR earth observation equipment has accumulated massive amounts of high-resolution SAR target image data, and SAR image target detection has great engineering application value in military/civilian fields. Aimed at the problems of unclear target contour information, complex backgrounds, strong scattering and multiple scales in SAR images, a new anchor-free SAR ship detection algorithm, LPEDet, was proposed to improve the accuracy and speed of SAR ship detection in a balanced manner. First, YOLOX was used as the benchmark detection network; then, a new lightweight backbone, NLCNet, was designed. At the same time, to further improve localization accuracy, we designed a location-enhanced attention strategy. The experimental results based on the SSDD dataset showed that the mAP of our LPEDet reached 97.4%, achieving SOTA. Meanwhile, the average inference time for a single image is only 7.01ms when the input size is 640. With respect to the HRSID dataset, our model is also stable, with an AP50 of 89.7%, which is superior to other state-of-the-art object detection methods, while the computational complexity, the number of parameters and the average inference time are lowest. In the future, based on the Hisea-1 SAR satellite that our research group participated in launching, our group independently constructed a larger-scale multi-type SAR target image dataset. We will verify the effectiveness of our proposed LPEDet algorithm on this large-scale dataset. Common SAR image artifacts such as speckle noise can affect SAR target detection results, and Mukherjee et al. [48] has demonstrated that their methods can respond to various types of image artifacts. Therefore, in the future, we will consider introducing image quality metrics to evaluate and correct the quality of the input SAR images so as to more comprehensively iterate and verify the robust performance of our designed SAR target detection method.

Author Contributions

Conceptualization, Y.F.; Methodology, Y.F.; Project administration, J.C. and Z.H.; Software, Y.F.; Supervision, J.C., Z.H., B.W., R.X., L.S. and M.X.; Validation, Y.F.; Visualization, Y.F.; Writing—original draft, Y.F.; Writing—review & editing, J.C. and H.W. All authors have read and agreed to the published version of the manuscript.

Funding

This work was supported in part by the National Natural Science Foundation of China under Grant 62001003, in part by the Natural Science Foundation of Anhui Province under Grant 2008085QF284 and in part by the China Postdoctoral Science Foundation under Grant 2020M671851.

Conflicts of Interest

The authors declare no conflict of interest.

References

  1. Robey, F.C.; Fuhrmann, D.R.; Kelly, E.J. A CFAR adaptive matched filter detector. IEEE Trans. Aerosp. Electron. Syst. 1992, 28, 208–216. [Google Scholar] [CrossRef] [Green Version]
  2. Huang, Y.; Liu, F. Detecting cars in VHR SAR images via semantic CFAR algorithm. IEEE Geosci. Remote Sens. Lett. 2016, 13, 801–805. [Google Scholar] [CrossRef]
  3. Stein, G.W.; Zelnio, E.G.; Garber, F.D. Target detection using an improved fractal scheme. Proc. SPIE—Int. Soc. Opt. Eng. 2006, 6237, 19. [Google Scholar]
  4. Zhang, T.; Zhang, X.; Shi, J.; Wei, S.; Wang, J.; Li, J.; Su, H.; Zhou, Y. Balance scene learning mechanism for offshore and inshore ship detection in SAR images. IEEE Geosci. Remote Sens. Lett. 2020, 19, 1–5. [Google Scholar] [CrossRef]
  5. Zhang, T.; Zhang, X. ShipDeNet-20: An only 20 convolution layers and <1-MB lightweight SAR ship detector. IEEE Geosci. Remote Sens. Lett. 2020, 18, 1234–1238. [Google Scholar] [CrossRef]
  6. Zhang, T.; Zhang, X.; Shi, J.; Wei, S. HyperLi-Net: A hyper-light deep learning network for high-accurate and high-speed ship detection from synthetic aperture radar imagery. ISPRS J. Photogramm. Remote Sens. 2020, 167, 123–153. [Google Scholar] [CrossRef]
  7. Tz, A.; Xz, A.; Chang, L.B.; Js, A.; Sw, A.; Ia, C.; Xu, Z.A.; Yue, Z.D.; Dp, E.; Jl, F. Balance learning for ship detection from synthetic aperture radar remote sensing imagery. ISPRS J. Photogramm. Remote Sens. 2021, 182, 190–207. [Google Scholar]
  8. Zhang, T.; Zhang, X.; Shi, J.; Wei, S. Depthwise separable convolution neural network for high-speed SAR ship detection. Remote Sens. 2019, 11, 2483. [Google Scholar] [CrossRef] [Green Version]
  9. Zhang, T.; Zhang, X. High-speed ship detection in SAR images based on a grid convolutional neural network. Remote Sens. 2019, 11, 1206. [Google Scholar] [CrossRef] [Green Version]
  10. Lin, T.-Y.; Goyal, P.; Girshick, R.; He, K.; Dollár, P. Focal loss for dense object detection. IEEE Trans. Pattern Anal. Mach. Intell. 2018, 42, 318–327. [Google Scholar] [CrossRef] [Green Version]
  11. Liu, W.; Anguelov, D.; Erhan, D.; Szegedy, C.; Reed, S.; Fu, C.-Y.; Berg, A.C. Ssd: Single shot multibox detector. In European Conference on Computer Vision; Springer International Publishing: Cham, Switzerland, 2016; pp. 21–37. [Google Scholar]
  12. Redmon, J.; Farhadi, A. Yolov3: An incremental improvement. arXiv 2018, arXiv:1804.02767. [Google Scholar]
  13. Ge, Z.; Liu, S.; Wang, F.; Li, Z.; Sun, J. Yolox: Exceeding yolo series in 2021. arXiv 2021, arXiv:2107.08430. [Google Scholar]
  14. Wan, H.Y.; Chen, J.; Huang, Z.X.; Xia, R.F.; Wu, B.C.; Sun, L.; Yao, B.D.; Liu, X.P.; Xing, M.D. AFSar: An anchor-free SAR target detection algorithm based on multiscale enhancement representation learning. IEEE Trans. Geosci. Remote Sens. 2021, 60, 1–14. [Google Scholar] [CrossRef]
  15. Liu, S.; Huang, D. Receptive field block net for accurate and fast object detection. In Proceedings of the European Conference on Computer Vision (ECCV), Munich, Germany, 14 September 2018; pp. 385–400. [Google Scholar]
  16. Cui, C.; Gao, T.; Wei, S.; Du, Y.; Guo, R.; Dong, S.; Lu, B.; Zhou, Y.; Lv, X.; Liu, Q. PP-LCNet: A lightweight CPU convolutional neural network. arXiv 2021, arXiv:2109.15099. [Google Scholar]
  17. Hou, Q.; Zhou, D.; Feng, J. Coordinate attention for efficient mobile network design. In Proceedings of the IEEE/CVF Conference on Computer Vision and Pattern Recognition, Nashville, TN, USA, 19–25 June 2021; pp. 13713–13722. [Google Scholar]
  18. Ai, J.; Yang, X.; Yan, H. A local Cfar detector based on gray Intensity correlation in Sar imagery. In Proceedings of the IGARSS 2018—2018 IEEE International Geoscience and Remote Sensing Symposium, Valencia, Spain, 22–27 July 2018; pp. 697–700. [Google Scholar]
  19. Kaplan, L.M. Improved SAR target detection via extended fractal features. IEEE Trans. Aerosp. Electron. Syst. 2001, 37, 436–451. [Google Scholar] [CrossRef]
  20. Charalampidis, D.; Kasparis, T. Wavelet-based rotational invariant roughness features for texture classification and segmentation. IEEE Trans. Image Process. 2002, 11, 825–837. [Google Scholar] [CrossRef]
  21. Simonyan, K.; Zisserman, A. Very deep convolutional networks for large-scale image recognition. arXiv 2014, arXiv:1409.1556. [Google Scholar]
  22. Szegedy, C.; Liu, W.; Jia, Y.; Sermanet, P.; Reed, S.; Anguelov, D.; Erhan, D.; Vanhoucke, V.; Rabinovich, A. Going deeper with convolutions. In Proceedings of the IEEE Conference on Computer Vision and Pattern Recognition, Boston, MA, USA, 7–12 June 2015; pp. 1–9. [Google Scholar]
  23. Zhang, X.; Zhou, X.; Lin, M.; Sun, J. Shufflenet: An extremely efficient convolutional neural network for mobile devices. In Proceedings of the IEEE Conference on Computer Vision and Pattern Recognition, Salt Lake City, UT, USA, 18–22 June 2018; pp. 6848–6856. [Google Scholar]
  24. Ma, N.; Zhang, X.; Zheng, H.-T.; Sun, J. Shufflenet v2: Practical guidelines for efficient cnn architecture design. In Proceedings of the IEEE Conference on Computer Vision and Pattern Recognition, Salt Lake City, UT, USA, 18–22 June 2018; pp. 116–131. [Google Scholar]
  25. Han, K.; Wang, Y.; Tian, Q.; Guo, J.; Xu, C.; Xu, C. Ghostnet: More features from cheap operations. In Proceedings of the IEEE/CVF Conference on Computer Vision and Pattern Recognition, Seattle, WA, USA, 14–19 June 2020; pp. 1580–1589. [Google Scholar]
  26. Howard, A.G.; Zhu, M.; Chen, B.; Kalenichenko, D.; Wang, W.; Weyand, T.; Andreetto, M.; Adam, H. Mobilenets: Efficient convolutional neural networks for mobile vision applications. arXiv 2017, arXiv:1704.04861. [Google Scholar]
  27. Sandler, M.; Howard, A.; Zhu, M.; Zhmoginov, A.; Chen, L.-C. Mobilenetv2: Inverted residuals and linear bottlenecks. In Proceedings of the IEEE Conference on Computer Vision and Pattern Recognition, Salt Lake City, UT, USA, 18–22 June 2018; pp. 4510–4520. [Google Scholar]
  28. Sun, L.; Chen, J.; Feng, D.; Xing, M. The recognition framework of deep kernel learning for enclosed remote sensing objects. IEEE Access 2021, 9, 95585–95596. [Google Scholar] [CrossRef]
  29. Sun, L.; Chen, J.; Feng, D.; Xing, M. Parallel ensemble deep learning for real-time remote sensing video multi-Target detection. Remote Sens. 2021, 13, 4377. [Google Scholar] [CrossRef]
  30. Jiao, J.; Zhang, Y.; Sun, H.; Yang, X.; Gao, X.; Hong, W.; Fu, K.; Sun, X. A densely connected end-to-end neural network for multiscale and multiscene SAR ship detection. IEEE Access 2018, 6, 20881–20892. [Google Scholar] [CrossRef]
  31. Chen, C.; He, C.; Hu, C.; Pei, H.; Jiao, L. A deep neural network based on an attention mechanism for SAR ship detection in multiscale and complex scenarios. IEEE Access 2019, 7, 104848–104863. [Google Scholar] [CrossRef]
  32. Cui, Z.; Li, Q.; Cao, Z.; Liu, N. Dense attention pyramid networks for multi-scale ship detection in SAR images. IEEE Trans. Geosci. Remote Sens. 2019, 57, 8983–8997. [Google Scholar] [CrossRef]
  33. Hu, J.; Shen, L.; Sun, G. Squeeze-and-excitation networks. In Proceedings of the IEEE Conference on Computer Vision and Pattern Recognition, Salt Lake City, UT, USA, 18–22 June 2018; pp. 7132–7141. [Google Scholar]
  34. Zhang, T.; Zhang, X.; Li, J.; Xu, X.; Wang, B.; Zhan, X.; Xu, Y.; Ke, X.; Zeng, T.; Su, H. Sar ship detection dataset (ssdd): Official release and comprehensive data analysis. Remote Sens. 2021, 13, 3690. [Google Scholar] [CrossRef]
  35. Wei, S.; Zeng, X.; Qu, Q.; Wang, M.; Su, H.; Shi, J. HRSID: A high-resolution SAR images dataset for ship detection and instance segmentation. IEEE Access 2020, 8, 120234–120254. [Google Scholar] [CrossRef]
  36. Ren, S.; He, K.; Girshick, R.; Sun, J. Faster r-cnn: Towards real-time object detection with region proposal networks. Adv. Neural Inf. Process. Syst. 2016, 39, 1137–1149. [Google Scholar] [CrossRef] [Green Version]
  37. Cai, Z.; Vasconcelos, N. Cascade r-cnn: Delving into high quality object detection. In Proceedings of the IEEE Conference on Computer Vision and Pattern Recognition, Salt Lake City, UT, USA, 18–22 June 2018; pp. 6154–6162. [Google Scholar]
  38. Lin, T.-Y.; Dollár, P.; Girshick, R.; He, K.; Hariharan, B.; Belongie, S. Feature pyramid networks for object detection. In Proceedings of the IEEE Conference on Computer Vision and Pattern Recognition, Honolulu, HI, USA, 21–26 July 2017; pp. 2117–2125. [Google Scholar]
  39. Law, H.; Deng, J. Cornernet: Detecting objects as paired keypoints. In Proceedings of the European Conference on Computer Vision (ECCV), Munich, Germany, 8–14 September 2018; pp. 734–750. [Google Scholar]
  40. Duan, K.; Bai, S.; Xie, L.; Qi, H.; Huang, Q.; Tian, Q. Centernet: Keypoint triplets for object detection. In Proceedings of the IEEE/CVF International Conference on Computer Vision, Seoul, Korea, 27–28 October 2019; pp. 6569–6578. [Google Scholar]
  41. Tian, Z.; Shen, C.; Chen, H.; He, T. Fcos: Fully convolutional one-stage object detection. In Proceedings of the IEEE/CVF International Conference on Computer Vision, Seoul, Korea, 27–28 October 2019; pp. 9627–9636. [Google Scholar]
  42. Fu, J.; Sun, X.; Wang, Z.; Fu, K. An anchor-free method based on feature balancing and refinement network for multiscale ship detection in SAR images. IEEE Trans. Geosci. Remote Sens. 2020, 59, 1331–1344. [Google Scholar] [CrossRef]
  43. Guo, H.; Yang, X.; Wang, N.; Gao, X. A CenterNet++ model for ship detection in SAR images. Pattern Recognit. 2021, 112, 107787. [Google Scholar] [CrossRef]
  44. Nie, J.; Anwer, R.M.; Cholakkal, H.; Khan, F.S.; Pang, Y.; Shao, L. Enriched feature guided refinement network for object detection. In Proceedings of the IEEE/CVF International Conference on Computer Vision, Seoul, Korea, 27–28 October 2019; pp. 9537–9546. [Google Scholar]
  45. Pang, J.; Chen, K.; Shi, J.; Feng, H.; Ouyang, W.; Lin, D. Libra r-cnn: Towards balanced learning for object detection. In Proceedings of the IEEE/CVF Conference on Computer Vision and Pattern Recognition, Long Beach, CA, USA, 16–20 June 2019; pp. 821–830. [Google Scholar]
  46. Gao, S.; Liu, J.; Miao, Y.; He, Z. A High-Effective Implementation of Ship Detector for SAR Images. IEEE Geosci. Remote Sens. Lett. 2021, 19, 1–5. [Google Scholar] [CrossRef]
  47. Zhou, X.; Koltun, V.; Krähenbühl, P. Probabilistic two-stage detection. arXiv 2021, arXiv:2103.07461. [Google Scholar]
  48. Mukherjee, S.; Valenzise, G.; Cheng, I. Potential of deep features for opinion-unaware, distortion-unaware, no-reference image quality assessment. In International Conference on Smart Multimedia; Springer International Publishing: Cham, Switzerland, 2019; pp. 87–95. [Google Scholar]
Figure 1. Overall framework of the model. PEA = position-enhanced attention. (The numbers (1–6) represent the output feature maps of blocks 1–6, respectively, and PEA is added to the adjacent blocks. The subsequent operations of (2), (3) are the same with (1)).
Remotesensing 14 01908 g001
Figure 2. The details of the NLCNet backbone network.
Remotesensing 14 01908 g002
Figure 3. The details of the position-enhanced attention block (C, W, H, r represent the number of channels, width, height and reduction ratio, respectively).
Remotesensing 14 01908 g003
Figure 4. Structural contrast of the classic SE channel attention block and the position-enhanced attention block.
Remotesensing 14 01908 g004
Figure 5. Illustration of the diversity of ship targets in the SSDD dataset.
Remotesensing 14 01908 g005
Figure 6. Visualization effect of the ablation experiment. The purple box is the target that was missed when marked, the red box is the target of misdetection and the blue box is a missed target. CA = coordinate attention; PEA = position-enhanced attention.
Remotesensing 14 01908 g006
Figure 7. Visual detection results of the latest methods. The purple box is the target that was missed when marked, the red box is the target of misdetection and the blue box is a missed target.
Remotesensing 14 01908 g007
Table 1. The details of NLCNet. PEA = position-enhanced attention.
OperatorKernel SizeStrideInputOutputPEA
Conv2D 3 × 3 2 640 2 × 3 320 2 × 16 -
DepthSepConv 3 × 3 1 320 2 × 16 320 2 × 32
DepthSepConv 3 × 3 2 320 2 × 32 160 2 × 64
DepthSepConv 3 × 3 1 160 2 × 64 160 2 × 64
DepthSepConv 3 × 3 2 160 2 × 64 80 2 × 128
DepthSepConv 3 × 3 1 80 2 × 128 80 2 × 128
DepthSepConv 3 × 3 2 80 2 × 128 40 2 × 256
5 × DepthSepConv 5 × 5 1 40 2 × 256 40 2 × 256
DepthSepConv 5 × 5 2 40 2 × 256 20 2 × 512
DepthSepConv 5 × 5 1 20 2 × 512 20 2 × 512
Table 2. Correspondence between NoS and NoI in the SSDD dataset.
NoS1234567891011121314
NoI725183894745161584115330
NoS = number of ships; NoI = number of images.
Table 3. Results of ablation experiments. (mAP, FLOPs, Params and average inference time represent detection accuracy, computational complexity, parameter amount and average inference time, respectively).
ModelBackboneAttentionmAP (%)FLOPs (GMac)Params (M)Average Inference Time (ms)
YOLOXDarknet-53-96.226.648.948.20
YOLOXNLCNet-96.818.275.585.27
YOLOXNLCNetCoordinate attention97.118.385.687.01
YOLOXNLCNetPosition-enhanced
attention
97.418.385.687.01
Table 4. Comparison with the latest target detection methods.
MethodmAP (%)FLOPs (GMac)Params (M)Average Inference
Time (ms)
One-stageRetinaNet [10]91.281.6936.144.10
SSD300 [11]93.1154.4534.3153.62
YOLOv3 [12]96.277.5461.5245.81
YOLOX96.226.648.948.20
YOLOv597.016.547.238.61
AFSar [14]96.78.66--
Two-stageFaster R-CNN [36]96.491.4141.1245.36
Cascade R-CNN [37]96.8119.0569.1765.56
FPN [38]96.571.6563.5678.30
Anchor-freeCornerNet [39]94.7707.75201.0495.61
CenterNet [40]95.120.414.2131.54
FCOS [41]95.378.6360.9748.67
LPEDet97.418.385.687.01
Table 5. Comparison with the latest SAR ship detection methods.
MethodsmAP (%)FLOPs (GMac)Params (M)Average Inference Time (ms)
DCMSNN [30]89.43-41.146.2
NNAM [31]79.8--28
FBR-Net [42]94.10-32.540.1
CenterNet++ [43]95.1--33
EFGRNet [44]91.1--33
Libra R-CNN [45]88.7--57
DAPN [32]89.8--41
LPEDet97.418.385.687.01
Table 6. Comparison of the latest SAR target detection methods on HRSID.
MethodAPAP50AP75APSAPMAPLFLOPs (GMac)Params (M)Average Inference
Time (ms)
YOLOv3 [12]50.985.053.151.056.125.5121.1561.52136
SAR-net [46]-84.7----104.242.6118
CenterNet2 [47]64.589.573.064.769.148.3-71.6-
RetinaNet [10]59.884.867.260.462.726.5127.9136.3122
YOLOX [13]61.487.268.963.057.021.826.648.948.20
LPEDet64.489.771.865.863.424.218.385.687.01
Table 7. Comparison of experimental results for different data volumes on SSDD.
MethodDatasets RatemAP (%)
LPEDet33%94.6
66%96.8
80%97.4
Publisher’s Note: MDPI stays neutral with regard to jurisdictional claims in published maps and institutional affiliations.

