Article

First Lidar Campaign in the Industrial Sites of Volta Redonda-RJ and Lorena-SP, Brazil

by
Fábio Juliano da Silva Lopes
1,*,
Silvânia A. Carvalho
2,
Fernando Catalani
3,
Jonatan João da Silva
1,4,
Rogério M. de Almeida
2,
Fábio de Jesus Ribeiro
2,
Carlos Eduardo Fellows
5,
Eduardo Landulfo
1,
Carlos Renato Menegatti
3 and
Carlos José Todero Peixoto
3
1
Centro de Lasers e Aplicações (CELAP), Instituto de Pesquisas Energéticas e Nucleares (IPEN), Av. Prof. Lineu Prestes 2242, São Paulo 05508-000, SP, Brazil
2
Escola de Engenharia Industrial Metalúrgica de Volta Redonda (EEIMVR), Universidade Federal Fluminense (UFF), Av. dos Trabalhadores 420, Vila Santa Cecília, Volta Redonda 27255-125, RJ, Brazil
3
Escola de Engenharia de Lorena (EEL), Universidade de São Paulo (USP), Estrada Municipal do Campinho, s/nº, Lorena 12602-810, SP, Brazil
4
Centro das Ciências Exatas e das Tecnologias (CCET), Universidade Federal do Oeste da Bahia (UFOB), Rua Professor José Seabra de Lemos—Lado par, Barreiras 47808-02, BA, Brazil
5
Departamento de Física, Instituto de Ciências Exatas (ICEx), Universidade Federal Fluminense (UFF), R. Des. Ellis Hermydio Figueira, 783, Aterrado, Volta Redonda 27213-145, RJ, Brazil
*
Author to whom correspondence should be addressed.
Remote Sens. 2022, 14(7), 1675; https://doi.org/10.3390/rs14071675
Submission received: 25 February 2022 / Revised: 7 March 2022 / Accepted: 25 March 2022 / Published: 31 March 2022

Abstract

:
We report on the first aerosol profiling campaign in the Paraíba valley, a hub connecting the region between the two largest Brazilian metropolitan areas, São Paulo and Rio de Janeiro. São Paulo Sanitation Technology Company (CETESB) air quality and Cloud-Aerosol Lidar and Infrared Pathfinder Satellite Observations (CALIPSO) data show homogeneous behavior of the atmosphere throughout the region. A more detailed description of the particulate material in the local atmosphere, including its temporal dependence, can be obtained by using ground-based lidars. Measurements were carried out with a backscatter lidar system in two industrial cities, Volta Redonda and Lorena. The aerosol backscatter profiles present several peaks at different altitudes, indicating the presence of aerosol in several atmospheric layers. In addition, The Hybrid Single Particle Lagrangian Integrated Trajectory (HYSPLIT) air-mass back-trajectories indicate a possible detection of long-range aerosol transported from biomass burning areas of South America. The present study emphasizes the importance of investigating and monitoring the emission of particulate matter at this important hub connection between two dense populated regions of Brazil.

1. Introduction

Atmospheric composition plays an important role in the Earth’s radiation budget and the understanding of its physical, chemical and optical properties is important to address the effects on climate, weather conditions and air quality [1,2,3]. The determination of atmospheric composition is becoming increasingly important for large urban centers and megacities where the impact of air pollution is extremely worrying. In these locations, serious problems are faced, such as overpopulation, disorderly growth, large vehicle fleet, poor quality of the collective transportation system and others [4,5,6,7].
In recent years, several studies have been focused on the monitoring of emission sources and analysis of primary and secondary formation of pollutants of large urban centers in Brazil [7,8]. In 2012 de Miranda et al. [9] and de Andrade et al. [8] conducted two similar studies to quantify P M 2.5 and black carbon concentrations in six large Brazilian urban centers and to correlate them with harmful health effects and the increased mortality risk. Ref. Pérez-Martínez et al. [10] used mobility data and emission models to investigate the relation of air quality and short-lived climate pollutant impacts related to on-road transportation in the Metropolitan Area of São Paulo (MASP). Several other studies in different regions of Brazil were conducted in order to investigate the composition of organic matters present in the aerosols and the effects of inorganic chemical composition on the aerosol hygroscopicity of urban polluted areas [11,12]. Concerning the large fleet of light and heavy-duty vehicles in the large urban areas of Brazil, several efforts have been made to understand the correlation between secondary inorganic and organic particle formation, particle number concentrations, ozone and fine particles with the vehicle emissions [13,14,15].
In addition, atmospheric pollution and aerosols are recognized as risk factors for health, associated with several diseases and premature deaths. The emission of particulates, especially with diameter smaller than 10 μ m, is correlated with respiratory problems that increase mortality and cancer in some urban areas [16,17,18,19,20]. Other studies developed an approach based on the atmospheric model employing specific arrangements of the physical and chemical processes to study the effects and impacts of air pollution in the large cities and their neighborhood, focusing on the pollution episodes [21], air quality forecasting [22,23], and regional and long-distance pollution transport [24,25,26]. In this context, to enhance the accuracy and the air quality predictions based on these forecasting and pollution transport models it is necessary to improve the inventories database and increase the coverage area for atmospheric monitoring.
Brazil has a historical deficiency in atmospheric monitoring in almost all its territory and the Paraíba valley is one of the regions where there is a lack of monitoring data. The Paraíba valley is a geographic region formed by the hydrographic basin of the Paraíba do Sul river and it is located among three different Brazilian states, Rio de Janeiro, São Paulo and Minas Gerais. Important natural reserves are located in this region, such as Mantiqueira mountains, Sea Ridge (Serra do Mar) and important reserves of the original Atlantic rain forest, despite being an urbanized and industrialized region with more than 3 million people living in their cities. Moreover, connecting the cities of São Paulo and Rio de Janeiro, and crossing all the Paraíba valley, there is one of the longest and important Brazilian highways, the Presidente Dutra Highway (PDH) or BR-116, a longitudinal highway that begins in the northeastern region of Brazil and goes to the extreme south Brazilian region, crossing a total of 10 states, with a total of 4486 km of extension with an intense flux of heavy and light-duty vehicles.
Recently, in an attempt to cover the lack of monitoring in these large populated regions, Duarte et al. [27] presented a high-resolution air quality study over a large urban area of Brazil, encompassing the Metropolitan area of São Paulo, Campinas, Paraíba valley and the Sea Ridge, by employing the European Air Pollution Dispersion-Inverse Model (EURAD-IM) to simulate detailed features of aerosols and investigate air pollution cases based on particulate matter concentrations. The EURAD-IM study demonstrated exchange of pollutants between MASP and the Metropolitan area of Rio de Janeiro (MARJ), which also affects the Metropolitan Area of the Paraíba valley (MAPV) by transportation of air pollutants. Furthermore, the MAPV can suffer from the impact of the large fleet of light and heavy-duty vehicles commuting every day by the Presidente Dutra Highway.
Remote sensing techniques such as lidar, an acronym for light detection and ranging [28], are widely used to retrieve atmospheric features and monitor air pollution. In the MASP, the lidar technique is used to study aerosol optical properties and their impact on air quality [29,30,31], to monitor long-range aerosol transportation from biomass burning areas [32,33,34,35], to study Cirrus cloud optical properties [36,37] and volcanic ashes [38], and also to study the daily aerosol boundary layer behavior [39] and its relation with air quality [40]. In this context, a collaborative effort between three Brazilian research institutions, Instituto de Pesquisas Energéticas e Nucleares-IPEN, Universidade Federal Fluminense-UFF/Volta Redonda and Universidade de São Paulo-USP/Lorena, studied the vertical distribution of atmospheric aerosols by employing a remote sensing lidar system in two different periods and two different urban sites impacted by industries and highway road emissions, and also by aerosol transport episodes.
The main contribution of this paper is to report the measurements of vertical aerosol distribution using a ground-based lidar in the Paraíba valley region. As far as we know, there are no articles in the literature using such a technique to study the aerosol optical properties in this region. The paper is structured as follows: The campaign sites and the instrumentation used in this work are described in Section 2. Section 3 presents the theoretical approach used to invert the lidar signal in order to obtain the aerosol optical coefficient profiles. The data retrieval, as well as the result analysis, are described in Section 4. Finally, the conclusions are presented in Section 5.

2. The Campaign Sites and Instrumentations

In this section, we present a description of the campaign sites, the remote sensing instruments and the air quality dataset.

2.1. Campaign Sites—Paraíba Valley Region

Volta Redonda is a medium size city with about 260,000 inhabitants, located at the Paraíba valley region, 141 km from the city of Rio de Janeiro, in the state of Rio de Janeiro. It grew up around one of the largest steel producers in Latin America, the Presidente Vargas Steelworks, which is the most important Companhia Siderúgica Nacional (CSN) manufacturing unit and one of the state’s main sources of revenue. This steelworks alone, with its two blast furnaces, produces 12.8 thousand tons of pig iron per day. In addition, CSN has a cement plant at the Presidente Vargas unit, with a capacity of 4.3 million tons per year.
Besides, other metallurgical factories were established in the region in order to supply CSN demand, forming a great industrial complex that contributes to local atmospheric pollution and makes imperative a meticulous control of air quality [41,42].
Halfway between the two most important Brazilian cities, Rio de Janeiro and São Paulo, and approximately 133 km from Volta Redonda, at the borders of Presidente Dutra Highway (PDH), is located Lorena, a medium size city with about 90,000 inhabitants, which belongs to the state of São Paulo.
Similarly to Volta Redonda city, Lorena, immersed in the metropolitan region of the Paraíba valley, is surrounded by many kinds of industries, as well as by other large urban areas that contribute to the emission of particulate matter into the atmosphere.
The first lidar campaign in the Paraíba valley was carried out in Lorena and Volta Redonda cities, whose geolocations are marked in red color in the map of the region of the Paraíba valley, see Figure 1a. The Rio de Janeiro and São Paulo megacities are also marked, as well as other important regions along the PDH.

2.2. Instruments

In this section, we describe the instruments and data employed in this work. Firstly, we present the ground-based system used, the mobile MSP-lidar II setup.
In order to acquire information about the atmosphere of the Paraíba valley, such as composition, homogeneity and optical properties, we used the data basis from São Paulo Sanitation Technology Company—CETESB—and from the Cloud-Aerosol Lidar and Infrared Pathfinder Satellite Observations—CALIPSO—satellite. We applied the Hybrid Single Particle Lagrangian Integrated Trajectory—HYSPLIT—model in order to study air mass transport. In this way, we also present, in the next subsections, the CETESB air-quality stations, the remote sensing system on board the satellite platform and a brief explanation of the HYSPLIT model.

2.2.1. Lidar System

The laser remote-sensing techniques, such as lidar, are very important due to their long-range non-invasive probes of the chemical composition and physical properties of the atmosphere. The lidar technique is based on the emission of a pulsed collimated laser beam in the atmosphere and on the detection of the backscattered radiation by the suspended aerosol particles, molecules and atoms present in the air. The intensity of the backscattered light is recorded as a function of time, and thus provides the required spatial resolution of the measurement. The mobile MSP-lidar II setup (Commercial Raymetrics LR101-V-D200) used in this work consists of a Q-Switched Nd:YAG laser (CFR 200 by Quantel SA) operating at the second harmonic frequency of 532 nm, with 6.7 ns pulse duration, 20 Hz repetition rate, and a maximum pulse energy of 130 mJ. The emitted laser beam is expanded (4×) and pointed vertically to the zenith. The beam has a divergence of less than 0.5 mrad. The backscattered laser light is detected by a 20 cm diameter Cassegrainian telescope (F# = 4.5) with 1 mrad Field of View (FOV) that provides the full overlap around 180 m. This FOV value, in accordance with the detection electronics, permits probing the atmosphere up to the free troposphere (12–15 km). The backscattered laser radiation is sent to the signal acquisition unit, consisting of two Hamamatsu R7400 Photo Multiplier Tubes (PMTs) coupled to narrow band (1 nm FWHM) interference filters for the elastic backscatter channel, at 532 nm. The PMT output signal is digitized by a lidar Transient Recorder TR-20-160 (LICEL) with an acquisition analog channel with 12 bits resolution at 20 MHz sampling rates. Each data profile is acquired using an integrated time of 100 s, with a typical spatial resolution of 7.5 m. This mobile system is part of the Latin America Lidar Network (LALINET) [43,44] and has been used in other studies [32,45].

2.2.2. CETESB Air Quality Stations

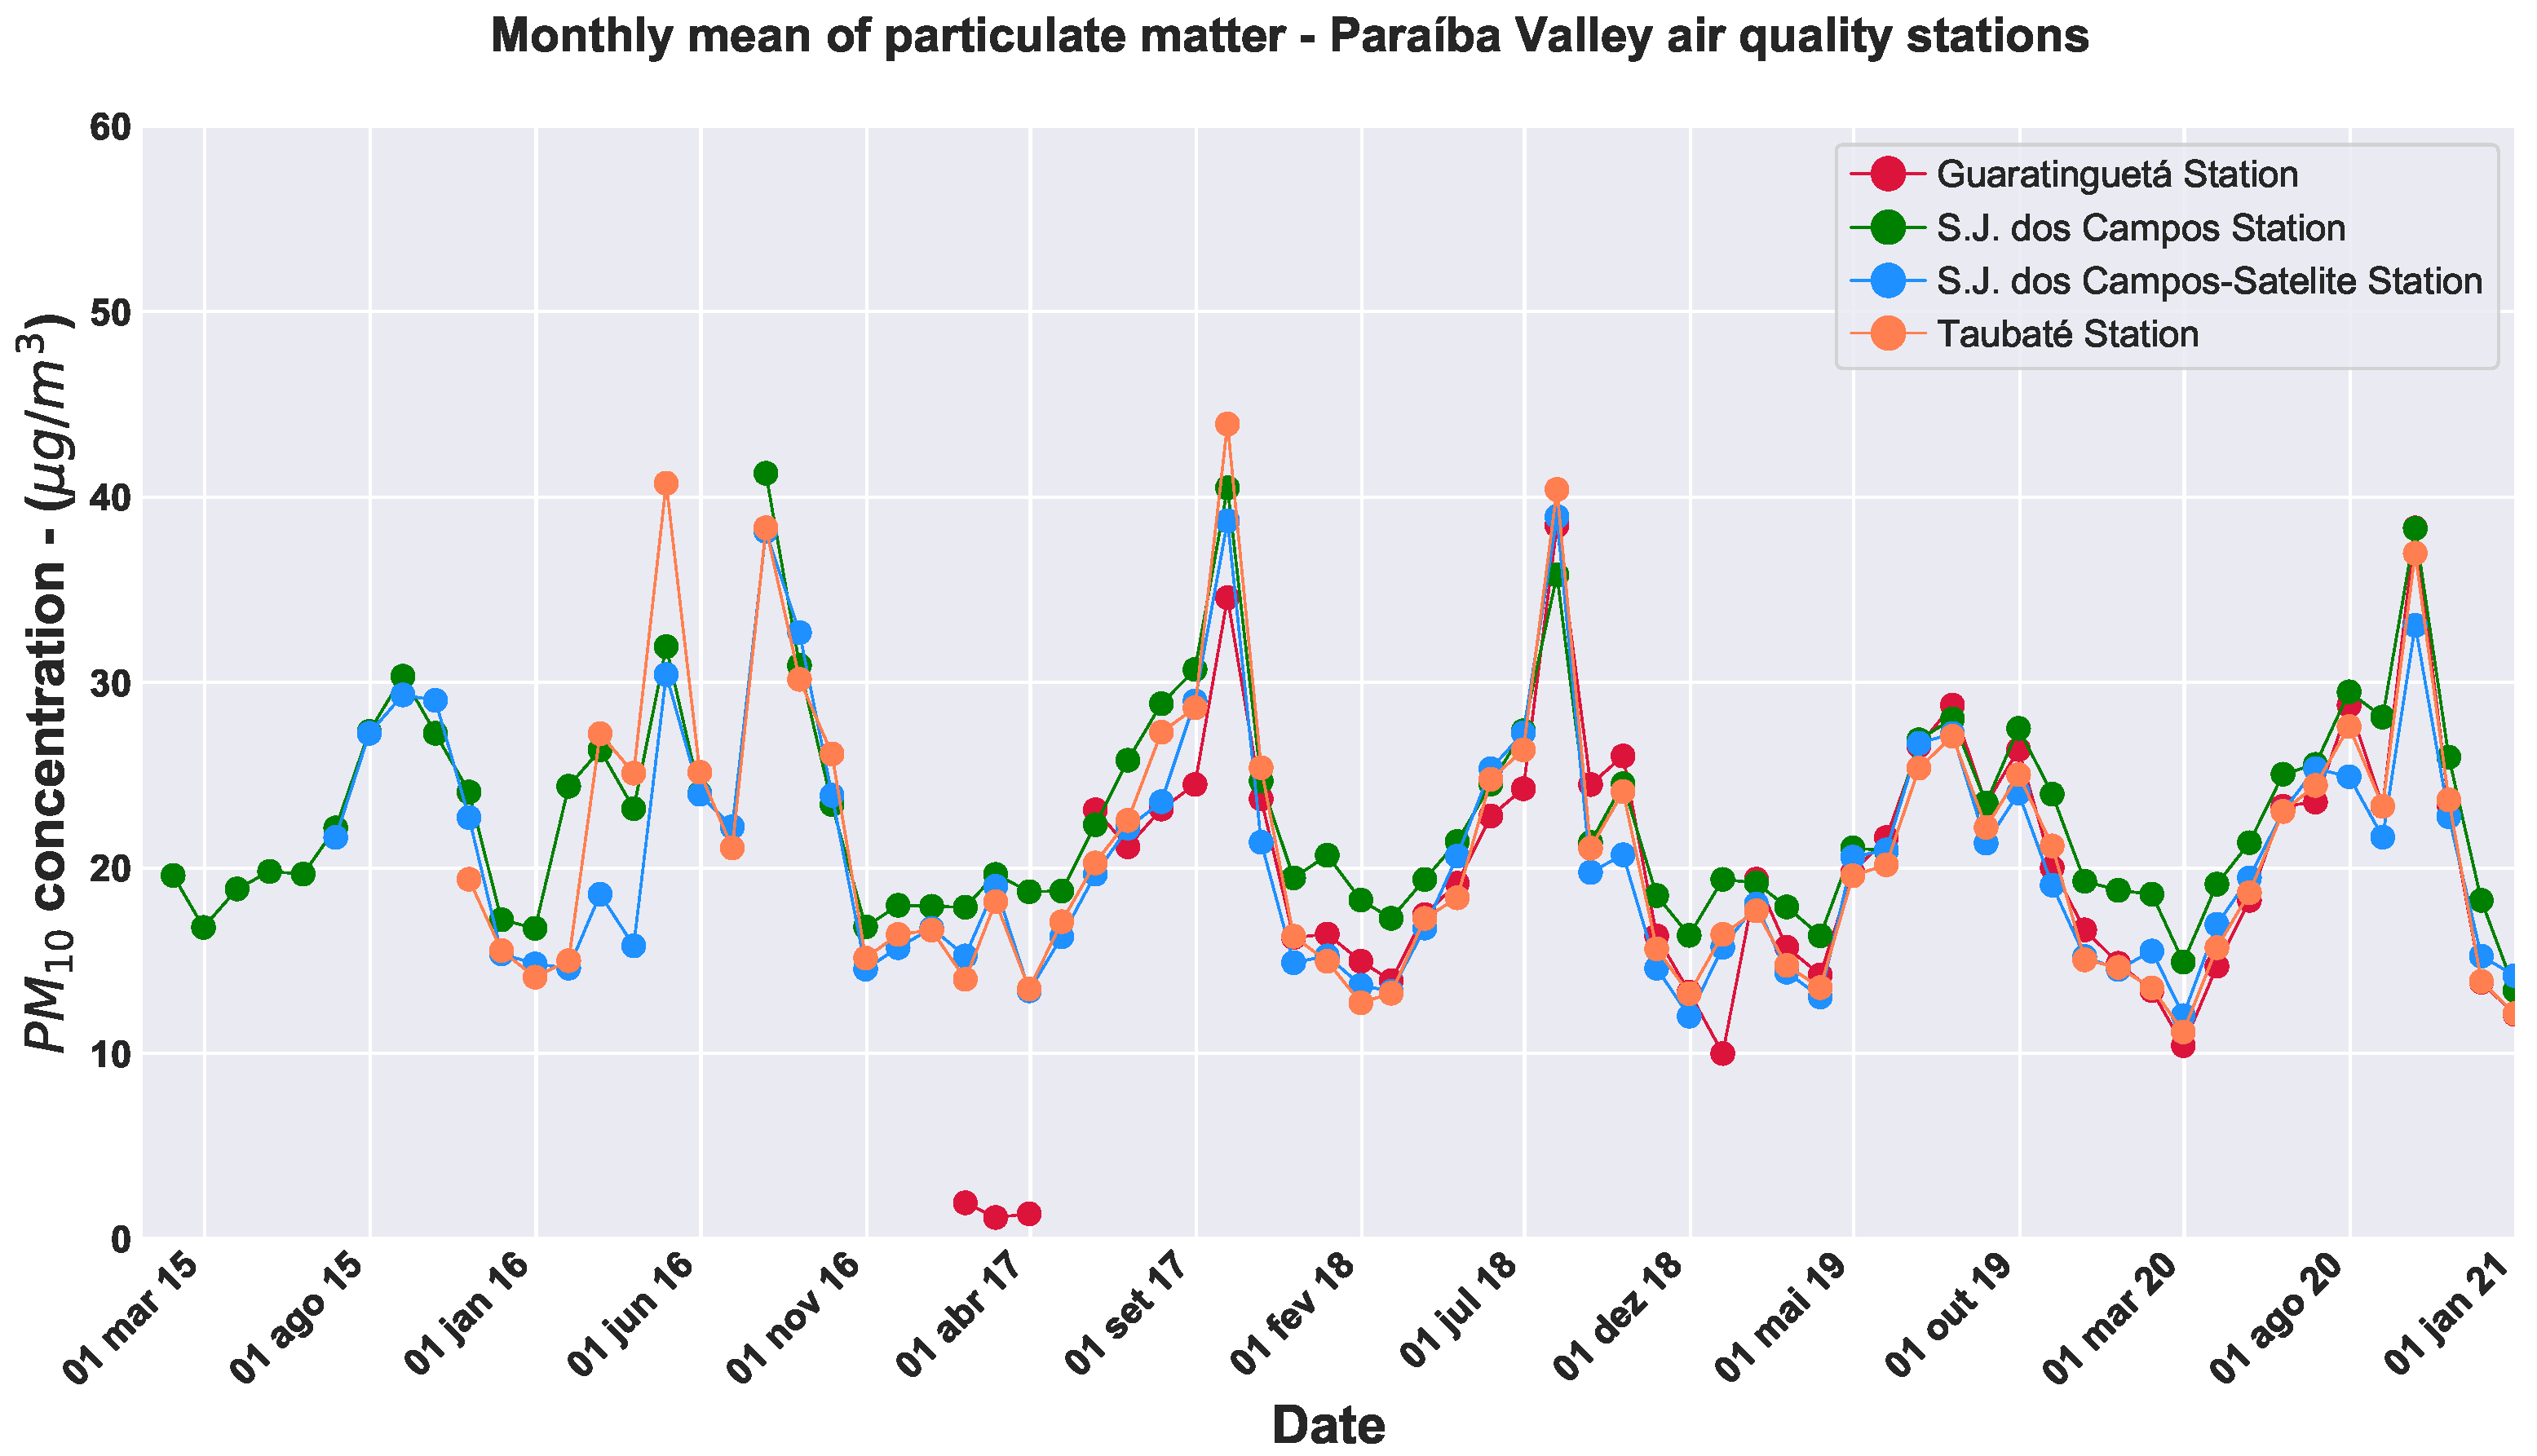
The air quality index and particulate matter concentration in the São Paulo state is provided by CETESB, which started air pollution and air quality monitoring in 1975 [7]. The CETESB has a total of 61 automatic stations to monitor concentrations of inhalable particles ( P M 2.5 and P M 10 ) and gas concentration such as sulfur dioxide ( S O 2 ), nitrogen monoxide and dioxide ( N O and N O 2 ), nitrogen oxides ( N O X ), carbon monoxide ( C O ), and ozone ( O 3 ). The CESTEB air quality network provides near real-time data based on hourly averages that are available in a web platform and since 2013 has changed its regulations in order to include standards for fine particle and gas concentrations more restrictive and based on guidelines established by WHO [7,46]. According to the CETESB annual report [46], the main sources of pollution in Paraíba valley is light-duty vehicles (LDV, e.g., passenger cars) running on gasohol or hydrated ethanol, heavy-duty vehicles (HDV, e.g., trucks and buses) running on diesel, and motorcycles running on gasohol commuting by the Presidente Dutra Highway; industries of several types, such as chemical, pharmaceutical, petrochemical, and steel and fertilizer manufacturing; and also long-range pollutant transportation from sugarcane burning and forest fires. In order to provide an air quality overview of the Paraíba valley region, monthly mean particulate matter concentrations were retrieved from four CETESB stations installed in three different cities, i.e., in São José dos Campos (with two stations—S. J. dos Campos and S. J. dos Campos-Satelite), Taubaté and Guaratinguetá, as can be seen in Figure 1.

2.2.3. CALIPSO Satellite

In the last decades, several efforts have been made to achieve global Earth monitoring using remote sensing techniques. As part of this effort, in April of 2006, the CALIPSO satellite was launched in order to provide the vertical profile of the Earth’s atmosphere on a global scale [47]. The satellite flies as part of the A-Train satellite constellation, in a 705 km sun-synchronous polar orbit with an equator-crossing time of about 13:30 local solar time. The Cloud-Aerosol Lidar with Orthogonal Polarization (CALIOP) is the primary instrument aboard CALIPSO and works based on a two-wavelength laser, 532 nm and 1064 nm, with a pulse repetition rate of 20.16 Hz [48]. The CALIOP measures attenuated backscatter coefficients using both mentioned wavelengths, with a horizontal resolution of 333 m and a variable vertical resolution according to the values: 30 m from the ground up to 8.2 km, 60 m from 8.2 km up to 20.2 km, and 180 m from 20.2 km up to 30.1 km. Several CALIOP data products are gathered from the attenuated backscatter signals and separated in two categories to monitor the atmospheric optical properties: Level 1 profiles, composed by the attenuated profiles; and level 2, which are derived from level 1 products and are composed of layer, profiles and vertical feature mask (VFM) products [49]. The CALIOP algorithms use a set of information about the aerosol layers such as altitude, location, surface type, depolarization ratio and integrated attenuated backscatter, in order to classify the aerosol subtype in the troposphere region applying a selection scheme [50,51]. The CALIOP aerosol subtype classification scheme for version 4 level 2 data enables the derivation of a total of 11 different types of aerosol: Clean marine, dust, polluted continental/smoke, clean continental, polluted dust, elevated smoke, dusty marine for the tropospheric region, and polar stratospheric aerosol, volcanic ash, sulfate/other, smoke, for the stratospheric region. For each aerosol subtype, it is assigned an extinction-to-backscatter ratio (i.e., lidar ratio) and its uncertainty [50,51]. The lidar ratio is applied to another set of algorithms and plays an important role in the aerosol extinction profile and aerosol optical depth retrieval [52]. In this manuscript, Level 2 version 4.10 was employed to derive important aerosol optical properties such as AOD, lidar ratio and aerosol subtype in order to describe the aerosol mean profile, variability and trends in the MAPV.

2.2.4. HYSPLIT Air-Mass Trajectories

The HYSPLIT model is a hybrid model between the Lagrangian and the Eulerian approach [53,54]. The Lagrangian method is applied to calculate the advection and diffusion as backward trajectories of the air parcels, and the Eulerian method is applied to compute the pollutant air concentrations using a fixed three-dimensional grid as a frame of reference. The combination of these two methodologies allows the HYSPLIT model to compute air parcel trajectories, complex transport, dispersion, deposition, and chemical transformation. In this work, the HYSPLIT model was applied to estimate the backward trajectories of air parcels for 72 and 120 h, with a temporal resolution of 6 h, in order to estimate the influence of aerosol from long-range transportation during the Lorena and Volta Redonda campaigns.

3. Lidar Retrieval Methodology

The expected elastic return signal from a pure molecular atmosphere can be written as
P m ( λ , z ) 1 z 2 β m o l ( λ , z ) × exp 2 0 z α m o l ( λ , z ) d z ,
where λ is the wavelength of the radiation, z is the altitude above ground level (a.g.l.), and α m o l ( λ , z ) and β m o l ( λ , z ) are the molecular extinction and backscatter coefficients. The molecular extinction coefficient is computed as
α m o l ( λ , z ) = N s σ r a y ( λ , C O 2 ) P ( z ) / T ( z ) P s t d / T s t d ,
where N s is the molecular number density for standard atmosphere ( 2.5469 × 10 25 m 3 ), σ r a y ( λ , C O 2 ) is the total Rayleigh scattering cross section per molecule, written as a function of the wavelength and the C O 2 concentration factor C O 2 , and P ( z ) and T ( z ) are the pressure and temperature for a given altitude. For calculation of the molecular backscatter and extinction atmospheric components, we considered the same approach done by Bodhaine et al. [55], taking into account the C O 2 and total water vapour concentration (which is considered small and does not significantly affect the above calculations). For λ = 532 nm and C O 2 = 392 ppm, the Rayleigh cross section is σ r a y = 5.1706 × 10 31 m 2 , considering the King correction factor calculated as given in [55,56,57] in order to correct for dispersion and scattering of light due to the effects of molecular anisotropy. For these calculations, we used the depolarization values of the gases O 2 , N 2 , C O 2 and A r according to Bates [57]. In addition, the molecular backscatter coefficient is obtained by
β m o l ( λ , z ) = α m o l ( λ , z ) 4 π P r a y ( θ , λ , C O 2 ) ,
with the depolarization function
P r a y ( θ , λ , C O 2 ) = 3 4 ( 1 + 2 γ ) ( 1 + 3 γ ) + ( 1 γ ) cos 2 θ ,
where γ = ρ n / ( 2 ρ n ) and ρ n is the depolarization factor [56]. The proportionality factor of Equation (1) can be obtained by comparison with the background ( BG ) subtracted elastic signal, P ( λ , z ) BG . Both the proportionality factor A and the background BG can be obtained by performing the linear fit,
P ( λ , z 0 ) = A P m ( λ , z 0 ) + BG .
Notice that the linear relation is only true if no aerosols are present in the region around z 0 selected for the regression. While this could indicate that a region of very high altitude would be a better one to perform the fit, the decrease of the signal-to-noise ratio of the lidar measurement as a function of altitude makes difficult the choice of the best region. In this work, the regions chosen to perform the fit were the ones that produced a good quality fit and did not result in non-physical solution for the aerosol backscatter coefficient. By defining the range corrected signal (RCS) as
S ( z ) = [ P ( λ , z ) BG ] × z 2 ,
we can compare the scaled molecular simulated signal with the RCS, S ( z 0 ) , to check if the lidar apparatus was properly aligned.
The expected lidar return when aerosols are present in the atmosphere is
P ( λ , z ) 1 z 2 β ( λ , z ) × exp 2 0 z α ( λ , z ) d z ,
with β = β m o l + β a e r and α = α m o l + α a e r , where β a e r and α a e r are the aerosol backscatter and extinction coefficients. The retrieval of aerosol profiles was performed by applying the Klett–Fernald–Sasano (KFS) inversion method ([28]). Therefore, the aerosol backscatter coefficient β a e r is obtained using the definition of particle extinction-to-backscatter ratio, also known as the lidar ratio, L a e r ( z ) = α a e r ( z ) β a e r ( z ) .
β a e r ( z ) = S ( z ) exp 2 z 0 z ( L a e r ( z ) L m o l ) β m o l ( z ) S ( z 0 ) β a e r ( z 0 ) + β m o l ( z 0 ) 2 z 0 z L a e r ( z ) S ( z ) T ( z , z 0 ) d z β m o l ( z )
in which L m o l ( z ) = α m o l ( z ) / β m o l ( z ) = 8 π / 3 sr and
T ( z , z r e f ) = exp 2 z r e f z [ L a e r ( z ) L m o l ] β m o l ( z ) d z .
The reference range z r e f is chosen such that at z r e f the aerosol backscatter coefficient is negligible compared to the molecular backscatter value. It is important to note that the value of L a e r is not well known and depends on an a priori assumption; therefore, it contains large uncertainties [28].

4. Data Retrieval and Results

The results retrieved in this study, based on satellite and ground-based remote sensing systems, are presented and discussed in this section. First, we present results of air quality analysis from stations installed on four cities of MRPV from 2015 to 2020, and an analysis of aerosol optical properties retrieved from CALIPSO satellite from the period of 2006 to 2020 for Volta Redonda and Lorena in order to describe an overview of air pollution impact on air quality of the region. Subsequently, we present results from two important campaigns developed in Volta Redonda and Lorena locations using the ground-based lidar. These two campaigns mainly contributed to achieving, for the first time, the monitoring of the vertical distribution of aerosol in the MRVP, detecting episodes of intense pollution within the atmospheric boundary layer and also detecting detached aerosol layers above the atmospheric boundary layer, which can indicate the possibility of long-range aerosol transportation that will be investigated using the HYSPLIT trajectory model.
This first effort to monitor aerosol optical properties and their vertical distribution can encourage initiatives to develop a monitoring network in this region and use the measured atmospheric data to improve numerical prediction models of air quality indices.

4.1. Air Quality Overview over Paraíba Valley

As mentioned earlier, in order to provide an air quality overview of the Paraíba valley region, monthly mean particulate matter concentrations were retrieved from four CETESB stations installed in three different cities, São José dos Campos (S. J. dos Campos and S. J. dos Campos-Satelite stations), Taubaté and Guaratinguetá, as can be seen in Figure 1. Concentration values of P M 10 were used since it is the single common product for all stations.
The monthly mean particulate matter concentration, taking into account four CETESB air quality stations spread across the metropolitan region of Paraíba valley, shows an increase in air pollutant episodes during dry seasons, between June and October of the subsequent years (2015 to 2020), reaching peaks of pollution during September for all years, except 2019, as can be seen in Figure 2. The period of high values of particulate matter concentration coincides with the dry season in the Southeastern region of Brazil, when there is low precipitation and several episodes of biomass burning events that can be detected all over South America [32,33,34,35], especially in September. These results show a pattern in the aerosol concentration values and demonstrate that there is a homogeneity in the Metropolitan Region of Paraíba valley.

4.2. CALIPSO Satellite Retrieval

The CALIPSO satellite data were used for two main purposes, to obtain the complete overview of the aerosol optical properties in this axis connecting region between two major capitals, São Paulo and Rio de Janeiro, and also to cover the absence of a second remote sensing instrument, such as a sunphotometer, which can be used to tune the first guess of lidar ratio values and AOD retrievals. The 5 km aerosol layer data from CALIPSO version 4 were employed to retrieve the AOD and lidar ratio values at 532 nm for Volta Redonda and Lorena sites, where monitoring campaigns were carried out with the MSP-LIDAR II system. We calculated the mean and standard deviation of AOD values for the period from 2006 to 2020 retrieved by CALIPSO satellite at 532 nm in order to quantify aerosol optical properties for both campaign sites. In order to reduce the dependence with horizontal distances and increase the correlation between CALIPSO retrievals and the ground-based measurements, only cloud-free measurements were considered with CALIPSO overpasses inside a horizontal spatial range of 120 km centered at the closest distance between the ground-based station and satellite ground-track [58,59,60]. It is important to note that AOD values retrieved from the CALIPSO satellite can present large uncertainties considering thin or undetected layers. Poor extinction retrievals from layers within the column can impact the quality of the column optical depths. For instance, Kim et al. [61] uses two years of CALIOP and Moderate Resolution Imaging Spectroradiometer (MODIS) data to quantify the aerosol optical depth of undetected layers of aerosol (ULA), showing the fraction of undetected backscattering layers are higher during daytime when compared to nighttime, mostly because a large amount of solar background noise lowers the signal-to-noise ratio. However, ULA is larger in the northern hemisphere and relatively larger at high latitudes, which is an important point for our results over South America.
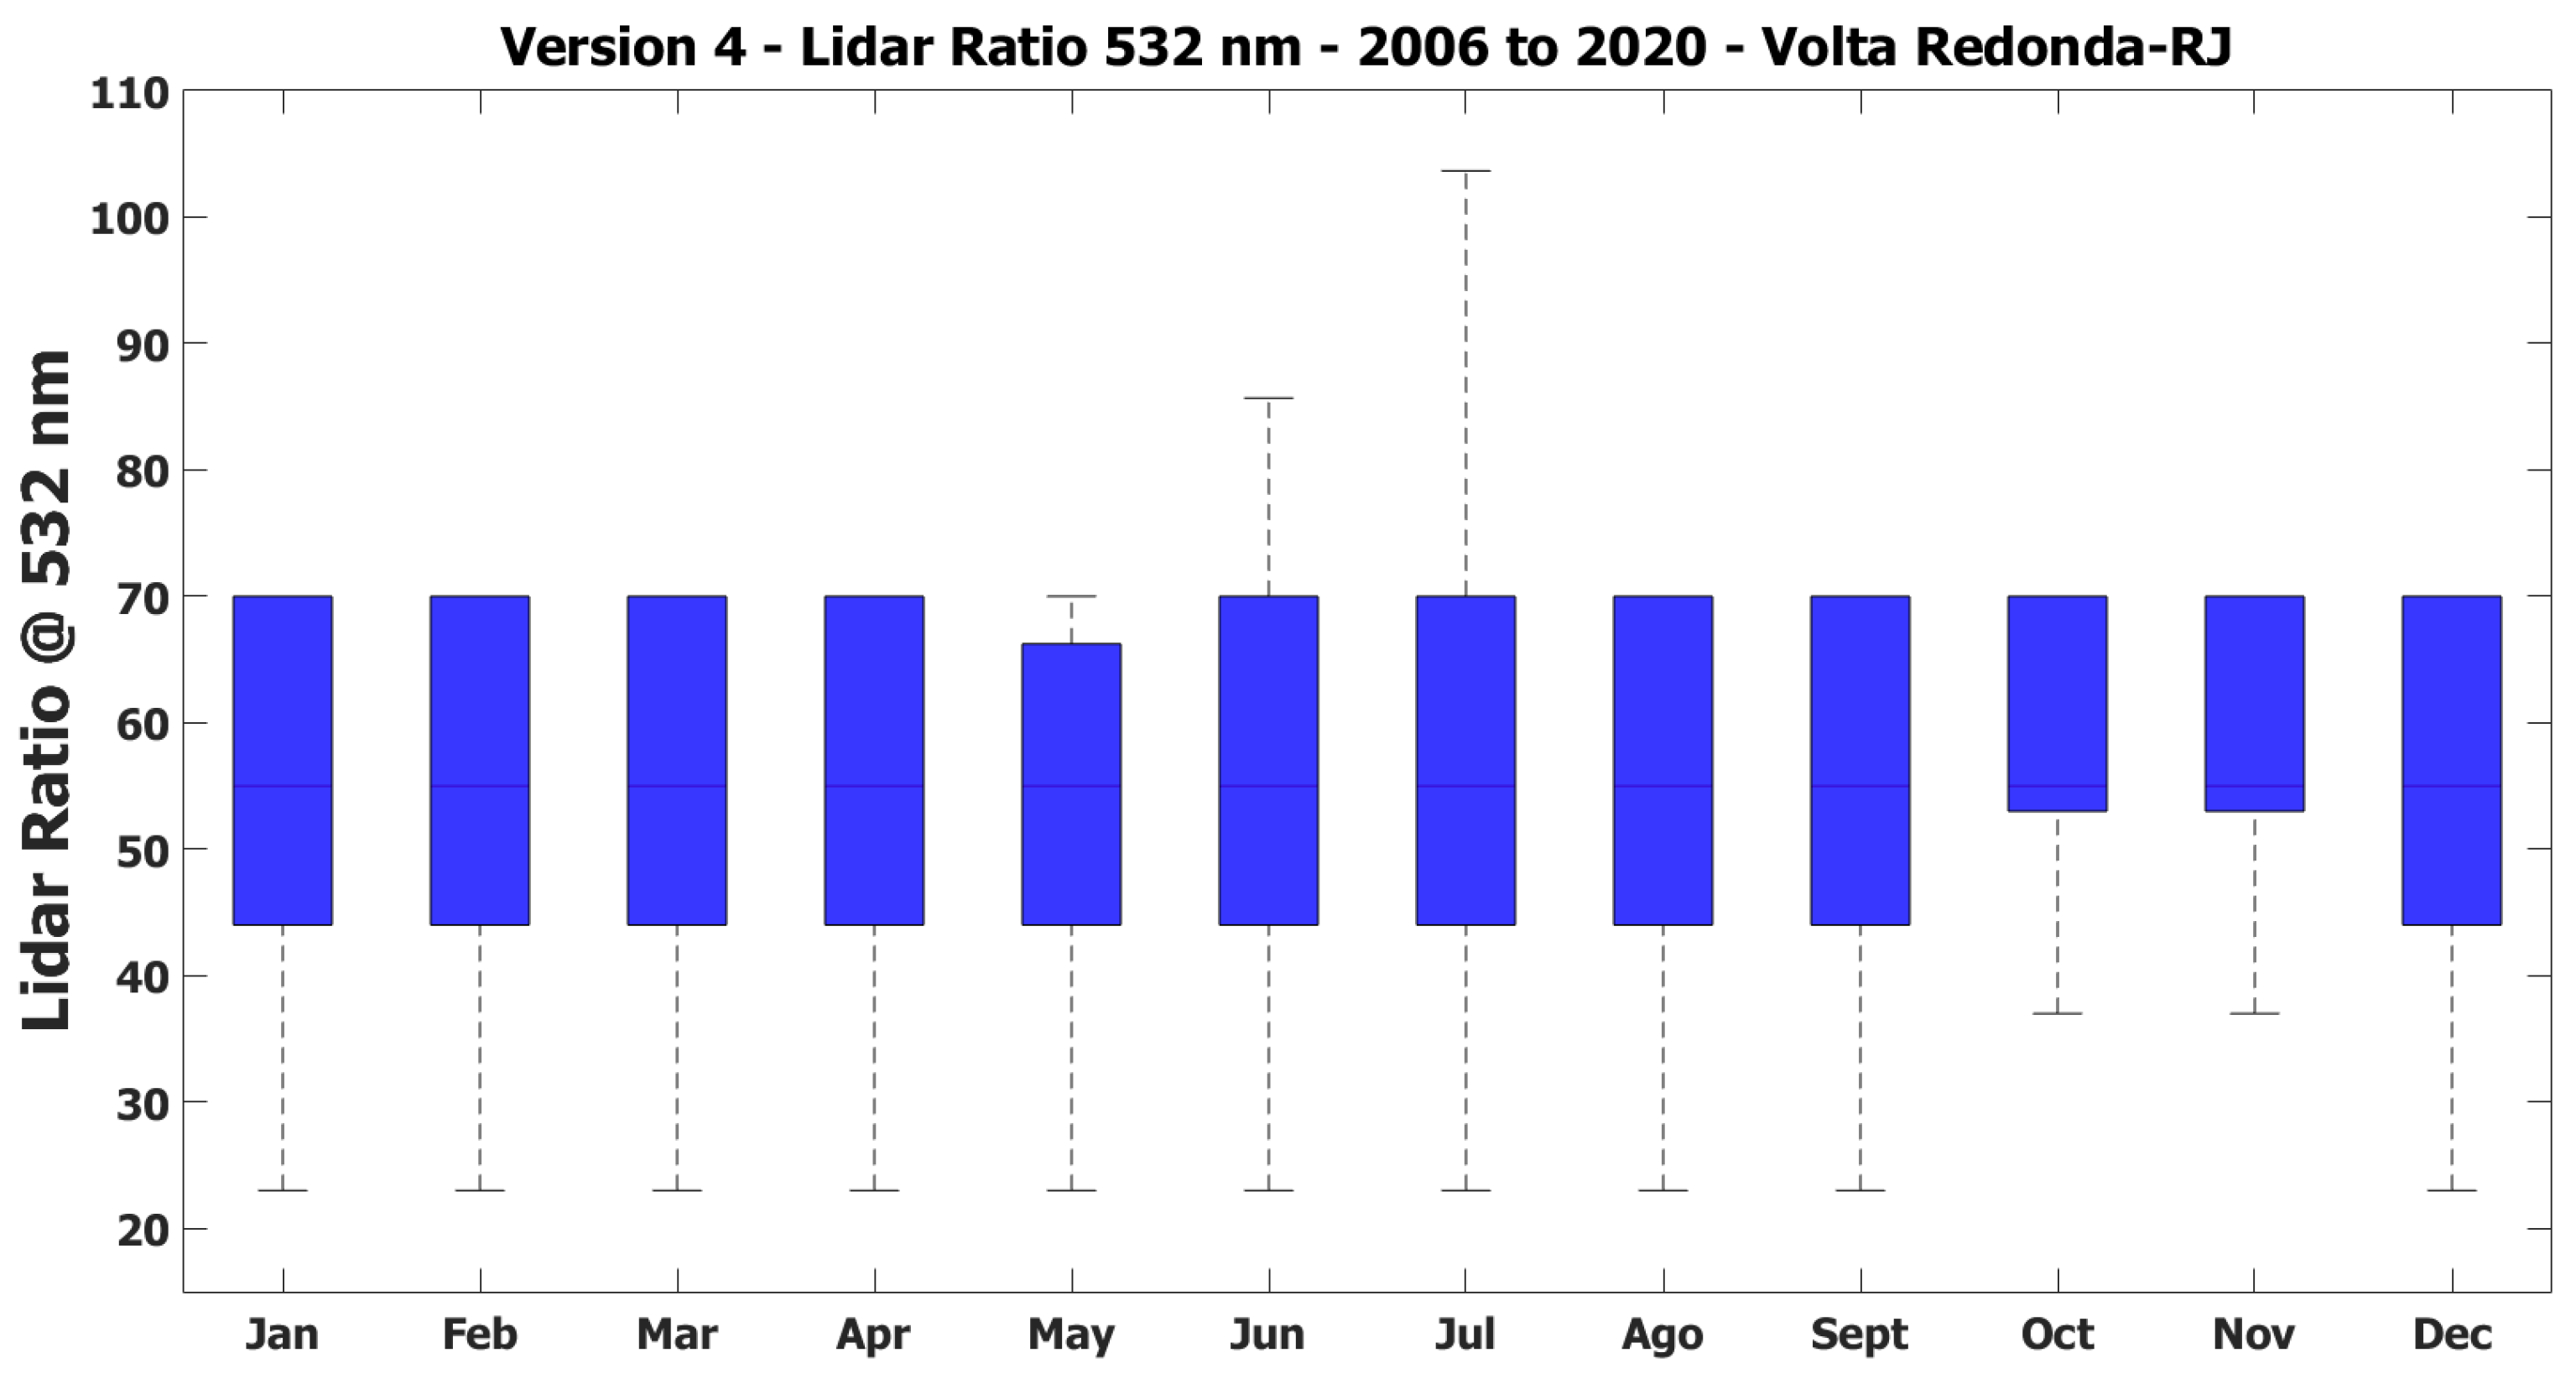
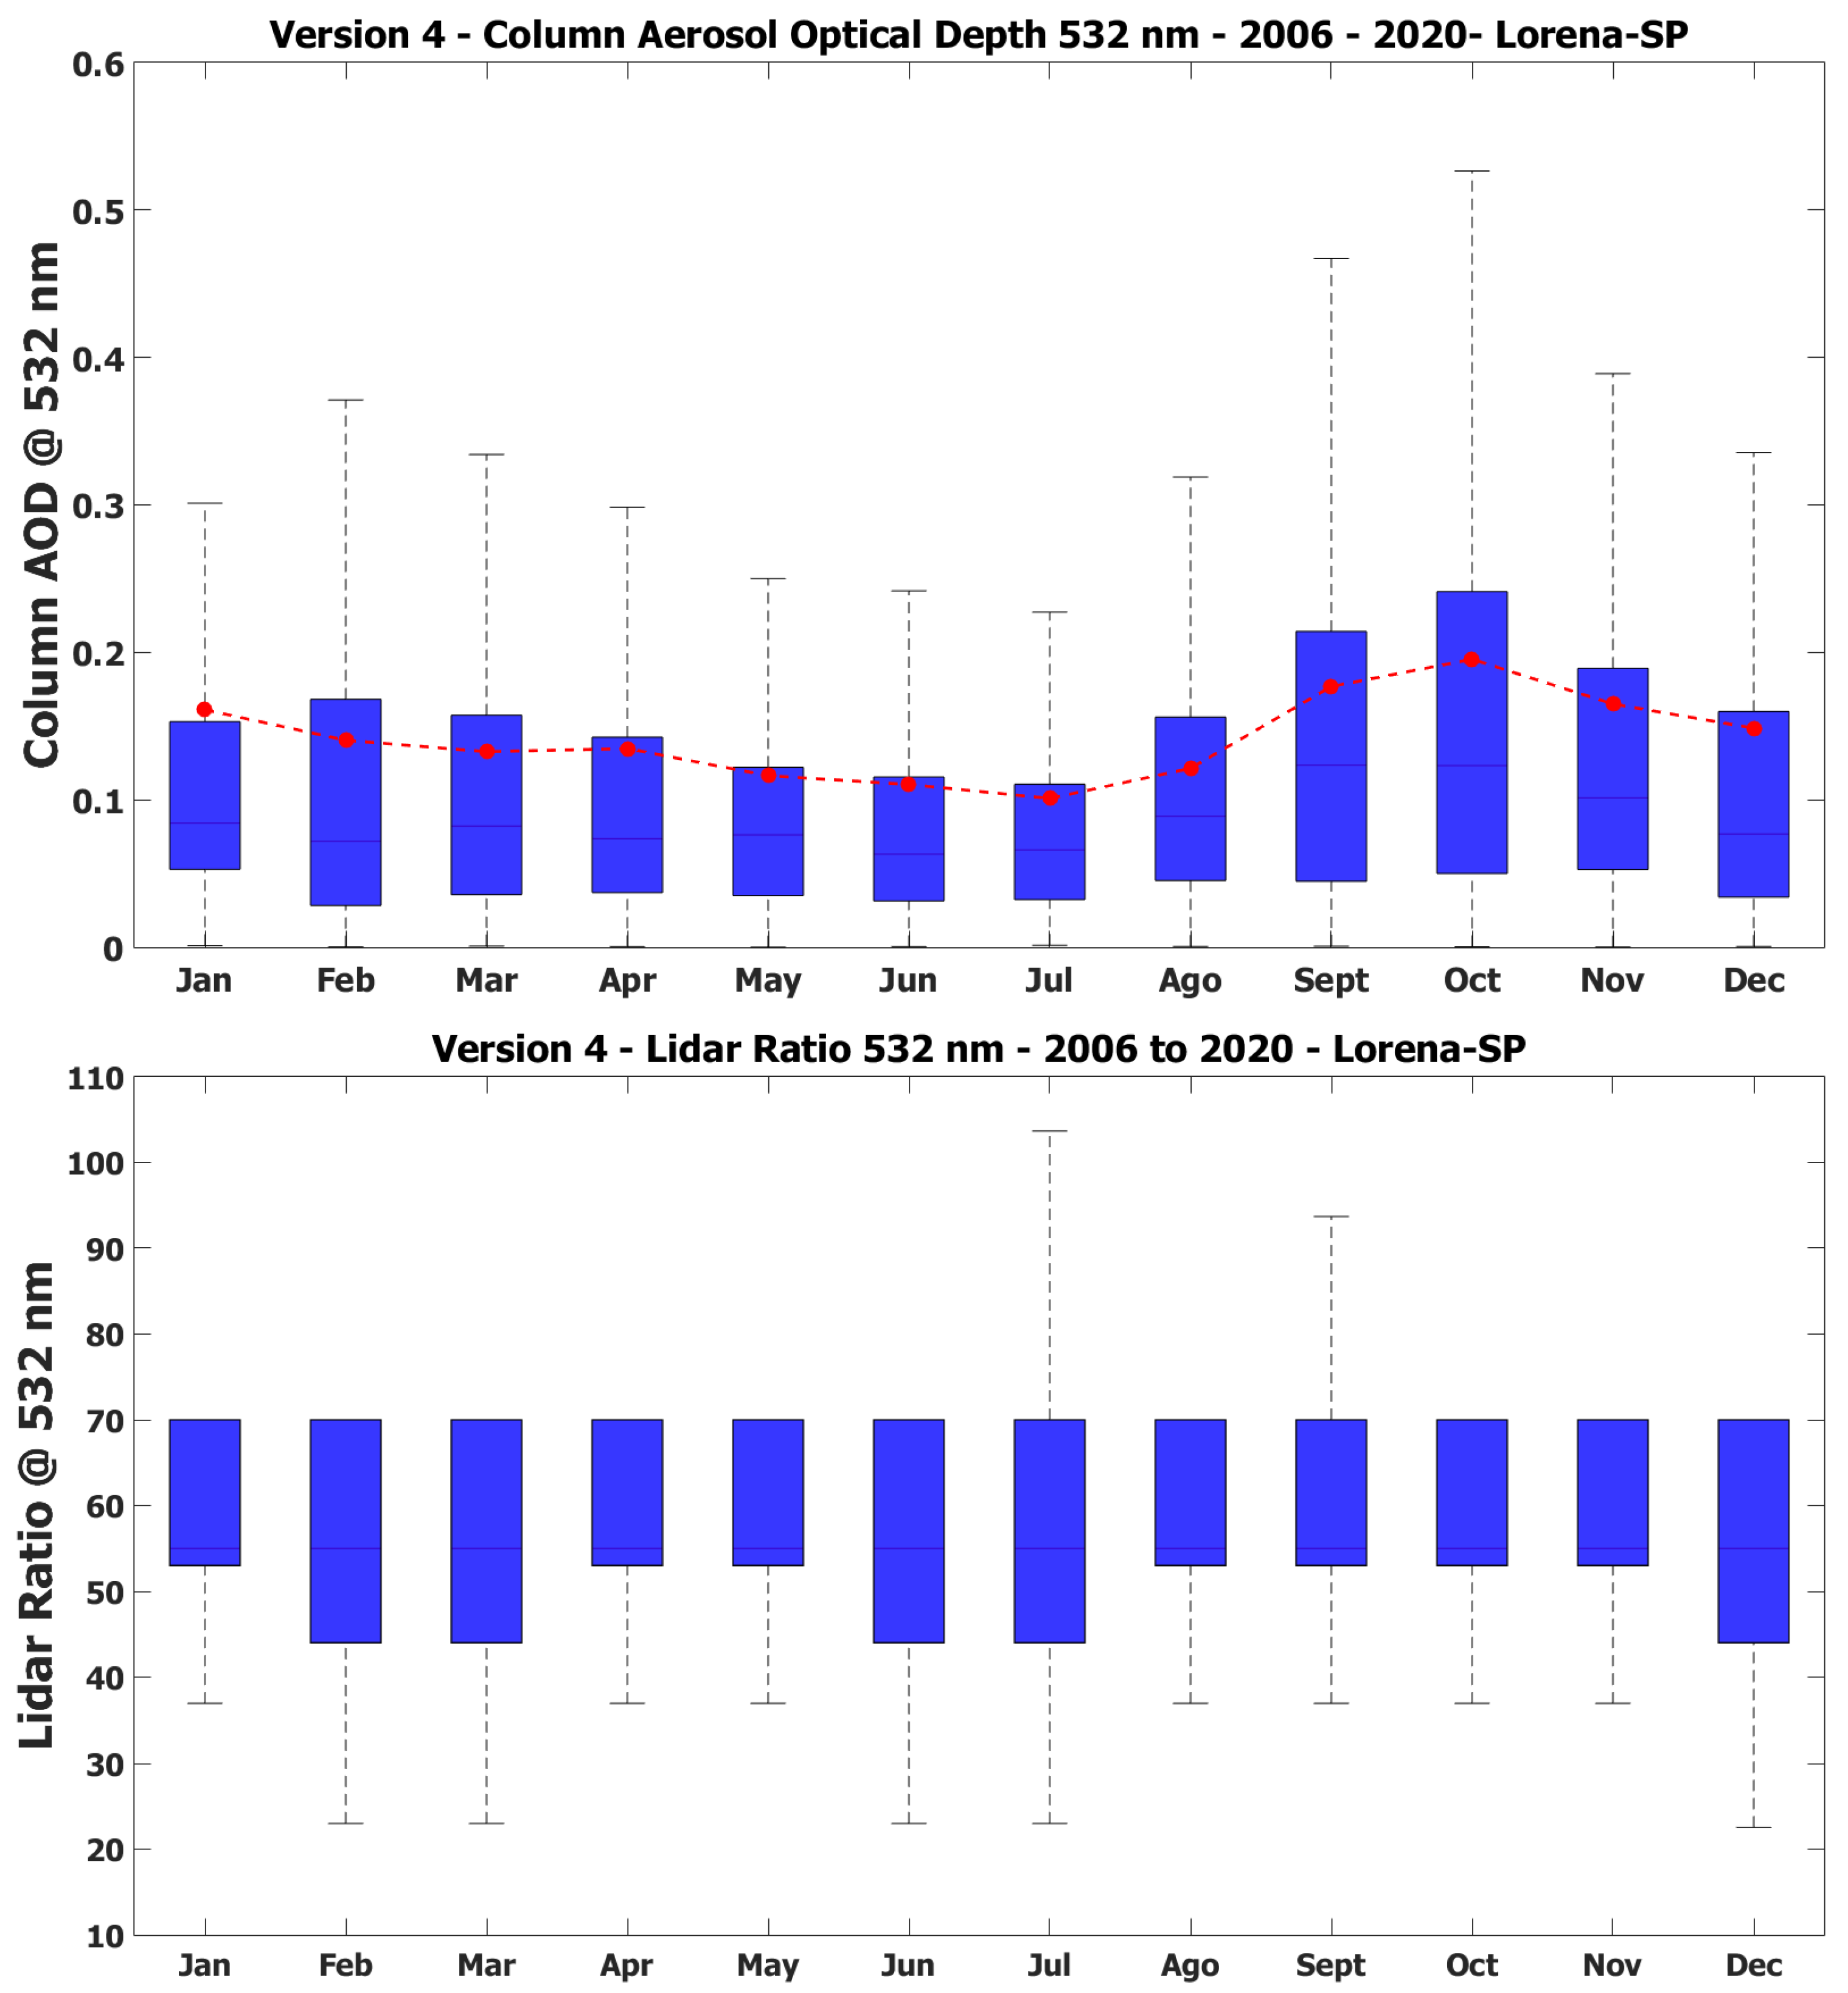
By analyzing aerosol optical depth values at 532 nm for both locations, we can see similar AOD annual patterns. Volta Redonda presents AOD mean values of 0.15 ± 0.22 , with the lowest mean value in June, 0.10 ± 0.15 , and the upper mean AOD in October 0.21 ± 0.29 . The whisker plot results present high variation in the interquartile range values in the months of September and October, where 50% of the total AOD values span from 0.06 to 0.25, as can be seen in Figure 3. Likewise, Lorena presents the same pattern of AOD values at 532 nm, with a mean AOD value of 0.14 ± 0.20 , with the lowest mean AOD of 0.10 ± 0.13 in July and the upper mean value of 0.20 ± 0.25 in October, as shown in Figure 4. The whisker plot results also present high variation in the interquartile range values in the months of September and October, where 50% of the total AOD values are allocated between values of 0.05 and 0.24, which agreed with the increase of the particulate matter concentration measured by the air quality stations of the Paraíba valley region, as presented in Figure 2. The analyses present the same rationale for CALIOP lidar ratio at 532 nm product for both locations. Lidar ratio products for Volta Redonda span from 44 sr to 70 sr most of the year, with a mean value of 55 sr for all months. In the case of the Lorena site campaign, the lidar ratio values span from 53 sr to 70 sr during most of the year, with mean values of 55 sr for all months, as can be seen in Figure 3 and Figure 4.
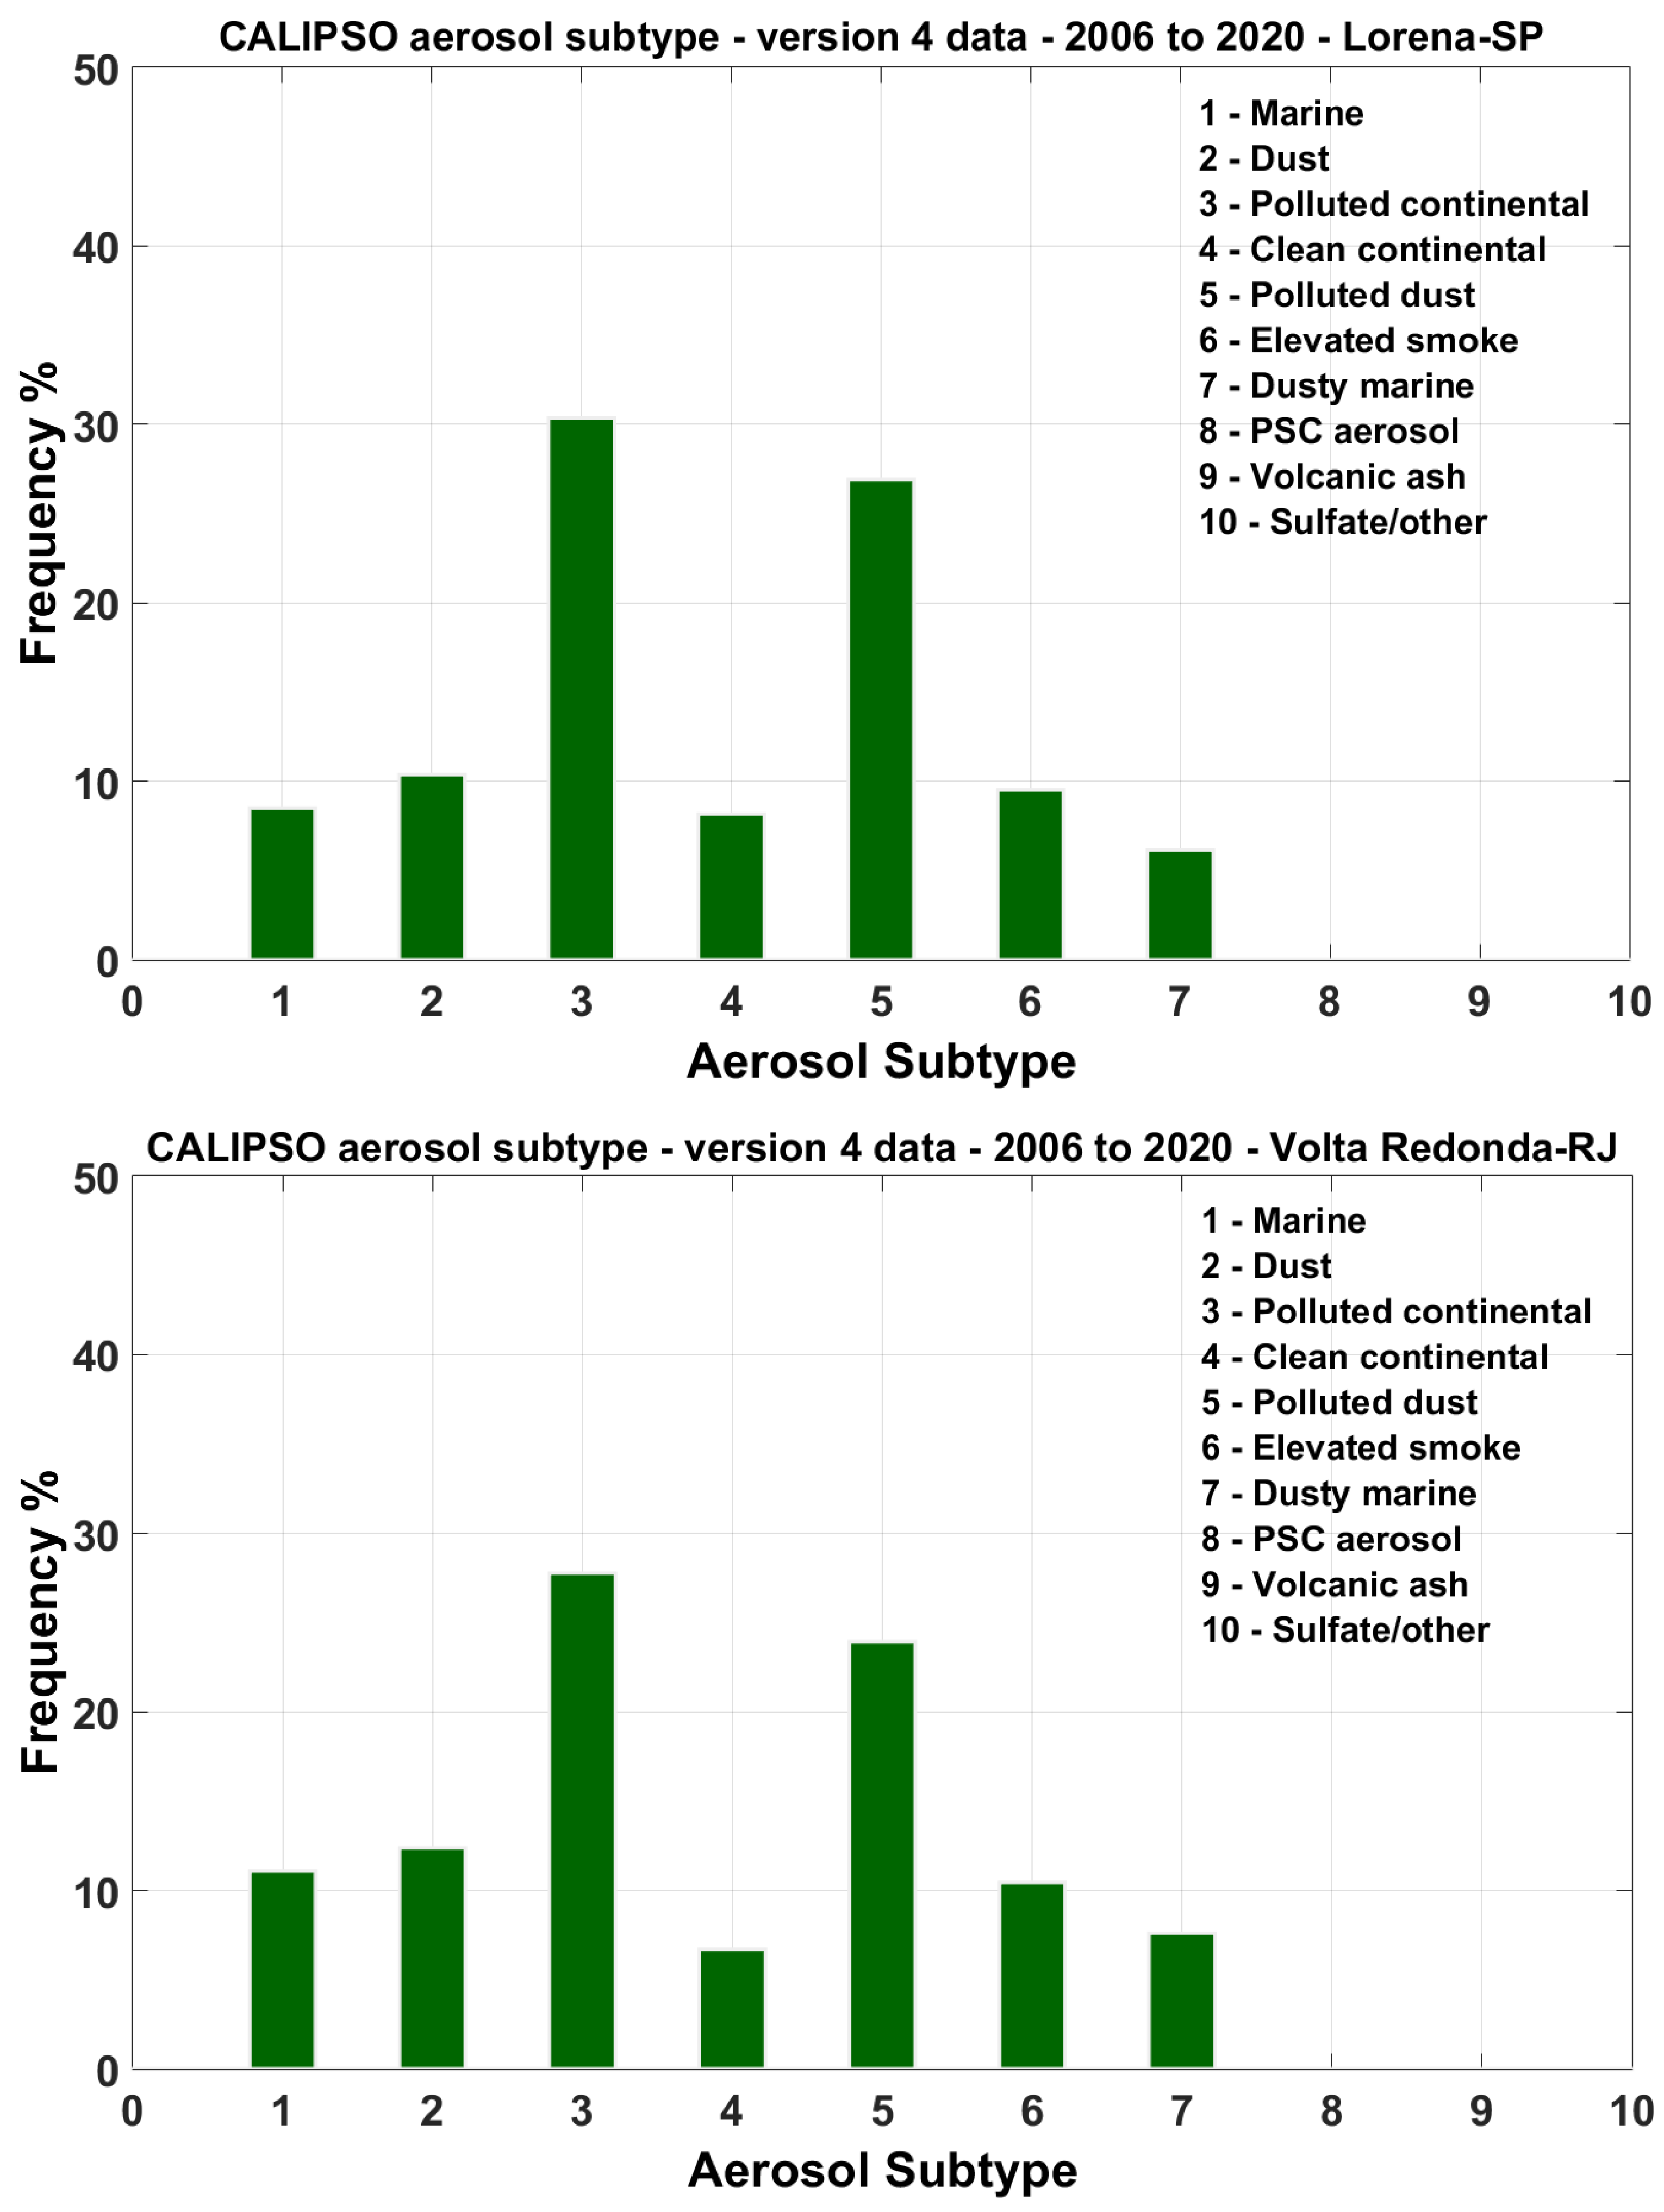
CALIOP’s aerosol subtype plays a critical role for the aerosol optical properties retrieval, more specifically, for extinction profiles of level 2 CALIPSO data. In the context of this work, the aerosol subtype classification is also important to derive the most relevant types of aerosol present in the atmosphere of the Volta Redonda and Lorena sites. As can be seen in Figure 5, it is possible to retrieve the most significant aerosol subtype from the histogram of aerosol subtype frequency. Volta Redonda presents relevant frequency values for polluted continental aerosol (≈28%), polluted dust (≈24%) and elevated smoke, with 11% occurrence from June 2006 to December 2020. The Lorena site follows the same pattern of aerosol classification, where most of the aerosol detected is flagged as polluted continental (≈30%) and polluted dust (≈27%).
The MSP-LIDAR II system was the only single remote sensing instrument employed during the measurement campaigns in Volta Redonda and Lorena. In both locations there is no structure for atmospheric monitoring, such as weather stations, sun-photometers, ceilometers, particulate matter sensors, etc. For this reason, CALIOP data products and its aerosol subtype classification were applied as reference to constrain the lidar ratio value applied to the inversion problem and to retrieve the backscatter profiles. In order to retrieve particle backscatter profiles at 532 nm, the Klett–Fernald–Sasano inversion method [62,63,64] was applied by tuning the initial lidar ratio assumption with the lidar ratio values from CALIOP aerosol subtype classification algorithms [51].

4.3. Volta Redonda and Lorena Campaigns

The lidar data were collected in the Escola de Engenharia de Lorena (EEL) at Universidade de São Paulo-USP (22.4152 ° S and 45.1194 ° W, 524 m above sea level) and in the Escola de Engenharia Industrial Metalúrgica de Volta Redonda-EEIMVR at Universidade Federal Fluminense-UFF (22.5160 ° S and 44.1046 ° W, 340 m above sea level). Figure 1b,c present the locations (red pins) where the lidar apparatus was placed during the Lorena and Volta Redonda campaigns. In Figure 1c, the yellow contour indicates the CSN area. The periods of data collection were from 31 May until 24 July 2014, in Lorena, and from 6 November until 9 December 2018, in Volta Redonda. In the latter campaign, the weather was rainy and only measurements performed from 4 December 17:10 until 5 December 6:20 local time were selected to be presented in this paper.
The lidar system was the only single remote sensing instrument employed during the measurement campaigns in Volta Redonda and Lorena. Considering a small underestimation of CALIOP lidar ratio values of 1.4 % ± 8.0 % for polluted continental aerosol type and 7.3 % ± 13.0 % for polluted dust reported in [65], we used the CALIOP data products as reference to constrain the lidar ratio value in order to retrieve the backscatter profiles. Based on the mean lidar ratio values obtained from the boxplot analysis (Figure 3 and Figure 4) and the aerosol classification frequency presented in Figure 5, a fixed lidar ratio value of L a e r = 55 ± 22 sr was used in order to retrieve the backscatter aerosol profiles for both campaigns.
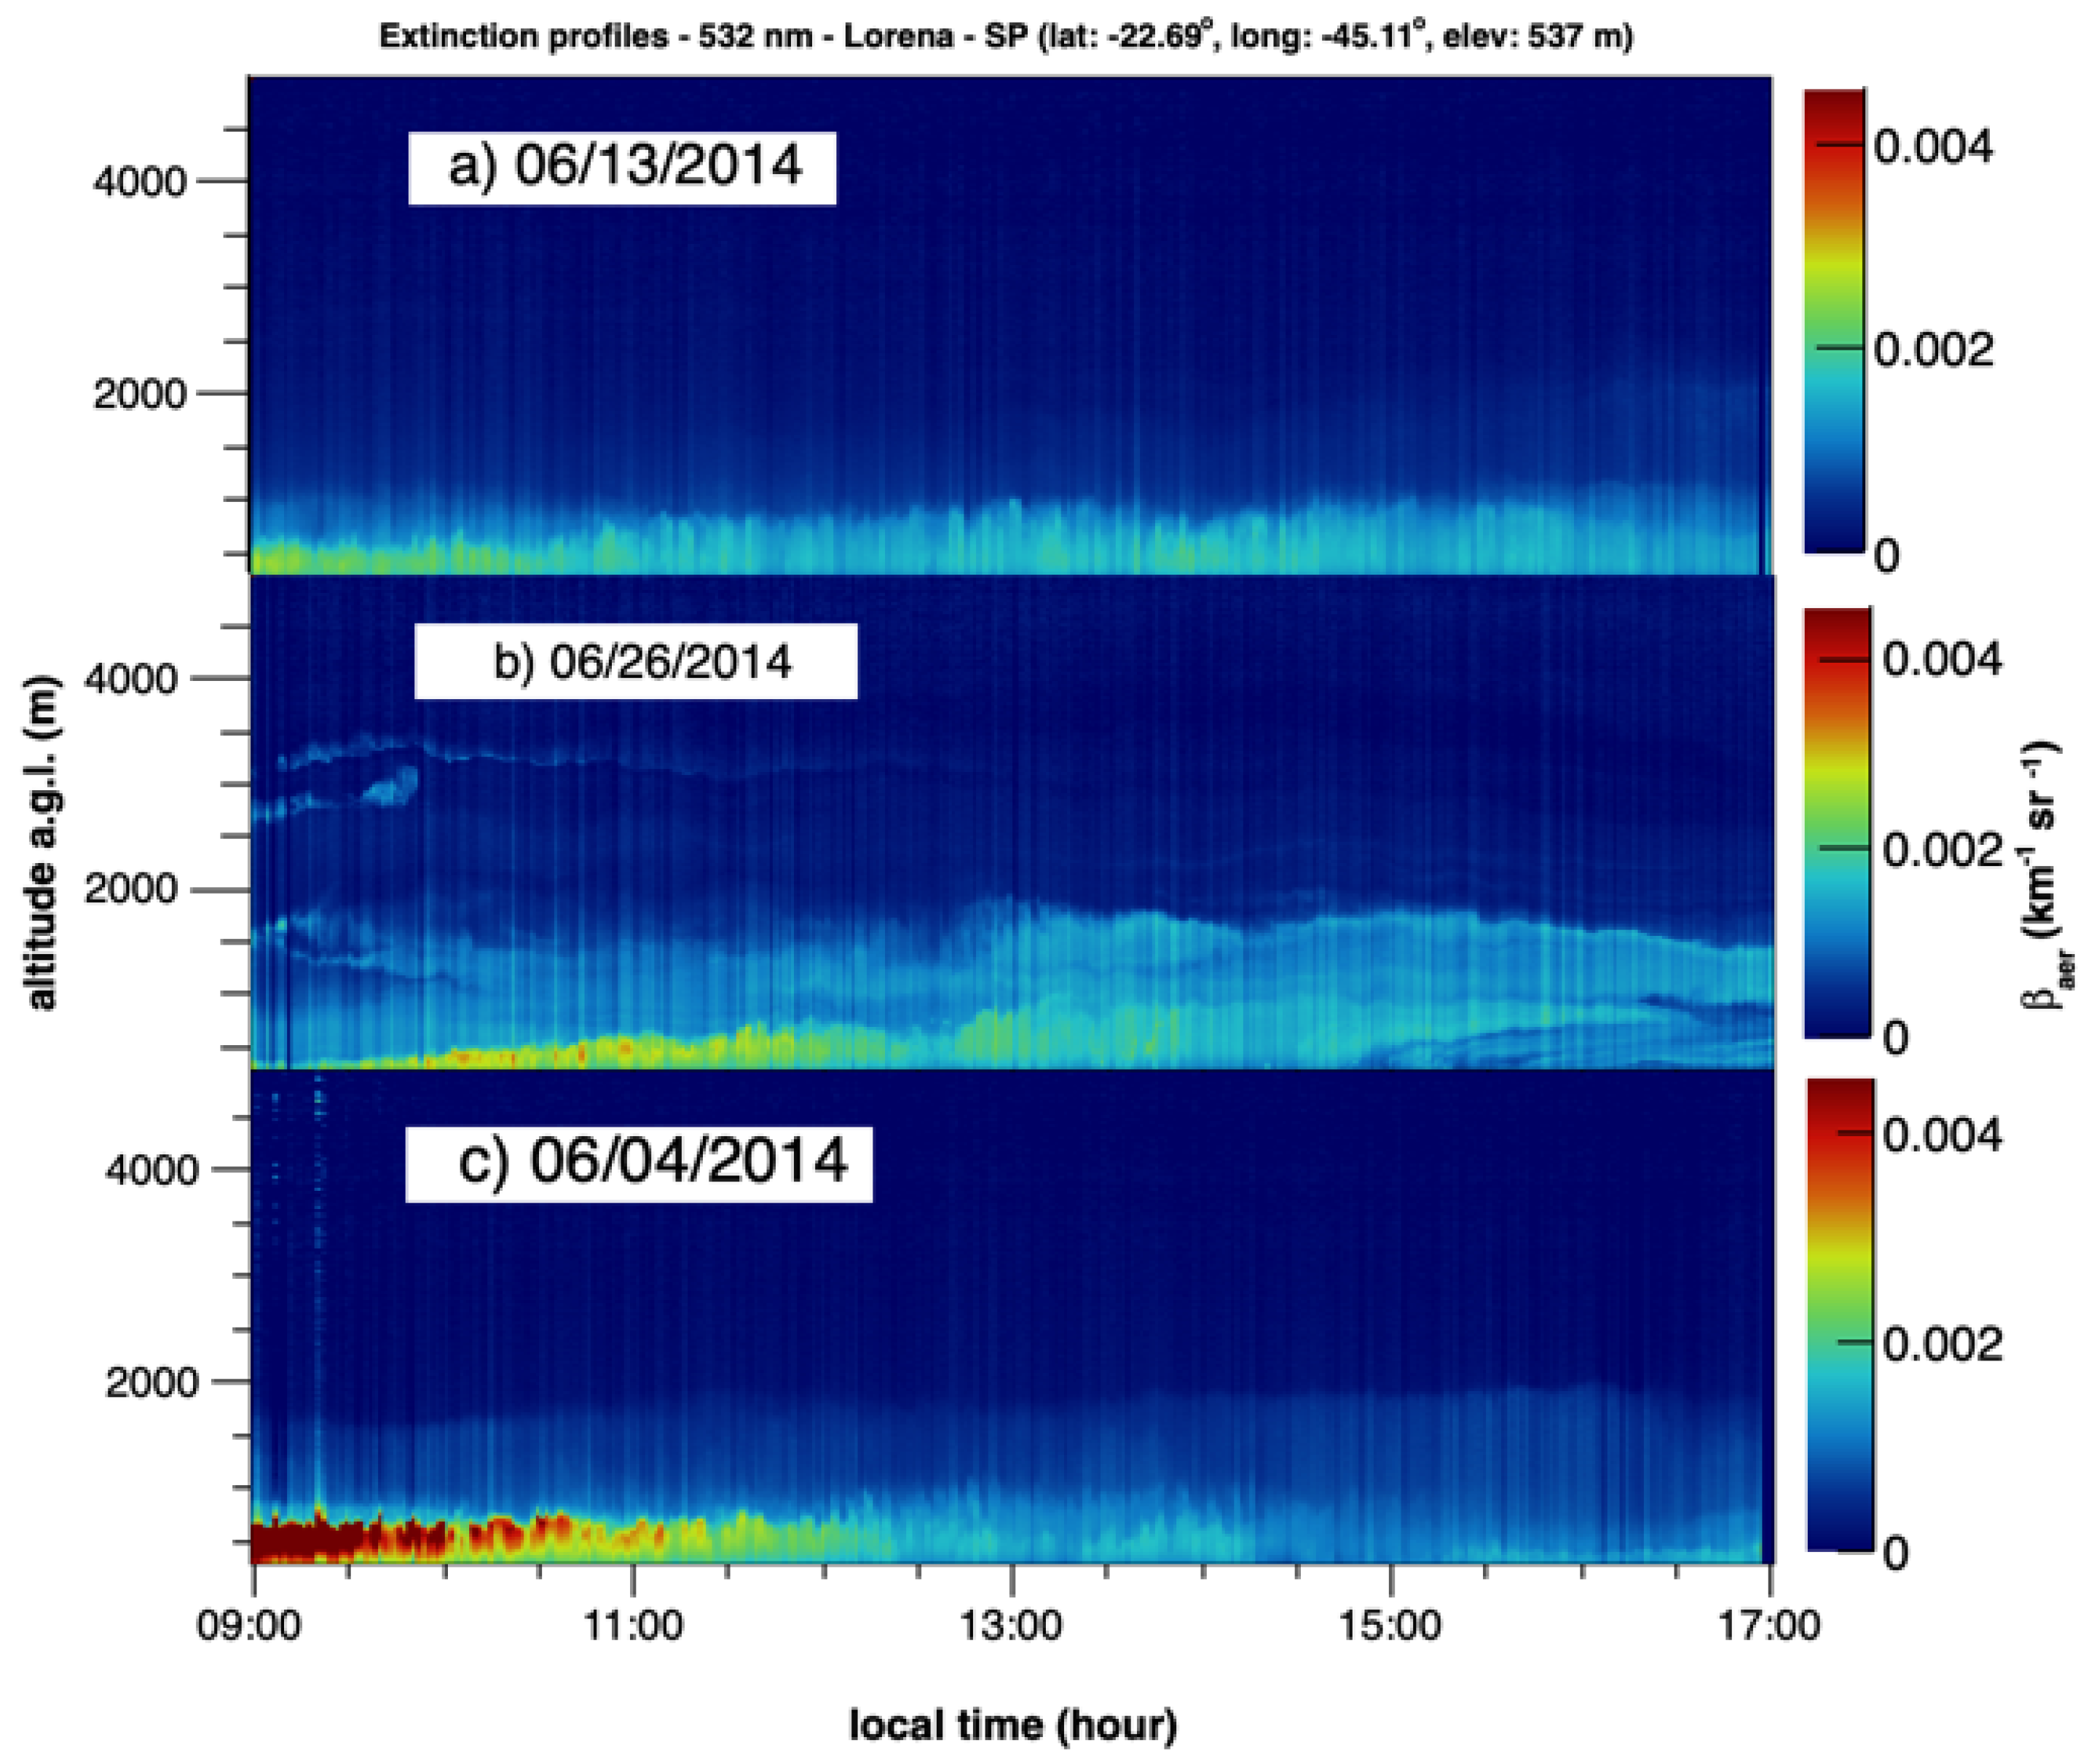
We first report on the results related to the Lorena campaign. Due to the very dry period in the 2014 Southern Hemisphere winter, the low frequency of rain provided several good quality measurements. The aerosol backscatter profiles corresponding to three representative days measured in bins of 100 s are presented in Figure 6. They were obtained by using the Klett inversion given by Equation (8). The background of the lidar measurement BG was determined by performing the linear fit described by Equation (5) considering an altitude range z from 6000 m to 7000 m a.g.l.
On general, one can observe a large concentration of aerosols restricted to low altitudes, with aerosol boundary layer typically at z 500 m a.g.l., mainly at the beginning of the day. As the atmosphere is heated by the solar radiation the aerosols are dispersed with a consequent increase of the atmospheric layer, reaching a maximum of z 1000 m a.g.l. at ∼15:00 local time. While a clean atmosphere can be observed in the aerosol backscatter profiles corresponding to 13 June (panel a in Figure 6), those corresponding to 4 June (panel c) illustrate a day with β a e r reaching a high value of 0.004 km 1 sr 1 . In particular, on 26 June (panel b), an aerosol layer at ∼3000 m a.g.l. can be observed at the beginning of the measurement. Besides that, a narrow region in altitude can also be observed in the end of the afternoon at ∼1000 m a.g.l. on 26 June and 1 July with smaller values of β a e r indicating intake of clear air.
For the Lorena lidar campaign, the HYSPLIT trajectory model [53,54] was employed to calculate the air mass backward trajectories and derive information from where, when and which altitude aerosol layers were transported. Five-day (120 h) back trajectories of air masses starting at the Lorena coordinates were calculated using the GDAS database from the Global Data Assimilation System for different altitudes ranging from 500 to 4000 m a.g.l. For this particular case, the back-trajectories started on the 26 June at 06:00 UTC with all plume altitude levels of 500, 1000, 2000, 3000 and 4000 m a.g.l. In this case it is clearly seen in Figure 7 that aerosol plumes come originally from the north and northwestern regions of Brazil, and the central portion of South America. The HYSPLIT air-mass back trajectories in Figure 7 show the plumes detected around 3000 m a.g.l. of altitude by the lidar system. They come directly from several fire focuses spread all over the central portion of South America. According to the active fire database from The National Institute for Space Research (INPE), which relies on information extracted at 1000 m resolution from daily AQUA MODIS data available at https://worldview.earthdata.nasa.gov/ (accessed on 17 September 2021) and other satellites available at https://queimadas.dgi.inpe.br/ (accessed on 17 September 2021), there were more than 953 focuses of fire in the period of 22–26 June 2014 in the South America territory.
The daily average backscatter profiles are presented in Figure 8 for the same days. The averages were done in the following way. First, we separated the range corrected signals in periods of 1 h. Then, we averaged the signals within the selected period in order to estimate the aerosol backscatter profile for the corresponding period. For this, a scan over the altitude of the region used to obtain the molecular fit was performed and the best one was chosen. Notice that, with this procedure, the altitude range of the molecular fit can be different for each time period during the day, reflecting the dynamics of the atmosphere. Finally, the aerosol backscatter profiles were averaged over the different time periods. The band corresponds to the uncertainty on the backscatter coefficient obtained by assuming different lidar ratio values corresponding to 68 % C.L. of the measurement performed by the CALIPSO satellite. As commented before, we can see high magnitude values of β a e r on 4 June for altitude ∼500 m. Notice that the backscatter coefficient for the referred day was multiplied by 0.25 in order to keep the same scale for all different days. Besides, the other analyzed days present large dispersion of the aerosol content with the boundary layer reaching altitudes of ∼2000 m a.g.l.
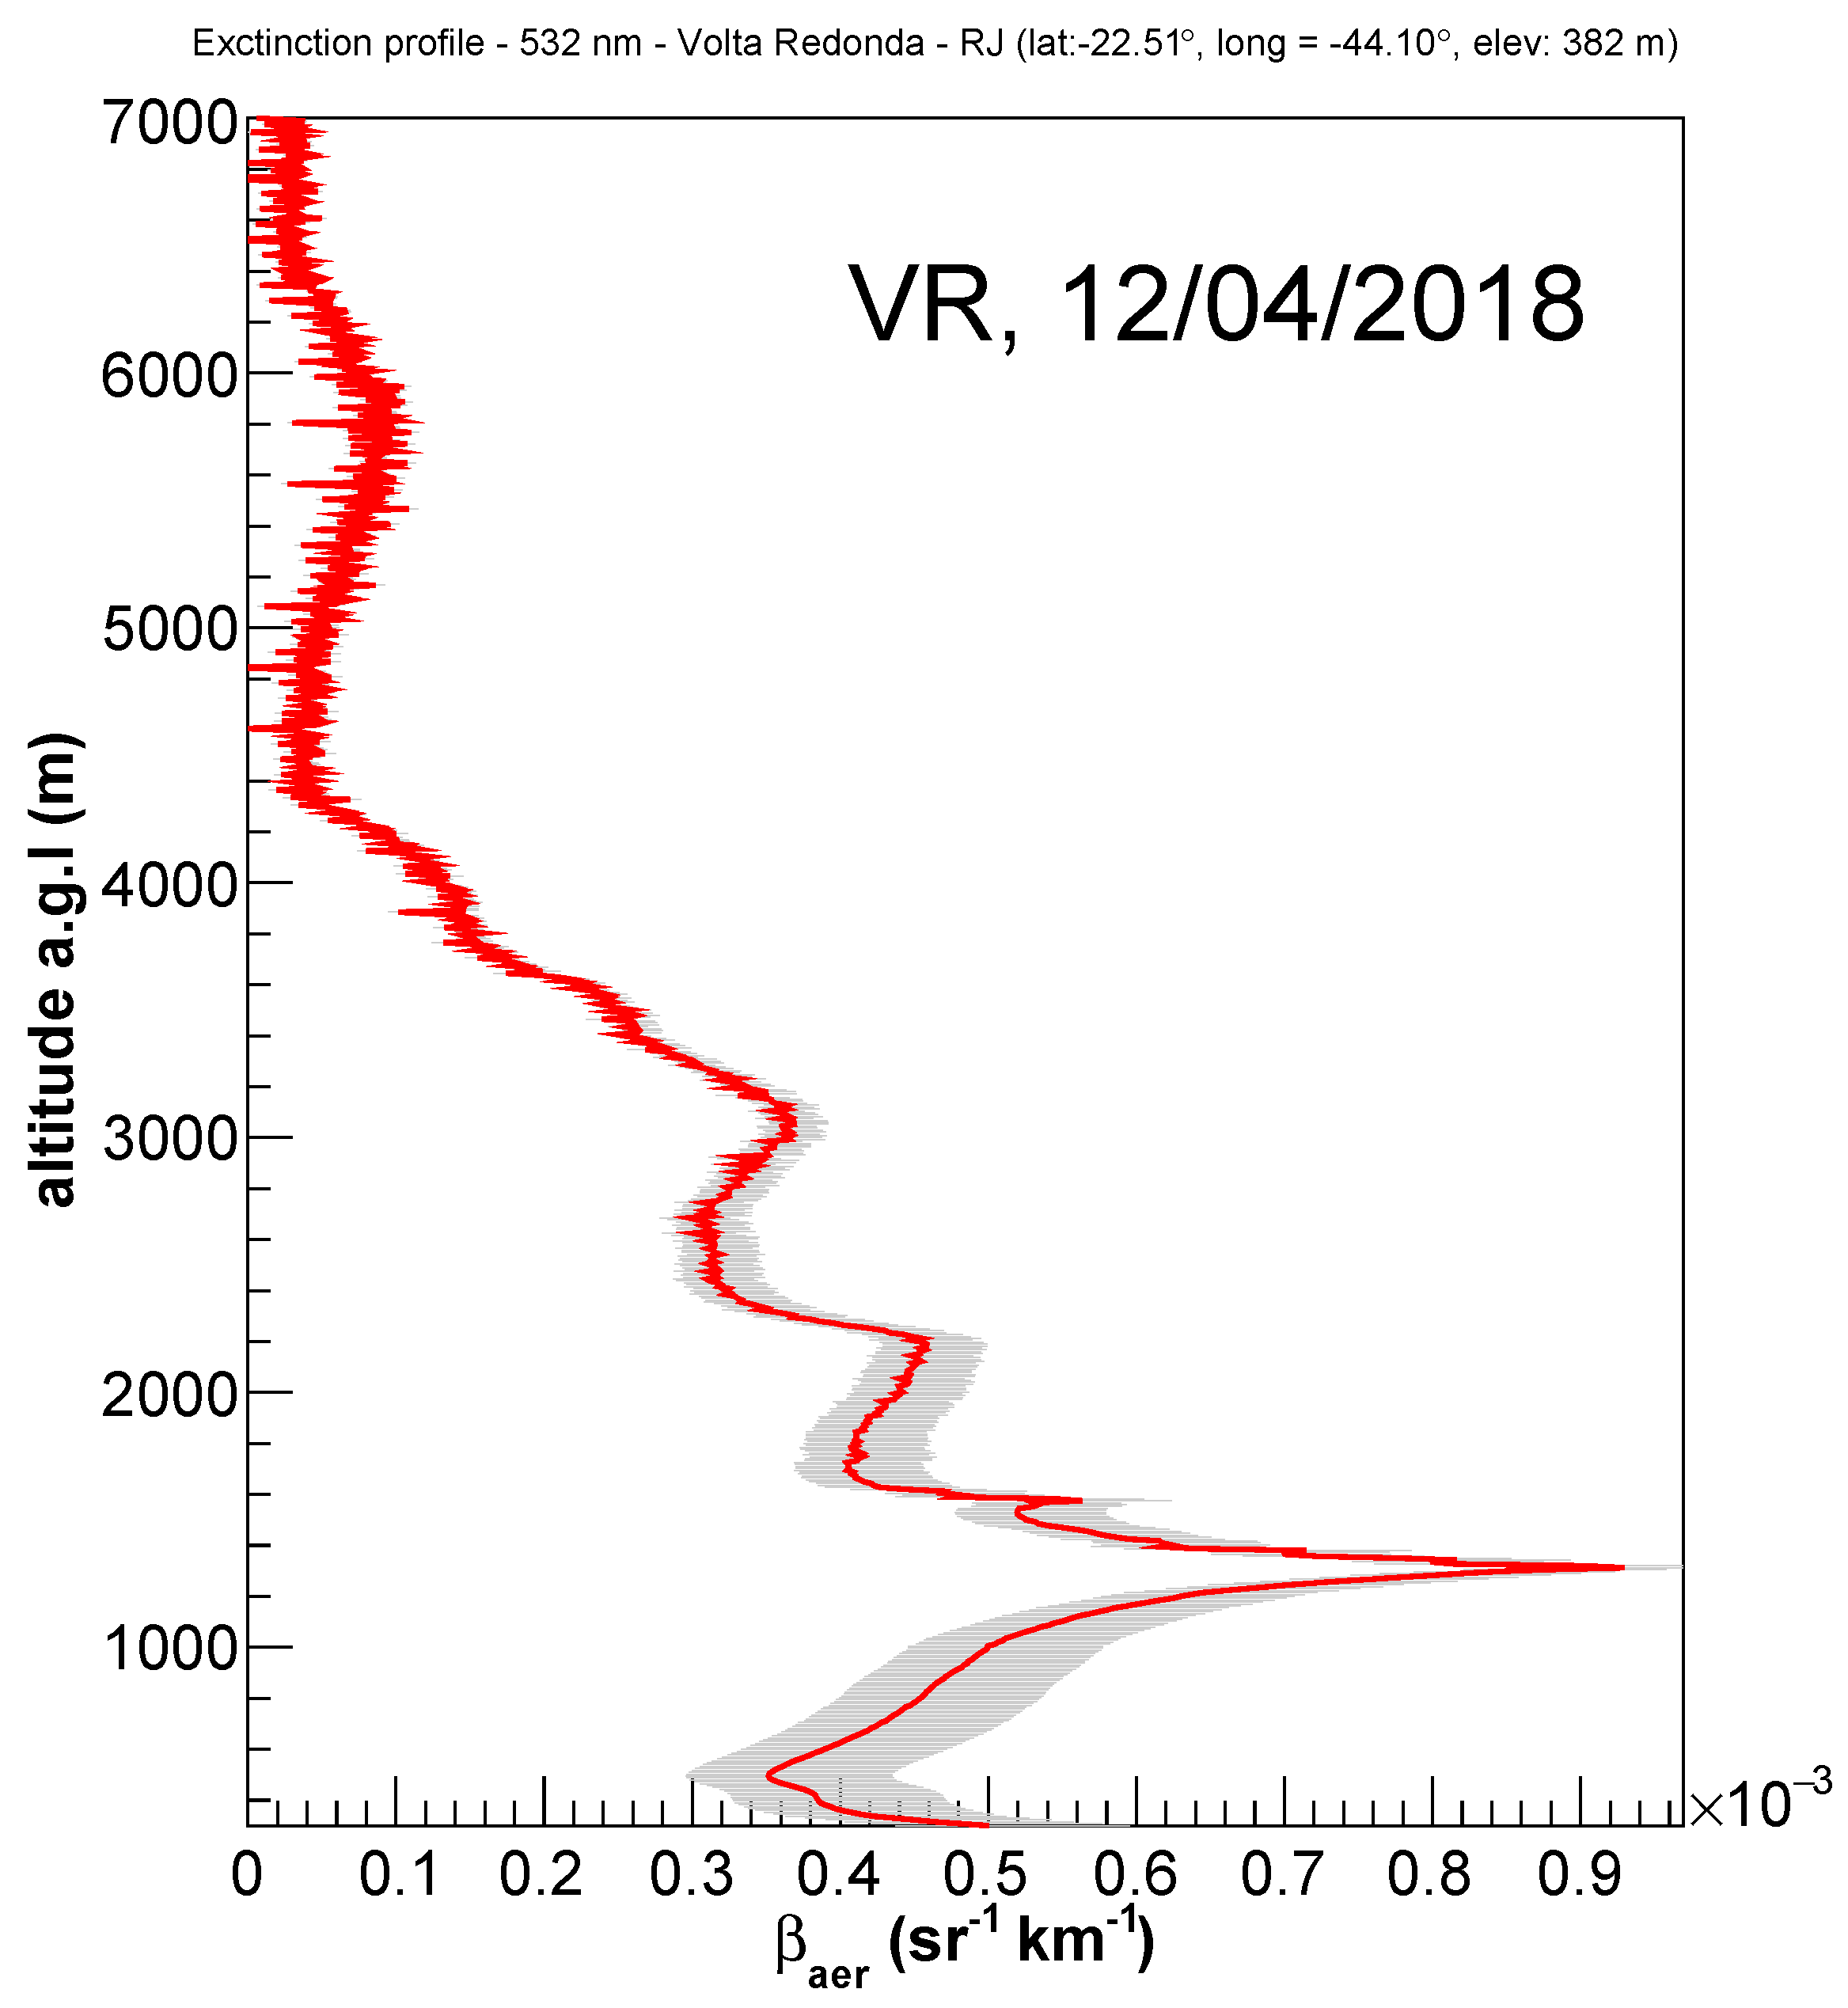
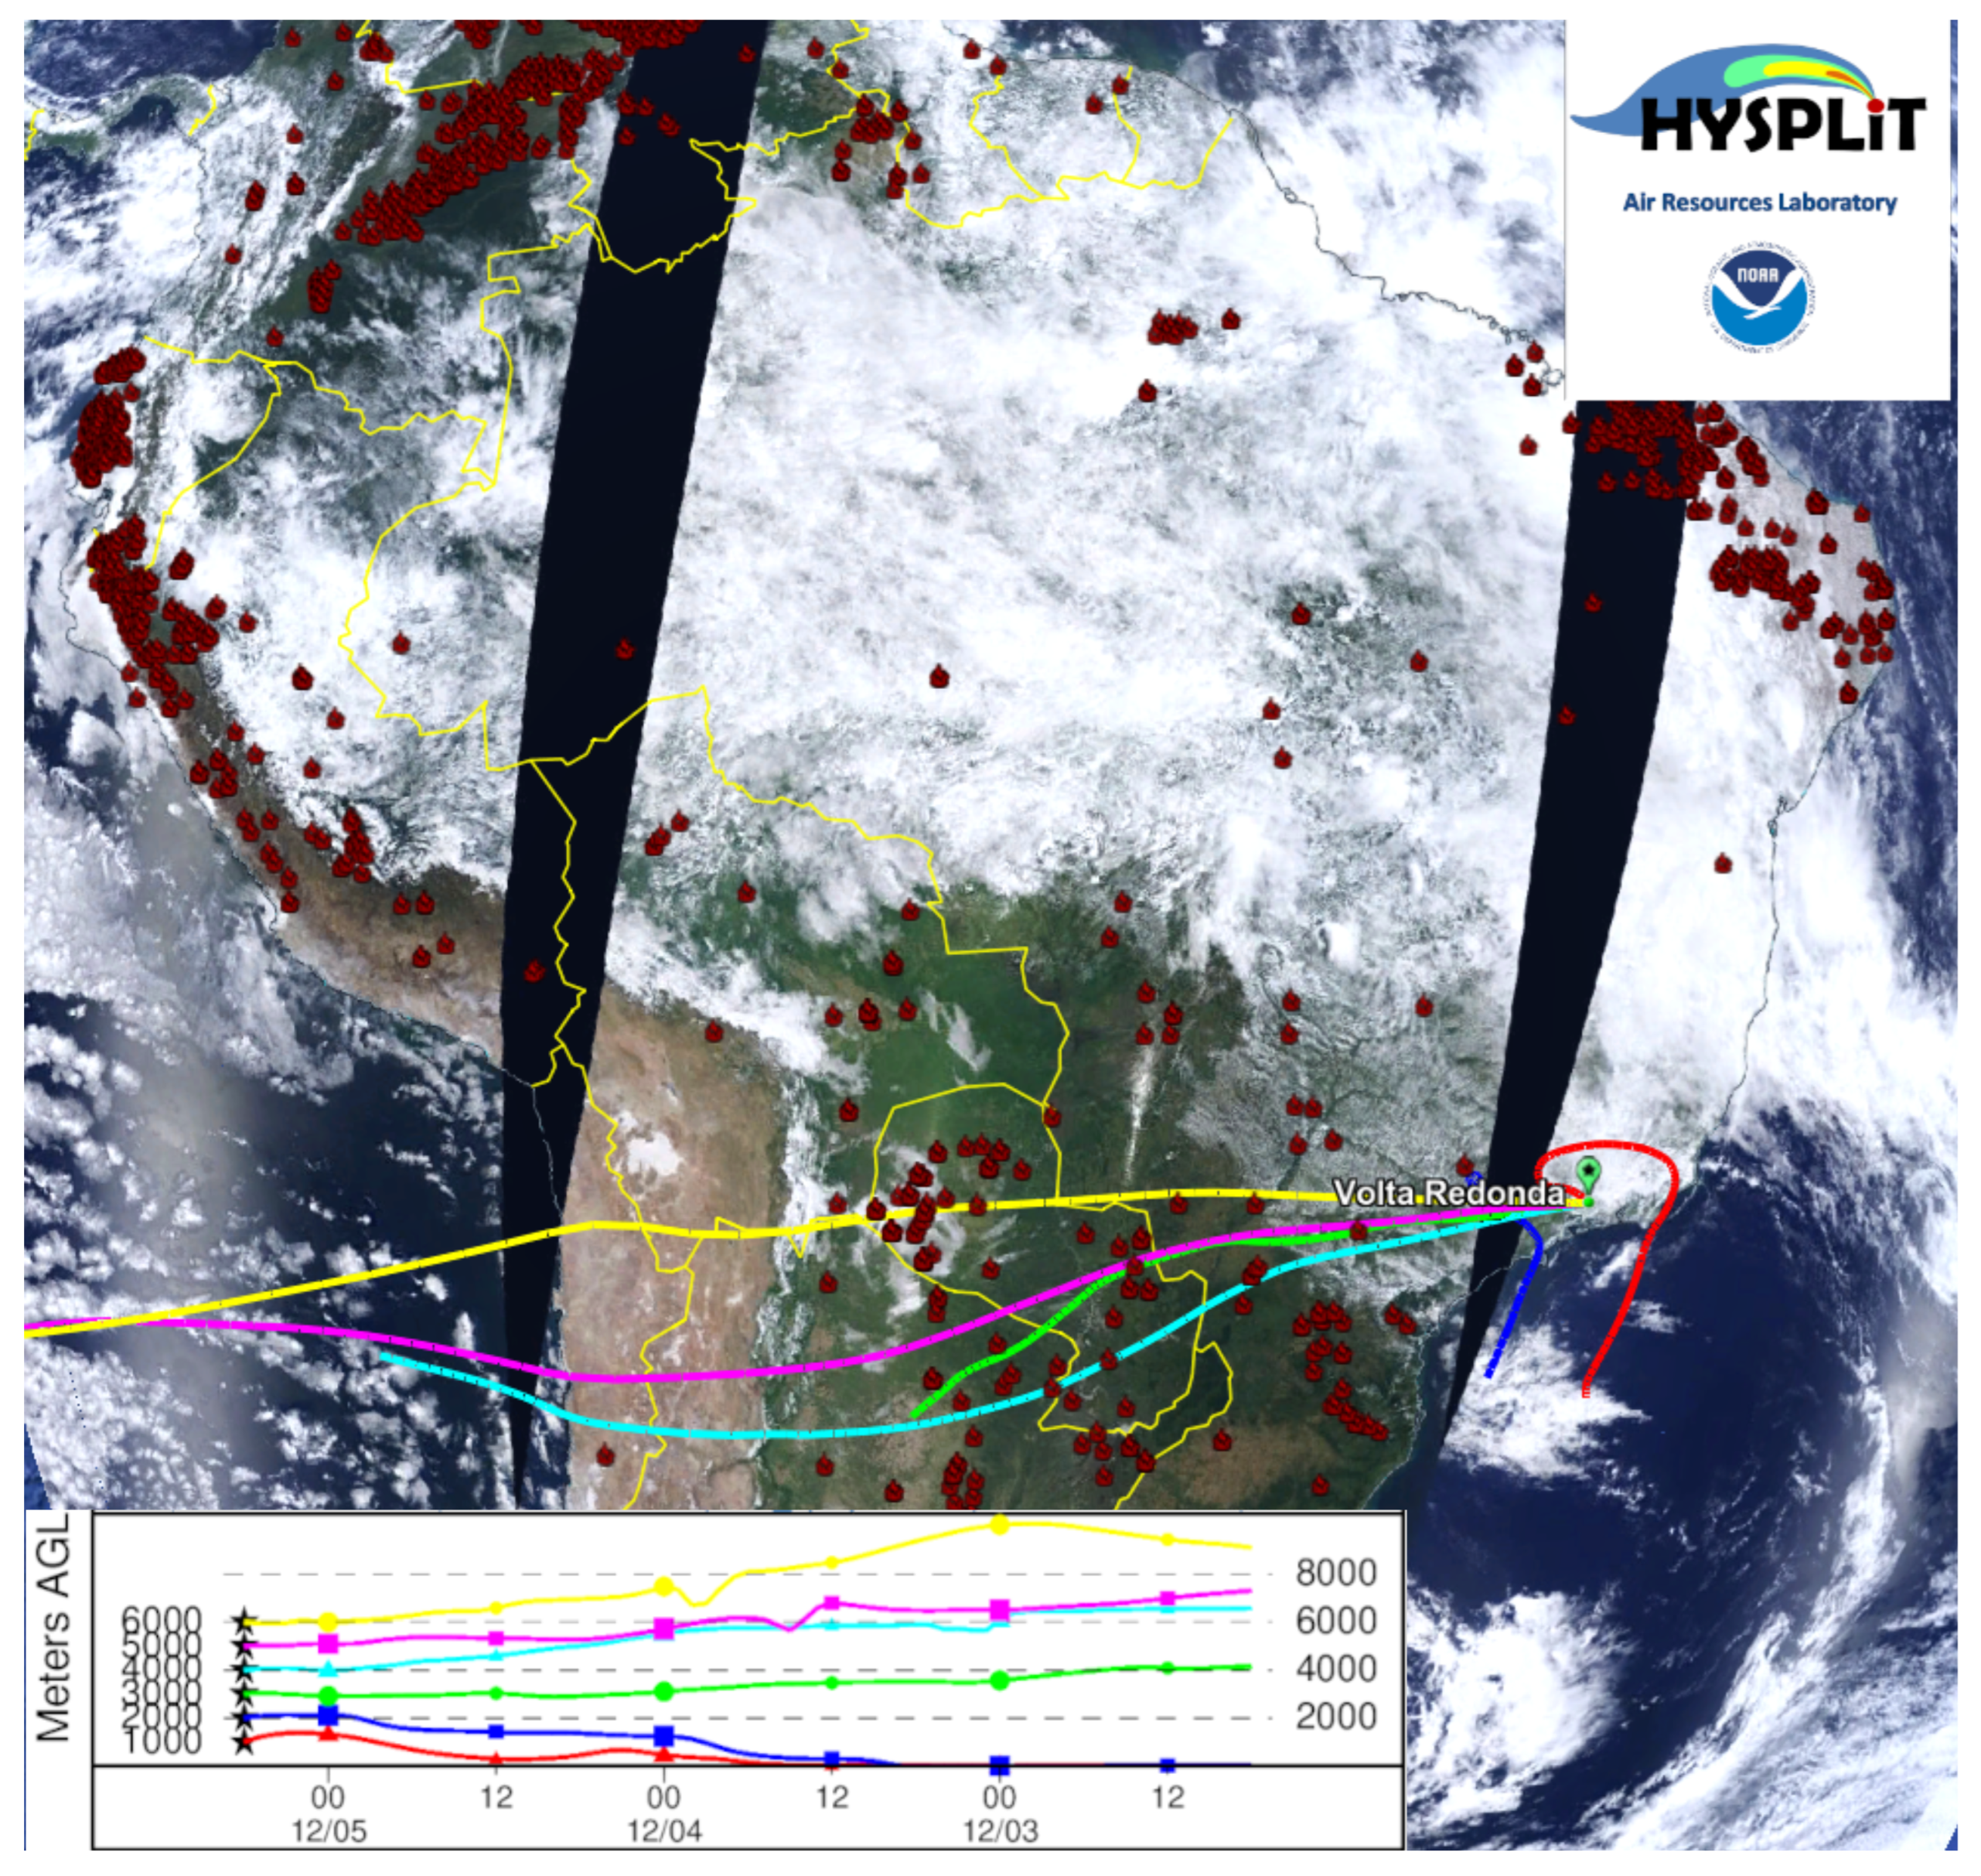
Unfortunately, during the measurement campaign employed in Volta Redonda, the weather conditions were not favorable for aerosol lidar measurements, with the occurrence of long periods of cloud covered sky or heavy rain. For this reason, we present only the results related to 4 December 2018. Figure 9 presents the corresponding image of the aerosol backscatter profiles obtained in time bins of 100 s for the whole measurement period. The white color corresponds to non-physical negative values of the aerosol backscatter coefficient caused by a poor quality lidar retrieval due to a noisy signal in some time periods. The aerosol boundary layer is not clearly defined, possibly because it is below the overlap region of the detector, since the measurement was performed during the night. The high magnitude values of β a e r present from ∼23:00 to ∼02:00 were considered to be originated by clouds and were discarded for the daily average backscatter profile, which will be presented later. We can notice a very dirty atmosphere with aerosol content present essentially at the whole range of altitudes considered, especially at altitudes between 1000 m and 2500 m a.g.l. It is noteworthy to mention that the measurements were taken very close to the CSN, as detailed in Figure 1c. The daily average backscatter profile was computed in the same way as in Lorena’s analysis and is presented in Figure 10. While the magnitude of the aerosol backscatter coefficient β a e r is not too high as observed in polluted areas, one can see several peaks at different altitudes, indicating the presence of aerosol layers throughout the analysed atmosphere. In order to investigate the influence of transported aerosol from large long-range distances in this particular case of the Volta Redonda campaign, the HYSPLIT trajectory model was also employed to calculate the backward trajectories and derive information about the altitude of aerosol layers reaching the measurement site. Three-day (72 h) back trajectories of air masses starting at the Volta Redonda coordinates were calculated using the GDAS database from the Global Data Assimilation System for different altitudes ranging from 1000 to 6000 m a.g.l. For this particular case, the back trajectories started on the 5th of December of 2018 at 06:00 UTC with plumes from 3000 to 6000 m a.g.l. of altitude coming from the west direction of South America and passing through some fire focuses spread all over Paraguay, as can be seen in Figure 11. However, in altitudes from 1000 to 2000 m a.g.l., the air-mass trajectories retrieved by the HYSPLIT model show a local impact of aerosol transportation. Despite the results of the influence of long-range aerosol transport obtained through the HYSPLIT model, it is necessary to investigate the effects and impacts of particulate matter emissions into the atmosphere of Volta Redonda, due to CSN production, based on the strong backscatter coefficient signal retrieved by lidar detached from the aerosol boundary layer (in altitudes of 5000 to 6000 m a.g.l.), as can be seen in Figure 10.

5. Conclusions

We have reported on the first aerosol profiling campaign carried out with a backscatter lidar system in Volta Redonda and Lorena, two industrial cities located in the Paraíba valley. This very important region connects two large metropolitan areas (Rio de Janeiro and São Paulo) and lacks remote sensing measurements. Additionally, we analyzed data from the air quality station over the Paraíba valley region and data measured by the CALIPSO satellite.
While the air quality station analysis shows an increase in air pollutant episodes for Volta Redonda and Lorena during dry seasons, satellite data analysis shows that both cities present the same AOD annual pattern and similar lidar ratio values. These results highlight the atmosphere homogeneity of the Paraíba valley.
In relation to the results obtained with the ground-based lidar campaigns, several peaks observed in the aerosol backscatter profile of Volta Redonda and Lorena indicate the presence of several aerosol layers detached from the aerosol boundary layer. HYSPLIT air-mass back trajectories indicate a possible detection of long-range aerosol transported from biomass burning areas of South America and also the influence of local pollution, with detection of aerosol layers up to 4000 and 5000 m altitude in Volta Redonda. In the particular case of Volta Redonda, it is speculated that the existence of aerosols at high altitudes could also come from the activities of industries in the region, such as CSN and others that supply its demand. It is very important to keep monitoring the region, an important axis connecting the cities of Rio de Janeiro and São Paulo, ideally by repeating the measurements for more days and in different seasons. New measurement campaigns are being planned to monitor the Paraíba do Sul basin, and allow a better understanding of the origins of aerosols. Furthermore, Raman lidar measurements could be very useful to better characterise the atmosphere by avoiding the assumption of the lidar ratio and reducing the uncertainty in the aerosol backscatter coefficient.

Author Contributions

In the present research article the individual contributions was followed by: Conceptualization: F.J.d.S.L., C.J.T.P., C.R.M., F.d.J.R., S.A.C. and R.M.d.A.; methodology: F.J.d.S.L. and R.M.d.A.; software and data analysis: F.J.d.S.L., C.J.T.P., C.R.M., F.C., F.d.J.R., S.A.C. and R.M.d.A.; formal analysis: F.J.d.S.L., C.J.T.P., C.R.M., F.C., F.d.J.R., S.A.C. and R.M.d.A.; resources: E.L. and R.M.d.A.; data curation: C.J.T.P., C.R.M., J.J.d.S., F.d.J.R., S.A.C., C.E.F. and R.M.d.A.; writing—original draft preparation: F.J.d.S.L., C.J.T.P., C.R.M., F.C., F.d.J.R., S.A.C. and R.M.d.A.; writing—review and editing, F.J.d.S.L., C.J.T.P., C.R.M., F.C., J.J.d.S., F.d.J.R., S.A.C., E.L., C.E.F. and R.M.d.A.; project administration, E.L. and R.M.d.A.; funding acquisition, E.L., J.J.d.S. and R.M.d.A. All authors have read and agreed to the published version of the manuscript.

Funding

Part of this research was funded by Conselho Nacional de Desenvolvimento Científico e Tecnológico-CNPQ under grant numbers 404993/2016-8, 152156/2018-6, The Universal Project 432515/2018-6, and the project number 306106/2019-1. The research has also funding by Fundação de Amparo à Pesquisa do Estado do Rio de Janeiro—FAPERJ under the grant number E-26/202.803/2019, and the IPEN Postgraduate program in Nuclear Technology under the CAPES-PROEX program 33002010050P7-Project 403/2021.

Institutional Review Board Statement

Not applicable.

Informed Consent Statement

Not applicable.

Data Availability Statement

Not applicable.

Acknowledgments

The authors wish to acknowledge the CALIPSO team for their substantial contributions and for the data obtained from the NASA Langley Research Center and Earth Observing System Data and Information System-EOSDIS. The NOAA Air Resources Laboratory for providing the HYSPLIT transport and dispersion model and the READY website used in this publication. The biomass burning database website from Instituto Nacional de Pesquisas Espaciais (INPE) and The São Paulo Sanitation Technology Company—CETESB to provide access to the air quality concentration database (QUALAR). The authors acknowledge the National Laboratory for Scientific Computing (LNCC/MCTI, Brazil) for providing HPC resources of the SDumont supercomputer, which have contributed to the research results reported within this paper. URL: http://sdumont.lncc.br (accessed on 17 September 2021).

Conflicts of Interest

The authors declare no conflict of interest and the funders had no role in the design of the study; in the collection, analyses, or interpretation of data; in the writing of the manuscript, or in the decision to publish the results.

Abbreviations

The following abbreviations are used in this manuscript:
AODAerosol Optical Depth
a.g.l.as ground level
BGBackground
CALIOPCloud-Aerosol Lidar with Orthogonal Polarization
CALIPSO       Cloud-Aerosol Lidar and Infrared Pathfinder Satellite Observations
C. L.Confidence limit
CSNCompanhia Siderúgica Nacional
FOVField of View
FWHMFull Width at Half Maximum
GDASGlobal Data Assimilation System
HYSPLITHybrid Single-Particle Lagrangian Integrated Trajectory
INPENational Institute for Space Research
IPENInstituto de Pesquisas Energéticas e Nucleares
KFSKlett–Fernald–Sasano
LALINETLatin America Lidar Network
LRLidar ratio
MODISModerate Resolution Imaging Spectroradiometer
MSP-LIDAR IIMunicipality of São Paulo Lidar II
Nd:YAGNeodymium-Doped Yttrium Aluminium Garnet
PDHPresidente Dutra Highway or BR-116
PMTPhotomultiplier Tube
RCSRange Corrected Signal
SPSão Paulo
RJRio de Janeiro
UTCUniversal Time Coordinated
VRVolta Redonda

References

  1. Isaksen, I.; Granier, C.; Myhre, G.; Berntsen, T.; Dalsøren, S.; Gauss, M.; Klimont, Z.; Benestad, R.; Bousquet, P.; Collins, W.; et al. Atmospheric composition change: Climate—Chemistry interactions. Atmos. Environ. 2009, 43, 5138–5192. [Google Scholar] [CrossRef]
  2. Laj, P.; Klausen, J.; Bilde, M.; Plaß-Duelmer, C.; Pappalardo, G.; Clerbaux, C.; Baltensperger, U.; Hjorth, J.; Simpson, D.; Reimann, S.; et al. Measuring atmospheric composition change. Atmos. Environ. 2009, 43, 5351–5414. [Google Scholar] [CrossRef]
  3. Salmond, J.; Sabel, C.E.; Vardoulakis, S. Towards the Integrated Study of Urban Climate, Air Pollution, and Public Health. Climate 2018, 6, 14. [Google Scholar] [CrossRef] [Green Version]
  4. Parrish, D.D.; Singh, H.B.; Molina, L.; Madronich, S. Air quality progress in North American megacities: A review. Atmos. Environ. 2011, 45, 7015–7025. [Google Scholar] [CrossRef]
  5. Huang, K.; Zhuang, G.; Lin, Y.; Wang, Q.; Fu, J.S.; Fu, Q.; Liu, T.; Deng, C. How to improve the air quality over megacities in China: Pollution characterization and source analysis in Shanghai before, during, and after the 2010 World Expo. Atmos. Chem. Phys. 2013, 13, 5927–5942. [Google Scholar] [CrossRef] [Green Version]
  6. Baklanov, A.; Molina, L.T.; Gauss, M. Megacities, air quality and climate. Atmos. Environ. 2016, 126, 235–249. [Google Scholar] [CrossRef]
  7. de Fatima Andrade, M.; Kumar, P.; de Freitas, E.D.; Ynoue, R.Y.; Martins, J.; Martins, L.D.; Nogueira, T.; Perez-Martinez, P.; de Miranda, R.M.; Albuquerque, T.; et al. Air quality in the megacity of São Paulo: Evolution over the last 30 years and future perspectives. Atmos. Environ. 2017, 159, 66–82. [Google Scholar] [CrossRef] [Green Version]
  8. de Andrade, M.F.; de Miranda, R.M.; Fornaro, A.; Kerr, A.; Oyama, B.; de Andre, P.A.; Saldiva, P. Vehicle emissions and PM2.5 mass concentrations in six Brazilian cities. Air Qual. Atmos. Health 2012, 5, 79–88. [Google Scholar] [CrossRef] [Green Version]
  9. de Miranda, R.M.; de Andrade, M.F.; Fornaro, A.; Astolfo, R.; de Andre, P.A.; Saldiva, P. Urban air pollution: A representative survey of PM2.5 mass concentrations in six Brazilian cities. Air Qual. Atmos. Health 2012, 5, 63–77. [Google Scholar] [CrossRef] [Green Version]
  10. Pérez-Martínez, P.; Miranda, R.; Andrade, M.; Kumar, P. Air quality and fossil fuel driven transportation in the Metropolitan Area of São Paulo. Transp. Res. Interdiscip. Perspect. 2020, 5, 100137. [Google Scholar] [CrossRef]
  11. de Almeida Azevedo, D.; Silveira Moreira, L.; Soares de Siqueira, D. Composition of extractable organic matter in aerosols from urban areas of Rio de Janeiro city, Brazil. Atmos. Environ. 1999, 33, 4987–5001. [Google Scholar] [CrossRef]
  12. Almeida, G.P.; Bittencourt, A.T.; Evangelista, M.S.; Vieira-Filho, M.S.; Fornaro, A. Characterization of aerosol chemical composition from urban pollution in Brazil and its possible impacts on the aerosol hygroscopicity and size distribution. Atmos. Environ. 2019, 202, 149–159. [Google Scholar] [CrossRef]
  13. Martins, L.D.; Andrade, M.F. Ozone Formation Potentials of Volatile Organic Compounds and Ozone Sensitivity to Their Emission in the Megacity of São Paulo, Brazil. Water Air Soil Pollut. 2008, 195, 201–213. [Google Scholar] [CrossRef]
  14. Nogueira, T.; de Souza, K.F.; Fornaro, A.; de Fatima Andrade, M.; de Carvalho, L.R.F. On-road emissions of carbonyls from vehicles powered by biofuel blends in traffic tunnels in the Metropolitan Area of Sao Paulo, Brazil. Atmos. Environ. 2015, 108, 88–97. [Google Scholar] [CrossRef]
  15. Souto-Oliveira, C.E.; Andrade, M.D.F.; Kumar, P.; Lopes, F.J.D.S.; Babinski, M.; Landulfo, E. Effect of vehicular traffic, remote sources and new particle formation on the activation properties of cloud condensation nuclei in the megacity of São Paulo, Brazil. Atmos. Chem. Phys. 2016, 16, 14635–14656. [Google Scholar] [CrossRef] [Green Version]
  16. Saldiva, P.H.N.; Lichtenfels, A.J.; Paiva, P.S.O.; Barone, I.; Martins, M.A.G.; Massad, E.; Pereira, J.C.R.; Xavier, V.P.; Singer, J.M.; Böhm, G.M. Association between air pollution and mortality due to respiratory diseases in children in São Paulo, Brazil: A preliminary report. Environ. Res. 1994, 65 2, 218–225. [Google Scholar] [CrossRef]
  17. Spinosa De Martinis, B.; Kado, N.Y.; de Carvalho, L.R.; Okamoto, R.A.; Gundel, L.A. Genotoxicity of fractionated organic material in airborne particles from São Paulo, Brazil. Mutat. Res. Toxicol. Environ. Mutagen. 1999, 446, 83–94. [Google Scholar] [CrossRef]
  18. Cheng, M.H.; Chiu, H.F.; Yang, C.Y. Coarse Particulate Air Pollution Associated with Increased Risk of Hospital Admissions for Respiratory Diseases in a Tropical City, Kaohsiung, Taiwan. Int. J. Environ. Res. Public Health 2015, 12, 13053–13068. [Google Scholar] [CrossRef]
  19. Liu, P.; Wang, X.; Fan, J.; Xiao, W.; Wang, Y. Effects of Air Pollution on Hospital Emergency Room Visits for Respiratory Diseases: Urban-Suburban Differences in Eastern China. Int. J. Environ. Res. Public Health 2016, 13, 341. [Google Scholar] [CrossRef] [Green Version]
  20. Mannucci, P.M.; Franchini, M. Health Effects of Ambient Air Pollution in Developing Countries. Int. J. Environ. Res. Public Health 2017, 14, 1048. [Google Scholar] [CrossRef]
  21. Andrade, M.d.F.; Ynoue, R.Y.; Freitas, E.D.; Todesco, E.; Vara Vela, A.; Ibarra, S.; Martins, L.D.; Martins, J.A.; Carvalho, V.S.B. Air quality forecasting system for Southeastern Brazil. Front. Environ. Sci. 2015, 3, 9. [Google Scholar] [CrossRef] [Green Version]
  22. Freitas, S.R.; Longo, K.M.; Silva Dias, M.A.F.; Chatfield, R.; Silva Dias, P.; Artaxo, P.; Andreae, M.O.; Grell, G.; Rodrigues, L.F.; Fazenda, A.; et al. The Coupled Aerosol and Tracer Transport model to the Brazilian developments on the Regional Atmospheric Modeling System (CATT-BRAMS)—Part 1: Model description and evaluation. Atmos. Chem. Phys. 2009, 9, 2843–2861. [Google Scholar] [CrossRef] [Green Version]
  23. Freitas, S.R.; Panetta, J.; Longo, K.M.; Rodrigues, L.F.; Moreira, D.S.; Rosário, N.E.; Silva Dias, P.L.; Silva Dias, M.A.F.; Souza, E.P.; Freitas, E.D.; et al. The Brazilian developments on the Regional Atmospheric Modeling System (BRAMS 5.2): An integrated environmental model tuned for tropical areas. Geosci. Model Dev. 2017, 10, 189–222. [Google Scholar] [CrossRef] [Green Version]
  24. Freitas, S.R.; Longo, K.M.; Chatfield, R.; Latham, D.; Silva Dias, M.A.F.; Andreae, M.O.; Prins, E.; Santos, J.C.; Gielow, R.; Carvalho, J.A., Jr. Including the sub-grid scale plume rise of vegetation fires in low resolution atmospheric transport models. Atmos. Chem. Phys. 2007, 7, 3385–3398. [Google Scholar] [CrossRef] [Green Version]
  25. Abou Rafee, S.A.; Martins, L.D.; Kawashima, A.B.; Almeida, D.S.; Morais, M.V.B.; Souza, R.V.A.; Oliveira, M.B.L.; Souza, R.A.F.; Medeiros, A.S.S.; Urbina, V.; et al. Contributions of mobile, stationary and biogenic sources to air pollution in the Amazon rainforest: A numerical study with the WRF-Chem model. Atmos. Chem. Phys. 2017, 17, 7977–7995. [Google Scholar] [CrossRef] [Green Version]
  26. de Almeida Albuquerque, T.T.; de Fátima Andrade, M.; Ynoue, R.Y.; Moreira, D.M.; Andreão, W.L.; dos Santos, F.S.; Nascimento, E.G.S. WRF-SMOKE-CMAQ modeling system for air quality evaluation in São Paulo megacity with a 2008 experimental campaign data. Environ. Sci. Pollut. Res. 2018, 25, 36555–36569. [Google Scholar] [CrossRef]
  27. Duarte, E.D.S.F.; Franke, P.; Lange, A.C.; Friese, E.; da Silva Lopes, F.J.; ao da Silva, J.J.; dos Reis, J.S.; Landulfo, E.; de Silva, C.M.S.; Elbern, H.; et al. Evaluation of atmospheric aerosols in the metropolitan area of São Paulo simulated by the regional EURAD-IM model on high-resolution. Atmos. Pollut. Res. 2021, 12, 451–469. [Google Scholar] [CrossRef]
  28. Weitkamp, C.; Walther, H. Lidar: Range-Resolved Optical Remote Sensing of the Atmosphere; Springer Series in Optical Sciences; Springer: New York, NY, USA, 2005. [Google Scholar]
  29. Landulfo, E.; Papayannis, A.; de Freitas, A.Z.; Vieira, N.D., Jr.; Souza, R.F.; Gonçalves, A.; Castanho, A.D.A.; Artaxo, P.; Sánchez-Ccoyllo, O.R.; Moreira, D.S.; et al. Tropospheric aerosol observations in São Paulo, Brazil using a compact lidar system. Int. J. Remote Sens. 2005, 26, 2797–2816. [Google Scholar] [CrossRef]
  30. Landulfo, E.; Matos, C.; Torres, A.; Sawamura, P.; Uehara, S. Air quality assessment using a multi-instrument approach and air quality indexing in an urban area. Atmos. Res. 2007, 85, 98–111. [Google Scholar] [CrossRef]
  31. Landulfo, E.; Lopes, F.J.; Mariano, G.L.; Torres, A.S.; de Jesus, W.C.; Nakaema, W.M.; Jorge, M.P.; Mariani, R. Study of the Properties of Aerosols and the Air Quality Index Using a Backscatter Lidar System and Aeronet Sunphotometer in the City of São Paulo, Brazil. J. Air Waste Manag. Assoc. 2010, 60, 386–392. [Google Scholar] [CrossRef] [Green Version]
  32. Lopes, F.J.S.; Moreira, G.A.; Rodrigues, P.F.; Guerrero-Rascado, J.L.; Andrade, M.F.; Landulfo, E. Lidar measurements of tropospheric aerosol and water vapor profiles during the winter season campaigns over the metropolitan area of São Paulo, Brazil. In Lidar Technologies, Techniques, and Measurements for Atmospheric Remote Sensing X; Singh, U.N., Pappalardo, G., Eds.; International Society for Optics and Photonics, SPIE: Amsterdam, The Netherlands, 2014; Volume 9246, pp. 99–112. [Google Scholar] [CrossRef]
  33. Lopes, F.J.S.; Luis Guerrero-Rascado, J.; Benavent-Oltra, J.A.; Román, R.; Moreira, G.; Marques, M.T.A.; da Silva, J.J.; Alados-Arboledas, L.; Artaxo, P.; Landulfo, E. Rehearsal for Assessment of atmospheric optical Properties during biomass burning Events and Long-range transportation episodes at Metropolitan Area of São Paulo-Brazil (RAPEL). EPJ Web Conf. 2018, 176, 08011. [Google Scholar] [CrossRef]
  34. Miranda, R.; Lopes, F.; Rosario, N.; Yamasoe, M.; Landulfo, E.; Andrade, M. The relationship between aerosol particles chemical composition and optical properties to identify the biomass burning contribution to fine particles concentration: A case study for São Paulo City, Brazil. Environ. Monit. Assess. 2016, 189, 6. [Google Scholar] [CrossRef]
  35. Bencherif, H.; Bègue, N.; Kirsch Pinheiro, D.; du Preez, D.J.; Cadet, J.M.; da Silva Lopes, F.J.; Shikwambana, L.; Landulfo, E.; Vescovini, T.; Labuschagne, C.; et al. Investigating the Long-Range Transport of Aerosol Plumes Following the Amazon Fires (August 2019): A Multi-Instrumental Approach from Ground-Based and Satellite Observations. Remote Sens. 2020, 12, 3846. [Google Scholar] [CrossRef]
  36. Larroza, E.G.; Nakaema, W.M.; Bourayou, R.; Hoareau, C.; Landulfo, E.; Keckhut, P. Towards an automatic lidar cirrus cloud retrieval for climate studies. Atmos. Meas. Tech. 2013, 6, 3197–3210. [Google Scholar] [CrossRef] [Green Version]
  37. Córdoba-Jabonero, C.; Lopes, F.J.; Landulfo, E.; Cuevas, E.; Ochoa, H.; Gil-Ojeda, M. Diversity on subtropical and polar cirrus clouds properties as derived from both ground-based lidars and CALIPSO/CALIOP measurements. Atmos. Res. 2017, 183, 151–165. [Google Scholar] [CrossRef]
  38. Lopes, F.J.S.; Silva, J.J.; Antuña Marrero, J.C.; Taha, G.; Landulfo, E. Synergetic Aerosol Layer Observation After the 2015 Calbuco Volcanic Eruption Event. Remote Sens. 2019, 11, 195. [Google Scholar] [CrossRef] [Green Version]
  39. de Arruda Moreira, G.; da Silva Lopes, F.J.; Guerrero-Rascado, J.L.; da Silva, J.J.; Arleques Gomes, A.; Landulfo, E.; Alados-Arboledas, L. Analyzing the atmospheric boundary layer using high-order moments obtained from multiwavelength lidar data: Impact of wavelength choice. Atmos. Meas. Tech. 2019, 12, 4261–4276. [Google Scholar] [CrossRef] [Green Version]
  40. de Arruda Moreira, G.; da Silva Andrade, I.; Cacheffo, A.; da Silva Lopes, F.J.; Calzavara Yoshida, A.; Gomes, A.A.; da Silva, J.J.; Landulfo, E. Influence of a Biomass-Burning Event in PM2.5 Concentration and Air Quality: A Case Study in the Metropolitan Area of São Paulo. Sensors 2021, 21, 425. [Google Scholar] [CrossRef]
  41. Gioda, A.; Sales, J.A.; Cavalcanti, P.M.S.; Maia, M.F.; Maia, L.F.P.G.; Neto, F.R.A. Evaluation of air quality in Volta Redonda, the main metallurgical industrial city in Brazi. J. Braz. Chem. Soc. 2004, 15, 856–864. [Google Scholar] [CrossRef] [Green Version]
  42. Rocha, N.L.T.; de Souza Guimarães, C. Air quality study and the steel activity in Volta Redonda city. Cad. UniFOA 2017, 12, 25–36. [Google Scholar] [CrossRef]
  43. Antuna-Marrero, J.C.; Landulfo, E.; Estevan, R.; Barja, B.; Robock, A.; Wolfram, E.; Ristori, P.; Clemesha, B.; Zaratti, F.; Forno, R.; et al. LALINET: The First Latin American—Born Regional Atmospheric Observational Network. Bull. Am. Meteorol. Soc. 2017, 98, 1255–1275. [Google Scholar] [CrossRef]
  44. Guerrero-Rascado, J.L.; Landulfo, E.; Antuña, J.C.; de Melo Jorge Barbosa, H.; Barja, B.; Bastidas, Á.E.; Bedoya, A.E.; da Costa, R.F.; Estevan, R.; Forno, R.; et al. Latin American Lidar Network (LALINET) for aerosol research: Diagnosis on network instrumentation. J. Atmos. Sol.-Terr. Phys. 2016, 138-139, 112–120. [Google Scholar] [CrossRef]
  45. da Silva Lopes, F.J.; Held, G.; Nakaema, W.M.; Rodrigues, P.F.; Bassan, J.M.; Landulfo, E. Initial analysis from a lidar observation campaign of sugar cane fires in the central and western portion of the São Paulo State, Brazil. In Lidar Technologies, Techniques, and Measurements for Atmospheric Remote Sensing VII; Singh, U.N., Pappalardo, G., Eds.; International Society for Optics and Photonics, SPIE: Amsterdam, The Netherlands, 2011; Volume 8182, pp. 233–242. [Google Scholar]
  46. CETESB. Relatório de qualidade do ar no Estado de São Paulo 2020; Technical Report; Companhia Ambiental do Estado de São Paulo: São Paulo, Brazil, 2020. [Google Scholar]
  47. Winker, D.M.; Pelon, J.; Coakley, J.A.; Ackerman, S.A.; Charlson, R.J.; Colarco, P.R.; Flamant, P.; Fu, Q.; Hoff, R.M.; Kittaka, C.; et al. The CALIPSO Mission: A Global 3D View of Aerosols and Clouds. Bull. Am. Meteorol. Soc. 2010, 91, 1211–1230. [Google Scholar] [CrossRef]
  48. Hunt, W.H.; Winker, D.M.; Vaughan, M.A.; Powell, K.A.; Lucker, P.L.; Weimer, C. CALIPSO Lidar Description and Performance Assessment. J. Atmos. Ocean. Technol. 2009, 26, 1214–1228. [Google Scholar] [CrossRef]
  49. Winker, D.M.; Vaughan, M.A.; Omar, A.; Hu, Y.; Powell, K.A.; Liu, Z.; Hunt, W.H.; Young, S.A. Overview of the CALIPSO Mission and CALIOP Data Processing Algorithms. J. Atmos. Ocean. Technol. 2009, 26, 2310–2323. [Google Scholar] [CrossRef]
  50. Omar, A.H.; Winker, D.M.; Vaughan, M.A.; Hu, Y.; Trepte, C.R.; Ferrare, R.A.; Lee, K.P.; Hostetler, C.A.; Kittaka, C.; Rogers, R.R.; et al. The CALIPSO Automated Aerosol Classification and Lidar Ratio Selection Algorithm. J. Atmos. Ocean. Technol. 2009, 26, 1994–2014. [Google Scholar] [CrossRef]
  51. Kim, M.H.; Omar, A.H.; Tackett, J.L.; Vaughan, M.A.; Winker, D.M.; Trepte, C.R.; Hu, Y.; Liu, Z.; Poole, L.R.; Pitts, M.C.; et al. The CALIPSO version 4 automated aerosol classification and lidar ratio selection algorithm. Atmos. Meas. Tech. 2018, 11, 6107–6135. [Google Scholar] [CrossRef] [Green Version]
  52. Young, S.A.; Vaughan, M.A.; Garnier, A.; Tackett, J.L.; Lambeth, J.D.; Powell, K.A. Extinction and optical depth retrievals for CALIPSO’s Version 4 data release. Atmos. Meas. Tech. 2018, 11, 5701–5727. [Google Scholar] [CrossRef] [Green Version]
  53. Stein, A.F.; Draxler, R.R.; Rolph, G.D.; Stunder, B.J.B.; Cohen, M.D.; Ngan, F. NOAA’s HYSPLIT Atmospheric Transport and Dispersion Modeling System. Bull. Am. Meteorol. Soc. 2015, 96, 2059–2077. [Google Scholar] [CrossRef]
  54. Rolph, G.; Stein, A.; Stunder, B. Real-time Environmental Applications and Display sYstem: READY. Environ. Model. Softw. 2017, 95, 210–228. [Google Scholar] [CrossRef]
  55. Bodhaine, B.A.; Wood, N.B.; Dutton, E.G.; Slusser, J.R. On Rayleigh Optical Depth Calculations. J. Atmos. Ocean. Technol. 1999, 16, 1854–1861. [Google Scholar] [CrossRef]
  56. Bucholtz, A. Rayleigh-scattering calculations for the terrestrial atmosphere. Appl. Optics. 1995, 34, 2765–2773. [Google Scholar] [CrossRef] [PubMed]
  57. Bates, D. Rayleigh scattering by air. Planet. Space Sci. 1984, 32, 785–790. [Google Scholar] [CrossRef]
  58. Anderson, T.L.; Charlson, R.J.; Winker, D.M.; Ogren, J.A.; Holmén, K. Mesoscale Variations of Tropospheric Aerosols. J. Atmos. Sci. 2003, 60, 119–136. [Google Scholar] [CrossRef]
  59. Kovacs, T. Comparing MODIS and AERONET aerosol optical depth at varying separation distances to assess ground-based validation strategies for spaceborne lidar. J. Geophys. Res. Atmos. 2006, 111. [Google Scholar] [CrossRef] [Green Version]
  60. Pappalardo, G.; Wandinger, U.; Mona, L.; Hiebsch, A.; Mattis, I.; Amodeo, A.; Ansmann, A.; Seifert, P.; Linné, H.; Apituley, A.; et al. EARLINET correlative measurements for CALIPSO: First intercomparison results. J. Geophys. Res. Atmos. 2010. [Google Scholar] [CrossRef] [Green Version]
  61. Kim, M.H.; Omar, A.H.; Vaughan, M.A.; Winker, D.M.; Trepte, C.R.; Hu, Y.; Liu, Z.; Kim, S.W. Quantifying the low bias of CALIPSO’s column aerosol optical depth due to undetected aerosol layers. J. Geophys. Res. Atmos. 2017, 122, 1098–1113. [Google Scholar] [CrossRef]
  62. Klett, J.D. Lidar inversion with variable backscatter/extinction ratios. Appl. Opt. 1985, 24, 1638–1643. [Google Scholar] [CrossRef]
  63. Fernald, F.G. Analysis of atmospheric lidar observations: Some comments. Appl. Opt. 1984, 23, 652–653. [Google Scholar] [CrossRef]
  64. Sasano, Y.; Nakane, H. Significance of the extinction/backscatter ratio and the boundary value term in the solution for the two-component lidar equation. Appl. Opt. 1984, 23, 11_1–13. [Google Scholar] [CrossRef]
  65. Lopes, F.J.S.; Landulfo, E.; Vaughan, M.A. Evaluating CALIPSO’s 532 nm lidar ratio selection algorithm using AERONET sun photometers in Brazil. Atmos. Meas. Tech. 2013, 6, 3281–3299. [Google Scholar] [CrossRef] [Green Version]
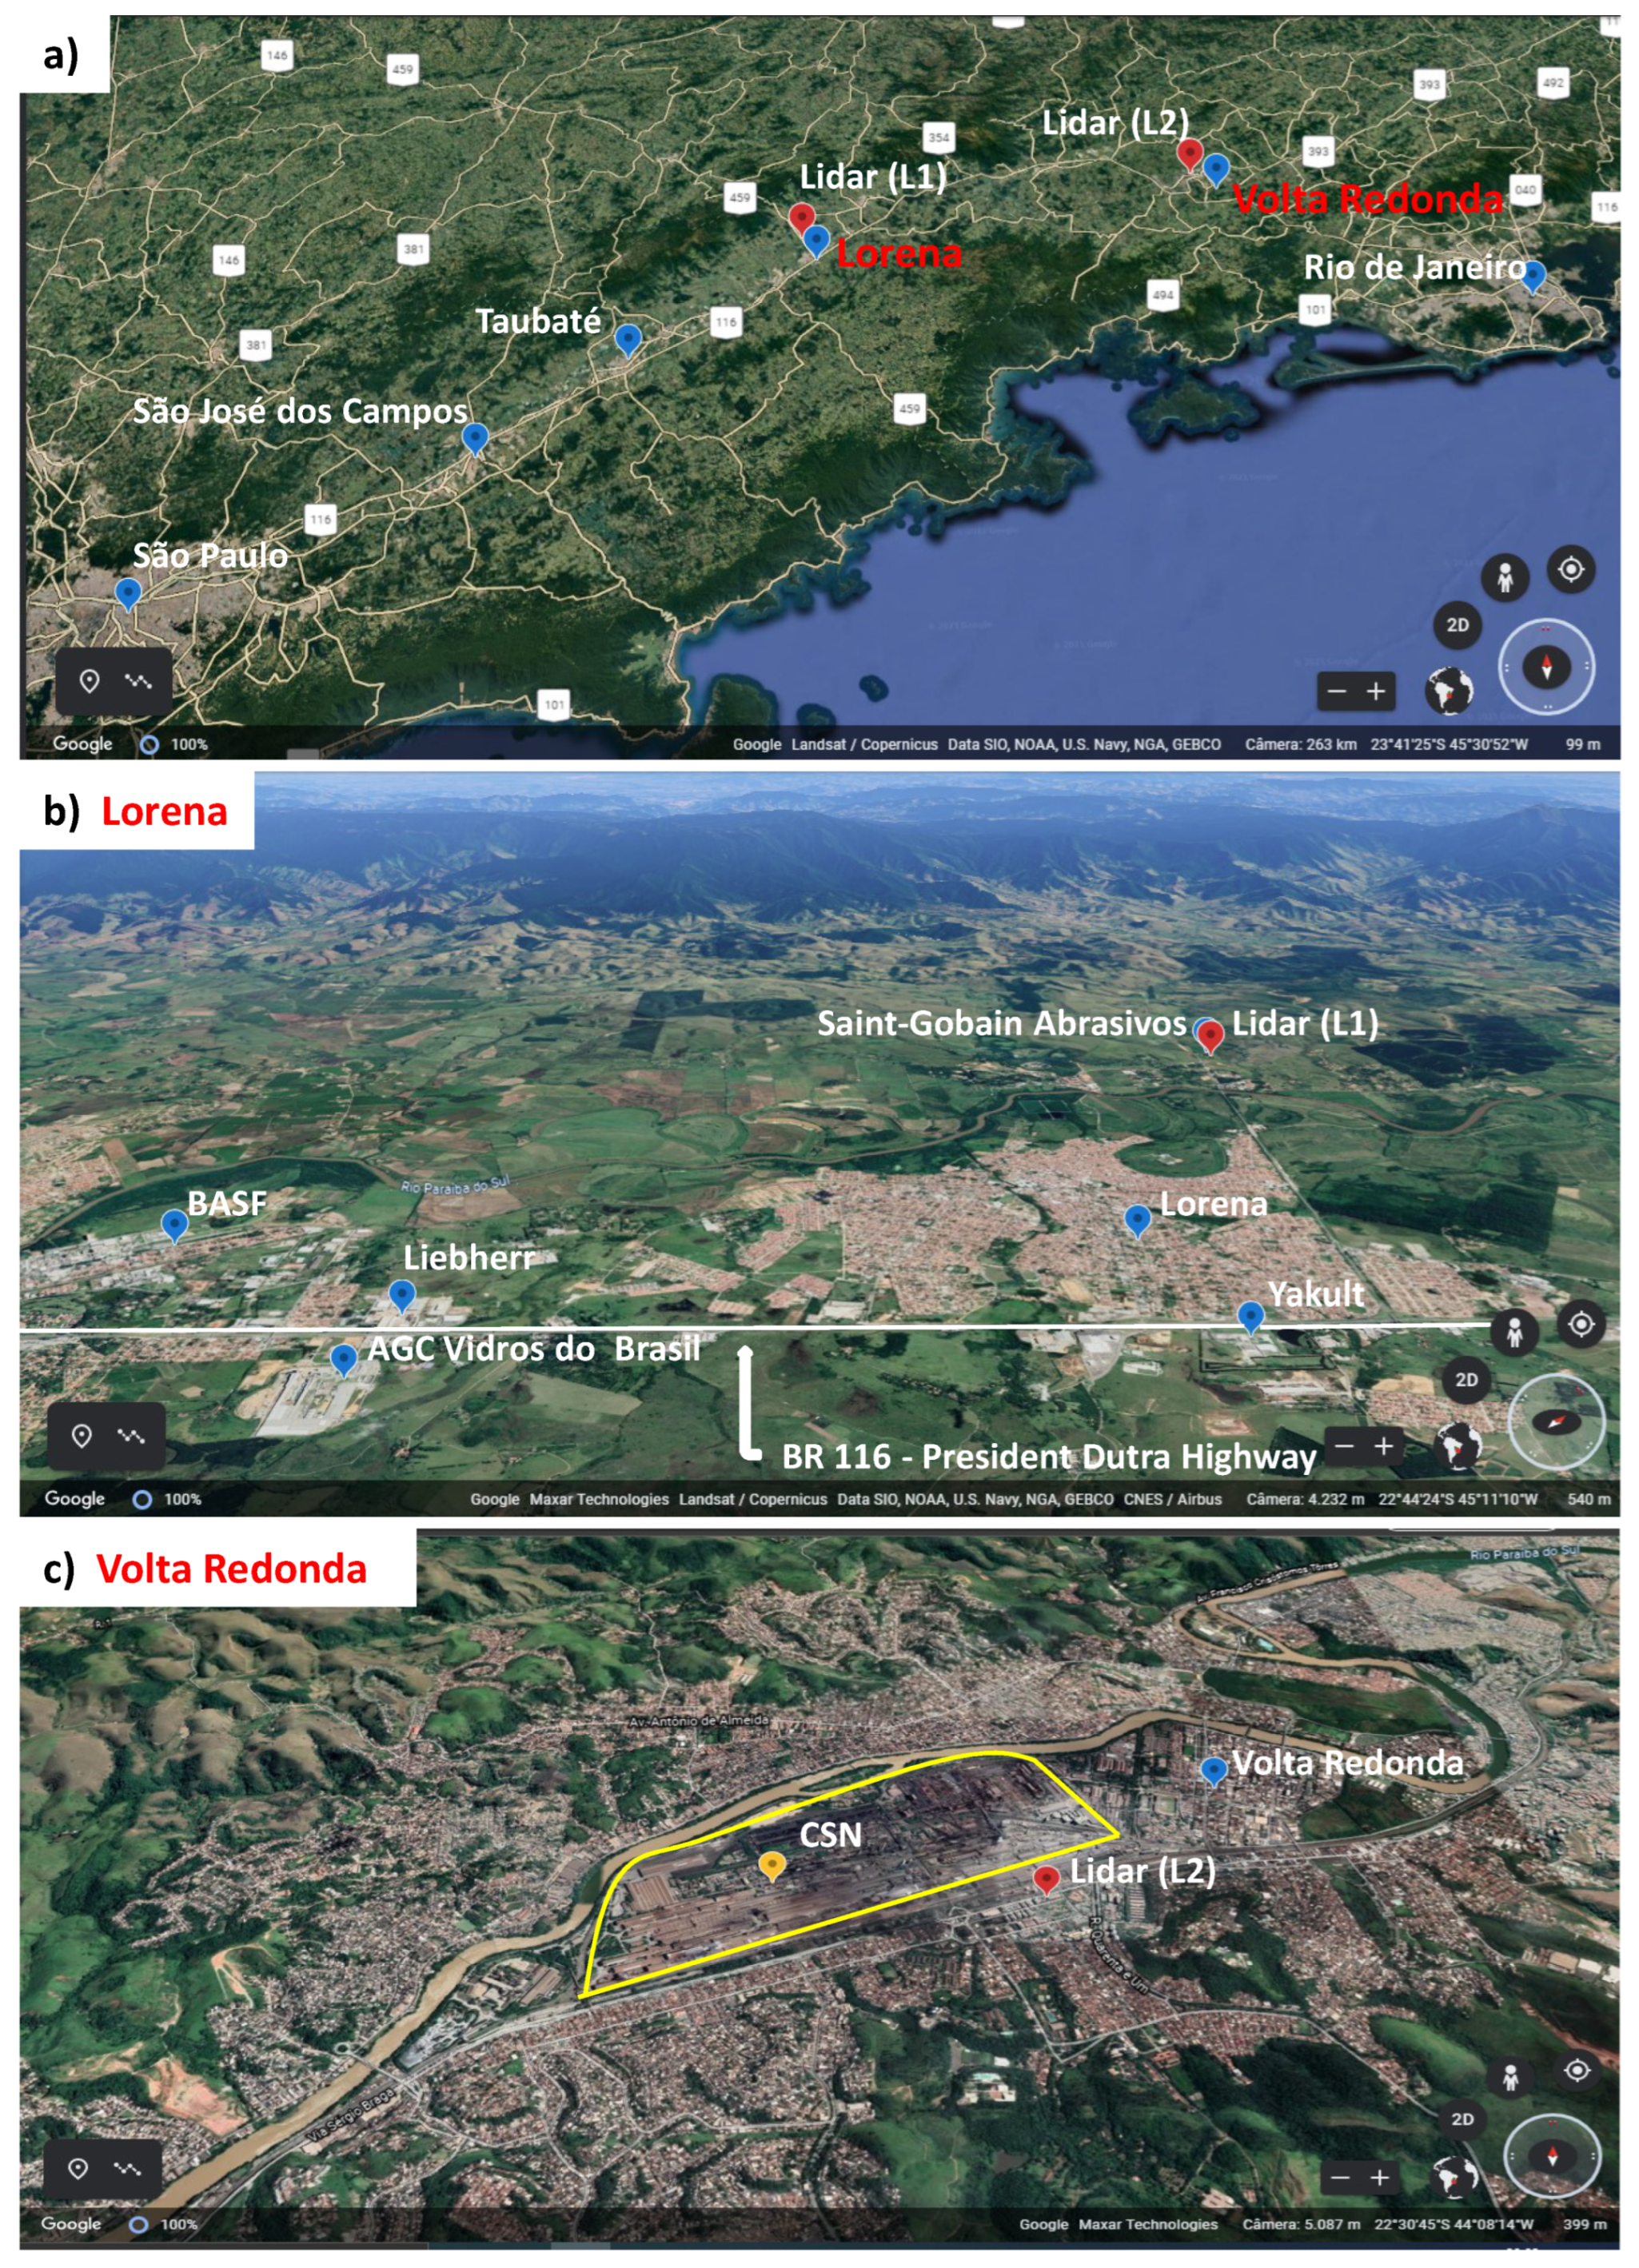
Figure 1. (a) Map of the region of the Paraíba valley with Lorena and Volta Redonda marked in red color. The Rio de Janeiro and São Paulo cities are also marked, as well as other important regions along the Presidente Dutra highway. (b) Lorena local map showing the lidar position (red pin) and nearby companies. (c) Volta Redonda local map. The lidar location is marked by a red pin while the yellow contour indicates the CSN area. One of two blast furnaces of the company, marked by a yellow pin, is 700 m away from the lidar position.
Remotesensing 14 01675 g001
Figure 2. Time series distribution of the monthly mean particulate matter concentration for the period of March of 2015 to December of 2020 for all four CETESB air quality stations over Paraíba valley.
Remotesensing 14 01675 g002
Figure 3. Whisker plots of the monthly AOD and lidar ratio from CALIOP/CALIPSO products at 532 nm over Volta Redonda-RJ, for the period of June of 2006 to December of 2020.
Remotesensing 14 01675 g003aRemotesensing 14 01675 g003b
Figure 4. Whisker plots of the monthly AOD and lidar ratio from CALIOP/CALIPSO products at 532 nm over Lorena-SP, for the period of June of 2006 to December of 2020.
Remotesensing 14 01675 g004
Figure 5. Frequency of occurrence of aerosol subtype flagged by CALIOP/CALIPSO data over Lorena-SP and Volta Redonda-RJ for the period of June of 2006 to December of 2020.
Remotesensing 14 01675 g005
Figure 6. Aerosol backscatter profiles for three representative measurement days in Lorena city: (a) Clean day; (b) day with possible transport of aerosols; and (c) polluted day.
Remotesensing 14 01675 g006
Figure 7. Five-day backward trajectories ending at Lorena site with different altitude levels, from 500 to 4000 m a.g.l., on 26 June 2014 at 06:00 UTC. Several fire focuses, represented by the red points, are detected by AQUA MODIS monitoring and retrieved from the biomass burning database from The National Institute for Space Research (INPE)—http://queimadas.dgi.inpe.br/queimadas/portal (accessed on 17 September 2021).
Remotesensing 14 01675 g007
Figure 8. Daily average aerosol backscatter profiles for three representative measurement days.
Remotesensing 14 01675 g008
Figure 9. Aerosol backscatter profiles image in Volta Redonda city on 4 December 2018 retrieved by KFS inversion method applying the lidar ratio value of 55 ± 22 sr.
Remotesensing 14 01675 g009
Figure 10. Daily average aerosol backscatter profile in Volta Redonda city on 4 December 2018.
Remotesensing 14 01675 g010
Figure 11. Three-day backward trajectories ending at Volta Redonda site with different altitude levels, from 1000 to 6000 m a.g.l., on 5 December of 2018 at 06:00 UTC. Several fire focuses, represented by the red points, are detected by AQUA MODIS and retrieved from the biomass burning database from the National Institute for Space Research (INPE)—http://queimadas.dgi.inpe.br/queimadas/portal (accessed on 17 September 2021).
Remotesensing 14 01675 g011
Publisher’s Note: MDPI stays neutral with regard to jurisdictional claims in published maps and institutional affiliations.