Article

Influence of Topographic Shading on the Mass Balance of the High Mountain Asia Glaciers

1
State Key Laboratory of Cryospheric Sciences, Northwest Institute of Eco-Environment and Resources, CAS, Lanzhou 730000, China
2
University of Chinese Academy of Sciences, Beijing 100049, China
3
China-Pakistan Joint Research Center on Earth Sciences, CAS-HEC, Islamabad 45320, Pakistan
4
College of Water Conservancy and Hydropower Engineering, Gansu Agricultural University, Lanzhou 730070, China
*
Author to whom correspondence should be addressed.
Remote Sens. 2022, 14(7), 1576; https://doi.org/10.3390/rs14071576
Submission received: 3 February 2022 / Revised: 20 March 2022 / Accepted: 22 March 2022 / Published: 24 March 2022
(This article belongs to the Special Issue Remote Sensing in Glaciology and Cryosphere Research)

Abstract

:
Most studies attribute the glacier mass balance within High Mountain Asia (HMA) to climate change, ignoring the influence of its complex terrain. Knowledge of the influence of this complex terrain is crucial for understanding the spatial variability in its mass balance. However, there is a lack of any systematic assessment of this influence across HMA. Therefore, in this study, we used the glacier outlines and raster data (SRTM DEM, slope and aspect) to calculate the topographic shading of all 97,965 glaciers within HMA during the ablation period, which is regarded as a major index of the influence of complex terrain on the mass balance. The results showed that 27.19% of HMA glacier area was subjected to topographic shading, and regional differences were significant with respect to both their altitudinal and spatial distributions. The topographic shading contributed to the protection of the smallest glaciers from solar illumination. Furthermore, we found a significant correlation between the topographic shading and mass balance in these small north-facing glaciers. However, these small glaciers were most prevalent in the north-facing orientation, especially in West Kunlun, East Kunlun, Inner Tibet Plateau and Qilian Shan, where shading was found to increase with decreases in the glacier area. This indicates that complex terrain can affect the spatial distribution of the mass balance by altering the solar illumination pattern.

1. Introduction

High Mountain Asia (HMA) is known as the Asian water tower [1], as it constitutes the largest concentration of glaciers and ice caps outside the polar regions, accounting for approximately 30% of the total area of all mountain glaciers on Earth [2,3]. The total volume of the glaciers in HMA is 6.14 × 10³ km3, providing meltwater supply to rivers that meet the requirements of nearly a quarter of a billion people [4], as well as agriculture on the Indo-Gangetic plain [5]. Due to ongoing climate change, most of the glaciers in HMA have suffered remarkable mass loss, becoming vulnerable and unsustainable due to their higher ablation than accumulation in these regions [6]. The mass balance spatial heterogeneity loss has been obvious across HMA in recent decades [7,8,9,10,11,12], with extremely negative mass balance leading to marked glacier thinning in Tian Shan and Hengduan Shan. The exception is the Karakoram, with a slightly positive mass balance having been observed [13]. Nevertheless, the current climate factors do not fully explain the mass balance differences, such as the Karakoram Glacier Anomaly [6], as numerous gaps remain in our knowledge of regional glacier behavior and the interactions of glaciers with complex topography. To improve our understanding of the relationship between mass balance and topography, it is crucial to carry out mass balance simulations and water resource estimates.
Although the mass balance within HMA is a combined climate response derived from numerous influencing factors [14,15,16,17,18,19], climate change is still a primary driver [14]. Spatial heterogeneity of the mass balance within HMA is driven by different atmospheric circulation patterns, which transform the annual distribution and source of precipitation [8]. Moreover, glaciers under these atmospheric circulation patterns can be classified as maritime, continental and subcontinental glacier types, with each having differential climate sensitivities [20,21]. However, the problem still exists that climate factors are not able to explain the difference in mass balance under the same climate conditions at a smaller scale. It is evident that the mass balance for north-facing glaciers is less than that of those facing south [19], and the same is true for the glacier area change [22]. It has been pointed out that the currently stable regional mass balance of Karakoram Anomaly glaciers might be attributable to topographic factors [6]. Within HMA, which is often referred to as the Third Pole [8], glaciers exist where cold climate, high altitude and complex terrain are the main environmental characteristics, all of which promote the glaciers’ evolution.
The effect of complex topography on glacier mass balance reflects the influence of topographic shading. By obstructing solar illumination, topographic shading exerts a direct impact on solar radiation reaching the glacier surface and has a significant effect on glacier mass balance [23]. Consequently, most studies take topographic shading into account in the distributed mass balance to improve the simulation accuracy [24,25,26,27]. As well as providing topographic shading data for models, these data also help to interpret glacier changes. A previous study found that the change in area of some small glaciers was not significant over their monitoring period, due to the topographic shading’s obstruction of direct solar radiation [28]. York (2013) found obvious differences in the mass balance for south- and north-facing glaciers [29], which were likely attributable to differences in the glacier aspects and solar illumination, with south-facing, higher solar illumination glaciers losing the most mass and vice versa for north-facing glaciers. Radiation and topographic shading are more important than wind in affecting glacier aspects and particularly affect the mass balance in accumulation areas [30]. It can be seen that topographic shading is not only important for a distributed mass balance model but also for understanding glacier changes.
Several topographic shading methods have been proposed. Mcdonnell et al. (1998) carried out the hill shading calculations in ArcGIS by determining the hill shading value of the center cell of a moving window using five surrounding grid units [31], ignoring the influence of the surrounding topographic grid cells that were further away. Some studies have considered the distant terrain obscuring effect and applied the ray tracing method to calculate topographic shading, which requires a digital elevation model (DEM) covering the glacier to be large enough so that the ray can trace the edge of the DEM to improve the calculation accuracy [24,32,33,34]. This approach is widely used to constrain the solar radiation over rugged terrain; hence, it is used in distributed mass balance models [26,27,35,36,37]. Topographic shading is particularly important for understanding glacier differences and model applications. However, systematic estimates of the relationship between topographic shading and mass balance remain lacking within HMA.
Here, we used the Shuttle Radar Topography Mission (SRTM) DEM data with a resolution of 90 m that covered all the glaciers within HMA, together with data on the glacier slope and aspect. We calculated the grid topographic shading by ray tracing according to the location between the grid and solar beam. The main aim of this study was to calculate the topographic shading of 97,965 glaciers included in the Randolph Glacier Inventory (RGI) version 6.0 on each pixel scale. Our goal was to provide a systematic estimate of the relationship between mass balance and topographic shading across HMA.

2. Materials and Methods

2.1. Study Area

HMA includes 16 mountain ranges and covers many countries in Asia, spanning from the Altai and Tian Shan Mountains to the Tibetan Plateau (TP) (Figure 1). Due to its high elevation and cold climate, this region holds the largest area of glaciers outside the polar regions [8]. According to the global Randolph Glacier Inventory version 6.0 [38], there are 97,965 glaciers within HMA, covering a total area of 98,752.33 km2 (Table 1). The Karakoram has the largest area covered by glaciers (22,858.08 km2), accounting for 23% of the total HMA glacier area. The Altay and Sayan have the smallest glacier area, 1161.57 km2, accounting for approximately 1% of the total area. The glacier area depends strongly on orientation in HMA. Nearly 40% of the glacier area is orientated north, of which 53% is in Qilian Shan and 28% is in the East Himalayas. The north-facing aspects are most suitable for glacier development, while glaciers oriented south have the smallest areas, because the stronger solar illumination hinders glacier development. South-facing glaciers account for only 15% of the total glacier area. There is no marked difference in glacier areas between east and west orientations, which account for 24% and 19%, respectively.
The rugged landscape affects the glacier development and distribution within HMA and also influences climate models applied to this region. Glaciers in HMA are primarily affected by atmospheric circulation patterns, including westerlies, the Indian monsoon and the East Asian monsoon [8]. The weather systems associated with these climatic patterns significantly affect glaciers by influencing the annual distribution of precipitation and temperature. Glaciers in different regions show different patterns of summer versus winter accumulation types [20,21]. The westerlies-dominated region receives abundant winter precipitation, such that glaciers in Western HMA (for example, the Tian Shan and Karakoram) are winter accumulation-type glaciers [39]. The Indian and East Asian monsoons strongly influence the Southwestern HMA, and summer precipitation is dominant in this region. Mountains block the transfer of most moisture to the TP, with precipitation decreasing sharply away from the plateau margin in both the monsoon and westerlies regions [18]. Consequently, most glaciers are east-facing in this region. Overall, both topography and climate affect the glacier distribution.

2.2. Data

The glacier outlines within HMA were taken from the RGI 6.0 [38]. Data for most glaciers in China were extracted from the second Chinese Glacier Inventory (CGI), covering the period 2006–2010 [40]. Glaciers outside China were based on RGI 6.0, which is based on satellite imagery for 1999–2010 [41]. Raster data for each glacier were established using the DEMs, aspect, slope and glacier outlines.
Glacier surface topography was extracted from the SRTM DEM version 4 [42] for the region 65–110° E and 25–55° N, fully covering all the glaciers in HMA. The DEM was transformed from geographical coordinates to Asia North Lambert Conformal Conic projection coordinates with a spatial resolution of 90 m. These transformed data were then used to calculate the aspect and slope.
The glacier-wide geodetic mass balance data were calculated from the rate of elevation change extracted from a linear fit of multitemporal DEMs obtained from the Advanced Spaceborne Thermal Emission and Reflection Radiometer (ASTER) [7], which covers most glaciers within HMA, except Altay and Sayan. The individual glacier mass balances have a median uncertainty of ±0.22 m water equivalent (w.e.)/a, ranging from a minimum of ±0.14 to a maximum of ±0.89 m w.e./a [7]. Only glaciers larger than 2 km2 were included to limit the error for the glacier mass balance, which decreases with the increasing glacier area [43]. Since small glaciers have a larger uncertainty for mass balance, we calculated the correlation between topographic shading and mass balance to maximize the information available for the mass balances of small glaciers. The glacier mass balances were calculated using the RGI 6.0 glacier mask to match the topographic shading raster.

2.3. Topographic Shading Calculation

For the topographic shading calculations, we first determined the solar ray location of each glacier grid cell. The solar ray location mainly involves calculating the solar altitude angle and solar azimuth of each pixel for individual glaciers within HMA using the following equations [44,45,46]:
α = a s i n ( s i n Φ π 180 s i n δ π 180 + c o s Φ π 180 c o s δ π 180 c o s h π 180 )
β = a c o s s i n Φ π 180 s i n α s i n δ π 180 c o s Φ π 180 c o s α
where α denotes the solar altitude angle, β is the solar azimuth, Φ is the geographical latitude (positive value in the Northern Hemisphere and negative in the Southern Hemisphere), δ is the solar declination and h is the hour angle.

2.3.1. Solar Declination

The solar declination (δ) is the angle between the sun’s rays and the equatorial plane, which is a function of the day of the year:
δ = 0.3948 + δ 1 + δ 2 + δ 3
δ 1 = 23.2559 c o s 2 π t j 365 + 0.1582
δ 2 = 0.3915 c o s 4 π t j 365 + 0.0934    
δ 3 = 0.1764 c o s 6 π t j 365 + 0.4539  
where tj is the Julian date (number of day of the year).

2.3.2. Hour Angle

The hour angle is the angle through which the Earth must turn to bring the meridian of the site directly under the sun. This angle is a function of the time of day:
h = 15 t 12
where t is the local apparent solar time.
In astronomy, time is divided into reference solar time and local apparent solar time. For glaciers within HMA, we referred to Beijing time (longitude 120°), which is not the local apparent solar time. When the solar ray location is calculated, the time must be the local apparent solar time. Therefore, we translated Beijing time to local apparent solar time using the following equations:
t = M T + l o n l o n r e f 15 + Δ T
where MT indicates the reference time and is assumed to be the Beijing time, lon is the grid pixel longitude, lonref is 120° and ΔT is expressed by:
Δ T = 0.128 sin θ 2.8 π 180 0.165 s i n 2 θ + 19.7 π 180
θ = t j 365.25 360

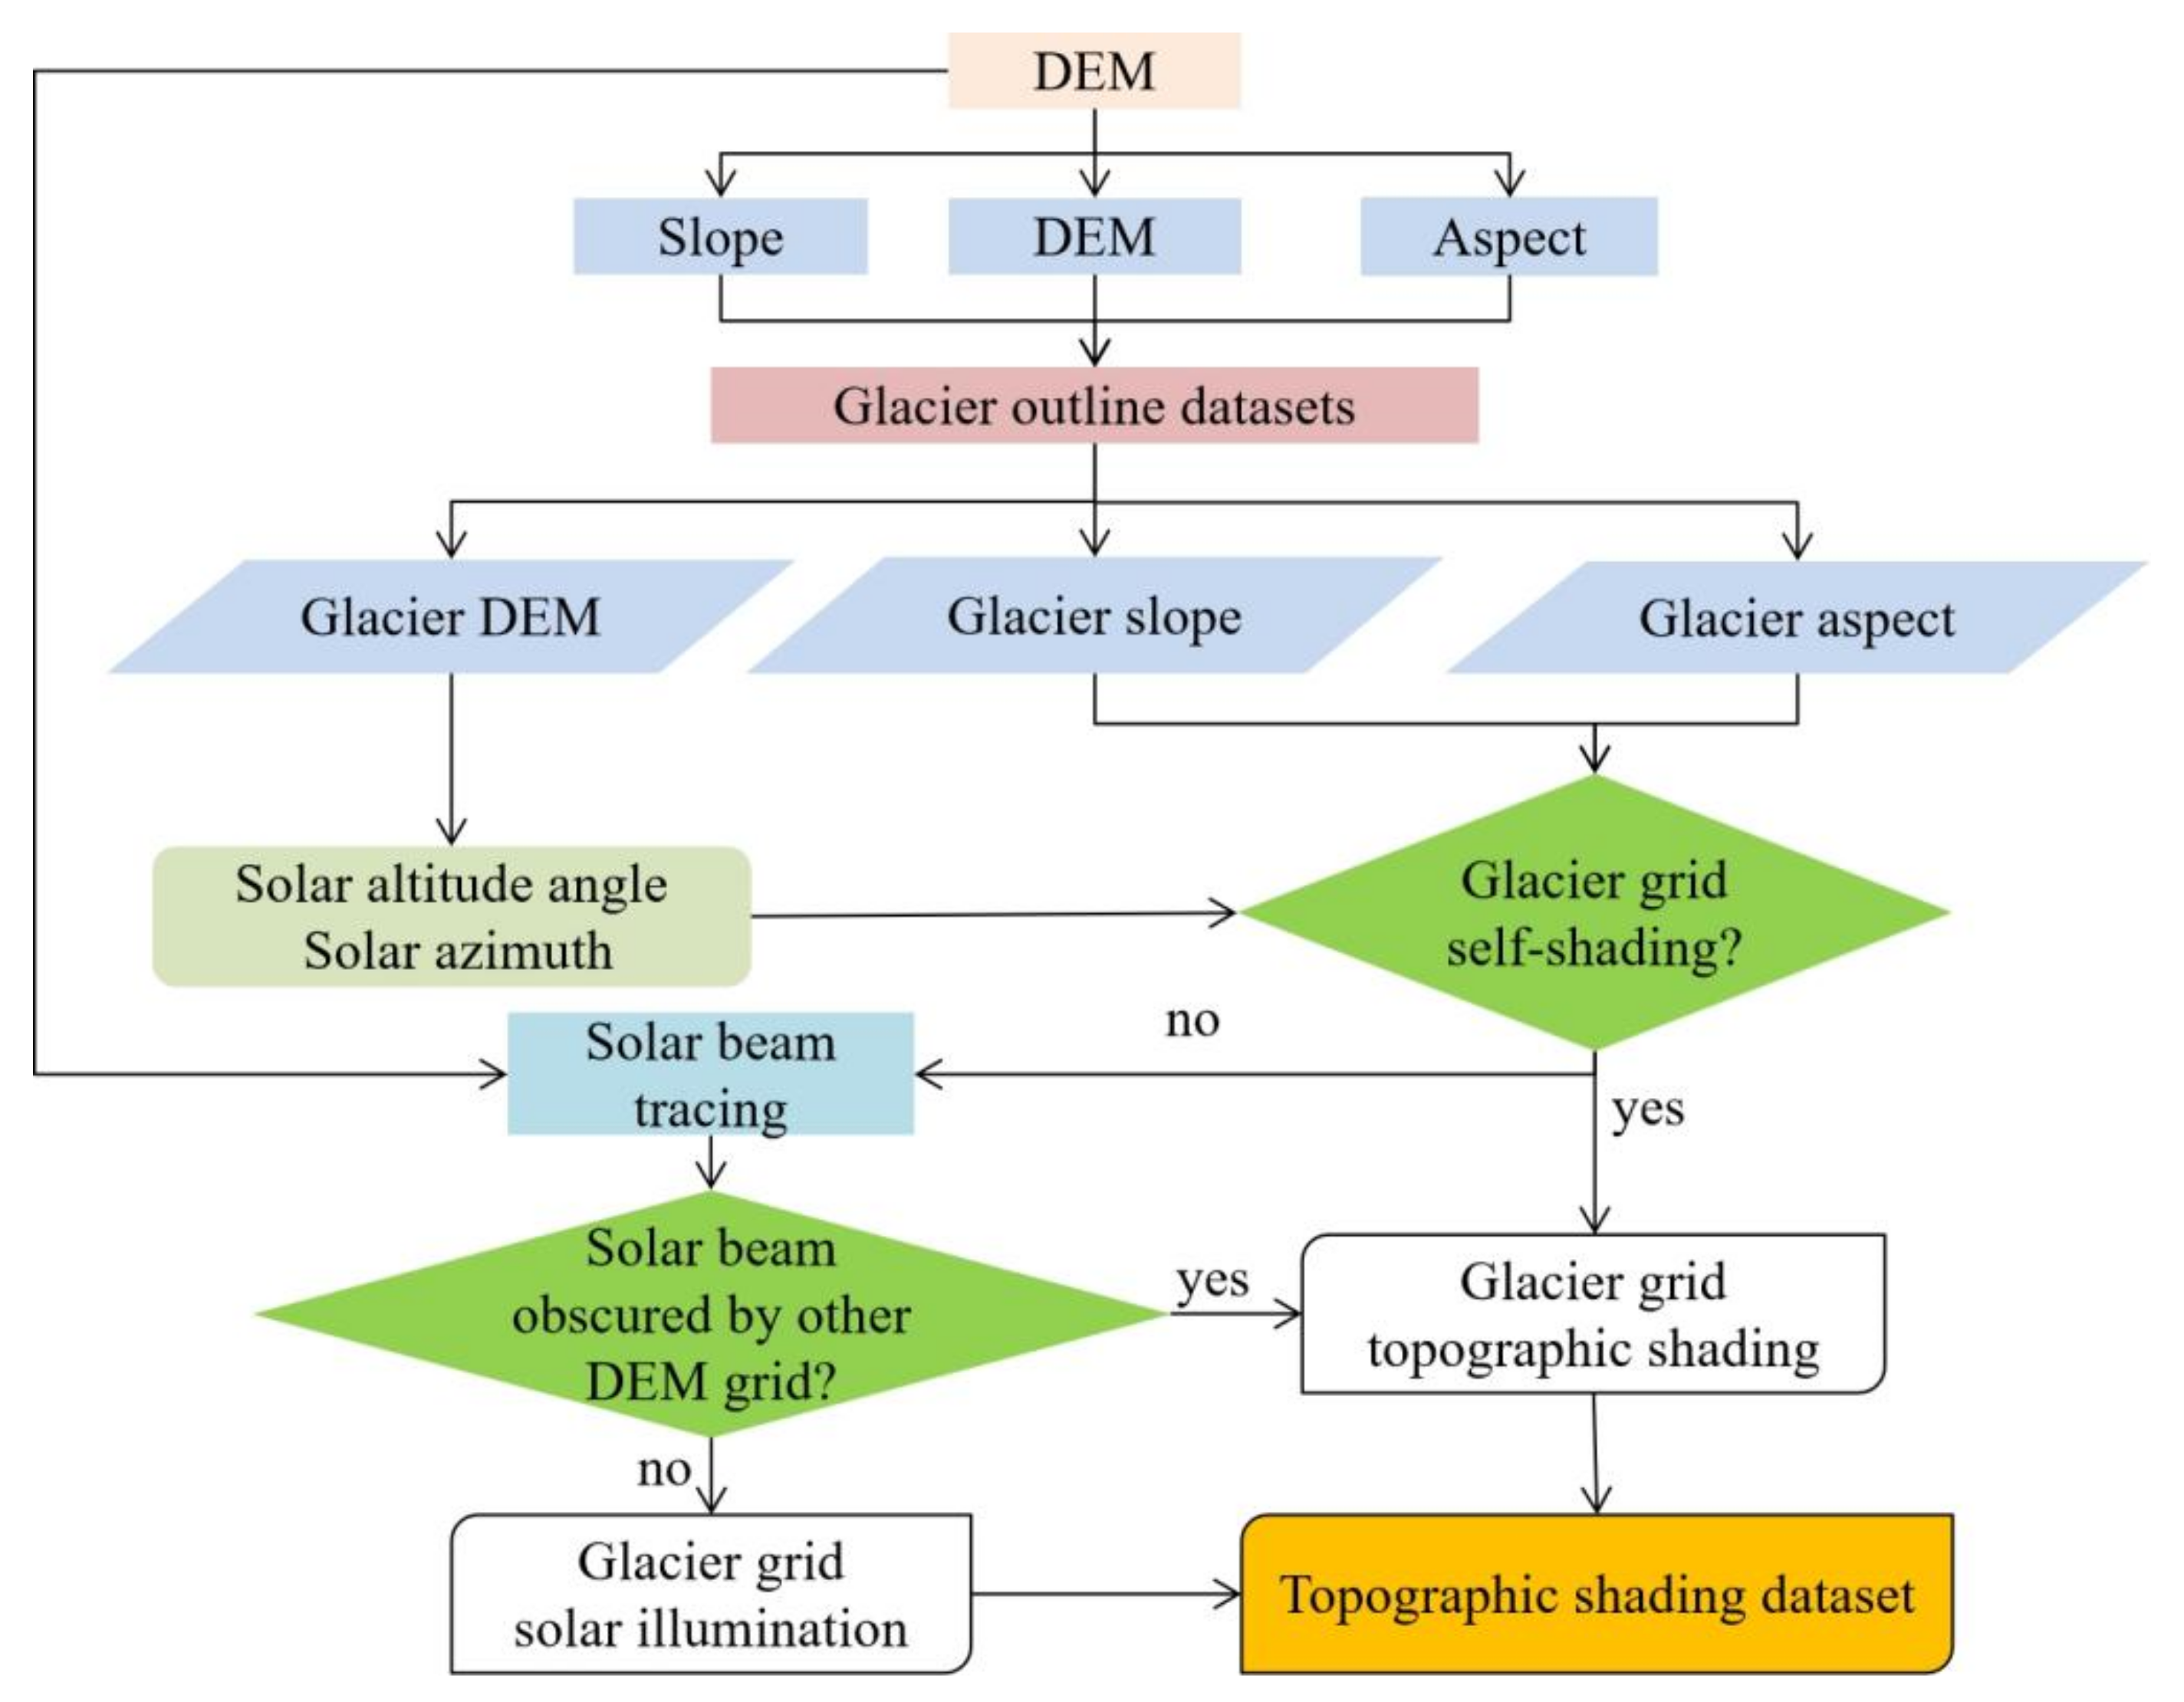
2.3.3. Topographic Shading of Glaciers

Glacier surface topographic shading occurs when the sun is obscured by topography during the day. Here, the solar illumination time is regarded as the period when the sun rises above the horizon in the morning and sinks below the horizon in the evening. This period changes with space and time. In this study, we calculated the solar altitude angle and solar azimuth at every hour during the ablation period (from June to September), as this is when the shading has a more significant influence on glacier melting compared to any other time period. We also restricted our focus to this period because glacier shading calculations are computationally expensive when considering a spatial resolution of 90 m for each hour from June to September within HMA.
Glacier surface topographic shading was calculated following the work flow shown in Figure 2 using the DEM and glacier outlines dataset. This process can be divided into three key steps as follows:
  • Data preprocessing
To obtain the glacier slope and aspect data, we transformed the DEM data from geographical coordinates to Asia North Lambert Conformal Conic projection coordinates, which is the projection data used to calculate the slope and aspect of glaciers within HMA. Since this process changed the raster data resolution, we translated all those data (slope, aspect and DEM) from the projection coordinates to geographical coordinates when considering the solar beam tracing for each grid in the third step, thereby ensuring a consistent resolution for the slope, aspect and DEM. These datasets were clipped by the extent of each glacier within HMA to form the basic dataset before the next step.
2.
Determine whether a grid is self-shading
For any glacier grid, we must consider whether the grid itself is obscuring the solar beam. If the slope of the glacier grid is greater than the solar altitude angle, when the solar azimuth is not within ±90° of the grid aspect range, then the glacier grid is obscured by its own grid. If not, the third step is required.
3.
Determine whether the solar beam is obscured by another DEM grid.
When tracing the glacier grid, it is necessary to determine a maximum tracking distance. In most cases, this maximum distance is equal to the maximum elevation of the region where the glacier is located divided by the tan(α). If this distance is greater than 50 km, 50 km should be chosen as the maximum tracking distance. Hock and Holmgren (2005) set zenith angles greater than 78° to 78°, allowing for refraction and other effects to be considered [25]. We initially designated all grid cells in the DEM as being illuminated. For each grid cell of the glacier DEM, the computational algorithm was applied to the start cell along the path of the solar beam and then to each subsequent cell until the maximum distance was reached. If any of the DEM elevations along the solar beam path were higher than the solar beam in that grid, the glacier grid was obscured. Otherwise, the glacier grid was solar-illuminated.
Finally, we obtained hourly glacier topographic shading data for all glaciers within HMA during the ablation period following the above steps. Taking Koxkar glacier (RGI60-13.43232) as an example, Figure 3 shows the topographic shading of that glacier at different time points. The topographic shading at noon was less extensive than that at 08:00 and 18:00 in June and varied greatly with time. The spatial frequency of shading differed significantly during the ablation period (shading frequency refers to the fractional duration of shading during the whole ablation period). The topographic shading was concentrated on the accumulation zone above the median elevation. Some areas were permanently shaded and had a shading frequency equal to 1. Most low-frequency areas below median elevation received more solar radiation, leading to glacier melting.

3. Results

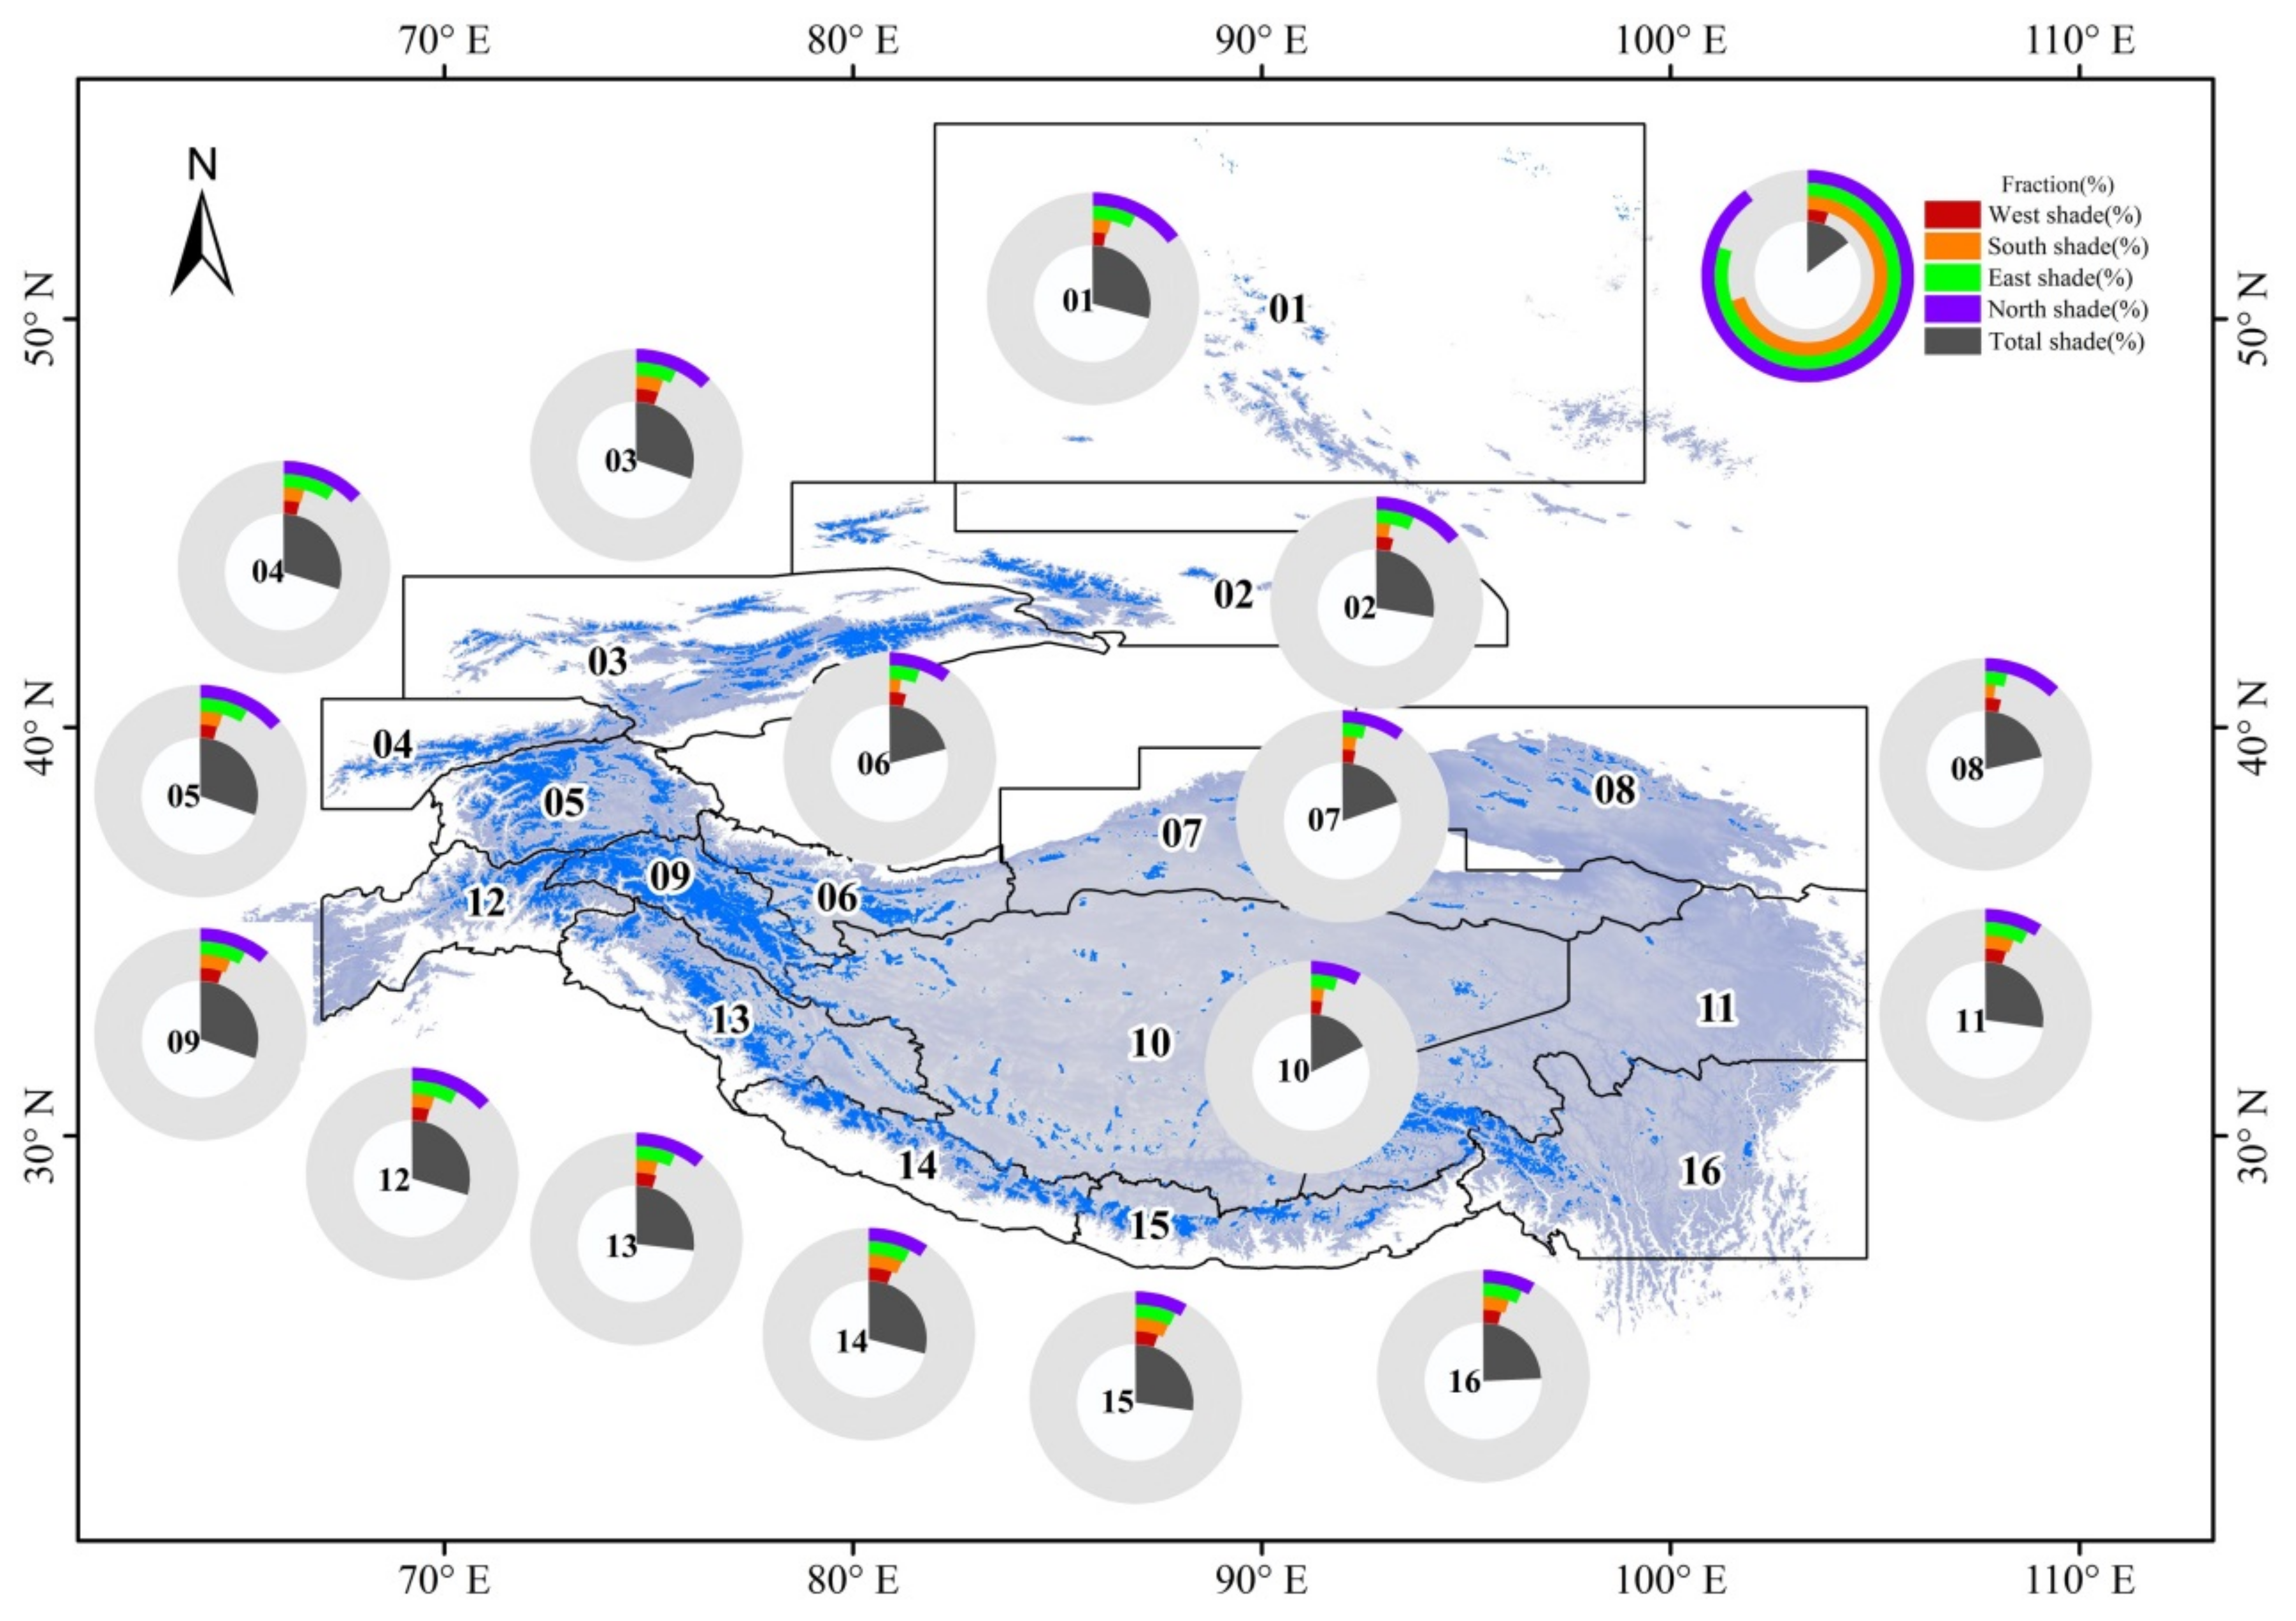
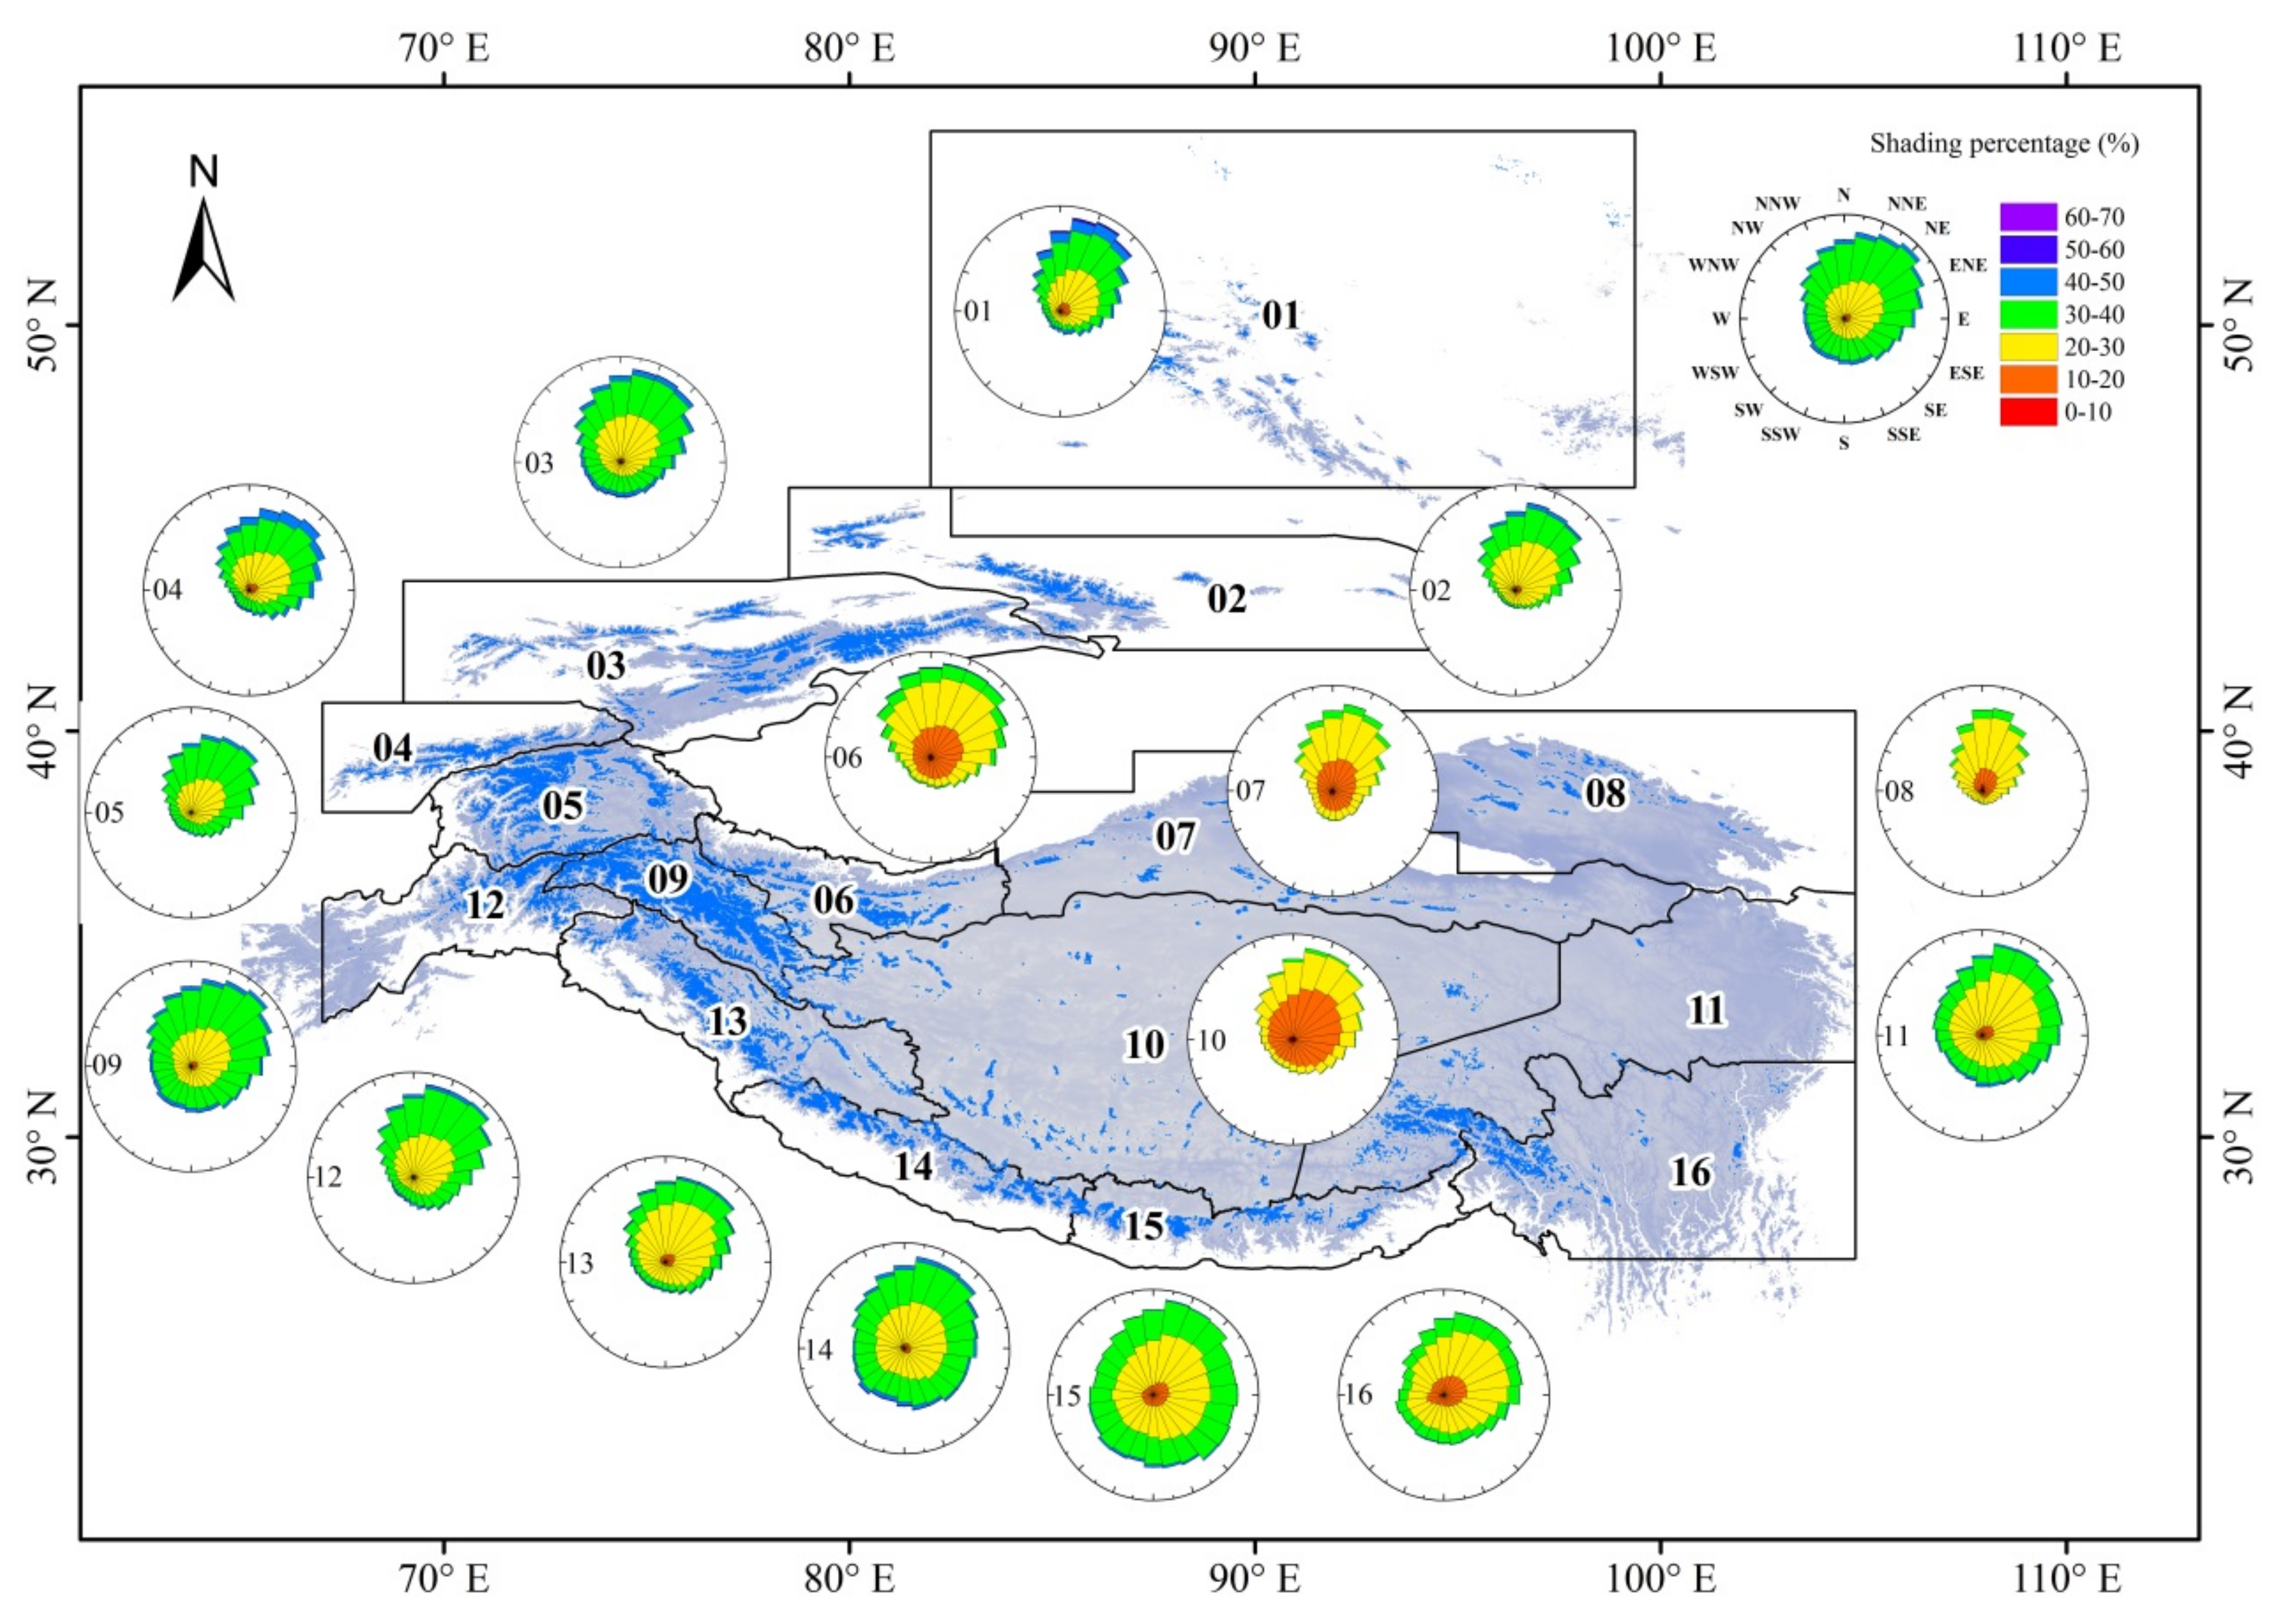
3.1. The Topographic Shading Area Differences between Each Region of HMA

To quantify the topographic shading area extent within each region of HMA, we calculated the regional percentage of the shading area relative to the regional glacier area using the DEM pixels. As shown in Figure 3, the shading area varied greatly with the time. Therefore, we averaged the shading area for individual glaciers during the ablation period. Our results showed apparent differences in the topographic shading areas between each region due to the complex terrain influence, as shown in Figure 4. The regional distribution of the shading area percentage varied from 17.76% to 30.43% during the ablation period. The larger shading area percentages were distributed in the Karakoram, Pamir and West Tianshan, where the shading area percentages were 30.43%, 30.35% and 30.20%, respectively (Table 1), meaning that more than 30% of the regional glacier area was shaded. This can be attributed to the high mountains in these regions. The East Kunlun and Inner Tibet Plateau had smaller shading percentages (19.73% and 17.76%, respectively). The glacier inventory showed that glaciers in the Inner Tibet Plateau have a smaller slope than those in other regions [40]. This indicates that the terrain is relatively flat, which resulted in the small shading area percentages in this study. The overall shading area percentage of all glaciers within HMA was found to be 27.19%.
The glaciers in HMA are located in the middle latitudes of the Northern Hemisphere, and the sun mainly illuminates their south-facing slopes. Therefore, the north-facing slopes of the glaciers are often shaded. Although glaciers are influenced by the orientation of the mountains, the topographic shading is still strongest for the northern aspect. The average shading area percentages for the north, east, south and west aspects for all the glaciers in HMA were found to be 10.97%, 6.72%, 4.36% and 4.31% (Table 2), respectively. This finding also implies that glaciers on the north-facing slopes are less prone to melting, which is especially worth considering in the simulations of glacier area changes and glacier mass balances in the northern regions.
For the regions in HMA (e.g., Altay and Sayan, East Tianshan, Pamir and Qilian Shan), the shading area percentages of the northern aspects were found to be far greater than those of the other aspects. This phenomenon is not evident for glaciers in the Himalayas and Hengduan Shan, where the shading areas vary less with the aspect, perhaps due to the south–north orientation of the mountains. We also found that East Tianshan, Qilian Shan and West Kunlun glaciers had greater shading percentages of the west aspects than the south aspects. This shows that the regional differences in shading areas is complex due to the influence of the terrain.

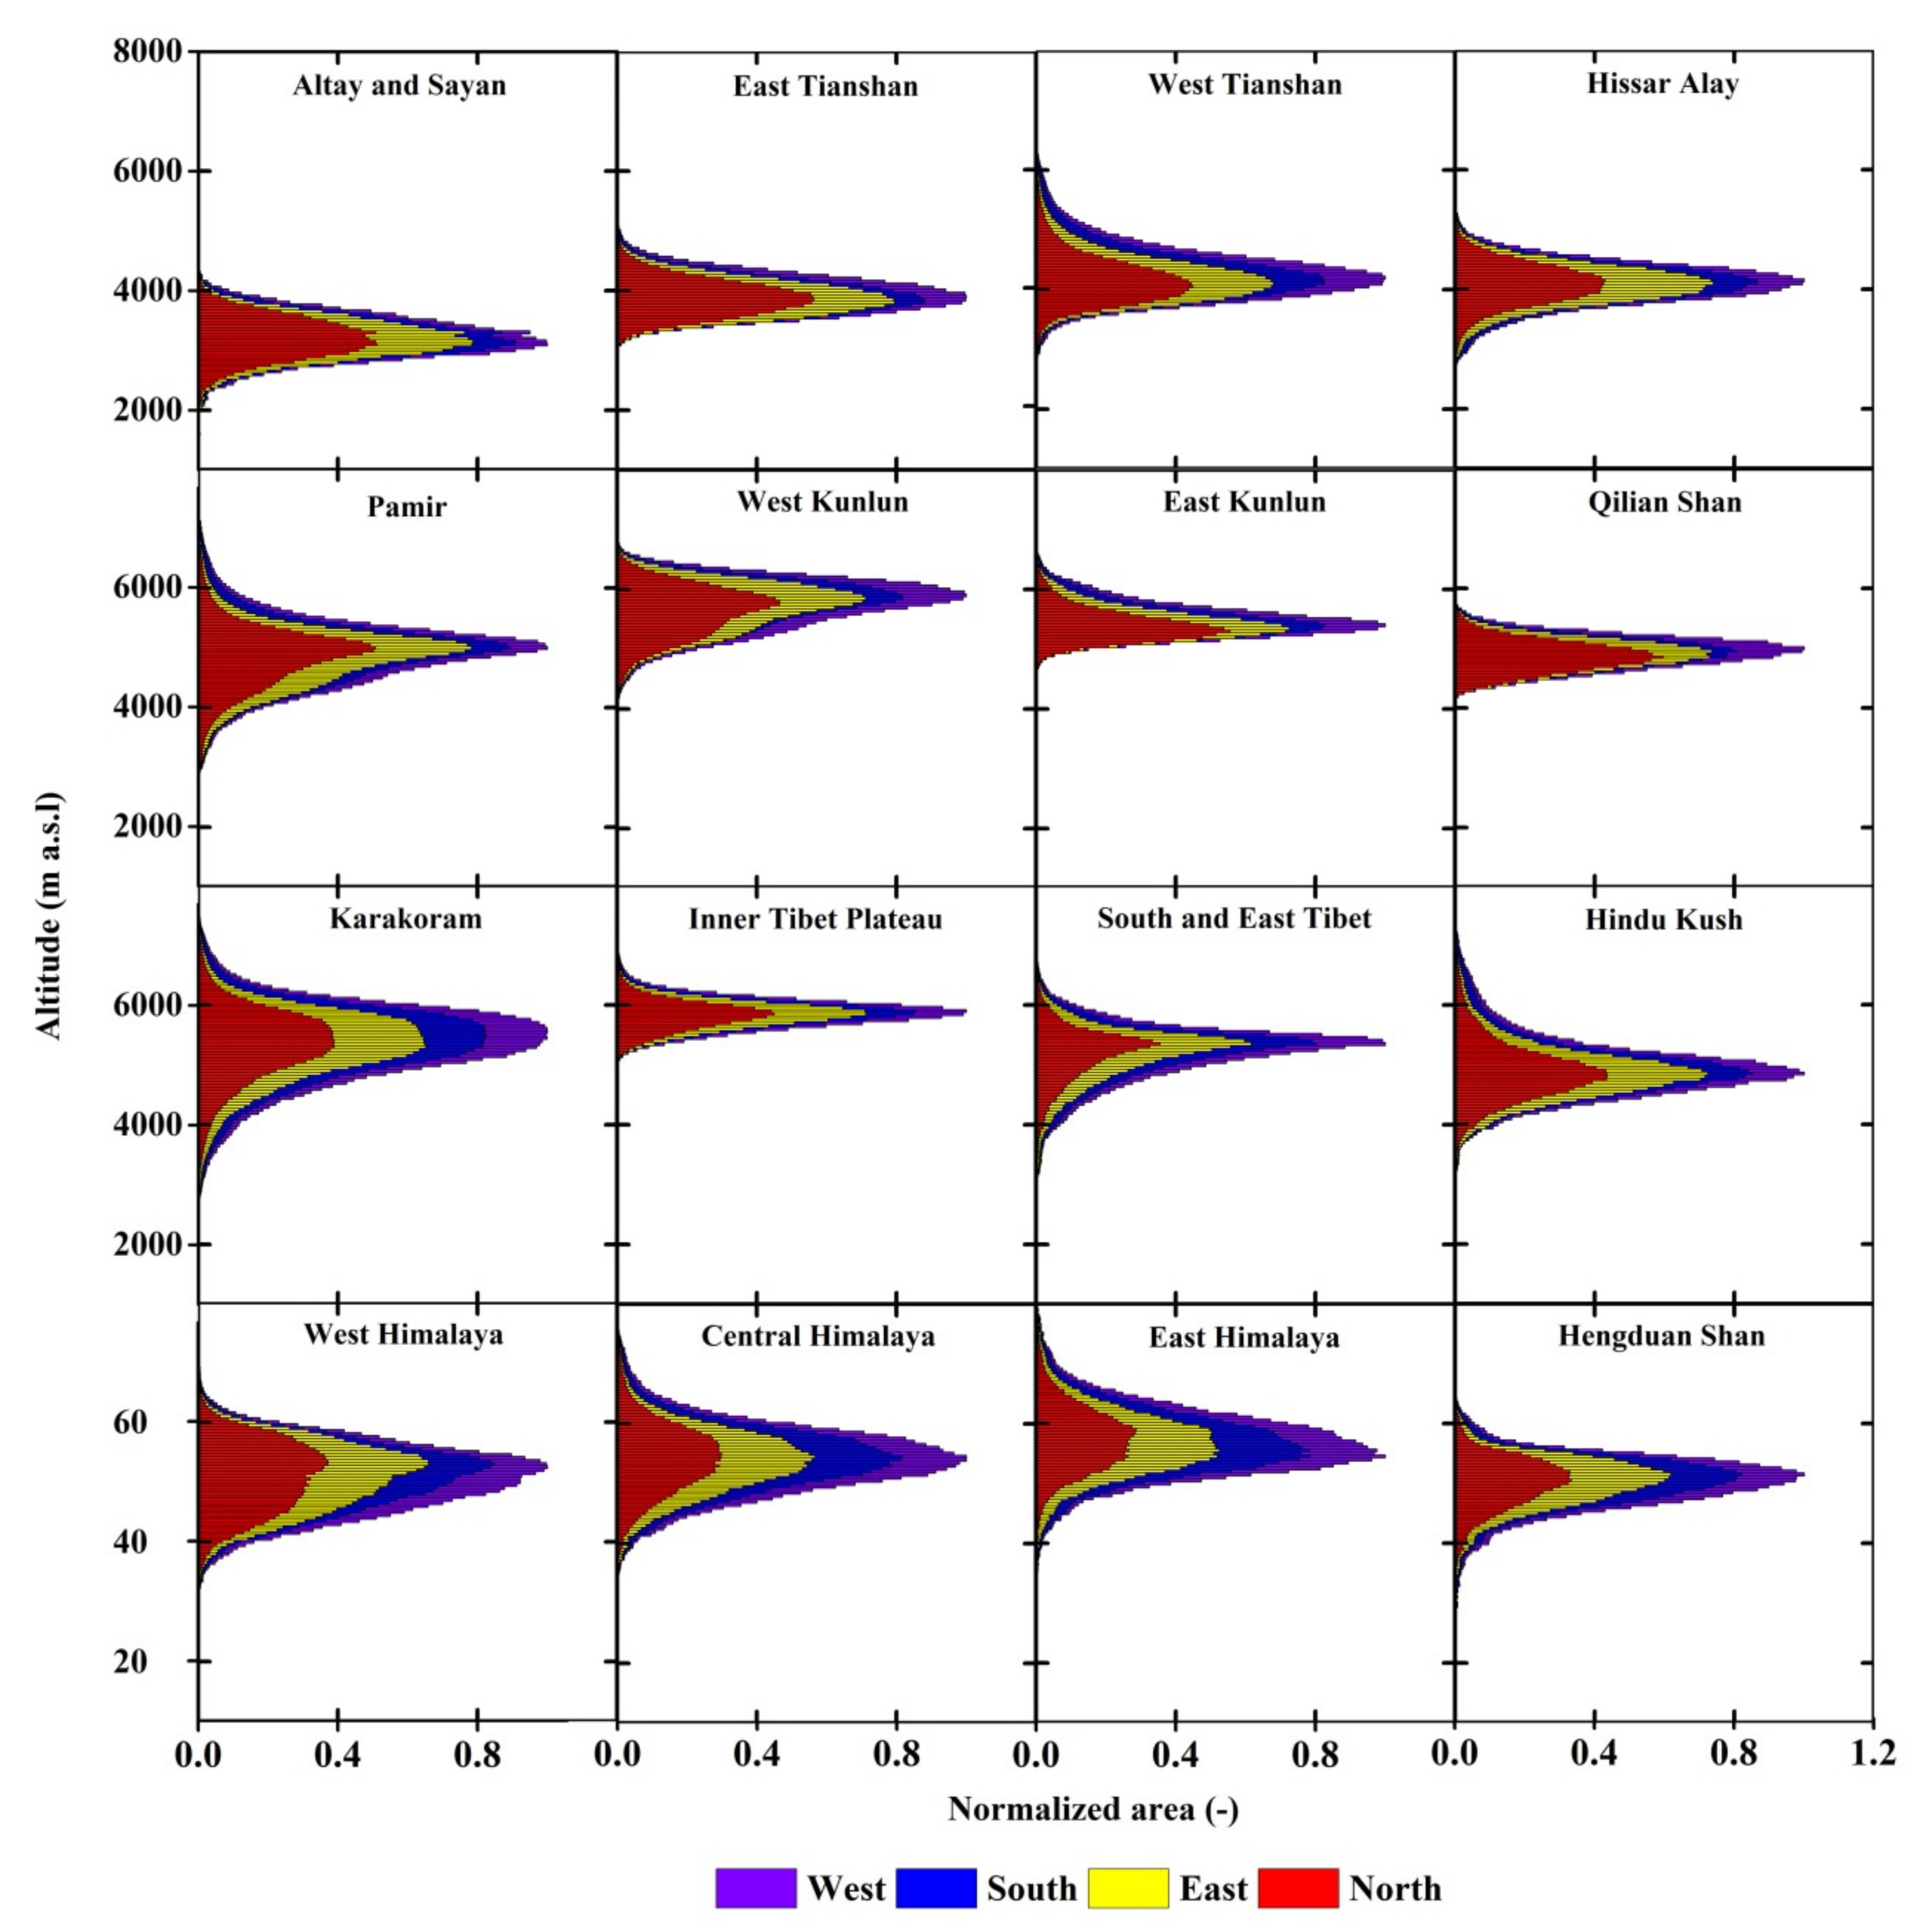
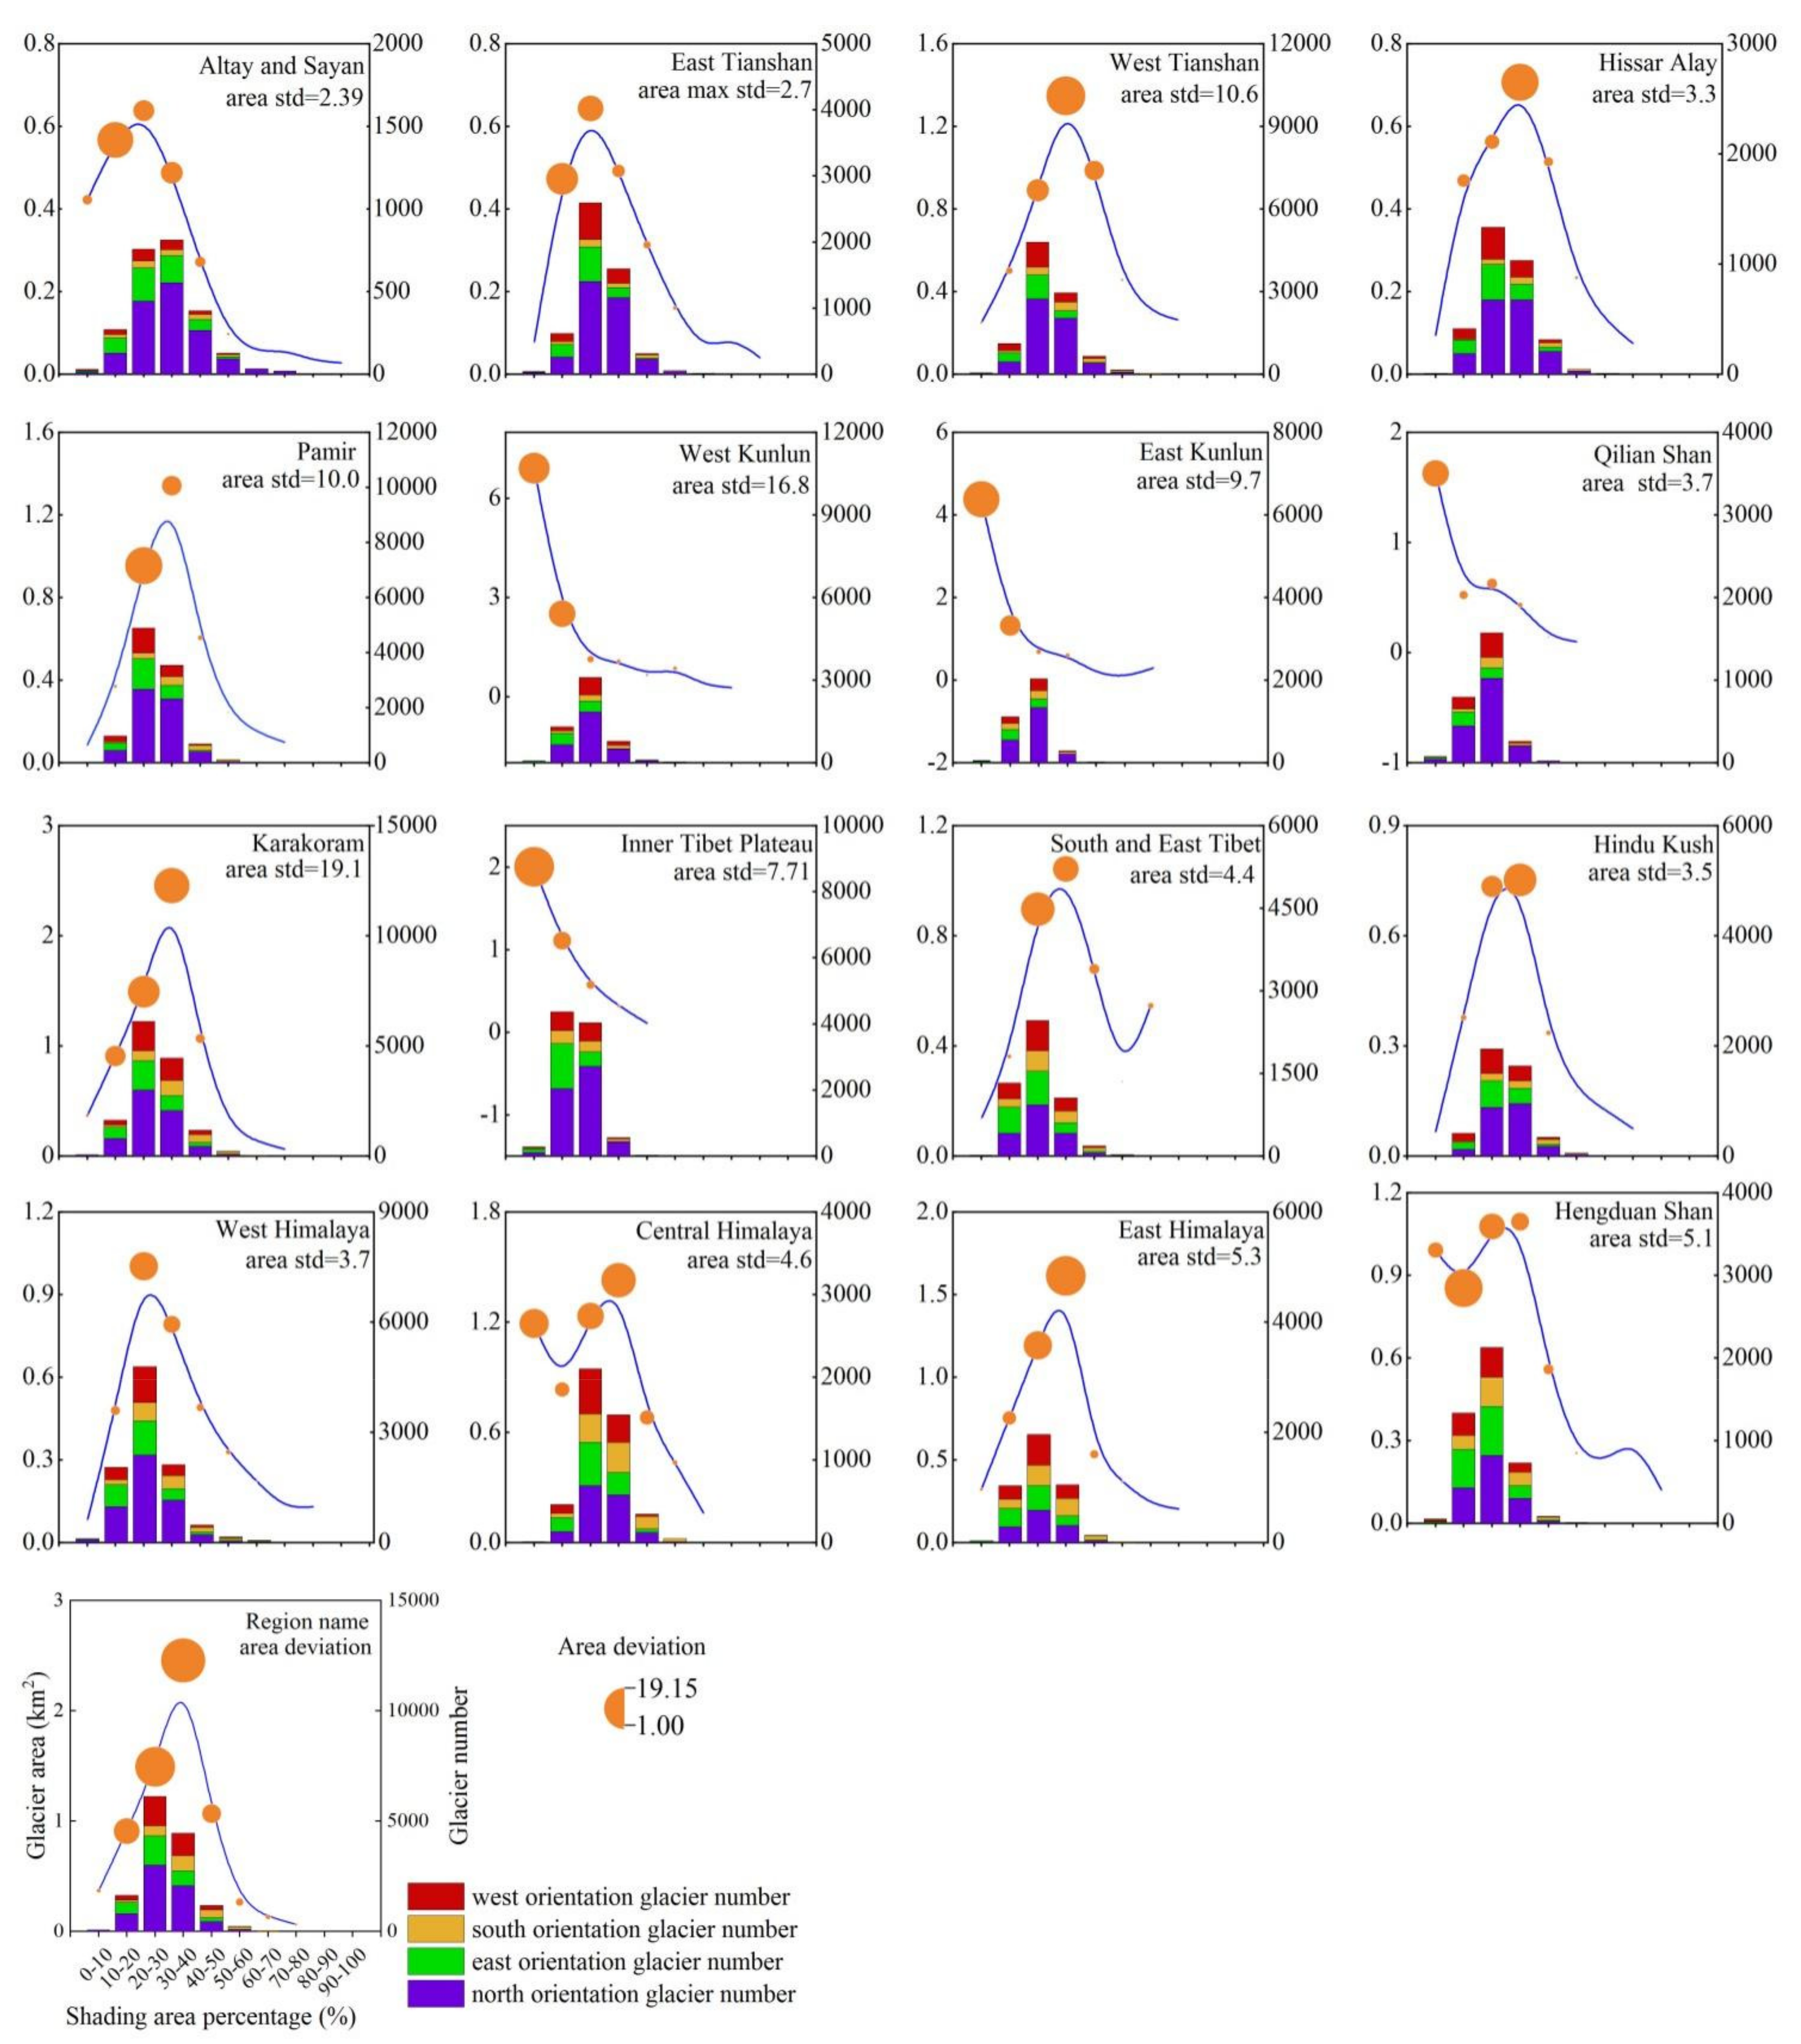
3.2. Altitudinal Distribution of Glacier Shading Areas

The shading areas vary with the altitude, as well as horizontally. To evaluate how shading depends on elevation, we calculated a pixel-wise altitudinal distribution of the shading areas for different aspects in each region of HMA (Figure 5). The shading areas were found to increase with the decreasing elevation, but the greatest shading area was typically around the median altitude. However, there were obvious regional differences in altitudinal shading areas for the different aspects. For the glaciers in Altay and Sayan, West Tianshan, East Kunlun and Qilian Shan, the shading areas on the west-, south-, east- and north-facing aspects successively increased from high altitude to low altitude; in addition, high mountain areas were found to obscure illumination of the west- and south-facing slopes in the high elevation zone, while they obscured the east- and north-facing slopes in the low elevation zone. In general, areas in high elevations were found to be in the glacier accumulation zone, while those at low elevations were in the ablation zone. This distribution of shading favors glacier development for the east and north orientations.
In contrast, the shading areas for the west, south, east and north aspects increased from high elevation to low elevation in the West Himalayas, which indicates that the larger mountains cause shading at low elevations in the west and south and at high elevations in the east and north. This pattern promotes glacier development for the west and south aspects, while glaciers for the east and north aspects undergo more intense ablation due to the reduced shading.

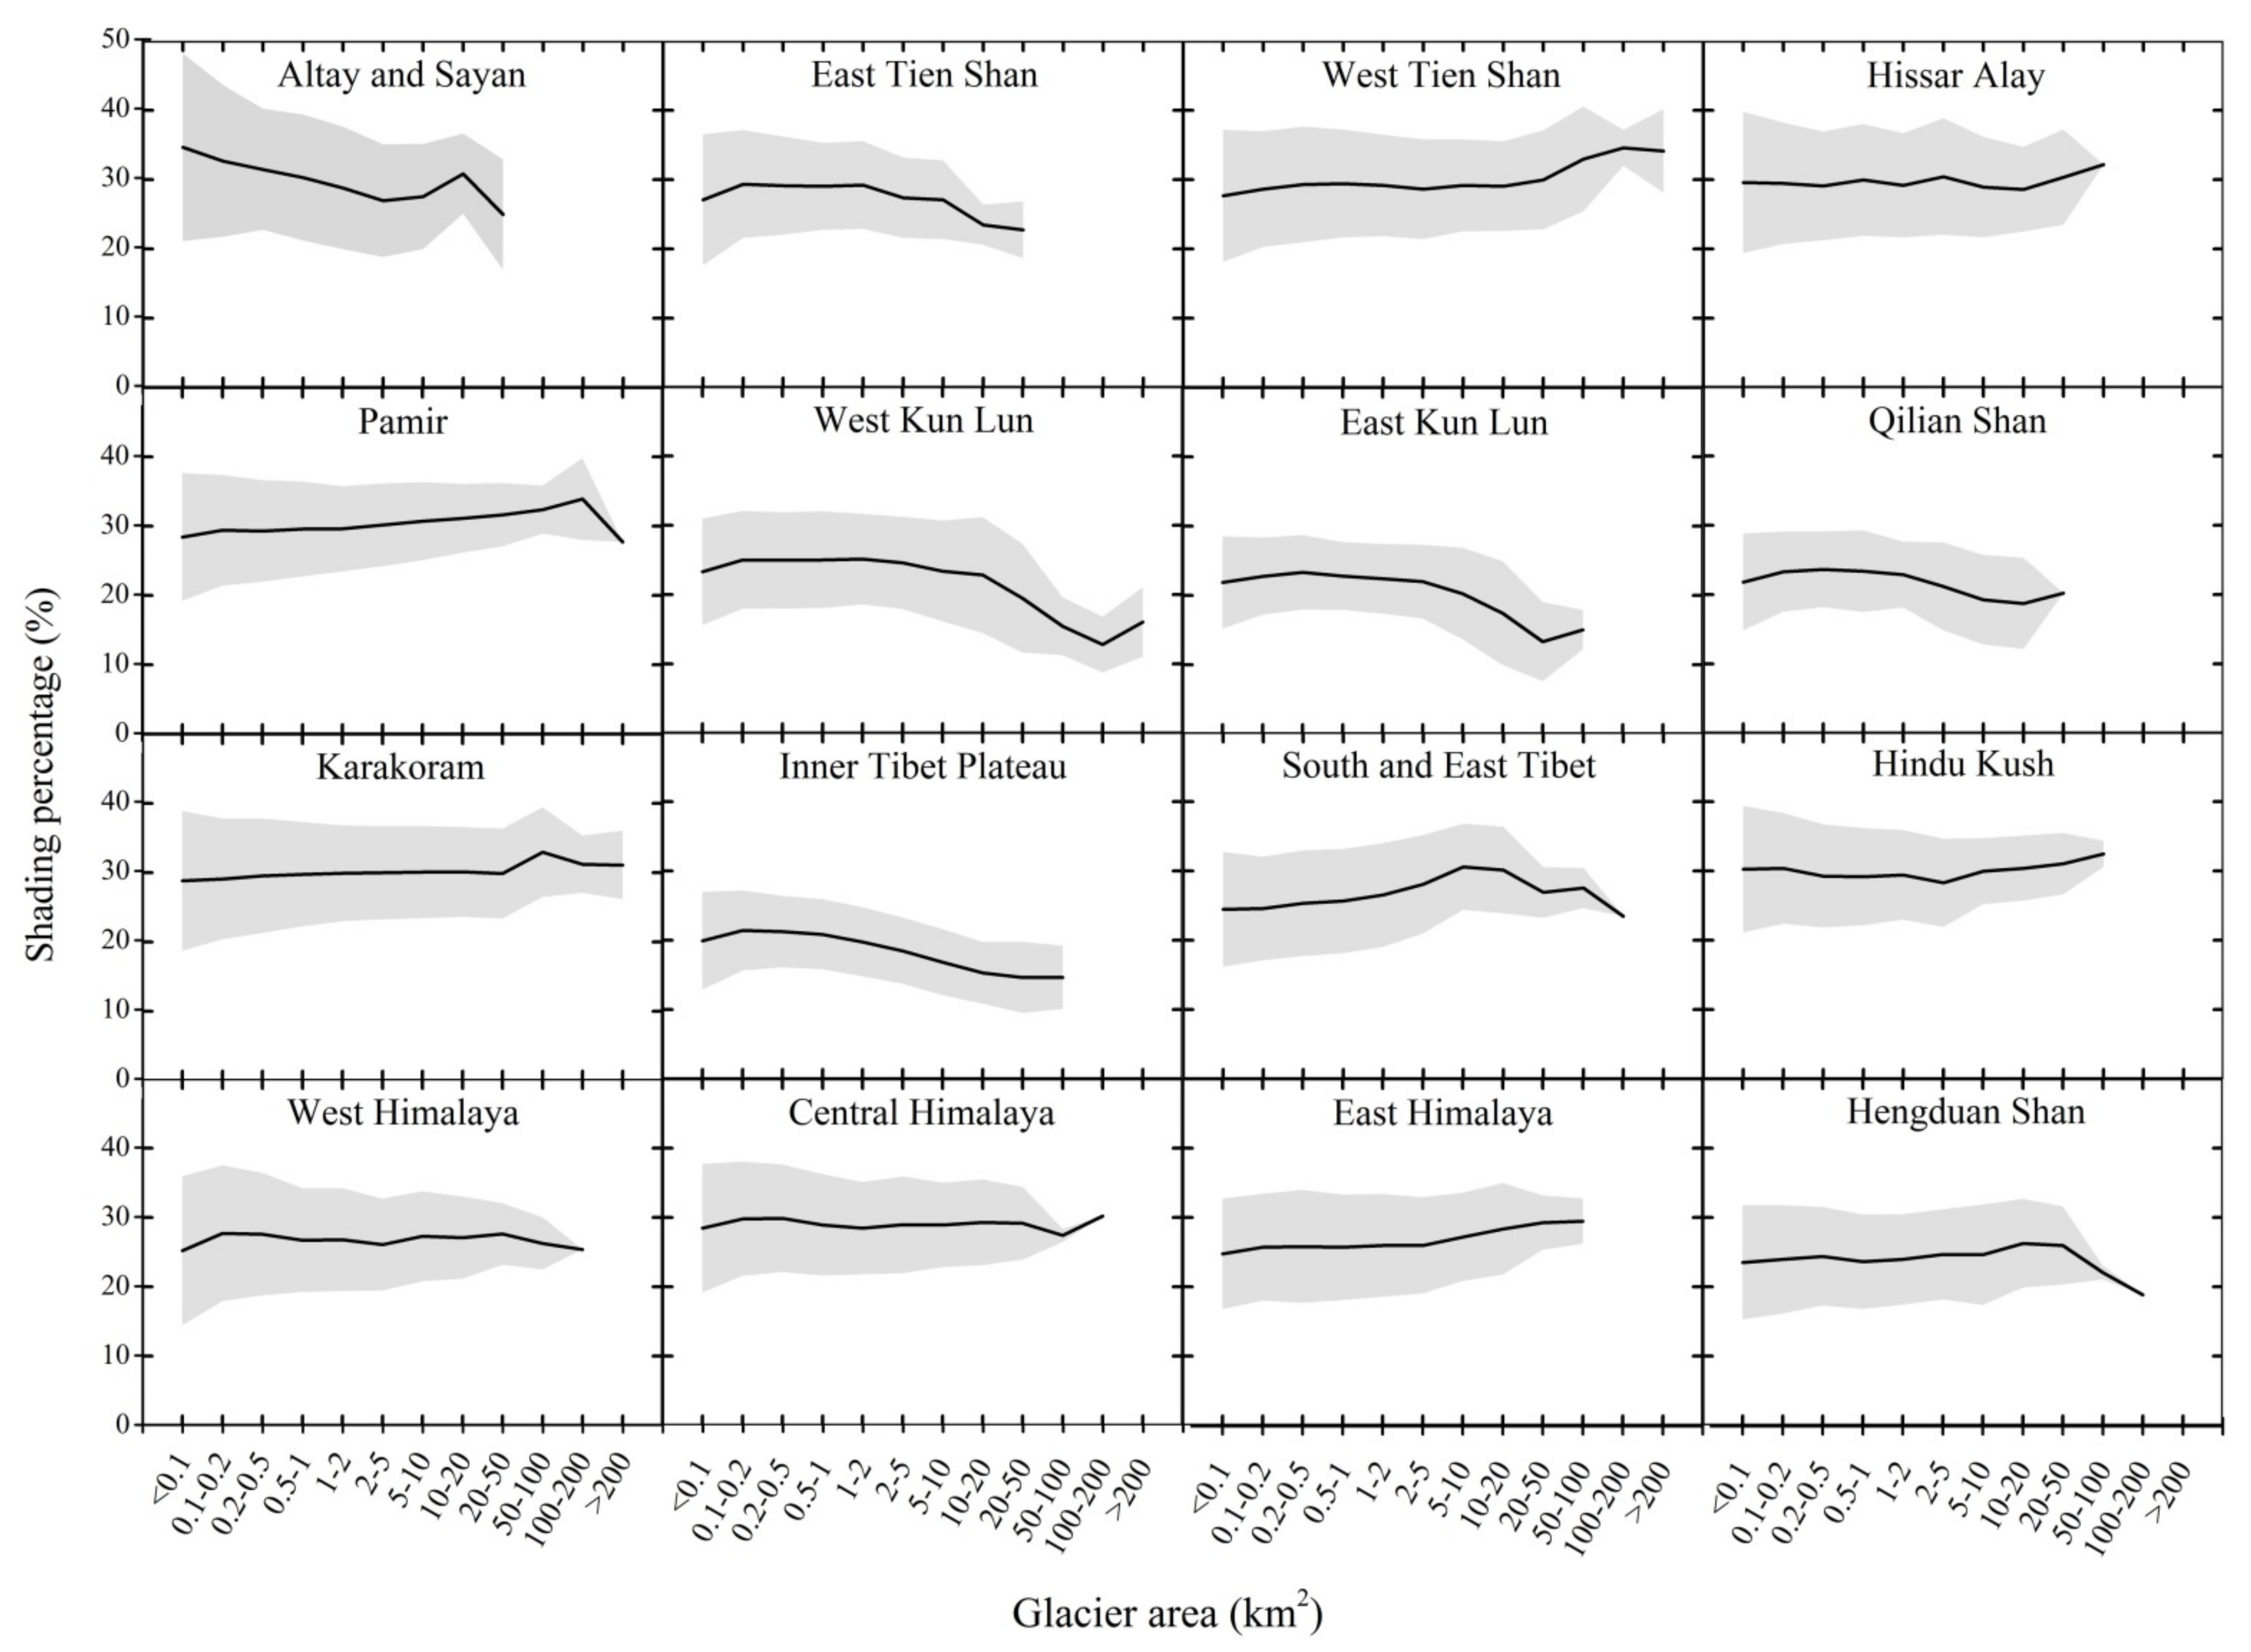
3.3. The Relationship between Glacier Area and Shading Area Percentage

Topographic shading protects glaciers from solar radiation. The strength of this protection changes with the glacier shape and area due to variations in the area covered by shading but is greatest for two cases: one in which the shading area percentage decreases with the decreasing glacier area (Figure 6), as commonly seen in most regions, such as glaciers in West Tianshan, Hindu Kush and the East Himalayas (Figure 7); the other pattern is that the shading area percentage increases with the decreasing glacier area, which is more commonly seen for glaciers in West Kunlun, East Kunlun, Qilian Shan and the Inner Tibet Plateau.
These two patterns of shading area are not related to the number of glaciers but are dependent on the glaciers’ orientations (Figure 8). Glaciers in West Kunlun, East Kunlun, Qilian Shan and the Inner Tibet Plateau tend to be distributed on the north-facing aspects, which is remarkably different from the other regional glacier distributions. Shading is more likely to protect small glaciers, because smaller glaciers tend to have a greater shading area percentage. We infer that this is because glaciers in areas with little shading are already absent, while those in well-shaded areas remain, entering a state of self-protection. In contrast, other regions (such as the Himalayas) still have extensive glaciers on south-facing slopes, even if the ablation and net mass loss are intense, as they receive abundant precipitation from the Indian and East Asian monsoons [7,18]. These south-facing glaciers will receive relatively less shading as their areas decrease, making them more susceptible to future retreat.

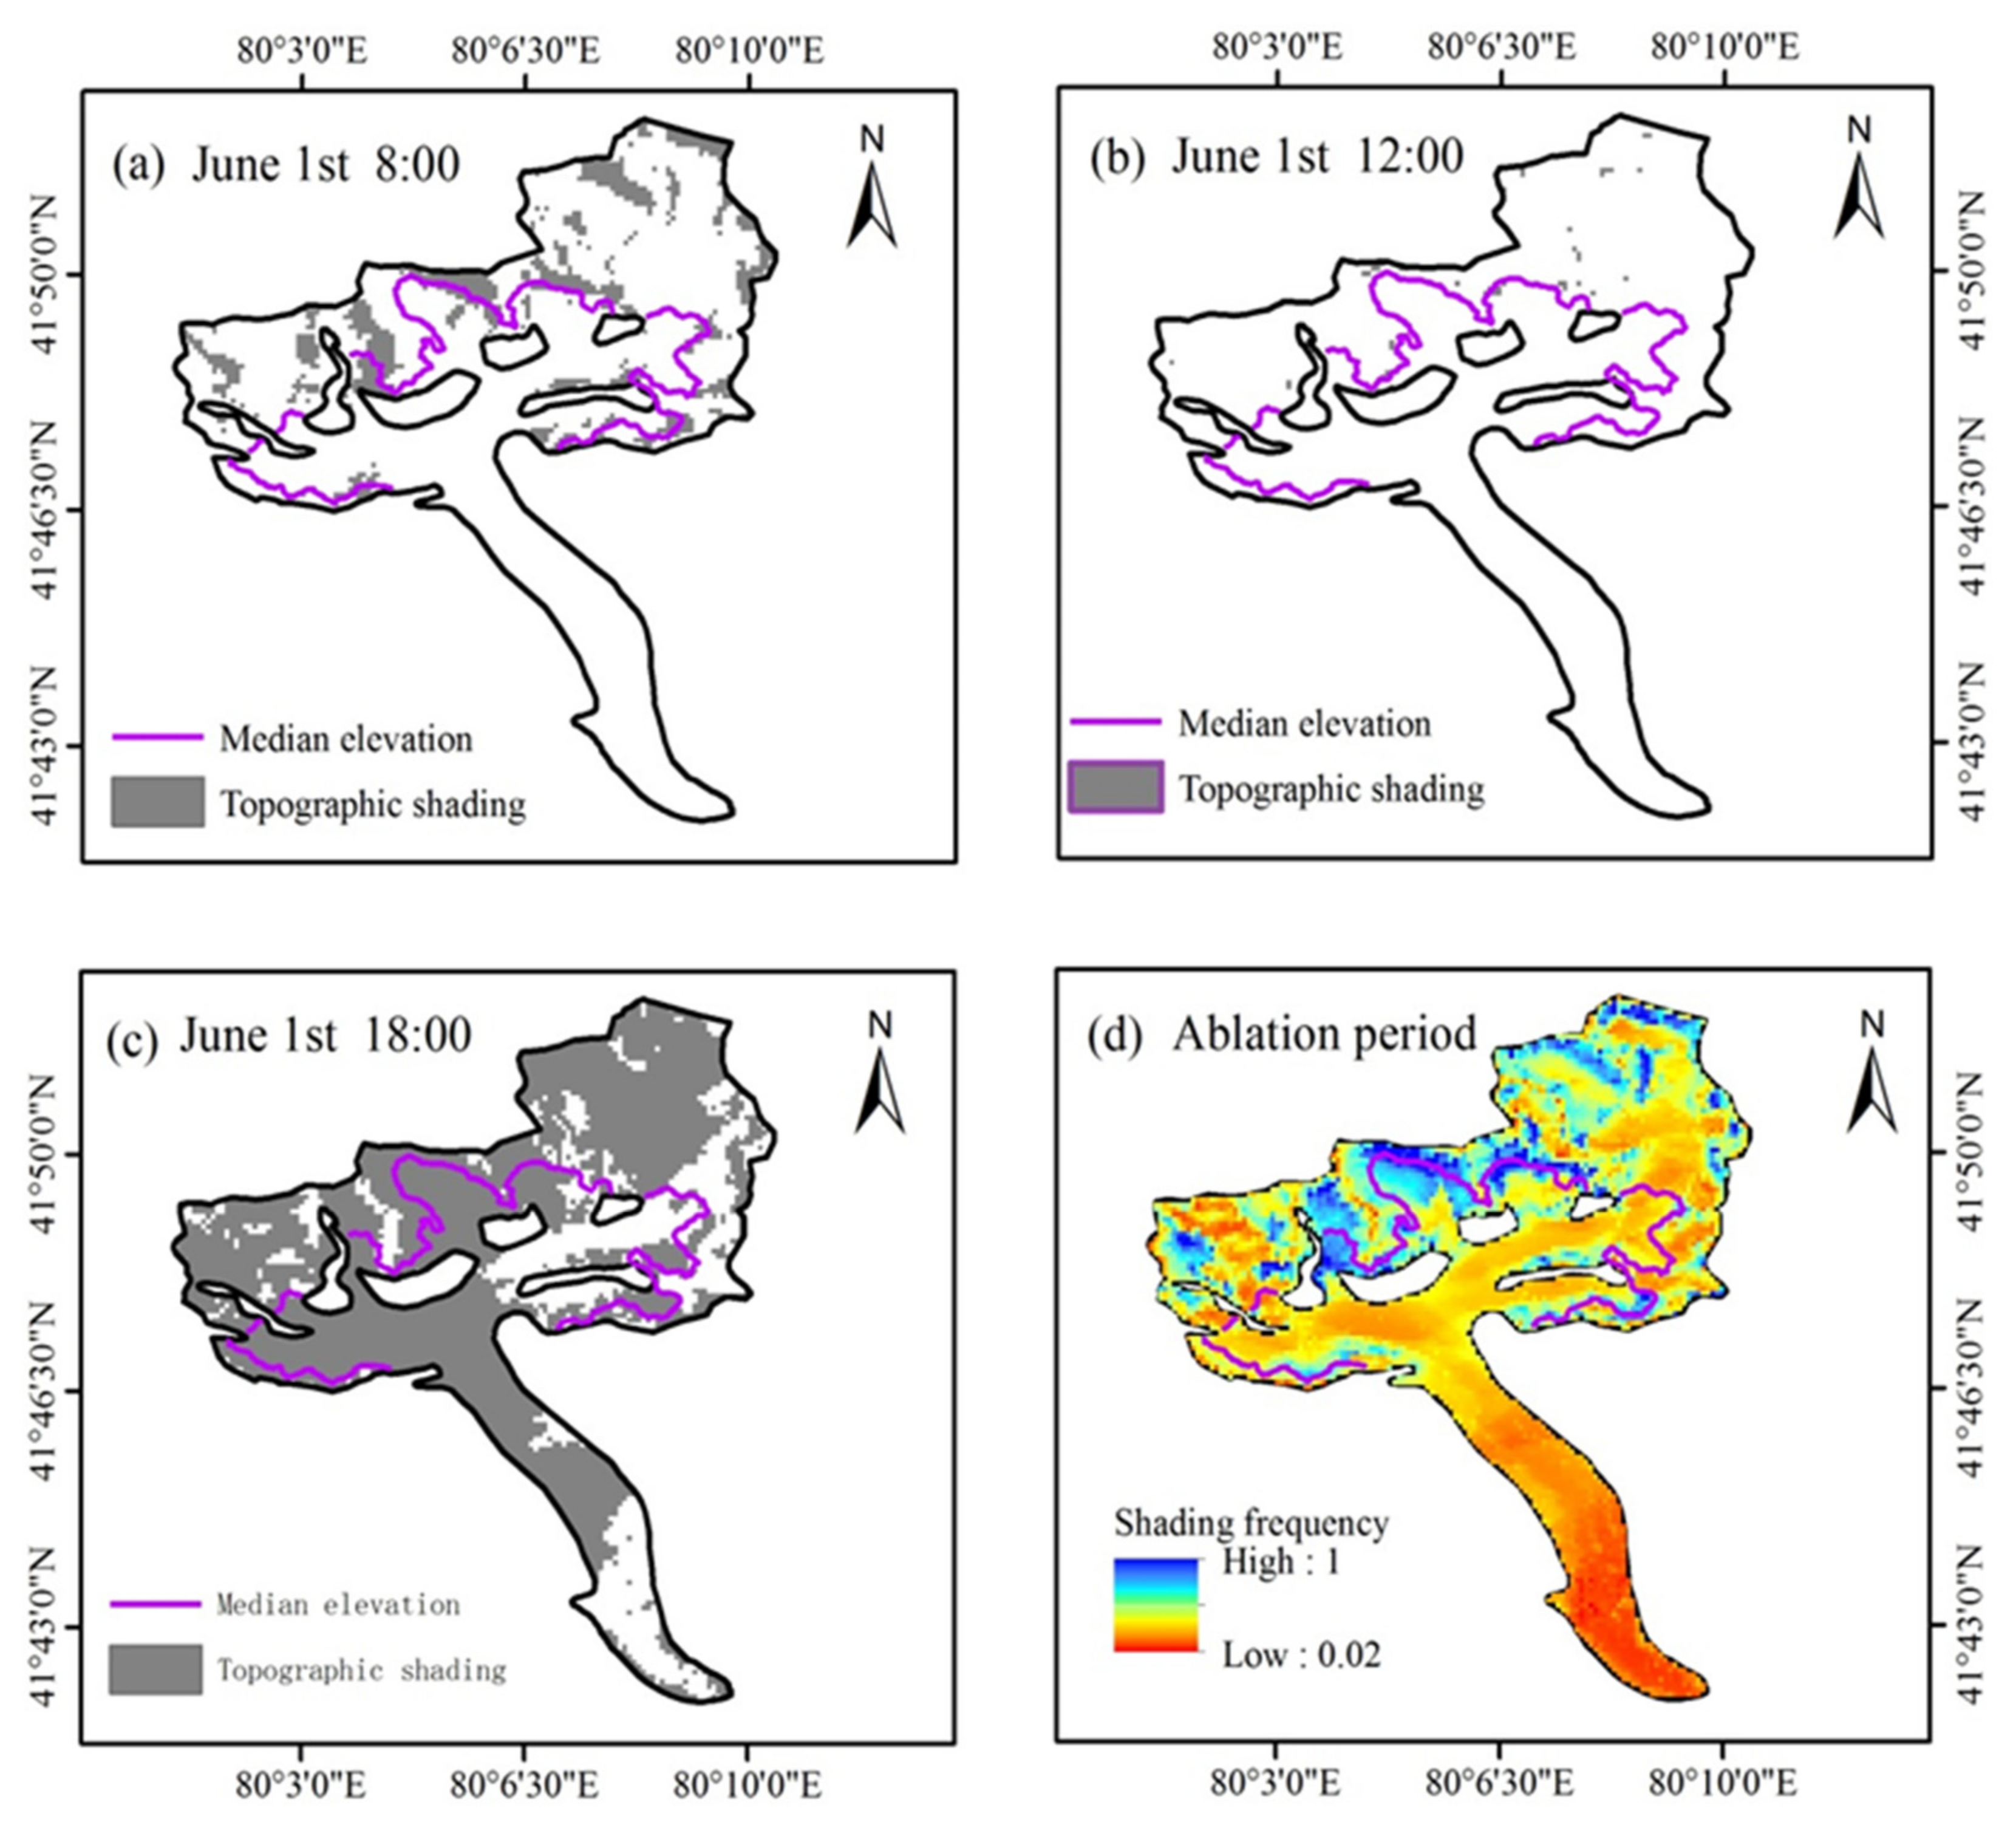
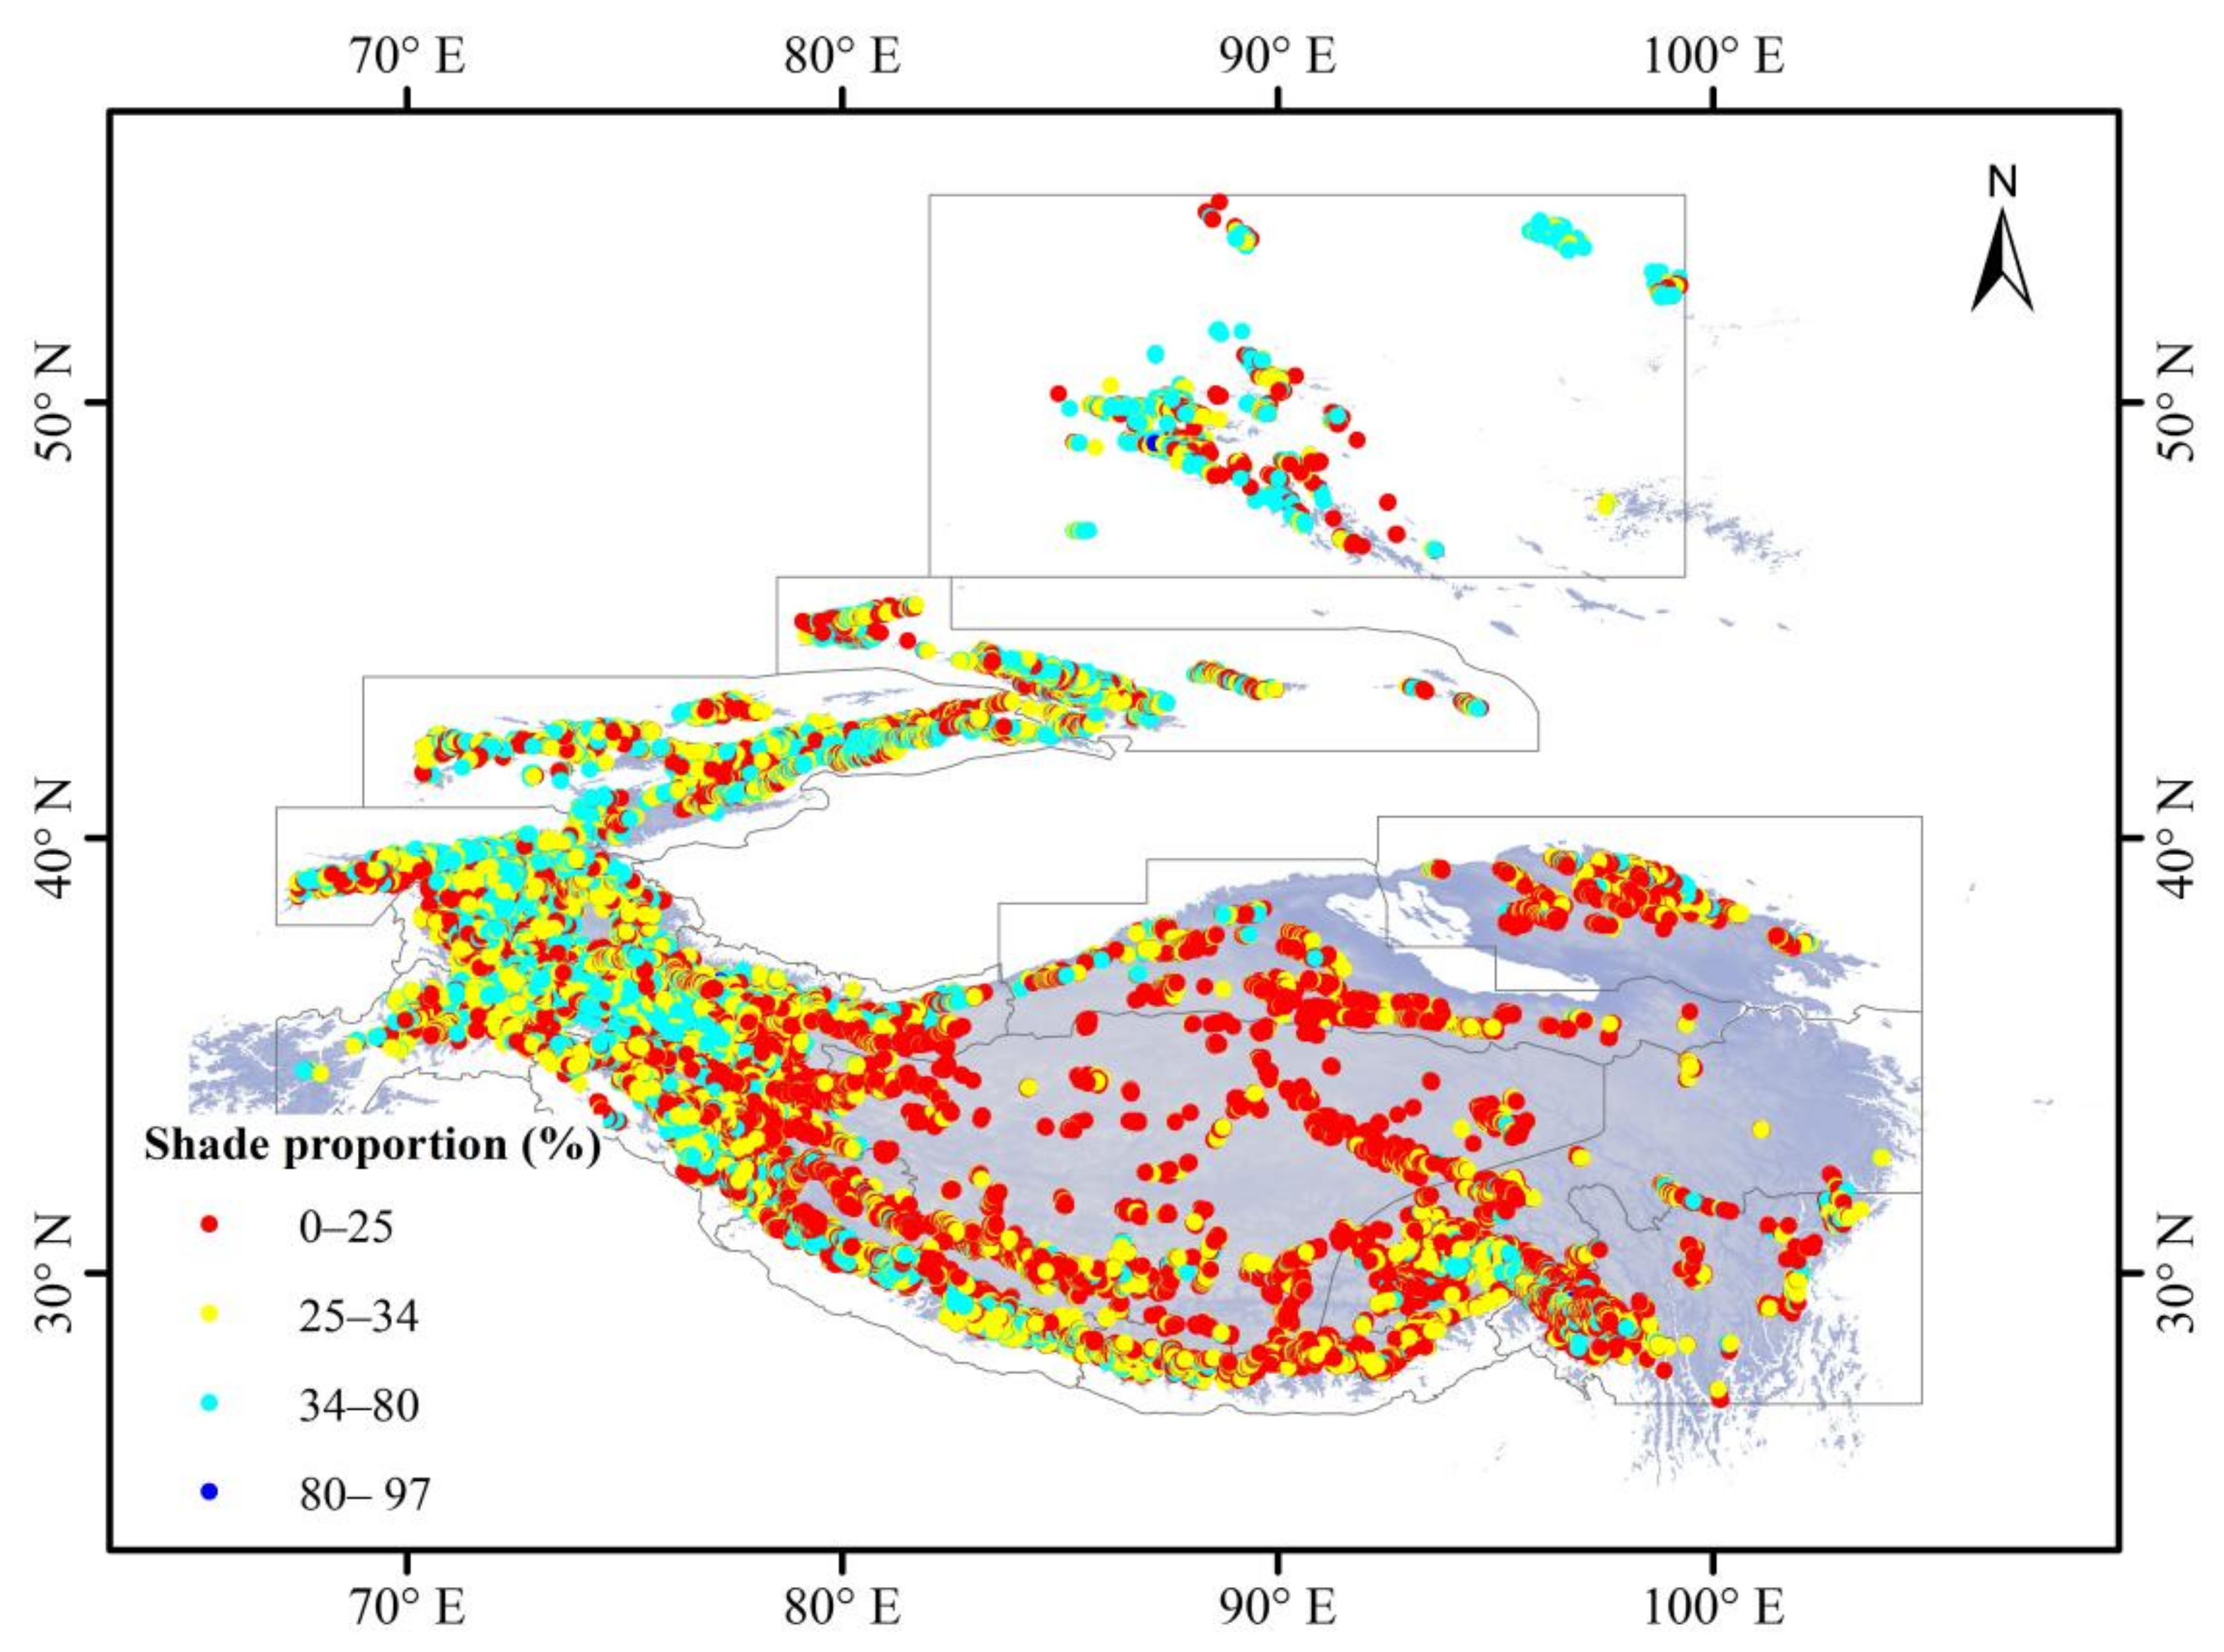
3.4. Glacier Shading Ratios Beneath the Median Elevation

The glaciers within HMA show significant mass losses, except for those in the Karakoram region [7]. Glacier melting mainly occurs in the ablation zone at low altitude but can be reduced if shading blocks the solar radiation. Therefore, shading at low altitudes has an important influence on glacier melting. To evaluate the shading area ratios at low altitude for each glacier, we calculated the shading area ratio (SAR) at elevations lower than the median elevation. The SAR refers to the ratios of shading area lower than the median elevation to glacier areas lower than the median elevation.
Our results found that the SAR values varied widely between glaciers across HMA, with these values ranging from 0 to 0.97 (Figure 9). Low values indicate glaciers with little shading area under the median elevation, while high values indicate that most of the ablation area of a given glacier is shaded. Over 50% of glaciers in HMA were found to have SAR values greater than 0.25 during the ablation period, with less than 50% of glaciers thus being found to have SAR values less than 0.25. For the glaciers with SAR values less than 0.25, the Inner Tibet Plateau glaciers accounted for 7.5%, while Altay and Sayan glaciers only accounted for 0.6%. Compared with the glaciers that recorded high SARs values greater than 0.25, these glaciers were distributed in Karakoram, Pamir, West Tianshan and the West Himalayas, accounting for 9.5%, 7.3%, 6.5% and 5.3%, respectively. Particularly for the glaciers in Karakoram, the shading area covered most of the glaciers in the low elevation zone, which provides protection from melting and contributes to their positive mass balance state. This supports the hypothesis that topographic factors might contribute to the currently stable regional mass balance of Karakoram glaciers [6]. Similarly, studies also found a positive mass balance for glaciers in Pamir [47,48], which is likely related to the shading area.
Few glaciers recorded high SAR values. For example, glaciers with SAR values greater than 0.34 accounted for 18% of all the glaciers in HMA, of which 3.7% were in Karakoram, 2.5% in Pamir and 2.2% in West Tianshan. This pattern supports the suggestion that the shading area is important for glacier melting in these regions. Glaciers in the Himalayas and Hengduan Shan were found to have an extremely negative mass balance, but less than 1% of the glaciers had SAR values greater than 0.34.

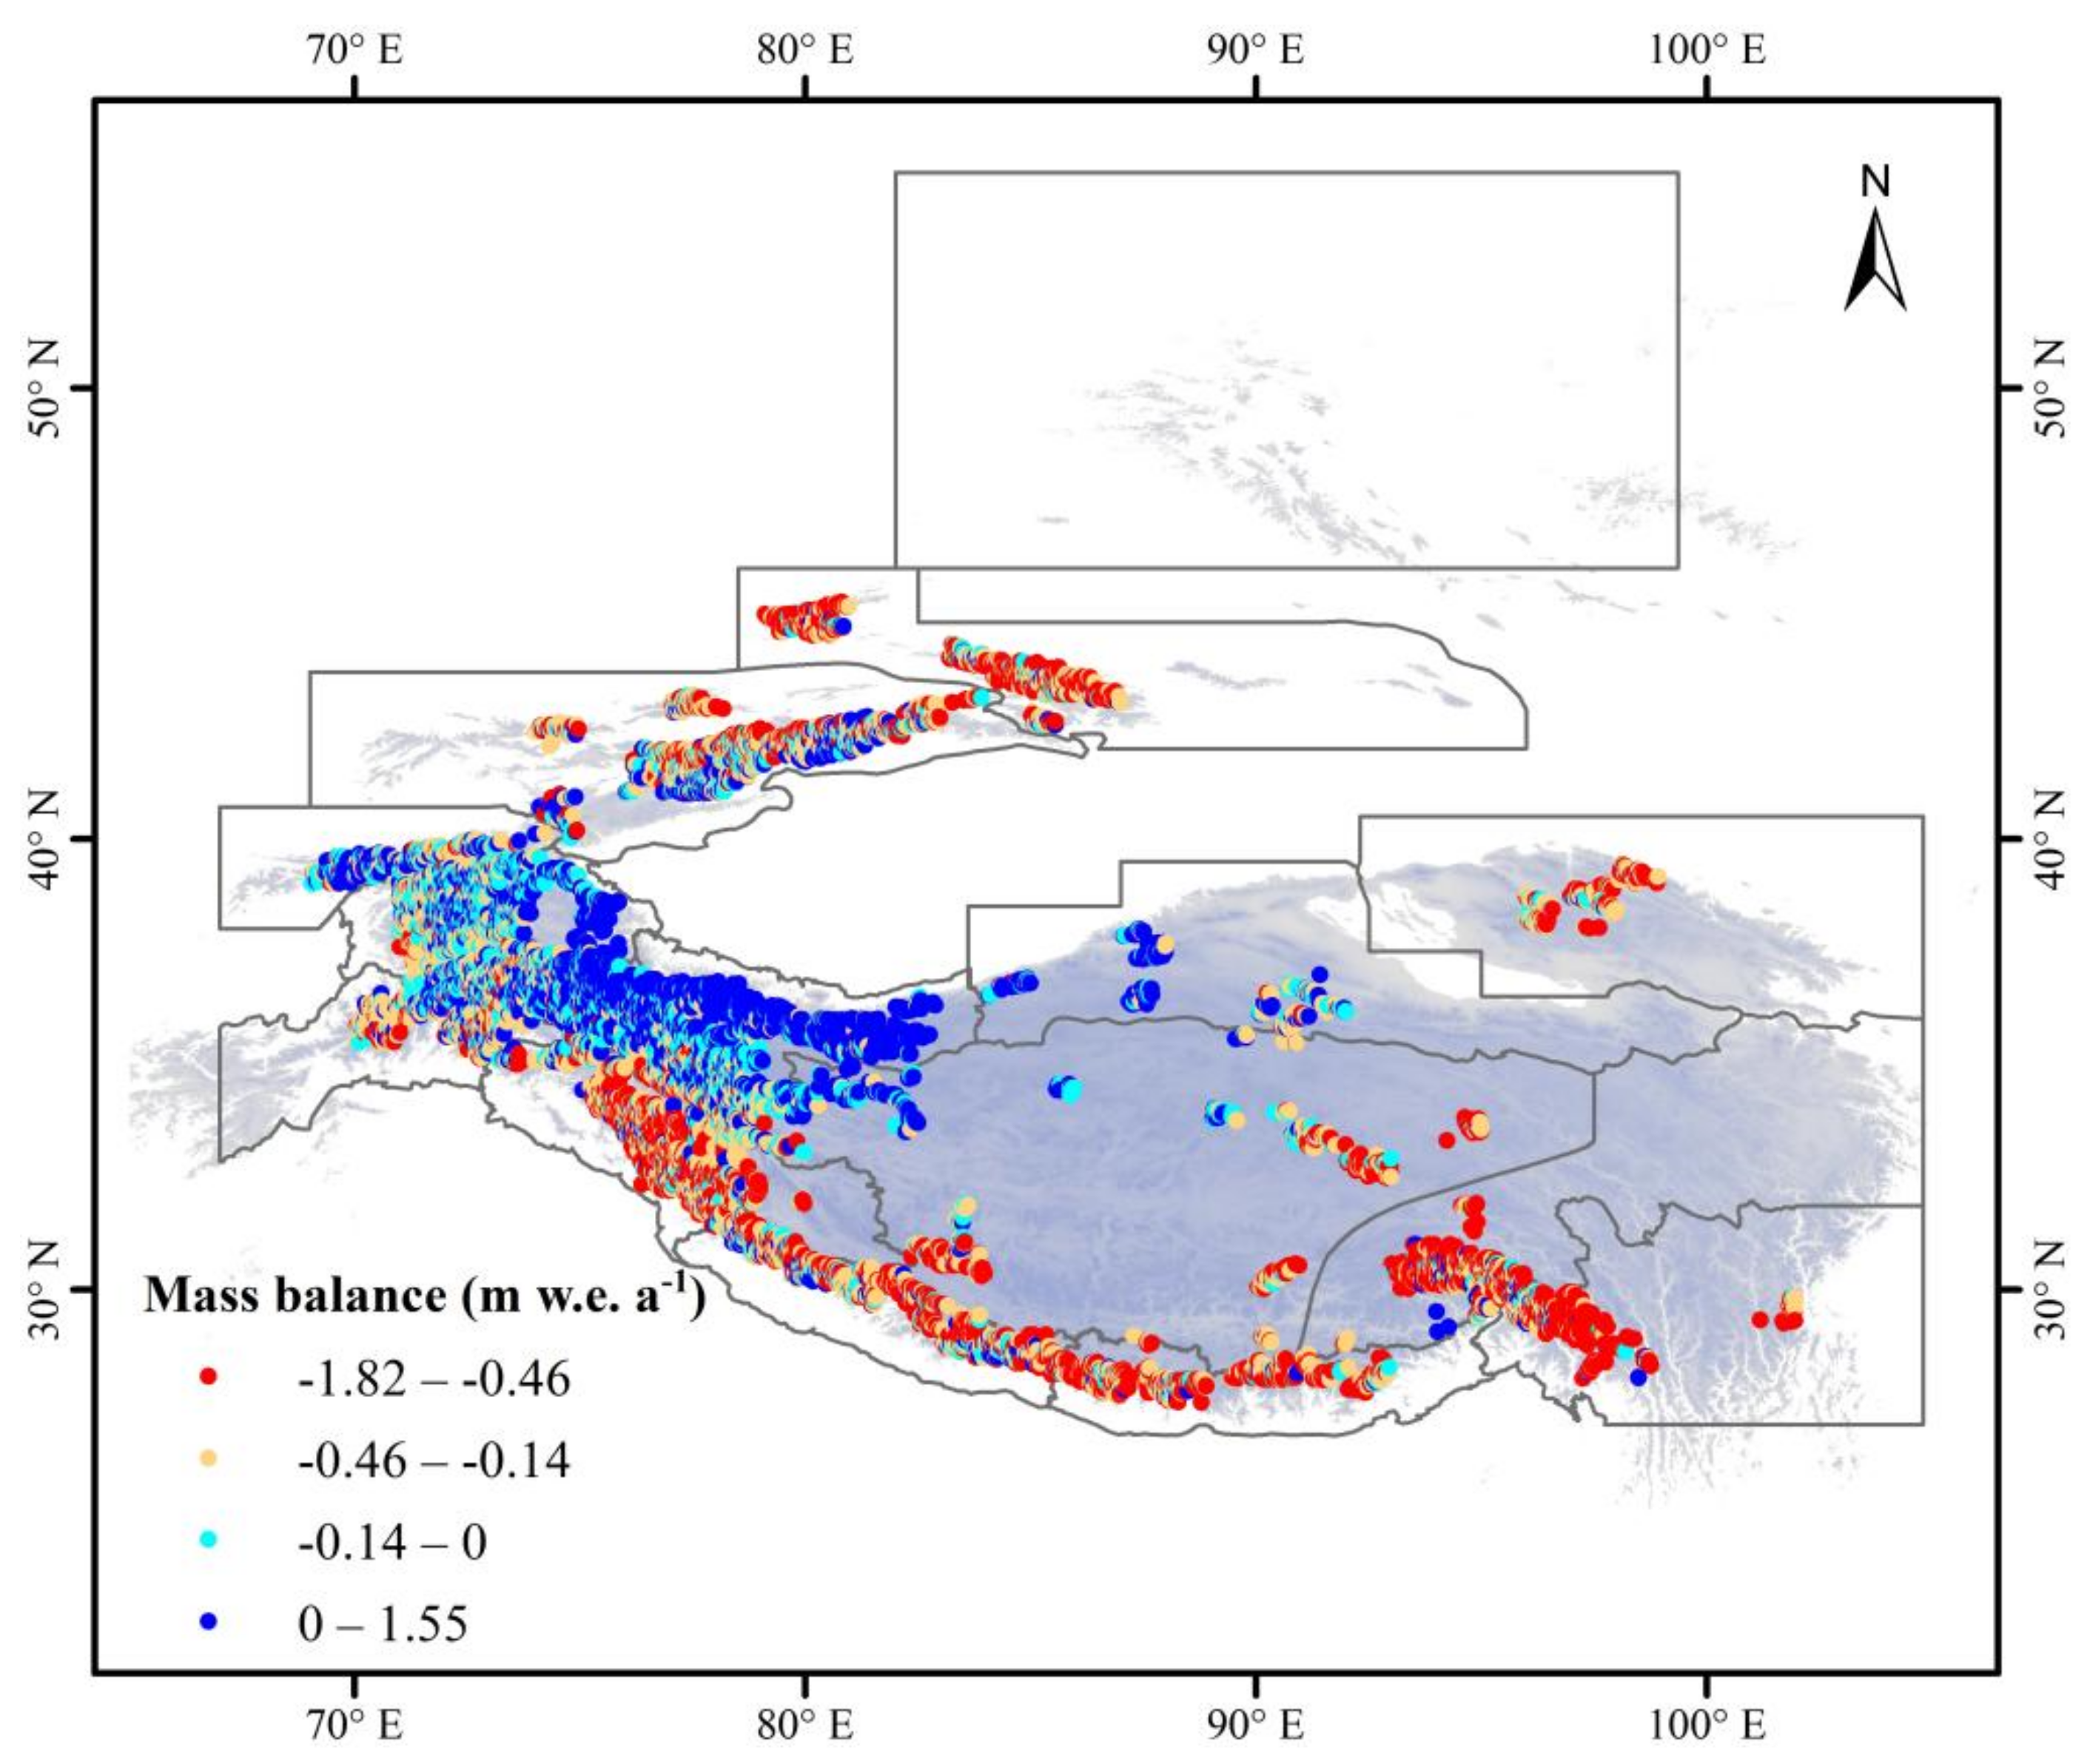
3.5. The Effect of Topographic Shading on the Glacier Mass Balance

Topographic shading protects glaciers from solar illumination and thus affects the glacier mass balance. Figure 10 shows the spatial distribution of the mass balance, topographic shading and DEM for one glacier (RGI60-14.07524). We found that both the mass balance and shading area frequency show broadly consistent spatial distribution, in which the lower shading frequency areas had a more negative mass balance and vice versa, except for the low-elevation ablation zone, where the influence of higher temperatures became stronger (Figure 10c). This indicates that the shading area frequency affects the spatial distribution of the mass balance.
To evaluate whether this relationship held for all the other glaciers, we searched for correlations between the mass balance and shading frequency for all glacier-covered grid points. We found that approximately 20% of the glaciers showed significant correlations (p < 0.05). However, the remaining 80% of the glaciers did not pass this significance test, perhaps because the mass balance is influenced by other climate factors, which masks the influence of the topography. The significant correlation between the spatial distribution of the mass balance and shading for 2000–2016 is shown in Figure 11. The mass balance heterogeneity was obvious for individual glaciers, ranging from −1.82 to 1.55 m w.e. The glaciers with the most positive mass balances appeared in West Tianshan, Pamir, West Kunlun and other regions, illustrating that topographic shading has a striking protective effect on these glaciers.
Table 3 summarizes how many regional glaciers had a mass balance that was significantly correlated with topographic shading, showing that most of these glaciers were located on the northern aspects, with relatively few being found on the southern aspects. The proportions of these glaciers on the eastern and western aspects varied from region to region. Overall, shading was mainly found to affect glaciers on the north-facing aspects.

4. Discussion

4.1. Factors Influencing Glacier Mass Balance

Among all the influencing factors, climate forcing is a major external control on the mass change of a glacier. The general patterns of mass balance within HMA follow atmospheric circulation patterns [8]. Recent studies have found that the Indian monsoon is weakening [49] and that the westerlies are strengthening [50], which can influence changes in precipitation patterns. The glacier responses to climate change have exhibited significant spatial heterogeneity in recent decades [10]. Temperature as a main indicator of climate change has accelerated glacial shrinkage within HMA [8]. These previous studies showed that climatic differences between low and high altitudes involve important issues relating to warming. An increasing warming trend at higher elevations has been observed within HMA, and the warming rate has been found to increase with the elevation before becoming quite stable, with a slight decline near the highest elevations observed [51,52]. Moreover, the mass balance is more sensitive to rises in the temperature, particularly for marine glaciers such as those located in the Himalayas and Hengduan Shan [20]. Increases in the precipitation cannot balance the glacier mass loss due to the increasing temperatures. Therefore, the glaciers are in a continuous state of mass loss [53]. This is the reason for the accelerating trend of mass loss.
Solar radiation is the dominant component in the surface energy balance, and it controls glacier ablation [54,55]. It accounts for 60–90% of the total energy budget for glaciers in HMA during the ablation period [17,56,57,58]. However, the spatial distribution of solar radiation is likely influenced by topographic shading and clouds, particularly for rugged terrains. The top-of-atmosphere shortwave radiation of Laohugou glacier No. 12 was reduced by ~30% on average owing to the effects of clouds and the atmosphere [59]. Topographic shading directly impacts solar radiation, altering the radiation intensity at the glacier surface by obstructing solar illumination. Our results confirm that the shading percentages are different for glaciers of different aspects. One of the major limitations of our work is the use of the significant correlation method to statistically analyze the relationship between mass balance and topographic shading, the deficiency of which being that the relationship between them cannot be quantified. To determine the strength of the impact, we resorted to a modeling approach through which we could accurately determine and quantify the impact of topographic shading on the mass balance for each glacier.
We did not consider the effect of debris on the mass balance when we carried out this significant correlation analysis. Debris-covered glaciers are common in the rugged Central Himalayas, but they are almost absent in the subdued landscapes of the TP, where the retreat rates are higher. In contrast, more than 50% of observed glaciers in the westerlies-influenced Karakoram region in the Northwestern Himalayas are advancing or stable [17,60]. The accelerating or retarding effect of debris cover on glacier melting depends on the debris thickness [15]. Debris exceeding a certain thickness will retard glacier melting [61]. Otherwise, it will accelerate glacier melting [62]. This could explain why these are the glaciers with the lowest correlation coefficients between mass balance and topographic shading. In addition, cloud cover and albedo also indirectly have an important impact on the glacier mass balance. Quantifying the impact of all factors on the glacier mass balance will be a key point of future research.

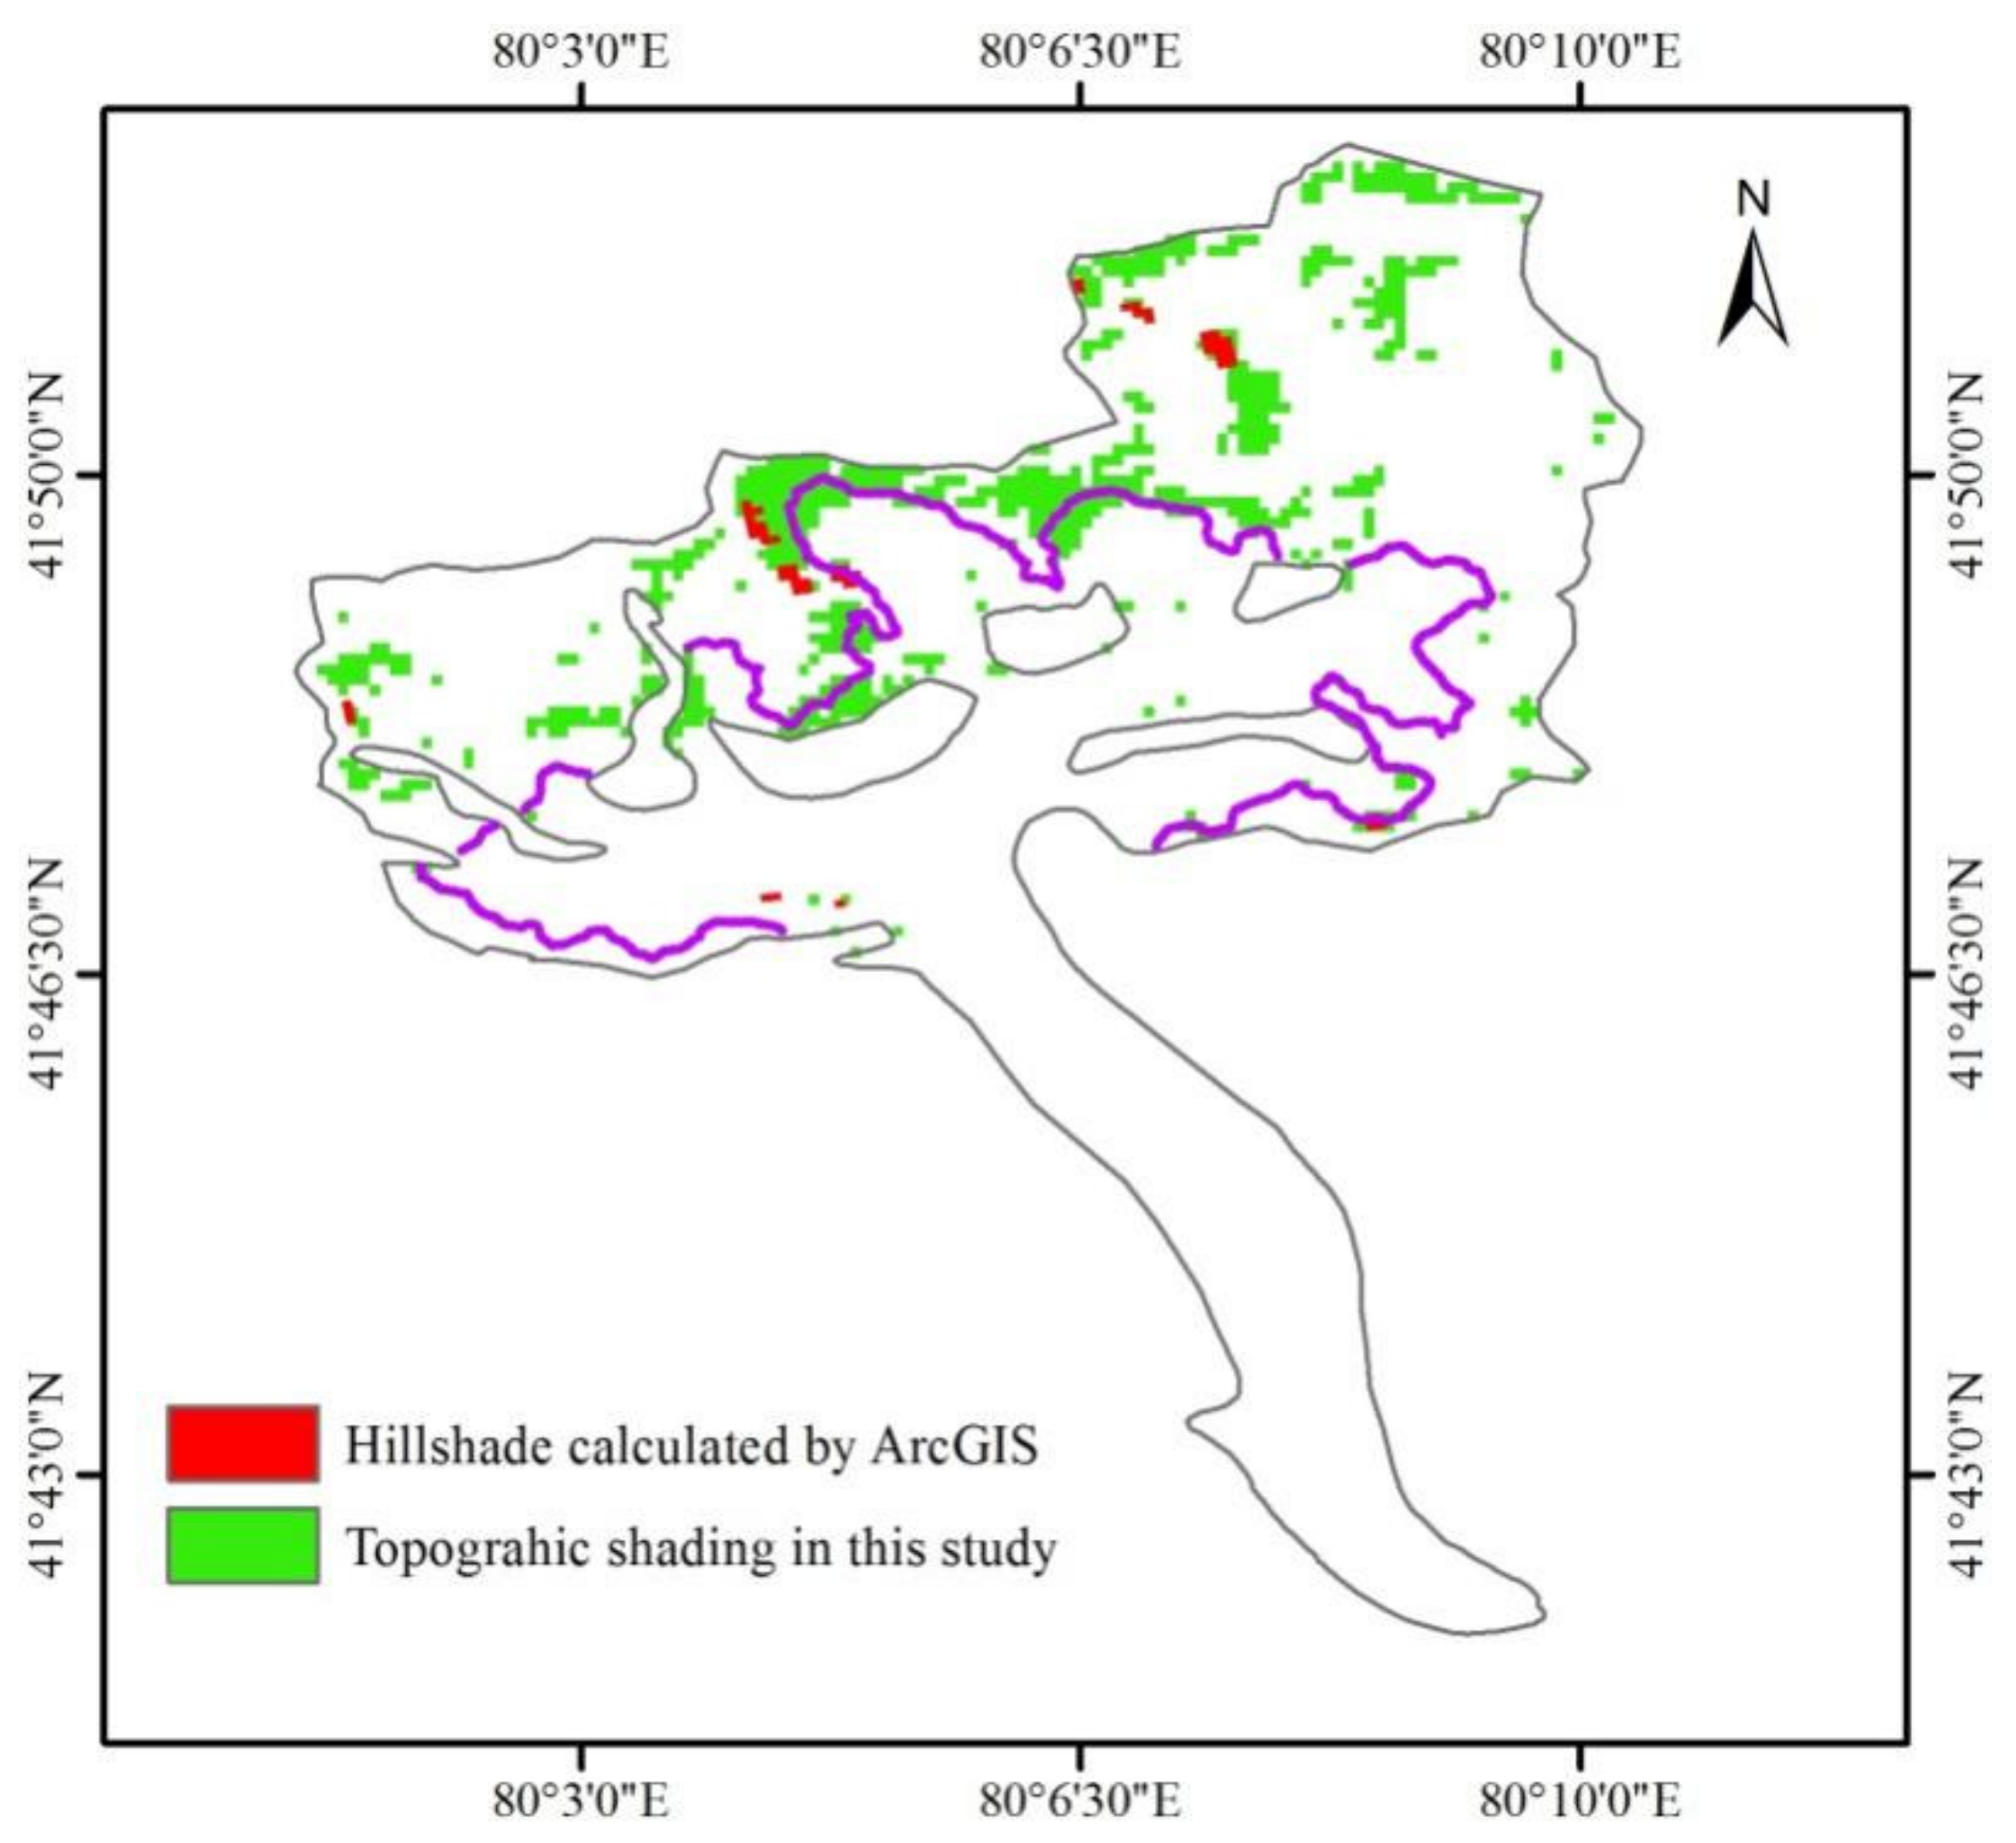
4.2. Comparison to Topographic Shading Estimates

Studies of topographic shading throughout HMA are quite scarce. There is also a lack of comparisons between previous results. Past studies have used topographic shading data to drive mass balance models for glaciers in Swedish Lapland [32], Switzerland [24] and elsewhere in the world [25,26,37]. The hill shading tool in ArcGIS can be used to calculate topographic shading [28,31]. Although the hill shading value of the center cell of a moving window can be calculated in relation to neighboring cells, this method only considers the influence of the local grid without considering high mountains at greater distances. To compare the ArcGIS results with our results, we calculated the hill shading used in ArcGIS, setting the solar azimuth to 225° and the solar altitude angle to 55°. We also calculated the topographic shading with the same azimuth and altitude parameters as those used in the ArcGis calculations. We found that the topographic shading area calculated in ArcGis was far smaller than that calculated by our method under the same conditions (Figure 12). Mountain glaciers (such as the Koxkar glacier) in HMA are distributed in the mountain valley. The surrounding high mountains obscure solar illumination, leading to high proportions of shading on the region’s glaciers. Since the ArcGIS calculations ignored this distant mountain influence, there remains great uncertainty in its results. However, we considered this distant mountain influence by tracing the solar rays for a distance of 50 km to more accurately determine whether the glacier surface was shaded. This approach considerably improved the shading area calculation accuracy.

4.3. Uncertainty in Topographic Shading and Mass Balance Data

This study used topography data extracted from SRTM DEM version 4 with a spatial resolution of 90 m [42], which was the basis for the topographic shading calculations. However, when clipping the raster data (such as DEM) using the glacier vector boundaries, both of the nonoverlapping boundaries will inevitably cause differences in the area. According to the glacier inventories used, the area uncertainty for each glacier was assumed to be 3.2–10% [40,63]. All these factors contributed to the uncertainty in our results. Although the uncertainties would decrease if the resolution improved, this approach would increase the computational costs. Consequently, studies of glacier thickness estimates use DEMs with a low resolution, typically 100 m or more for larger glaciers [2], especially when considering all HMA glaciers or the global scale. In addition, the DEM data represent the average elevation within the 90-m grid, which does not reflect the sub-grid scale topographic features. The real topography may obscure the sun’s radiation, even if the average DEM grid elevation used to calculate the topographic shading is lower than the solar altitude angle. This could particularly influence the results in rugged terrain.
The topographic shading in this study focused on the ablation period and was calculated without considering the specific year. Although the annual topographic shading changes over long time scales, such changes are extremely slow, as they are related to the varying distances from the Earth to the Sun caused by the variations in the Earth’s orbit (orbit scale: 10–100 kyr) [64]. Consequently, the orbital influences on topographic shading were ignored. Our results are valid for energy balance studies over long time periods, but it is worth noting that the glacier inventories used in this study were based on data for 1999–2010 [40,41]. Topographic shading is closely related to the inventory data, because glaciers are in a state of change (e.g., due to temperature change), which alters the shading area of each glacier.
Alternative mass balance data resources are also subject to uncertainty with regards to their data quality. Individual mass balance data have a relatively high level of uncertainty, with a median uncertainty of 0.22 m w.e./a having been recorded (in the range from 0.14 to 0.89 m w.e./a); This depended on the glacier area, on the proportion of the glacier surface surveyed and the number of DEMs available to extract a reliable rate of elevation change [19]. The median uncertainty was slightly higher than the root mean square error of 0.17 m w.e./a found when comparing the ASTER mass balance with higher-resolution geodetic mass balances for 60 glaciers [7].

5. Conclusions

Our goal was to provide a systematic estimate of the relationship between mass balance and topographic shading across HMA. To achieve this, we used the glacier outlines and raster data (DEM, slope and aspect) to systematically estimate for topographic shading across HMA. We found a clear correlation between mass balance and topographic shading, which was most obvious for glaciers of the north-facing aspects. The main conclusions are as follows:
Overall, 27.19% of the HMA glacier area was found to be affected by topographic shading. The north, east, south and west aspects accounted for 10.97%, 6.72%, 4.36% and 4.31% of this total shading, respectively. The differences in the topographic shading area were apparent between each region, and the regional distribution of the shading area fraction varied from 17.76% to 30.43% during the ablation period. Glaciers with the greatest shading percentages were found to be distributed in the Karakoram, Pamir and West Tianshan, recording shading area percentages of 30.43%, 30.35% and 30.20%, respectively. Moreover, regional differences were found to exist in the altitudinal distribution and the SAR below the median elevation. The glacier shading areas under the median elevation in the Karakoram, Pamir, West Tianshan and West Himalayas were found to be mainly distributed at low elevations, which accounted for 9.5%, 7.3%, 6.5% and 5.3% of the total HMA glacier area. This was especially true for the glaciers in Karakoram, where shading was found to cover most glaciers in the low-elevation zone, thus protecting them from radiative melting and contributing to their positive mass balance state.
Topographic shading was found to contribute to the protection of the smallest glaciers from solar illumination. These small glaciers are located on the north-facing aspects, especially in West Kunlun, East Kunlun, the Inner Tibet Plateau and Qilian Shan, where the shading area percentages increased with the decreasing glacier area. In contrast, in other regions such as the Himalayas, glaciers on the south-facing aspects maintained a large glacier area, but the shading percentages decreased as the glacier area decreased. These glaciers are at risk of disappearing in the future.
Approximately 20% of the glaciers with mass balance data showed a significant correlation between topographic shading and mass balance, passing the significance test at p < 0.05. These glaciers are mainly located at the northern aspect, indicating that complex terrain can affect the spatial distribution of the mass balance by altering the solar illumination pattern.

Author Contributions

Y.D. and R.W. designed the project; R.W. and W.G. calculated the topographic shading and the analysis; R.W., D.S. and Q.Z. analyzed the results and wrote the initial version of the paper; Y.L. and M.S. contributed to the discussions and improvements of the paper. All authors have read and agreed to the published version of the manuscript.

Funding

This research was funded by the Strategic Priority Research Program of the Chinese Academy of Sciences (Grant No. XDA19070501); the National Natural Science Foundation of China (grants no. 42001068 and 41871055); Open Foundation of State Key Laboratory of Cryospheric Science (SKLCS-OP-2020-4); the Key Research Program of Frontier Sciences, CAS (KFZD-SW-428); the Light of West China Program of CAS, and a joint grant from the Chinese Academy of Sciences—People’s Government of Qinghai Province on Sanjiangyuan National Park (LHZX-2020-10).

Data Availability Statement

The glacier outlines within HMA are available at https://www.glims.org/RGI/rgi60_dl.html (accessed on 1 February 2022). SRTM DEM version 4 are available at https://www.gscloud.cn/ (accessed on 1 February 2022). ASTER mass balance data are available at https://doi.pangaea.de/10.1594/PANGAEA.876545 (accessed on 1 February 2022).

Conflicts of Interest

The authors declare no conflict of interest.

References

  1. Immerzeel, W.W.; Bierkens, M.F.P. Asia’s water balance. Nat. Geosci. 2012, 5, 841–842. [Google Scholar]
  2. Farinotti, D.; Huss, M.; Fürst, J.J.; Landmann, J.M.; Machguth, H.; Maussion, F.; Pandit, A. A consensus estimate for the ice thickness distribution of all glaciers on Earth. Nat. Geosci. 2019, 12, 168–173. [Google Scholar] [CrossRef] [Green Version]
  3. Immerzeel, W.W.; Lutz, A.F.; Andrade, M.; Bahl, A.; Biemans, H.; Bolch, T.; Hyde, S.; Brumby, S.; Davies, B.J.; Elmore, A.C.; et al. Importance and vulnerability of the world’s water towers. Nature 2020, 577, 364–369. [Google Scholar] [CrossRef]
  4. Pritchard, H.D. Asia’s shrinking glaciers protect large populations from drought stress. Nature 2019, 569, 649–654. [Google Scholar] [CrossRef] [PubMed]
  5. Biemans, H.; Siderius, C.; Lutz, A.F.; Nepal, S.; Ahmad, B.; Hassan, T.; Von Bloh, W.; Wijngaard, R.R.; Wester, P.; Shrestha, A.B.; et al. Importance of snow and glacier meltwater for agriculture on the Indo-Gangetic Plain. Nat. Sustain. 2019, 2, 594–601. [Google Scholar] [CrossRef]
  6. Miles, E.; McCarthy, M.; Dehecq, A.; Kneib, M.; Fugger, S.; Pellicciotti, F. Health and sustainability of glaciers in High Mountain Asia. Nat. Commun. 2021, 12, 2868. [Google Scholar] [CrossRef]
  7. Brun, F.; Berthier, E.; Wagnon, P.; Kääb, A.; Treichler, D. A spatially resolved estimate of High Mountain Asia glacier mass balances from 2000 to 2016. Nat. Geosci. 2017, 10, 668–673. [Google Scholar]
  8. Yao, T.D.; Thompson, L.; Yang, W.; Yu, W.S.; Gao, Y.; Guo, X.J.; Yang, X.X.; Duan, K.Q.; Zhao, H.B.; Xu, B.Q.; et al. Different glacier status with atmospheric circulations in Tibetan Plateau and surroundings. Nat. Clim. Chang. 2012, 2, 663–667. [Google Scholar] [CrossRef]
  9. Gardner, A.S.; Moholdt, G.; Cogley, J.G.; Wouters, B.; Arendt, A.A.; Wahr, J.; Berthier, E.; Hock, R.; Pfeffer, W.T.; Kaser, G.; et al. A Reconciled Estimate of Glacier Contributions to Sea Level Rise: 2003 to 2009. Science 2013, 340, 852–857. [Google Scholar] [CrossRef] [Green Version]
  10. Bhattacharya, A.; Bolch, T.; Mukherjee, K.; King, O.; Menounos, B.; Kapitsa, V.; Neckel, N.; Yang, W.; Yao, T. High Mountain Asian glacier response to climate revealed by multi-temporal satellite observations since the 1960s. Nat. Commun. 2021, 12, 4133. [Google Scholar] [CrossRef]
  11. Farinotti, D.; Longuevergne, L.; Moholdt, G.; Duethmann, D.; Mölg, T.; Bolch, T.; Vorogushyn, S.; Güntner, A. Substantial glacier mass loss in the Tien Shan over the past 50 years. Nat. Geosci. 2015, 8, 716–722. [Google Scholar] [CrossRef]
  12. Shean, D.E.; Bhushan, S.; Montesano, P.; Rounce, D.R.; Arendt, A.; Osmanoglu, B. A systematic, regional assessment of High-Mountain Asia glacier mass balance. Front. Earth Sci. 2019, 7, 363. [Google Scholar]
  13. Farinotti, D.; Immerzeel, W.W.; De Kok, R.J.; Quincey, D.J.; Dehecq, A. Manifestations and mechanisms of the Karakoram glacier Anomaly. Nat. Geosci. 2020, 13, 8–16. [Google Scholar] [CrossRef] [PubMed]
  14. Dehecq, A.; Gourmelen, N.; Gardner, A.S.; Brun, F.; Goldberg, D.; Nienow, P.W.; Berthier, E.; Vincent, C.; Wagnon, P.; Trouvé, E. Twenty-first century glacier slowdown driven by mass loss in High Mountain Asia. Nat. Geosci. 2019, 12, 22–27. [Google Scholar] [CrossRef]
  15. Kraaijenbrink, P.; Bierkens, M.F.; Lutz, A.; Immerzeel, W. Impact of a global temperature rise of 1.5 degrees Celsius on Asia’s glaciers. Nature 2017, 549, 257–260. [Google Scholar] [CrossRef]
  16. Kapnick, S.; Delworth, T.; Ashfaq, M.; Malyshev, S.; Milly, P.C.D. Snowfall less sensitive to warming in Karakoram than in Himalayas due to a unique seasonal cycle. Nat. Geosci. 2014, 7, 834–840. [Google Scholar] [CrossRef]
  17. Scherler, D.; Bookhagen, B.; Strecker, M.R. Spatially variable response of Himalayan glaciers to climate change affected by debris cover. Nat. Geosci. 2011, 4, 156–159. [Google Scholar] [CrossRef]
  18. Bolch, T.; Kulkarni, A.; Kääb, A.; Huggel, C.; Paul, F.; Cogley, J.G.; Frey, H.; Kargel, J.S.; Fujita, K.; Scheel, M.; et al. The State and Fate of Himalayan Glaciers. Science 2012, 336, 310–314. [Google Scholar] [CrossRef] [Green Version]
  19. Brun, F.; Wagnon, P.; Berthier, E.; Jomelli, V.; Maharjan, S.B.; Shrestha, F.; Kraaijenbrink, P. Heterogeneous Influence of Glacier Morphology on the Mass Balance Variability in High Mountain Asia. J. Geophys. Res. Earth Surf. 2019, 124, 1331–1345. [Google Scholar] [CrossRef]
  20. Wang, R.; Liu, S.; Shangguan, D.; Radić, V.; Zhang, Y. Spatial Heterogeneity in Glacier Mass-Balance Sensitivity across High Mountain Asia. Water 2019, 11, 776. [Google Scholar] [CrossRef] [Green Version]
  21. Sakai, A.; Fujita, K. Contrasting glacier responses to recent climate change in high-mountain Asia. Sci. Rep. 2017, 7, 13717. [Google Scholar] [CrossRef] [PubMed]
  22. Shangguan, D.; Liu, S.; Ding, Y.; Li, J.; Zhang, Y.; Ding, L.; Wang, X.; Xie, C.; Li, G. Glacier changes in the west Kunlun Shan from 1970 to 2001 derived from Landsat TM/ETM+ and Chinese glacier inventory data. Ann. Glaciol. 2007, 46, 204–208. [Google Scholar] [CrossRef] [Green Version]
  23. Mölg, T.; Maussion, F.; Yang, W.; Scherer, D. The footprint of Asian monsoon dynamics in the mass and energy balance of a Tibetan glacier. Cryosphere 2012, 6, 1445–1461. [Google Scholar] [CrossRef] [Green Version]
  24. Arnold, N.S.; Willis, I.C.; Sharp, M.J.; Richards, K.S.; Lawson, W.J. A distributed surface energy-balance model for a small valley glacier. I. Development and testing for Haut Glacier d’Arolla, Valais, Switzerland. J. Glaciol. 1996, 42, 77–89. [Google Scholar]
  25. Hock, R.; Holmgren, B. A distributed surface energy-balance model for complex topography and its application to Storglaciren, Sweden. J. Glaciol. 2005, 51, 25–36. [Google Scholar]
  26. Anslow, F.S.; Hostetler, S.; Bidlake, W.R.; Clark, P.U. Distributed energy balance modeling of South Cascade Glacier, Washington and assessment of model uncertainty. J. Geophys. Res. Earth Surf. 2008, 113, F0201. [Google Scholar] [CrossRef] [Green Version]
  27. Jiang, X.; Wang, N.; He, J.; Wu, X.; Song, G. A distributed surface energy and mass balance model and its application to a mountain glacier in China. Chin. Sci. Bull. 2010, 55, 2079–2087. [Google Scholar] [CrossRef]
  28. DeBeer, C.M.; Sharp, M.J. Topographic influences on recent changes of very small glaciers in the Monashee Mountains, British Columbia, Canada. J. Glaciol. 2009, 55, 691–700. [Google Scholar] [CrossRef] [Green Version]
  29. York, A. Comparing Geodetically Derived Mass Balances among Three Small Glaciers, South Coast Mountains, British Columbia. Ph.D. Thesis, Northern Arizona University, Flagstaff, AZ, USA, 2013. [Google Scholar]
  30. Evans, I.S. Local aspect asymmetry of mountain glaciation: A global survey of consistency of favoured directions for glacier numbers and altitudes. Geomorphology 2006, 73, 166–184. [Google Scholar] [CrossRef]
  31. Burrough, P.A.; McDonnell, R.A.; Lloyd, C.D. Principles of Geographical Information Systems; Oxford University Press: Oxford, UK, 1998. [Google Scholar]
  32. Regine, H. A distributed temperature-index ice- and snowmelt model including potential direct solar radiation. J. Glaciol. 1999, 45, 101–111. [Google Scholar]
  33. Li, X.; Cheng, G.; Chen, X.; Lu, L. Modification of solar radiation model over rugged terrain. Chin. Sci. Bull. 1999, 44, 1345–1349. [Google Scholar] [CrossRef]
  34. Olson, M.; Rupper, S. Impacts of topographic shading on direct solar radiation for valley glaciers in complex topography. Cryosphere 2019, 13, 29–40. [Google Scholar] [CrossRef] [Green Version]
  35. Hock, R.; Tijm-Reijmer, C. A mass-balance, glacier runoff and mutli-layer snow model. In Program Documentation and Users Manual; University of Alaska Fairbanks: Fairbanks, AK, USA; Utrecht University: Utrecht, The Netherlands, 2012. [Google Scholar]
  36. Hock, R.; Noetzli, C. Areal melt and discharge modelling of Storglaciären, Sweden. Ann. Glaciol. 1997, 24, 211–216. [Google Scholar]
  37. Liang, L.; Cuo, L.; Liu, Q. The energy and mass balance of a continental glacier: Dongkemadi Glacier in central Tibetan Plateau. Sci. Rep. 2018, 8, 12788. [Google Scholar] [PubMed]
  38. Rgi, C.; Nosenko, G. Randolph Glacier Inventory(RGI)-A Dataset of Global Glacier Outlines: Version6.0; Technical Report; Global Land Ice Measurements from Space: Boulder, CO, USA, 2017. [Google Scholar]
  39. Sorg, A.; Bolch, T.; Stoffel, M.; Solomina, O.; Beniston, M. Climate change impacts on glaciers and runoff in Tien Shan (Central Asia). Nat. Clim. Chang. 2012, 2, 725–731. [Google Scholar] [CrossRef]
  40. Guo, W.; Liu, S.; Xu, J.; Wu, L.; Shangguan, D.; Yao, X.; Wei, J.; Bao, W.; Yu, P.; Liu, Q.; et al. The second Chinese glacier inventory: Data, methods and results. J. Glaciol. 2015, 61, 357–372. [Google Scholar] [CrossRef] [Green Version]
  41. Pfeffer, W.T.; Arendt, A.A.; Bliss, A.; Bolch, T.; Cogley, J.G.; Gardner, A.; Hagen, J.-O.; Hock, R.; Kaser, G.; Kienholz, C.; et al. The Randolph Glacier Inventory: A globally complete inventory of glaciers. J. Glaciol. 2014, 60, 537–552. [Google Scholar] [CrossRef] [Green Version]
  42. Jarvis, A.; Reuter, H.I.; Nelson, A.; Guevara, E. Hole-Filled SRTM for the Globe Version 4. Available from the CGIAR-CSI SRTM 90 m Database. 2008. Available online: http://srtm.csi.cgiar.org (accessed on 1 February 2022).
  43. Rolstad, C.; Haug, T.; Denby, B. Spatially integrated geodetic glacier mass balance and its uncertainty based on geostatistical analysis: Application to the western Svartisen ice cap, Norway. J. Glaciol. 2009, 55, 666–680. [Google Scholar] [CrossRef] [Green Version]
  44. Brock, B.W.; Arnold, N.S. A spreadsheet-based (Microsoft Excel) point surface energy balance model for glacier and snow melt studies. Earth Surf. Process. Landf. 2000, 25, 649–658. [Google Scholar] [CrossRef]
  45. Oke, T. Boundary Layer Climates, 2nd ed.; Routledge: London, UK, 2002. [Google Scholar]
  46. Walraven, R. Calculating the position of the sun. Sol. Energy 1978, 20, 393–397. [Google Scholar] [CrossRef]
  47. Holzer, N.; Vijay, S.; Yao, T.; Xu, B.; Buchroithner, M.; Bolch, T. Four decades of glacier variations at Muztagh Ata (eastern Pamir): A multi-sensor study including Hexagon KH-9 and Pléiades data. Cryosphere 2015, 9, 2071–2088. [Google Scholar] [CrossRef] [Green Version]
  48. Zhu, M.; Yao, T.; Yang, W.; Xu, B.; Wu, G.; Wang, X.; Xie, Y. Reconstruction of the mass balance of Muztag Ata No. 15 glacier, eastern Pamir, and its climatic drivers. J. Glaciol. 2018, 64, 259–274. [Google Scholar] [CrossRef] [Green Version]
  49. Wu, B. Weakening of Indian summer monsoon in recent decades. Adv. Atmos. Sci. 2005, 22, 21–29. [Google Scholar] [CrossRef]
  50. Zhao, H.; Xu, B.; Yao, T.; Wu, G.; Lin, S.; Gao, J.; Wang, M. Deuterium excess record in a southern Tibetan ice core and its potential climatic implications. Clim. Dyn. 2012, 38, 1791–1803. [Google Scholar] [CrossRef]
  51. Liu, X.D.; Chen, B.D. Climatic warming in the Tibetan plateau during recent decades. Int. J. Climatol. 2015, 20, 1729–1742. [Google Scholar]
  52. Gao, Y.; Chen, F.; Lettenmaier, D.P.; Xu, J.; Xiao, L.; Li, X. Does elevation-dependent warming hold true above 5000 m elevation? Lessons from the Tibetan Plateau. NPJ Clim. Atmos. Sci. 2018, 1, 19. [Google Scholar] [CrossRef]
  53. Zhang, Y.; Enomoto, H.; Ohata, T.; Kitabata, H.; Kadota, T.; Hirabayashi, Y. Glacier mass balance and its potential impacts in the Altai Mountains over the period 1990–2011. J. Hydrol. 2017, 553, 662–677. [Google Scholar]
  54. Mölg, T.; Hardy, D.R. Ablation and associated energy balance of a horizontal glacier surface on Kilimanjaro. J. Geophys. Res. 2007, 109, D16104. [Google Scholar]
  55. Oerlemans, J.; Klok, E. Energy balance of a glacier surface: Analysis of automatic weather station data from the Morteratschgletscher, Switzerland. Arct. Antarct. Alp. Res. 2002, 34, 477–485. [Google Scholar]
  56. Yang, W.; Guo, X.; Yao, T.; Yang, K.; Zhao, L.; Li, S.; Zhu, M. Summertime surface energy budget and ablation modeling in the ablation zone of a maritime Tibetan glacier. J. Geophys. Res. Earth Surf. 2011, 116. [Google Scholar] [CrossRef]
  57. Sun, W.; Qin, X.; Ren, J.; Yang, X.; Zhang, T.; Liu, Y.; Cui, X.; Du, W. The Surface Energy Budget in the Accumulation Zone of the Laohugou Glacier No. 12 in the Western Qilian Mountains, China, in Summer 2009. Arct. Antarct. Alp. Res. 2012, 44, 296–305. [Google Scholar] [CrossRef] [Green Version]
  58. Zhang, G.; Kang, S.; Fujita, K.; Huintjes, E.; Xu, J.; Yamazaki, T.; Haginoya, S.; Wei, Y.; Scherer, D.; Schneider, C.; et al. Energy and mass balance of Zhadang glacier surface, central Tibetan Plateau. J. Glaciol. 2013, 59, 137–148. [Google Scholar] [CrossRef] [Green Version]
  59. Chen, J.; Qin, X.; Kang, S.; DU, W.; Sun, W.; Liu, Y. Effects of clouds on surface melting of Laohugou glacier No. 12, western Qilian Mountains, China. J. Glaciol. 2018, 64, 89–99. [Google Scholar] [CrossRef] [Green Version]
  60. Herreid, S.; Pellicciotti, F. The state of rock debris covering Earth’s glaciers. Nat. Geosci. 2020, 13, 621–627. [Google Scholar] [CrossRef]
  61. Zhang, Y.; Liu, S.; Ding, Y. Glacier meltwater and runoff modelling, Keqicar Baqi glacier, southwestern Tien Shan, China. J. Glaciol. 2007, 53, 91–98. [Google Scholar] [CrossRef] [Green Version]
  62. Zhang, Y.; Hirabayashi, Y.; Liu, Q.; Liu, S. Glacier runoff and its impact in a highly glacierized catchment in the southeastern Tibetan Plateau: Past and future trends. J. Glaciol. 2015, 61, 713–730. [Google Scholar] [CrossRef] [Green Version]
  63. Radić, V.; Hock, R. Regional and global volumes of glaciers derived from statistical upscaling of glacier inventory data. J. Geophys. Res. Earth Surf. 2010, 115, F01010. [Google Scholar] [CrossRef]
  64. Yin, Q.Z.; Wu, Z.P.; Berger, A.; Goosse, H.; Hodell, D. Insolation triggered abrupt weakening of Atlantic circulation at the end of interglacials. Science 2021, 373, 1035–1040. [Google Scholar]
Figure 1. Glacier distribution and regional boundaries within HMA. The grey areas indicate elevations greater than 2800 m.
Remotesensing 14 01576 g001
Figure 2. Work flow for topographic shading calculations.
Remotesensing 14 01576 g002
Figure 3. Topographic shading of Koxkar glacier at different times.
Remotesensing 14 01576 g003
Figure 4. The area percentage of topographic shading of the glaciers in each region during the ablation period within HMA.
Remotesensing 14 01576 g004
Figure 5. Altitudinal distribution of the topographic shading area within each region of HMA during the ablation period.
Remotesensing 14 01576 g005
Figure 6. Changes in the shading area percentage with the glacier area for each region within HMA. The glacier area refers to the average area of the regional glaciers. The area std is the standard deviation of the regional glacier areas.
Remotesensing 14 01576 g006
Figure 7. Changes in the glacier area with shading area percentages for each region within HMA. The black line is the average shading area percentage, and the gray shadow is the standard deviation.
Remotesensing 14 01576 g007
Figure 8. Distribution of shading on different aspects for each region within HMA.
Remotesensing 14 01576 g008
Figure 9. Shading area ratio for each glacier within HMA.
Remotesensing 14 01576 g009
Figure 10. Comparison between the mass balance (a), topographic shading (b) and DEM (c) of Glacier RGI60-14.07524.
Remotesensing 14 01576 g010
Figure 11. Spatial distribution of the mass balance was significantly correlated with topographic shading during 2000–2016.
Remotesensing 14 01576 g011
Figure 12. Comparison of topographic shading calculated by AcrGIS and this study.
Remotesensing 14 01576 g012
Table 1. Summary of the glacier characteristics statistics for different regions within HMA.
RGI RegionNglacierAnorth (km2)Aeast (km2)Asouth (km2)West (km2)A (km2)
01 Altay and Sayan2431551.58325.48132.75151.771161.57
02 East Tianshan52271373.07665.27292.97521.882853.18
03 West Tianshan97393869.712048.931555.032055.029528.69
04 Hissar Alay3151804.03480.33217.39343.691845.43
05 Pamir10,2334625.882520.351307.451781.1310,234.80
06 West Kunlun53973379.151946.581064.661759.468149.85
07 East Kunlun35191448.55717.18507.55577.283250.56
08 Qilian Shan2730869.49337.21144.58285.831637.10
09 Karakoram13,7598285.105807.444308.074457.4722,858.08
10 Inner Tibet Plateau93653228.152122.981198.371382.547932.05
11 South and East Tibet50631283.681083.66730.77772.953871.05
12 Hindu Kush44011257.87702.68415.83563.012939.39
13 West Himalaya98293092.481844.761160.461627.417725.10
14 Central Himalaya45301786.111372.671165.311168.305492.39
15 East Himalaya42371399.291277.931165.561045.614888.39
16 Hengduan Shan43541380.201274.30884.10846.104384.70
Total97,96538,634.3324,527.7316,250.8319,339.4598,752.33
The number of glaciers (N) and their corresponding areas in each aspect (A). Orientations are classified as north (315–360°, 0–45°), east (45–135°), south (135–225°) and west (225–315°), with respective areas Anorth, Aeast, Asouth and Awest, and A is the total area of all orientations.
Table 2. Glacier shading area percentages in the regions within HMA.
RGI RegionPnorth (%)Peast (%)Psouth (%)Pwest (%)Ptotal (%)
01 Altay and Sayan14.837.563.643.1029.13
02 East Tianshan14.046.582.834.1327.57
03 West Tianshan12.237.055.475.4530.20
04 Hissar Alay12.799.094.113.8029.79
05 Pamir13.568.364.424.0230.35
06 West Kunlun9.615.212.304.0221.13
07 East Kunlun9.774.042.823.1119.73
08 Qilian Shan12.033.792.033.7721.62
09 Karakoram11.027.976.165.2830.43
10 Inner Tibet Plateau7.774.622.662.7117.76
11 South and East Tibet8.867.535.725.0427.15
12 Hindu Kush12.898.004.534.2029.62
13 West Himalaya10.896.854.364.8526.96
14 Central Himalaya9.297.246.855.6929.07
15 East Himalaya8.007.006.725.5027.23
16 Hengduan Shan8.026.795.244.3624.40
Pnorth, Peast, Psouth and Pwest are the shading area percentages relative to the glacier areas in the north, east, south and west aspects, respectively. Ptotal is the shading area percentages relative to all the glacier area in HMA.
Table 3. Summary of the regional glaciers with mass balances that were significantly correlated with topographic shading during 2000–2016.
RGI RegionNglacierNnorthNeastNsouthNwestMB (m w.e.)Area (km2)
01 Altay and Sayan
02 East Tianshan95757016659162−0.471.254
03 West Tianshan17921084252189267−0.272.747
04 Hissar Alay479277943870−0.091.531
05 Pamir21121275416163258−0.102.59
06 West Kunlun890588111601310.104.422
07 East Kunlun344222374441−0.093.41
08 Qilian Shan328203432755−0.351.642
09 Karakoram23751360384250381−0.095.285
10 Inner Tibet Plateau1189705230106148−0.262.712
11 South and East Tibet615213152109141−0.683.058
12 Hindu Kush81138917292158−0.171.8
13 West Himalaya1891976364218333−0.492.215
14 Central Himalaya1099382252211254−0.382.732
15 East Himalaya981298193237253−0.483.018
16 Hengduan Shan850324248136142−0.722.662
Nnorth, Neast, Nsouth and Nwest are the numbers of glaciers with north, east, south and west aspects, respectively. MB is the regional average mass balance, and Area is the regional average glacier area.
Publisher’s Note: MDPI stays neutral with regard to jurisdictional claims in published maps and institutional affiliations.

