1. Introduction
Entomological radar is of great importance in the application field of insect migration monitoring [
1,
2]. The traditional scanning entomological radar appeared in 1968. The research team led by Schaefer (1969) at the Center for Anti-Locust Research used a specially modified entomological radar for locust migration research in the south of the Saharato. This radar can obtain the number of migrating insects, and only the insect echo amplitude information is used for detection. In 1991, the Natural Resources Institute (NRI) and Commonwealth Scientific and Industrial Research Organisation (CSIRO) jointly developed a zenith-pointing linear-polarised conical-scan (ZLC) configuration for vertical observation radar (VLR), and successfully measured the body length, orientation, displacement direction, and flight speed of flying individuals in Australia [
3]. The rotating linear polarization antenna was used to obtain the polarization information of insects, which helps the radar to measure insect body mass and orientation [
3,
4,
5]. In 2016, the fully polarimetric entomological radar developed by the Beijing Institute of Technology can obtain insect targets PSM instantaneously [
6], further improving the measurement capability of entomological radar [
7,
8,
9].
The measurement of target polarization information is particularly important for an entomological radar system. Polarization information is used to estimate orientation, body length, and mass of the insect in the entomological radar; thus, the polarization measurement accuracy directly affects the estimation accuracy of insect parameters [
10]. Studies have shown that when the polarization direction is parallel to the insect body axis, the echo power reaches the largest value. This conclusion is used as the basic assumption to calculate the orientation of insects [
10]. Insect body axis direction can be obtained from the main eigenvector of the insect PSM [
11,
12]. The insect mass estimation is based on the monotonous mapping relationship between the insect mass and radar cross section (RCS) [
13,
14]. The estimations of insect body length and body width are based on two invariant target parameters calculated from the insect targets PSM [
13]. One represents the target RCS when the polarization direction is perpendicular to the insect body axis, and the other represents the RCS product when the polarization direction is perpendicular to the insect body axis. Therefore, the measurement accuracy of the target PSM affects the estimation accuracy of body length, body mass, and orientation. PSM measurement accuracy is mainly affected by the polarization errors of radar system, including the stability and consistency of amplitude and phase between the horizontal polarization and vertical polarization channels, polarization isolation of dual-polarization antenna, etc. In order to ensure the measurement accuracy of insect PSM, the polarization calibration of an entomological radar is required [
15].
The traditional polarization calibration is divided into active and passive techniques. Active polarization calibration refers to the use of a polarimetric active radar calibrator (PARC) to receive, amplify, delay, and transmit the radar radiation signal [
16]. The polarization of the receiving antenna and transmitting antenna of PARC can be selected independently, and any PSM can be obtained by combing the polarization directions of the two antennas [
17]. Passive polarization calibration refers to the radar calibration that measures the passive reflectors with a specific PSM, including metal sphere, corner reflector, metal wire, etc. [
18,
19]. Since the passive technique has the advantages of lower cost and simple maintenance, it is suitable for entomological radars in the field. The traditional passive calibration techniques include the isolated antenna calibration technique (IACT) [
18], three targets calibration technique (TTCT) [
18], single target calibration technique (STCT) [
20], generalized calibration technique (GCT) [
18,
21], and so on. These techniques realize the polarimetric calibration by measuring one to three passive standard calibrators and solving the polarimetric errors [
21]. These traditional polarization calibration techniques require high precision of calibrator machining and calibrator posture during measurement (for example, dihedral of a specific angle). The problems of the traditional polarization calibration in the field include difficult calibrator machining and storage, and difficult operation of the calibration process; thus, the real calibration error is large and difficult to apply in practice. Among these techniques, STCT only needs to measure a metal sphere, so it is more practical. However, the machining precision and damage during storage limit the calibration accuracy. To avoid the above problems of passive polarization calibration, this paper proposes a new polarimetric calibration technique based on antenna rotation (PCTAR), which calibrates the systematic polarization error by rotating the antenna and measuring the echoes of the calibrator in different polarization directions. The technique has no requirements for the posture and PSM form of the calibrator, and any target can be used as the calibrator. It is easy to implement in actual field calibration. PCTAR uses the polarization error model of STCT. By rotating the antenna of the radar, a series of PSMs of the calibrator with systematic polarization errors in different directions are obtained. Next, based on the polarization error model and the measured PSMs, the system polarization errors are calculated. Finally, the system polarization errors are calibrated based on the polarization error model. In this paper, the theoretical analysis and simulation of the PCTAR technique are carried out to verify the feasibility. The performance for practical application is also tested based on our self-developed, fully polarimetric radar system.
The subsequent arrangement of this paper is as follows:
Section 2 introduces the polarization measurement error model of the fully polarimetric radar;
Section 3 gives the details of the PCTAR polarization calibration technique; In
Section 4, the detailed performance simulations of PCTAR under different conditions are carried out, and the performances of PCTAR and STCT are compared; In
Section 5, field experiments were conducted based on a fully polarimetric entomological radar to verify the effectiveness of the proposed method; and
Section 6 and
Section 7 are the discussion and conclusion of the paper, respectively.
Mathematical Notations: In this paper, the scalars are indicated with lower case, non-bold letters. Vectors are indicated with bold, upper-case letters. Matrices are indicated with bold, capital letters. and denote the transpose, and the inverse transpose of a matrix. The symbol denotes the modulus of a number.
2. Polarization Error Model of the Fully Polarimetric Entomological Radar System
A fully polarimetric entomological radar developed by our team will be taken as an example to introduce the polarimetric error model. The fully polarimetric entomological radar system is a two-dimensional scanning radar. It is capable of transmitting and receiving two polarization orthogonal signals (horizontal polarization, H, and vertical polarization, V) at the same time. The PSM of the target in the coordinate system can be obtained by constructing the coordinate system with mutually perpendicular H- and V-polarization directions. The system block diagram is shown in
Figure 1, including a dual-channel RF transceiver module with a bandwidth of 800 MHz and the center frequency of 16.2 GHz, a dual-polarized antenna, and a signal processor. A high resolution range profile (HRRP) for target detection is generated by transmitting, receiving, and processing the step-frequency chirp signals. In a previous paper [
15], the internal design block diagram and signal processing of the radar was described in detail.
The signal processor generates two sets of orthogonal polarization baseband signals, each of which consists of a number of stepped frequency chirp pulses. The orthogonal isolation is realized by reverse frequency modulation and different phase encoding among pulses in the stepped frequency cycle [
15]. The baseband signals are converted to RF signals by up-conversion, amplifying, filtering, and so on. Next, the signals pass through the circulators. Finally, the signals of two channels are transformed into H-polarization and V-polarization signals through the dual-polarization antenna, and then radiated into space. Due to reverse frequency modulation and phase encoding, the two signals are isolated from each other and can be restored separately by demodulation. Due to the depolarization effect of the target, the H-polarization signal is partly reflected as an H-polarization signal (HH) and partly as a V-polarization signal (VH). Similarly, V-polarization signals are also partly reflected as H-polarization signals (HV) and partly as V-polarization signals (VV). After the processes of antenna receiving, transceiver switching, down-conversion, amplification, and filtering, each signal is demodulated by two kinds of coding and matched filtering, so as to get four kinds of polarization signals (HH, HV, VH, and VV), which are, namely, the elements of PSM.
For an ideal, fully polarimetric radar, the target PSM can be obtained based on the above process. However, there are many unsatisfied factors due to the complex multiple polarization channels of the radar system. First, it is impossible to make a dual-polarization antenna with the ideal polarization isolation. The coupling exists between two polarization ports of the antenna. Second, the two polarization signals pass through two independent frequency conversion amplification circuits, which contain some active devices, such as amplification circuits, filters, mixers, etc. These devices exhibit different amplitude and phase characteristics at different temperatures, which cannot be completely consistent. The above undesirable factors will seriously distort the measured PSM, making it impossible to use the effective polarization information of the target. In order to obtain the correct PSM of a target, it is necessary to establish the systematic polarization error model of the measured PSM, and then solve and compensate for the systematic error based on the model.
Sarabandi and colleagues described the fully polarimetric antenna as a four-port network and establishes a complete systematic polarization error model for a fully polarimetric radar system with a single antenna and dual-polarization channels [
18]. This paper directly follows this model:
In Equation (1),
refers to the measured (uncalibrated) PSM of the target with noise;
R and
T refer to the error matrices of the receiving and transmitting channels, respectively, which can be written as:
where
and
represent the amplitude and phase errors (gains) of the H-polarization and V-polarization receiving channels, respectively;
and
represent that of the transmitting channels, respectively.
represents the true value of target PSM, which is written as:
where the subscript
i,
j of
represent the polarization forms of receiving and transmitting, respectively. According to the reciprocity principle of radar polarization with single station and single antenna,
.
C refers to antenna crosstalk matrix, which is written as:
where
and
represent antenna leakage between polarization channels, respectively, and
.
C can be assumed to be a symmetric matrix [
18].
, representing a complex, white Gaussian noise matrix. During polarization calibration, the effects of additive white noise are usually ignored, so the model is simplified as:
where
and
.
Since the absolute amplitude of the target (RCS) is obtained through RCS calibration, polarization calibration only needs to realize the relative value calibration between different polarization channels of the target. That is, obtaining the amplitude and phase information of each polarization channel relative to the HH-polarization channel is enough. Therefore, the absolute amplitude item
can be discarded, and Equation (6) can be further simplified as:
Polarization calibration is the process of solving the three systematic polarization error matrices of
,
, and
C. Next, the real target PSM can be obtained by matrix inversion and multiplication:
So far, the polarization measurement model of a fully polarimetric radar has been established. The following describes how to solve the three unknown matrices of , , and C by a polarimetric calibration technique based on antenna rotation designed in this paper.
3. Polarimetric Calibration Technique Based on Antenna Rotation (PCTAR)
For the proposed method, the target used for calibration is not required to be a regular calibrator with a known PSM. It can be an arbitrary, single scatter point target, such as a metal sphere, metal wire, irregular metal object, etc. During measurement, it is necessary to place the target in the center of the radar beam, and rotate the radar beam around the axis of the beam center for at least one rotation period (0°–360°) (
Figure 2a). If the antenna cannot rotate, the measurement can also be conducted by rotating the target around the axis of the radar beam center for at least one rotation period (
Figure 2b). Thereby, a series of target PSMs at different angles (at least one rotation period) are obtained.
The steps and calculation methods of PCTAR polarization calibration technique are described in detail below. When the rotation angle
is 0°, taking the H-polarization direction as the reference direction, the target PSM can be expressed as:
The direction of H-polarization (V-polarization) rotates with the rotation of the radar beam, which is equivalent to the rotation of the polarization coordinate system. The change of the target PSM with the rotation angle
can be expressed by the rotation matrix [
18]:
The
is the rotation matrix, and
Equation (10) represents the real target PSM. The measured PSM can be obtained by substituting Equation (10) into Equation (7), marked as
, where
The average of each element of
over different angles (0°~360°) can be represented as:
where,
refers to the operation to take the average of the values in angle brackets. In the process of beam rotation, H-polarization and V-polarization can be regarded as two linear polarizations with an angle difference of 90°; thus, the sum of the measured signals of H-polarization and V-polarization in one period is equal, namely
.
By taking [Equation (13)-④]/[Equation (13)-①] and [Equation (13)-③]/[Equation (13)-②], the following equation can be obtained:
According to Equation(14), two sets of solutions for
and
with opposite signs, can be calculated:
or
Next, we will introduce how to solve the cross-polarization coupling matrix parameter
. Through
[Equation (12)-①] + [Equation (12)-④], and
[Equation (12)-②], it can be found that:
Substitute Equation (11) into Equation (17), and we can obtain:
As at least one rotation period was measured, the terms with
in Equation (18) can be eliminated by taking the average of the term in one period or its integral in multiple periods. The average of
and
at each angle is defined as two constant items,
u, and
v, where
where
is the number of angles in one rotation period. By taking the average of both sides of equation in Equation (18), we can get:
Next, it can be found that
Two solutions of can be obtained. Since represents the polarization isolation that , the smaller one is usually the real solution.
The polarization calibration can be realized by taking the values of
,
, and
into Equation (7):
In Equation (24), is the measured value of the target PSM and is the truth value of relative PSM. The truth value of the PSM can be obtained by an additional traditional RCS calibration, which is not described here.
As two sets of solutions of
and
with opposite signs are obtained, two calibrated matrices can be obtained. The difference between these two matrices is that the signs of the cross-polarization elements are opposite. Similar to the traditional STCT polarization calibration technique, the true value can be determined by measuring the metal wire with an orientation of 45°. Two solutions are taken to calibrate the PSM of metal wire. If the orientation (the calculation method refers to [
12]) calculated by the calibrated PSM is around 45°, this solution is the correct one. Otherwise, if the orientation is around 45°, the selected solution is wrong.
4. Simulation Analysis
In the derivation of the proposed method, it is assumed that the radar measurement is free of noise, and the calibrator is always located on the normal of the antenna beam during the rotation of the antenna. However, in the actual calibration process, noise interference is inevitable. In addition, the calibrator may deviate from the normal of the beam due to the interference of environmental factors and rotation control accuracy. In this section, firstly, the effect of noise on the proposed method is simulated. Second, the calibration error caused by beam pointing error is analyzed. Finally, the performances of STCT and PCTAR under difference noise levels are compared.
In this section, assumptions of radar system parameters in all simulations are as follows: the matrix for the amplitude and phase imbalances between the receiving channels is ; the matrix for the amplitude and phase imbalances between the transmitting channels is ; the isolation of the fully polarimetric antenna is −25 dB, that is, ; and the antenna half-power beam width () is . The assumptions fit the polarization errors of the self-developed radar system.
4.1. Effects of Noise on the PCTAR
The performance of the proposed method under different signal-to-noise ratios (SNRs) is analyzed in this section. The expectation (E) and standard deviation () of the amplitude and phase errors of each element in the PSM are used to evaluate the performance of the PCTAR technique. The amplitude and phase errors are defined as the absolute value, , of the amplitude and phase difference between the calibrated PSM, , and the real PSM, , of the target, respectively.
The simulation takes an ideal metal sphere as the calibrator, and its theoretical PSM is
. The SNR changes from 10 dB to 40 dB. Since the power of the noise is constant during the rotation of the radar antenna, and the power of the target echo signal usually changes with the angle, the SNR usually changes with the rotation angle
. For convenience, the SNR in the simulation is defined as the SNR of the HH channel at
. Depending on the different SNR, there are several groups of simulation conditions. The Monte Carlo simulation is used to generate
PSMs
of insects randomly in each condition. By using Equation (13), a series of PSMs measurements at 0°~360° are obtained. After adding the complex, white Gaussian noise matrix
N, the target PSMs
with errors are obtained. Equations (15), (16), (18), (22), and (23) are used to calculate
,
, and
, and the calibrated targets PSMs
are calculated based on Equation (24).
and
are normalized by the element of HH polarization, and can then be used to calculate the amplitude and phase errors. The expectation, E, and standard deviation,
, of the amplitude and phase errors of the three polarization channels (HV, VH, and VV) for
targets are calculated. Simulation results are shown in
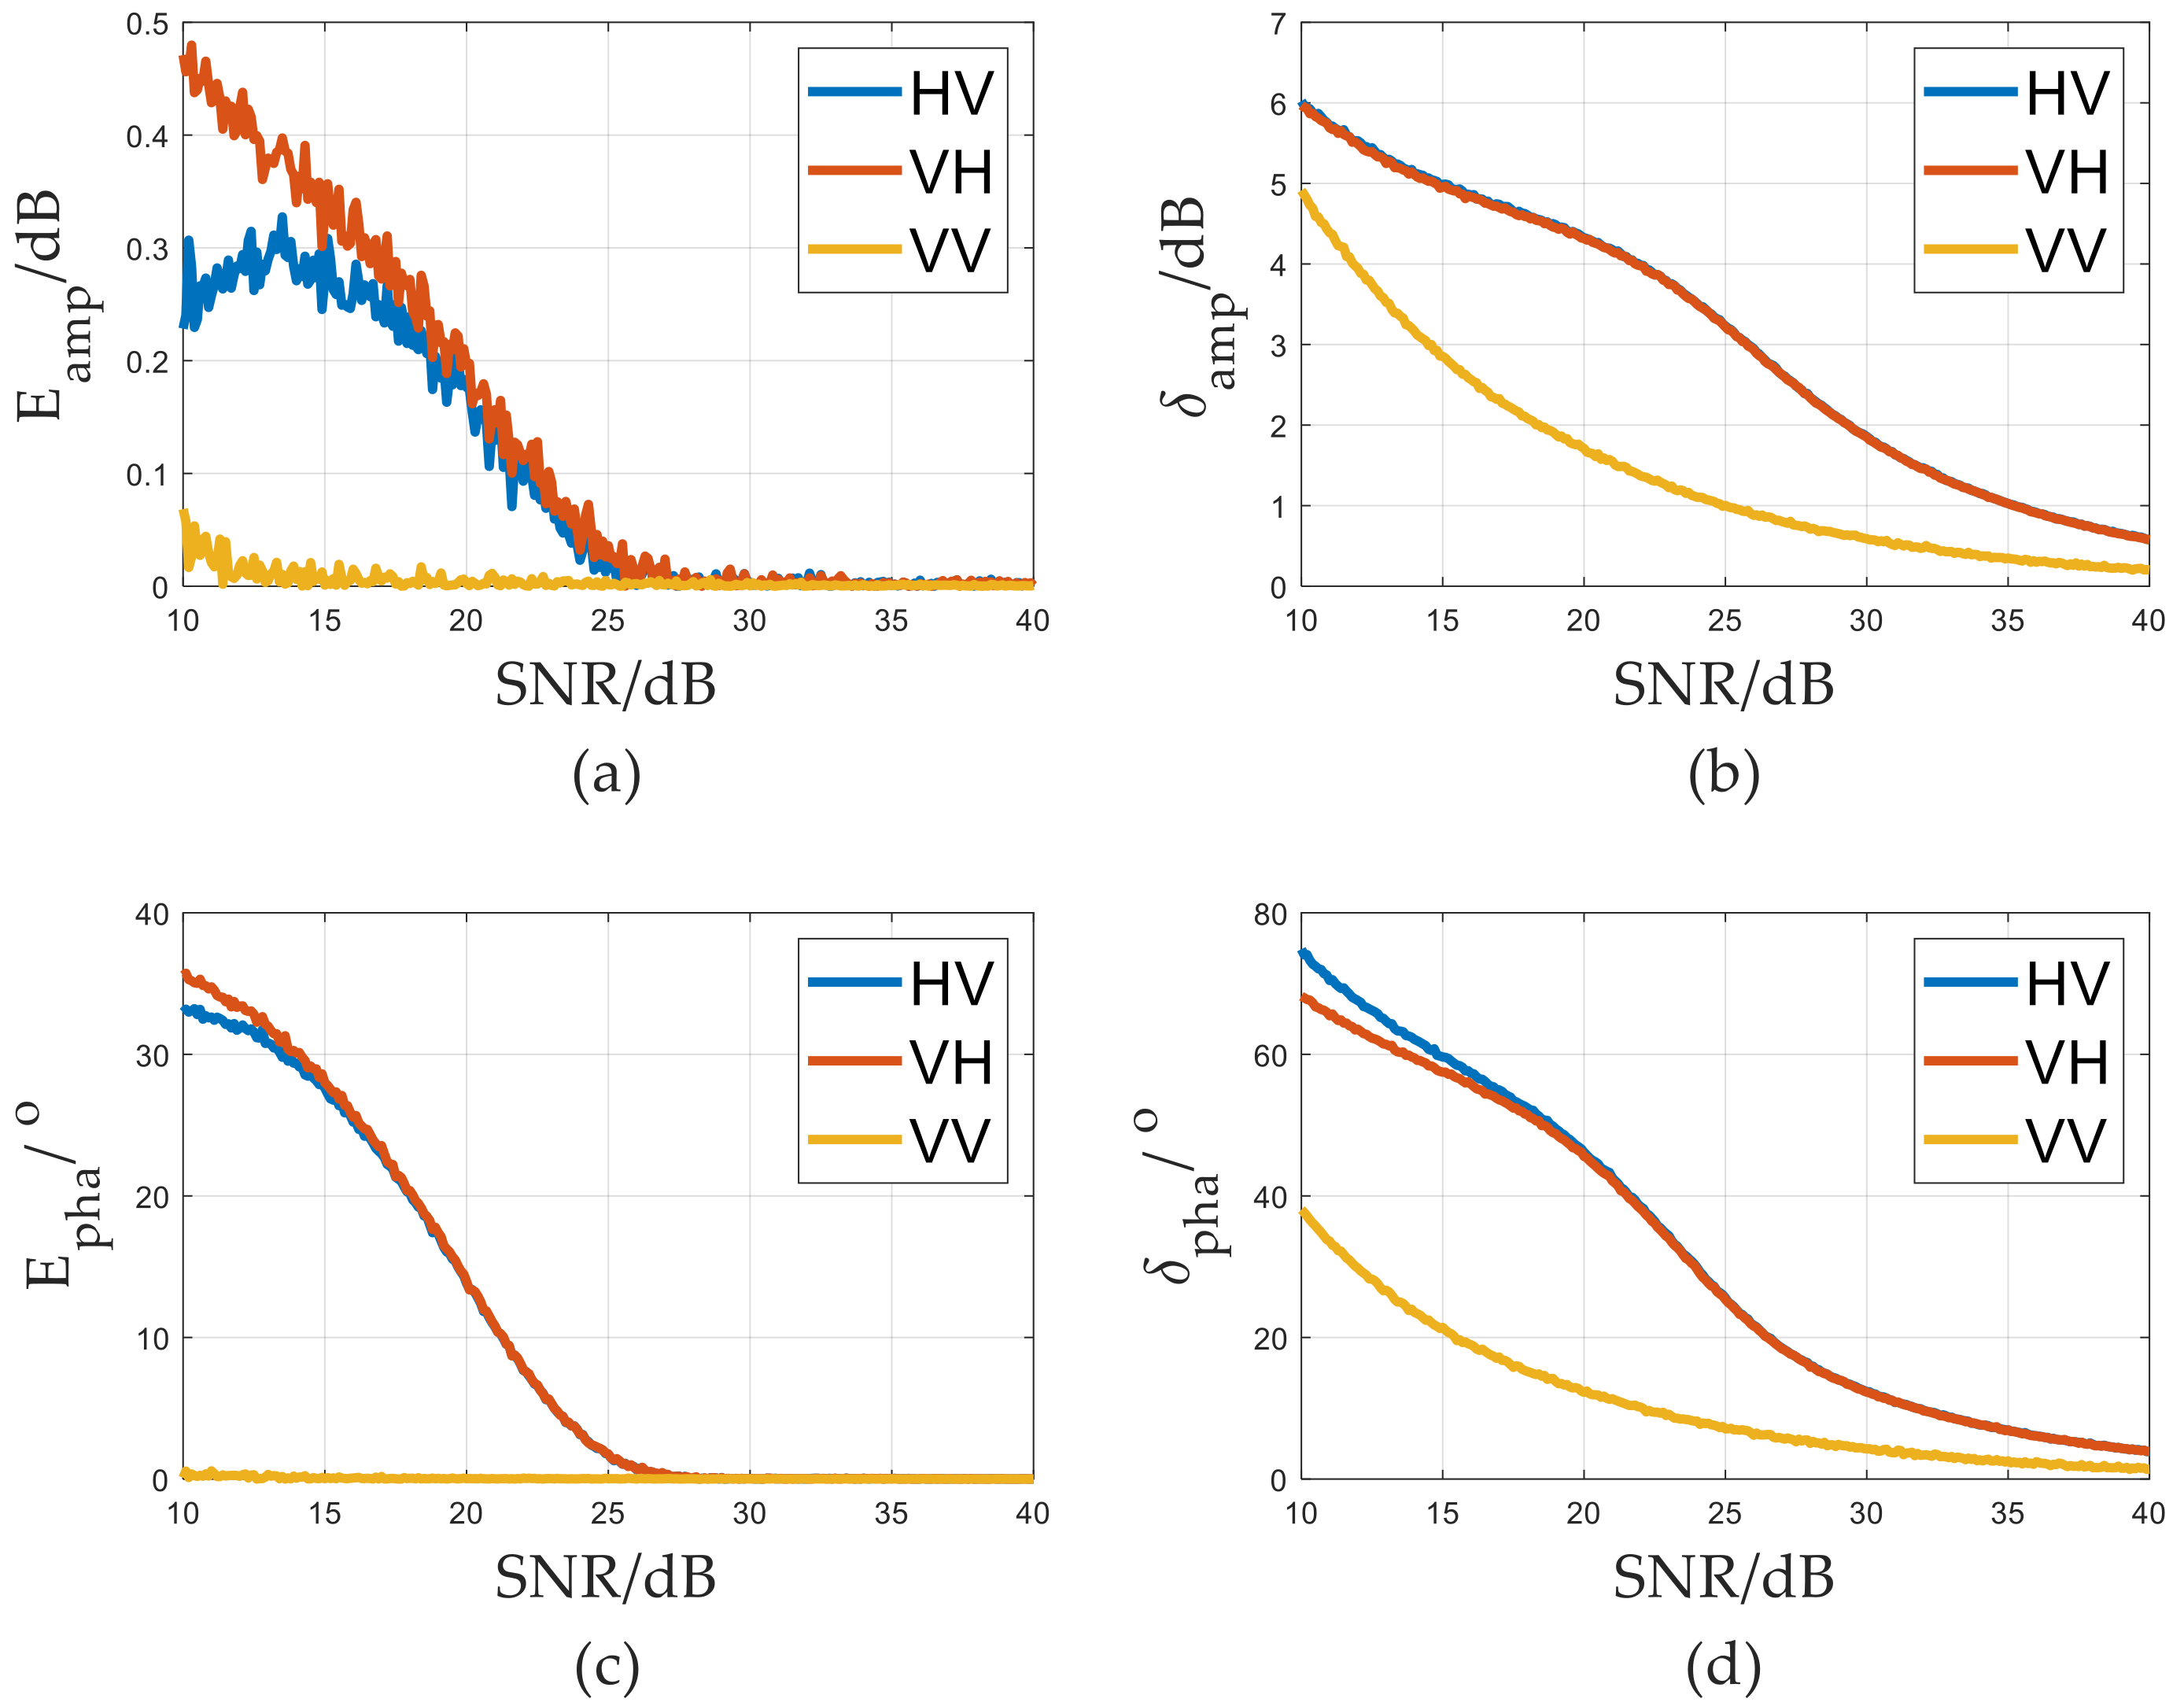
Figure 3.
Figure 3 shows the influence of SNR on the performance of PCTAR. It can be seen that both expectation, E, and standard deviation,
, decrease with SNR, which means the calibration accuracy gradually increases with the increasing SNR. Since the HH channel signal is set as the reference, the VV channel error represents the co-polarization channel error in the simulation results. Cross-channel meets the consistency of reciprocity error accuracy, and, therefore, the amplitude and phase error of the HV or VH channel represents cross-polarization channel amplitude and phase error. It can be seen that the calibration precision of the co-polarization channel (VV) is higher than that of the cross-polarization channels (VH) under the same noise level. When the SNRs are larger than 15 dB, for all polarization channels,
dB (
dB), and
(
). This means that the calibration is of high accuracy.
4.2. Effects of Beam Alignment Error on PCTAR
The PCTAR technique has no requirements for the prior knowledge of the calibrator PSM. During the calibration, we need to place the target in the center of the antenna beam, and rotate the antenna at least one rotation period. However, errors will be introduced if the target is not on the center of the antenna beam. There are two main factors leading to the offset to the center of antenna beam. One is that the rotation axis is not in alignment with the radar beam center due to the errors of mechanical process or an installation error. The other is that the actual position of the target is not on the rotation axis caused by the experimental error. The effects of these two factors on the measured PSM are analyzed in
Appendix A. In the following part of this section, the effect of beam alignment error on the proposed method is simulated.
The ideal metal sphere is used as the calibrator in the simulation. The simulation parameters are set as follows: the misalignment angle between the rotation center axis and the antenna beam center axis is
with the interval step of 0.1°;
with the interval step of 1 m. There are several groups of error conditions. In each condition, the Monte Carlo simulation method is used to randomly generate PSMs of
insects. The theoretical PSM of each insect is represented as
. A series of PSMs measured at different angles (0°~360°) with a beam alignment error (represented as
) are obtained by using Equations (6), (13), and (A6). The calibration matrices with errors
,
, and
are calculated by using Equations (15), (16), (18), (22) and (23). The calibrated target PSM
is calculated by Equation (24). Next, the amplitude and phase errors, as well as their expectations (
E) and standard deviations (
), are calculated, respectively. The co-polarization (VV) and cross-polarization (HV) channel errors are shown in
Figure 4 and
Figure 5, respectively.
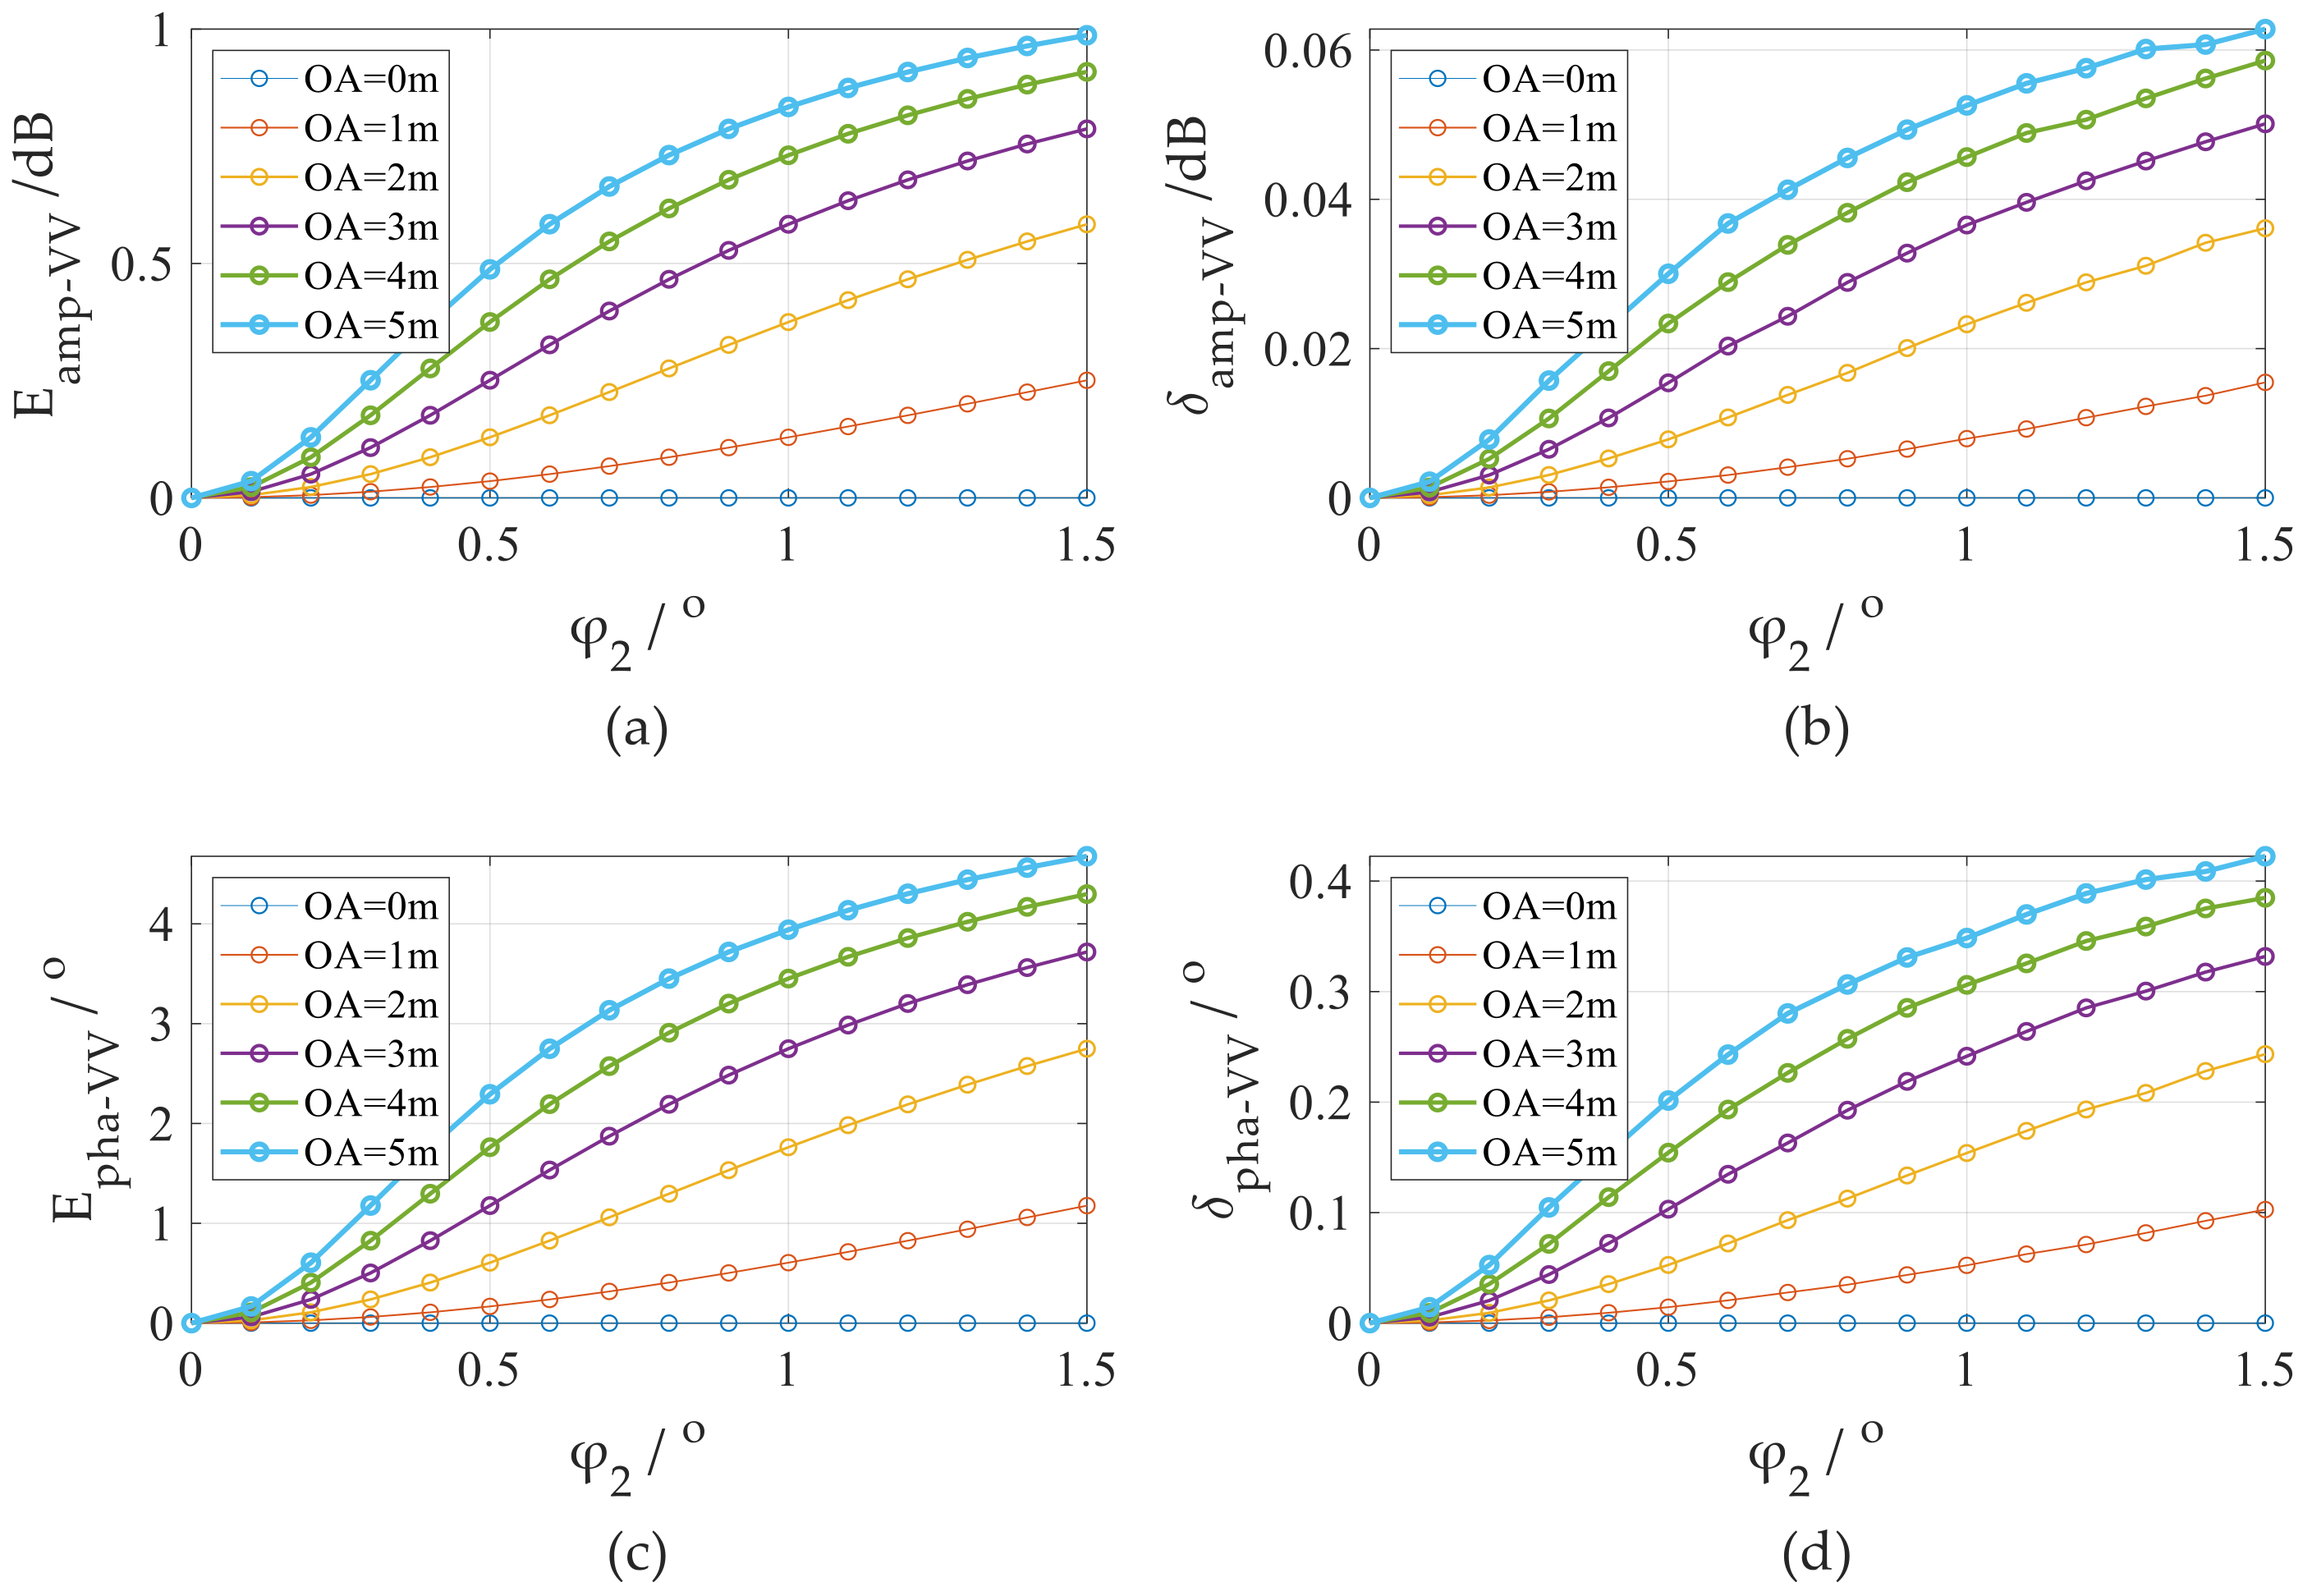
Figure 4 shows the simulation results of a co-polarization channel under the different distance errors, OA, and the angle errors,
. If
is not zero, as the OA increases, the
,
,
, and
increase accordingly. If OA is not zero, as
increases, the
,
,
, and
increase accordingly. When
and
m, the calibration error of the co-polarization channel can be obtained as:
,
,
, and
.
Figure 5 shows the simulation results of cross-polarization channels under the different distance errors, OA, and the angle errors,
. The relationships between OA and
and the calibration precision of the cross-polarization channel are similar to that of the co-polarization channel. When
and
m, the amplitude and phase errors of the cross-polarization channel can be obtained as:
(
), and
(
).
The simulation indicates that the beam alignment error deteriorates the calibration precision of PCTAR. Therefore, in the polarization calibration measurement, the angle between the antenna beam and the rotation axis should be reduced as much as possible, and the calibrator should be placed on the center of the beam as much as possible to improve the polarization calibration precision.
4.3. Comparison of PCTAR and STCT
The performances of PCTAR and STCT in difference noise levels are compared in this section. The simulation and evaluation methods are similar to that in
Section 4.1. First, the influence of SNR on the STCT is analyzed, as shown in
Figure 6. Next, the performances of PCTAR and STCT are compared in
Figure 7.
It can be seen from
Figure 6 that the relationships between the amplitude and phase errors and SNR of STCT are similar to that of PCTAR. When the SNR reaches 15 dB, the amplitude calibration errors of all polarization channels are
and
; the phase calibration errors of all polarization channels are
and
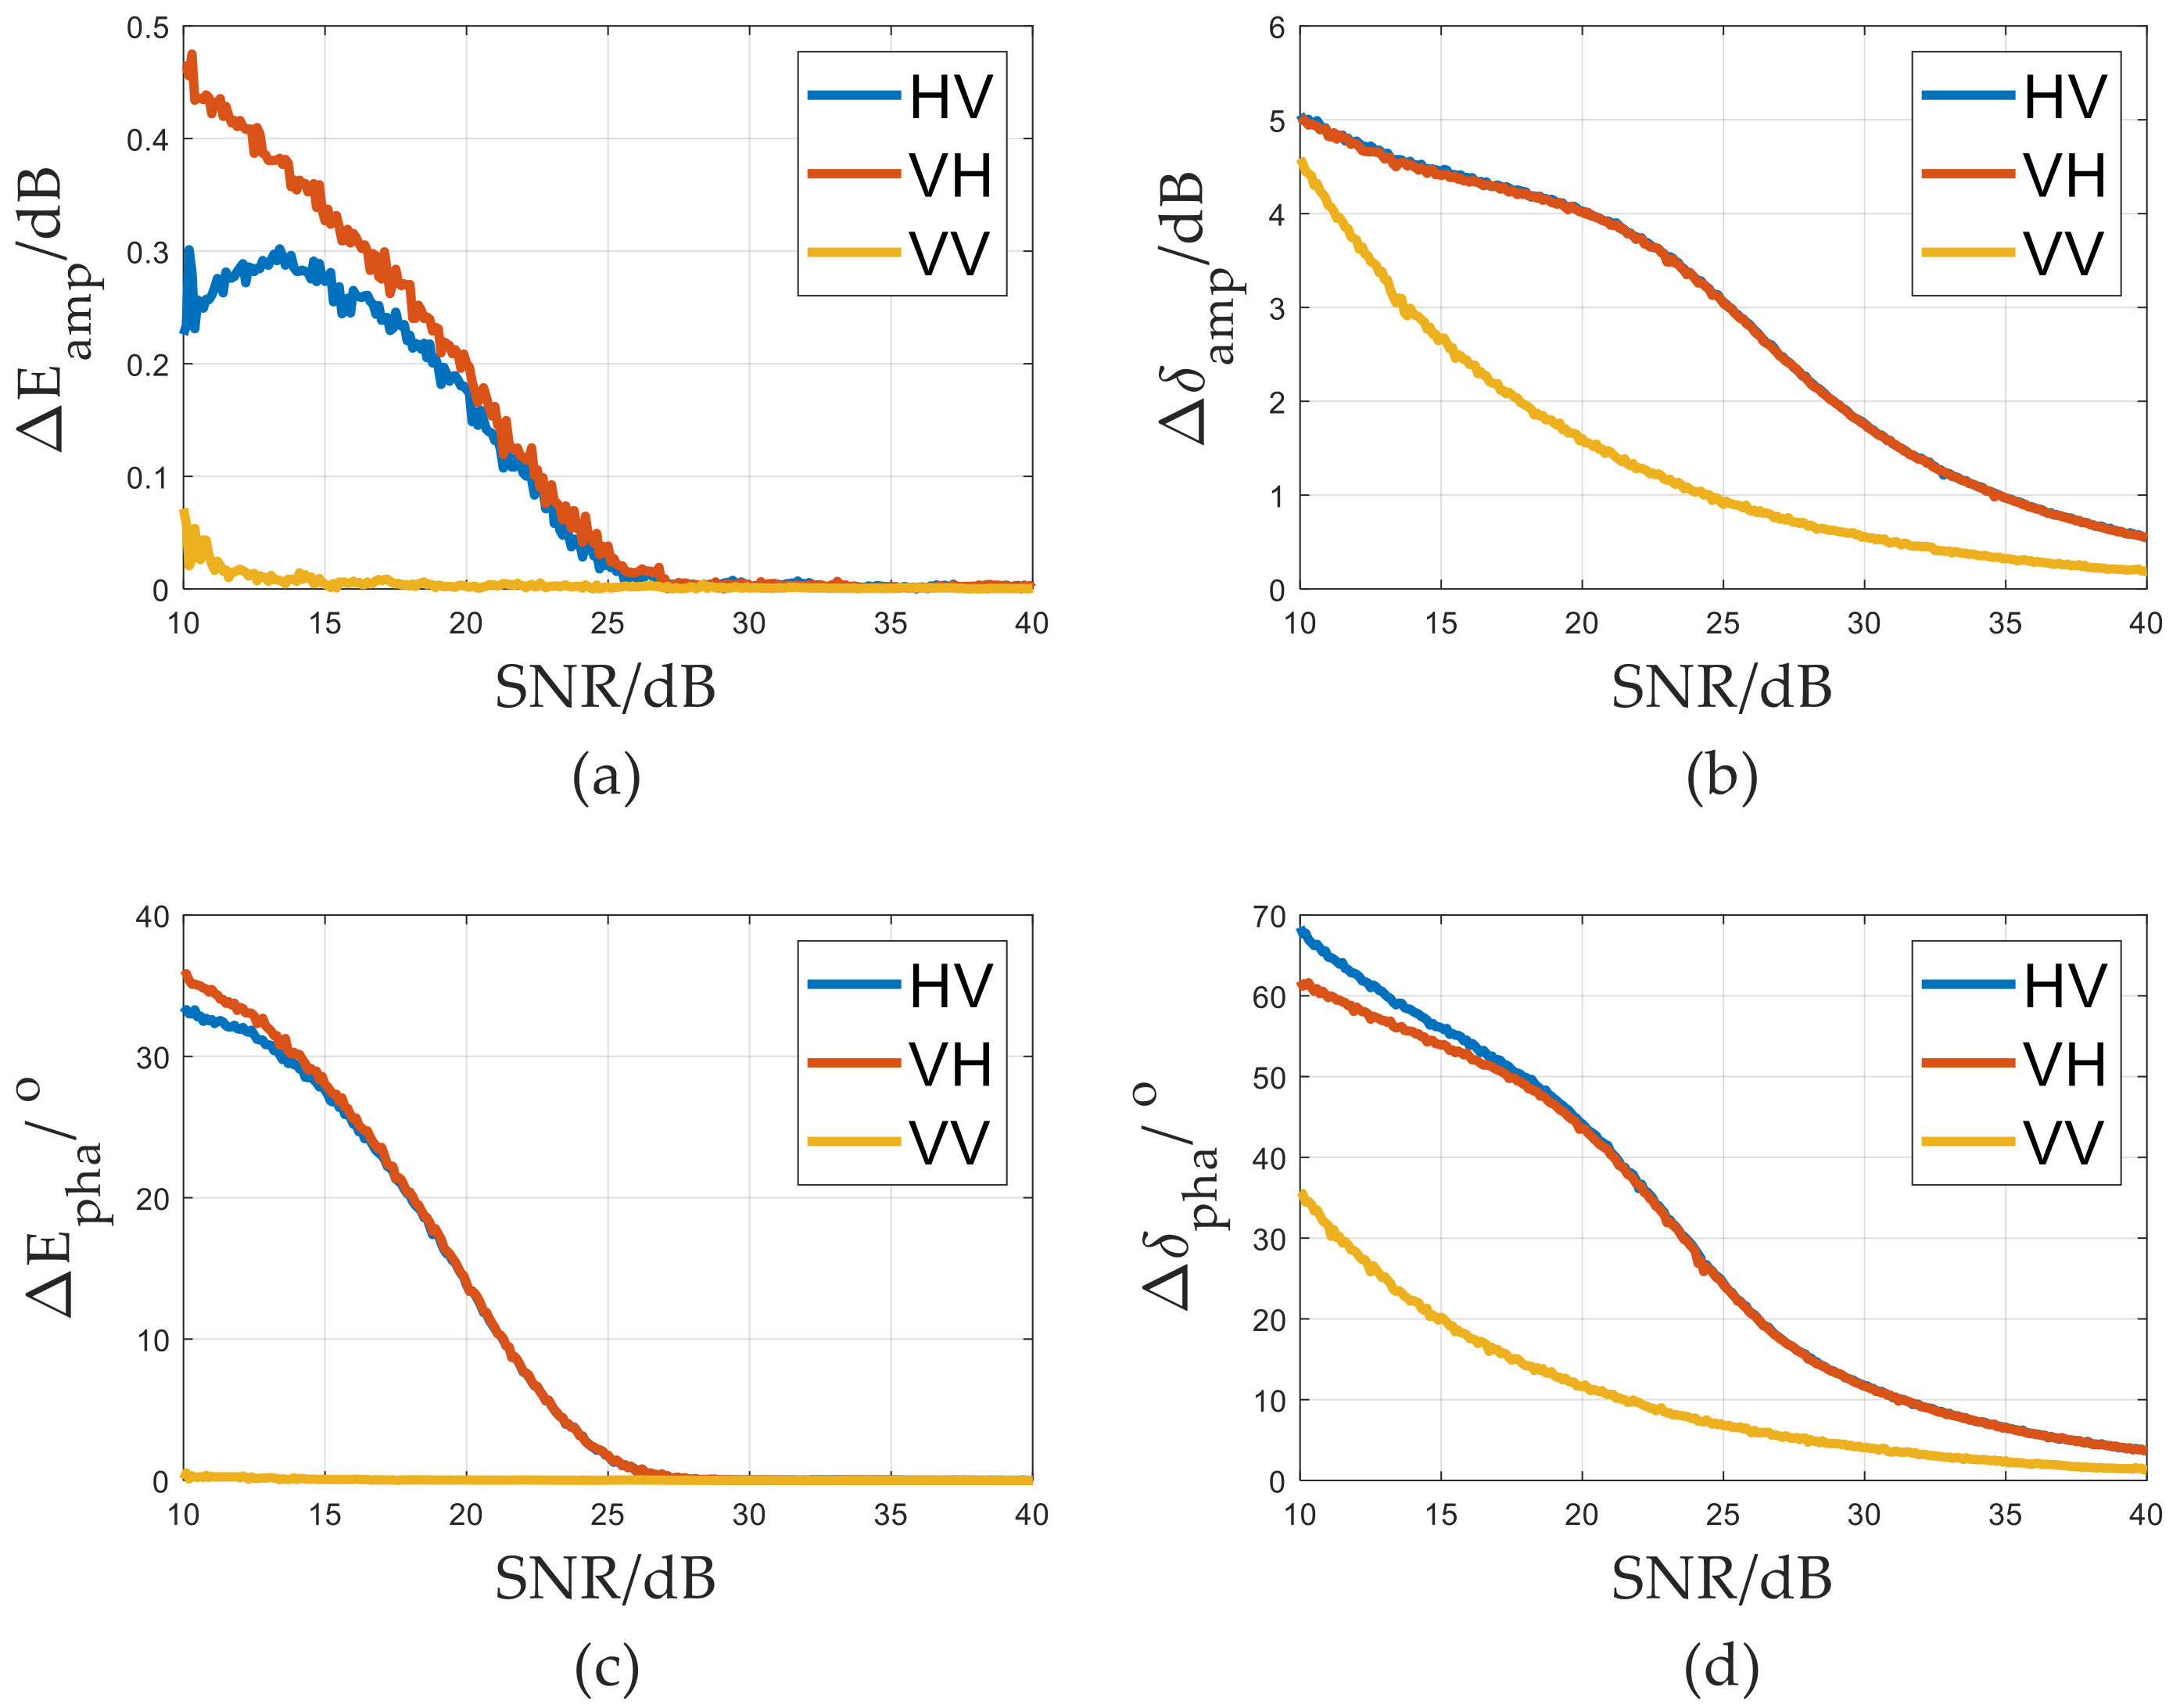
. To compare the performance of PCTAR and STCT, the differences of the expectation, E, and standard deviation,
, of the amplitude and phase errors at different SNRs and different polarization channels of STCT (
Figure 6) and PCTAR (
Figure 3) are calculated. The differences of the expectation and the standard deviation of the amplitude and phase errors are denoted as
,
,
, and
, respectively. If the differences are greater than 0, it means that the precision of PCTAR is better than that of STCT. Otherwise, it means that the precision of STCT is better than that of PCTAR. The comparison results are shown in
Figure 7:
The accuracies of PCTAR are much higher than STCT at SNRs lower than 26 dB. When SNR , and are close to zero, which indicates that the error expectations of the two methods are close. However, the standard deviations and of PCTAR are smaller than that of STCT. This indicates that the PCTAR is more robust to the system noise than STCT. Therefore, PCTAR can achieve higher accuracy than STCT under different SNRs. The reason is that STCT uses only one PSM of the calibrator, while PCTAR uses a series of PSMs (0°~360°), which has an accumulation effect on the echo signal, and the SNR is improved.
5. Experimental Verification
In order to verify the feasibility of PCTAR, a practical experiment is carried out based on a fully polarimetric radar. The radar is a Ku-band, high-resolution, fully polarimetric entomological radar set up in Jiangcheng, Yunnan, China. The details of the experiments and results are shown as follows.
5.1. Experiment
The experiment was carried out in calm weather. Before the measurement, the radar was set on a flat place to ensure the base level. An inclination sensor was used to measure the inclination angle of the radar base at different directions, and the radar was adjusted until the inclination angles in all directions are smaller than
. Next, the antenna beam was adjusted to point vertically to the sky. Before the measurement, the radar worked for about thirty minutes so that it could warm up to bring the amplitude and phase characteristics of the radar to a thermal equilibrium state. After that, the calibrator was placed in the center of the radar beam. Two DJI M600 unmanned aerial vehicles (UAVs) were used to suspend the target at an altitude of 300 m above the radar. The two UAVs were 120 m away, connected by a polyethylene (PE) line with low reflectivity. The calibrator was suspended in the middle of the line. The position of the calibrator was adjusted to be on the axis of radar beam. The radar antenna rotated along the azimuth angle for one cycle at a constant speed of
, and the PSMs at different angles were recorded. A schematic diagram of the experiment is shown in
Figure 8. The experiment scenario is shown in
Figure 9.
The calibration experiment flow is shown as follows:
| 1. | Start; |
| 2. | Set up the radar; |
| 3. | Warm up the radar; |
| 4. | Place the calibrator on the axis of the radar beam left; |
| 5. | Activate radar transmission and record data; |
| 6. | Rotate the radar antenna for one cycle; |
| 7. | Calculate the error matrices C, R, and T; |
| 8. | Shut down the radar; |
| 9. | End. |
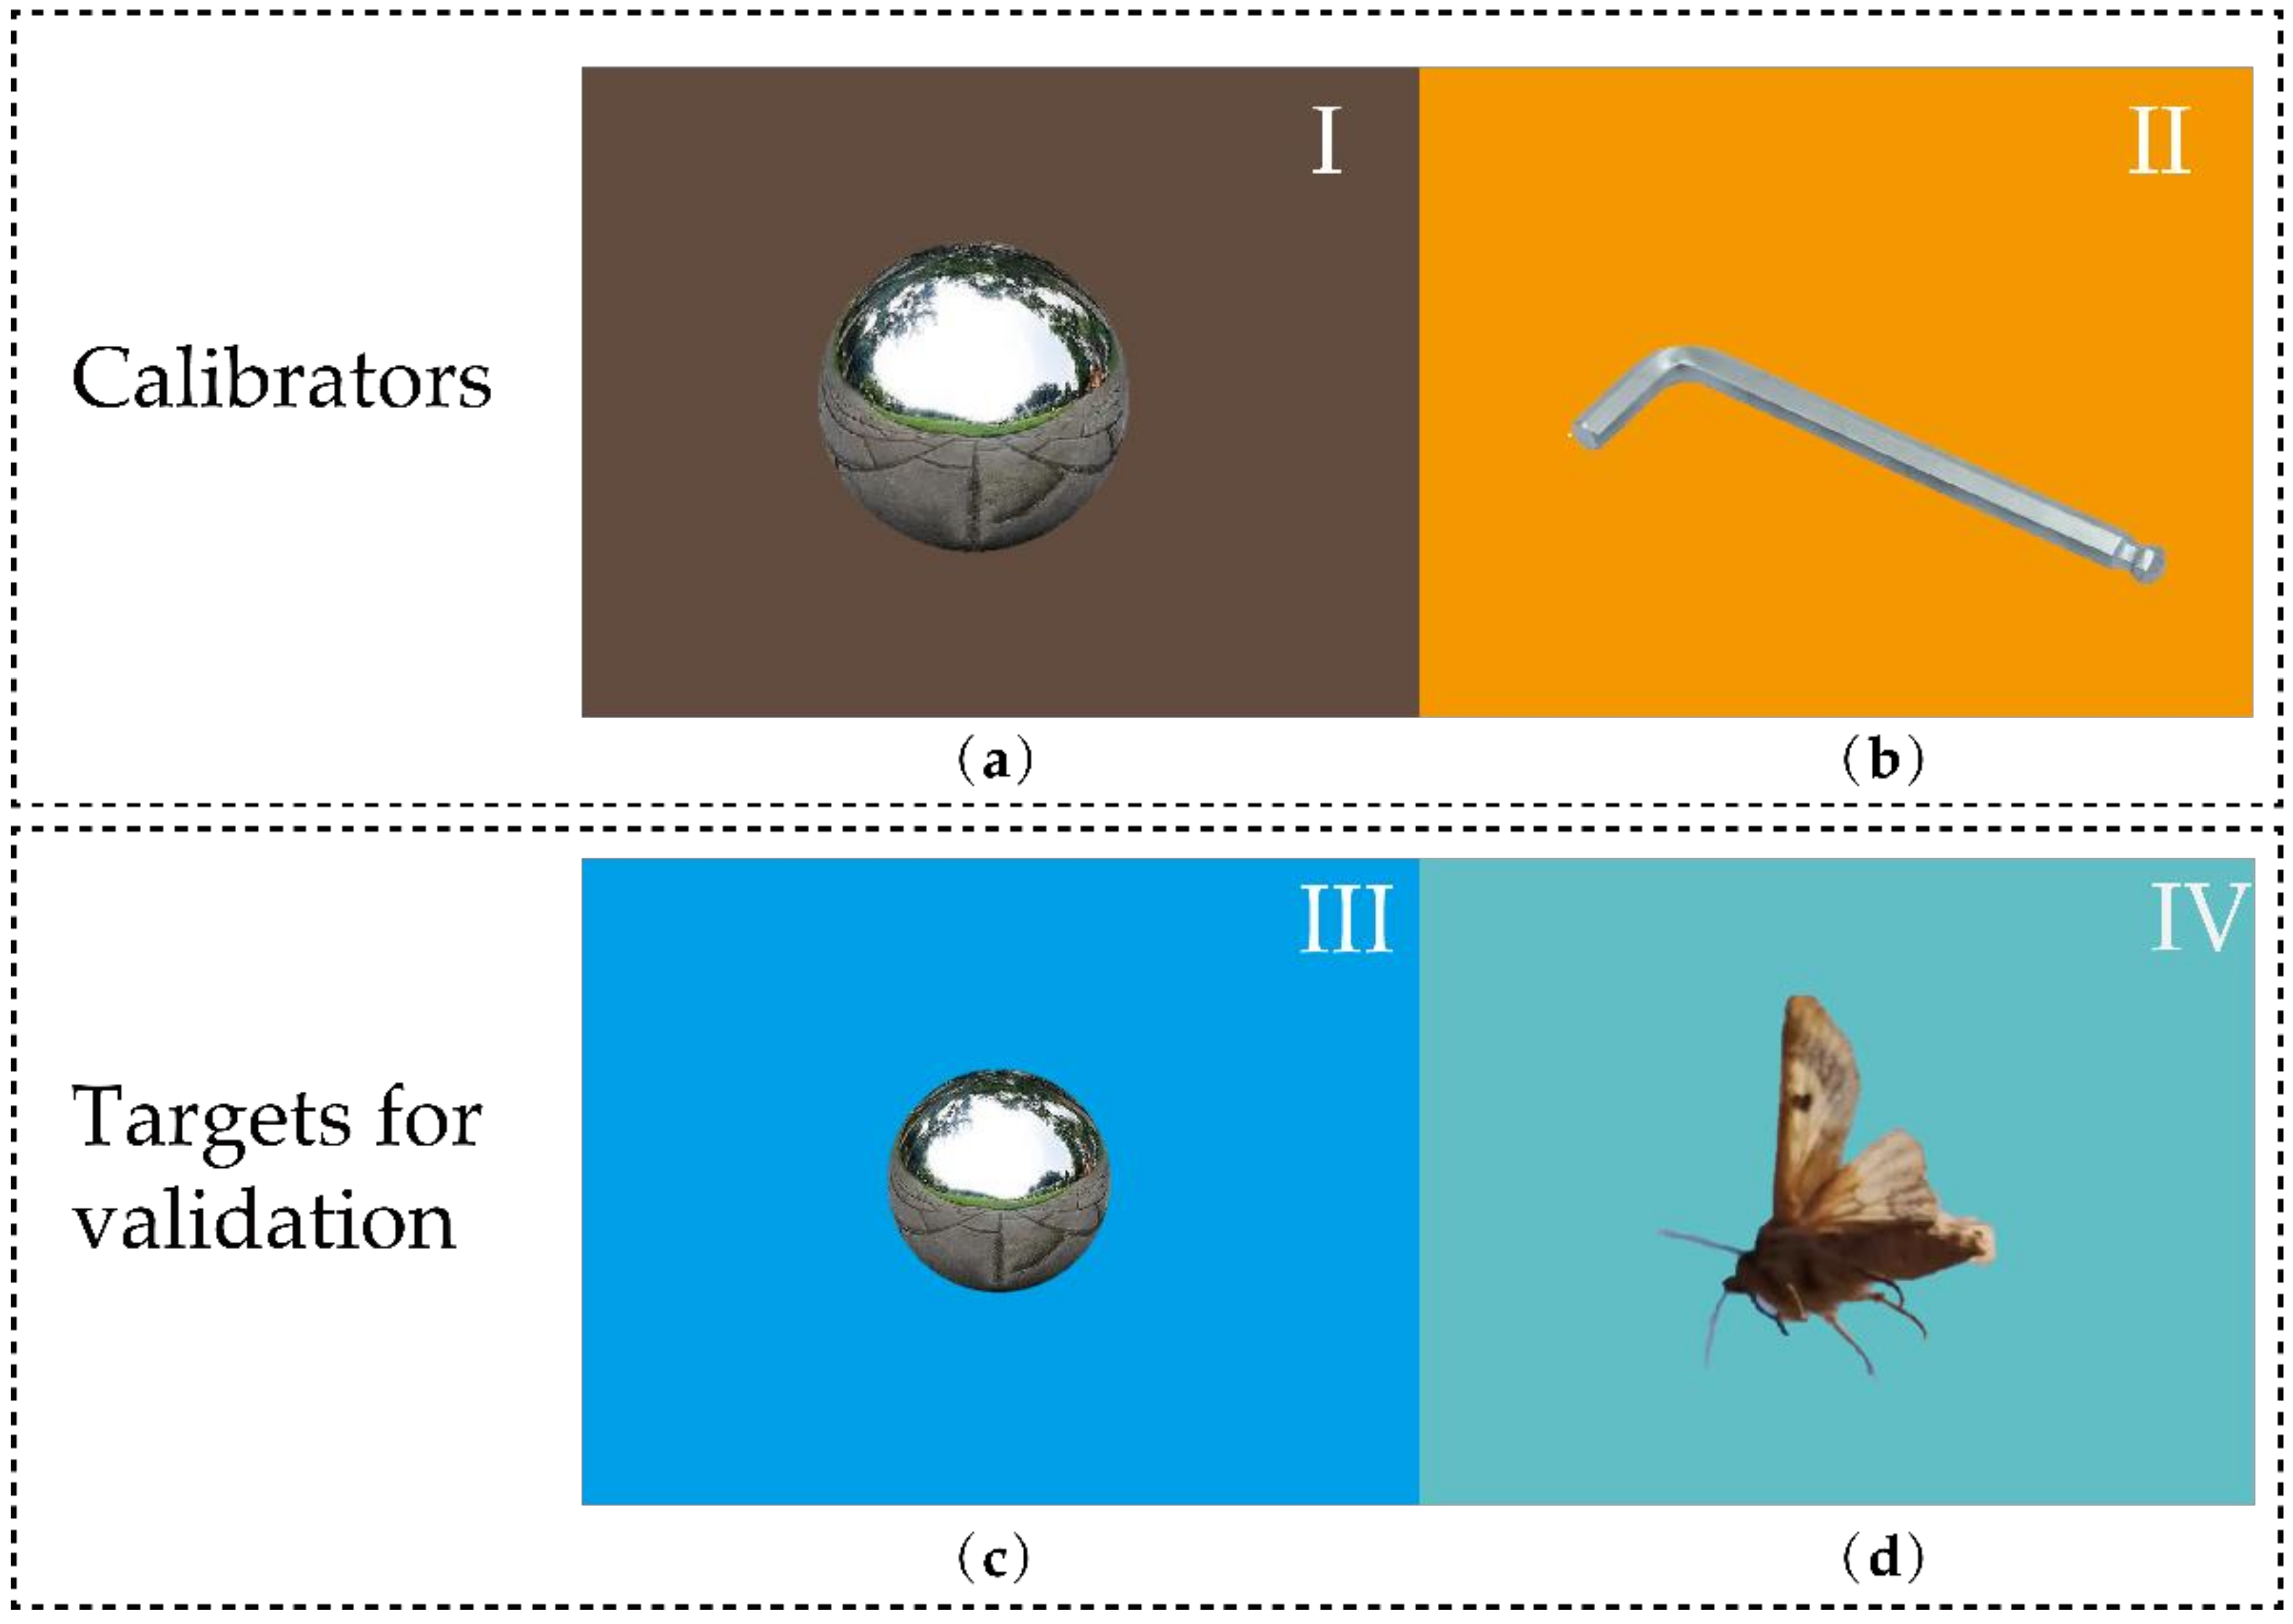
Four targets were measured in the experiment (
Figure 10):
Target I: A metal sphere with a diameter of 122 mm used as a calibrator for STCT;
Target II: A 120 mm wrench used as a calibrator for PCTAR;
Target III: A metal sphere with a diameter of 60 mm used as a target;
Target IV: An insect (bollworm) with 15 mm length used as a target.
5.2. Experimental Results
Target I, the sphere with a diameter of 122 mm, was used as the calibrator for STCT. The error matrices obtained by STCT are as follows: ; ; and . Target II, the 120 mm wrench, was used as a calibrator for PCTAR. The error matrices obtained by PCTAR are as follows: ; ; and .
Target III, the sphere with a diameter of 60 mm, was used to validate the calibration performance of these two methods. For this purpose, the polarization pattern is introduced here, which represents the echo signal power at different polarization directions
, and can be calculated from the PSM as [
13]:
where
represents the effective antenna length, and can be written as:
The ideal polarization pattern of a sphere is a standard circle. Thus, the shape of the polarization pattern of the sphere can be used to qualitatively evaluate the calibration accuracy.
The polarization patterns of Target III without calibration (blue), calibrated with STCT (red), and calibrated with PCTAR (black) are shown in
Figure 11, respectively. It can be seen that the polarization patterns after calibration are close to a standard circle, which means the calibrations of the two methods are effective. The polarization pattern calibrated with PCTAR is closer to a standard circle that that with STCT, which means the accuracy of PCTAR is higher than that of STCT in the experiment.
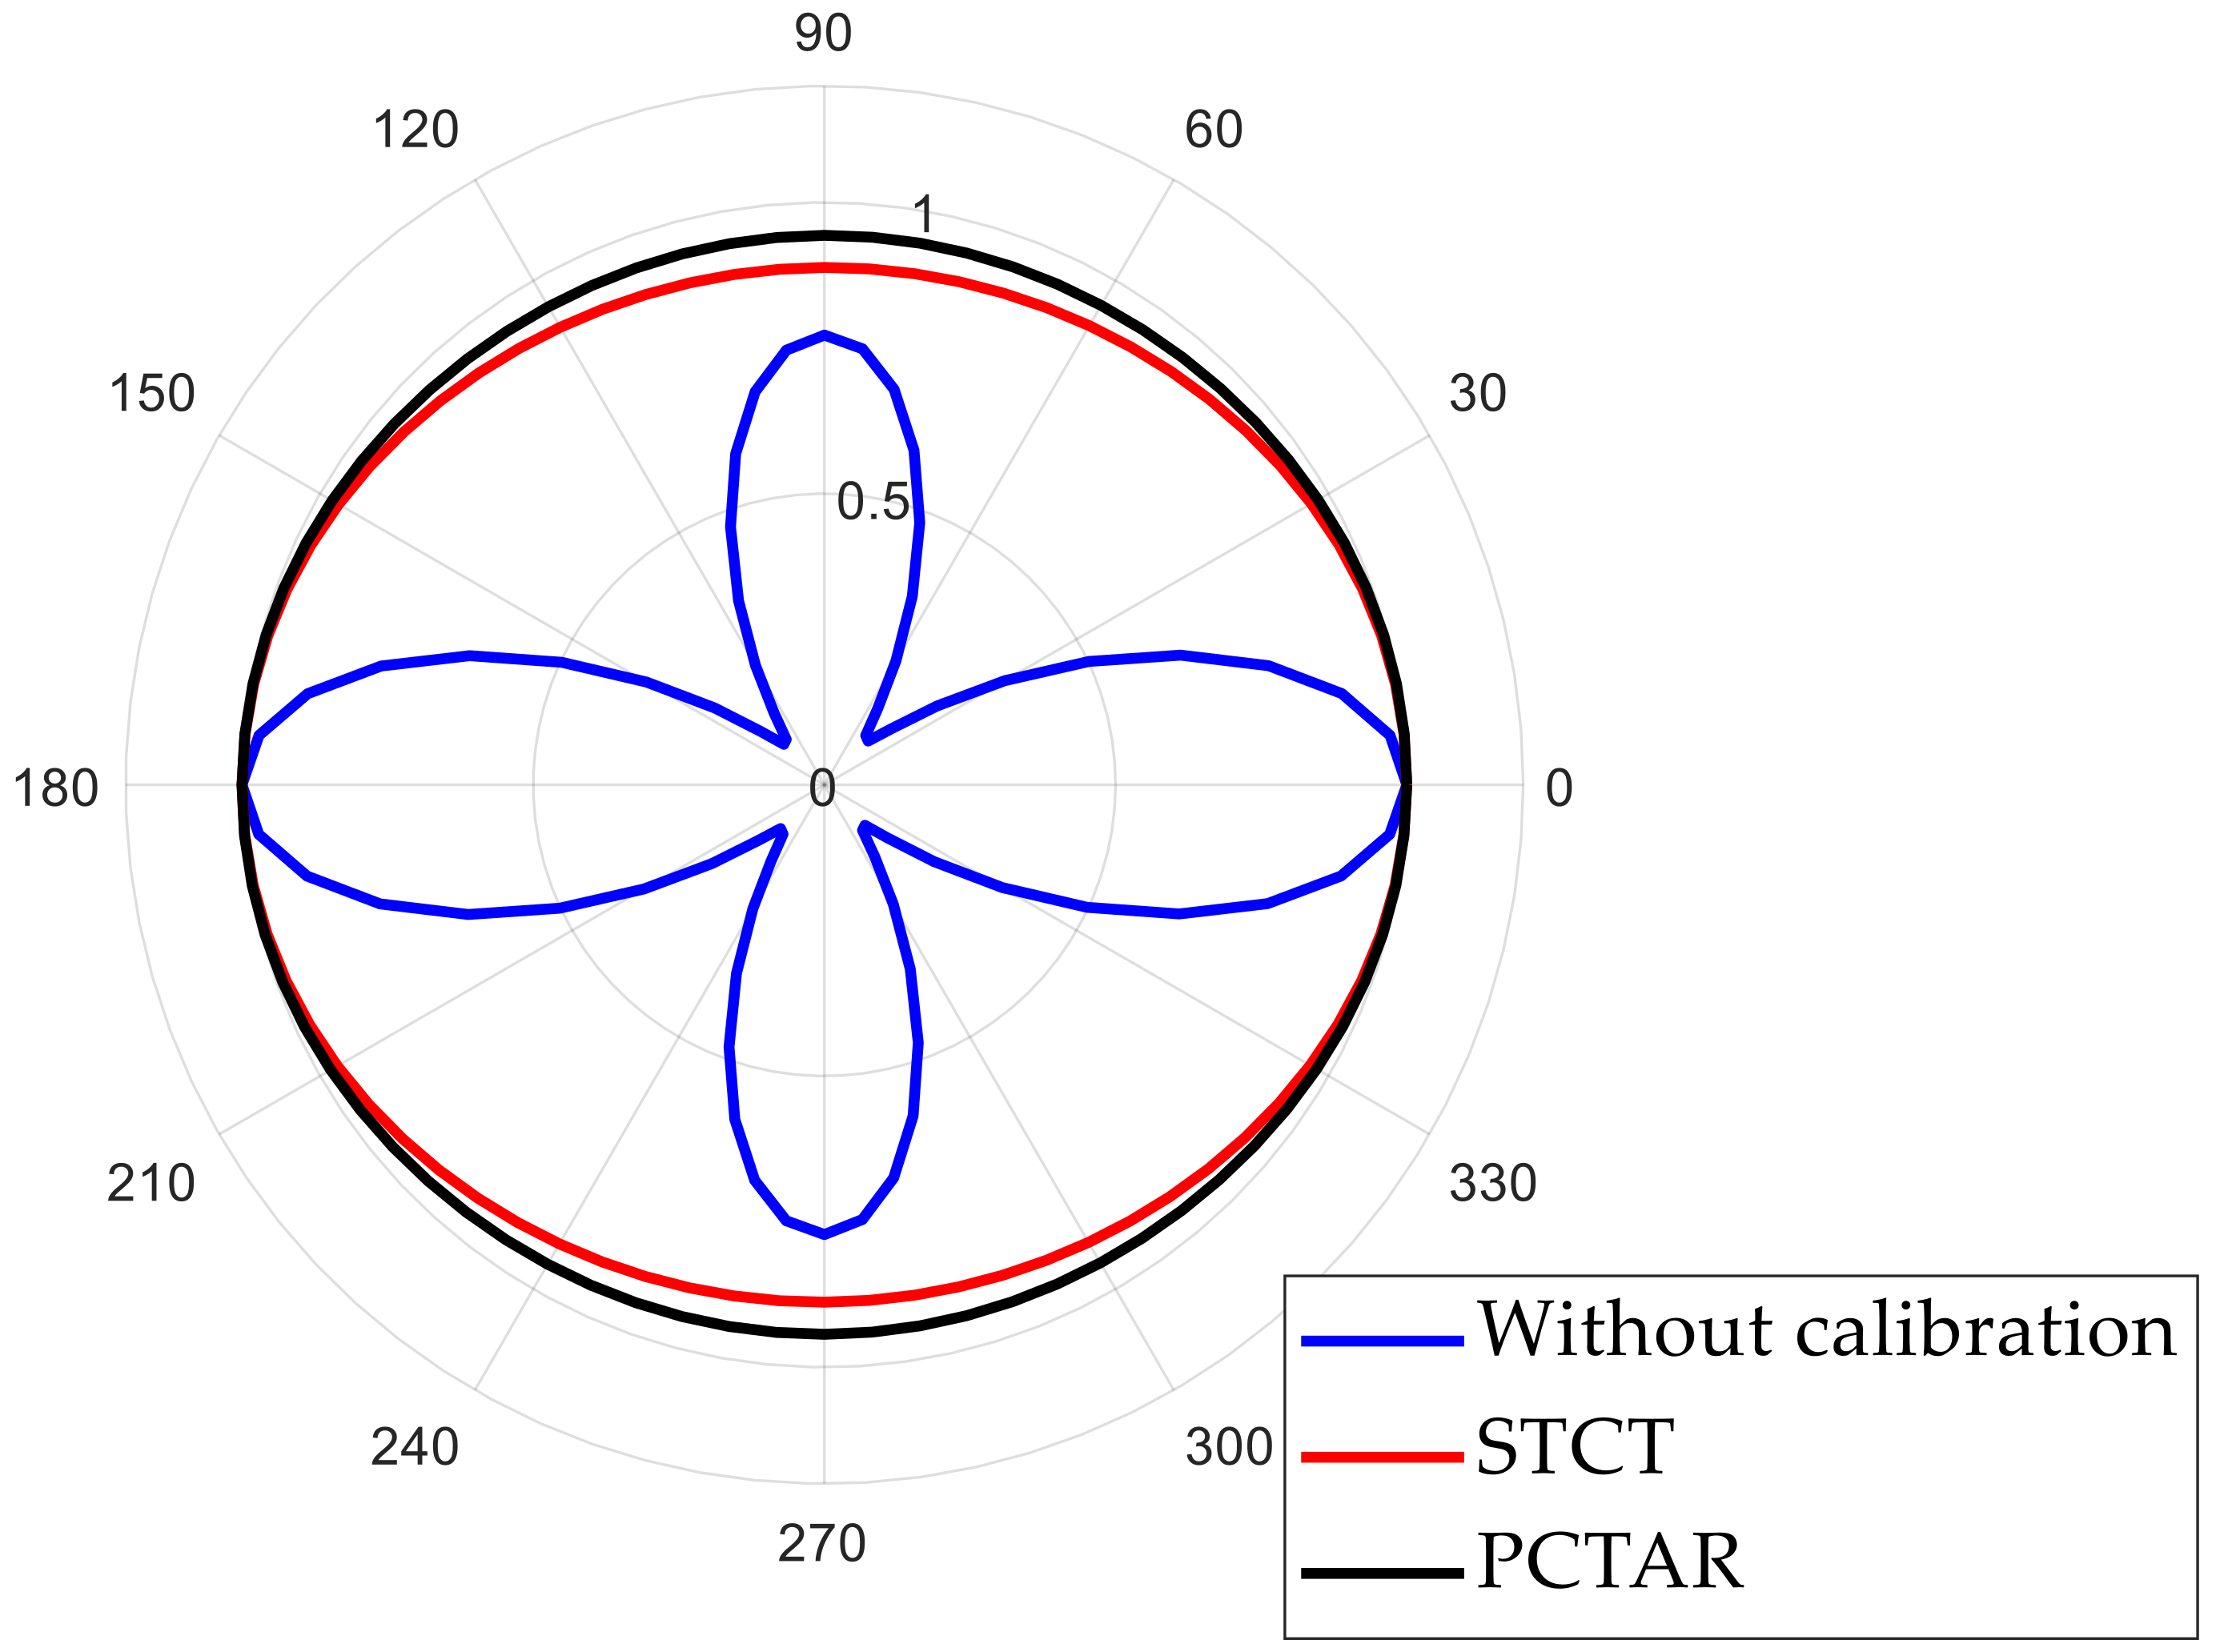
The polarization patterns of Target IV, an insect, without calibration (blue), calibrated with STCT (red), and calibrated with PCTAR (black) are shown in
Figure 12, respectively. As the true polarization pattern of the insect is unknown, the polarization pattern calibrated with STCT can be treated as the true value because the STCT has been fully verified. In fact, this is a typical shape of an insect polarization pattern [
13]. It can be seen that the polarization pattern calibrated with PCTAR is very close to that with STCT. This means that the calibration of PCTAR highly accurate, and can be used for an entomological radar.
6. Discussion
The traditional polarization calibration method requires a standard calibrator with a known theoretical PSM. The machining accuracy and posture errors of the calibrator will affect the calibration precision. This paper proposes a polarization calibration technique based on antenna rotation, which has no assumption for the target PSM. Therefore, this method avoids the errors introduced by calibrator. However, during the measurement, if the beam center is not aligned with the calibrator or the beam center is inconsistent with the rotation axis, PSM measurement error will be introduced and the calibration accuracy will be affected.
The effectiveness of the method is verified by simulation and an experiment. It should be pointed out that, although the calibrator used in the simulation is metal sphere, this method has no requirements for the calibrator form, and any form of calibrator can be used. For example, a wrench was used as the calibrator in the experiment, which realized a polarization calibration of high quality. Nevertheless, in order to reduce the influence of noise, it is recommended to use a target with a strong radar echo as the calibrator. Furthermore, it should be noted that, before the polarization calibration of the radar, it is necessary to calculate whether the radar works in the linear gain region for the calibrator and avoid errors caused by the saturation of the radar receiving channel.
The proposed method requires the radar to rotate along the beam center axis for at least one cycle. For an entomological radar with rotation function, the equipment cost and device cost of polarization calibration can be reduced. For the fully polarimetric radar without rotation function, it can be realized by rotating the calibrator, but this is usually difficult to realize.
The proposed method provides a novel idea for the polarization calibration of a fully polarimetric radar. As an extended application, the polarization calibration and correction of a radar system may be realized by using nonstandard calibration in nature, which will be a good future research topic.
7. Summary
The fully polarimetric entomological radar used to monitor the biological characteristics of airborne migratory insects has a requirement for the accuracy of the polarization measurement. A polarimetric calibration technique based on antenna rotation is designed in this paper, aiming to meet the requirement of high polarization calibration precision and solve the problem of inconvenient experimental operations for measuring the specific posture of a calibrator in the field environment. Based on this new method, the highly accurate polarization measurement of the fully polarimetric entomological radar is realized. Compared with other passive calibration techniques, there is no assumption of the calibrator PSM, and, therefore, the errors of the mechanical process introduced by the hypothetical calibrator PSM are avoided. In this paper, the fully polarimetric system model is first described, and the PCTAR method is proposed based on the model. The performance of the proposed method at different noise levels is analyzed by simulation. The influence on the calibration accuracy due to the offset of calibrator to the beam axis is analyzed based on theoretical derivation and simulation. In addition, the performances of the proposed PCTAR and the traditional STCT is compared under different SNRs. The simulation results show that the accuracy of the PCTAR technique is much higher than STCT. Finally, the effectiveness of PCTAR is verified based on a field experimental conducted with a fully polarimetric entomological radar. The experiment indicates that this method can be used for the real fully polarimetric radar.


 ,
, 
