Article

Remote Sensing Based Conservation Effectiveness Evaluation of Mangrove Reserves in China

1
State Key Laboratory of Resources and Environmental Information System, Institute of Geographic Sciences and Natural Resources Research, Chinese Academy of Sciences, Beijing 100101, China
2
University of Chinese Academy of Sciences, Beijing 100049, China
3
Land Satellite Remote Sensing Application Center (LASAC), Beijing 100048, China
*
Author to whom correspondence should be addressed.
Remote Sens. 2022, 14(6), 1386; https://doi.org/10.3390/rs14061386
Submission received: 31 December 2021 / Revised: 17 February 2022 / Accepted: 11 March 2022 / Published: 13 March 2022
(This article belongs to the Special Issue GIS and RS in Ocean, Island and Coastal Zone)

Abstract

:
In recent decades, the mangrove area in China has changed dramatically, and governments have established multiple mangrove protected areas at various levels. However, we know little about the effectiveness of conservation on mangroves on a national scale. In this study, we constructed an evaluation index system for landscape health and proposed a landscape health composite index (LHCI) to characterize the landscape health status of mangroves. Based on the distribution dataset of mangrove forests mangrove in the recent 40 years, we evaluated the conservation effectiveness of mangrove reserves in China from a perspective of landscape health. The dynamics of mangrove areas show that the mangrove area in 83% of the reserves increased after the establishment of reserves. Additionally, the increase in mangrove area in provincial-level, municipal-level, and county-level reserves was higher than that in national-level reserves, and the most significant increase in mangrove area was in Guangxi, followed by Fujian and Hong Kong. The evaluation results show that mangrove reserves have achieved outstanding conservation effectiveness in China, with 43% of the reserves significantly improving the landscape health status of mangroves and 35% of the reserves maintaining good condition. The reserves in Guangxi, Guangdong, and Fujian Provinces showed more significant protective effects. Specifically, the most effective reserves protecting mangroves were the Qi’ao Island reserve, Maowei Gulf reserve, and Enping reserve. This study may provide references for formulating a rapid evaluation method of conservation effectiveness based on remote sensing and promote the scientific management of protected areas and the ecological restoration of mangroves in China.

1. Introduction

Mangroves are essential wetland ecosystems with the characteristics of both terrestrial and marine ecosystems, widely distributed in the intertidal areas of tropical and subtropical regions of the world [1,2]. They have significant social, economic, and ecological values and provide a wide range of ecosystem services, such as water purification, shoreline stabilization, reducing coastal erosion, and maintaining biodiversity [3,4,5]. However, due to unreasonable economic development and human overexploitation in coastal areas, the area of mangroves in China has been drastically decreased since the 1950s [6]. The remaining mangroves are also under pressure from climate change and human activities, such as sea-level rise, biological invasion, seawall construction, and aquaculture [7,8,9]. Irreplaceable in ecological and socio-economic services, mangroves have become important targets for wetland conservation and biodiversity protection in China.
Establishing nature reserves is an effective measure to protect and manage mangrove resources [10]. At present, China has nearly 40 nature reserves with mangroves as the primary protection objects established by the state or local governments. Approximately 64% of mangroves are distributed within the nature reserves, and the coverage of the reserves is still expanding [11]. However, mangrove reserves in China started late and lacked systematic planning and design and management experience. Reserves mainly adopted a “rescuing protection” compulsory conservation policy, and the evaluation of its effectiveness was not given sufficient attention [12]. There are four different and complementary aspects in protected areas effectiveness evaluation, i.e., coverage [13,14], degree of detailed monitoring [15,16], management effectiveness [17,18], and conservation effectiveness [19,20]. Specifically, the coverage is an evaluation based on the scope of protection, the degree of detailed monitoring is an evaluation based on the monitoring method, the management effectiveness is an evaluation based on the management behavior, and the conservation effectiveness is an evaluation based on the protection objects of the protected areas. Previous studies on the effectiveness of reserves paid more attention to the evaluation of management effectiveness. According to preliminary statistics, there are about fifty evaluation methods for management effectiveness, which are mainly conducted through literature research, questionnaire surveys, interviews with managers, or expert scoring [17,21]. However, few studies were conducted to evaluate the conservation effectiveness of reserves, especially for mangrove reserves.
Remote sensing has been widely used in the multi-scale and long time-series monitoring of the ecological environment and natural resources, especially for inaccessible mangrove ecosystems [22,23,24]. Due to the characteristics of timely observations and large-area coverage, remote sensing also provides new perspectives and methods for the evaluation of conservation effectiveness [25,26]. A common method is to analyze the changes in the area indicators related to protected objects based on the land cover data obtained from remote sensing monitoring. For example, Wang et al. [27] tested the conservation effectiveness of 20 reserves in Hainan Island by comparing the changes in forest area in locations within the reserves, adjacent to the reserves, and far outside of the reserves. Jia et al. [28] analyzed the dynamics of mangrove areas in seven national reserves before and after the establishment of the reserves. The results showed that China’s mangrove forest conservation effectiveness is better than other Asian countries, and the mangrove area increased immediately after the reserves were established. Porter Bolland et al. [29] compared the annual deforestation rates of community-managed forests and protected forests and found that community-managed forests presented lower annual deforestation rates and higher conservation effectiveness than protected forests. Other studies also evaluated the conservation effectiveness from the perspective of vegetation productivity based on vegetation index or net primary productivity (NPP) data retrieved from remote sensing. For example, Tang et al. [30] used the normalized difference vegetation index (NDVI) to measure variations in plant productivity in the core, boundary, and surroundings of 1015 reserves over a 25-year period. The results suggested that reserves achieved good conservation effectiveness in protecting vegetation productivity. Zhang et al. [31] evaluated the effectiveness of 11 reserves in protecting the ecological environment by analyzing the differences of the NPP before and after the establishment of the reserves and inside and outside reserves.
Besides the area and vegetation productivity indicators, some researchers also evaluated the conservation effectiveness from a landscape perspective based on landscape metrics. Landscape metrics can objectively represent the spatial structure, configuration, and function of the landscape from different levels and perspectives in a quantitative manner, which has been proven to be a reliable indicator for evaluating the conservation effectiveness of reserves [32,33]. For example, Jia et al. [34] analyzed the dynamics of six landscape indices in the Futian reserve and the Mai Po reserve. The results showed that although the integrity and connectivity of mangrove patches improved in both reserves, the integrity of mangrove patches in Mai Po reserve was always higher than that in the Futian reserve, which indicated higher conservation effectiveness of Mai Po reserve. Lu et al. [35] used eighteen landscape metrics to construct an evaluation index system and evaluated the conservation effectiveness of five national wetland nature reserves in the Songnen Plain based on an information entropy model. They found that the natural wetland area of each reserve declined continuously during the study period, and the conservation effectiveness also showed a decreasing trend. In general, the effectiveness evaluation based on landscape metrics is easier to analyze, compare, and monitor than other qualitative methods. The diversity of landscape metrics (e.g., number, area, shape, distance, and connectivity) also makes the evaluation results more comprehensive and credible [36]. Although the methods mentioned above have been widely used and recognized, previous studies on the conservation effectiveness of mangrove reserves in China mainly focused on reserves at local scales, which were insufficient to understand the protection status of mangrove resources in China [37]. Therefore, it is of great practical significance and scientific value to evaluate the conservation effectiveness of mangrove reserves at a national scale, which can contribute to promoting the restoration of mangrove resources and strengthening the management of the reserves.
In this study, we constructed an evaluation index system for landscape health and proposed a landscape health composite index (LHCI) to characterize the landscape health status of mangroves. Based on China’s mangrove distribution dataset with high classification accuracy from 1978 to 2018, we analyzed the dynamics of mangrove landscape health status in 24 representative reserves and evaluated the conservation effectiveness from the perspective of landscape health. To the best of our knowledge, this is the first national-scale evaluation of the conservation effectiveness of mangrove reserves. The results can provide references for the scientific management and adequate protection of mangroves in China.

2. Materials and Methods

2.1. Study Area

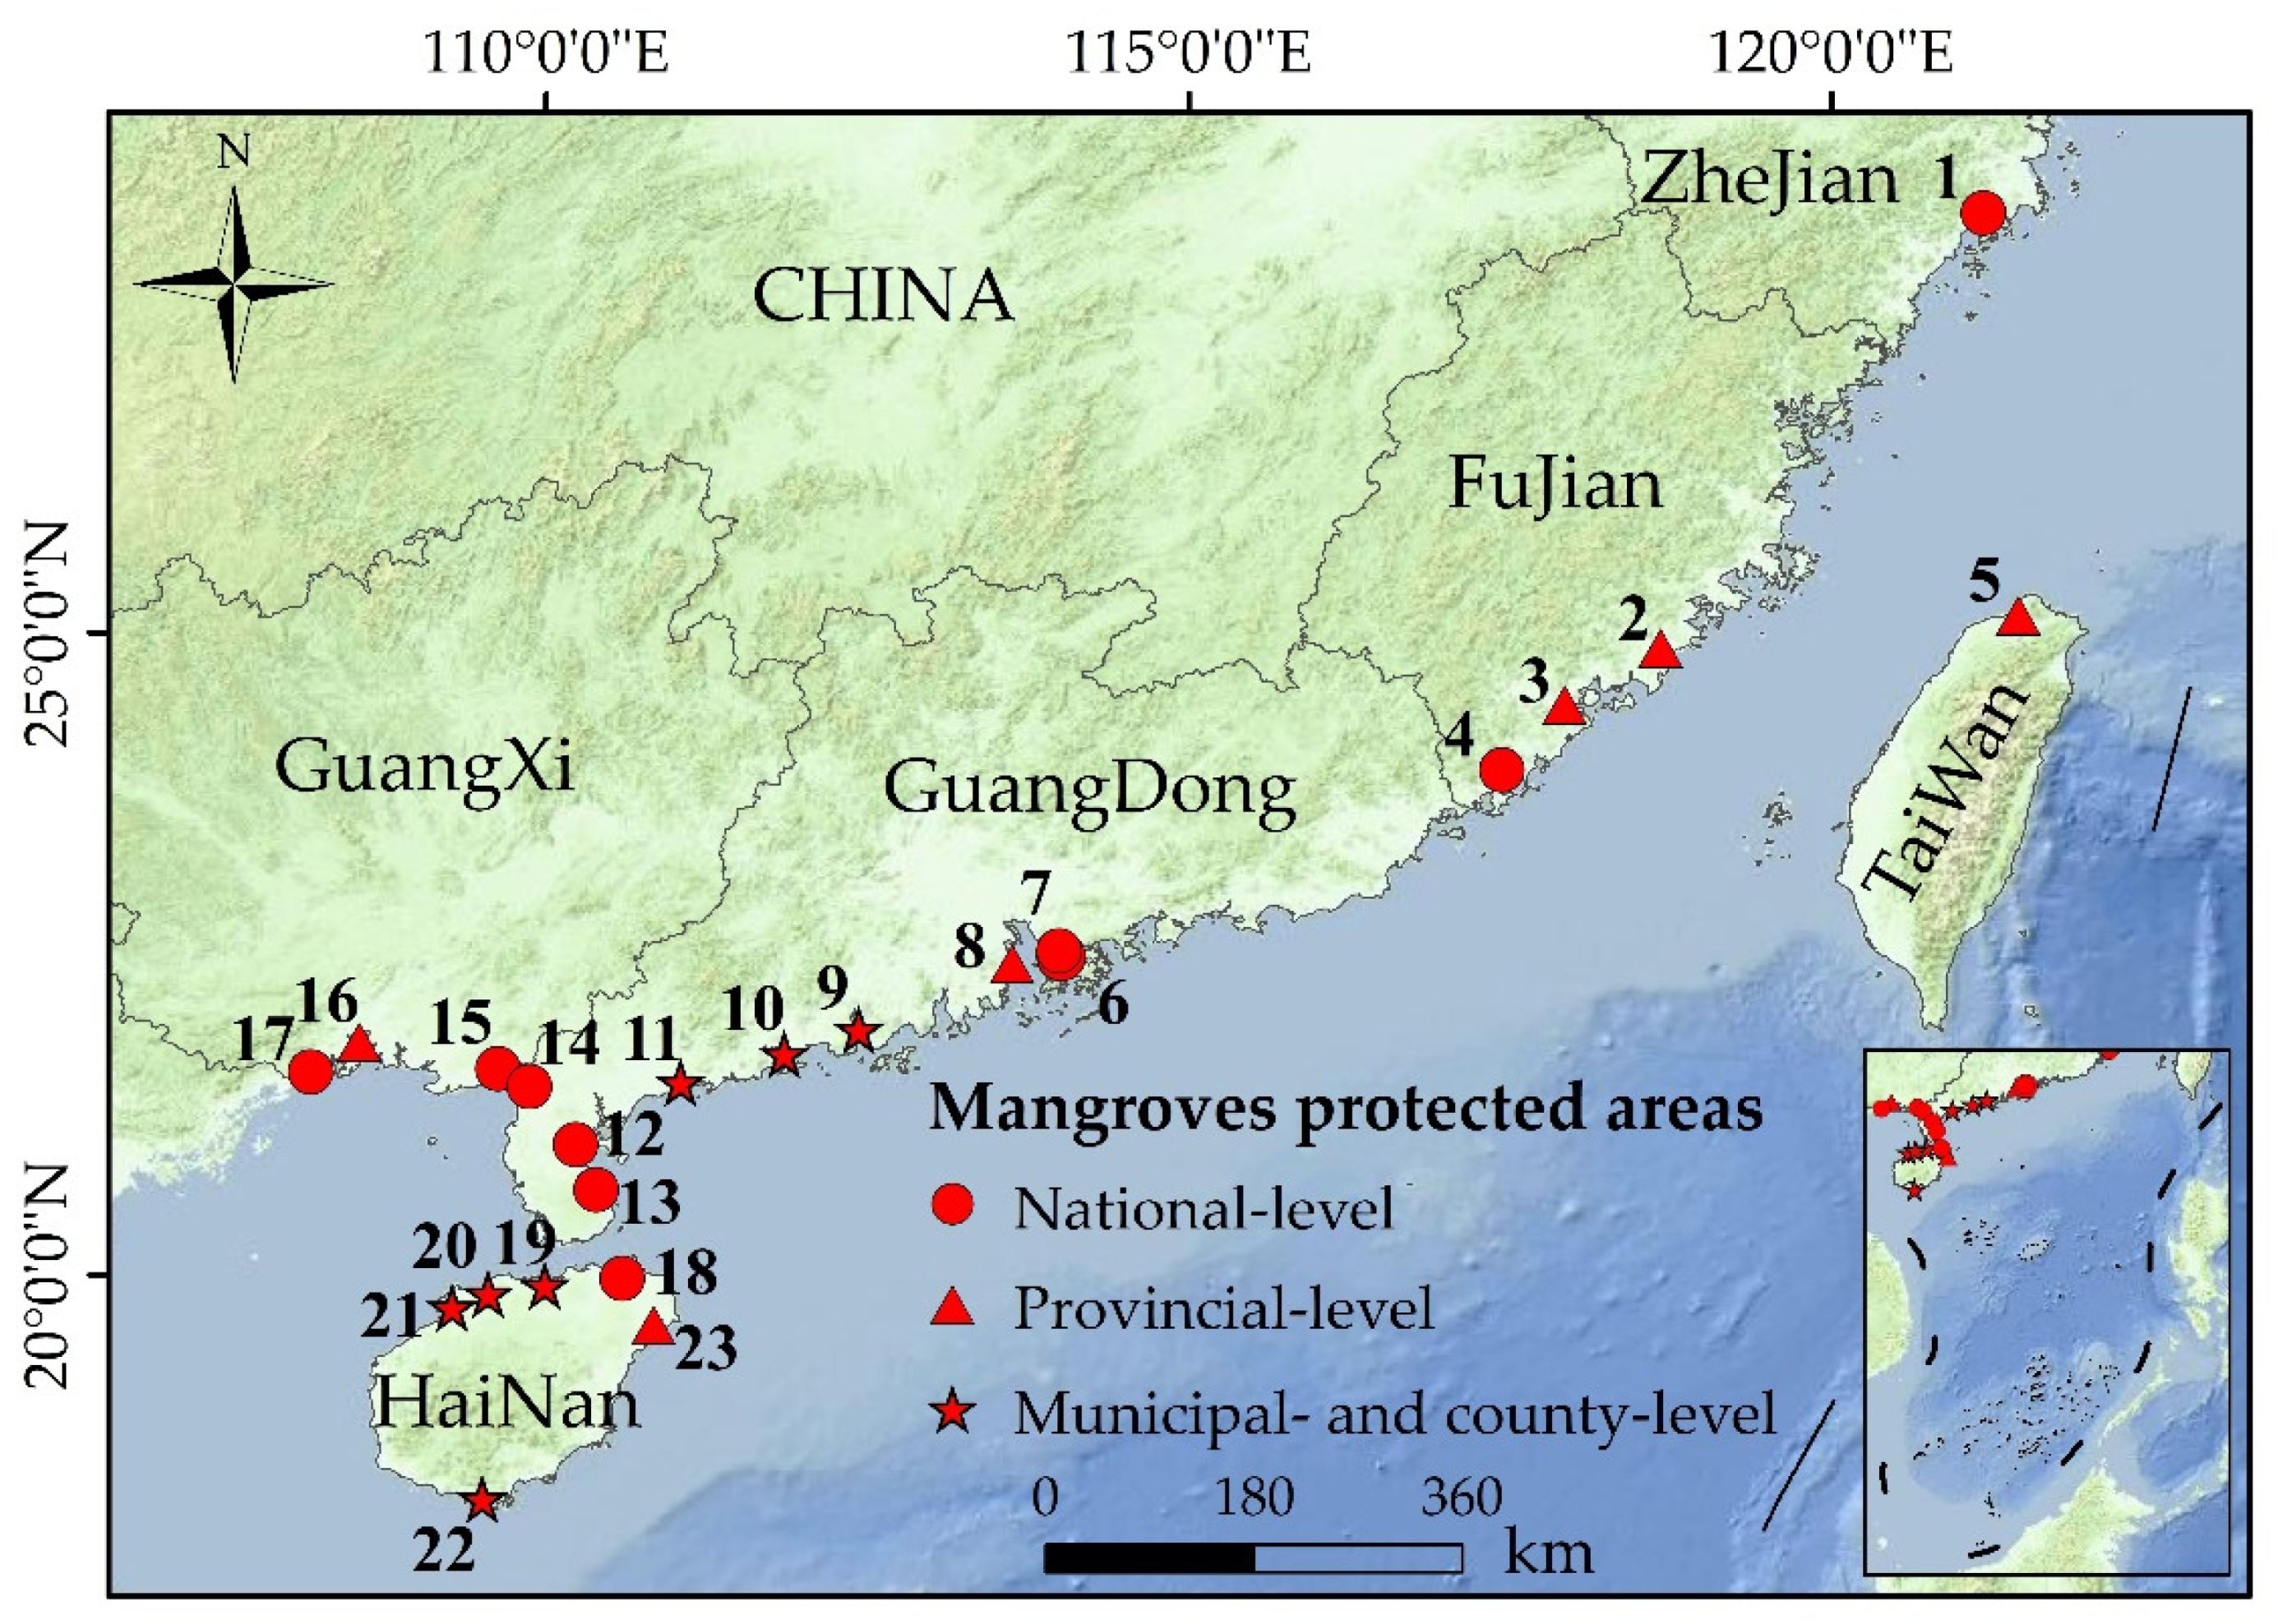
The study area covers six coastal provinces (Hainan, Guangxi, Guangdong, Fujian, Zhejiang, and Taiwan) and one special administrative region (Hong Kong). The geographical range of the study area is 18–29°N and 108–122°E (Figure 1). Yueqing County, Zhejiang Province, and Sanya City, Hainan Province, are the northernmost and southernmost boundaries of mangrove distribution in China, respectively. According to the spatial distribution characteristic of mangroves in China, 24 reserves (including 8 national-level reserves, 6 provincial-level reserves, and 10 municipal- and county-level reserves) with mangroves as the primary protection object were selected from the newest China Nature Reserves List and China Marine Reserve List (Table 1) [38,39].
Due to the particular situations of the establishment and management of reserves in China, most reserves have not announced clear boundaries. In this study, based on the location of mangrove reserves and the spatial distribution characteristics of mangroves, we comprehensively delineated the boundary of the key mangrove protection areas in each reserve for evaluating the conservation effectiveness of mangrove reserves in China. In addition, because the spatial distribution of mangroves in the Zhanjiang Reserve, Guangdong Province, was too scattered, we divided it into three zones with concentrated mangroves for evaluation, namely the Tongming Bay zone (reserve 12), the Xinliao–Hean zone (reserve 13), and the Gaoqiao–Anpu zone (reserve 14). The Enping Reserves and Zhenhai Bay Reserve in Guangdong Province (reserve 9) are two adjacent county-level reserves. Since the establishment time of these two reserves was very close and the contiguous area of mangroves at their boundaries was large, the two reserves were considered as a whole for evaluation. The Pinggang Reserves and Haoguang Reserves in Guangdong Province (reserve 10) and the Caiqiao Reserve and Dongchang Reserve in Hainan Province (reserve 20) were also evaluated as a whole for the same reasons. The Mai Po Marshes Reserve (reserve 6) was established by the Hong Kong Special Administrative Region, China, and was added as a Wetland of International Importance under the Ramsar Convention. Due to its high protection level for mangroves, it was classified as a national-level reserve in this study.

2.2. Mangrove Distribution Dataset

The long time-series China’s mangrove distribution dataset was collected from the Natural Resources Satellite Remote Sensing Cloud Service Platform, which included five periods of mangrove distribution data for 1978, 1990, 2000, 2013, and 2018 (the canopy density of the mangrove patches is greater than 20%, and the area is greater than 100 m2) [40,41]. First, the mangrove distribution data for 2018 (MC2018) was obtained using a hybrid method of object-based image analysis, visual interpretation, and field surveys based on 2 m high-resolution satellite images of GF-1 and ZY-3, with an overall accuracy of 99.3% [11]. Specifically, the object-based image analysis mainly included four steps: sample collection, image segmentation, image object classification, and post-processing, which were used for the primary extraction of mangrove plots. Visual interpretation and field surveys were conducted to refine the detected mangrove plots and evaluate the classification accuracy. Then, the MC2018 data were used as the basic reference data, and the mangrove distributions in 2013, 2000, 1990, and 1978 were interpreted using a reverse time order and step-by-step interpretation strategy [42,43]. In addition, considering the low resolution of the historical satellite images and the inability to conduct field surveys to refine the extraction results, three measures were implemented to ensure the classification accuracy: (1) comprehensive interpretation of mangroves combined with multi-tidal inundation information, (2) auxiliary identification of mangroves based on vegetation phenology information, and (3) collaborative interpretation of mangroves based on Google Earth historical high-resolution imagery. Table 2 presents the details of the satellite data used for interpretation in historical periods.

2.3. Methods

2.3.1. Construction of Evaluation Index System for Landscape Health

In order to comprehensively and accurately evaluate the conservation effectiveness of China’s mangrove reserves, we constructed an evaluation index system for landscape health. First, considering the objective of constructing the evaluation index system and the basic criteria of index selection, i.e., scientific, systematic, operational, and practical, thirteen landscape metrics were selected as evaluation indexes after a review of the literature concerning the application and ecological significance of landscape metrics [32,33,44,45,46]. These thirteen metrics constitute the preliminary evaluation index system, and they can characterize the landscape health status of mangroves in reserves from multiple aspects, including patch area, patch shape, patch distance, habitat fragmentation, and connectivity (Table 3).
In addition, according to the ecological significance represented by the indices, these indices were divided into two types: positive index (i.e., the higher the value, the better the landscape health) and negative index (i.e., the lower the value, the better the landscape health). For example, the complexity of patch shape can reflect the impact of human activities (e.g., population migration, urban expansion, and aquaculture) on mangroves, and human activities generally result in the simplification of patch shape [47,48]. Therefore, the increase in the patch shape complexity (a higher value) can indicate the effectiveness of mangrove conservation. The fragmentation of mangrove habitats may lead to a series of negative impacts on mangrove ecosystems, such as weakened stability, reduced service capacity, and reduced biodiversity [49,50]. Thus, the reduction of patch fragmentation (a lower value) can also reflect the positive conservation effect of the reserve on mangroves. Finally, since the inconsistent spatial resolution of the images used for interpretation in different periods, to prevent the uncertainty of the final evaluation results caused by scale effect, the shapefiles of five periods of mangrove distribution data were projected into 10 m raster data [51]. The spatial resolution was set to 10 m (i.e., a raster size was 100 m2) because the minimum patch size of mangroves extracted during the 2018 mapping procedure was 100 m2. Then, the selected landscape metrics were calculated using FRAGSTATS v4.2.1 software [52].
The reduction of landscape metrics in the preliminary evaluation index system was necessary to eliminate information redundancy, confusion, and duplication that may exist among them. In this study, a combination of correlation analysis and discrimination analysis was used to screen and optimize the preliminary evaluation index system by eliminating redundant landscape metrics [32,35]. First, a correlation analysis was carried out based on the Pearson correlation coefficient. If the correlation coefficient of a pair of metrics was greater than 0.9, a high correlation was considered to exist, and only one of the two metrics was retained. Following the correlation analysis, a discrimination analysis was carried out based on the coefficient of variation. The coefficient of variation can eliminate the influence of dimensional differences, and the degree of data dispersion between indices of different demission can be compared. The higher the value of the coefficient of variation, the greater the internal dispersion of the landscape index, i.e., the better the discrimination of the landscape index. If the coefficient of variation was less than 0.1, the landscape metric was considered to be poorly distinguishable, and it was eliminated from the preliminary evaluation index system. The formula of the coefficient of variation is as follows:
c v = σ j μ j
where c v is the coefficient of variation, σ j is the standard deviation of index j , and μ j is the mean value of index j .
The calculation results of the correlation coefficient and the coefficient of variation are given in Table S1. As a result, eight landscape metrics were retained to construct the final evaluation index system: TA, AREA_MN, SHAPE_MN, SHAPE_AM, PD, NP, ENN_MN, and CONTIG_MN.

2.3.2. Establishment and Calculation of the Landscape Health Composite Index

Although the eight representative landscape metrics in the final evaluation index system can reflect the landscape pattern from different aspects, the landscape health status of mangroves is not dependent on a single index but is influenced by them collectively. In order to comprehensively describe the landscape health status of mangroves, a landscape health composite index (LHCI) was established based on the entropy weight method. The entropy weight method is a commonly used weighting method to determine the weight of indices in a system based on information entropy by comprehensively measuring the amount of information provided by each index [53,54,55]. Unlike the subjective weighting method (e.g., Delphi method, analytic hierarchy process method), the entropy weight method can effectively avoid the distortion of weights caused by the interference of personal factors, ensuring the credibility and objectivity of the weight values. The primary process is as follows:
(1)
Constructing the original evaluation index matrix X:
X = ( x ij ) m × n
where m is the number of reserves, n is the number of evaluation indexes, and x ij is the j th index value of the i th reserve.
(2)
Performing data normalization to obtain the normalization matrix X . Data standardization can eliminate the differences among indices caused by the inconsistency of the dimension and direction. For positive index x ij :
x ij = x ij MIN ( x j ) MAX ( x j ) MIN ( x j )
For negative index x ij :
x ij = MAX ( x j ) x ij MAX ( x j ) MIN ( x j )
where x ij is the normalized value of x ij , MAX ( x j ) is the maximum value of the j th index, MIN ( x j ) is the minimum value of the j th index. Then, the normalization matrix X is obtained:
X = ( x ij ) m × n
(3)
Calculating the proportion value ( p ij ) of the i th reserve under the j th index:
p ij = x ij i = 1 n x ij
(4)
Calculating the entropy value ( e j ) of the j th index:
e j = 1 ln m i = 1 n p ij ln p ij
(5)
Calculating the difference coefficient value ( g j ) of the j th index:
g j = 1 e j
(6)
Calculating the weight value ( w j ) of the j th index:
w j = g j j = 1 n g j
(7)
Calculating the landscape health composite index value ( z i ) of the i th reserve:
z i = j = 1 n w j x ij

2.3.3. Assessment of Mangrove Dynamics

The dynamic change of mangrove areas is an objective and direct reflection of the conservation effectiveness and the evolution of mangrove landscape patterns. To objectively analyze and evaluate the dynamic degree of mangroves, we calculated the annual land change rate (ALCR) of mangroves [56]. The formula of ALCR is as follows:
ALCR = S a S b S b × 1 T × 100 %
where S b represent the area of mangroves at the time point before the reserve was established. S a  represent the area of mangroves at the end of the study period, i.e., 2018. T is the number of years from the time point before the establishment of the reserve to the time point at the end of the study period.

2.3.4. Evaluation of Mangrove Conservation Effectiveness

In this study, we chose four indicators to analyze the dynamic changes of mangrove landscape health status for the period before and after the establishment of reserves: the amplitude of LHCI ( C ), the amplitude ratio of LHCI ( C r ), the slope of LHCI ( k 1 ), and the slope of the amplitude ration of LHCI ( k 2 ) [31]. The conservation effectiveness of mangrove reserves in China was evaluated based on the analysis results.
Since the establishment time of each reserve varied greatly (the earliest was 1975, the latest was 2005), we defined the time point before protection ( T b ) (i.e., the time point before the reserve was established) by taking into account the establishment time of each reserve and the time point contained in the mangrove distribution dataset. The definition of the time point before and after protection is shown in Table 4. In addition, the mangroves in the Ximen Island reserve were artificially introduced and planted, and there were no natural mangroves before the establishment of the reserve (i.e., 2005). Therefore, its T b was defined as the year closest to the establishment time of the reserve (i.e., 2013). The Mai Po reserve was established in 1975, earlier than the start time of the mangrove distribution dataset. Therefore, its T b was also defined as the year closest to the establishment time of the reserve (i.e., 1978). Finally, the time point after the protection ( T a ) of each reserve was defined as 2018.
The amplitude of LHCI ( C ) is the difference between the value of LHCI at Ta and the value of LHCI at Tb, i.e., the net increase or decrease in the LHCI. A positive value indicates the improvement of mangrove landscape health status after protection, and a negative value indicates the deterioration of mangrove landscape health status after protection. The amplitude ratio of LHCI ( C r ) is the ratio of the C to the value of LHCI at Tb, which characterizes the significant degree of the improvement or deterioration of mangrove landscape health status after protection. The slope of LHCI ( k 1 ) is the slope of the line fitted by the value of LHCI at each time point from Tb to Ta, which characterizes the changing trend of the LHCI after protection; a positive value indicates an increasing trend of LHCI, and a negative value indicates a decreasing trend of LHCI. The formula of C and C r are as follows:
C = Z a Z b
C r = C Z b × 100 %
where Z b and Z a are the value of LHCI at T b and T a , respectively.
In addition, although some reserves have not significantly improved the landscape health status of mangroves in the short term after protection (i.e., C < 0 ), they have effectively mitigated the deterioration trend of landscape health status, and their conservation effects should also be recognized. Therefore, the amplitude ratio of LHCI for each period from T b to T a ( C r i ) of the reserve was also calculated. The formula of C r i is as follows:
C i = Z m i Z n i
C r i = C i Z n i × 100 %
where Z n i and Z m i are the value of LHCI at the beginning and end of the i th period from T b to T a . Finally, the slope of the amplitude ratio of LHCI ( k 2 ) is the slope of the line fitted by the value of C r i , which characterizes the changing trend of the decreased degree of LHCI after protection. A positive value indicates that the decreased degree of LHCI is weakening, and a negative value indicates that the decreased degree of LHCI is still increasing.

3. Results

3.1. Dynamics of Mangrove Area after Protection

The net change area and ALCR of mangroves in each reserve are shown in Table 5. In general, although the area of mangroves in a few reserves still decreased to a certain extent after the reserves were established, most reserves showed an increasing trend in the mangrove area. Specifically, the mangrove area in 83% of the reserves increased after protection, among which the most significant increase in mangrove area is the Qi’ao Island (reserve 8), with an ALCR of 50.82% and a net increase of 503.11 ha. In addition, the area of mangroves in Jiulong Estuary (reserve 3) and Maowei Gulf (reserve 16) also increased notably, with an ALCR of 7.82% and 7.81%, respectively. However, the mangrove area did not increase in the four reserves after protection: Qinglan (reserve 23), Huachang Bay (reserve 19), Xinying Bay (reserve 21), and Tongming Bay (reserve 12), which were mainly concentrated in the northern part of Hainan Province. Notably, the mangrove area changes in different zones of the Zhanjiang reserve varied considerably after the reserve was established. The mangrove area in Xinliao–Hean (reserve 13) and Gaoqiao–Anpu (reserve 14) both increased, while the mangrove area in Tongming Bay (reserve 12) decreased significantly.
The statistics of mangrove area changes in the reserves of different levels and districts before and after protection are shown in Table 6 and Table 7. The total mangrove area in reserves increased from 16,005.33 ha to 17,460.95 ha after protection, with a net increase of 1455.62 ha. From the perspective of mangrove area changes in the reserves of different levels, the increase in mangrove area in provincial-level, municipal-level, and county-level reserves was higher than that in national-level reserves. The most significant change of mangrove area was in the provincial-level reserves, which increased by 1370.46 ha. In contrast, the change of mangrove area in national-level reserves was not significant. From the perspective of mangrove area changes in the reserves of different districts, the most significant increase in mangrove area after protection was in Guangxi Province, where the total mangrove area of reserves increased by 2259.89 ha, followed by Fujian and Hong Kong. In addition, the total mangrove area in the reserves of Taiwan and Zhejiang Province also increased, while the total mangrove area in the reserves of Hainan and Guangdong Province still decreased.
The ALCR and the dynamics of mangrove areas in reserves after protection can characterize the conservation effectiveness to a certain extent. However, area indicators alone cannot fully reflect the changes in mangrove landscape quality or landscape health status. For example, mangrove forests that experienced severe damage can rapidly increase their area by artificial planting. However, problems such as the aggravation of landscape fragmentation and poorer habitat connectivity caused by external damage are difficult to recover quickly in a short period. Therefore, it is one-sided and incomprehensive to evaluate the conservation effectiveness of mangroves based only on the area indicator.

3.2. Conservation Effectiveness of Mangrove Reserves in China

3.2.1. Analysis of Conservation Effectiveness in Mangrove Reserves

The establishment of China’s mangrove reserves focused on factors including the spatial distribution characteristics of mangroves and the “rescuing protection” of mangroves. Therefore, taking the establishment time of the reserve as the node, we comprehensively evaluated the reserves’ conservation effectiveness on mangroves based on the dynamics of the mangrove landscape health status for the period before and after the establishment of the reserves. The dynamics of mangrove landscape health status in each reserve can be divided into the following four patterns.
(1)
C > 0 and k 1 > 0 , representing that the LHCI was net increased after protection and showed a continuously increasing trend. In this pattern, the landscape health status of mangroves improved significantly compared to that before the reserve was established and maintained a constant positive trend, indicating that the reserves achieved remarkable conservation effectiveness on mangroves. There are ten reserves (reserves 2, 3, 8, 9, 10, 14, 15, 16, 18, and 22) that conformed to this pattern. Among them, the Cr of the Qi’ao Island (reserve 8), Maowei Gulf (reserve 16), and Enping (reserve 9) reached 519.78%, 45.01%, and 25.65%, respectively, which were the three most outstanding reserves in terms of conservation effectiveness.
(2)
C > 0 and k 1 < 0 , representing that the LHCI was net increased after protection but showed a decreasing trend. In this pattern, the landscape health status of mangroves improved compared to that before the reserve was established, indicating that the reserves achieved good conservation effectiveness on mangroves. However, the landscape health status of mangroves did not maintain a positive trend, i.e., the LHCI only increased greatly in isolated periods and then decreased. The reserve that conformed to this pattern was Caiqiao (reserve 20), which needs attention.
(3)
C < 0 and k 2 > 0 , representing that the LHCI was decreased after protection, but the decreasing trend continuously slowed down. In this pattern, the landscape health status of mangroves gradually turned better after the reserve was established, indicating that the reserves achieved a certain protective effect while the conservation effectiveness was relatively insignificant. There are seven reserves (reserves 4, 7, 11, 12, 19, 21, and 23) that conformed to this pattern. Among them, the latest C r i in Zhangjiang Estuary (reserve 4), Futian (reserve 7), Tongming Bay (reserve 12), and Huachang Bay (reserve 19) has turned from negative to positive in recent periods. The protection and restoration of mangroves in these reserves should be further enhanced to accelerate the improvement of the landscape health status of mangroves.
(4)
C < 0 and k 2 < 0 , representing that the LHCI was still decreased after protection, and the decreasing trend did not slow down. In this pattern, the landscape health status of mangroves did not improve obviously compared to that before the reserve was established, indicating that the conservation effectiveness on mangroves was ordinary. Five reserves (reserves 1, 5, 6, 13, and 17) conformed to this pattern, and special attention and focus to these reserves needed to be strengthened.
Based on the four patterns of the dynamics of mangrove landscape health status in reserves, conservation effectiveness can be categorized into three levels: excellent, good, and ordinary (Table 8). The results show that mangrove reserves in China achieved outstanding conservation effectiveness, with 43% of the reserves significantly improving the landscape health status of mangroves, 35% of the reserves maintaining good mangrove landscape health status, and only 22% of the reserves having ordinary protection efficacy. The detailed evaluation results of each reserve are shown in Table S2.

3.2.2. Comparison of Conservation Effectiveness in Different Levels of Reserves

The statistics of reserves’ evaluation results based on protection level are shown in Table 9. The results showed that 60% of the national-level reserves, 83% of the provincial-level reserves, and all the municipal- and county-level reserves were excellent and good reserves, which showed remarkable conservation effectiveness of mangrove reserves in China. In addition, the Gaoqiao–Anpu (reserve 14) at the national level, the Qi’ao Island (reserve 8) at the provincial level, and the Enping (reserve 9) at the county level were the most effective in protecting mangroves among each level of reserves, with the C r of 12.13%, 519.78%, and 25.65%, respectively. In general, the conservation effectiveness of provincial-, municipal-, and county-level reserves was more significant than the national-level reserves, with excellent reserves accounting for 66% and 57%, respectively.

3.2.3. Comparison of Conservation Effectiveness in Different Districts of Reserves

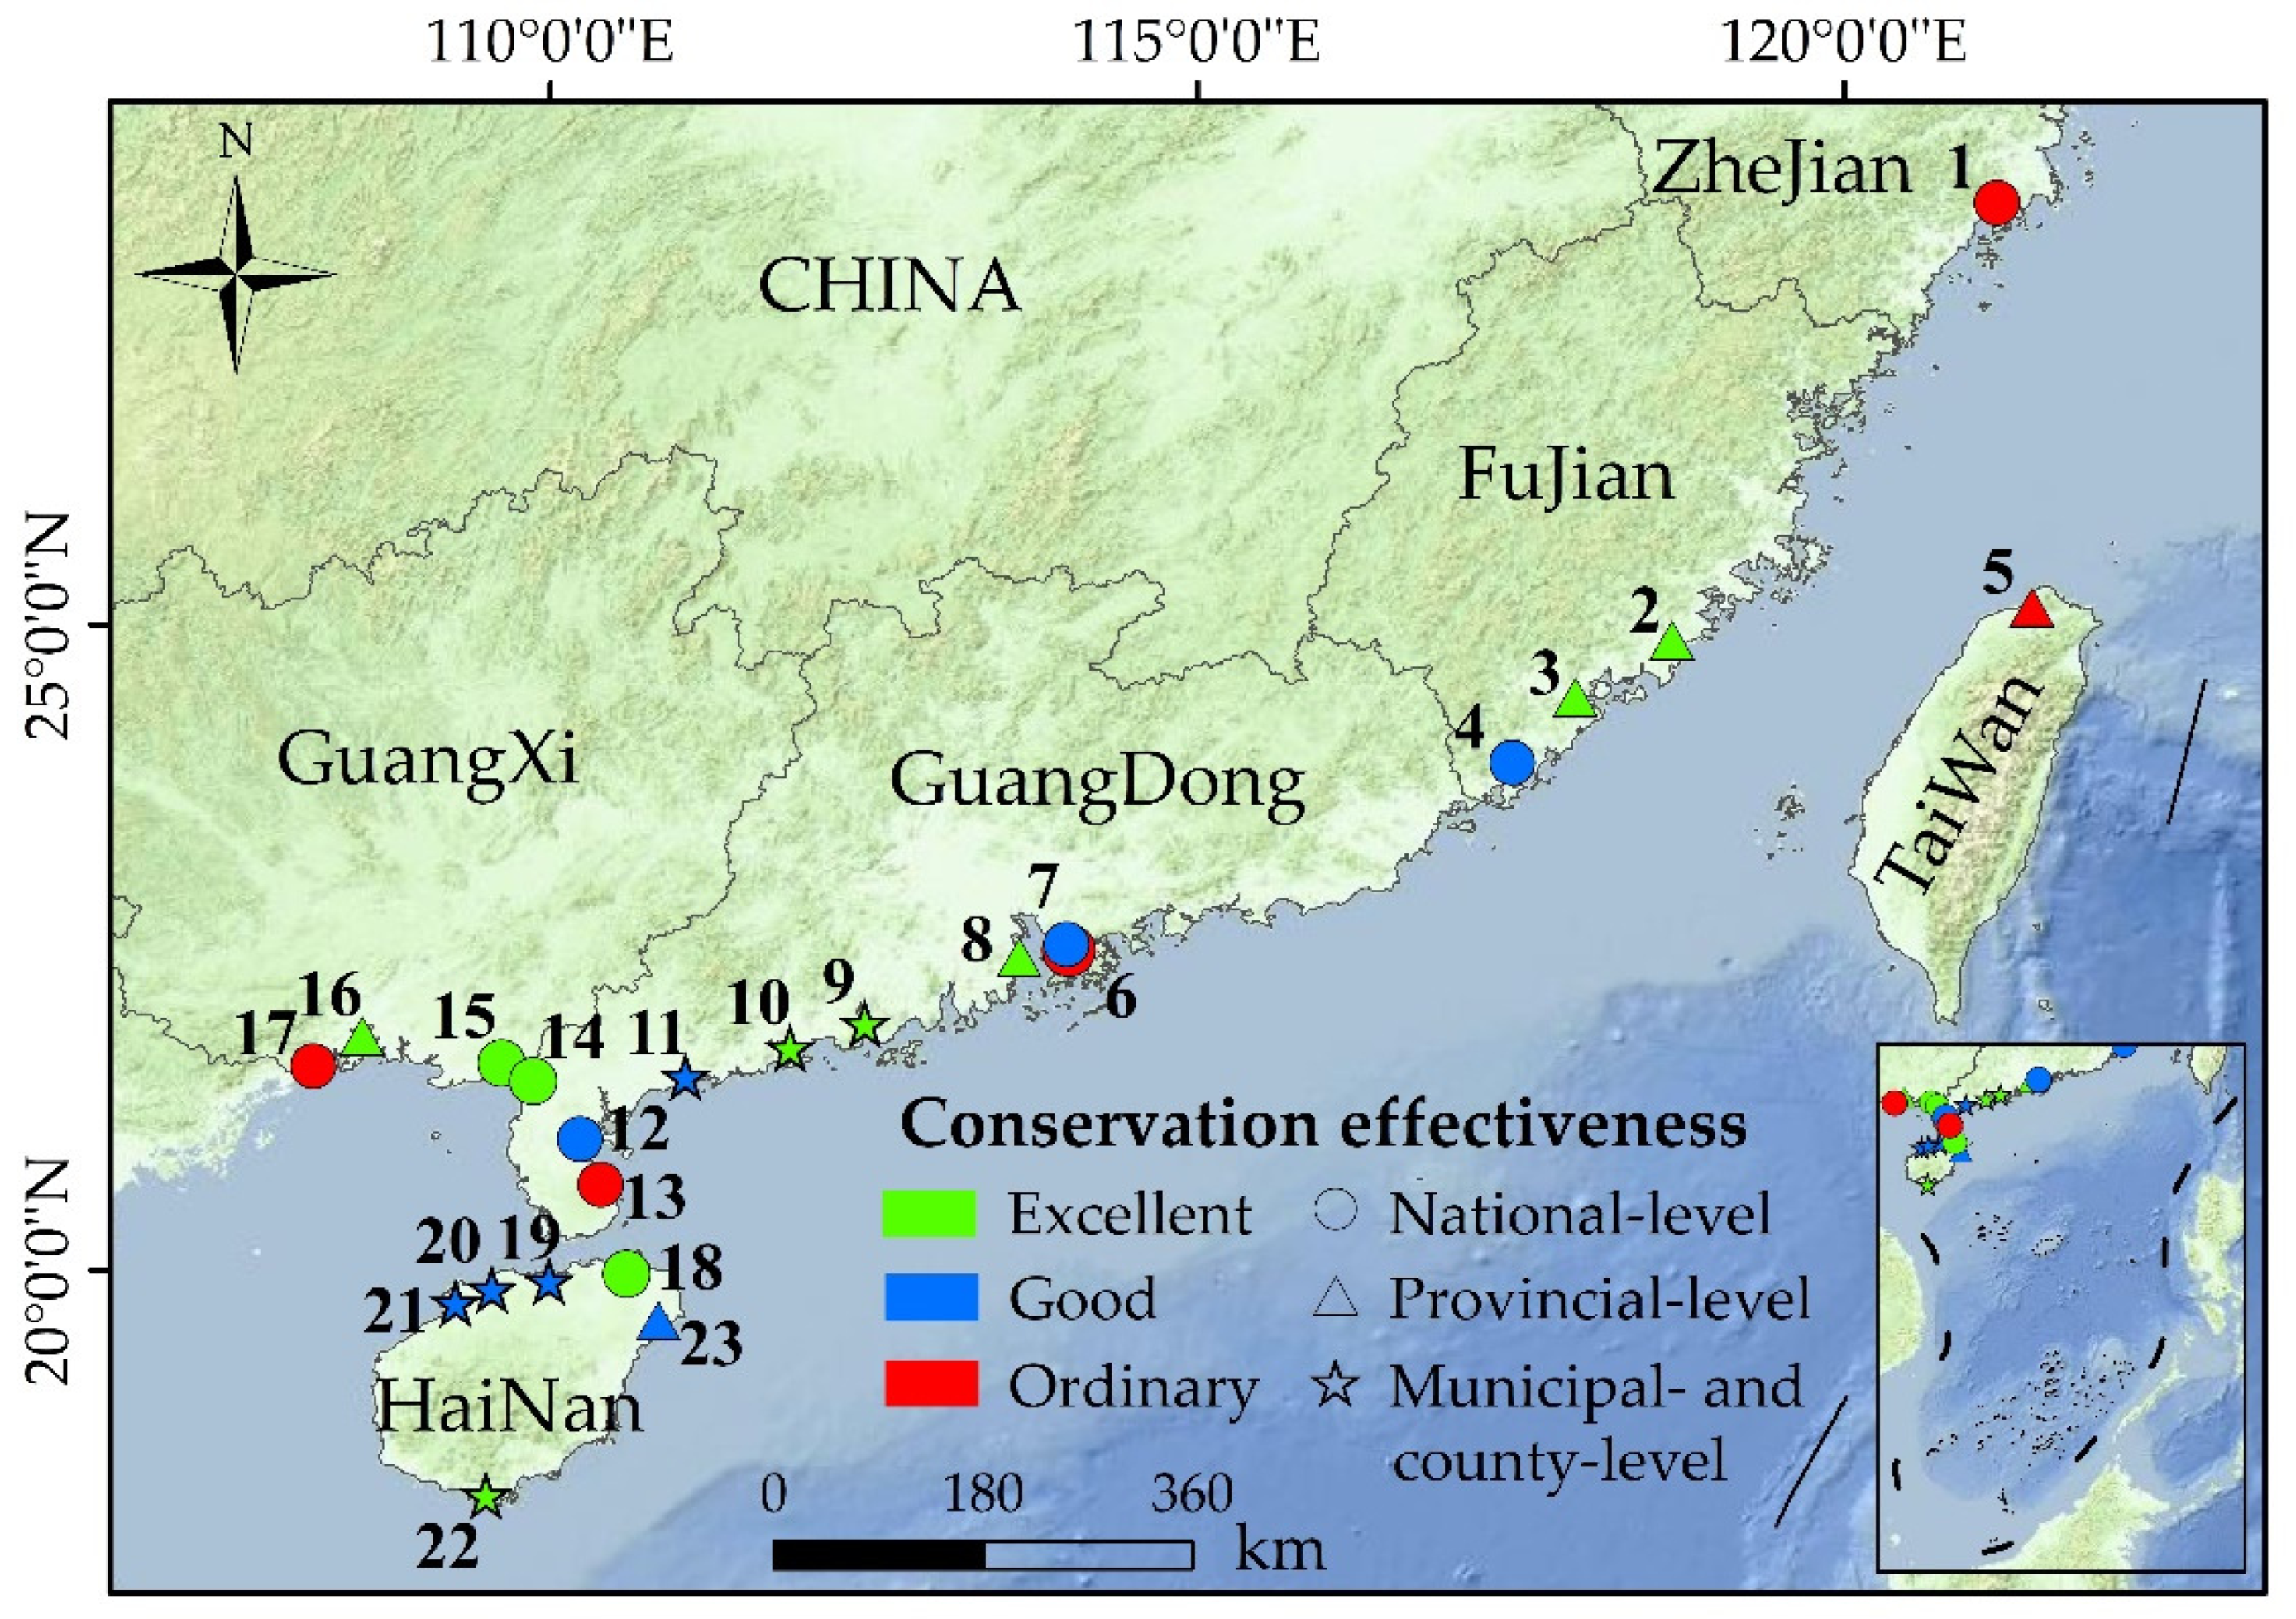
From the evaluation results of mangrove reserves in each province (Figure 2), the reserves in Guangxi, Guangdong, and Fujian Provinces are the most effective in protecting mangroves, with the proportion of excellent reserves at 50% and above. From the changes of the LHCI before and after the establishment of reserves in different provinces (Figure 3), the LHCI increased the most in Guangxi and Guangdong Provinces, followed by Fujian Province, which indicated that the reserves in Guangxi and Guangdong Provinces have larger conservation effectiveness than those in other provinces. There is a clear outlier in Guangdong Province (Figure 3), which represents the Qi’ao Island, the earliest reserve where mangrove planting was carried out in China. Before protection, the local mangroves were severely destroyed by human activities (e.g., urbanization). After establishing the reserve, the government invested special funds to carry out mangrove species introduction and mangrove reforestation projects. The landscape health status of mangroves has been significantly improved. Therefore, the LHCI of the reserve showed a dramatic improvement accordingly.
Considering the specificity of the spatial distribution of mangrove forests in the Zhanjiang reserve, we divided it into three zones with concentrated mangroves for evaluation. The results show that the effectiveness of conservation on mangroves in Gaoqiao–Anpu, Tongming Bay, and Xinliao–Hean was excellent, good, and ordinary, respectively. Given the obvious zonal differences in the evaluation results of the Zhanjiang reserve, we take the Zhanjiang reserve as an example to conduct an in-depth analysis of the temporal and spatial evolution of the mangrove landscape pattern in each zone to verify the reliability of the evaluation results.
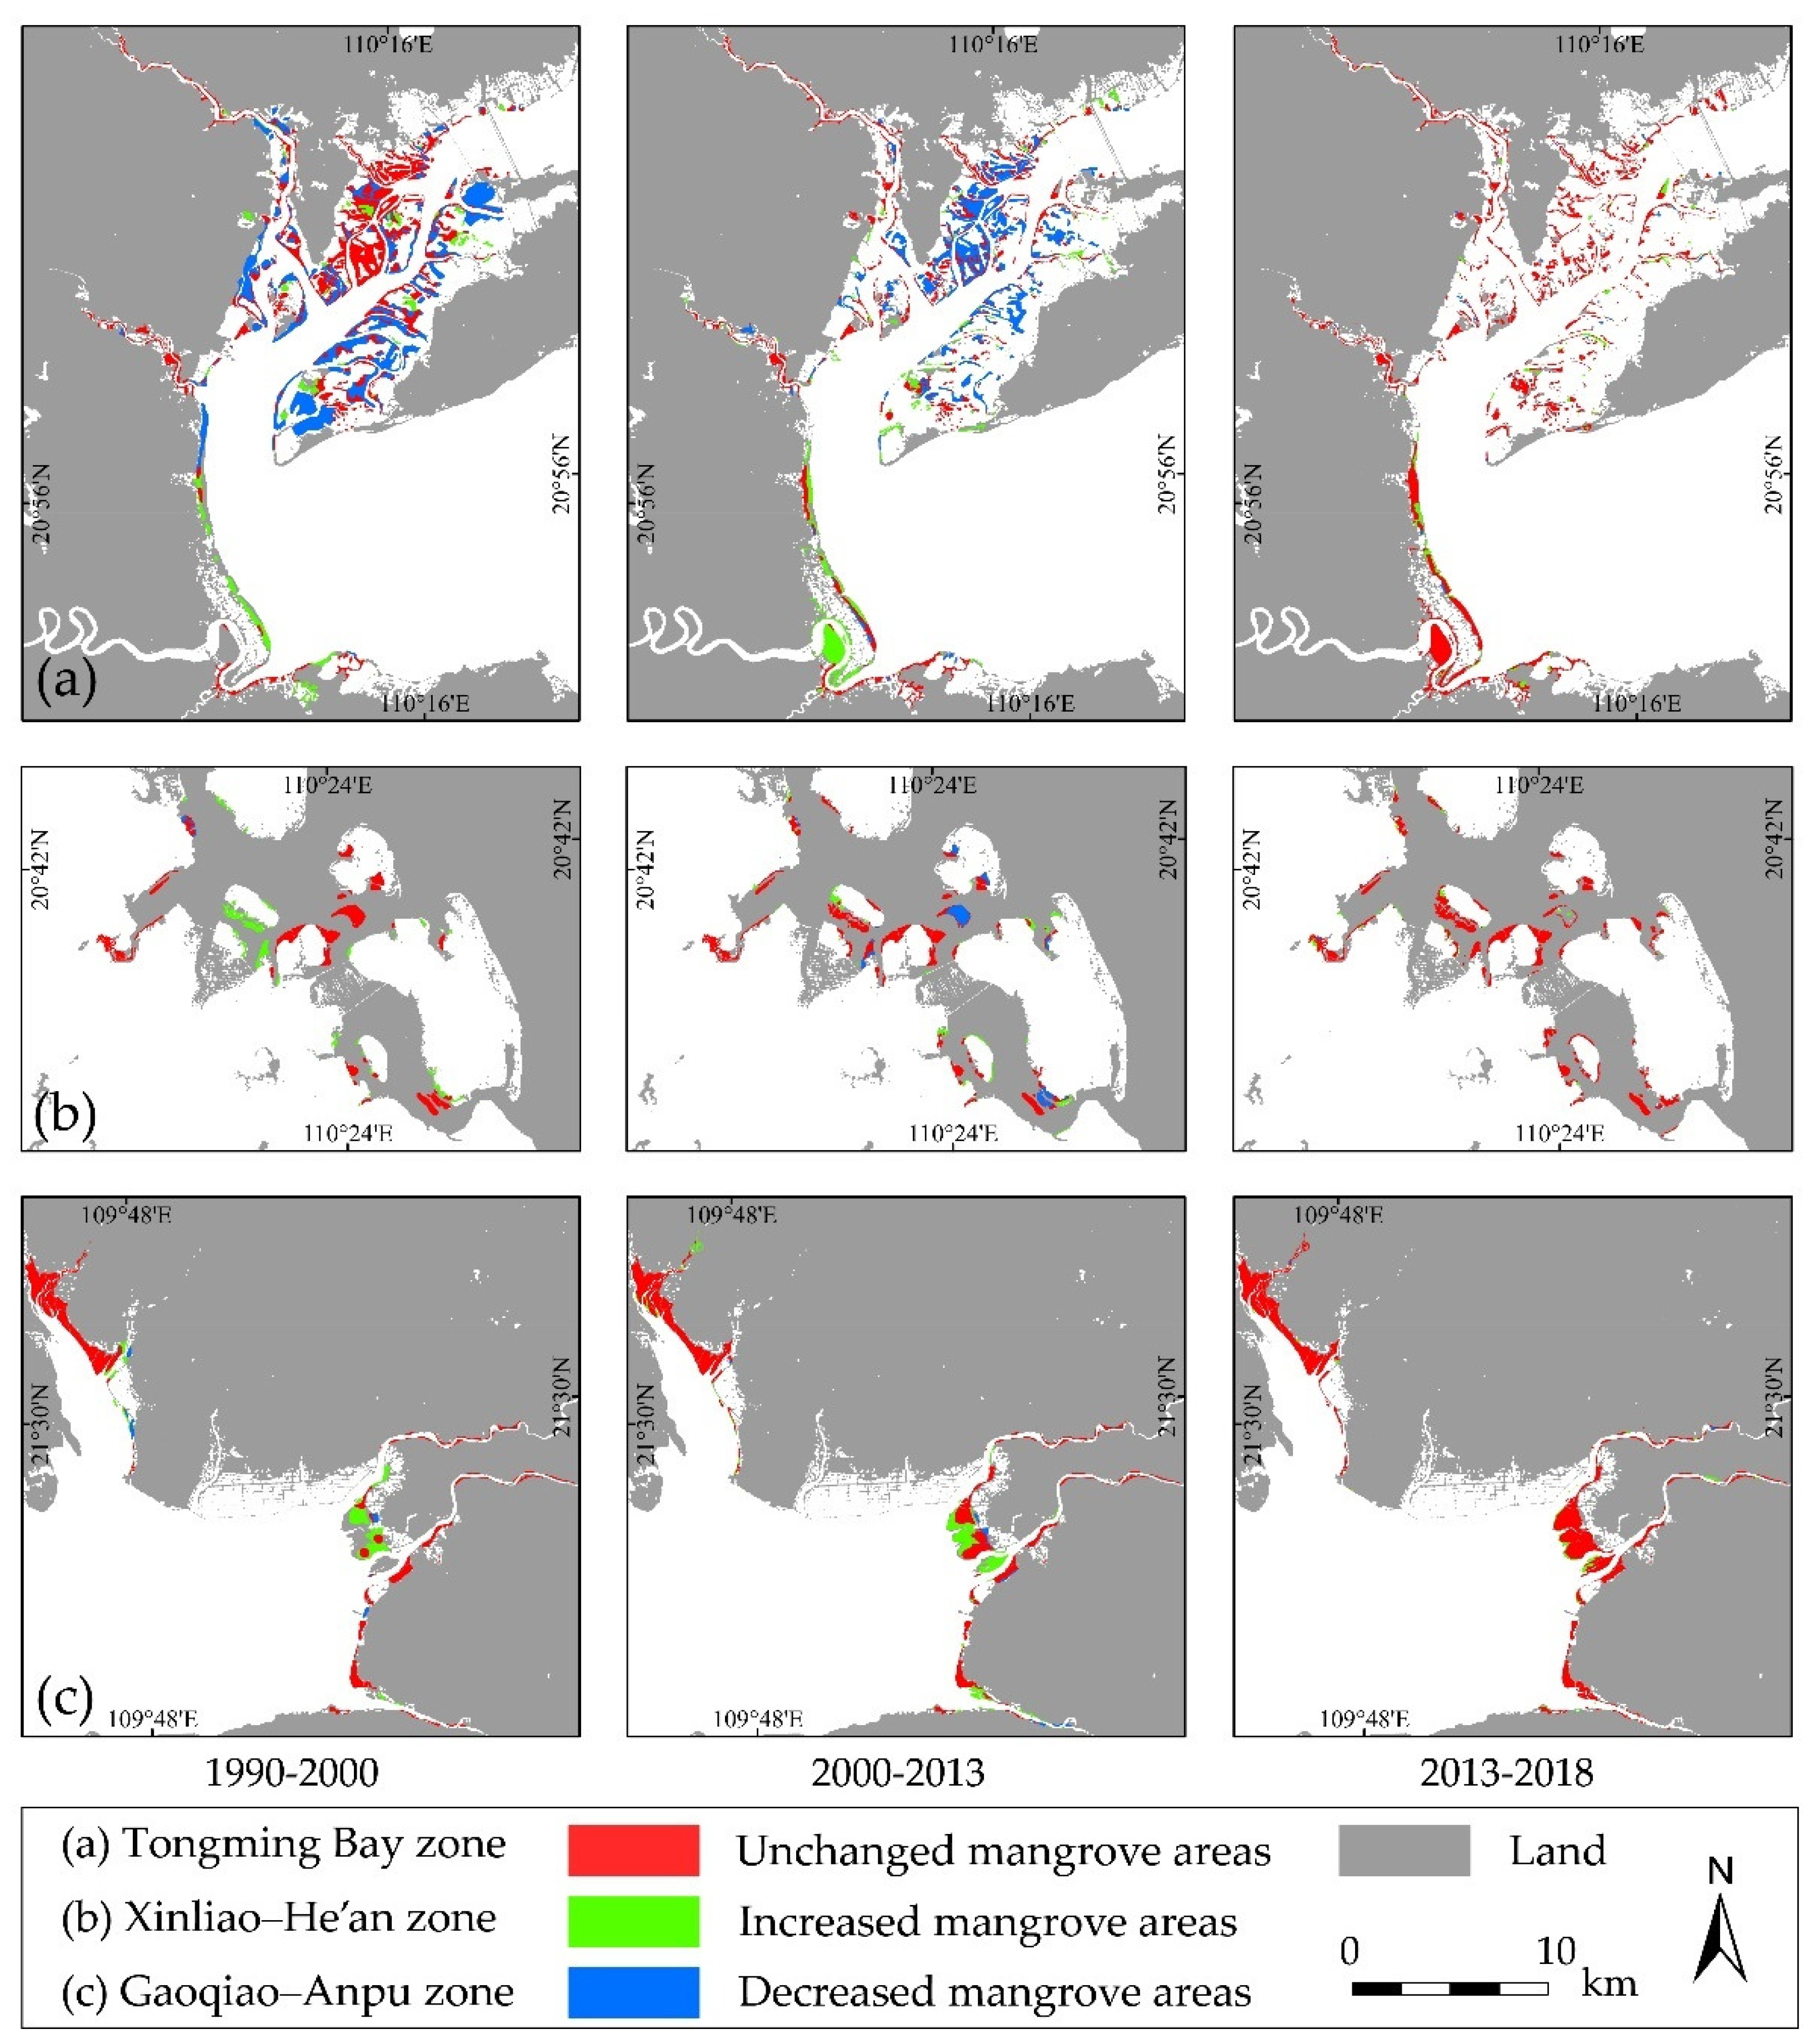
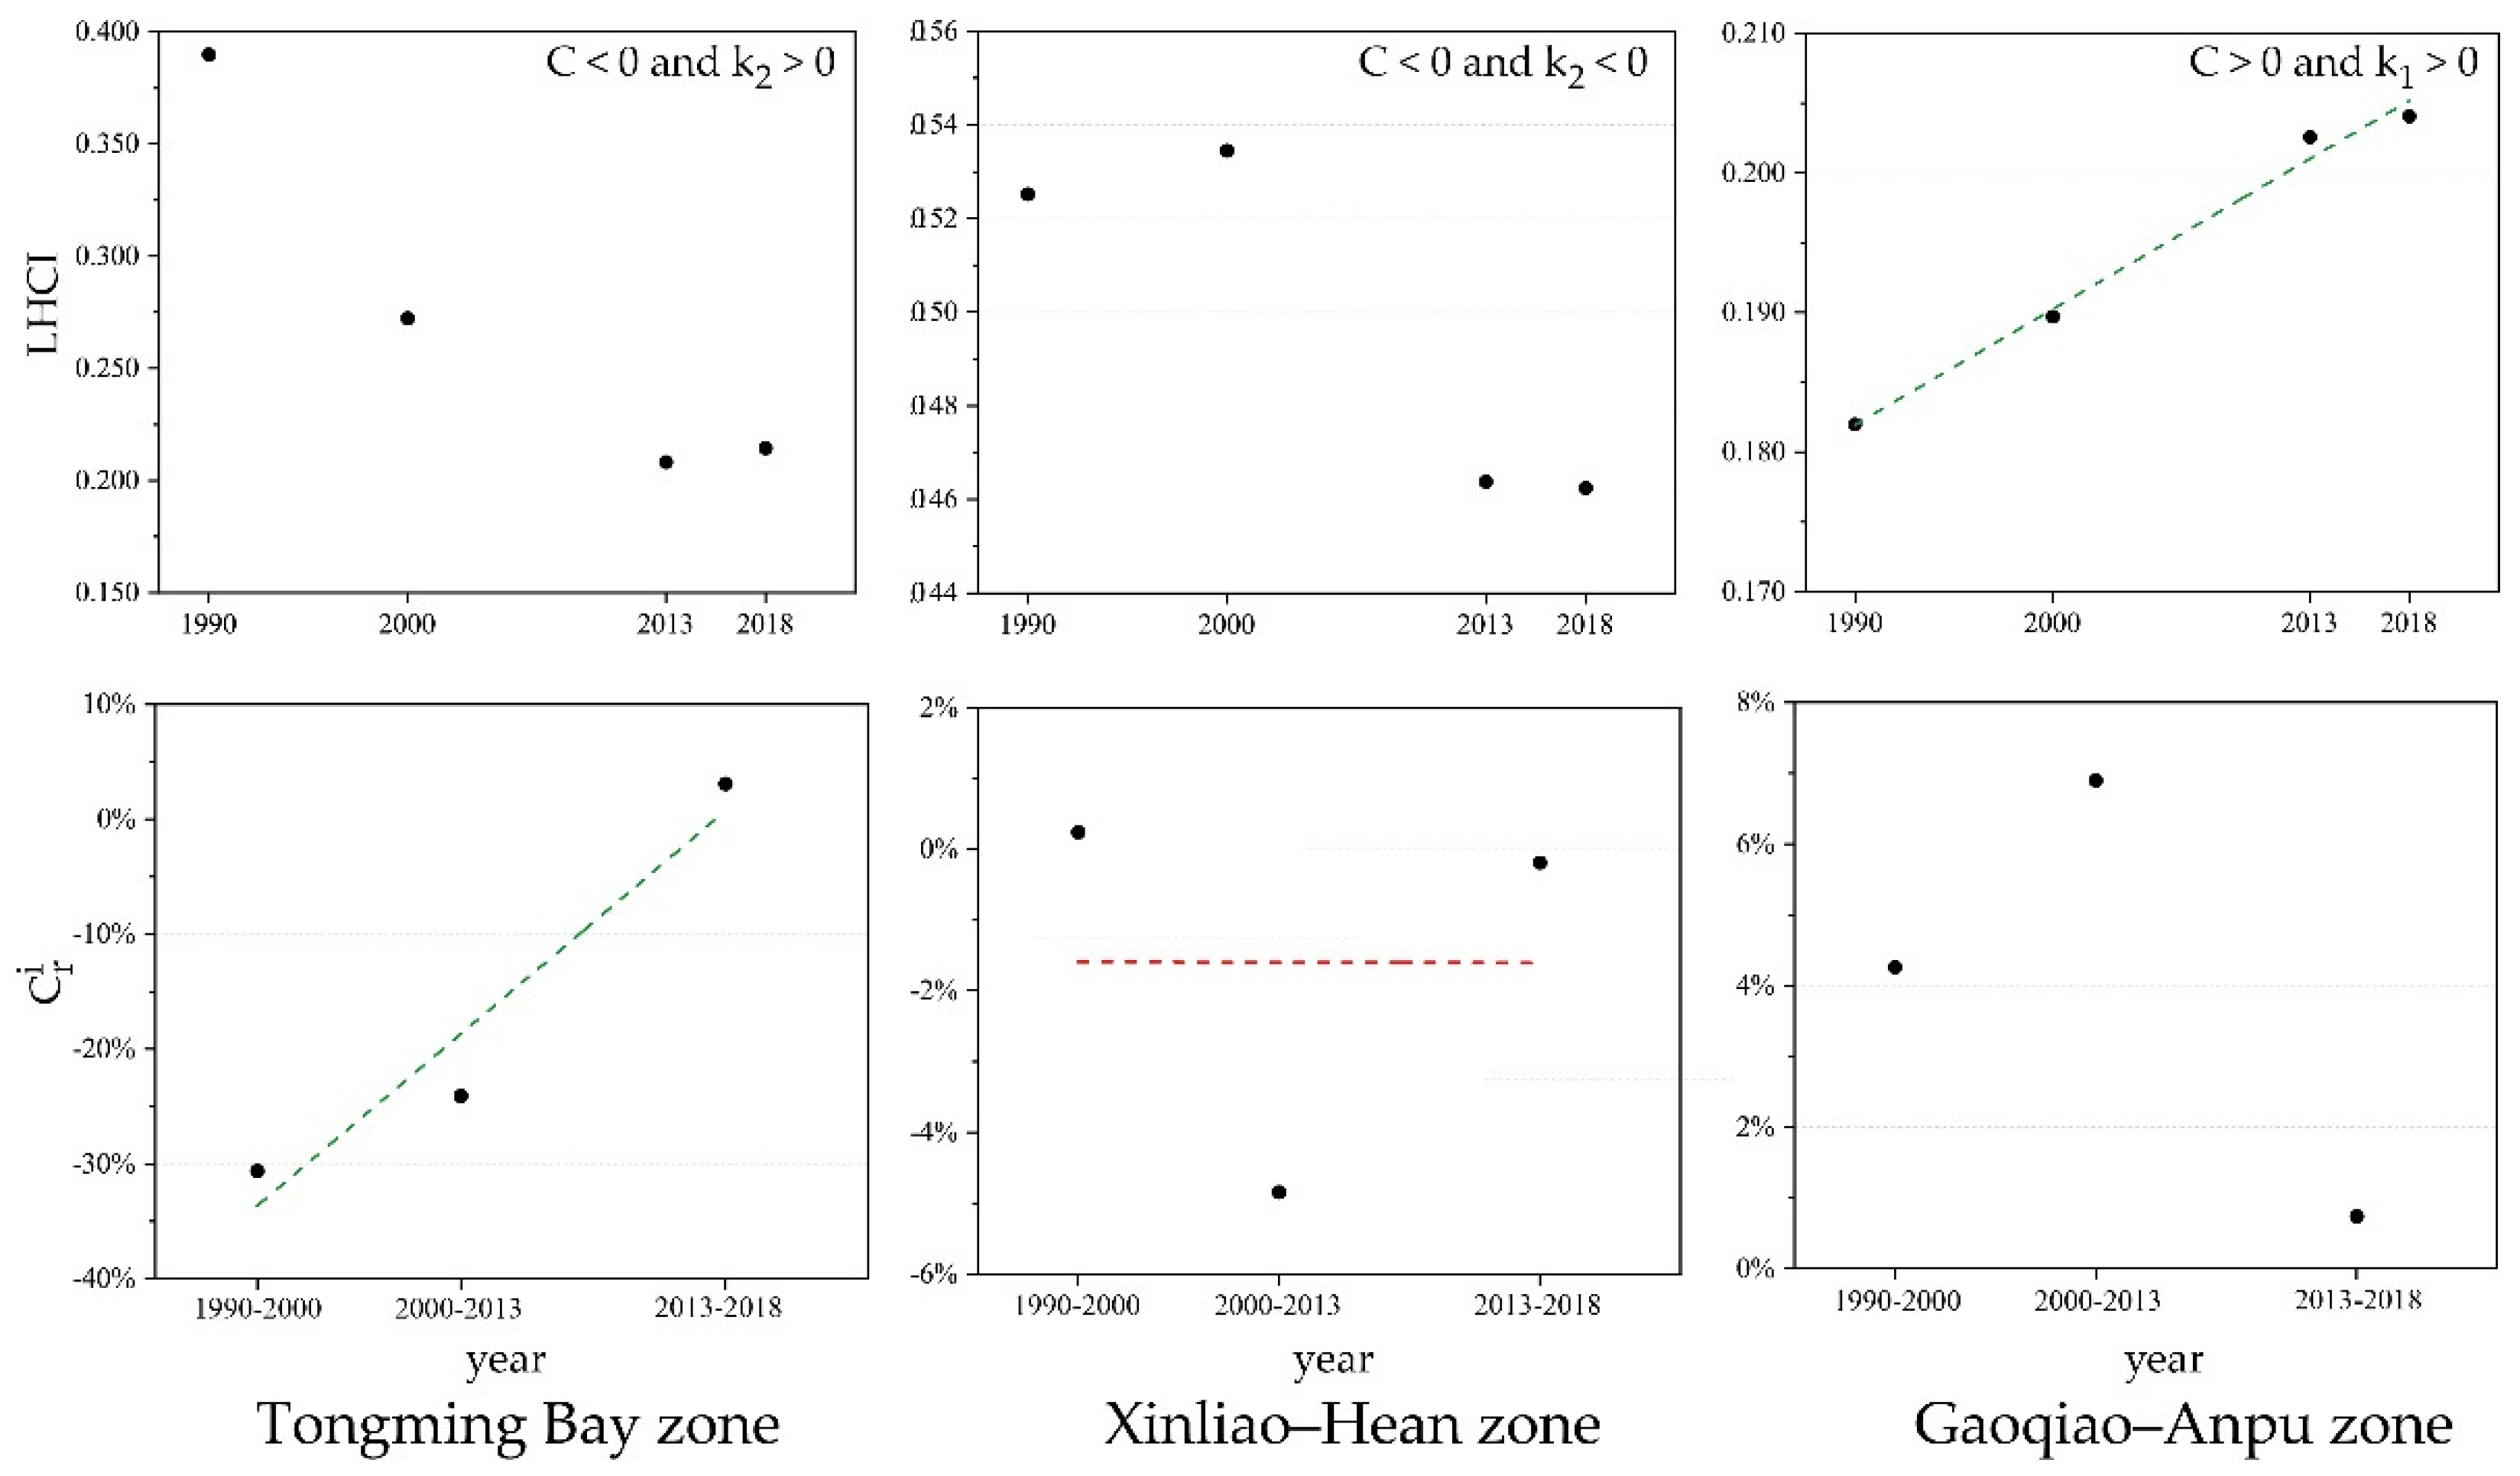
Figure 4a shows the changes in mangrove patches in the Tongming Bay zone. The mangrove area in this zone continued to decrease after the establishment of the reserve. The most severe mangrove area retreat occurred between 1990 and 2013, with high fragmentation of mangrove patches and a significant decrease in spatial aggregation and habitat connectivity of patches. However, there were no significant changes in the mangrove patches from 2013 to 2018, and the landscape health status of mangroves remained stable. From the changes of the corresponding LHCI (Figure 5), the LHCI continued to decline from 1990 to 2013, with a slight increase from 2013 to 2018; 2013 was the turning point when the mangrove landscape health status changed. Although the current landscape health status has not been significantly improved, the changes in the LHCI and C r i show that the deteriorating trend of landscape health status has been completely controlled, and the landscape health status has gradually turned better. Therefore, the zone has achieved a certain protective effect. For the Xinliao–He’an zone (Figure 4b), the mangrove area increased significantly in the early stage from 1990 to 2000, and some new small patches appeared around the original mangrove patches. However, after 2000, many of the original large patches were obviously destroyed and tended to be fragmented. The changes in the LHCI and C r i (Figure 5) show that the LHCI only slightly improved between 1990 and 2000. After 2000, the LHCI continued to decline, and the decreasing trend has not been completely controlled. Therefore, the conservation effectiveness of this zone is not apparent, and it is classified into ordinary grades. The changes of mangrove patches in the Gaoqiao–Anpu zone (Figure 4c) show that the spatial distribution of mangroves has been continuously expanding after the establishment of the reserve, and the original small patches have gradually developed into large patches with high spatial aggregation. Moreover, the shape of the patches tends to be complex, and the habitat connectivity between patches is obviously enhanced. The changes in the LHCI (Figure 5) show that the LHCI throughout the entire period and has been dramatically improved compared to that before the reserve was established, indicating significant conservation effectiveness on mangroves.
The above analysis shows that the changes in mangrove landscape patterns are consistent with the situation reflected by LHCI and C r i . The four indicators ( C , C r , k 1 , and k 2 ) we selected can effectively describe the dynamics of mangroves landscape health status in reserve. Therefore, the evaluation result based on the LHCI is accurate and reliable. In addition, compared with the evaluation of the Zhanjiang reserve as a whole, the results obtained by the zoning evaluation in this study are more reasonable. Differentiated protection strategies can be adopted according to the spatial differentiation characteristics of its conservation effectiveness, focusing on strengthening the protection and restoration of mangroves in the Tongming Bay zone and Xinliao–He’an zone.

4. Discussion

As the ecological and socio-economic functions of mangroves are increasingly valued in China, the government has issued a series of laws and regulations to protect mangroves. The number of mangrove reserves is increasing, and about 64% of mangroves have been protected [11]. However, the quantitative enhancement of mangrove reserves does not always guarantee qualitative improvement [57]. The conservation effectiveness evaluation is necessary to enhance the conservation level of mangrove reserves and promote the restoration of mangrove resources.
Previous studies based on remote sensing mainly focused on the analysis and evaluation of the conservation effects of mangrove reserves from the perspective of spatial-temporal changes in mangroves, such as the research carried out in the Zhanjiang reserve [58], Qinglan reserve [59], Quanzhou Bay reserve [56], and Zhangjiang Estuary [60]. There is no doubt that the increase in the area of mangroves can indicate the conservation effects of reserves. The maintenance of mangrove cover is also an essential guarantee for preserving the integrity and biodiversity of mangrove ecosystems [61]. However, the mangrove area is only one indicator to evaluate conservation effectiveness [29]. If there is insufficient knowledge of the quality and spatial arrangement of mangrove habitat, the area indicator alone is not adequate to guide the implementation of conservation actions. Though measuring and understanding changes in mangroves is an essential step in developing conservation policies and identifying conservation priorities, other indicators of habitat health, such as connectivity and fragmentation, are also critical indicators for conservation effectiveness evaluation [49,62]. Therefore, it is more comprehensive and reliable to evaluate the conservation effectiveness from the perspective of landscape pattern change instead of simply considering the area change.
Different from previous studies, our analysis of changes in landscape metrics was not conducted independently [63,64,65]. Independent analysis of landscape metrics is feasible for evaluating the conservation effectiveness of a few reserves [34]. When the number of reserves to be evaluated is large, or the changes in landscape metrics are complex, it may be difficult to judge which reserve is more effective in protecting mangroves. For example, AREA_MN and PD may increase simultaneously (by different amplitudes) over a certain period. However, as pointed out in Section 2.3.1, one is a positive index, and the other is a negative index. Therefore, we comprehensively considered the ecological significance of different landscape metrics by establishing the LHCI. This measure is reasonable because one or a class of landscape metrics only characterizes one aspect of the landscape pattern. The detailed analysis of the temporal and spatial evolution of the mangrove landscape pattern in three zones of the Zhanjiang reserve also verified the reliability of the evaluation method based on the LHCI. On the other hand, as far as the research scale is concerned, there is still a lack of specialized research on the conservation effectiveness evaluation of mangrove reserves at the national scale in China. Zheng et al. [66] and Jia et al. [28] have conducted a national-scale evaluation of the conservation effectiveness of mangrove reserves, which only included reserves at the national level. Zheng et al. [66] evaluated the conservation effectiveness of China’s national wetland reserves from three aspects: conservation value, wetland changes, and functional zoning adjustment. Although the evaluation index system in their study was comprehensive, the difficulty of collecting reserves database (e.g., environmental data, protection value data, species data) limited the promotion and application of the method. Jia et al. [28] analyzed the conservation effectiveness of national mangrove reserves based on the changes in mangrove forests between 1973 and 2015. However, as only the area was considered, the information provided by the research results was not exhaustive.
In this study, the research objects covered mangrove reserves at all levels (national, provincial, municipal, and county levels), and the study area covered the main distribution areas of mangroves in China (six coastal provinces and one special administrative region). The comprehensive evaluation results obtained from the perspective of landscape health can provide a practical reference for the construction and management of mangrove reserves and the formulation and adjustment of protection policies. For those good reserves, we suggest that long-term protection plans should be formulated, and more reasonable and targeted protection measures should be developed to consolidate and improve conservation effectiveness, such as conducting field surveys of critical mangrove habitats and increasing the frequency of remote sensing monitoring. For those ordinary reserves, we suggest that more investment should be increased to improve conservation effectiveness as soon as possible, carrying out mangrove species introduction projects and implementing replantation and afforestation programs.
However, there are still limitations in remote sensing-based conservation evaluation. First, a time-series mangrove distribution dataset is necessary for remote sensing-based evaluation methods, but it is difficult to produce unbiased maps due to differences in the raw images used in the mapping process (e.g., satellite sensors, image resolutions). Although the dataset can be converted to a consistent spatial resolution, the conversion process can also generate errors. In addition, the change of spatial resolution (pixel size) often affects landscape metrics. On the other hand, large-scale mangrove afforestation is a primary conservation measure in China [67]. For example, in May 2017, the State Forestry Administration and the National Development and Reform Commission released the Planning of Constructing National Coastal Shelter Forests (2016–2025). In this plan, mangrove reforestation was listed as a critical project, aiming to plant 48,650 ha mangroves in 62 counties. Nevertheless, mangroves planted in most restoration projects usually consisted of only a single species (e.g., Sonneratia apetala), which may reduce regional biodiversity. Previous studies have demonstrated the great potential of mapping the spatial distribution of mangrove species based on satellite imagery [68,69,70]. Future research should give some consideration to species diversity to further improve the evaluation of conservation effectiveness based on remote sensing.

5. Conclusions

This study constructed an evaluation index system for landscape health and proposed a landscape health composite index (LHCI) to characterize the landscape health status of mangroves. Using a long time-series China’s mangrove distribution dataset in the past 40 years, the conservation effectiveness of mangrove reserves in China was evaluated by analyzing the dynamics of mangrove area and mangrove landscape health status before and after the establishment of the reserves.
The dynamics of mangrove areas show that the mangrove area in 83% of the reserves increased after the establishment of reserves. In addition, the increase in mangrove area in provincial-level, municipal-level, and county-level reserves was higher than that in national-level reserves, and the most significant increase in mangrove area was in Guangxi, followed by Fujian and Hong Kong. The evaluation results show that reserves protected mangroves effectively in China, with 43% of the reserves significantly improving the landscape health status of mangroves and 35% of the reserves maintaining good mangrove landscape health status. The most effective reserves protecting mangroves were the Qi’ao Island reserve, Maowei Gulf reserve, and Enping reserve. Moreover, the conservation effectiveness of provincial-, municipal- and county-level reserves was more significant than the national-level reserves, with excellent reserves accounting for 66% and 57%, respectively. The reserves in Guangxi, Guangdong, and Fujian Provinces showed more significant protection effects, with the proportion of excellent reserves at 50% and above. Although there are limitations, this study nonetheless provides a sound evaluation to understand the conservation effectiveness of mangrove reserves, which can also be used as a guide for conservation policymaking and scientific management of reserves.
Supplementary Materials

The following supporting information can be downloaded at: https://zenodo.org/record/5811793#.Yc7T7mBBxEa (accessed on 12 March 2022), Table S1: The correlation coefficients and variation coefficients of landscape metrics, Table S2: Evaluation results of conservation effectiveness of reserves.

Author Contributions

Conceptualization, X.L., X.Y. and T.Z.; methodology, X.L.; formal analysis, X.L.; resources, T.Z. and X.Y.; data curation, J.Z., Y.L. and B.L.; writing—original draft preparation, X.L.; writing—review and editing, T.Z., Z.W. and X.Y.; funding acquisition, X.Y. All authors have read and agreed to the published version of the manuscript.

Funding

This research was funded by the National Key Research and Development Program of China (Grant No. 2021YFB3900501), the CAS Earth Big Data Science Project of China (Grant No. XDA19060303), and the Innovation Project of LREIS (Grant No. O88RAA01YA).

Institutional Review Board Statement

Not applicable.

Informed Consent Statement

Not applicable.

Conflicts of Interest

The authors declare no conflict of interest.

References

  1. Giri, C.; Ochieng, E.; Tieszen, L.L.; Zhu, Z.; Singh, A.; Loveland, T.; Masek, J.; Duke, N. Status and distribution of mangrove forests of the world using earth observation satellite data. Glob. Ecol. Biogeogr. 2011, 20, 154–159. [Google Scholar] [CrossRef]
  2. Bunting, P.; Rosenqvist, A.; Lucas, R.M.; Rebelo, L.-M.; Hilarides, L.; Thomas, N.; Hardy, A.; Itoh, T.; Shimada, M.; Finlayson, C.M. The Global Mangrove Watch—A New 2010 Global Baseline of Mangrove Extent. Remote Sens. 2018, 10, 1669. [Google Scholar] [CrossRef] [Green Version]
  3. Lee, S.Y.; Primavera, J.H.; Dahdouh-Guebas, F.; McKee, K.; Bosire, J.O.; Cannicci, S.; Diele, K.; Fromard, F.; Koedam, N.; Marchand, C.; et al. Ecological role and services of tropical mangrove ecosystems: A reassessment. Glob. Ecol. Biogeogr. 2014, 23, 726–743. [Google Scholar] [CrossRef]
  4. Carugati, L.; Gatto, B.; Rastelli, E.; Lo Martire, M.; Coral, C.; Greco, S.; Danovaro, R. Impact of mangrove forests degradation on biodiversity and ecosystem functioning. Sci. Rep. 2018, 8, 13298. [Google Scholar] [CrossRef] [PubMed] [Green Version]
  5. Duarte, C.M.; Losada, I.J.; Hendriks, I.E.; Mazarrasa, I.; Marbà, N. The role of coastal plant communities for climate change mitigation and adaptation. Nat. Clim. Chang. 2013, 3, 961–968. [Google Scholar] [CrossRef] [Green Version]
  6. Wang, W.; Fu, H.; Lee, S.Y.; Fan, H.; Wang, M. Can Strict Protection Stop the Decline of Mangrove Ecosystems in China? From Rapid Destruction to Rampant Degradation. Forests 2020, 11, 55. [Google Scholar] [CrossRef] [Green Version]
  7. Fu, X.-M.; Tang, H.-Y.; Liu, Y.; Zhang, M.-Q.; Jiang, S.-S.; Yang, F.; Li, X.-Y.; Wang, C.-Y. Resource status and protection strategies of mangroves in China. J. Coast. Conserv. 2021, 25, 42. [Google Scholar] [CrossRef]
  8. Goldberg, L.; Lagomasino, D.; Thomas, N.; Fatoyinbo, T. Global declines in human-driven mangrove loss. Glob. Chang. Biol. 2020, 26, 5844–5855. [Google Scholar] [CrossRef] [PubMed]
  9. Liu, M.; Mao, D.; Wang, Z.; Li, L.; Man, W.; Jia, M.; Ren, C.; Zhang, Y. Rapid Invasion of Spartina alterniflora in the Coastal Zone of Mainland China: New Observations from Landsat OLI Images. Remote Sens. 2018, 10, 1933. [Google Scholar] [CrossRef] [Green Version]
  10. Guo, Z.L.; Cui, G.F. Establishment of Nature Reserves in Administrative Regions of Mainland China. PLoS ONE 2015, 10, e0119650. [Google Scholar] [CrossRef]
  11. Zhang, T.; Hu, S.; He, Y.; You, S.; Yang, X.; Gan, Y.; Liu, A. A Fine-Scale Mangrove Map of China Derived from 2-Meter Resolution Satellite Observations and Field Data. ISPRS Int. J. Geo-Inf. 2021, 10, 92. [Google Scholar] [CrossRef]
  12. Li, S.; Xie, T.; Pennings, S.C.; Wang, Y.; Craft, C.; Hu, M. A comparison of coastal habitat restoration projects in China and the United States. Sci. Rep. 2019, 9, 14388. [Google Scholar] [CrossRef] [PubMed]
  13. Chape, S.; Harrison, J.; Spalding, M.; Lysenko, I. Measuring the extent and effectiveness of protected areas as an indicator for meeting global biodiversity targets. Philos. Trans. R. Soc. B Biol. Sci. 2005, 360, 443–455. [Google Scholar] [CrossRef] [PubMed] [Green Version]
  14. Jenkins, C.N.; Joppa, L. Expansion of the global terrestrial protected area system. Biol. Conserv. 2009, 142, 2166–2174. [Google Scholar] [CrossRef]
  15. Timko, J.A.; Innes, J.L. Evaluating ecological integrity in national parks: Case studies from Canada and South Africa. Biol. Conserv. 2009, 142, 676–688. [Google Scholar] [CrossRef]
  16. Parrish, J.D.; Braun, D.P.; Unnasch, R.S. Are We Conserving What We Say We Are? Measuring Ecological Integrity within Protected Areas. BioScience 2003, 53, 851–860. [Google Scholar] [CrossRef] [Green Version]
  17. Leverington, F.; Costa, K.L.; Pavese, H.; Lisle, A.; Hockings, M. A Global Analysis of Protected Area Management Effectiveness. Environ. Manag. 2010, 46, 685–698. [Google Scholar] [CrossRef] [PubMed]
  18. Coelho Junior, M.G.; Biju, B.P.; Silva Neto, E.C.d.; Oliveira, A.L.d.; Tavares, A.A.d.O.; Basso, V.M.; Turetta, A.P.D.; Carvalho, A.G.d.; Sansevero, J.B.B. Improving the management effectiveness and decision-making by stakeholders’ perspectives: A case study in a protected area from the Brazilian Atlantic Forest. J. Environ. Manag. 2020, 272, 111083. [Google Scholar] [CrossRef] [PubMed]
  19. Fuller, R.A.; McDonald-Madden, E.; Wilson, K.A.; Carwardine, J.; Grantham, H.S.; Watson, J.E.M.; Klein, C.J.; Green, D.C.; Possingham, H.P. Replacing underperforming protected areas achieves better conservation outcomes. Nature 2010, 466, 365–367. [Google Scholar] [CrossRef]
  20. Wu, R.; Zhang, S.; Yu, D.W.; Zhao, P.; Li, X.; Wang, L.; Yu, Q.; Ma, J.; Chen, A.; Long, Y. Effectiveness of China’s nature reserves in representing ecological diversity. Front. Ecol. Environ. 2011, 9, 383–389. [Google Scholar] [CrossRef]
  21. Coad, L.; Leverington, F.; Knights, K.; Geldmann, J.; Eassom, A.; Kapos, V.; Kingston, N.; de Lima, M.; Zamora, C.; Cuardros, I.; et al. Measuring impact of protected area management interventions: Current and future use of the Global Database of Protected Area Management Effectiveness. Philos. Trans. R. Soc. B Biol. Sci. 2015, 370, 20140281. [Google Scholar] [CrossRef] [PubMed]
  22. Chen, B.; Xiao, X.; Li, X.; Pan, L.; Doughty, R.; Ma, J.; Dong, J.; Qin, Y.; Zhao, B.; Wu, Z.; et al. A mangrove forest map of China in 2015: Analysis of time series Landsat 7/8 and Sentinel-1A imagery in Google Earth Engine cloud computing platform. ISPRS J. Photogramm. Remote Sens. 2017, 131, 104–120. [Google Scholar] [CrossRef]
  23. Zhao, C.; Qin, C.Z. 10-m-resolution mangrove maps of China derived from multi-source and multi-temporal satellite observations. ISPRS J. Photogramm. Remote Sens. 2020, 169, 389–405. [Google Scholar] [CrossRef]
  24. Hu, L.J.; Li, W.Y.; Xu, B. Monitoring mangrove forest change in China from 1990 to 2015 using Landsat-derived spectral-temporal variability metrics. Int. J. Appl. Earth Obs. Geoinf. 2018, 73, 88–98. [Google Scholar] [CrossRef]
  25. Nagendra, H.; Lucas, R.; Honrado, J.P.; Jongman, R.H.G.; Tarantino, C.; Adamo, M.; Mairota, P. Remote sensing for conservation monitoring: Assessing protected areas, habitat extent, habitat condition, species diversity, and threats. Ecol. Indic. 2013, 33, 45–59. [Google Scholar] [CrossRef]
  26. Wang, Y.Q.; Lu, Z.; Sheng, Y.W.; Zhou, Y.Y. Remote Sensing Applications in Monitoring of Protected Areas. Remote Sens. 2020, 12, 1370. [Google Scholar] [CrossRef]
  27. Wang, W.; Pechacek, P.; Zhang, M.X.; Xiao, N.W.; Zhu, J.G.; Li, J.S. Effectiveness of Nature Reserve System for Conserving Tropical Forests: A Statistical Evaluation of Hainan Island, China. PLoS ONE 2013, 8, e57561. [Google Scholar] [CrossRef] [PubMed]
  28. Jia, M.M.; Wang, Z.M.; Zhang, Y.Z.; Mao, D.H.; Wang, C. Monitoring loss and recovery of mangrove forests during 42 years: The achievements of mangrove conservation in China. Int. J. Appl. Earth Obs. Geoinf. 2018, 73, 535–545. [Google Scholar] [CrossRef]
  29. Porter-Bolland, L.; Ellis, E.A.; Guariguata, M.R.; Ruiz-Mallén, I.; Negrete-Yankelevich, S.; Reyes-García, V. Community managed forests and forest protected areas: An assessment of their conservation effectiveness across the tropics. For. Ecol. Manag. 2012, 268, 6–17. [Google Scholar] [CrossRef]
  30. Tang, Z.; Fang, J.; Sun, J.; Gaston, K.J. Effectiveness of protected areas in maintaining plant production. PLoS ONE 2011, 6, e19116. [Google Scholar] [CrossRef]
  31. Zhang, Y.; Hu, Z.; Qi, W.; Wu, X.; Bai, W.; Li, L.; Ding, M.; Liu, L.; Wang, Z.; Zheng, D. Assessment of effectiveness of nature reserves on the Tibetan Plateau based on net primary production and the large sample comparison method. J. Geogr. Sci. 2016, 26, 27–44. [Google Scholar] [CrossRef] [Green Version]
  32. Sowinska-Swierkosz, B.N.; Soszynski, D. Landscape structure versus the effectiveness of nature conservation: Roztocze region case study (Poland). Ecol. Indic. 2014, 43, 143–153. [Google Scholar] [CrossRef]
  33. Suyadi; Gao, J.; Lundquist, C.J.; Schwendenmann, L. Characterizing landscape patterns in changing mangrove ecosystems at high latitudes using spatial metrics. Estuar. Coast. Shelf Sci. 2018, 215, 1–10. [Google Scholar] [CrossRef]
  34. Jia, M.M.; Liu, M.Y.; Wang, Z.M.; Mao, D.H.; Ren, C.Y.; Cui, H.S. Evaluating the Effectiveness of Conservation on Mangroves: A Remote Sensing-Based Comparison for Two Adjacent Protected Areas in Shenzhen and Hong Kong, China. Remote Sens. 2016, 8, 627. [Google Scholar] [CrossRef] [Green Version]
  35. Lu, C.; Wang, Z.; Liu, M.; Ouyang, L.; Jia, M.; Mao, D. Analysis of conservation effectiveness of wetland protected areas based on remote sensing in West Songnen Plain. China Environ. Sci. 2015, 35, 599–609. [Google Scholar]
  36. Peng, J.; Wang, Y.; Zhang, Y.; Wu, J.; Li, W.; Li, Y. Evaluating the effectiveness of landscape metrics in quantifying spatial patterns. Ecol. Indic. 2010, 10, 217–223. [Google Scholar] [CrossRef]
  37. Lu, Y.; Xu, W.; Zhang, Z.; Zhang, L.; Xie, S.; Zhang, J.; Fan, X.; Ouyang, Z. Gap analysis of mangrove ecosystem conservation in China. Acta Ecol. Sin. 2019, 39, 684–691. [Google Scholar]
  38. Ministry of Ecology and Environment of the People’s Republic of China. China Nature Reserves List. Available online: http://www.mee.gov.cn/ (accessed on 28 November 2021).
  39. Ministry of Natural Resources of the People’s Republic of China. China Marine Reserve List. Available online: http://www.gov.cn/ (accessed on 28 November 2021).
  40. Land Satellite Remote Sensing Application Center, Ministry of Natural Resources. Mangroves Map of China Derived from Long Time Series Satellite Observations (1978–2018); Land Satellite Remote Sensing Application Center, Ministry of Natural Resources: Beijing, China, 2021; Available online: http://www.sasclouds.com/chinese/platform/newsList/notic/detail/618cc900fd423278867c5dda (accessed on 12 November 2021).
  41. Land Satellite Remote Sensing Application Center, Ministry of Natural Resources. Remote Sensing Monitoring of Mangrove Resources in China (1978–2018); Geological Publishing House: Beijing, China, 2019. [Google Scholar]
  42. Zhang, T.; You, S.; Yang, X.; Hu, S. Mangroves Map of China 2018 (MC2018) Derived from 2-Meter Resolution Satellite Observations and Field Data; Science Data Bank: Beijing, China, 2020. [Google Scholar] [CrossRef]
  43. Zhang, J.Y.; Yang, X.M.; Wang, Z.H.; Zhang, T.; Liu, X.L. Remote Sensing Based Spatial-Temporal Monitoring of the Changes in Coastline Mangrove Forests in China over the Last 40 Years. Remote Sens. 2021, 13, 1986. [Google Scholar] [CrossRef]
  44. Vaz, E. Managing urban coastal areas through landscape metrics: An assessment of Mumbai’s mangrove system. Ocean Coast. Manag. 2014, 98, 27–37. [Google Scholar] [CrossRef]
  45. Manson, F.J.; Loneragan, N.R.; Phinn, S.R. Spatial and temporal variation in distribution of mangroves in Moreton Bay, subtropical Australia: A comparison of pattern metrics and change detection analyses based on aerial photographs. Estuar. Coast. Shelf Sci. 2003, 57, 653–666. [Google Scholar] [CrossRef]
  46. Lustig, A.; Stouffer, D.B.; Roigé, M.; Worner, S.P. Towards more predictable and consistent landscape metrics across spatial scales. Ecol. Indic. 2015, 57, 11–21. [Google Scholar] [CrossRef]
  47. Saura, S.; Carballal, P. Discrimination of native and exotic forest patterns through shape irregularity indices: An analysis in the landscapes of Galicia, Spain. Landsc. Ecol. 2004, 19, 647–662. [Google Scholar] [CrossRef]
  48. Geri, F.; Amici, V.; Rocchini, D. Human activity impact on the heterogeneity of a Mediterranean landscape. Appl. Geogr. 2010, 30, 370–379. [Google Scholar] [CrossRef]
  49. Bryan-Brown, D.N.; Connolly, R.M.; Richards, D.R.; Adame, F.; Friess, D.A.; Brown, C.J. Global trends in mangrove forest fragmentation. Sci. Rep. 2020, 10, 7117. [Google Scholar] [CrossRef] [PubMed]
  50. Turschwell, M.P.; Tulloch, V.J.D.; Sievers, M.; Pearson, R.M.; Andradi-Brown, D.A.; Ahmadia, G.N.; Connolly, R.M.; Bryan-Brown, D.; Lopez-Marcano, S.; Adame, M.F.; et al. Multi-scale estimation of the effects of pressures and drivers on mangrove forest loss globally. Biol. Conserv. 2020, 247, 108637. [Google Scholar] [CrossRef]
  51. Wu, J.; Shen, W.; Sun, W.; Tueller, P.T. Empirical patterns of the effects of changing scale on landscape metrics. Landsc. Ecol. 2002, 17, 761–782. [Google Scholar] [CrossRef]
  52. McGarigal, K. FRAGSTATS Help; University of Massachusetts: Amherst, MA, USA, 2015; p. 182. [Google Scholar]
  53. Chang, M.-E.; Zhao, Z.-Q.; Chang, H.-T.; Shu, B. Urban green infrastructure health assessment, based on landsat 8 remote sensing and entropy landscape metrics. Eur. J. Remote Sens. 2021, 54, 417–430. [Google Scholar] [CrossRef]
  54. Zhao, S.A.; Chai, L.H. A new assessment approach for urban ecosystem health basing on maximum information entropy method. Stoch. Environ. Res. Risk Assess. 2015, 29, 1601–1613. [Google Scholar] [CrossRef]
  55. Singh, K.R.; Dutta, R.; Kalamdhad, A.S.; Kumar, B. Information entropy as a tool in surface water quality assessment. Environ. Earth Sci. 2019, 78, 15. [Google Scholar] [CrossRef]
  56. Lu, C.; Liu, J.; Jia, M.; Liu, M.; Man, W.; Fu, W.; Zhong, L.; Lin, X.; Su, Y.; Gao, Y. Dynamic Analysis of Mangrove Forests Based on an Optimal Segmentation Scale Model and Multi-Seasonal Images in Quanzhou Bay, China. Remote Sens. 2018, 10, 2020. [Google Scholar] [CrossRef] [Green Version]
  57. Peng, Y.; Zheng, M.; Zheng, Z.; Wu, G.; Chen, Y.; Xu, H.; Tian, G.; Peng, S.; Chen, G.; Lee, S.Y. Virtual increase or latent loss? A reassessment of mangrove populations and their conservation in Guangdong, southern China. Mar. Pollut. Bull. 2016, 109, 691–699. [Google Scholar] [CrossRef]
  58. Liu, D.Z.; Li, S.S.; Fu, D.Y.; Shen, C.Y. Remote sensing analysis of mangrove distribution and dynamics in Zhanjiang from 1991 to 2011. J. Oceanol. Limnol. 2018, 36, 1597–1603. [Google Scholar] [CrossRef]
  59. Zhu, B.; Liao, J.; Shen, G. Combining time series and land cover data for analyzing spatio-temporal changes in mangrove forests: A case study of Qinglangang Nature Reserve, Hainan, China. Ecol. Indic. 2021, 131, 108135. [Google Scholar] [CrossRef]
  60. Zhao, F.; Zhang, H.Q.; Liu, H.; Zhao, F.; Fang, B.Z.; Lin, W.S. Remote Sensing Monitoring and Protection of Mangrove Wetland Reserve of the Zhang jiang Estuary in Fujian Province. J. Northwest For. Univ. 2011, 26, 160–165. [Google Scholar]
  61. Butchart, S.H.M.; Walpole, M.; Collen, B.; Strien, A.v.; Scharlemann, J.P.W.; Almond, R.E.A.; Baillie, J.E.M.; Bomhard, B.; Brown, C.; Bruno, J.; et al. Global Biodiversity: Indicators of Recent Declines. Science 2010, 328, 1164–1168. [Google Scholar] [CrossRef]
  62. Binks, R.M.; Byrne, M.; McMahon, K.; Pitt, G.; Murray, K.; Evans, R.D. Habitat discontinuities form strong barriers to gene flow among mangrove populations, despite the capacity for long-distance dispersal. Divers. Distrib. 2019, 25, 298–309. [Google Scholar] [CrossRef] [Green Version]
  63. Ma, C.L.; Ai, B.; Zhao, J.; Xu, X.P.; Huang, W. Change Detection of Mangrove Forests in Coastal Guangdong during the Past Three Decades Based on Remote Sensing Data. Remote Sens. 2019, 11, 921. [Google Scholar] [CrossRef] [Green Version]
  64. Vorovencii, I. Quantifying landscape pattern and assessing the land cover changes in Piatra Craiului National Park and Bucegi Natural Park, Romania, using satellite imagery and landscape metrics. Environ. Monit. Assess. 2015, 187, 692. [Google Scholar] [CrossRef]
  65. Valle, I.C.; Francelino, M.R.; Hardt, E.; Pinheiro, H.S.K. Landscape indicators of the success of protected areas on habitat recovery for the Golden Lion Tamarin (Leontopithecus rosalia). Écoscience 2017, 25, 61–69. [Google Scholar] [CrossRef]
  66. Zheng, Y.; Zhang, H.; Niu, Z.; Gong, P. Protection efficacy of national wetland reserves in China. Chin. Sci. Bull. 2012, 57, 1116–1134. [Google Scholar] [CrossRef] [Green Version]
  67. Ren, H.; Lu, H.; Shen, W.; Huang, C.; Guo, Q.; Li, Z.a.; Jian, S. Sonneratia apetala Buch.Ham in the mangrove ecosystems of China: An invasive species or restoration species? Ecol. Eng. 2009, 35, 1243–1248. [Google Scholar] [CrossRef]
  68. Jia, M.; Zhang, Y.; Wang, Z.; Song, K.; Ren, C. Mapping the distribution of mangrove species in the Core Zone of Mai Po Marshes Nature Reserve, Hong Kong, using hyperspectral data and high-resolution data. Int. J. Appl. Earth Obs. Geoinf. 2014, 33, 226–231. [Google Scholar] [CrossRef]
  69. Peng, L.H.; Liu, K.; Cao, J.J.; Zhu, Y.H.; Li, F.S.; Liu, L. Combining GF-2 and RapidEye satellite data for mapping mangrove species using ensemble machine-learning methods. Int. J. Remote Sens. 2020, 41, 813–838. [Google Scholar] [CrossRef]
  70. Li, H.; Jia, M.; Zhang, R.; Ren, Y.; Wen, X. Incorporating the Plant Phenological Trajectory into Mangrove Species Mapping with Dense Time Series Sentinel-2 Imagery and the Google Earth Engine Platform. Remote Sens. 2019, 11, 2479. [Google Scholar] [CrossRef] [Green Version]
Figure 1. Location of the study area and the spatial distribution of the selected mangrove reserves. (The details of the reserve corresponding to the number are shown in Table 1.)
Remotesensing 14 01386 g001
Figure 2. Evaluation results of conservation effectiveness of reserves in different provinces.
Remotesensing 14 01386 g002
Figure 3. Changes of the LHCI in the reserves of different provinces before and after the establishment of reserves.
Remotesensing 14 01386 g003
Figure 4. Changes of mangrove area in (a) the Tongming Bay zone, (b) the Xinliao–He’an zone, and (c) the Gaoqiao–Anpu zone after protection.
Remotesensing 14 01386 g004
Figure 5. The LHCI and C r in Tongming Bay, Xinliao–Hean, and Gaoqiao–Anpu zones from 1990 to 2018. (The red dotted line represents the decreasing trend ( k < 0 ), and the green dotted line represents the increasing trend ( k > 0 ).)
Remotesensing 14 01386 g005
Table 1. The detailed information of the selected reserves in this study.
Reserve No.Name of ReserveAbbreviationLevelProvinceEstablishment Time
1Yueqing Ximen Island Marine Special ReserveXimen IslandNationalZhejiang2005
2Quanzhou Bay Estuary Wetland Nature ReserveQuanzhou BayProvincialFujian2002
3Jiulong River Estuary Mangrove Nature ReserveJiulong EstuaryProvincialFujian1988
4Zhangjiang River Estuary Mangrove Nature ReserveZhangjiang EstuaryNationalFujian1992
5Danshui River Estuary Mangrove Nature ReserveDanshui EstuaryProvincialTaiwan1986
6Mai Po Marshes Nature ReserveMai PoNationalHong Kong1975
7Neilingding-Futian Nature ReserveFutianNationalGuangdong1984
8Qiao-Dangan Island Nature ReserveQi’ao IslandProvincialGuangdong1989
9Enping Mangrove Nature ReserveEnpingCountyGuangdong2005
Taishan Zhenhai Bay Mangrove Nature Reserve2000
10Pinggang Mangrove Wetland Nature ReservePinggangCountyGuangdong2005
Chengcun Haoguang Mangrove Nature Reserve2000
11Dianbai Mangrove Nature ReserveDianbaiMunicipalGuangdong1999
12Zhanjiang (Tongming Bay) Mangrove Nature ReserveTongming BayNationalGuangdong1990
13Zhanjiang (Xinliao–Hean) Mangrove Nature ReserveXinliao–Hean
14Zhanjiang (Gaoqiao–Anpu) Mangrove Nature ReserveGaoqiao–Anpu
15Shankou Mangrove Nature ReserveShankouNationalGuangxi1990
16Maowei Gulf Mangrove Nature ReserveMaowei GulfProvincialGuangxi2005
17Beilun River Estuary Nature ReserveBeilun EstuaryNationalGuangxi1990
18Dongzhaigang Nature ReserveDongzhaigangNationalHainan1980
19Huachang Bay Mangrove Nature ReserveHuachang BayCountyHainan1995
20Caiqiao Mangrove Nature ReserveCaiqiaoCountyHainan1986
Danzhou Dongchang Mangrove Nature Reserve1986
21Xinying Bay Mangrove Nature ReserveXinying BayCountyHainan1992
22Sanya River Mangrove Nature ReserveSanya RiverMunicipalHainan1992
23Qinglan Mangrove Nature ReserveQinglanProvincialHainan1981
Table 2. The satellite platform and sensors used in mangrove monitoring.
YearSatelliteSensorResolution
2018GF-1PMS2 m
ZY-3NAD and MUX2 m
2013GF-1PMS2 m
ZY-3NAD and MUX2 m
2000Landsat 7ETM+15 m
1990Landsat 5TM30 m
1978Landsat 1, 2, and 3MSS60 m
Table 3. Preliminary evaluation index system for landscape health.
CategoryMetricsEcological SignificanceTypes
AreaTATA is an important index of landscape structure, which can directly reflect the change of mangrove area. In landscape ecological construction, the landscape area is the most important factor used to maintain the stability of the ecosystem.Positive
AREA_MNThe mean size of mangrove patches can reflect the fragmentation of the mangrove landscape.Positive
Shape
complexity
SHAPE_MNSHAPE_MN characterizes the degree of regularity of the patches and the complexity of their edges. When all the patches in the landscape are square, SHAPE_MN is equal to 1. When the shape of the patches deviates from the square, SHAPE_MN increases.Positive
SHAPE_AMSHAPE_AM is an important index for measuring the complexity of landscape spatial patterns and has an impact on many ecological processes.Positive
FRAC_MN *An index to measure the spatial shape complexity of patches with fractal dimension theory. The closer the value tends to 1, the more regular the shape of the patch.Positive
FRAC_AM *An important index to reflect the overall shape characteristics of landscape patterns. It also reflects the impact of human activities on the mangrove landscape pattern to a certain extent.Positive
DistanceENN_MNENN_MN is widely used to quantify patch isolation and characterize the spatial distribution of discrete or aggregated patches. It also reflects the difficulty of the ecological process of species migration and energy flow.Negative
FragmentationPDPD is the number of mangrove patches per unit area, which characterizes the degree of fragmentation in the landscape. The higher the patch density, the greater the degree of landscape fragmentation.Negative
NPNP is the number of mangrove patches, the simplest index to measure landscape separation and fragmentation.Negative
ED *ED is used to characterize the length of the edge per unit area, revealing the extent to which the mangrove landscape is divided by the edge.Negative
ConnectivityCONTIG_MNCONTIG_MN can measure the proximity between patches of the same type. A large value indicates a high degree of proximity between patches of the same type and good landscape connectivity.Positive
COHESION *COHESION measures the physical connectivity between patches to characterize the habitat connectivity between mangrove patches.Positive
AI *AI characterizes the connectivity between mangrove patches and measures the degree of possible connectivity between mangrove patches.Positive
* Indexes eliminated by correlation analysis and discrimination analysis. Abbreviations: TA—total area; AREA_MN—mean patch area; SHAPE_MN—mean patch shape index; SHAPE_AM—area-weighted mean patch shape index; FRAC_MN—mean patch fractal dimension; FRAC_AM—area-weighted mean patch fractal dimension; ENN_MN—mean Euclidean nearest neighbor distance distribution; PD—patch density; NP—number of patches; ED—edge density; CONTIG_MN—mean contiguity index distribution; COHESION—patch cohesion index; AI—aggregation index.
Table 4. Definition of the time point of reserves before and after protection.
Range of Establishment Time of Reserves 1Time Point
before   Protection   ( T b )
Time Point
after   Protection   ( T a )
1978–198919782018
1990–199919902018
2000–200520002018
1 Excluding the Ximen Island reserve and the Mai Po reserve.
Table 5. Dynamic changes of mangrove area in reserves before and after protection.
Reserve No.Reserve S b   ( ha ) S a   ( ha ) Net Change (ha) K
1Ximen Island29.4936.286.794.60%
2Quanzhou Bay161.55290.17128.624.42%
3Jiulong Estuary98.09404.85306.767.82%
4Zhangjiang Estuary49.7386.4036.672.63%
5Danshui Estuary61.12151.9590.833.72%
6Mai Po173.77535.84362.075.21%
7Futian47.00139.9492.944.94%
8Qi’ao Island22.37525.48503.1150.82%
9Enping and Zhenhai Bay484.17904.69420.524.83%
10Pinggang and Haoguang603.20769.97166.771.54%
11Dianbai304.19313.339.140.11%
12Tongming Bay4741.502207.83−2533.69−1.91%
13Xinliao–Hean544.87735.19190.321.25%
14Gaoqiao–Anpu959.461472.45512.991.91%
15Shankou1201.701973.04771.312.29%
16Maowei Gulf898.742162.701263.967.81%
17Beilun Estuary814.711039.33224.620.98%
18Dongzhaigang1605.301841.45236.150.37%
19Huachang Bay319.92250.91−69.01−0.77%
20Caiqiao and Dongchang229.52284.0054.480.59%
21Xinying Bay906.23508.36−397.87−1.57%
22Sanya River33.3234.280.960.10%
23Qinglan1715.30792.51−922.82−1.34%
Table 6. Dynamic changes of mangrove area in the reserves of different levels before and after protection.
Level S b   ( ha ) S a   ( ha ) Net Change (ha)
National10,167.5810,067.75−99.83
Provincial2957.204327.661370.46
Municipal and county2880.553065.54184.99
Total16,005.3317,460.951455.62
Table 7. Dynamic changes of mangrove area in the reserves of different districts before and after protection.
District S b   ( ha ) S a   ( ha ) Net Change (ha)
Zhejiang29.4936.286.79
Fujian309.37781.42472.05
Taiwan61.12151.9590.83
Guangdong7706.787068.88−637.90
Hong Kong173.77535.84362.07
Guangxi2915.185175.072259.89
Hainan4809.623711.51−1098.11
Total16,005.3317,460.951455.62
Table 8. Criteria and results of conservation effectiveness evaluation of reserves.
Conservation Effectiveness C k 1 k 2 NumberPercent
Excellent C > 0 k 1 > 0 /1043%
Good C > 0 k 1 < 0 /835%
C < 0 / k 2 > 0
Ordinary C < 0 / k 2 < 0 522%
Table 9. Statistics of evaluation results of reserves based on protection levels.
LevelConservation EffectivenessNumberPercent
NationalExcellent330%
Good330%
Ordinary440%
ProvincialExcellent466%
Good117%
Ordinary117%
Municipal and countyExcellent457%
Good343%
Ordinary00%
Publisher’s Note: MDPI stays neutral with regard to jurisdictional claims in published maps and institutional affiliations.