Technical Note

Columnar Water Vapor Retrieval by Using Data from the Polarized Scanning Atmospheric Corrector (PSAC) Onboard HJ-2 A/B Satellites

1
State Environment Protection Key Laboratory of Satellite Remote Sensing, Aerospace Information Research Institute, Chinese Academy of Sciences, Beijing 100101, China
2
University of Chinese Academy of Sciences, Beijing 100049, China
3
Anhui Institute of Optics and Fine Mechanics, Hefei Institute of Physical Science, Chinese Academy of Sciences, Hefei 230031, China
*
Author to whom correspondence should be addressed.
Remote Sens. 2022, 14(6), 1376; https://doi.org/10.3390/rs14061376
Submission received: 28 January 2022 / Revised: 7 March 2022 / Accepted: 10 March 2022 / Published: 11 March 2022
(This article belongs to the Section Atmospheric Remote Sensing)

Abstract

:
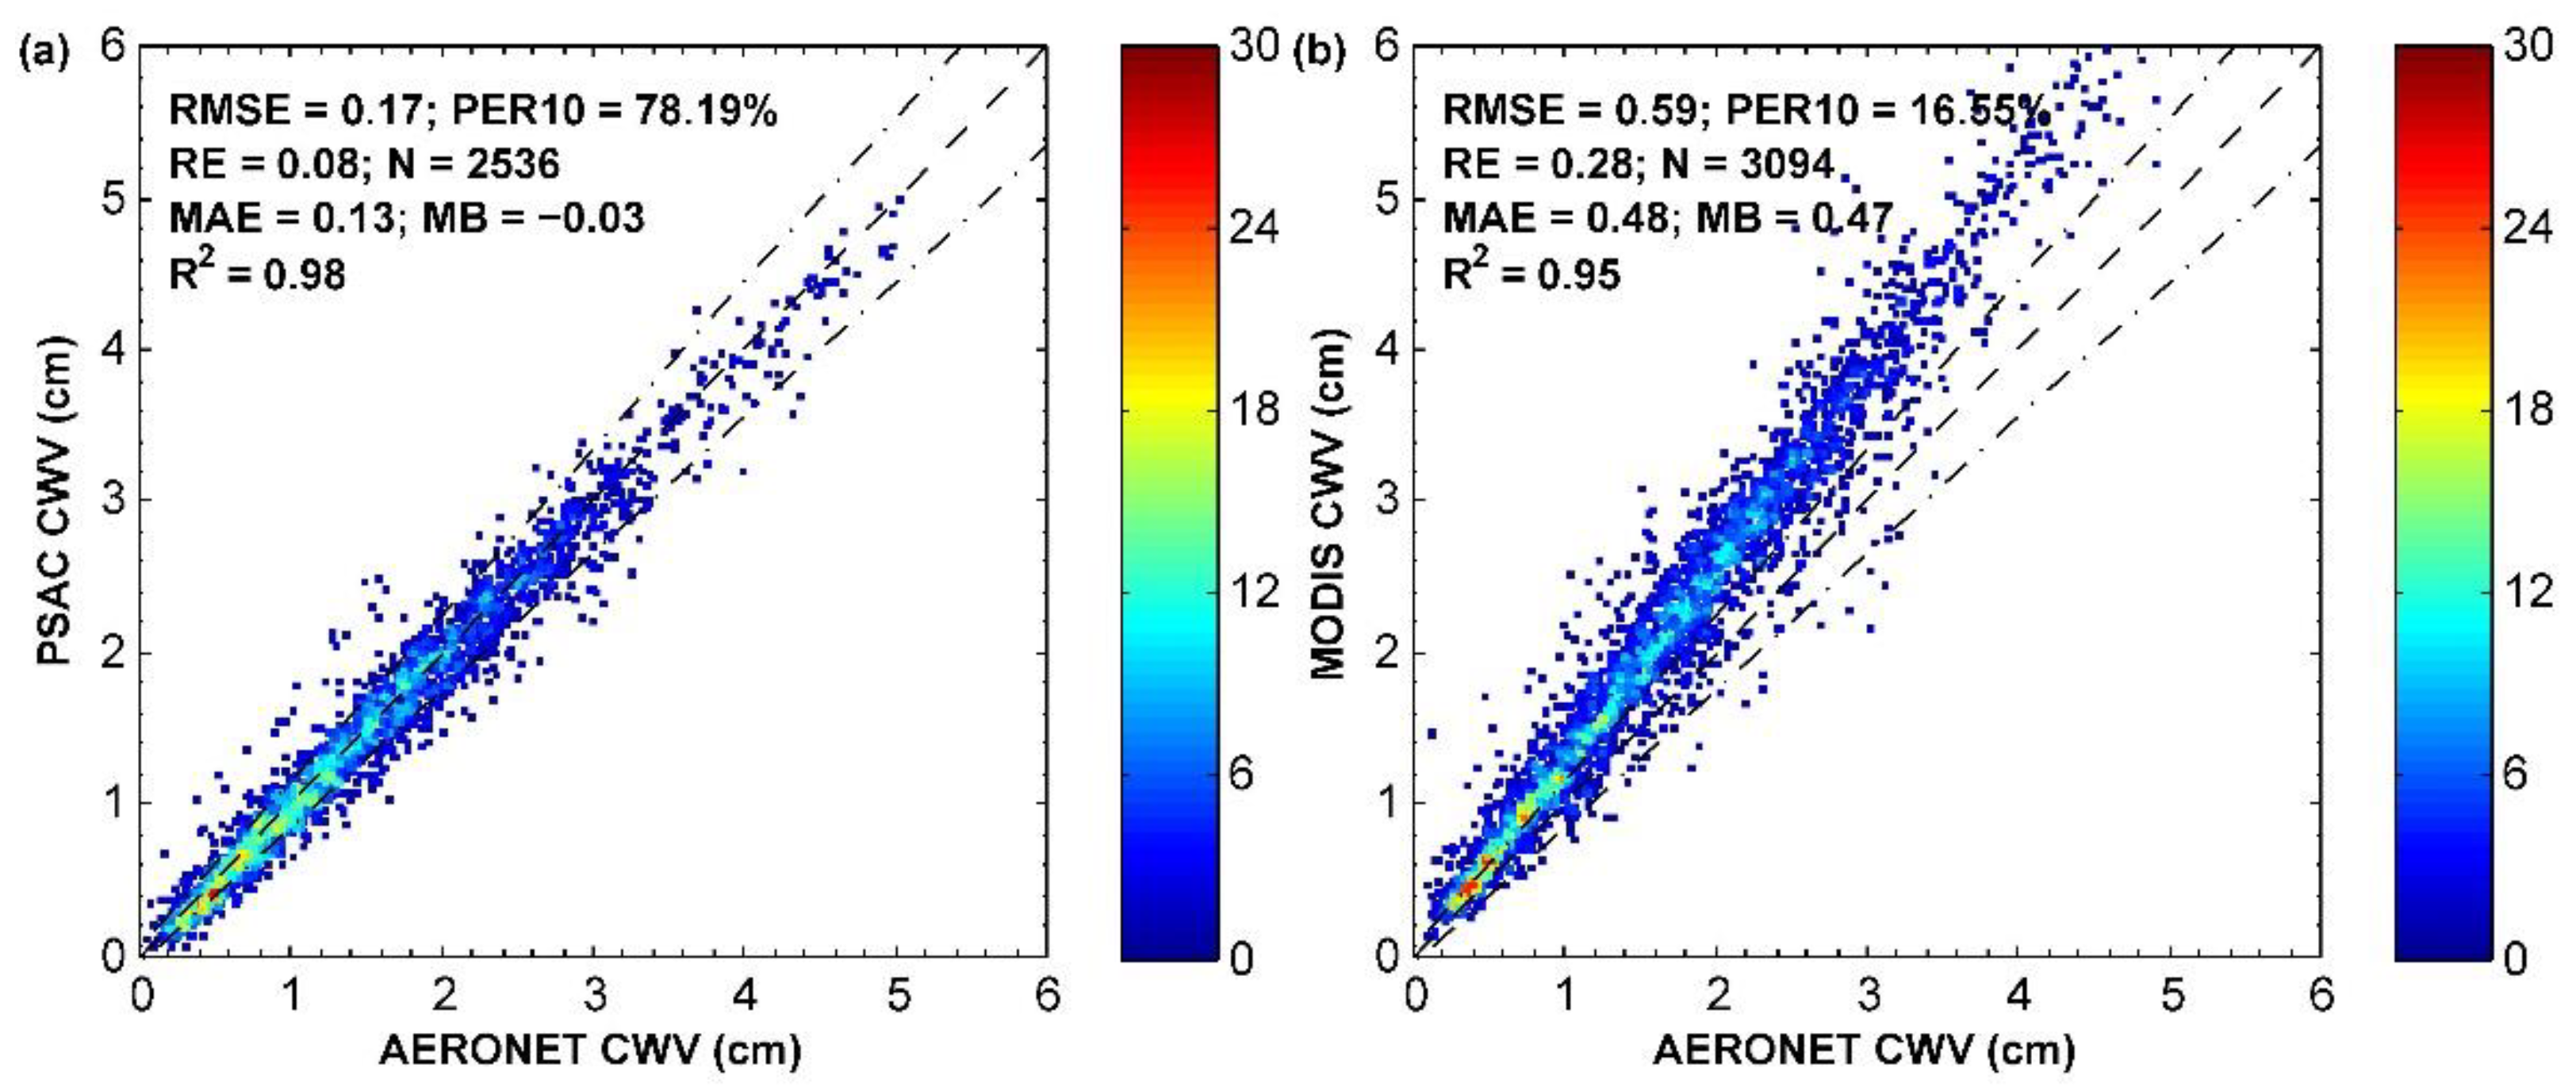
As the latest members of Chinese Environmental Protection and Disaster Monitoring Satellite Constellation, the first two of HuanjingJianzai-2 (HJ-2) series satellites were launched on 27 September 2020 by China and are usually abbreviated as HJ-2 A/B satellites. The polarized scanning atmospheric corrector (PSAC) is one of main sensors onboard HJ-2 A/B satellites, which is mainly used to monitor atmospheric components such as water vapor and aerosols. In this study, a columnar water vapor (CWV) retrieval algorithm using two bands (865 and 910 nm) is developed for PSAC. The validation results of PSAC CWV data based on ground-based CWV data derived from Aerosol Robotic Network (AERONET) show that PSAC CWV data has a high accuracy, and all statistical parameters of PSAC CWV data are better than those of Moderate-resolution Imaging Spectroradiometer (MODIS) CWV data released by NASA. Overall, there is no obvious overestimation or underestimation in PSAC CWV data. The root mean square error (RMSE), mean absolute error (MAE), relative error (RE), and percentage of CWV data with error within ± ( 0.05 + 0.10 C W V A E R O N E T ) (PER10) of PSAC CWV data are 0.17 cm, 0.13 cm, 0.08, and 78.19%, respectively. The RMSE, MAE, RE, and PER10 of MODIS CWV data are 0.59 cm, 0.48 cm, 0.28, and 16.55%, respectively. Compared with MODIS CWV data, PSAC CWV data shows a 71% decrease in RMSE, a 73% decrease in MAE, a 71% decrease in RE, and a 372% increase in PER10. In addition, the results of day-to-day comparisons between PSAC CWV data and AERONET data show that PSAC CWV data can effectively characterize the change trend of CWV.

1. Introduction

Water vapor is one of the components of the atmosphere that is mainly distributed in the troposphere, and its proportion in the atmosphere usually varies in the range of 0–4%. Its main sources are evaporation of water and transpiration of plants. The water vapor content can be characterized by the columnar water vapor (CWV) with the unit of cm, which is the total amount of water vapor contained in a vertical column per unit cross-sectional area from the ground to the top of the atmosphere (TOA). Although water vapor accounts for only a small fraction of the atmosphere, it plays an important role in climate change and weather systems [1,2,3,4]. In addition, water vapor also has an important impact on the accuracy of quantitative remote sensing such as remote sensing inversion of atmospheric parameters and atmospheric correction of remote sensing data [5,6,7]. The spatial distribution of water vapor has significant spatial and temporal differences due to its long-range transport, differences in emission sources, and short lifetime. Therefore, it is of great importance to monitor water vapor on a large scale. Because of the very large spatial coverage of remote sensing data obtained by Earth observation satellites, large-scale monitoring of water vapor using remote sensing data is now the dominant approach.
The HuanjingJianzai-2 (HJ-2) series of satellites are the latest members of the Chinese Environmental Protection and Disaster Monitoring Satellite Constellation developed by China, and the first two (HJ-2A and HJ-2B) HJ-2 series satellites were launched on 27 September 2020. Each satellite is equipped with four imaging sensors, including the wide view charge-coupled device (CCD) camera, the hyper-spectral imager (HSI), the infrared multispectral scanner (IRMSS), and the polarized scanning atmospheric corrector (PSAC) [8]. The first three sensors are mainly used for surface observations, and PSAC is mainly used to monitor atmospheric components such as water vapor and aerosols. In order to remove the atmospheric interference to the data of the first three main sensors to extend their application, it is necessary to perform atmospheric correction on these data according to the atmospheric parameters including CWV [9,10]. Because of the large temporal differences in distribution of water vapor, it is essential to use CWV data synchronous with HJ-2 satellites rather than CWV data from other satellites for high-precision atmospheric correction. In addition, since the observation time of different satellites is different, the CWV data derived from HJ-2 satellites is useful for the studies on weather forecasting and climate change. Therefore, it is of great significance to develop CWV data using PSAC data.
The current remote sensing retrieval algorithms for water vapor can be classified into four categories based on the wavelength of the data used, namely, visible algorithm, near-infrared (NIR) algorithm, thermal infrared (TIR) algorithm, and microwave (MW) algorithm [11,12,13,14]. Each of these algorithms has its own scope of application. Among them, the visible algorithm, TIR algorithm, and MW algorithm can be used not only for CWV retrieval over the land, but also for CWV retrieval over the ocean, while the NIR algorithm is only applicable to areas with large surface albedo, such as land and the sun-glint region of the ocean. Due to the use of data in the visible-NIR spectral range, the visible algorithm and NIR algorithm are only suitable for water vapor retrieval in the daytime, while the TIR algorithm and MW algorithm can be used for water vapor retrieval at any time. In addition, the MW algorithm can be used for water vapor detection both over cloud-free areas and over areas covered by clouds because of the strong penetration ability of microwaves, while the other three algorithms are only applicable to areas not affected by clouds. In addition to the above methods based on remote sensing image data, there are still many other methods for monitoring water vapor content. For example, radio occultation methods [15,16] and methods for retrieving CWV by using data observed by ground stations including global positioning system (GPS) receiver, sun photometer, and radiosonde [17,18]. In general, the accuracy of CWV data derived from ground-based observations is higher than that of CWV data derived from satellite data, but ground-based observations have difficulty monitoring water vapor on a large scale due to the limitation of the number of ground-based stations.
All the above-mentioned remote sensing retrieval algorithms for water vapor have been used in the development of water vapor products for multiple sensors. For example, the visible algorithm has been used for water vapor retrieval for sensors such as the Ozone Monitoring Instrument (OMI) and the Global Ozone Monitoring Experience 2 (GOME-2) [14,19], the NIR algorithm has been applied to the water vapor retrieval for sensors such as the Moderate-resolution Imaging Spectroradiometer (MODIS) and the Medium Resolution Spectral Imager (MERSI)-2 [20,21], the TIR algorithm has been used for water vapor retrieval for sensors such as the Spinning Enhanced Visible and Infrared Imager (SEVIRI) and the Advanced Very High Resolution Radiometer (AVHRR) [12,22], and the MW algorithm has been applied to water retrieval for sensors such as the Microwave Radiation Imager (MWRI) and the calibration microwave radiometer (CMR) [13,23]. On the whole, among the four algorithms, the NIR algorithm has the highest accuracy and the MW algorithm has the strongest applicability. In this work, the NIR algorithm is selected for water vapor retrieval of PSAC according to the band setting of PSAC.
In this study, we use the NIR algorithm to retrieve CWV from PSAC onboard HJ-2 satellites and evaluate the accuracy of retrieval algorithm based on ground-based data. The retrieval results can be used for atmospheric correction of data from other sensors onboard HJ-2 satellites and provide data support for studies related to weather forecasting and climate change. The paper is structured as follows. The data used are introduced in Section 2 and the CWV retrieval algorithm is presented in Section 3. Then, the CWV retrieval results and analysis are shown in Section 4. After that, the limitations of this study are discussed in Section 5. Finally, the paper is summarized in Section 6.

2. Data

2.1. PSAC Data

The main purpose of HJ-2 series satellites is for monitoring and early warning of environmental pollution and disasters, which is operated by China Centre for Resources Satellite Data and Application (CCRSDA. Available online: http://www.cresda.com (accessed on 18 January 2022)). HJ-2A and HJ-2B are the first two of the HJ-2 series, and both satellites are polar orbiting satellites with an orbital altitude of 645 km. PSAC onboard HJ-2 satellite is mainly used for atmospheric monitoring. It has a spatial resolution of about 6 km and an imaging width of more than 800 km. PSAC has nine spectral channels with polarization detection capability, including two NIR channels (865 and 910 nm) dedicated to CWV retrieval. The spectral response functions (SRF) of two bands of PSAC used for CWV retrieval are shown in Figure 1, and more characteristics of them can be found in Table 1. Since CCRSDA only provides us with PSAC data from March 2021 to August 2021 during the in-orbit testing period, the time period chosen for this study was these 6 months.

2.2. Ground-Based CWV Data

The aerosol robotic network (AERONET) is a global ground-based aerosol observation network, which has been in operation for nearly 25 years [24]. Although it is specially established for observing aerosols rather than water vapor, it can also provide high-quality CWV data. The uncertainty of AERONET CWV data is about 10% [25,26]. Due to the continuity and high accuracy of AERONET CWV data, it is widely used for quality assessment of remote sensing CWV data [27]. In this paper, the last version (Version 3.0) of Level 1.5 AERONET data after cloud mask and quality control were used for the validation of remote sensing CWV data [28]. A total of 350 sites were used in this work, and their spatial distribution is shown in Figure 2. The AERONET CWV data mentioned above are all available from the Internet (https://aeronet.gsfc.nasa.gov/, last accessed on 23 January 2022).

3. Method

3.1. Water Vapor Retrieval

As mentioned before, the NIR water vapor retrieval algorithm is only applicable to sensors with both the water vapor absorption band and band not affected by water vapor absorption in the spectral range of 850–1250 nm [11]. Therefore, bands 5 and 6 (865 and 910 nm) of PSAC are bands selected for water vapor retrieval. Among them, band 5 is located in the spectral range of the atmospheric window and is basically not affected by gas absorption, while band 6 is strongly absorbed by the atmosphere, almost all of which is caused by water vapor.
For NIR bands, the apparent reflectance observed by the satellite ( R T O A ) at the top of the atmosphere can be expressed as [29,30]:
R T O A = T g ( ρ 0 + T T R s u r f ) ,
where T g is the total gaseous absorption transmittance, ρ 0 denotes the atmospheric path reflectance caused by the atmosphere, R s u r f is surface reflectance, T and T represent the total transmittance (direct + diffuse) upward and downward, respectively.
Due to their relatively long and close wavelengths, the difference between path radiation and atmospheric transmittance of bands 5 and 6 can be ignored. In addition, the difference in surface reflectance between the two bands is very small. For the above reasons, it can be considered that the apparent reflectance of band 5 is equal to that of band 6 without considering water vapor absorption [21]. Since the effect of gases other than water vapor on the absorption of radiation observed by PSAC in bands 5 and 6 is negligible, the water vapor absorption transmittance of band 6 can be calculated by dividing the apparent reflectance of band 6 by that of band 5.
T g 910   nm = R T O A 910   nm / R T O A 865   nm ,
where T g 910   nm is the water vapor absorption transmittance of band 6, R T O A 865   nm and R T O A 910   nm are the TOA reflectance of bands 5 and 6, respectively.
Previous studies have shown that the water vapor absorption transmittance of the NIR channel is strongly correlated with CWV. This relationship can be written as [31,32]:
V C W V = A ( l n ( T g ) ) 2 + B l n ( T g ) + C L ,
L = 1 c o s ( θ s ) + 1 c o s ( θ v ) ,
where V C W V denotes CWV, T g represents the water vapor absorption transmittance of NIR band, θ s is the solar zenith angle, θ v is the satellite zenith angle, and A, B, and C are three constants related to the characteristics of the NIR band, respectively.
In this paper, the selected PSAC data was divided into two parts. Among them, PSAC data in East Asia (18–53°N, 73–130°E) was used to determine above three parameters (A, B, and C), and the remaining PSAC data was used to test the effectiveness of the water vapor retrieval algorithm. For the convenience of description, the region used to determine parameters of algorithm model is referred to as region 1, and the region used to test the algorithm is referred to as region 2. There are 38 AERONET sites in region 1 and 312 AERONET sites in region 2. In order to construct water vapor retrieval model for PSAC, we first matched PSAC L1 data containing TOA reflectance data, solar zenith angle data, and satellite zenith angle data with AERONET CWV data within region 1. In this paper, we use the temporal mean of AERONET PWV data within half an hour of observation time of PSAC to match the cloudless pixels where the AERONET site is located. Note that the TOA reflectance of band 2 and the TOA reflectance difference between adjacent pixels of bands 2 and 7 are used to judge whether a pixel is a cloud pixel. The specific judgment criteria are described in Section 3.2. There are a total of 839 valid matches.
After that, we can calculate the natural logarithm of water vapor absorption transmittance of band 6 of PSAC (i.e., l n ( T g 910   nm ) ) and the slanted water vapor content in the path of the sun-ground-satellite (i.e., V C W V L ) of each valid match based on the corresponding AERONET CWV data, solar zenith angle data, satellite zenith angle data, and TOA reflectance of bands 5 and 6. Finally, we can substitute the above matching results into Equation (3) to establish 839 equations containing only three unknowns (A, B, and C), and determine the values of A, B, and C by using the least squares method. The scatter plot of the slanted water vapor content in the path of the sun-ground-satellite and natural logarithm of water vapor absorption transmittance of band 6 of PSAC of the above matching results is shown in Figure 3.
As shown in Figure 3, there is a significant correlation (R2 = 0.98) between the slanted water vapor content in the path of the sun-ground-satellite ( V C W V L ) and natural logarithm of water vapor absorption transmittance of band 6 of PSAC ( l n ( T g 910   nm ) ). This means that it is feasible to retrieve water vapor based on the data from bands 5 and 6 of PSAC. For band 6 of PSAC, A, B, and C in Equation (3) are equal to 13.944, −4.867, and −0.049, respectively. Therefore, the semi-empirical equation for retrieving water vapor content can be expressed as:
V C W V = 13.944 ( l n ( T g 910   nm ) ) 2 4.867 l n ( T g 910   nm ) 0.049 L ,

3.2. Cloud Mask

The NIR CWV retrieval algorithm is only applicable to the pixels not affected by clouds, so it is necessary to remove the cloud-influenced part of the PSAC CWV retrieval results to ensure the quality of PSAC CWV data. Two methods are used to identify cloud pixels. If a pixel is identified as a cloud pixel by any of the methods, the pixel is removed as a cloud pixel.
(1) The TOA reflectance of band 2 (443 nm) and band 7 (1380 nm) is used for the cloud identification [33,34]. For a pixel that needs to be detected, if the TOA reflectance of band 2 of the pixel is greater than 0.4, the pixel would be regarded as a cloud pixel. Next, we identify cloud pixels based on the TOA reflectance of band 7. For a pixel that needs to be detected, it is first assumed that the pixel is not affected by clouds. Then we can calculate the CWV of the pixel based on Equation (5). Next, the water vapor absorption transmittance of band 7 can be calculated using the Second Simulation of the Satellite Signal in the Solar Spectrum (6SV) model based on the calculated CWV [35]. Since the TOA reflectance of band 7 is less than 1 for cloud-free pixels when water vapor content is equal to 0, so the actual observed TOA reflectance of band 7 should be less than the value of 1 multiplied by the water vapor absorption transmittance calculated above. In other words, if a pixel is not affected by clouds, the actual observed TOA reflectance of band 7 of the pixel is less than the water vapor absorption transmittance of band 7 of the pixel calculated based on the above method. Therefore, if the actual observed TOA reflectance of band 7 of a pixel is not smaller than the water vapor absorption transmittance of band 7 of the pixel calculated based on the above method, the pixel would be regarded as a cloud pixel.
(2) The TOA reflectance difference between adjacent pixels of band 2 and band 7 is used for the cloud identification [5,36]. For a pixel that needs to be detected, the standard deviation of apparent reflectance of it and its nearest 8 pixels is used to characterize the difference. The specific calculation method is given in Equation (6). If the calculated standard deviation of band 2 is greater than 0.01, or the standard deviation of band 7 is greater than 0.005, the pixel would be considered as a cloud pixel.
STD = i = 1 9 ( R T O A i R T O A m e a n ) 2 9 ,
where R T O A i is the TOA reflectance with a different serial number, R T O A m e a n is the average value of all 9 TOA reflectance participating in the calculation, and STD represents the calculated standard deviation.
Note that the above thresholds (i.e., 0.4, 0.01, and 0.005) were set with reference to the threshold used by the cloud mask algorithms of the Advanced Himawari Imager (AHI) and MODIS that use similar bands to PSAC. Since the cloud mask is not the focus of this paper, the requirement for the cloud mask algorithm in this paper is that most cloud pixels can be detected. Examples of cloud mask results based on the above methods are shown in Figure 4. By analyzing Figure 4, it can be seen that the cloud mask methods used in this work are basically effective in identifying cloudy pixels.

4. Results

In this section, the quality of PSAC CWV data is evaluated in two ways, including overall validation results and analysis of day-to-day variation in CWV.

4.1. Overall Validation Results

To clearly understand the advantages and disadvantages of PSAC CWV data, we not only used AERONET data to assess the quality of PSAC CWV data but compared its accuracy with that of widely used and fully validated MODIS CWV data derived from MODIS onboard Terra (MOD05) [11,37,38]. Existing validation results show that MOD05 has a high correlation with ground-based CWV data, but MOD05 has a significant overestimation [39,40]. Since the accuracy of MOD05 derived from Terra/MODIS and MYD05 derived from MODIS/Aqua is close [40], MOYD05 is not used together with MOD05. The above MODIS CWV data can be downloaded free of charge from the Internet (https://ladsweb.modaps.eosdis.nasa.gov/, last accessed on 26 January 2022). A total of five parameters were used for quality assessment of remote sensing CWV data, including root mean square error (RMSE), mean absolute error (MAE), mean bias (MB), relative error (RE), and percentage of CWV data with error within ± ( 0.05 + 0.1 C W V A E R O N E T ) (PER10). The calculation equations of RMSE, MAE, MB, and RE are as follows:
RMSE = i = 1 N ( V c w v i V c w v i , ) 2 / N ,
MAE = i = 1 N | V c w v i V c w v i , | / N ,
MB = i = 1 N ( V c w v i V c w v i , ) / N ,
RE = i = 1 N | V c w v i V c w v i , | / i = 1 N V c w v i , ,
where N is the number of effective matching results between AERONET CWV data and remote sensing CWV data, V c w v i is the value of remote sensing CWV data of the ith matching result, and V c w v i , is the value of ground-based CWV data corresponding to V c w v i .
In this work, we used the temporal mean of ground-based observations within half an hour of the satellite observation time to match the spatial average of remote sensing CWV data within the range of 9 × 9 km centered on the ground-based site [27,39]. The scatter plots of the matching results between PSAC CWV data, MODIS CWV data, and AERONET data are shown in Figure 5. From Figure 5, it can be found that there is no obvious overestimation or underestimation in PSAC CWV data (MB = −0.03 cm). However, there is a large overestimation in the MODIS CWV dataset (MB = 0.47 cm), which is consistent with the existing quality assessment results of MODIS CWV data [39,40]. The RMSE, MAE, RE, and PER10 of PSAC CWV data are 0.17 cm, 0.13 cm, 0.08, and 78.19%, respectively. The RMSE, MAE, RE, and PER10 of MODIS CWV data are 0.59 cm, 0.48 cm, 0.28, and 16.55%, respectively. Compared with MODIS CWV data, PSAC CWV data shows a 71% decrease in RMSE, a 73% decrease in MAE, a 71% decrease in RE. By analyzing the values of above statistical parameters, it can be found that, whether the MAE and RMSE used to characterize absolute error or the RE used to characterize relative error is selected for quality assessment of remote sensing CWV data, the accuracy of PSAC CWV data is significantly better than that of MODIS CWV data.
The obvious overestimation of MODIS CWV data is the main reason why the absolute error and relative error of MODIS CWV data are obviously worse than those of PSAC CWV data. In addition, due to the big systematic error of MODIS CWV data, the PER10 of PSAC CWV data (78.19%) is significantly larger than that of MODIS CWV data (16.55%). Since the PER10 of PSAC CWV data is greater than 68.27%, it can be considered that the expected error of PSAC CWV data is less than ± ( 0.05 + 0.1 C W V A E R O N E T ) . In summary, it can be concluded that PSAC CWV data has no large systematic deviation and has a high accuracy, which is higher than that of MODIS CWV data.

4.2. Analysis of Day-to-Day Variation in CWV

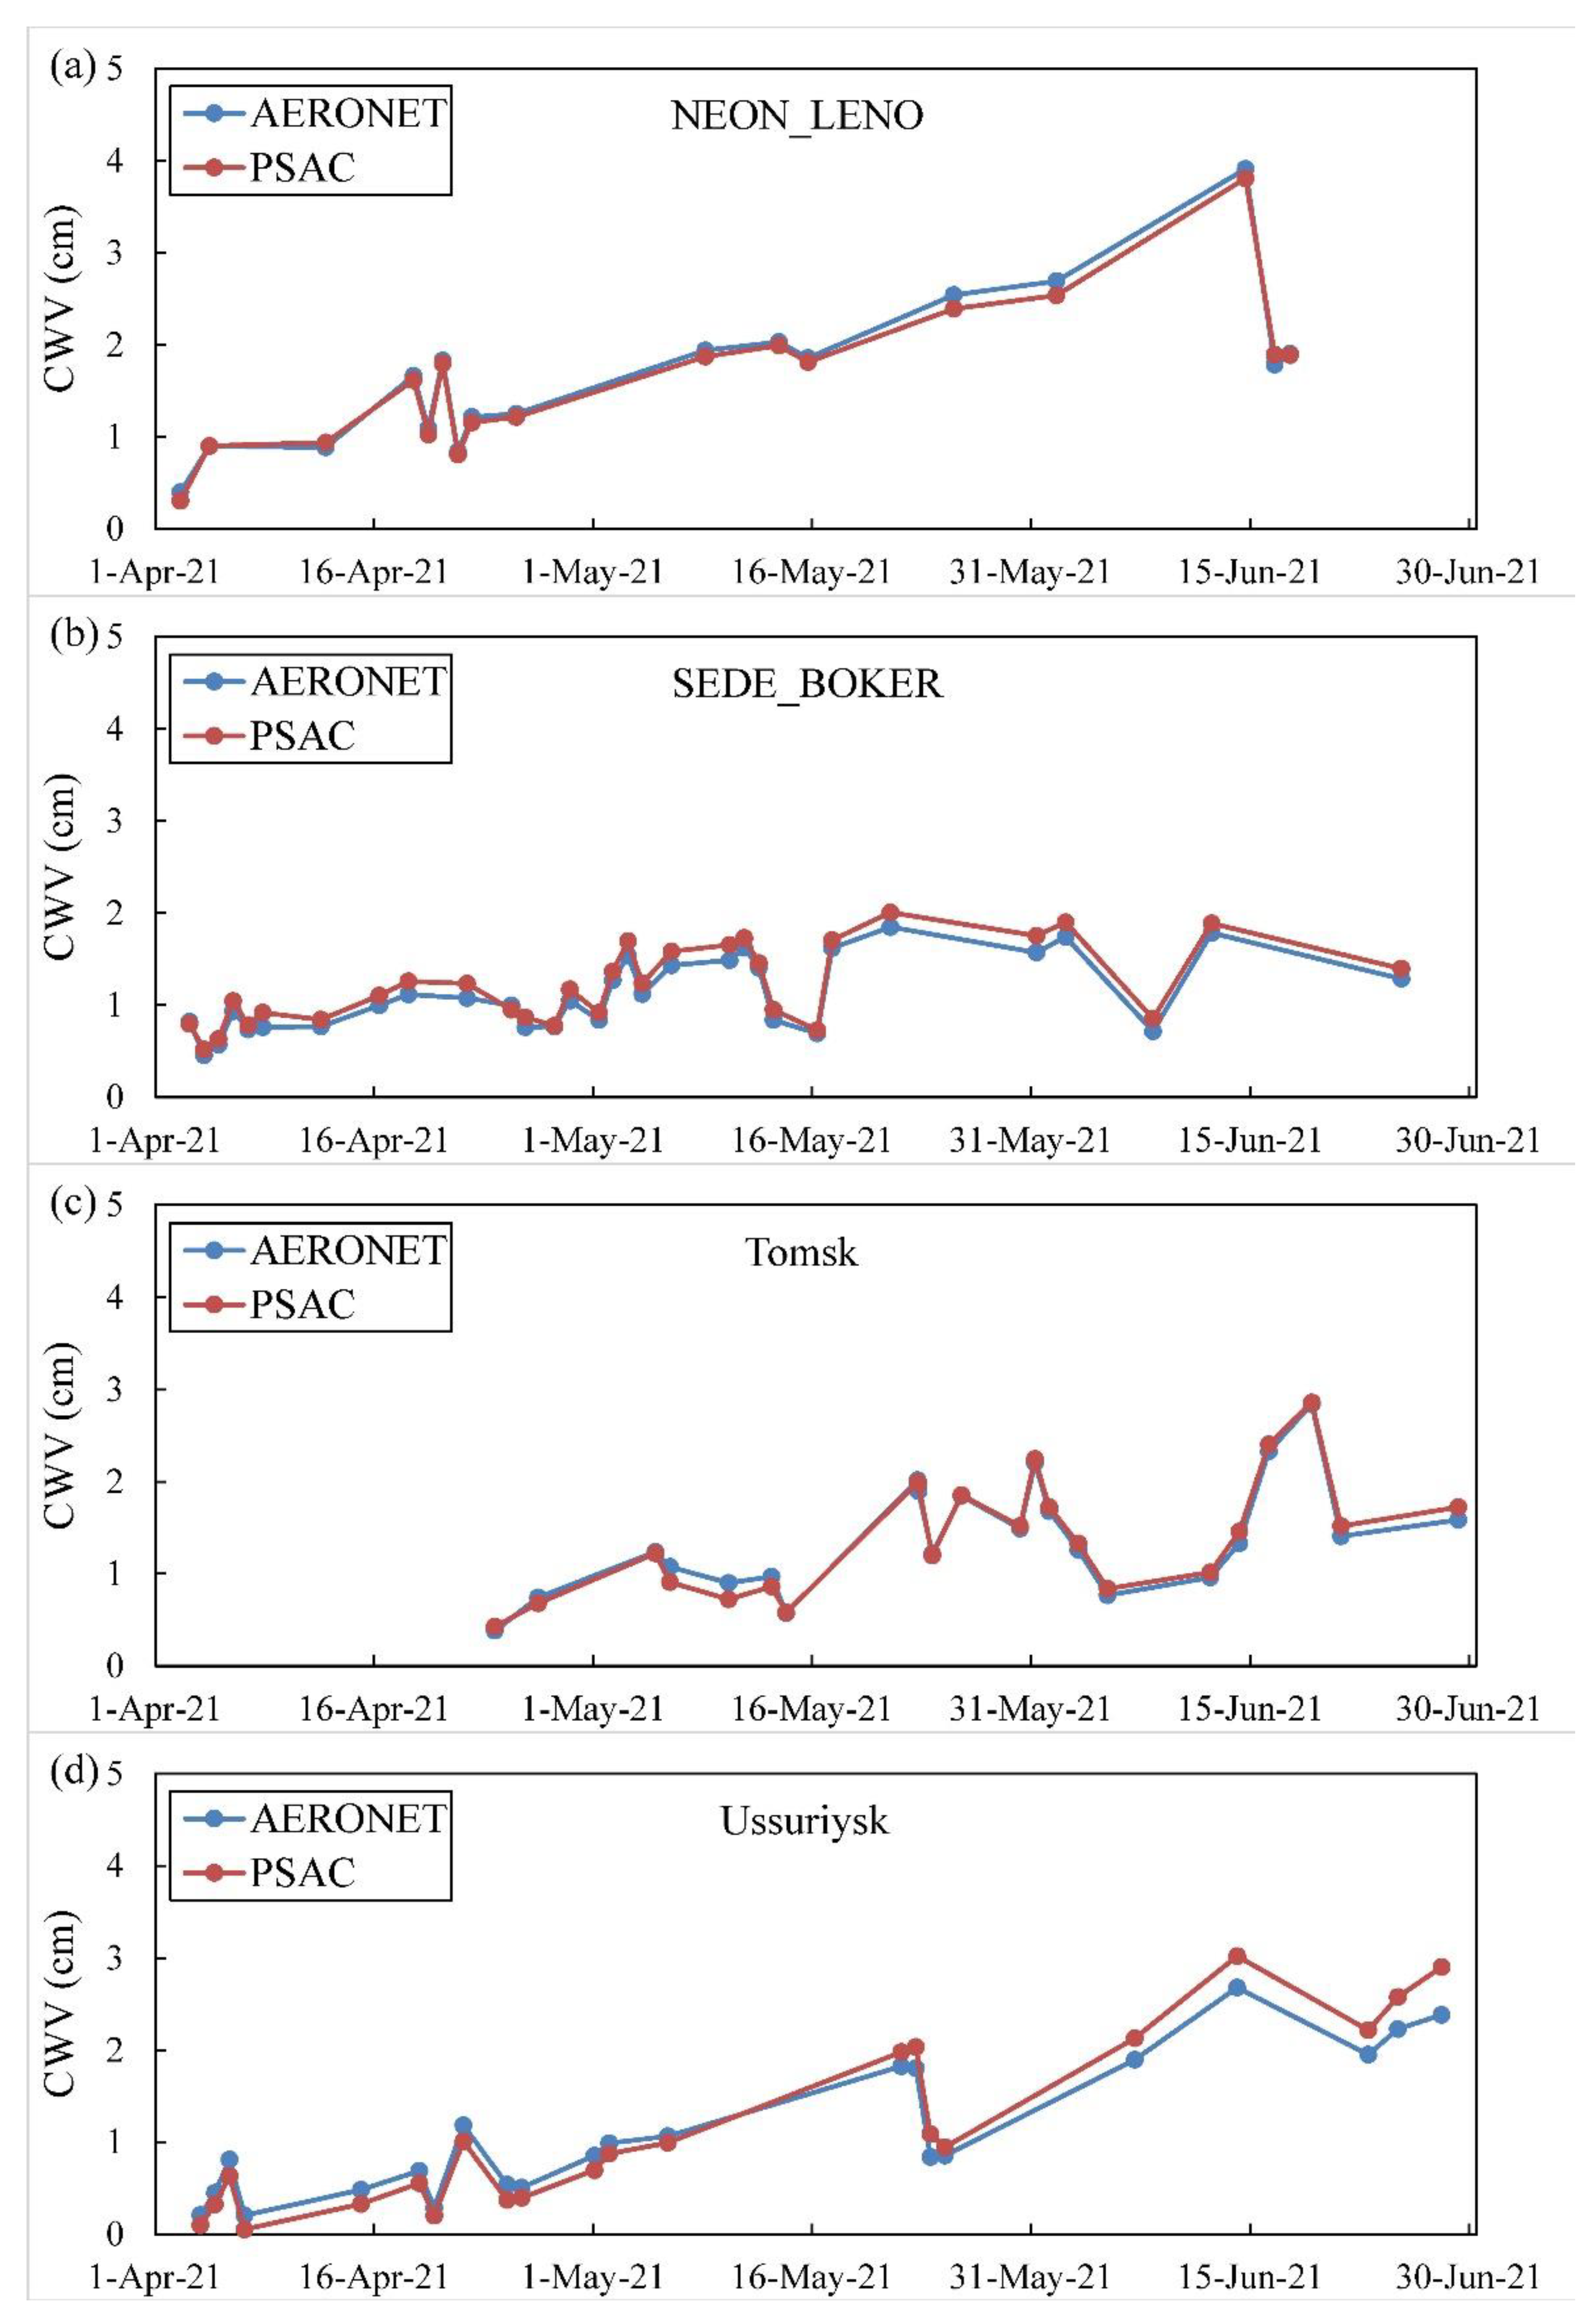
As shown in Figure 6, the day-to-day comparisons between PSAC CWV data and AERONET CWV data were performed at four AERONET sites in different regions to evaluate the time consistency between them. The selected sites are NEON_LENO (88.16°W, 31.85°N), SEDE_BOKER (34.78°E, 30.86°N), Tomsk (85.05°E, 56.48°N), and Ussuriysk (132.16°E, 43.70°N), respectively. In general, AERONET CWV data and PSAC CWV data have very high consistency, and more than 90% of them having a difference of less than 0.2 cm. This indicates that PSAC CWV data can effectively characterize the daily variation in CWV.

5. Discussion

Compared with the widely used water vapor retrieval algorithm based on look-up table, the semi-empirical algorithm developed in this study has an extremely high retrieval efficiency because it does not need to use the radiative transfer model such as the MODerate resolution atmospheric TRANsmission (MODTRAN) computer code [41] to build the look-up table before retrieval and retrieve CWV by querying the look-up table [20]. Additionally, our algorithm has very strong portability. Although it is only used for PSAC at present, it can be easily used for CWV retrieval of sensors such as MODIS and MERSI-2 that have both a water vapor absorption band and a band unaffected by water vapor absorption in the spectral range of 850–1250 nm [11].
Although PSAC CWV data developed in this work has a high accuracy and can effectively characterize the change trend of CWV, it still has some limitations. First, because the water vapor retrieval algorithm developed in this study needs to use historical PSAC data and AERONET data to determine the parameters of the algorithm model (A, B, and C in Equation (3)), it cannot be used for CWV retrieval immediately after the launch of HJ-2 satellites. However, HJ-2 satellites will undergo nearly one year of in-orbit testing before operational operation, a large amount of data will be accumulated during this period, which is sufficient for building the algorithm model. Therefore, it is feasible to use it as an operational algorithm.
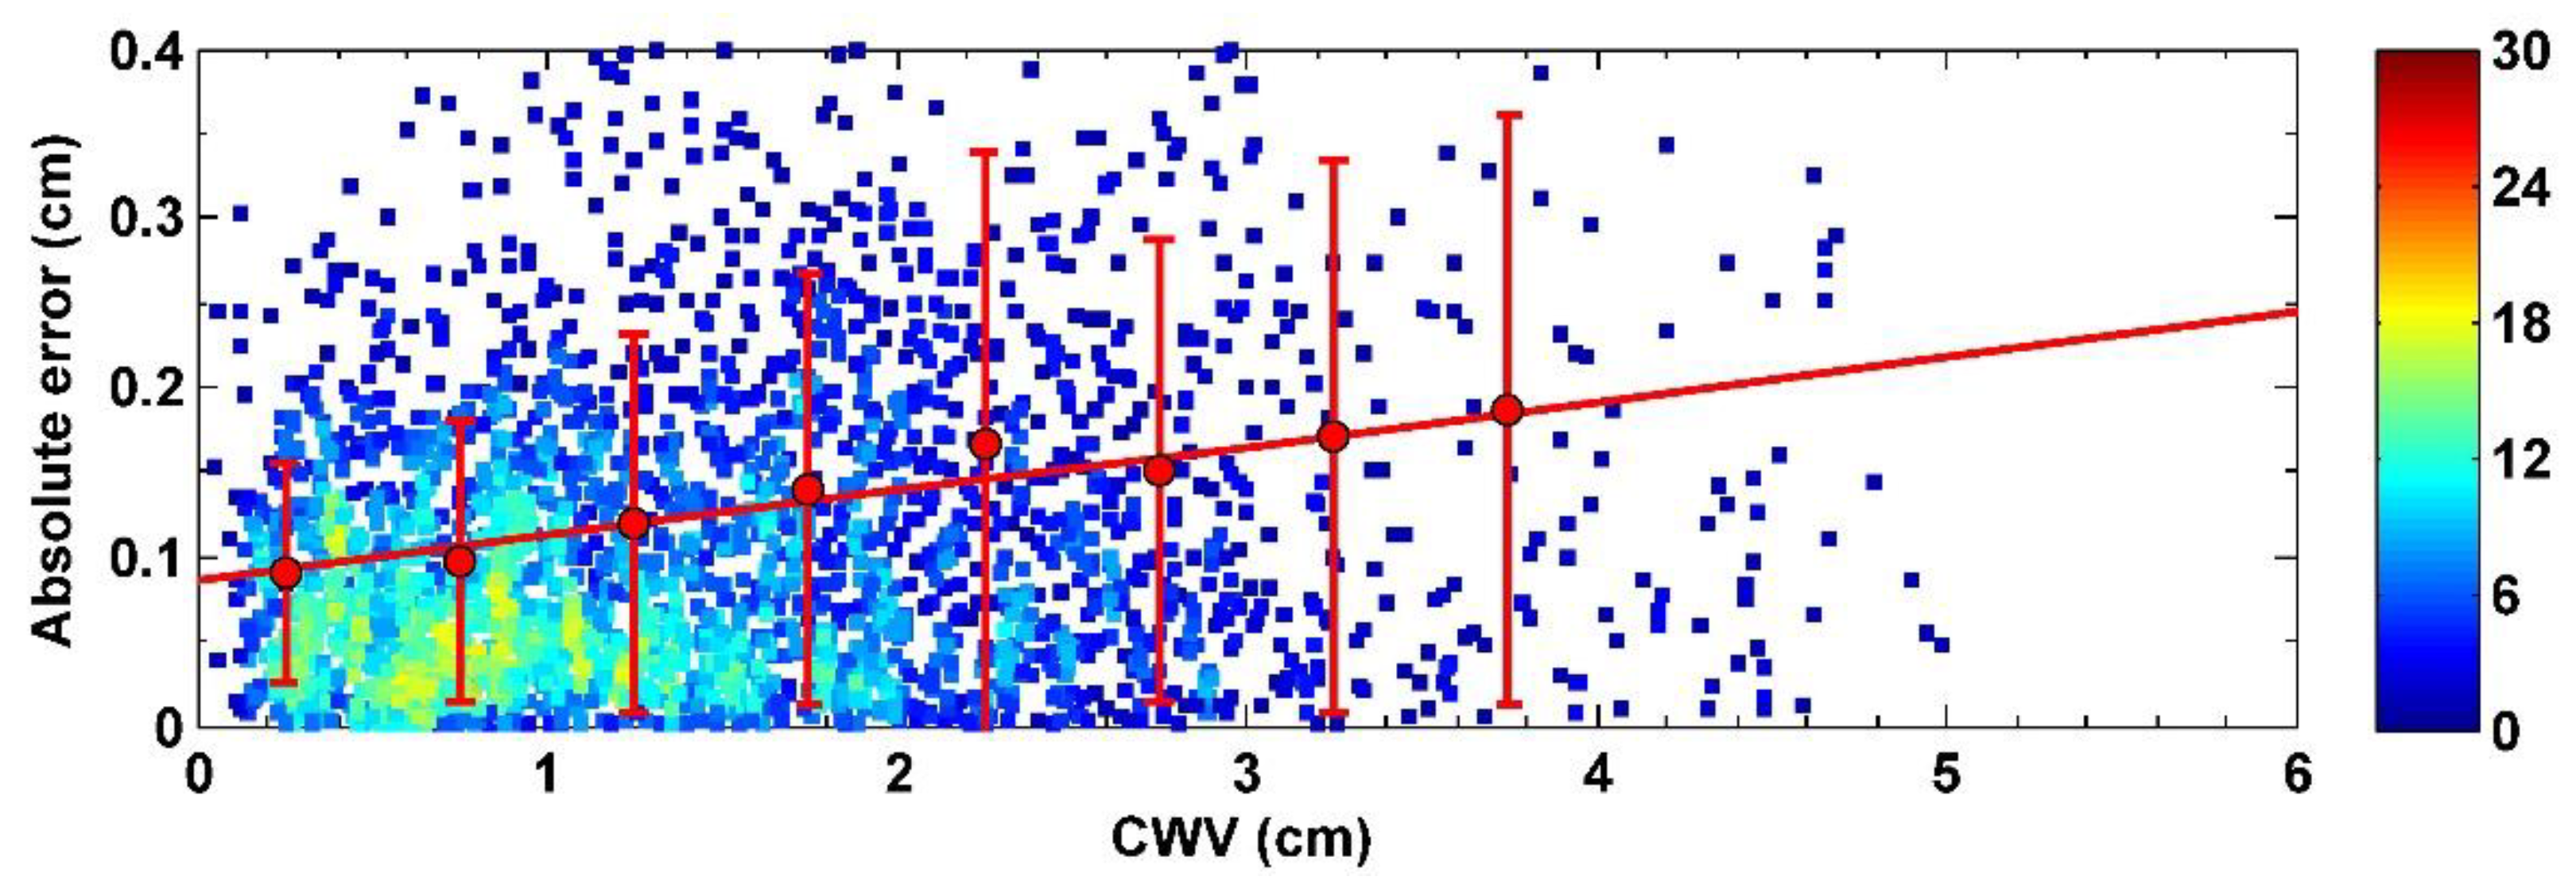
In addition, as shown in Figure 7, the retrieval error of PSAC CWV data generally increases with the increase in CWV. This is unavoidable mainly because the sensitivity of band 6 to water vapor gradually decreases with the increasing water vapor content [42]. Although the sensitivity of all NIR bands to water vapor decreases with increasing water vapor content, the sensitivity of different water vapor absorption channels to water vapor is different. This means that the retrieval error of remote sensing CWV data can be reduced by using a band that is more sensitive to water vapor at high water vapor content compared to band 6. For example, MODIS and MERSI-2 are equipped with three NIR water vapor absorption bands to improve the accuracy of CWV retrieval results. Therefore, to improve the accuracy of CWV retrieval results at high water vapor content, two or more water vapor absorption bands are necessary for the subsequent PSACs.

6. Conclusions

In this study, we developed a water vapor retrieval algorithm using two bands (865 and 910 nm) for PSAC onboard HJ-2 satellites, which is constructed based on the high correlation between the water vapor absorption transmittance of band 6 at 910 nm and water vapor content. The semi-empirical algorithm consists of three parts: (1) calculating the water vapor absorption transmittance of band 6 of PSAC; (2) constructing the relationship between the water vapor absorption transmittance of band 6 and CWV; (3) inverting CWV based on the constructed relationship. Since it can directly calculate CWV based on PSAC data and does not need to build the look-up table before retrieval and retrieve CWV by querying the look-up table, it has a very high retrieval efficiency.
To clearly assess the quality of PSAC CWV data, we not only use AERONET data to validate PSAC CWV data but compare its accuracy with that of widely used MODIS CWV data. The validation results based on ground-based CWV data from 312 AERONET sites show that PSAC CWV has a very high accuracy, and its accuracy is significantly better than that of MODIS CWV data released by NASA. The RMSE, MAE, RE, and PER10 of PSAC CWV data are 0.17 cm, 0.13 cm, 0.08, and 78.19%, respectively. The RMSE, MAE, RE, and PER10 of MODIS CWV data are 0.59 cm, 0.48 cm, 0.28, and 16.55%, respectively. Compared with MODIS CWV data, PSAC CWV data shows a 71% decrease in RMSE, a 73% decrease in MAE, a 71% decrease in RE, and a 372% increase in PER10. In addition, time-series comparisons between PSAC CWV data and AERONET data were performed to evaluate the time consistency between them. The results show that PSAC CWV data can effectively characterize the change trend of CWV.

Author Contributions

This work was carried out in collaboration with all the authors. Conceptualization, Y.X., W.H., Z.L. (Zhengqiang Li), Z.L. (Zhenhai Liu), J.H., B.Y., X.S. and Y.Q.; methodology, Y.X., W.H., Z.L. (Zhengqiang Li), Y.M., C.F. and J.G.; data acquisition, Y.X., W.H., S.Z., X.L. (Xuefeng Lei), H.H., X.L. (Xiao Liu), Y.Z., M.S. and P.Z.; writing and revision, Y.X., W.H., Z.L. (Zhengqiang Li), S.Z., Y.Z. and Z.L. (Zhenhai Liu). All authors have read and agreed to the published version of the manuscript.

Funding

This work was supported by the National Natural Science Foundation of China (Grant No. 41871269), the National Outstanding Youth Foundation of China (Grant No. 41925019), the National Natural Science Foundation of China (Grant No. 41701407), and the K. C. Wong Education Foundation (Grant No. GJTD-2018-15).

Institutional Review Board Statement

Not applicable.

Informed Consent Statement

Not applicable.

Data Availability Statement

PSAC data can be obtained from China Centre for Resources Satellite Data and Application (Available online: http://www.cresda.com (accessed on 18 January 2022)). AERONET data can be downloaded from the official website of AERONET (https://aeronet.gsfc.nasa.gov/, last accessed on 23 January 2022). MODIS data can be downloaded from the official website of NASA (https://ladsweb.modaps.eosdis.nasa.gov/, last accessed on 26 January 2022).

Acknowledgments

The authors thank Jun Lin, Zhongzheng Hu and Lanlan Fan of China Centre for Resources Satellite Data and Application for providing PSAC L1 data during the in-orbit test of the HJ-2 A/B satellites, and Zhaoguang Bai, Jun Zhu and Qiang Cong of DFH Satellite Co. Ltd. for helpful discussions on the PSAC instrument. The ground-based CWV data used to validate the remote sensing CWV data were obtained from 350 AERONET sites. We would also like to thank the PI(s), Co-I(s) and their staff for their efforts in establishing and maintaining the AERONET sites. In addition, we thank NASA for providing us with MODIS water vapor data.

Conflicts of Interest

The authors declare no conflict of interest.

References

  1. Lyngwa, R.V.; Nayak, M.A. Atmospheric river linked to extreme rainfall events over Kerala in August 2018. Atmos. Res. 2021, 253, 13. [Google Scholar] [CrossRef]
  2. Griffith, H.V.; Wade, A.J.; Lavers, D.A.; Watts, G. Atmospheric river orientation determines flood occurrence. Hydrol. Processes 2020, 34, 4547–4555. [Google Scholar] [CrossRef]
  3. Held, I.M.; Soden, B.J. Water Vapor Feedback and Global Warming. Annu. Rev. Energy Environ. 2000, 25, 441–475. [Google Scholar] [CrossRef] [Green Version]
  4. Dessler, A.; Zhang, Z.; Yang, P. Water-vapor climate feedback inferred from climate fluctuations, 2003–2008. Geophys. Res. Lett. 2008, 35. [Google Scholar] [CrossRef] [Green Version]
  5. Xue, Y.; He, X.W.; Xu, H.; Guang, J.; Guo, J.P.; Mei, L.L. China Collection 2.0: The aerosol optical depth dataset from the synergetic retrieval of aerosol properties algorithm. Atmos. Environ. 2014, 95, 45–58. [Google Scholar] [CrossRef]
  6. Li, Z.; Hou, W.; Qiu, Z.; Ge, B.; Xie, Y.; Hong, J.; Ma, Y.; Peng, Z.; Fang, W.; Zhang, D.; et al. Preliminary On-Orbit Performance Test of the First Polarimetric Synchronization Monitoring Atmospheric Corrector (SMAC) On-Board High-Spatial Resolution Satellite Gao Fen Duo Mo (GFDM). IEEE Trans. Geosci. Remote Sens. 2021, 60, 1–14. [Google Scholar] [CrossRef]
  7. Richter, R.; Schläpfer, D.; Müller, A. An automatic atmospheric correction algorithm for visible/NIR imagery. Int. J. Remote Sens. 2006, 27, 2077–2085. [Google Scholar] [CrossRef]
  8. Hou, W.; Xie, Y.; Li, Z.; Yang, H.; Hu, Z.; Song, C.; Lin, J.; Huang, H.; Lei, X.; Ge, B.; et al. Preliminary Study on the Multispectral Measurement Simulations of Polarized Scanning Atmospheric Corrector Image; SPIE: Beijing, China, 2020; Volume 11566. [Google Scholar]
  9. Vermote, E.F.; El Saleous, N.Z.; Justice, C.O. Atmospheric correction of MODIS data in the visible to middle infrared: First results. Remote Sens. Environ. 2002, 83, 97–111. [Google Scholar] [CrossRef]
  10. Gao, B.-C.; Montes, M.J.; Davis, C.O.; Goetz, A.F.H. Atmospheric correction algorithms for hyperspectral remote sensing data of land and ocean. Remote Sens. Environ. 2009, 113, S17–S24. [Google Scholar] [CrossRef]
  11. Gao, B.C.; Kaufman, Y.J. Water vapor retrievals using moderate resolution Imaging spectroradiometer (MODIS) near-infrared channels. J. Geophys. Res. Atmos. 2003, 108, 10. [Google Scholar] [CrossRef]
  12. Eck, T.F.; Holben, B.N. AVHRR split window temperature differences and total precipitable water over land surfaces. Int. J. Remote Sens. 1994, 15, 567–582. [Google Scholar] [CrossRef]
  13. Wu, Z.L.; Liu, Y.X.; Liu, Y.; Wang, J.G.; He, X.F.; Xu, W.X.; Ge, M.R.; Schuh, H. Validating HY-2A CMR precipitable water vapor using ground-based and shipborne GNSS observations. Atmos. Meas. Tech. 2020, 13, 4963–4972. [Google Scholar] [CrossRef]
  14. Wang, H.; Souri, A.H.; Gonzalez Abad, G.; Liu, X.; Chance, K. Ozone Monitoring Instrument (OMI) Total Column Water Vapor version 4 validation and applications. Atmos. Meas. Tech. 2019, 12, 5183–5199. [Google Scholar] [CrossRef] [Green Version]
  15. Heise, S.; Wickert, J.; Beyerle, G.; Schmidt, T.; Reigber, C. Global monitoring of tropospheric water vapor with GPS radio occultation aboard CHAMP. Adv. Space Res. 2006, 37, 2222–2227. [Google Scholar] [CrossRef] [Green Version]
  16. Wang, X.; Lu, D.R.; Xue, Z.G. A Non-Linear Inverse Method for Retrieval of Water Vapour from Radio Occultation Measurements. Chinese J. Geophys. 2005, 48, 47–54. [Google Scholar] [CrossRef]
  17. Koulali, A.; Ouazar, D.; Bock, O.; Fadil, A. Study of seasonal-scale atmospheric water cycle with ground-based GPS receivers, radiosondes and NWP models over Morocco. Atmos. Res. 2012, 104, 273–291. [Google Scholar] [CrossRef]
  18. Campmany, E.; Bech, J.; Rodríguez-Marcos, J.; Sola, Y.; Lorente, J. A comparison of total precipitable water measurements from radiosonde and sunphotometers. Atmos. Res. 2010, 97, 385–392. [Google Scholar] [CrossRef] [Green Version]
  19. Chan, K.L.; Valks, P.; Slijkhuis, S.; Köhler, C.; Loyola, D. Total column water vapor retrieval for Global Ozone Monitoring Experience-2 (GOME-2) visible blue observations. Atmos. Meas. Tech. 2020, 13, 4169–4193. [Google Scholar] [CrossRef]
  20. Abbasi, B.; Qin, Z.H.; Du, W.H.; Fan, J.L.; Zhao, C.L.; Hang, Q.Y.; Zhao, S.H.; Li, S.F. An Algorithm to Retrieve Total Precipitable Water Vapor in the Atmosphere from FengYun 3D Medium Resolution Spectral Imager 2 (FY-3D MERSI-2) Data. Remote Sens. 2020, 12, 3469. [Google Scholar] [CrossRef]
  21. Moradizadeh, M.; Momeni, M.; Saradjian, M.R. Estimation and validation of atmospheric water vapor content using a MODIS NIR band ratio technique based on AIRS water vapor products. Arab. J. Geosci. 2014, 7, 1891–1897. [Google Scholar] [CrossRef]
  22. Zhang, X.Y.; Pang, J. A comparison between atmospheric water vapour content retrieval methods using MSG2-SEVIRI thermal-IR data. Int. J. Remote Sens. 2015, 36, 5075–5086. [Google Scholar] [CrossRef]
  23. Du, B.L.; Ji, D.B.; Shi, J.C.; Wang, Y.Q.; Lei, T.J.; Zhang, P.; Letu, H. The Retrieval of Total Precipitable Water over Global Land Based on FY-3D/MWRI Data. Remote Sens. 2020, 12, 1508. [Google Scholar] [CrossRef]
  24. Holben, B.N.; Eck, T.F.; Slutsker, I.; Tanre, D.; Buis, J.P.; Setzer, A.; Vermote, E.; Reagan, J.A.; Kaufman, Y.J.; Nakajima, T.; et al. AERONET—A federated instrument network and data archive for aerosol characterization. Remote Sens. Environ. 1998, 66, 1–16. [Google Scholar] [CrossRef]
  25. Pérez-Ramírez, D.; Whiteman, D.N.; Smirnov, A.; Lyamani, H.; Holben, B.N.; Pinker, R.; Andrade, M.; Alados-Arboledas, L. Evaluation of AERONET precipitable water vapor versus microwave radiometry, GPS, and radiosondes at ARM sites. J. Geophys. Res. Atmos. 2014, 119, 9596–9613. [Google Scholar] [CrossRef] [Green Version]
  26. Alexandrov, M.D.; Schmid, B.; Turner, D.D.; Cairns, B.; Oinas, V.; Lacis, A.A.; Gutman, S.I.; Westwater, E.R.; Smirnov, A.; Eilers, J. Columnar water vapor retrievals from multifilter rotating shadowband radiometer data. J. Geophys. Res. Atmos. 2009, 114. [Google Scholar] [CrossRef] [Green Version]
  27. Martins, V.S.; Lyapustin, A.; Wang, Y.J.; Giles, D.M.; Smirnov, A.; Slutsker, I.; Korkin, S. Global validation of columnar water vapor derived from EOS MODIS-MAIAC algorithm against the ground-based AERONET observations. Atmos. Res. 2019, 225, 181–192. [Google Scholar] [CrossRef] [Green Version]
  28. Giles, D.M.; Sinyuk, A.; Sorokin, M.G.; Schafer, J.S.; Smirnov, A.; Slutsker, I.; Eck, T.F.; Holben, B.N.; Lewis, J.R.; Campbell, J.R.; et al. Advancements in the Aerosol Robotic Network (AERONET) Version 3 database—Automated near-real-time quality control algorithm with improved cloud screening for Sun photometer aerosol optical depth (AOD) measurements. Atmos. Meas. Tech. 2019, 12, 169–209. [Google Scholar] [CrossRef] [Green Version]
  29. Fraser, R.S.; Kaufman, Y.J. The Relative Importance of Aerosol Scattering and Absorption in Remote-Sensing. IEEE Trans. Geosci. Remote Sens. 1985, 23, 625–633. [Google Scholar] [CrossRef]
  30. Hansen, J.E.; Travis, L.D. Light scattering in planetary atmospheres. Space Sci. Rev. 1974, 16, 527–610. [Google Scholar] [CrossRef]
  31. Bouffies, S.; Breon, F.M.; Tanre, D.; Dubuisson, P. Atmospheric water vapor estimate by a differential absorption technique with the polarisation and directionality of the Earth reflectances (POLDER) instrument. J. Geophys. Res. Atmos. 1997, 102, 3831–3841. [Google Scholar] [CrossRef]
  32. Bennartz, R.; Fischer, J. Retrieval of columnar water vapour over land from backscattered solar radiation using the Medium Resolution Imaging Spectrometer. Remote Sens. Environ. 2001, 78, 274–283. [Google Scholar] [CrossRef]
  33. Yang, F.K.; Wang, Y.; Tao, J.H.; Wang, Z.F.; Fan, M.; de Leeuw, G.; Chen, L.F. Preliminary Investigation of a New AHI Aerosol Optical Depth (AOD) Retrieval Algorithm and Evaluation with Multiple Source AOD Measurements in China. Remote Sens. 2018, 10, 748. [Google Scholar] [CrossRef] [Green Version]
  34. Ge, B.Y.; Li, Z.Q.; Liu, L.; Yang, L.K.; Chen, X.F.; Hou, W.Z.; Zhang, Y.; Li, D.H.; Li, L.; Qie, L.L. A Dark Target Method for Himawari-8/AHI Aerosol Retrieval: Application and Validation. IEEE Trans. Geosci. Remote Sens. 2019, 57, 381–394. [Google Scholar] [CrossRef]
  35. Vermote, E.F.; Tanre, D.; Deuze, J.L.; Herman, M.; Morcrette, J.J. Second Simulation of the Satellite Signal in the Solar Spectrum, 6S: An overview. IEEE Trans. Geosci. Remote Sens. 1997, 35, 675–686. [Google Scholar] [CrossRef] [Green Version]
  36. Martins, J.V.; Tanré, D.; Remer, L.; Kaufman, Y.; Mattoo, S.; Levy, R. MODIS Cloud screening for remote sensing of aerosols over oceans using spatial variability. Geophys. Res. Lett. 2002, 29, MOD4-1–MOD4-4. [Google Scholar] [CrossRef] [Green Version]
  37. Shi, F.L.; Xin, J.Y.; Yang, L.K.; Cong, Z.Y.; Liu, R.X.; Ma, Y.N.; Wang, Y.S.; Lu, X.F.; Zhao, L. The first validation of the precipitable water vapor of multisensor satellites over the typical regions in China. Remote Sens. Environ. 2018, 206, 107–122. [Google Scholar] [CrossRef]
  38. Gui, K.; Che, H.; Chen, Q.; Zeng, Z.; Liu, H.; Wang, Y.; Zheng, Y.; Sun, T.; Liao, T.; Wang, H.; et al. Evaluation of radiosonde, MODIS-NIR-Clear, and AERONET precipitable water vapor using IGS ground-based GPS measurements over China. Atmos. Res. 2017, 197, 461–473. [Google Scholar] [CrossRef]
  39. Xie, Y.; Li, Z.; Hou, W.; Guang, J.; Ma, Y.; Wang, Y.; Wang, S.; Yang, D. Validation of FY-3D MERSI-2 Precipitable Water Vapor (PWV) Datasets Using Ground-Based PWV Data from AERONET. Remote Sens. 2021, 13, 3246. [Google Scholar] [CrossRef]
  40. Bright, J.M.; Gueymard, C.A.; Killinger, S.; Lingfors, D.; Sun, X.X.; Wang, P.; Engerer, N.A. Climatic and Global Validation of Daily MODIS Precipitable Water Data at AERONET Sites for Clear-Sky Irradiance Modelling; International Solar Energy Society: Freiburg, Germany, 2018; pp. 1490–1501. [Google Scholar] [CrossRef] [Green Version]
  41. Berk, A.; Conforti, P.; Kennett, R.; Perkins, T.; Hawes, F.; Bosch, J. MODTRAN6: A major upgrade of the MODTRAN radiative transfer code. In Proceedings of the 6th Workshop on Hyperspectral Image and Signal Processing: Evolution in Remote Sensing (WHISPERS), Lausanne, Switzerland, 24–27 June 2014; Volume 9088, p. 90880H. [Google Scholar]
  42. Wang, L.; Hu, X.Q.; Xu, N.; Chen, L. Water Vapor Retrievals from Near-infrared Channels of the Advanced Medium Resolution Spectral Imager Instrument onboard the Fengyun-3D Satellite. Adv. Atmos. Sci. 2021, 38, 1351–1366. [Google Scholar] [CrossRef]
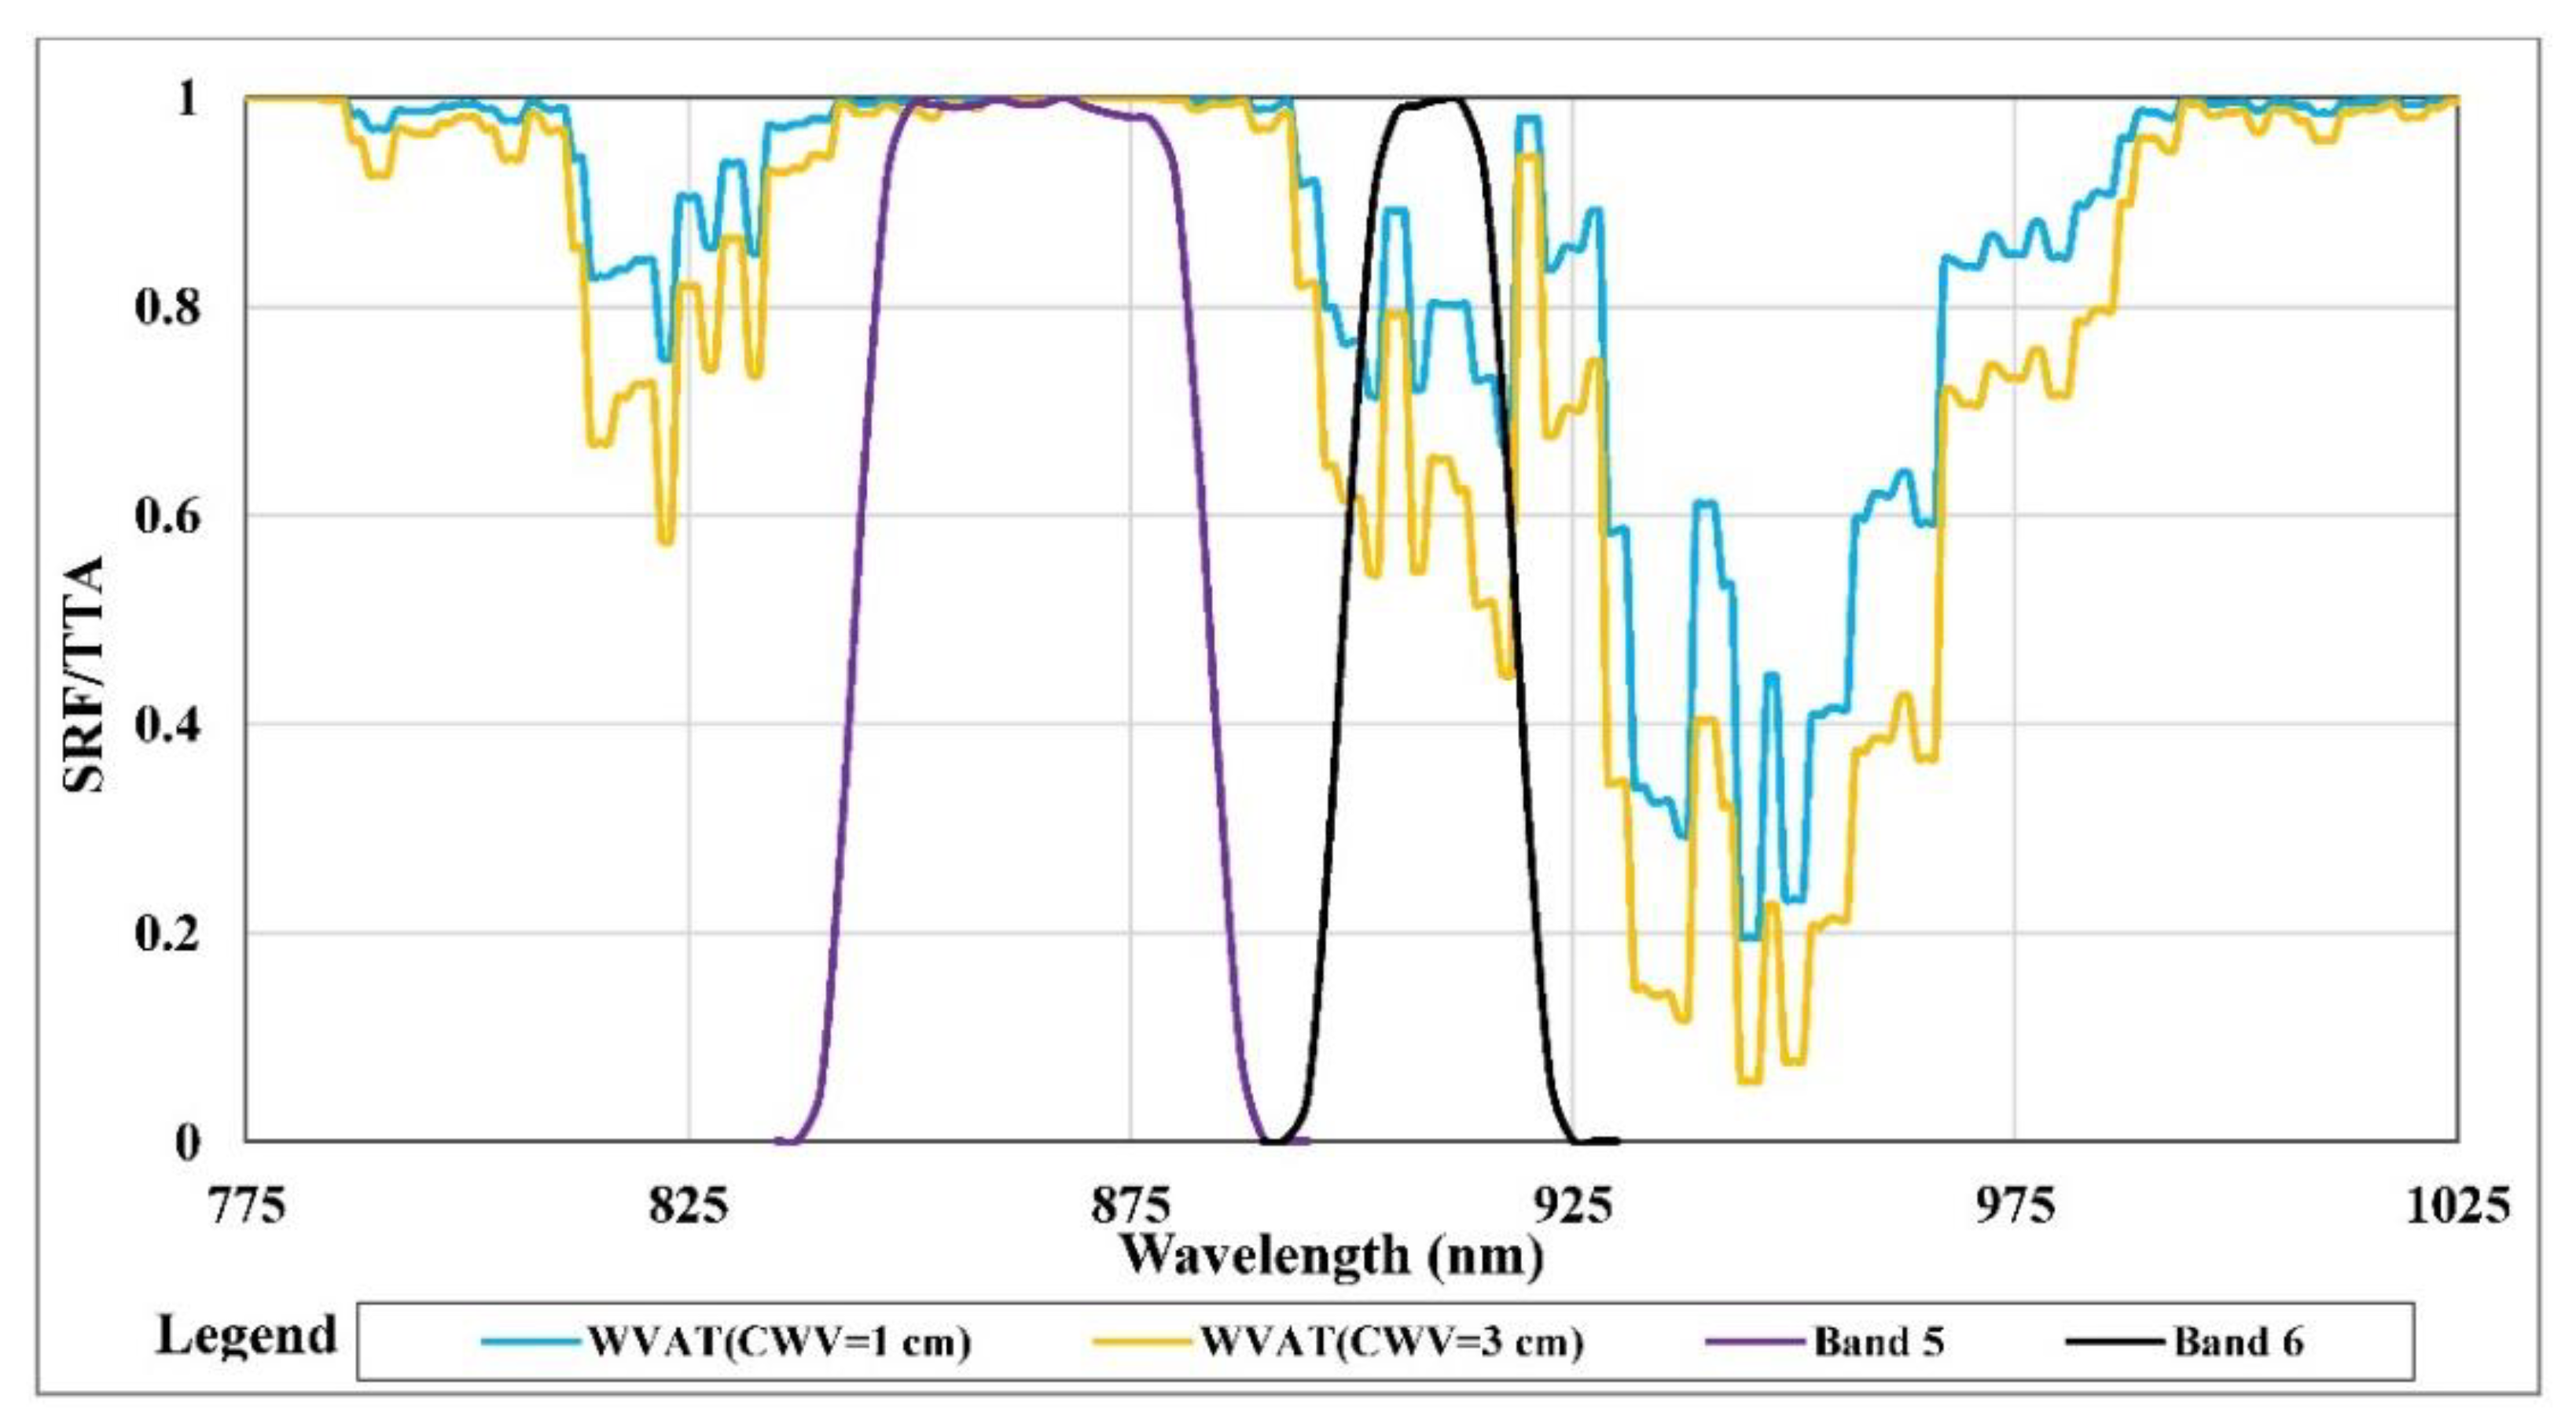
Figure 1. The SRFs of two bands of PSAC used for CWV retrieval. The first line in the legend (blue line) represents the water vapor absorption transmittance (WVAT) of the atmosphere when the view zenith angle (VZA) and solar zenith angle (SZA) are equal to 0 and CWV is equal to 1 cm. The second line (yellow line) represents the WVAT when VZA and SZA are equal to 0 and CWV is equal to 3 cm. The next two are SRFs of the two bands of PSAC used for CWV retrieval.
Remotesensing 14 01376 g001
Figure 2. Spatial distribution of AERONET sites used in this study. Each point represents a site.
Remotesensing 14 01376 g002
Figure 3. Scatter plot of matching results between the slanted water vapor content in the path of the sun-ground-satellite (i.e., V C W V L ) and the natural logarithm of the water vapor absorption transmittance of band 6 of PSAC (i.e., l n ( T g 910   nm ) ) in East Asia (18–53°N, 73–130°E). Each blue solid circle represents a matching result of AERONET data and PSAC data. The red solid line represents the fitting equation of the natural logarithm of the water vapor absorption transmittance of band 6 and the slanted water vapor content in the path of the sun-ground-satellite.
Remotesensing 14 01376 g003
Figure 4. Examples of PSAC false color composite images and cloud mask results. (a) PSAC false color composite image of example 1. (b) PSAC cloud mask result of example 1. (c) PSAC false color composite image of example 2. (d) PSAC cloud mask result of example 2.
Remotesensing 14 01376 g004
Figure 5. Scatter plots of the matching results between PSAC CWV data, MODIS CWV data, and AERONET data. (a) PSAC CWV data. (b) MODIS CWV data.
Remotesensing 14 01376 g005
Figure 6. Day-to-day comparisons between PSAC CWV data and AERONET CWV data. (a) NEON_LENO. (b) SEDE_BOKER. (c) Tomsk. (d) Ussuriysk.
Remotesensing 14 01376 g006
Figure 7. The distribution of the absolute error of PSAC CWV retrieval results from March 2021 to August 2021. The sloping red line is the linear regression line. The red points are the means for specific ranges of absolute error, and the vertical red lines are the mean ± 2σ (standard deviation) of absolute error in a certain range. The color of a point is determined by the density of the point where it is located.
Remotesensing 14 01376 g007
Table 1. The specific band settings of the polarized scanning atmospheric corrector (PSAC).
No.Center WavelengthSpectral RangeSpectral WidthSpatial Resolution
Band 10.410 μm0.400–0.420 μm20 nm6 km
Band 20.443 μm0.433–0.453 μm20 nm6 km
Band 30.555 μm0.545–0.565 μm20 nm6 km
Band 40.670 μm0.660–0.680 μm20 nm6 km
Band 50.865 μm0.845–0.885 μm40 nm6 km
Band 60.910 μm0.900–0.920 μm20 nm6 km
Band 71.380 μm1.360–1.400 μm40 nm6 km
Band 81.610 μm1.580–1.640 μm60 nm6 km
Publisher’s Note: MDPI stays neutral with regard to jurisdictional claims in published maps and institutional affiliations.