Article

Ha Long—Cam Pha Cities Evolution Analysis Utilizing Remote Sensing Data

1
Faculty of Civil Engineering, Hanoi Architecture University, Hanoi 12109, Vietnam
2
Faculty of Geography, Hanoi National University of Education, Hanoi 11310, Vietnam
3
Vietnam National Space Center, Academy of Sciences and Technologies, Hanoi 11307, Vietnam
4
Territoires Environnement Télédétection et Information Spatiale, CNRS, Université Montpellier, 34000 Montpellier, France
*
Author to whom correspondence should be addressed.
Remote Sens. 2022, 14(5), 1241; https://doi.org/10.3390/rs14051241
Submission received: 22 January 2022 / Revised: 22 February 2022 / Accepted: 26 February 2022 / Published: 3 March 2022
(This article belongs to the Special Issue Urban Planning Supported by Remote Sensing Technology)

Abstract

:
Socio-economic development has promoted the modification of land cover patterns in the coastal area of Ha Long, Cam Pha cities since the 1990s. The urban growth, together with intensive coal mining activities, has improved the life quality of residents. However, it has also caused many environmental problems in this region. Change detection techniques based on post-classification comparison were applied for monitoring the spatial and temporal evolution of land covers. The confusion matrix for 2001 and 2019 showed high overall accuracy (97.99%, 94.95%) and Kappa coefficient (0.97, 0.92), respectively. Statistics from classified images have revealed that man-made features increased by about 15.32%, while natural features, mangrove jungles, and water bodies decreased 10.64%, 1.96%, 2.72%, respectively, and urban evolution presents various dynamics, soft in the first period (1991–2001), but stronger in the second period (2001–2019) with different characteristics. The study also expresses the constraint of topographic and geologic resources, which have prevented the urban development in this coastal area. Such obtained results are very important for understanding interactions and relations between natural and human phenomena and they may help authorities by providing indicators and maps able to highlight necessary actions for sustainable development.

1. Introduction

The statistics of the United Nations showed that the Vietnamese urban population has accelerated from 14.7% in 1960 to 37% in 2020 [1], and the amount of urban centers has rapidly risen in recent years, reaching to 862 in 2020 [2] in comparison with 480 in 1986 [3]. Ha Long and Cam Pha cities have become the largest centers of the coal mining industry in the Northern East region of Vietnam owing to considerable coal reserves in the underground [4]. Over the past decades, rapid socio-economic development has promoted urbanization at Ha Long and Cam Pha cities. Specifically, the recent statistics show that their urban population comprised 76.5% of the total population in 2010, but it reached 88.0% in 2019 [5]. The urban development has interacted with the intensity of coal mining exploitation, causing significant pressures on the environment with many dynamics at the coastal area of Ha Long and Cam Pha cities, such as the expansion of man-made infrastructures [6], the modification of hydrologic network and topographic surface [7], the dissemination of environmental problems such as air pollution, water pollutions, soil degradation [8], and land subsidence hazard [9], etc. Thus, understanding and monitoring urban evolution over a long period in the coastal area of Ha Long and Cam Pha cities are crucial for various purposes such as land management, public service provision, spatial planning, territorial organization, and sustainable objectives achievements [10,11]. This might be an effective support to manage the urban development towards suitable land-use decisions in the future [12].
Urban growth can be highlighted through the environmental impacts caused by increased consumption of food, energy, water, land, etc. [13], which induces energy demands with the development of residential settlements [14], alters the local climate with the increase of urban heat flux [15], perturbs the natural water cycle with the extension of impervious surfaces [16], reduces biodiversity with the rise of habitat fragmentation [17], stimulates the expansion of the industrial zones with pollutant emission [18], converts land surface from non-urban to urban uses with the loss of arable soil, and intensive pressure on agricultural production [19]. However, the researchers noted that these issues could be described and traced notably via land use/land cover changes studies based on reflected and emitted measurements at various spectrum wavelengths [20,21]. The spectral variations between different image acquisitions due to the alteration of land use/land cover in urbanized areas are used for identifying the changes when the magnitude of spectral variations is more important than any noises [22].
As a matter of fact, monitoring urban evolution trends have started with the launches of Earth Observation satellites for spatially and temporarily determining land use/land cover pattern changes (location, intensity, period) through satellite data processing [23,24,25]. Studying the urban evolution over several decades requires a historical dataset with the repetitive acquisitions of multispectral images of the ground surface. The Landsat program can satisfy these requirements owing to the successive launches of some satellites from Landsat 1 to Landsat 8 (except Landsat 6 due to the failure after not reaching the velocity necessary) since the 1970s by the joint mission of the National Aeronautics and Space Administration (NASA) and the United States Geological Survey (USGS) [26]. This Landsat program might be expected as a potential source of information for identifying land use/land cover changes for environmental management support at a regional scale [27] because it has successively provided identical image specifications with medium spatial and temporal resolutions [28]. Otherwise, Landsat images with enhanced spatial resolution at 30 m of multispectral bands could be considered as suitable and reliable datasets for analyzing urban evolution in a more timely and cost-effective manner [29]. Therefore, Landsat images have been exploited to investigate when, how, and where Earth’s surface has been changing because of its historical archive availability over the last five decades. Although the number of studies using Landsat data has dramatically increased after the opening of entire Landsat collections for free access in 2008 [30], the studies on urban evolution have been confined in an inadequate amount in which the methods of change detection have been revolutionized depending on the number of handled images [31].
Several researchers noted that change detection is the process of identifying mutations in the state of an object or phenomenon by simultaneously processing two or more images of the same geographical region acquired at different times [32,33]. Meanwhile, Radke et al. [34] supposed that change detection was considered as a process to determine considerable differences in sequential pixel appearances due to the emergence, disappearance, movement, or shape alteration of objects on the ground surface [34]. For detecting changes in land use/land cover, many issues have been discussed and synthesized in literature reviews of several researchers’ articles [31,33,34,35,36,37,38,39,40,41]. Salah et al. [42] mentioned the different categorization schemes in previous reviews, which have usually focused on a few aspects or dimensions of change detection problems while ignoring others because of the complexity of this topic. However, Hemati et al. [31] and Zhu [41] have suggested six categorical change detection methods such as thresholding, differencing, segmentation, trajectory classification, statistical boundary, and regression, which have been applied in diverse applications using Landsat data to observe the dynamics caused by human activities including urban evolution analysis [43,44].
Land use/land cover changes can be detected by comparing satellite images acquired at two different moments—the bitemporal approach, which is a simple but less comprehensive understanding of the urban dynamics in comparison to the time-series approach [45]. Indeed, in this recent time-series approach, a set of satellite image scenes taken at many different times—Satellite Image Time Series (SITS) affords a large amount of information compared to a single image couple in the context of temporal tendencies of regional evolution [46]. Despite these benefits, it still raises specific challenges regarding: the irregular temporal phenological signature of different land cover types; the insufficient sampling used to train the supervised classification; the missing temporal data [42]; the network architectures or specific datasets shaping that need to be developed for exploiting the temporal information jointly with the spatial and spectral information of the data [47]. Thus, in a more classical way, other sets of approaches and methods can be used varying from manual change interpretation [48] to bi-temporal linear data transformation [49] or multi-temporal spectral mixture analysis [50] and deep learning [51].
Although in the coming years, together with Van Don Special Economic Zone, the two adjacent cities of Ha Long and Cam Pha will become the pole of development in the North-East region. However, there was not research on urban evolution in this dynamic region except at Ha Long city, where the relevant topic had been considered in the works of Brömme et al. [52], Hens et al. [6], Jalilov et al. [53]. Therefore, the present study examines the spatio-temporal land cover change utilizing Landsat multitemporal and multispectral images for a period of 30 years (i.e., 1991, 2001, and 2019). The aims are to (a) identify land cover changes using different sensors of Landsat satellites to characterize urban dynamics at the coastal area of Ha Long—Cam Pha cities over this period and highlight the different tendencies of urban evolution between these two cities; (b) verify the interest of topographic gradient issued from Shuttle Radar Topography Mission (SRTM) digital elevation model for analyzing the land suitability in urban development. It will then analyze the concern for urban planning policies in the region.
After the context of this study (Section 1), the presentation of the study area is provided (Section 2), the description of the data used, and the various processing steps are presented (Section 3). The results are followed with a validation procedure (Section 4). These parts are subsequent to a discussion (Section 5), a conclusion closes the paper (Section 6).

2. Study Area

The study area is mainly located in the Quang Ninh province in the North of Vietnam, focused on the coastal area of Ha Long and Cam Pha cities, which are adjacent to each other. The Quang Ninh province is closed to the Chinese frontier and expanded along the Tonkin gulf. This area has remarkably diverse landscapes: hills and mountains predominating with elevations ranging from 0 to 1498 m and narrow coastal alluvial plains, where urban development can be extended toward shallow intertidal zone (Figure 1). The remaining part is a vast gulf including hundreds of big and small limestone islands.
The territory of these two cities covers an area of 758 km2 from the latitude 20°54′35″ N to 21°14′05″ N and from the longitude 106°54′08″ E to 107°24′08″ E. It is influenced by the tropical monsoon climate, in which the annual average temperature reaches 22.6–24.4 °C, and the annual average rainfall is approximately 2200–2700 mm [54]. The climate is separated into two distinctive seasons: hot in the summer (lasting from May to October) with heavy rainfall (accounting for 80% to 85% of the total annual precipitation) and cold in the winter (lasting from November to April) with low rainfall (15% to 20% of the total annual precipitation) [55]. The hydrographic system is mainly composed of small, short rivers originating from Northern mountainous districts characterized by a fast-rising flow and quick drainage to the sea due to the steep terrain and heavy rains in the rainy season.
Many coal mines are located at the central part of the study area, and the residential settlements were developed on both sides of the national road No18 with various man-made structures extending along the shoreline. However, the tropical rainforest still dominates in the Northern part. Besides, carbonate sediments with thick limestone layers have developed in the marine environment, generating unique landscapes with high geomorphological values. The Ha Long bay is recognized by the United Nations Educational, Scientific and Cultural Organization (UNESCO) as the World’s Natural Heritage site since 1994 [56]. These resources provide comparative advantages for the Quang Ninh province in several developing economic sectors, including coal mining, aquaculture, tourism, etc. For example, the total number of tourist arrivals reached around 21.78 million, and the tourism sector contributed 8% to the Gross Domestic Product (GDP) of Quang Ninh province in the period of 2013–2015 [57]. Otherwise, in the coal mining sector, 80,000 employees have worked in 23 major coal mines yielding more than 38.5 million tons of raw coal in 2020 [58].
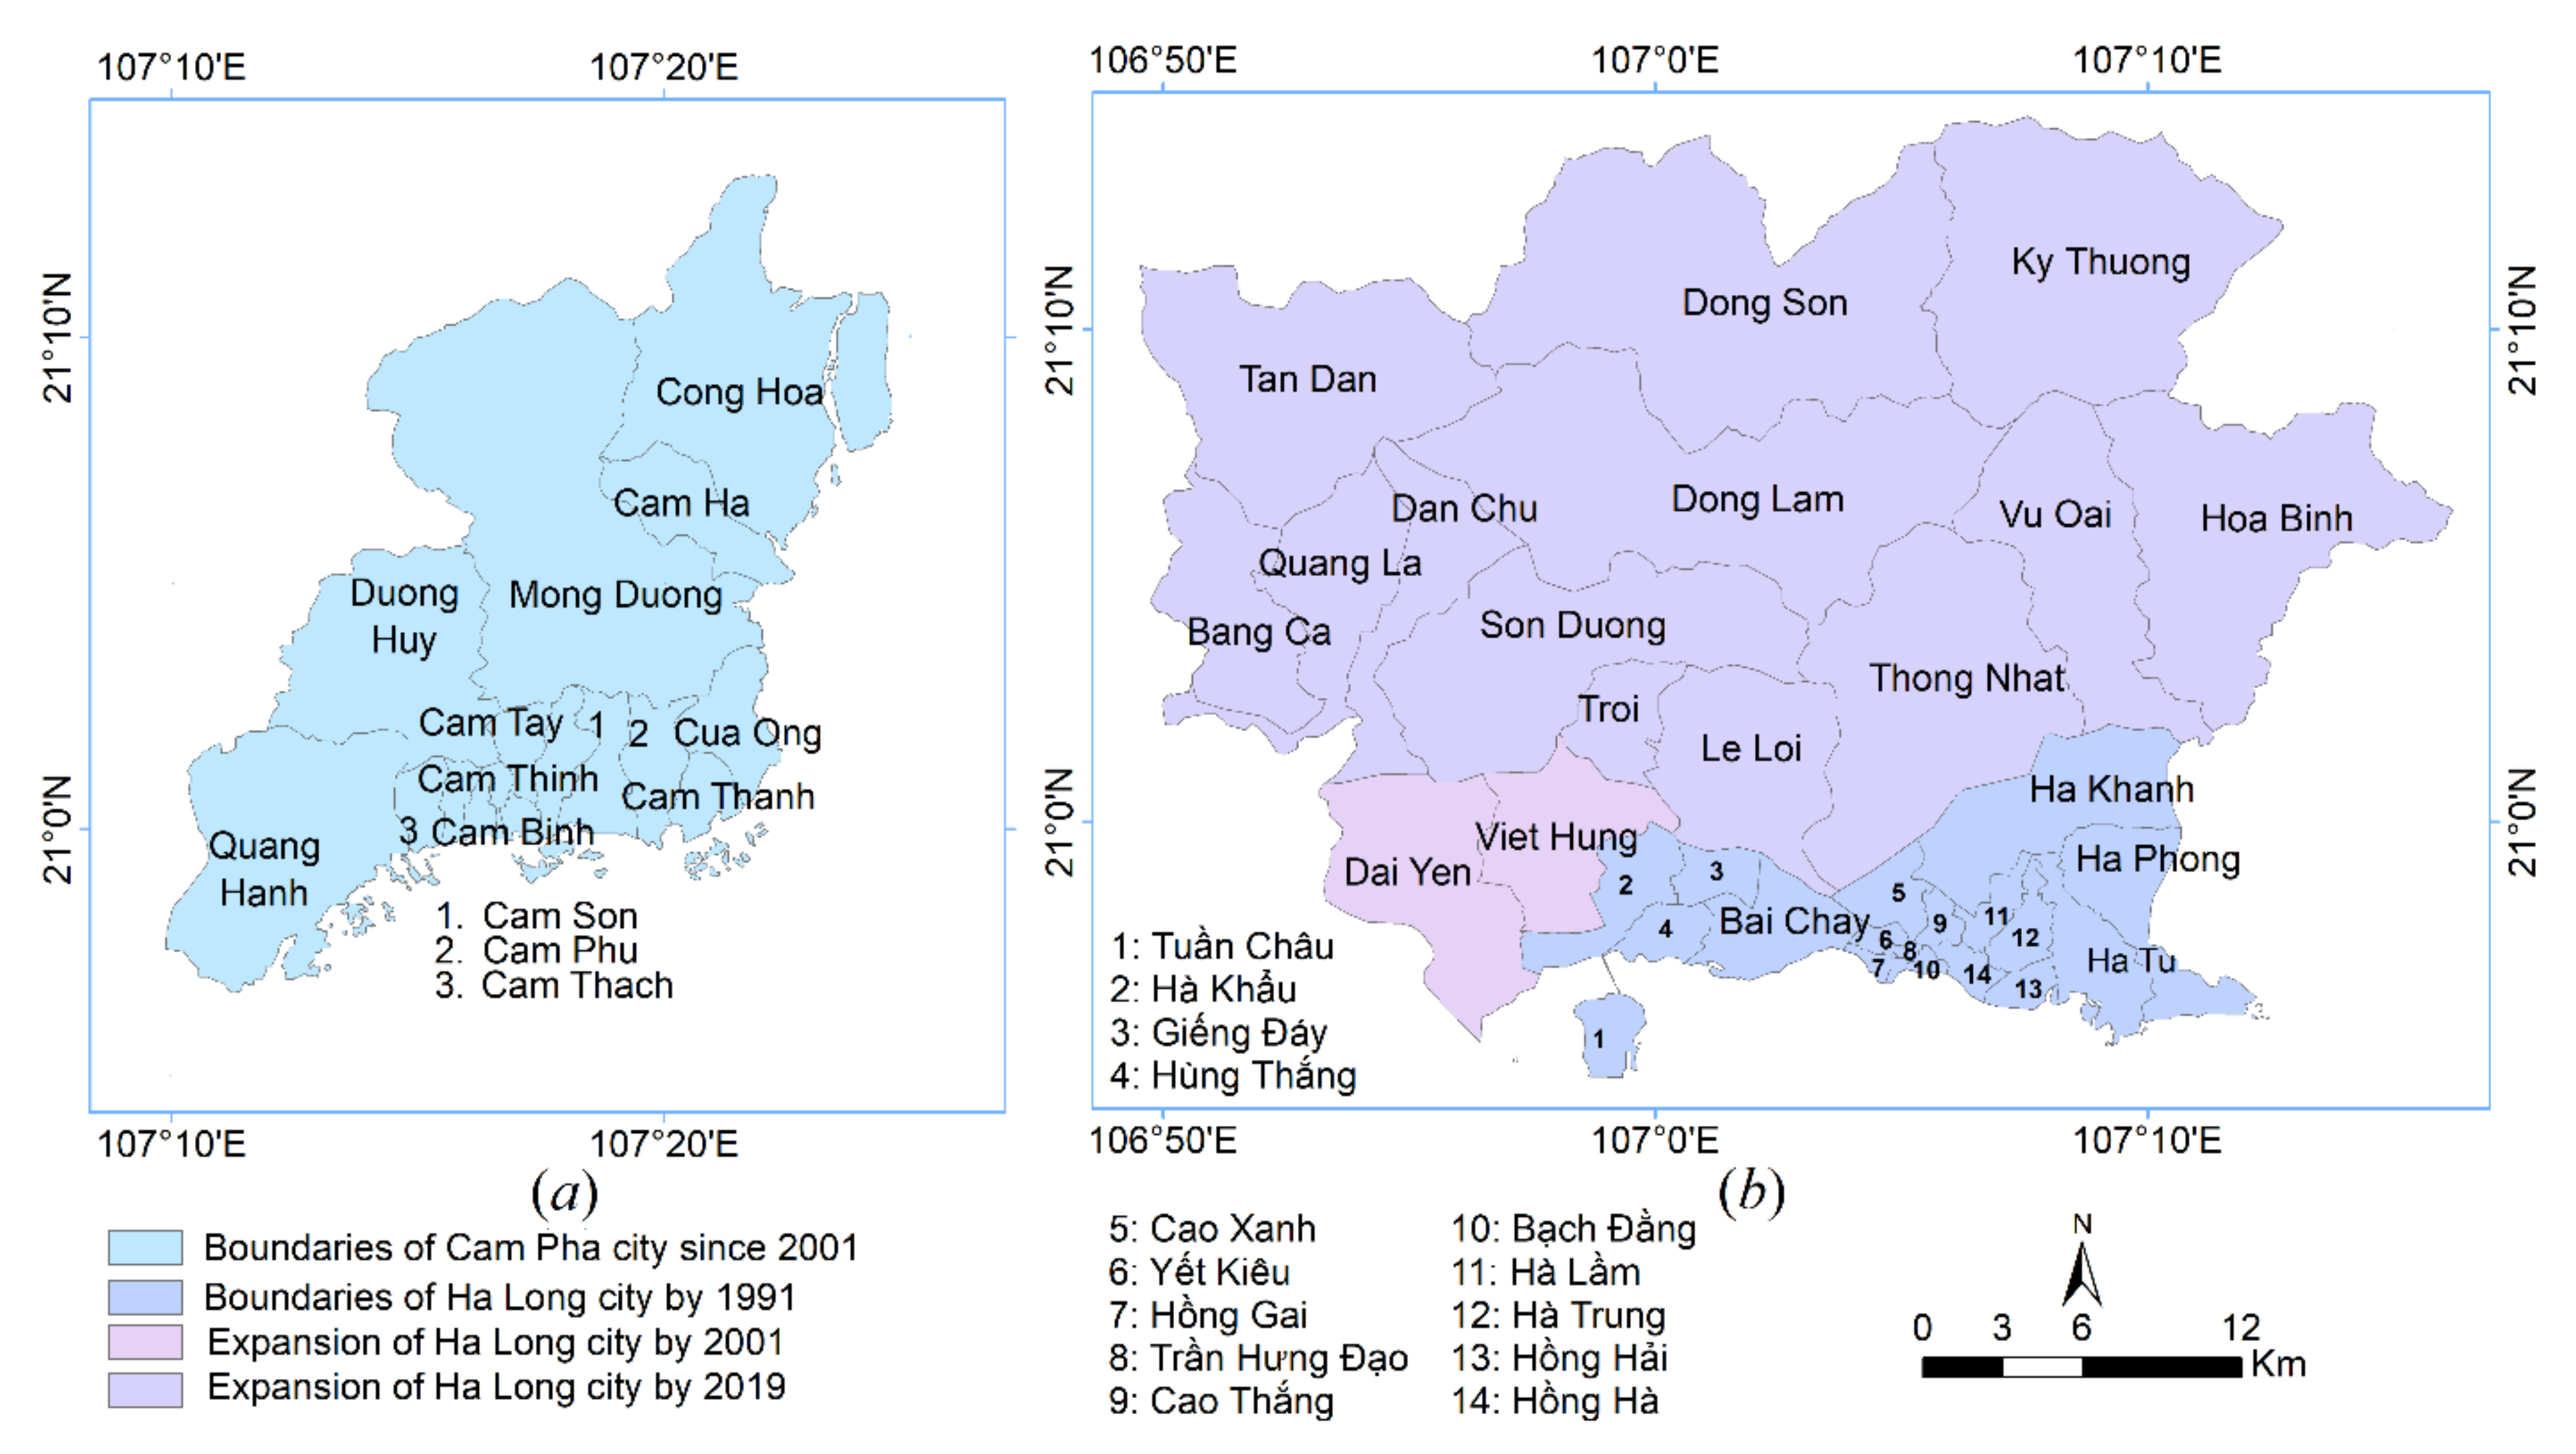
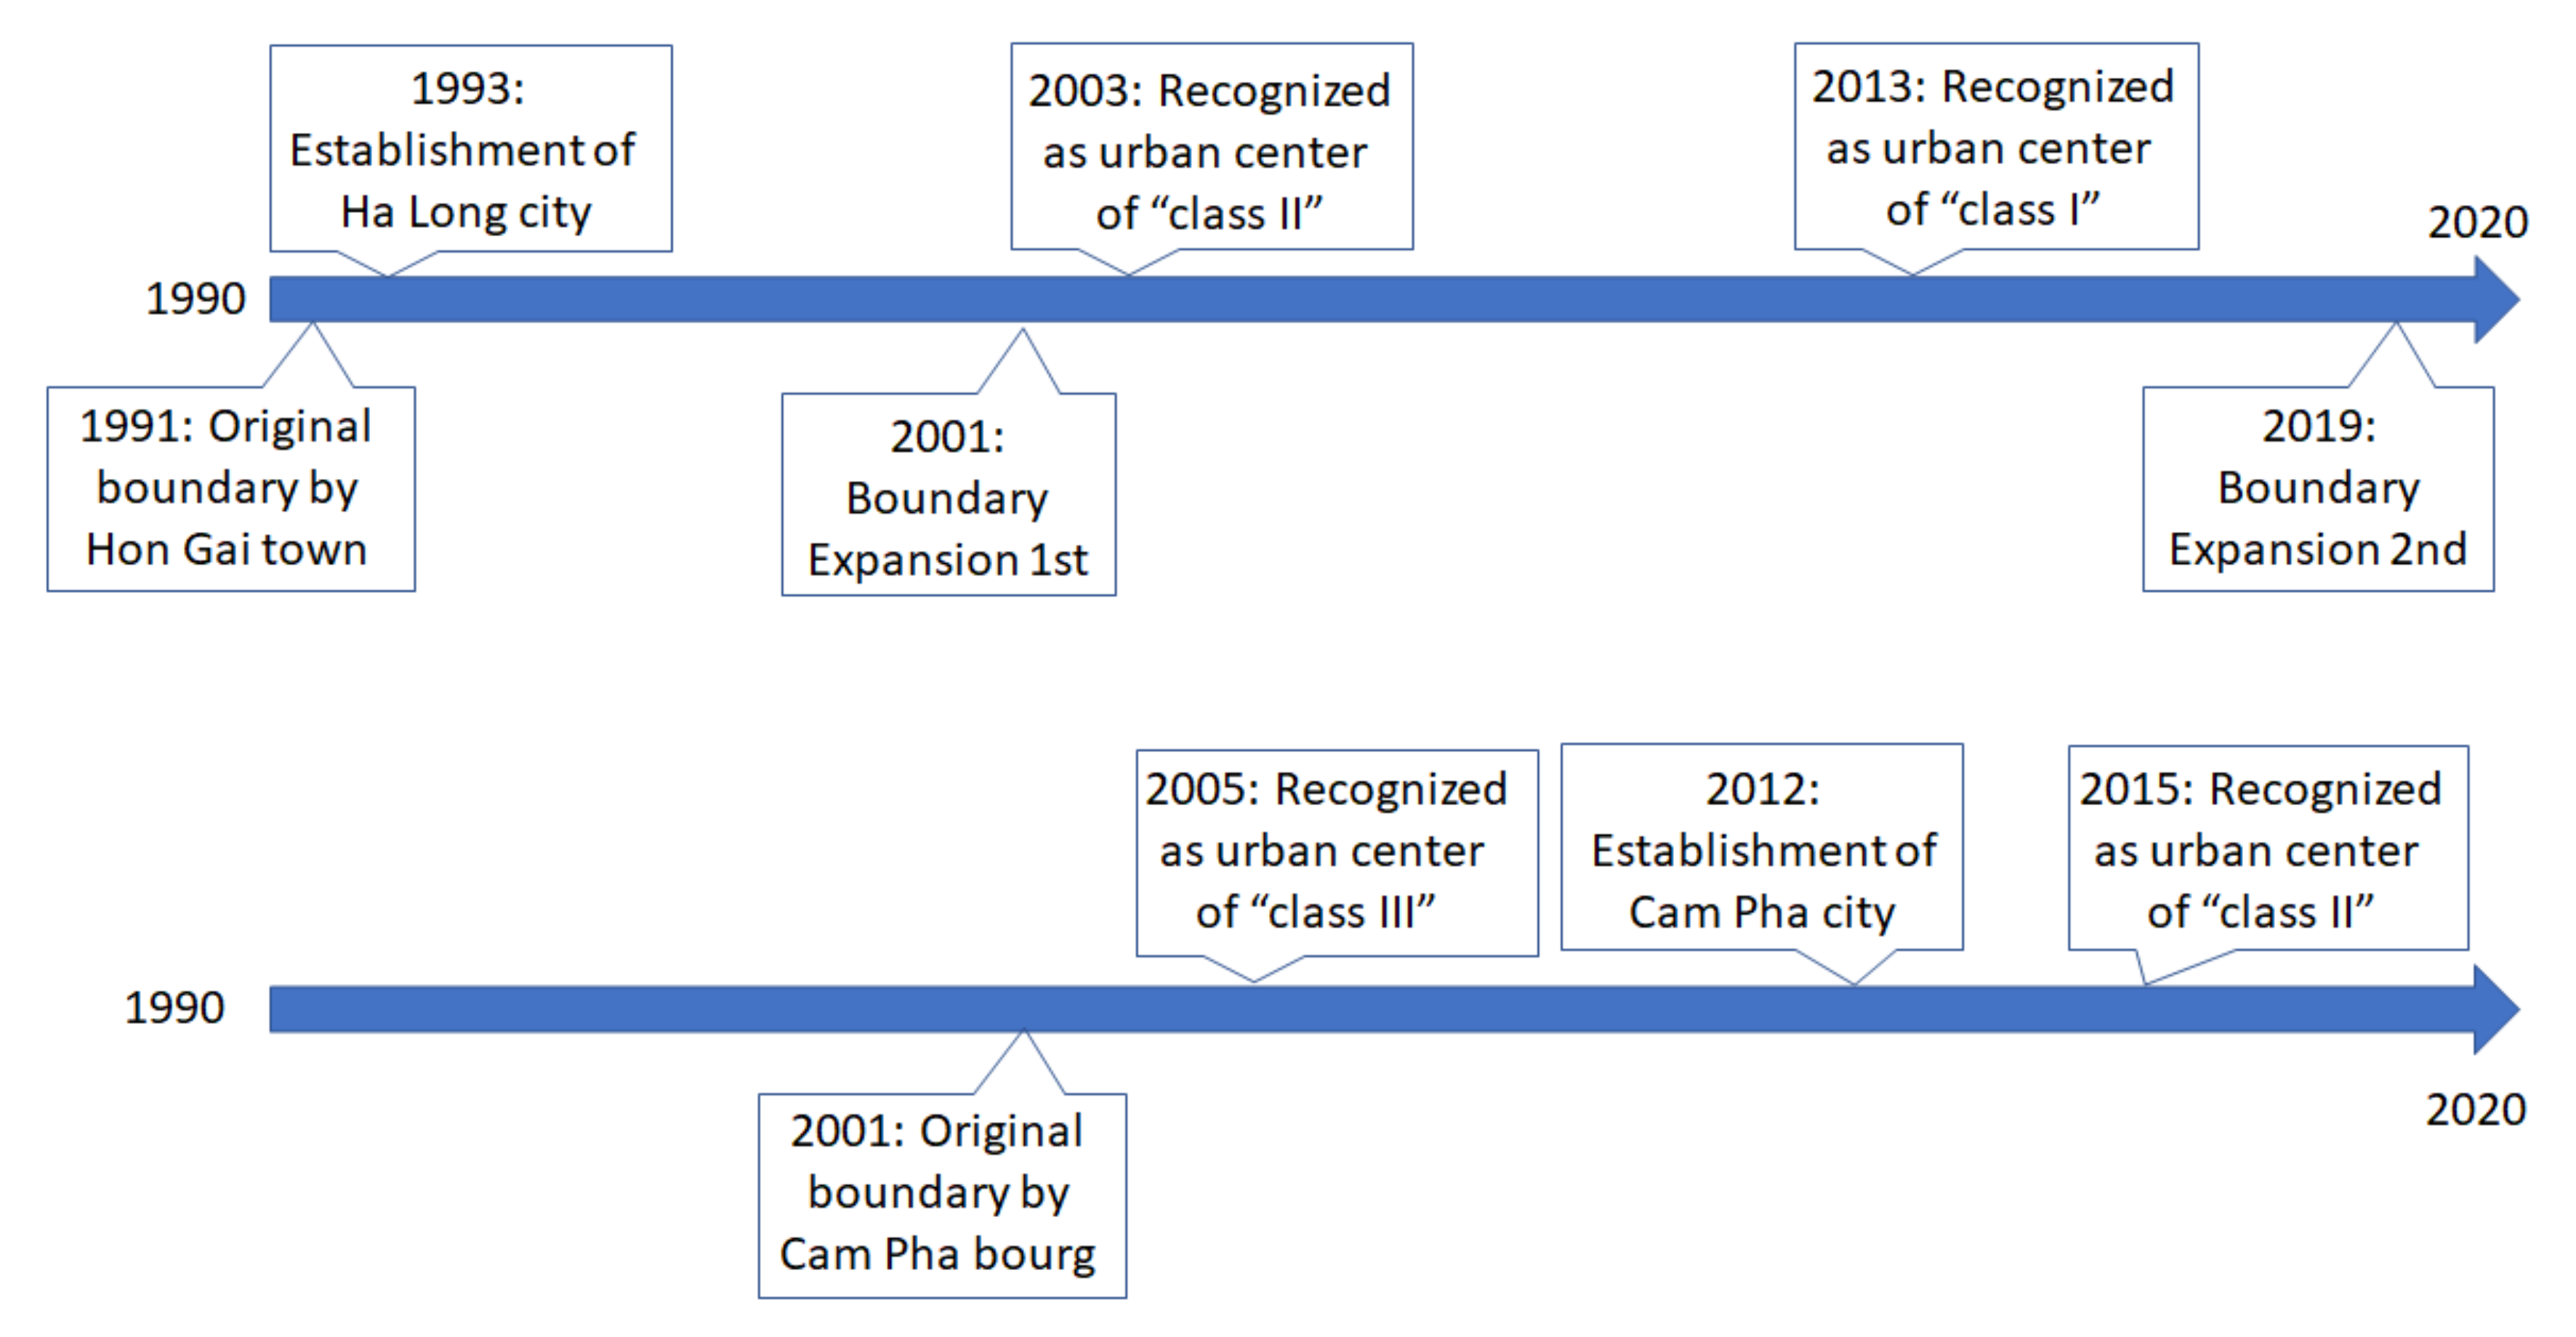
Local authorities have planned and reorganized functional urban areas, completed urban infrastructures, developed public facilities, and improved environmental sanitation in order to constitute major urban centers in the region. As described in Figure 2 and Figure 3, the evolution of Ha Long city during the last three decades have been officially decided through a dozen years: it was established on 27 December 1993 based on the territory of Hon Gai town; recognized as the urban center of class II on 26 September 2003, and urban center of class I on 10 October 2013. Then its spatial boundary was expanded on 17 December 2019. While Cam Pha bourg was established as the urban center of class III on 6 January 2005, had become a city on 21 February 2012, and on 17 April 2015, it was recognized as the urban center of class II [60].
By 2020, the population of the two cities reached 518,300 people, prevailed in 21 wards, 12 communes (Ha Long city), and 13 wards, three communes (Cam Pha city) corresponding to an average density of 292 people km−2 and 570 people km−2 respectively [5]. In accompanying the dynamic socio-economic activities, local authorities have faced institutional challenges in environmental management [61], especially when these activities have intertwined with the rapid urban development on narrow piedmont situated along the coast (Figure 1).
Figure 3. Administrative boundary modification of: (a) Cam Pha city, (b) Ha Long city. All islands are not presented in the maps [62].
Remotesensing 14 01241 g003

3. Materials and Methods

3.1. Data

3.1.1. Landsat Images

In change detection analysis, seasonal variation due to solar angles and phenological changes is taken into consideration as the main source of noise, and it can be minimized by image selection [41]. In the present study, three aspects were necessary to consider: (a) the selection of cloud-free images, as in this cloudy region, at least around 10% was acceptable for the mainland part of the scene; (b) the selected images were captured in the period between Summer and Autumn when crop makes agricultural land in suburban areas highly distinguishing with the residence in urban areas; (c) the acquisition date must correspond to the moment of changing administrative structures at both cities.
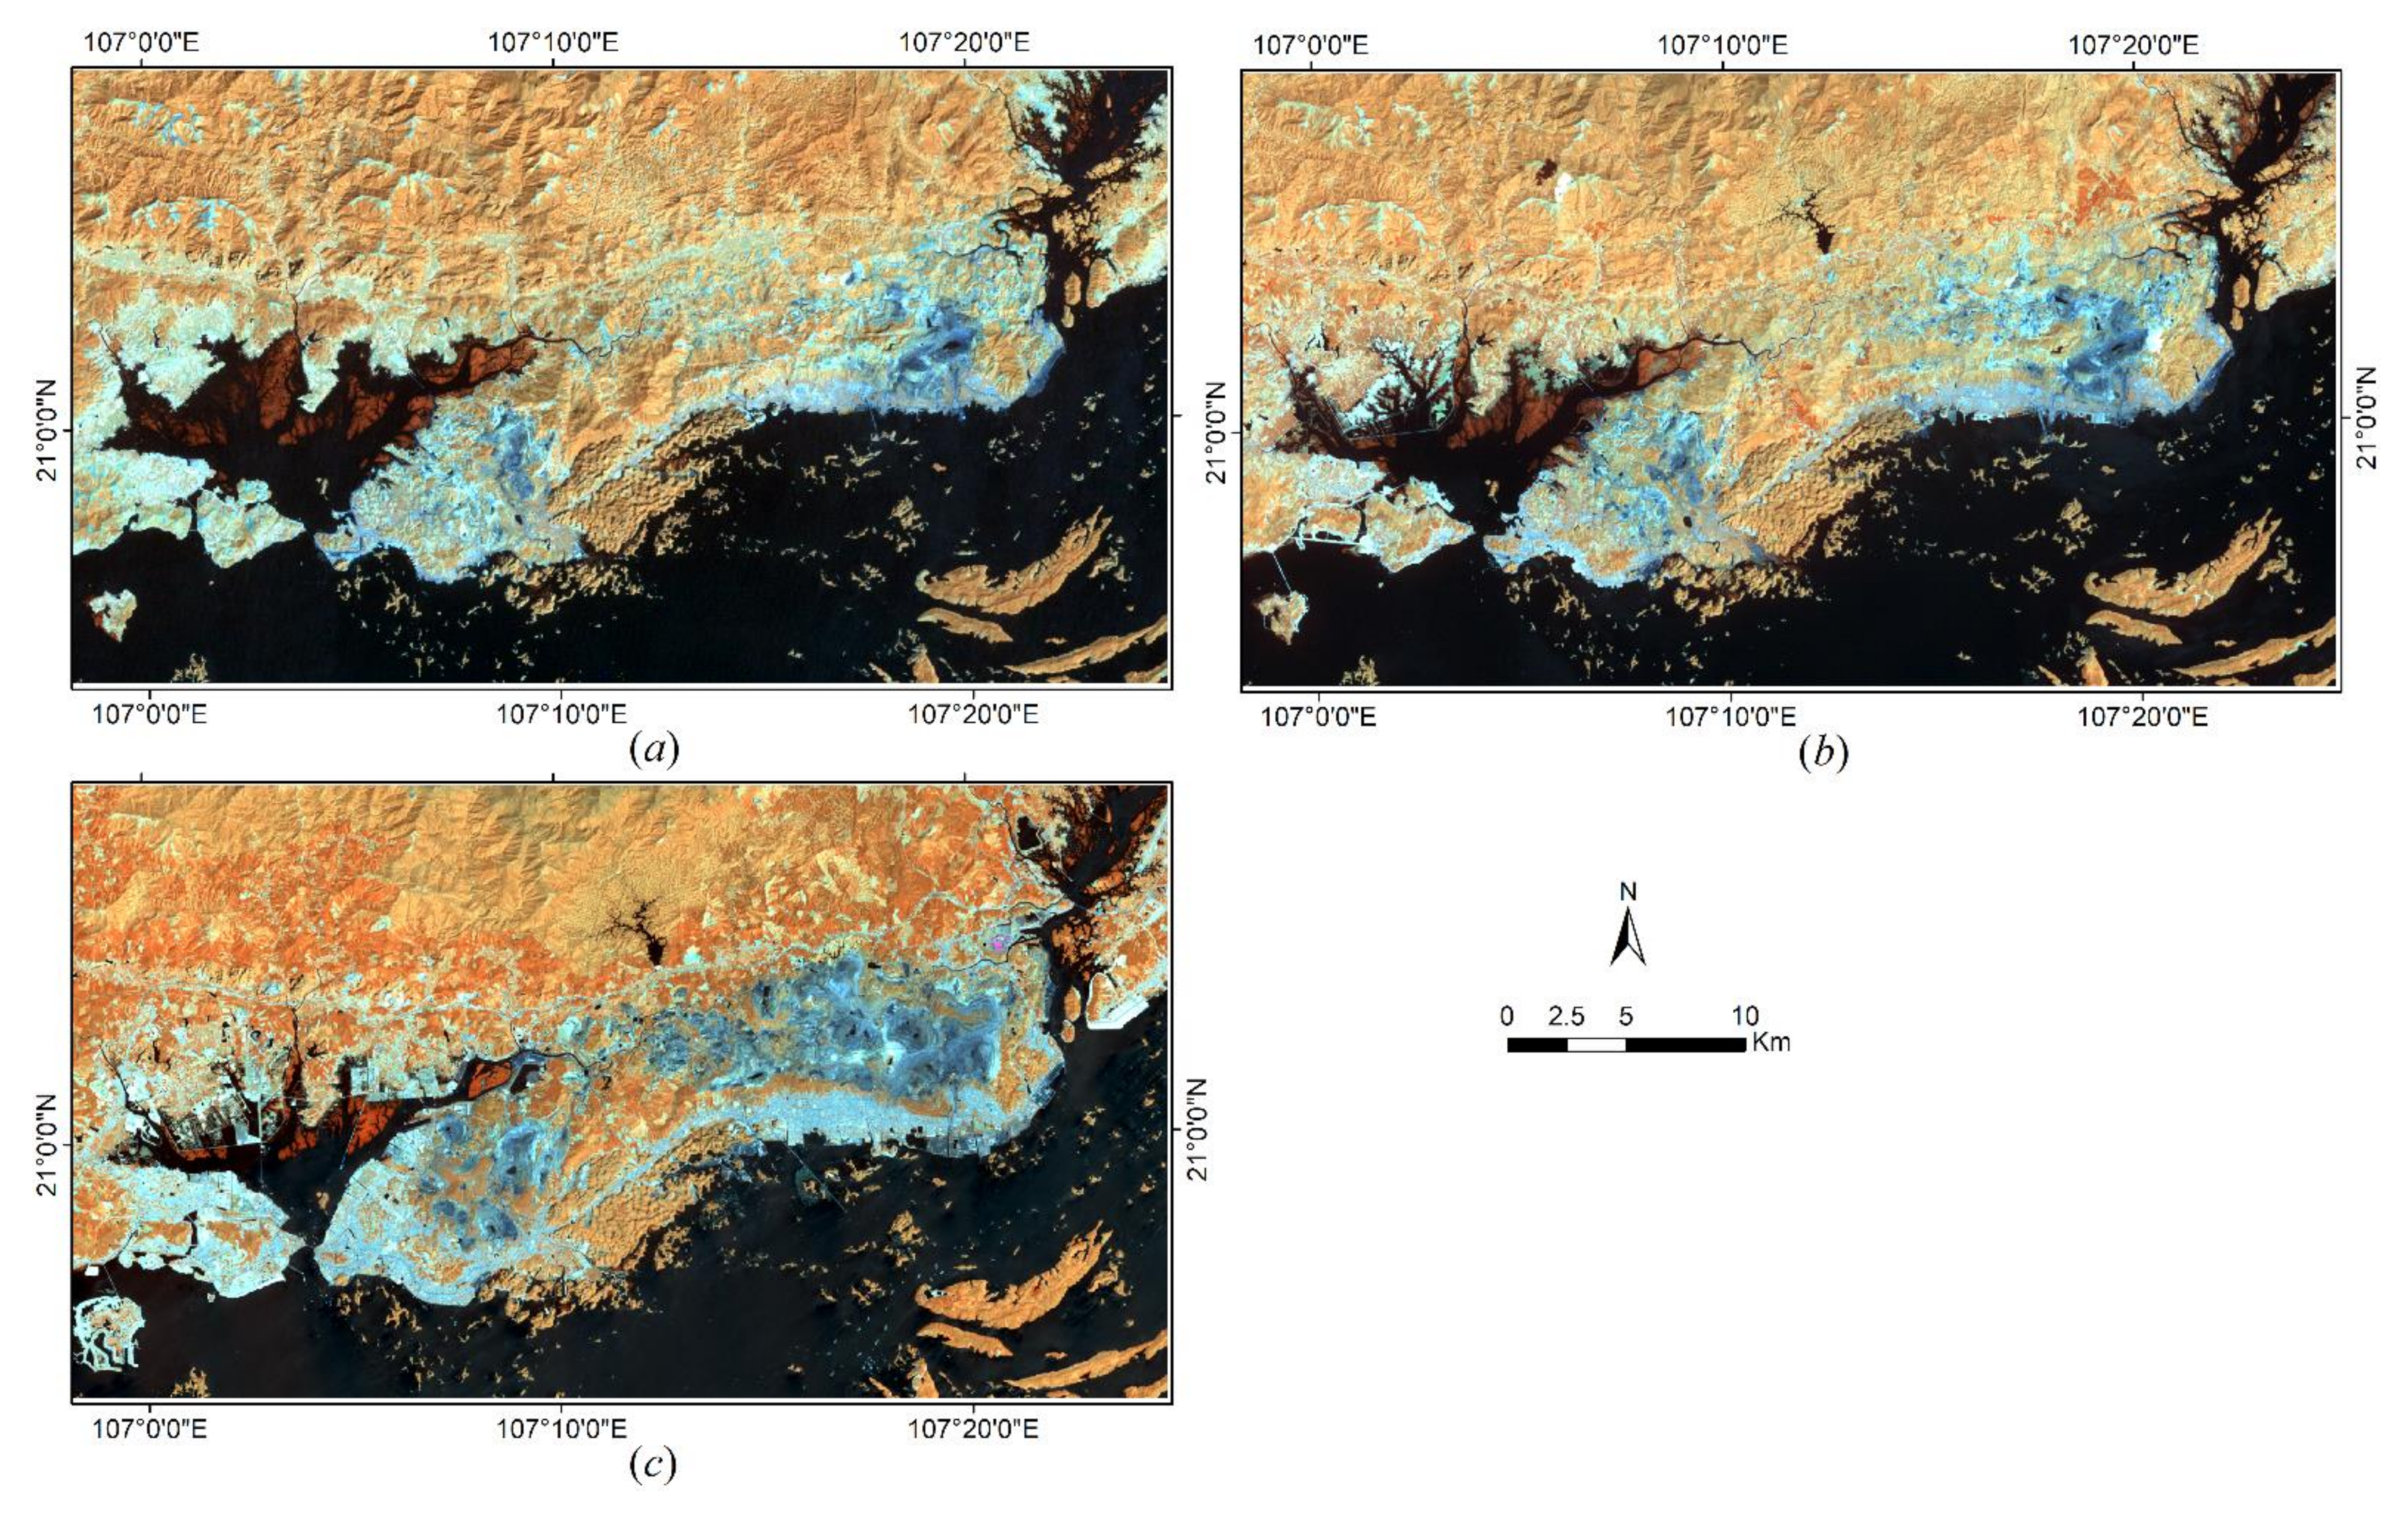
Landsat images were chosen in moderate weather conditions corresponding to 3 acquisition dates. Cloud had partly covered some sections of the scenes, but this had not seriously impacted the study (Figure 4). The parameters from Landsat images are shown in Table 1.
In this study, Landsat images were downloaded from the website of the USGS: https://earthexplorer.usgs.gov/ (accessed on 15 August 2021). The images were pre-processed at the 2A level, providing surface reflectance products (Bottom Of Atmosphere reflectance—BOA), and they were geo-referenced in the UTM coordinate system (WGS84). Landsat 5 satellite provides 7 bands in a visible spectrum, infrared, and thermal parts with different spatial resolutions: 30 m and 120 m, respectively. Landsat 7 satellite has an additional panchromatic band with a spatial resolution of 15 m. Landsat 8 satellite provides 11 bands with identical characteristics, but it also has a panchromatic band (Table 2). All spectral bands were exploited to identify the land covers in the study area.

3.1.2. High Spatial Resolution Imagery from Google Earth

Google Earth integrates several types of spatial data such as satellite images in natural color composite, aerial photos, and geographic information layers. Images can be displayed at the present time or at a specific time in the past. Currently, Google Earth images are provided with a super high spatial resolution of less than 1.0 m [63] and are regularly updated over time. Users can recognize features on the ground using Google Earth Pro applications. Google Earth images are suitable for interpreting land covers because all features on the images are clearly identified with prior knowledge via field surveys [64]. In this study, the images captured on 17 August 2001 and 8 November 2019 were used for selecting the ground truth region of interest (ROIs) by visual interpretation, while the image of 1991 was not available.

3.1.3. Digital Elevation Model

Figure 1 presents the SRTM Digital Elevation Model Version 1 from NASA with a spatial resolution of 90 m. It was exploited for identifying the topographic gradient of the study area [65].

3.1.4. Field Campaign

The selection of training samples for a supervised classification must be independently applied to three Landsat images. However, the recognition of land cover categories was difficult due to the ambiguity of features on two ancient images (1991, 2001). A field campaign needs to be taken place for referencing land cover categories. Each land cover category was identified with five sampling sites, which supported the selection of the training samples on Landsat images. Hence, the field campaign was carried out with five team members on 12–13 November 2019. Photos of some sites are shown in Figure 5.

3.2. Method

Zhu [41] noted that whether change detection approaches were time series or bitemporal, the differencing was most commonly adopted among change detection methods by using images at different acquisition dates. Changes in land cover will be identified by differencing classification results, also known as a post-classification comparison [35,39,66]. This principle was applied to urban change detection from the early 1970s, and it required the comparison of classified images corresponding to spectral variations over time due to the urban land use/land cover changes [67]. In recent years, many advanced classifiers have been taken into account to process satellite images, and image classification approaches can be distinguished into some categorical classifiers: supervised and unsupervised, or parametric and non-parametric, or hard and soft, or per-pixel, sub-pixel, and per-field. For detailed information about each category, readers can refer to the research of Lu and Weng [68]. In general, different image classifiers have their own advantages and disadvantages, and the selection of suitable classification methods depends on the sufficient training samples, the distribution of features on the ground, the spatial resolution of satellite images, the availability of classification software [69].

3.2.1. Pre-Processing

Landsat images were atmospherically corrected for the surface reflectance at 2A level, geo-referenced to the UTM coordinate system (WGS84) by the USGS. The multispectral bands of these images with the spatial resolution of 30 m were pre-processed as illustrated in Figure 6:
  • Co-registration with respect to each image ensures that the images become spatially aligned thus that all features in one image overlap as well as possible with its footprint in other images. Accurate image co-registration is a prerequisite to the accurate extraction of features, and it may subsequently provide correct land cover mapping results.
  • Cropping image aims to discard the unwanted portion outer areas from Landsat’s scene for preserving the important part—the study area (Figure 1).
  • Stacking layers address to combine several channels of Landsat image with the identical frame of reference, thus that multi-channels can be processed later in the image processing software.
The reflectance values in integer format were converted into a floating format according to Formula (1) for classifying at each acquisition date.
Refn = (Bn × 0.0000275) − 0.2
Here, Refn is the reflectance value of band n in a decimal number, Bn is the apparent value of band n in an integer number [70].

3.2.2. Image Classification

Image classification is a favorite method to identify the land cover categories because it provides the ability to generate a series of land cover maps at different moments. Lu and Weng [68] described many classifiers, which have been successfully applied into image classification, such as artificial neural network [71], fuzzy classification [72], or object-based classification [73], maximum likelihood [74], etc. In the present research, we applied the Support Vector Machines (SVMs) classifier, an algorithm of Supervised Machine Learning developed by Cortes and Vapnik [75]. It was initially applied to machine vision domains such as handwriting digit and text recognition based on Statistical Learning Theory [76]. Subsequently, it was experienced in satellite image classification [77,78,79]. Although this classifier was developed for about 3 decades, the results of recent researches proved the prominence of SVMs in comparison with other usual classifiers due to its ability to generalize desirable events despite limited training sample sets [80,81,82,83]. Otherwise, Paneque-Gaslvez et al. proved that SVMs outperformed all the rest for establishing an efficient classification approach to accurate map all broad land cover classes in a large, heterogeneous tropical area [84], thus that Support Vector Machines (SVMs) were chosen for classifying land use/land cover categories in urban studies and this classifier yielded better performance regarding accuracy and generalization [85,86].
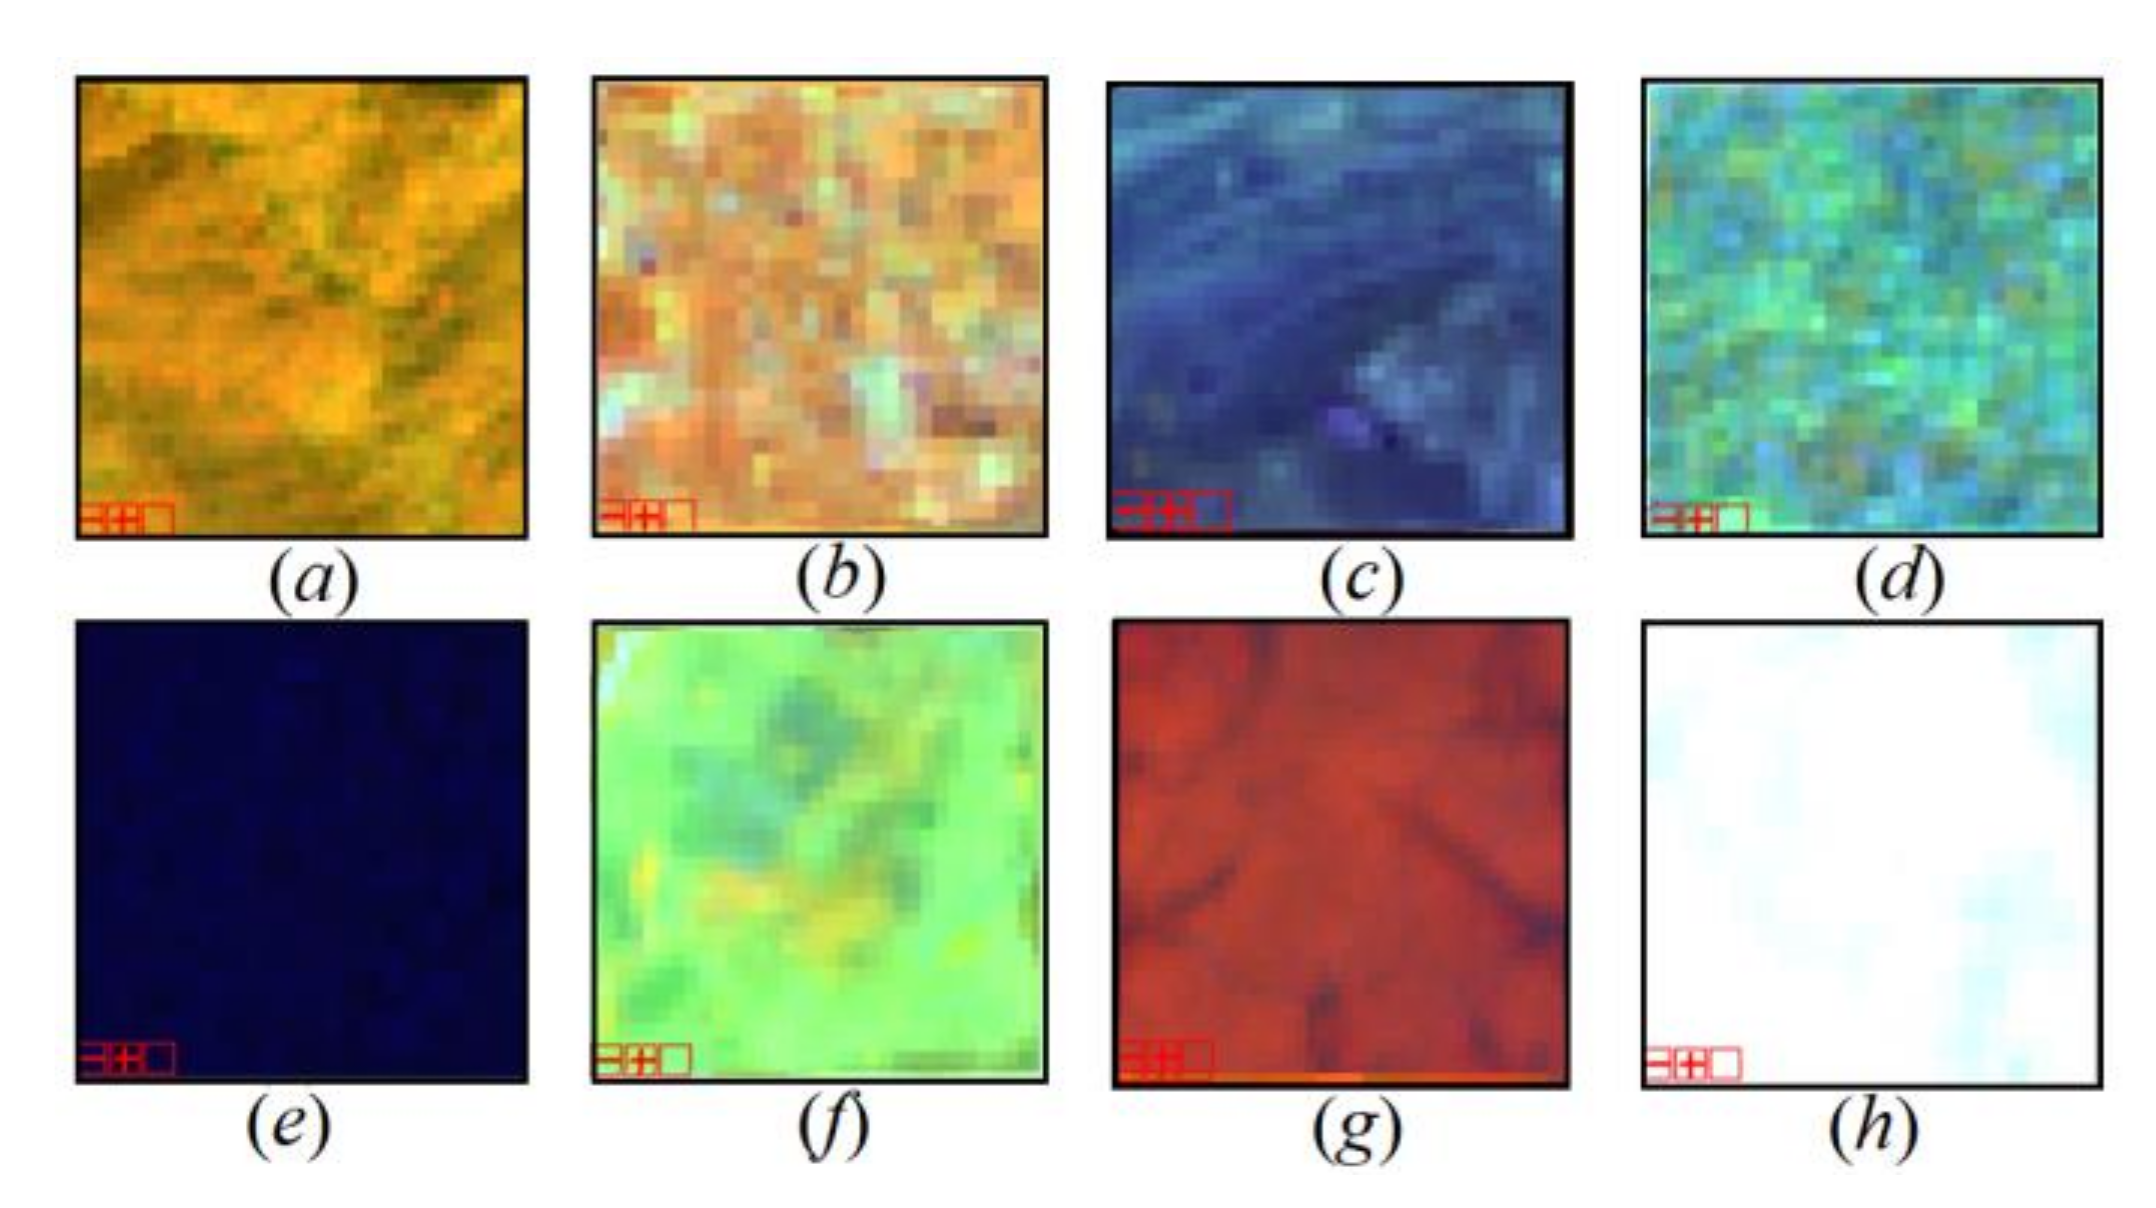
In order to proceed with the supervised classification, three sets of training samples were, respectively, determined here by on-screen digitization based on color composite images of Landsat 1991, 2001, and 2019. Each sample set corresponds to 10 samples with an average of 200 pixels/sample for each land cover category (Figure 7).
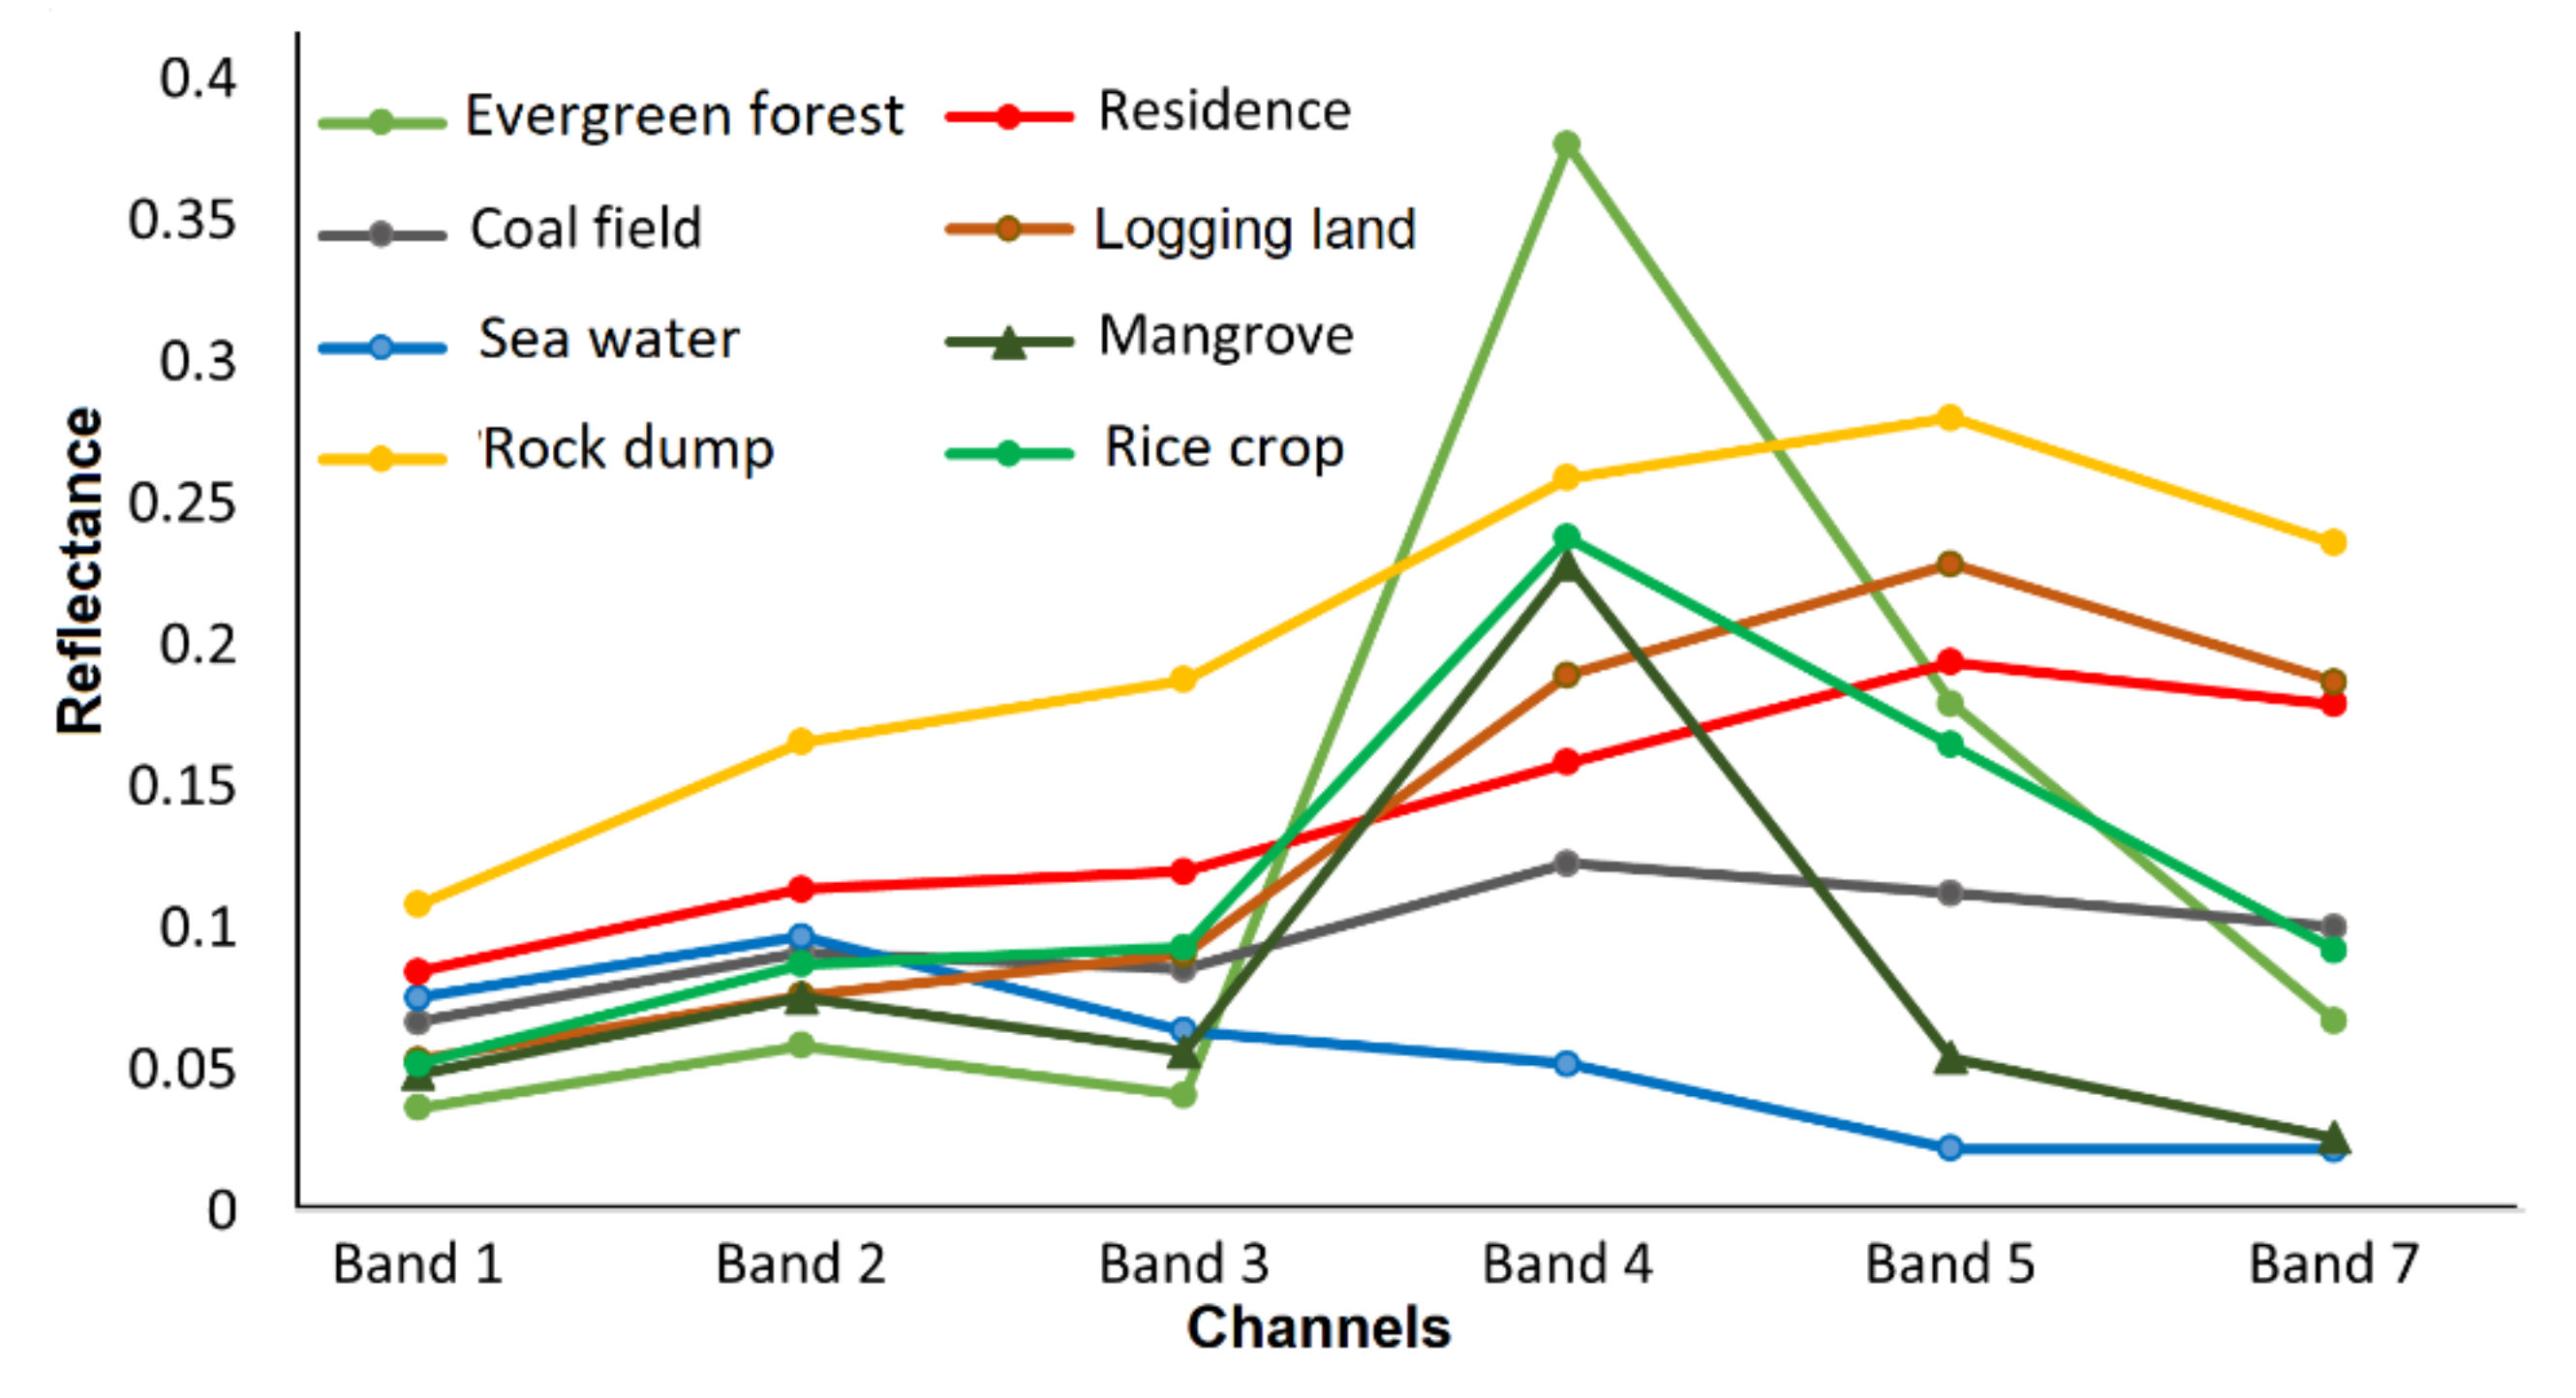
A code corresponding to each category of level 2 in Table 2 was assigned to each class, of which a distinctive radiometric curve was calculated by the average values of pixels within the window sample for all spectral bands (Figure 8). The SVMs classifier was executed to separate them from each other using this training sample set.

4. Results

4.1. Validation

The accuracy of change detection highly depends on the classification accuracy, and errors in each classified image are present in the final change products. The obtained results are thus vulnerable to classification errors [41]. Moreover, classification accuracy can be affected by many reasons, such as the classification methods, the algorithms used, and the type of satellite images [68]. In our study, Landsat’s SVMs classification accuracy was visually adjudged by knowledge of the study area. In accordance with this interest, the selection of ground truth samples was realized from Google Earth images in order to quantitatively assess the Landsat’s SVMs classification accuracy using confusion matrix, on the one hand [88]. In addition, the outline of features issued from the classified images was visually explicit on Google Earth images to identify the coincidence between these two data sets, on the other hand [89].

4.1.1. Keys for Visual Interpretation

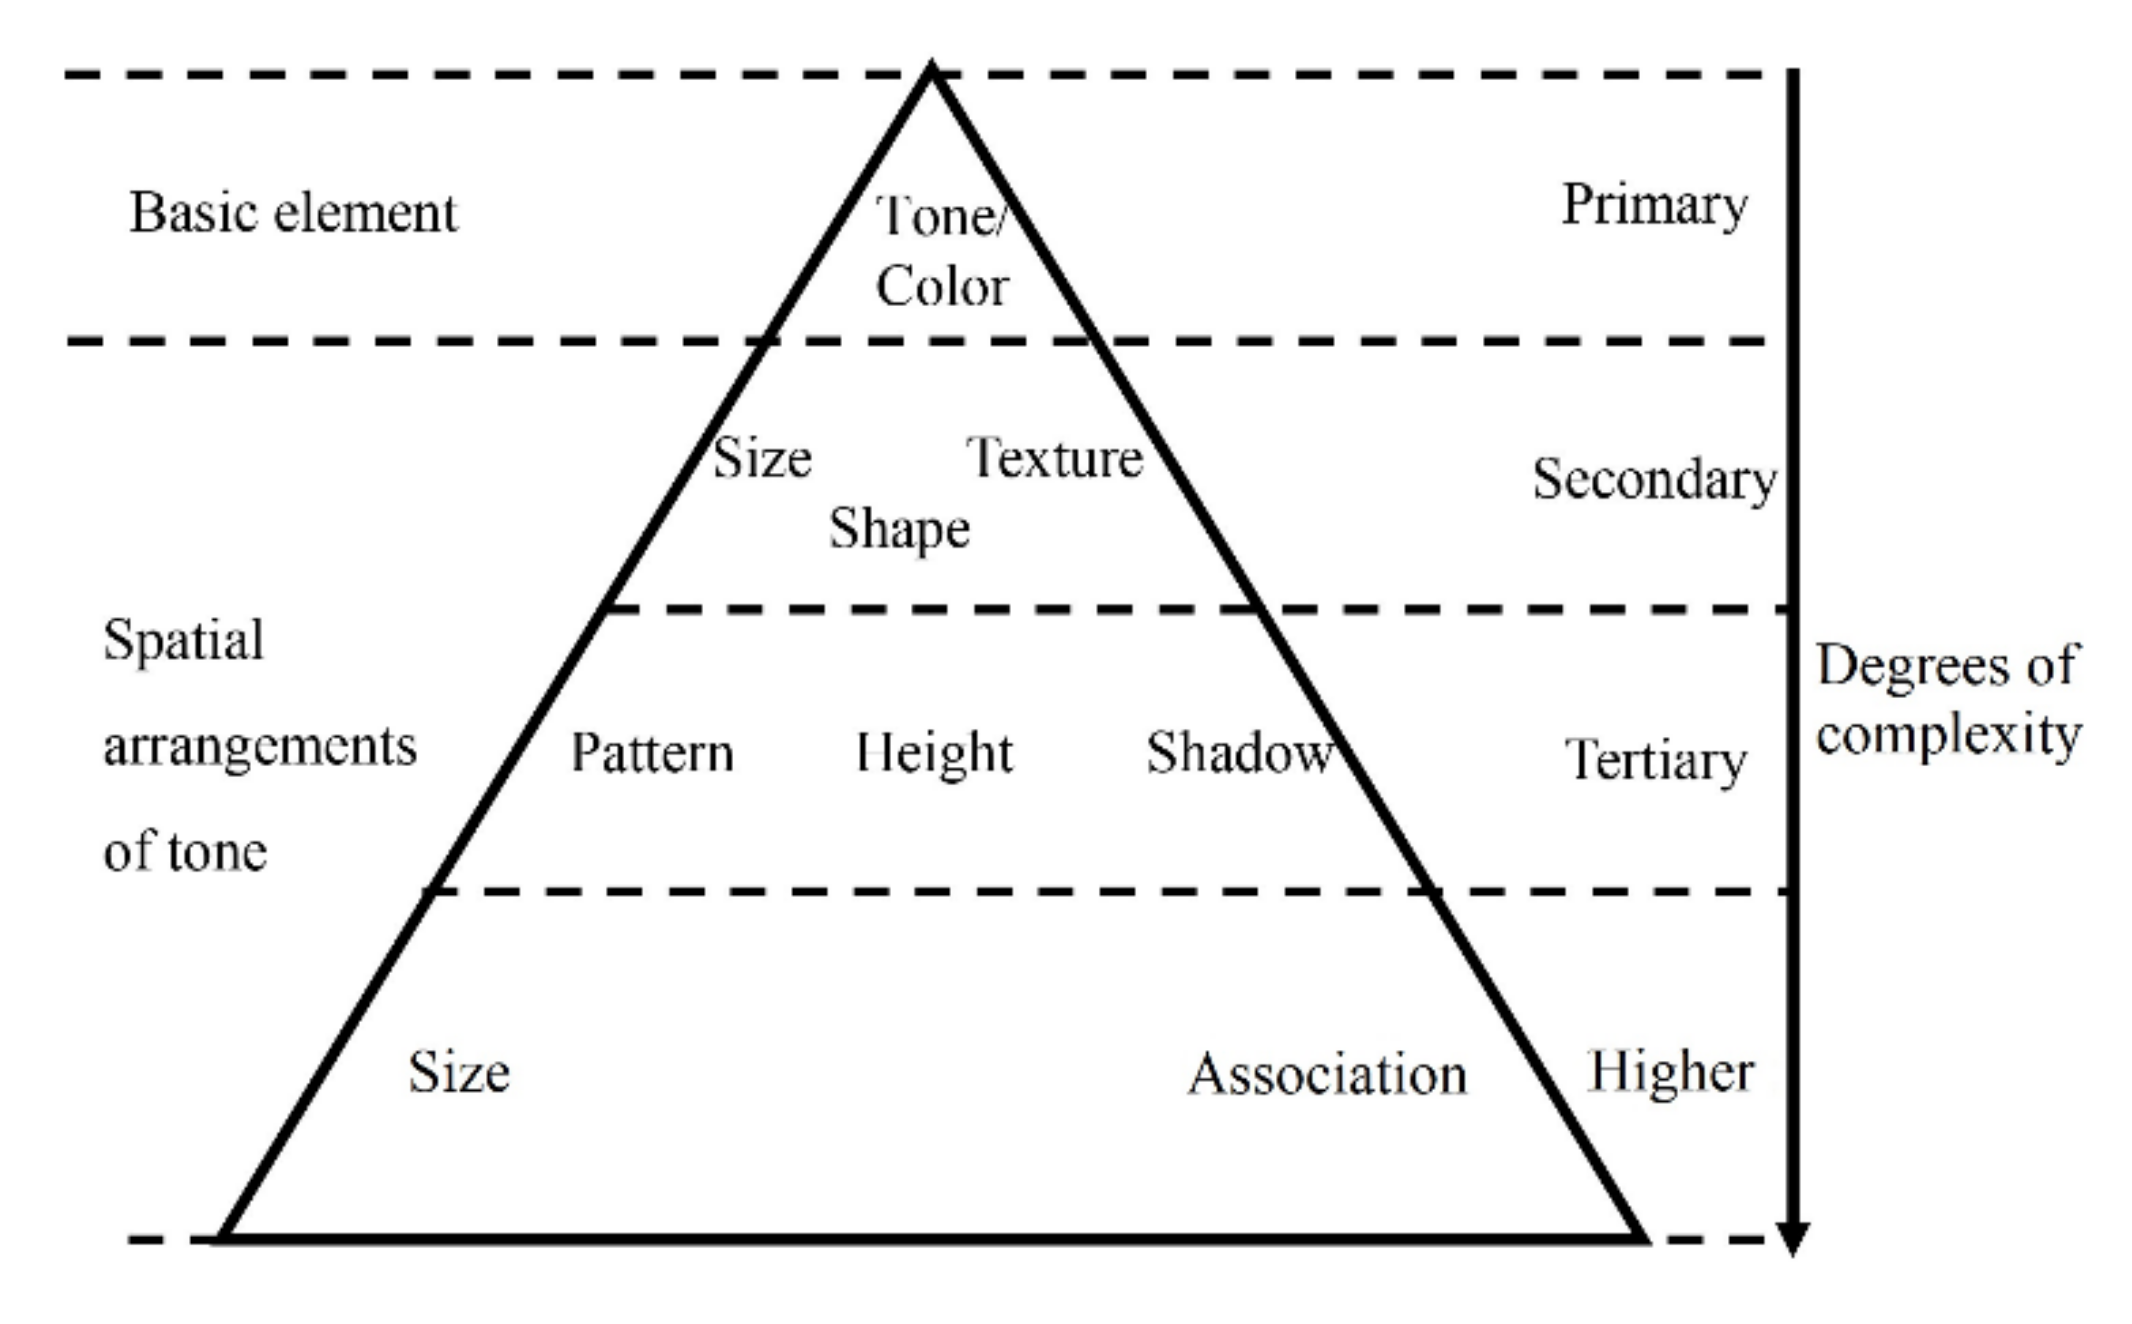
Land cover categories can be apparently recognized on Google Earth images through visual interpretation due to high spatial resolution in comparison to Landsat images. Figure 9 below presents the elements of visual interpretation from satellite images. However, some interpretation keys are used to choose ground truth samples on Google Earth images captured on 17 August 2001 and 8 November 2019 as follows:
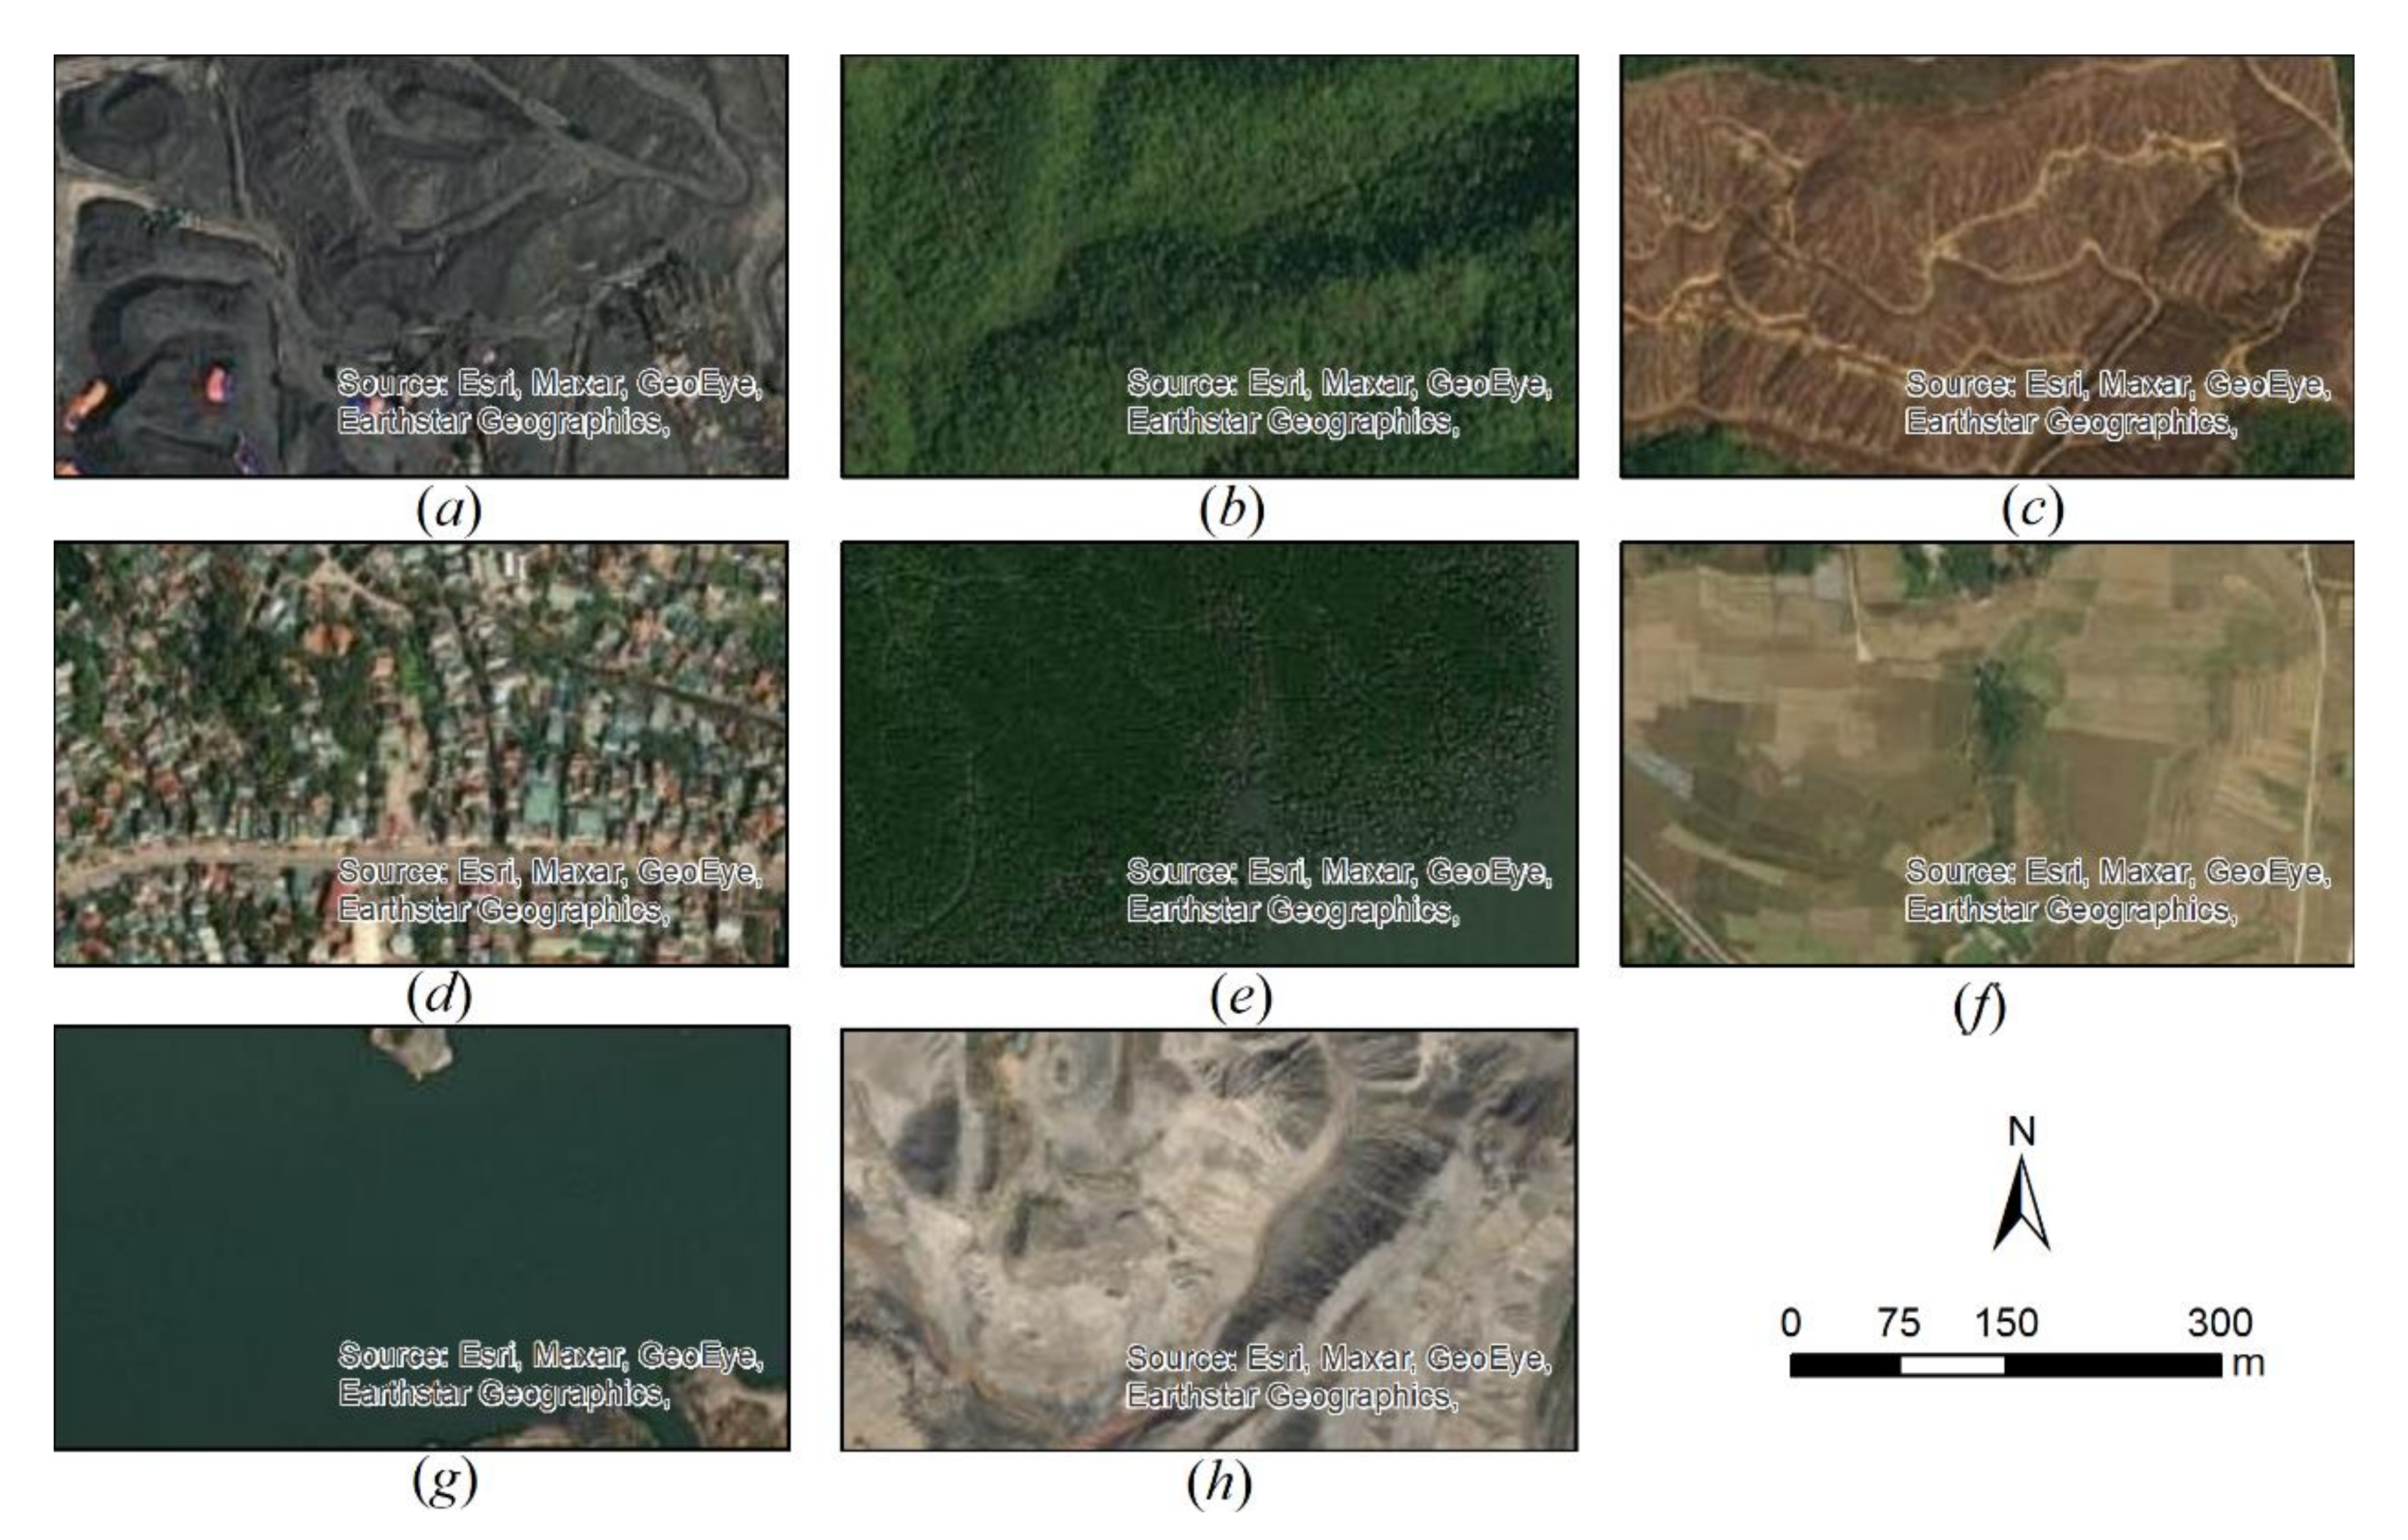
Site: The mangrove is often located near the natural water bodies such as the riverbanks or estuaries (Figure 10e). However, many mangrove jungles have been partly replaced by aquaculture ponds, and the rest of the mangrove jungle became adjacent ponds where water impoundment is constructed and managed for farming fish, shrimp, mollusks, etc.
Structure and shape: It is easy to distinguish the structure of mangrove with other vegetation types because mangrove’s foliage leaf often has a finer structure than forest but coarser structure than a paddy field (Figure 10b,e,f).
Tone/color: Coalfields are usually black (Figure 10a), while mangrove is dark green, logging land is brown, rock dump is grey on the natural color composite. It helps to clearly distinguish mangrove from other vegetation such as terrestrial forest, paddy field, logging land, etc. (Figure 10b,c,e,f).
Association: It is an indirect sign allowing to recognize the presence of objects or phenomena that cannot be directly perceived. However, we can identify their existence via traces, which have been left on the ground. For example, there are often many different types of equipment such as trucks, excavators, conveyors in coal fields (Figure 10a).

4.1.2. Accuracy Assessment

The accuracy of established land cover maps is often assessed via the confusion matrix [91] and the Kappa coefficient [92]. In fact, the land cover maps issued from Landsat’s SVMs classifications are compared with ground truth samples, which were independently selected by visual interpretation on high spatial resolution satellite of Google Earth images. Due to the unavailability of Google Earth images in 1991, only two sets of random samples were respectively determined on Google Earth images (17 August 2001 and 8 November 2019) corresponding to eight classes of land covers mentioned in Figure 7. Each set consists of 10 samples with an average of 200 pixels/sample for each land cover category. Various indices might be pointed out from the confusion matrix: the overall accuracy, producer’s accuracy, user’s accuracy, Kappa coefficient, which are summarized in Table 3. The statistical parameters for 2001 and 2019 show that the overall accuracy alternately reached 97.99%, and 94.95%, while the Kappa coefficients reached 0.97 and 0.92. The user’s and producer’s accuracies of individual classes are consistently high, ranging from 72% to 100%.

4.1.3. Comparison with High Spatial Resolution Image

In order to validate SVMs classification results, the outline of the land cover map issued from Landsat image (23 September 2019) was investigated by overlaying on Google Earth image (8 November 2019). The five random specific frames are closed-up in Figure 11, showing the properly geometric and thematic matching between two datasets in the validation context.

4.2. Land Cover Maps

4.2.1. Filtering Noise

After SVMs classification, the patches of pixels representing detached small and discrete land covers are quite common in the raster dataset and considered as noise. This unwanted noise can cause disturbance in image quality assessment and affect the reader’s ability to grasp the information. The filtering approach is introduced into the post-classification stage as an appropriate solution [93,94,95]. Thus, the filters help to eliminate discrete pixels in the image but still preserve the accuracy of results. In this study, the Median filter with a dimension of 3 × 3 window is applied to the SVMs classification products for all acquisition dates. The results show that noises were reduced in the final land cover maps. However, the general shape of objects in the classified images was still preserved (Figure 12).

4.2.2. Combining Classes

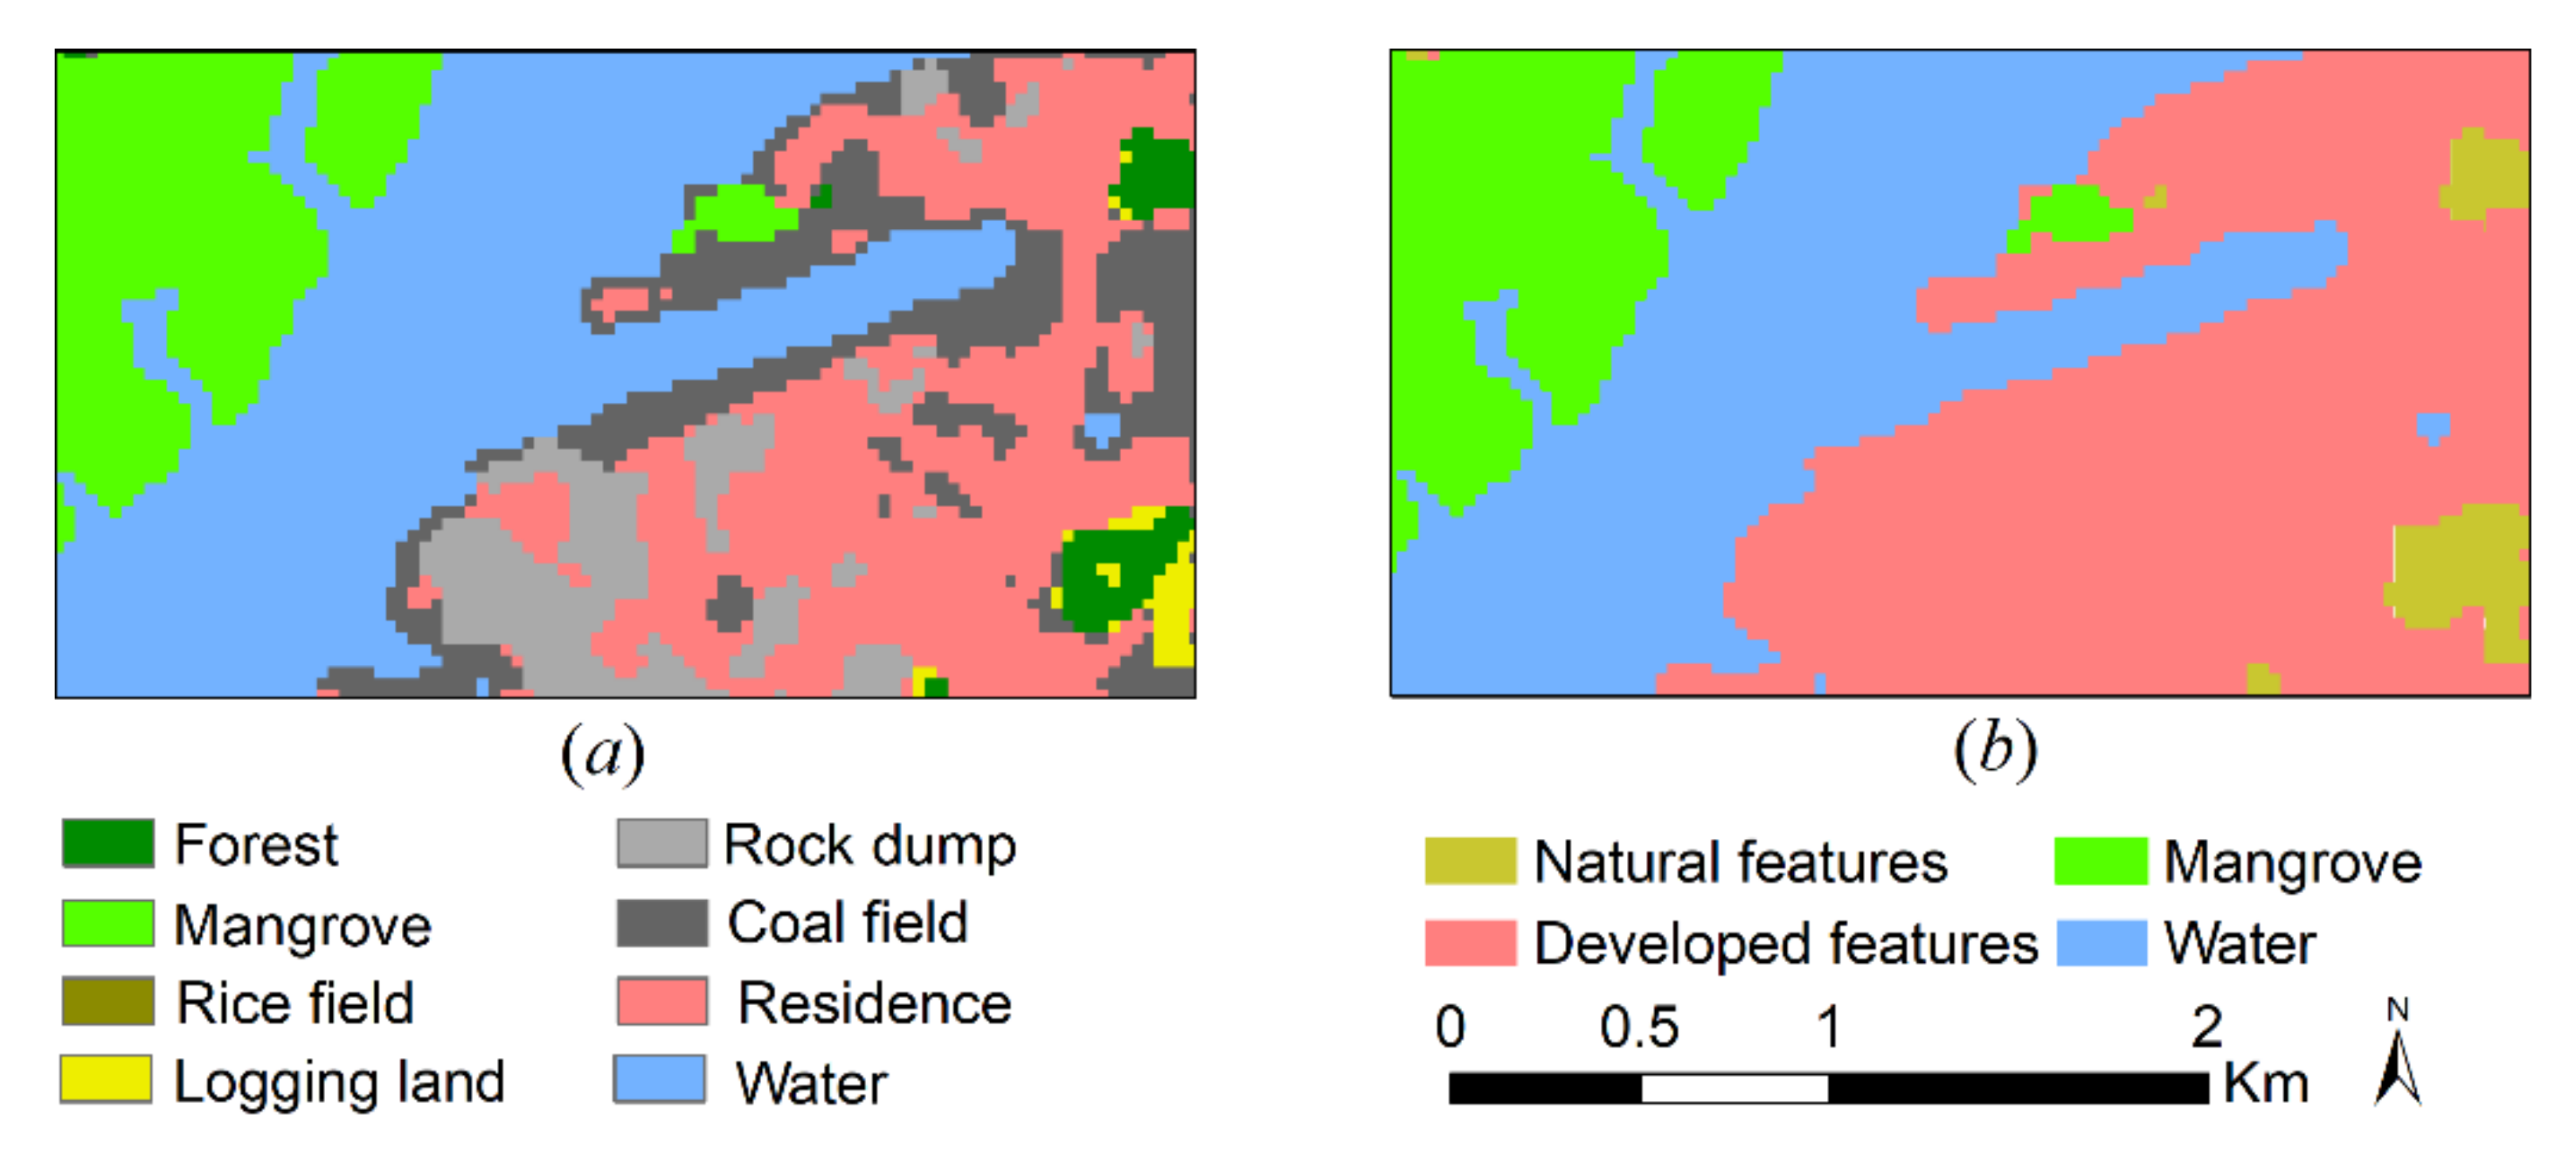
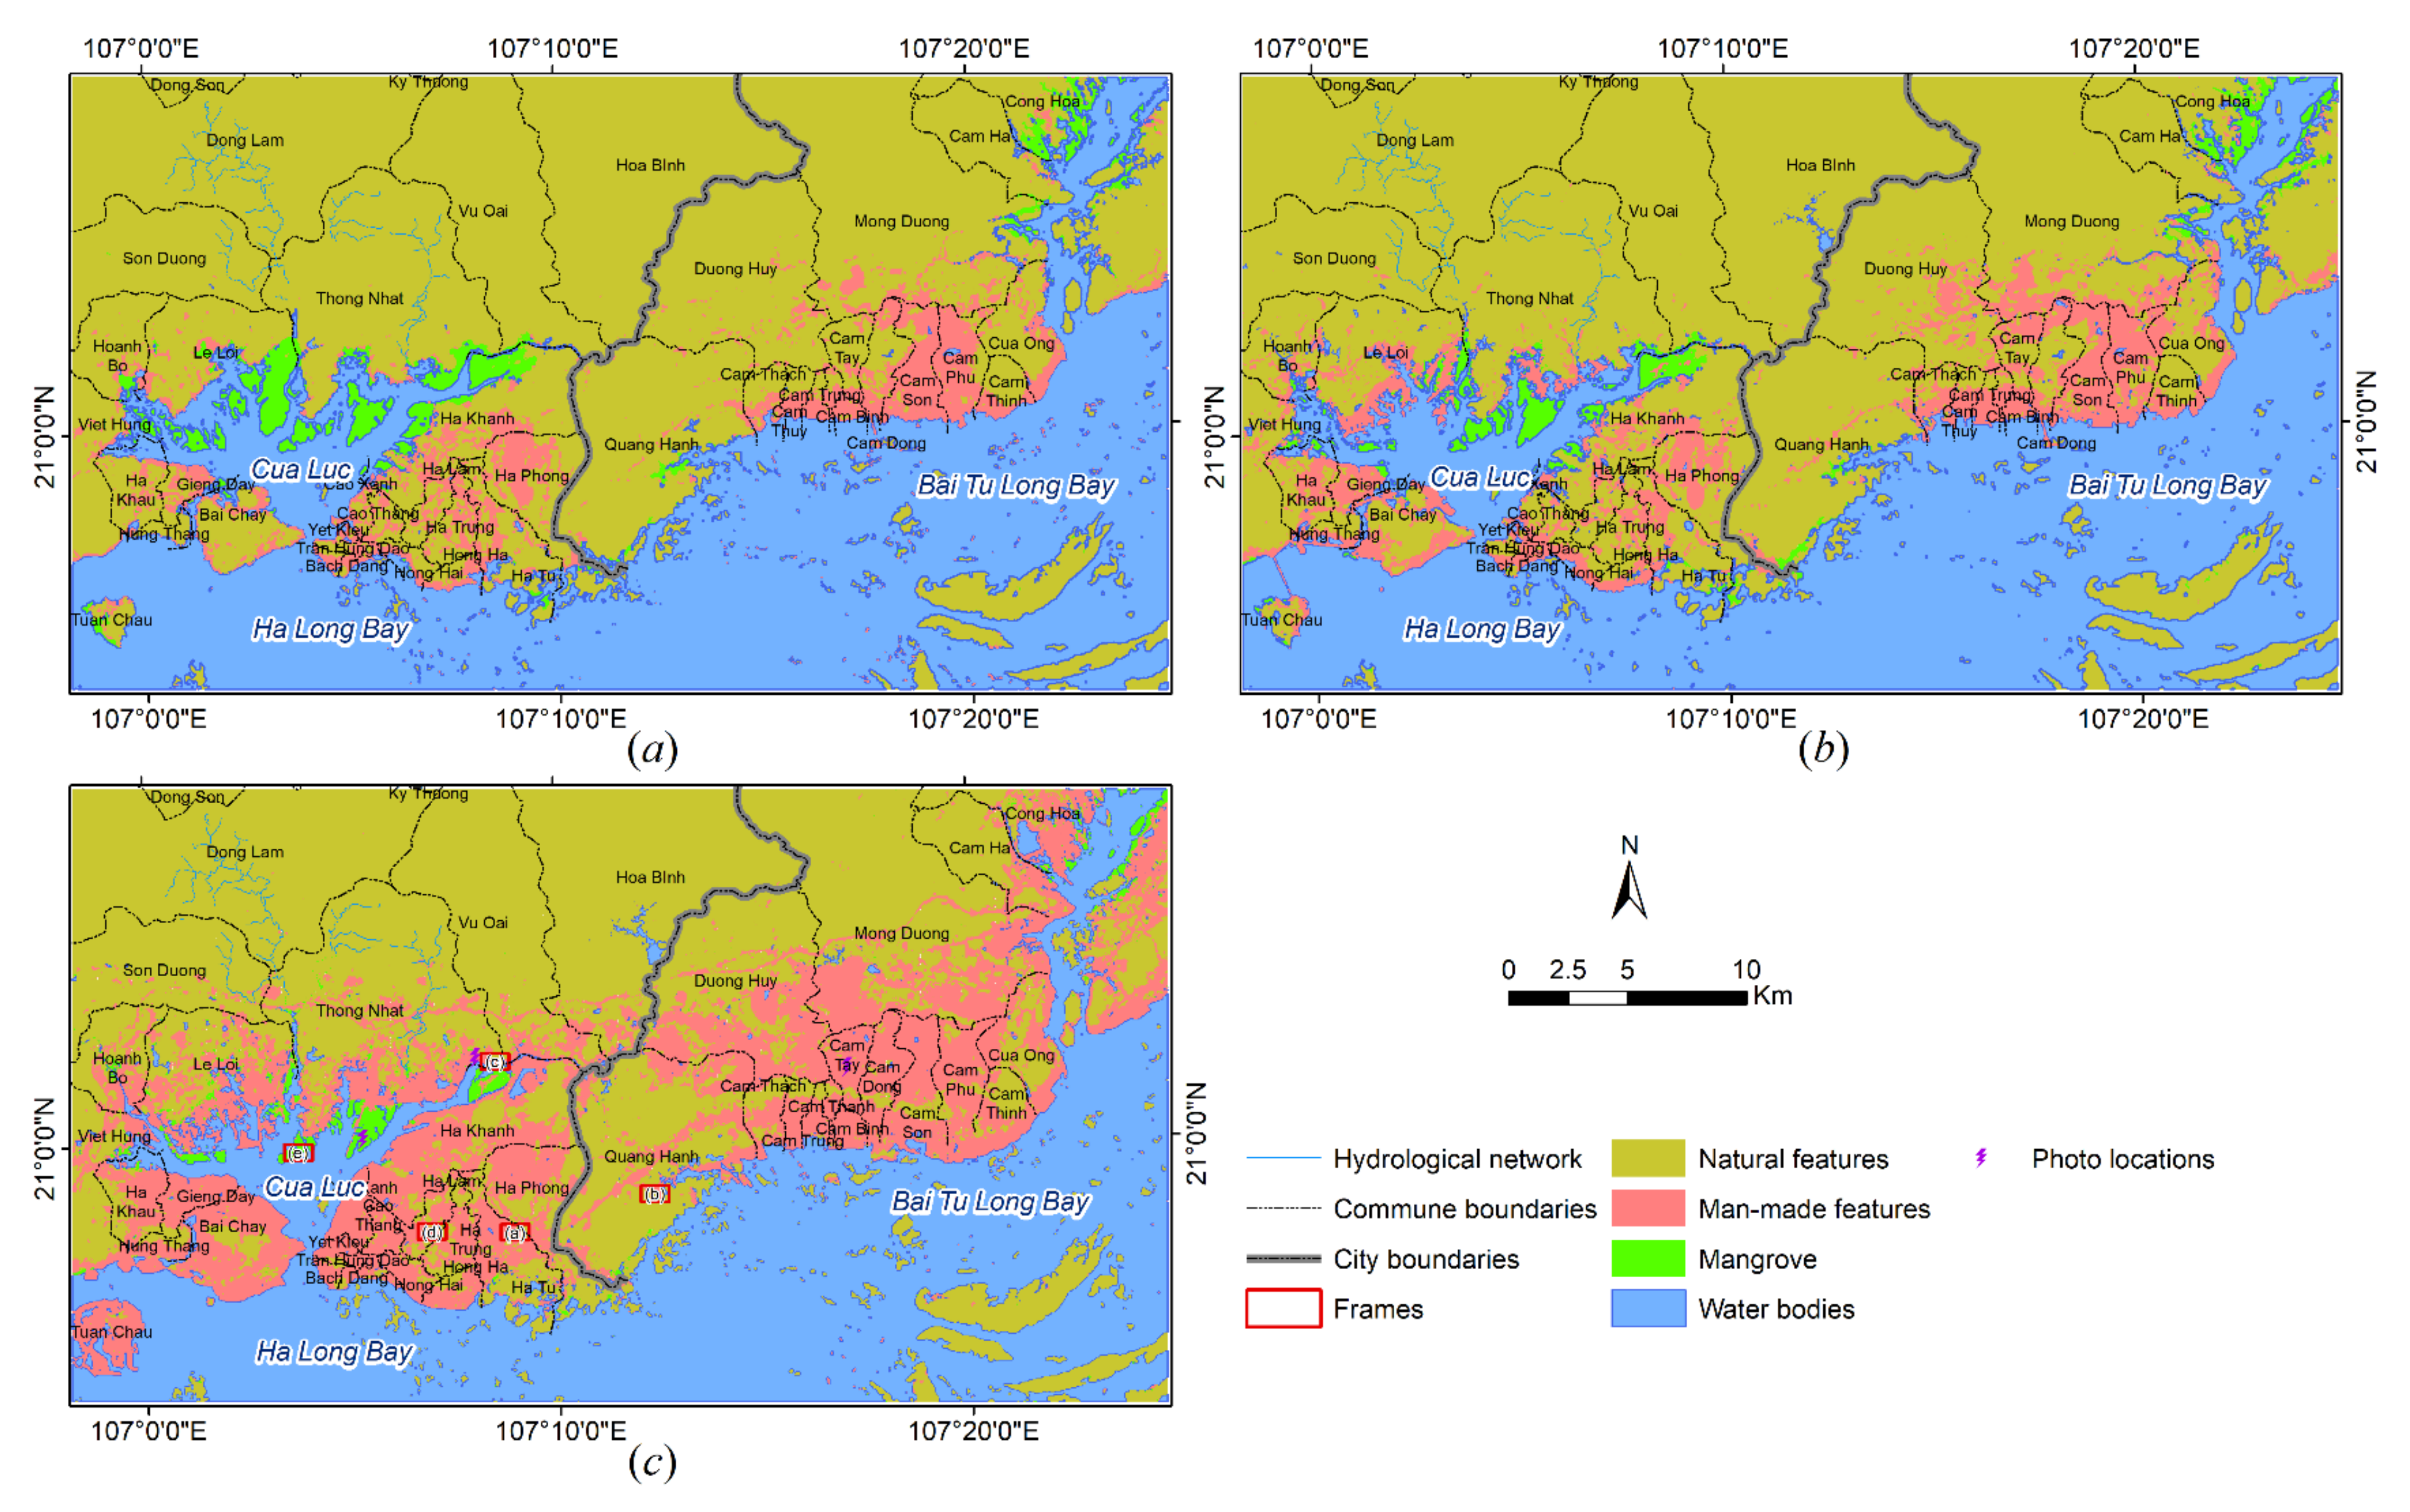
Mapping land cover products based on Landsat’s SVMs supervised classification identified eight land cover categories for each year (1991, 2001, 2019). However, change detection in urban areas focused on man-made features analysis because they are the most important artifacts reflecting the interactions between human activities with the natural environment. Therefore, eight original classes were selectively aggregated for responding to the study objectives, and new land cover maps were established with four derived classes: natural features, man-made features, mangrove, water (Figure 13a,b). Specifically, man-made features are composed of artificial land with coal fields, settlements, and rock dumps. In contrast, natural features consist of woodland (forest), bare land (logging land), and cropland (rice field). Meanwhile, mangroves and water were considered as two independent classes with natural features strongly affected by human activities in the study area (Figure 14).

5. Discussion

5.1. Change Detection

The change detection matrix of land covers is deduced from 3 classified images. They are synthesized in Table 4 and Table 5. The land cover categories can be determined when and what has been changed to what during an interval of time. In the present study, two periods are considered I: from 1991 to 2001 and II: from 2001 to 2019, corresponding to the administrative adjustments of Ha Long, Cam Pha cities. For change detection analysis, the post-classification approach was applied to the comparison of independent classified images for each period. The main benefit of the post-classification approach is the capability to provide the matrix of change information and to minimize external impact from atmospheric and environmental differences between the multi-temporal images [38].
The statistic numbers show that land covers had been slightly changed over the first period, but their mutation in the second period was considerably faster. For instance, the absolute values indicate that the areas of man-made features increased 2.08% for 10 years of the first period, but they have reached 13.24%, corresponding to 6 times for 18 years of the second period. However, the average area of man-made features increased from 248 ha/year in the first period to 828 ha/year in the second period corresponding to 3.3 times, while the area of natural features, mangrove, and water bodies decreased due to the coal exploitation or sea encroachment from 148 ha, 74 ha, and 25 ha/year in the first period to 620 ha, 88 ha, and 166 ha/year in the second period, respectively. That manifests that the temporal interval of the second period is almost twice as long as the first period, the change of land covers does not occur linearly.

5.2. Analysis of Urban Evolution

After integrating two classified maps of each period, the situation of each land cover category over two periods is expressed in Table 5.
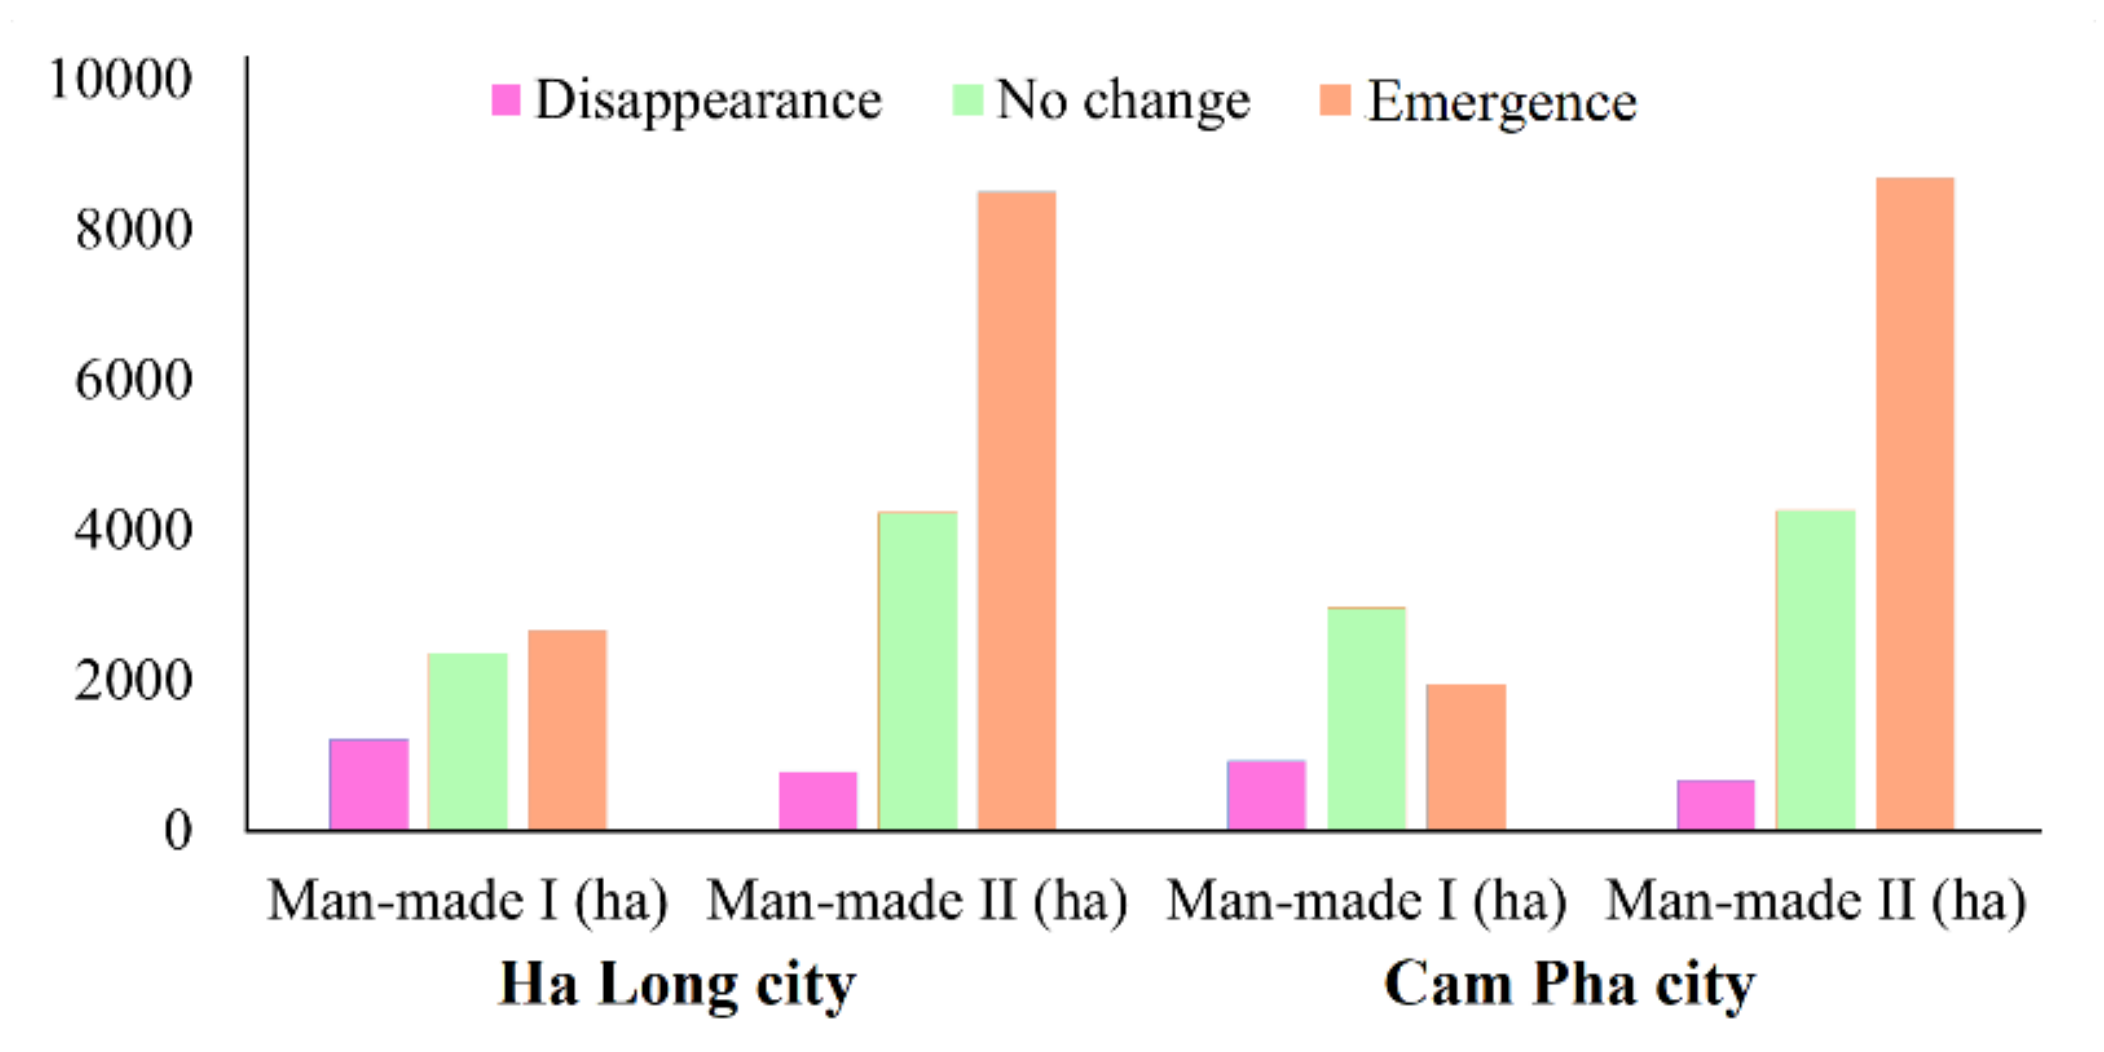
Ha Long city was established in the early 1990s based on Hon Gai town and then followed by Cam Pha city in the early 21st century based on Cam Pha bourg. These major urban centers provide labor sources for coal mines in the region. After the national opening economy plan in the middle 1980s, the urban evolution at Ha Long—Cam Pha cities emerged with slight changes during the first period and stronger dynamics after 2001. The changes in Ha Long city were bigger than in Cam Pha city (Figure 15).
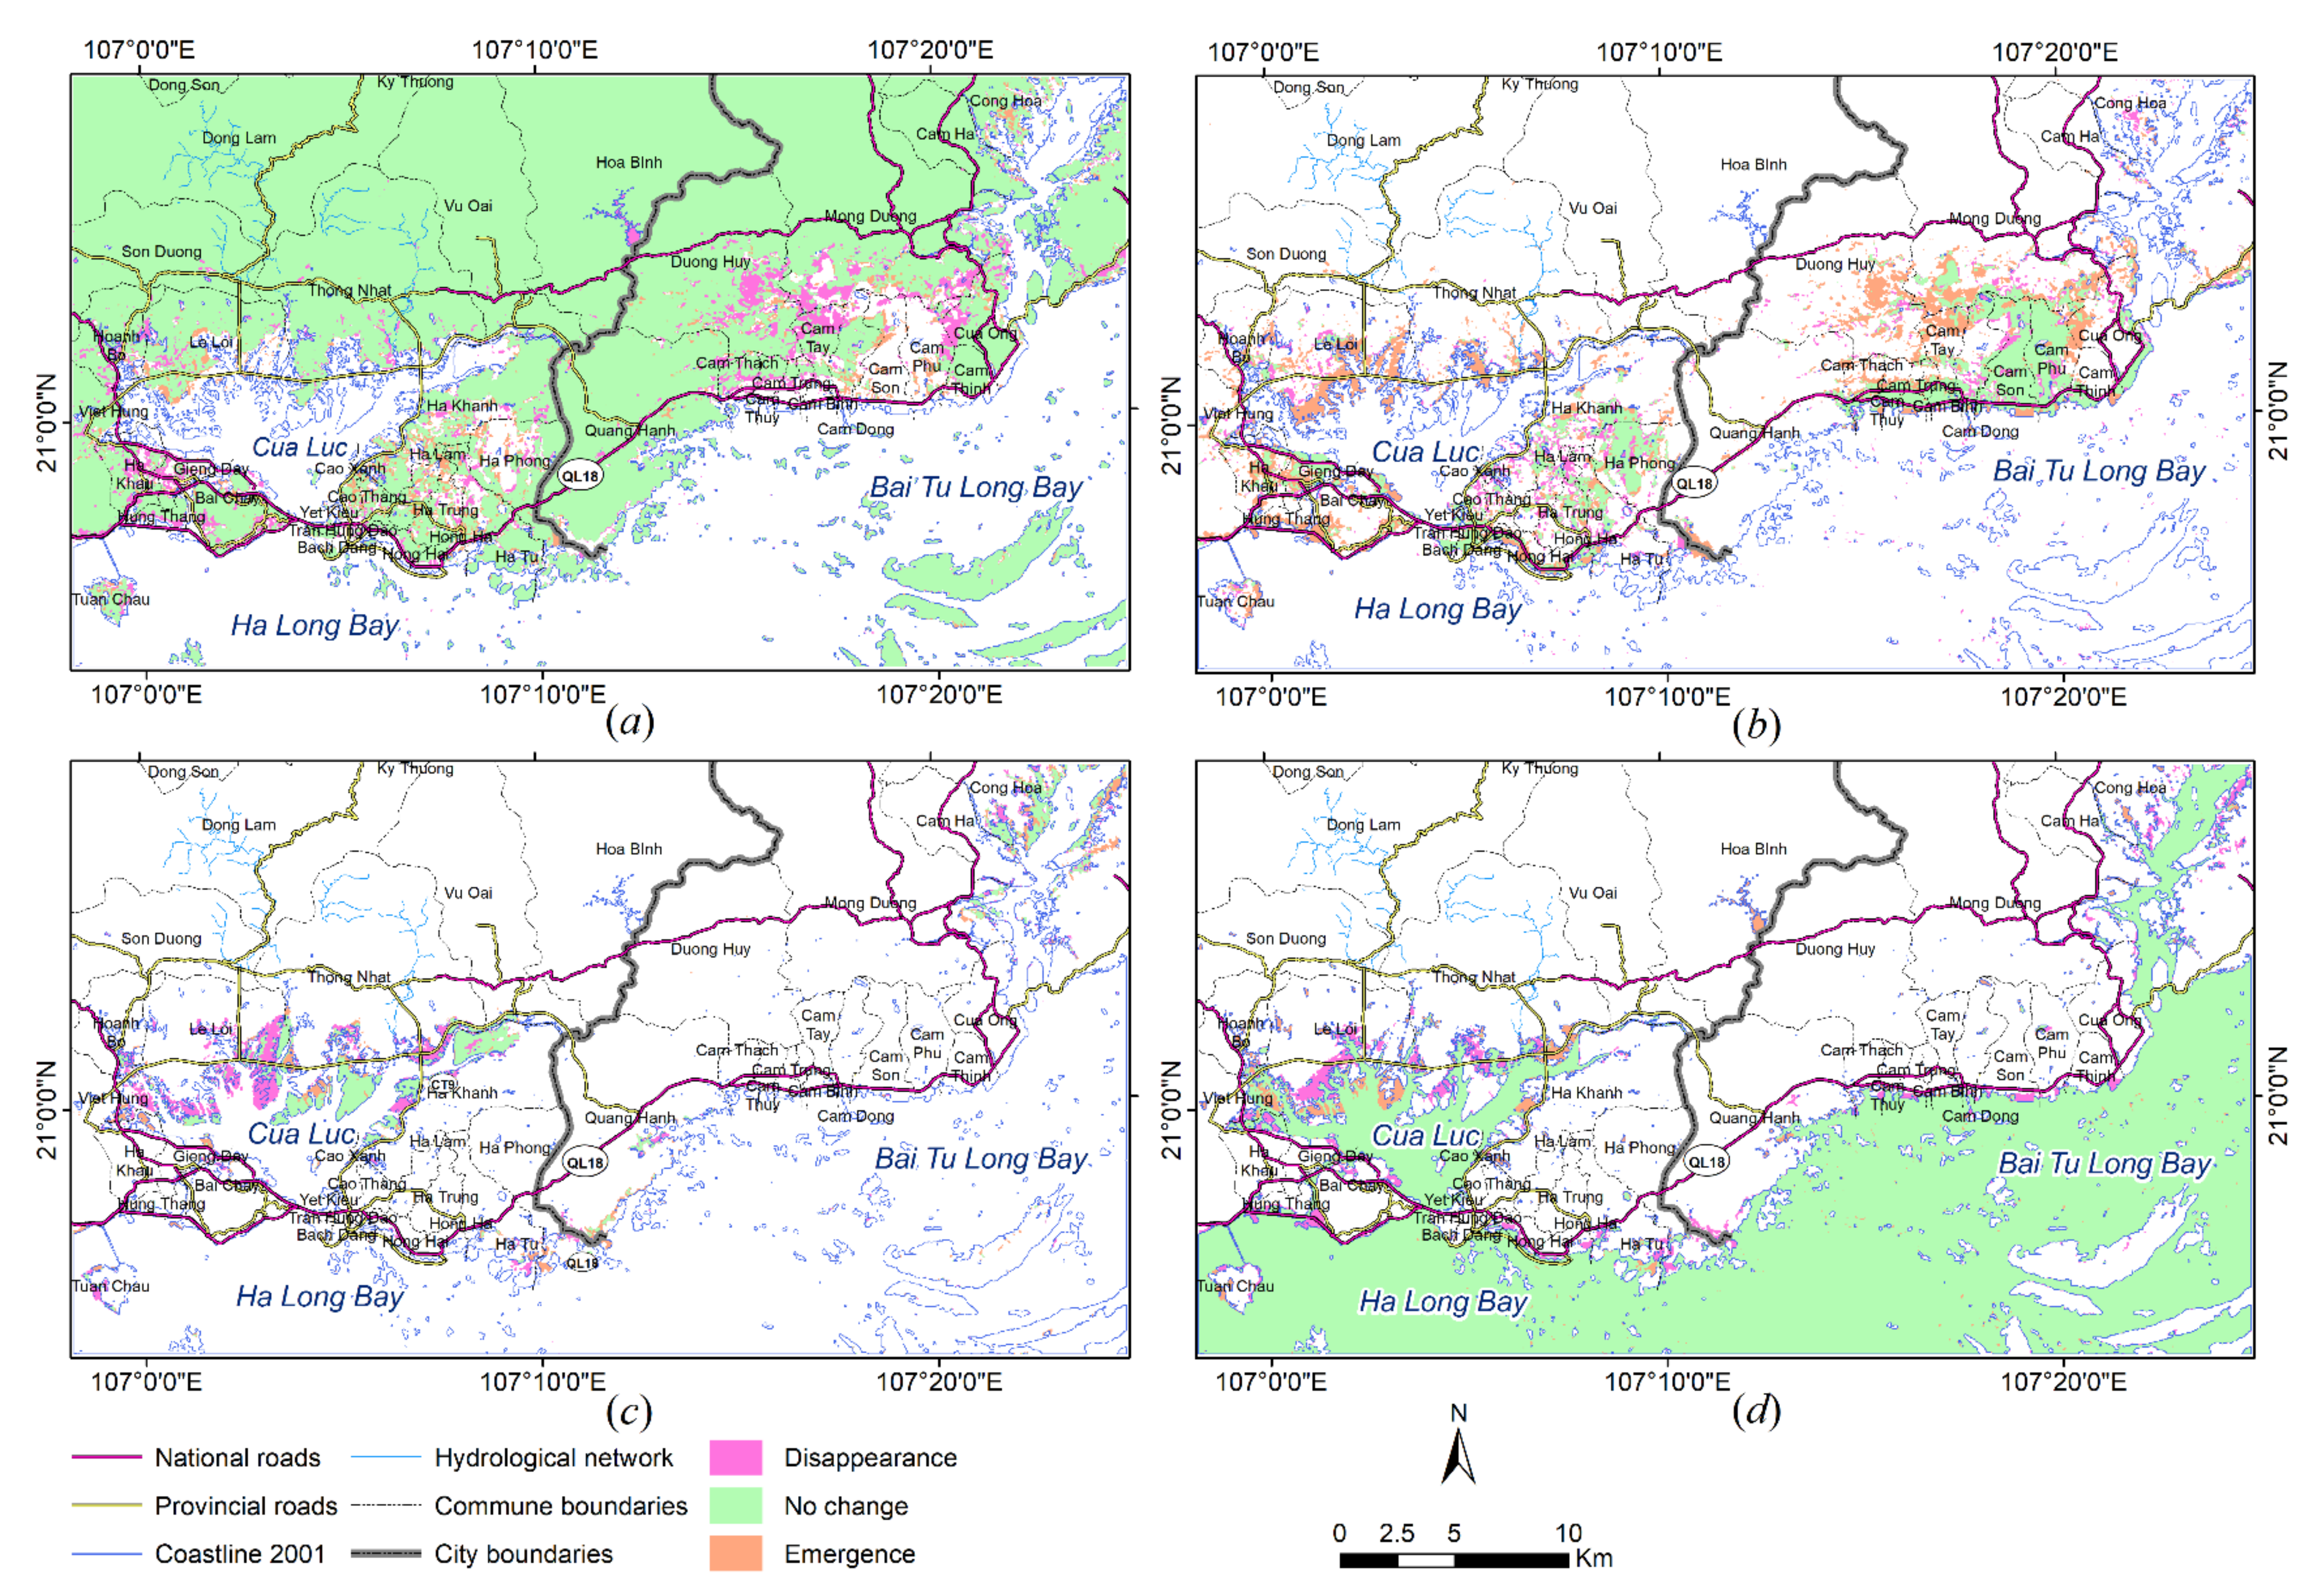
In the first period in Ha Long city, natural features have not changed yet (Figure 16a) because the flat intertidal zone at the North part of Cua Luc estuary, Hung Thang, and Gieng Day wards was affected, where the large patches of mangrove forest (1372.72 ha) and water bodies (1288.16 ha) were replaced by man-made features (Figure 16c,d). In Cam Pha city, the significant emergence of man-made features was related to activities of open-pit coal mines, where the denudation of natural features was recognized (Figure 16a,b). Otherwise, many small patches of man-made features were expanded by pouring waste rock into the sea with the replacement of water bodies (473.94 ha) at Cam Trung and Cam Thinh wards (Figure 16d). The disappearance of man-made features at two cities is explained by environmental reclamation when coal mines have been exhausted (Figure 16b).
In the second period, the population growth and economic development promoted the rapid increase of urban change. Specifically, in 2010 the population of Ha Long and Cam Pha cities reached 223,700 people and 177,400 people, respectively. In 2020, the population reached 327,000 and 191,300 people [5]. Moreover, Table 6 illustrates the differentiation of economic structures between the two cities: industrial sectors have been concentred at Cam Pha city, where coal exploitation became dominant. Meanwhile, service sectors have been concentred in Ha Long city of which the potential is tourism with recreation activities. However, the changes are identical between the two cities (Figure 15).
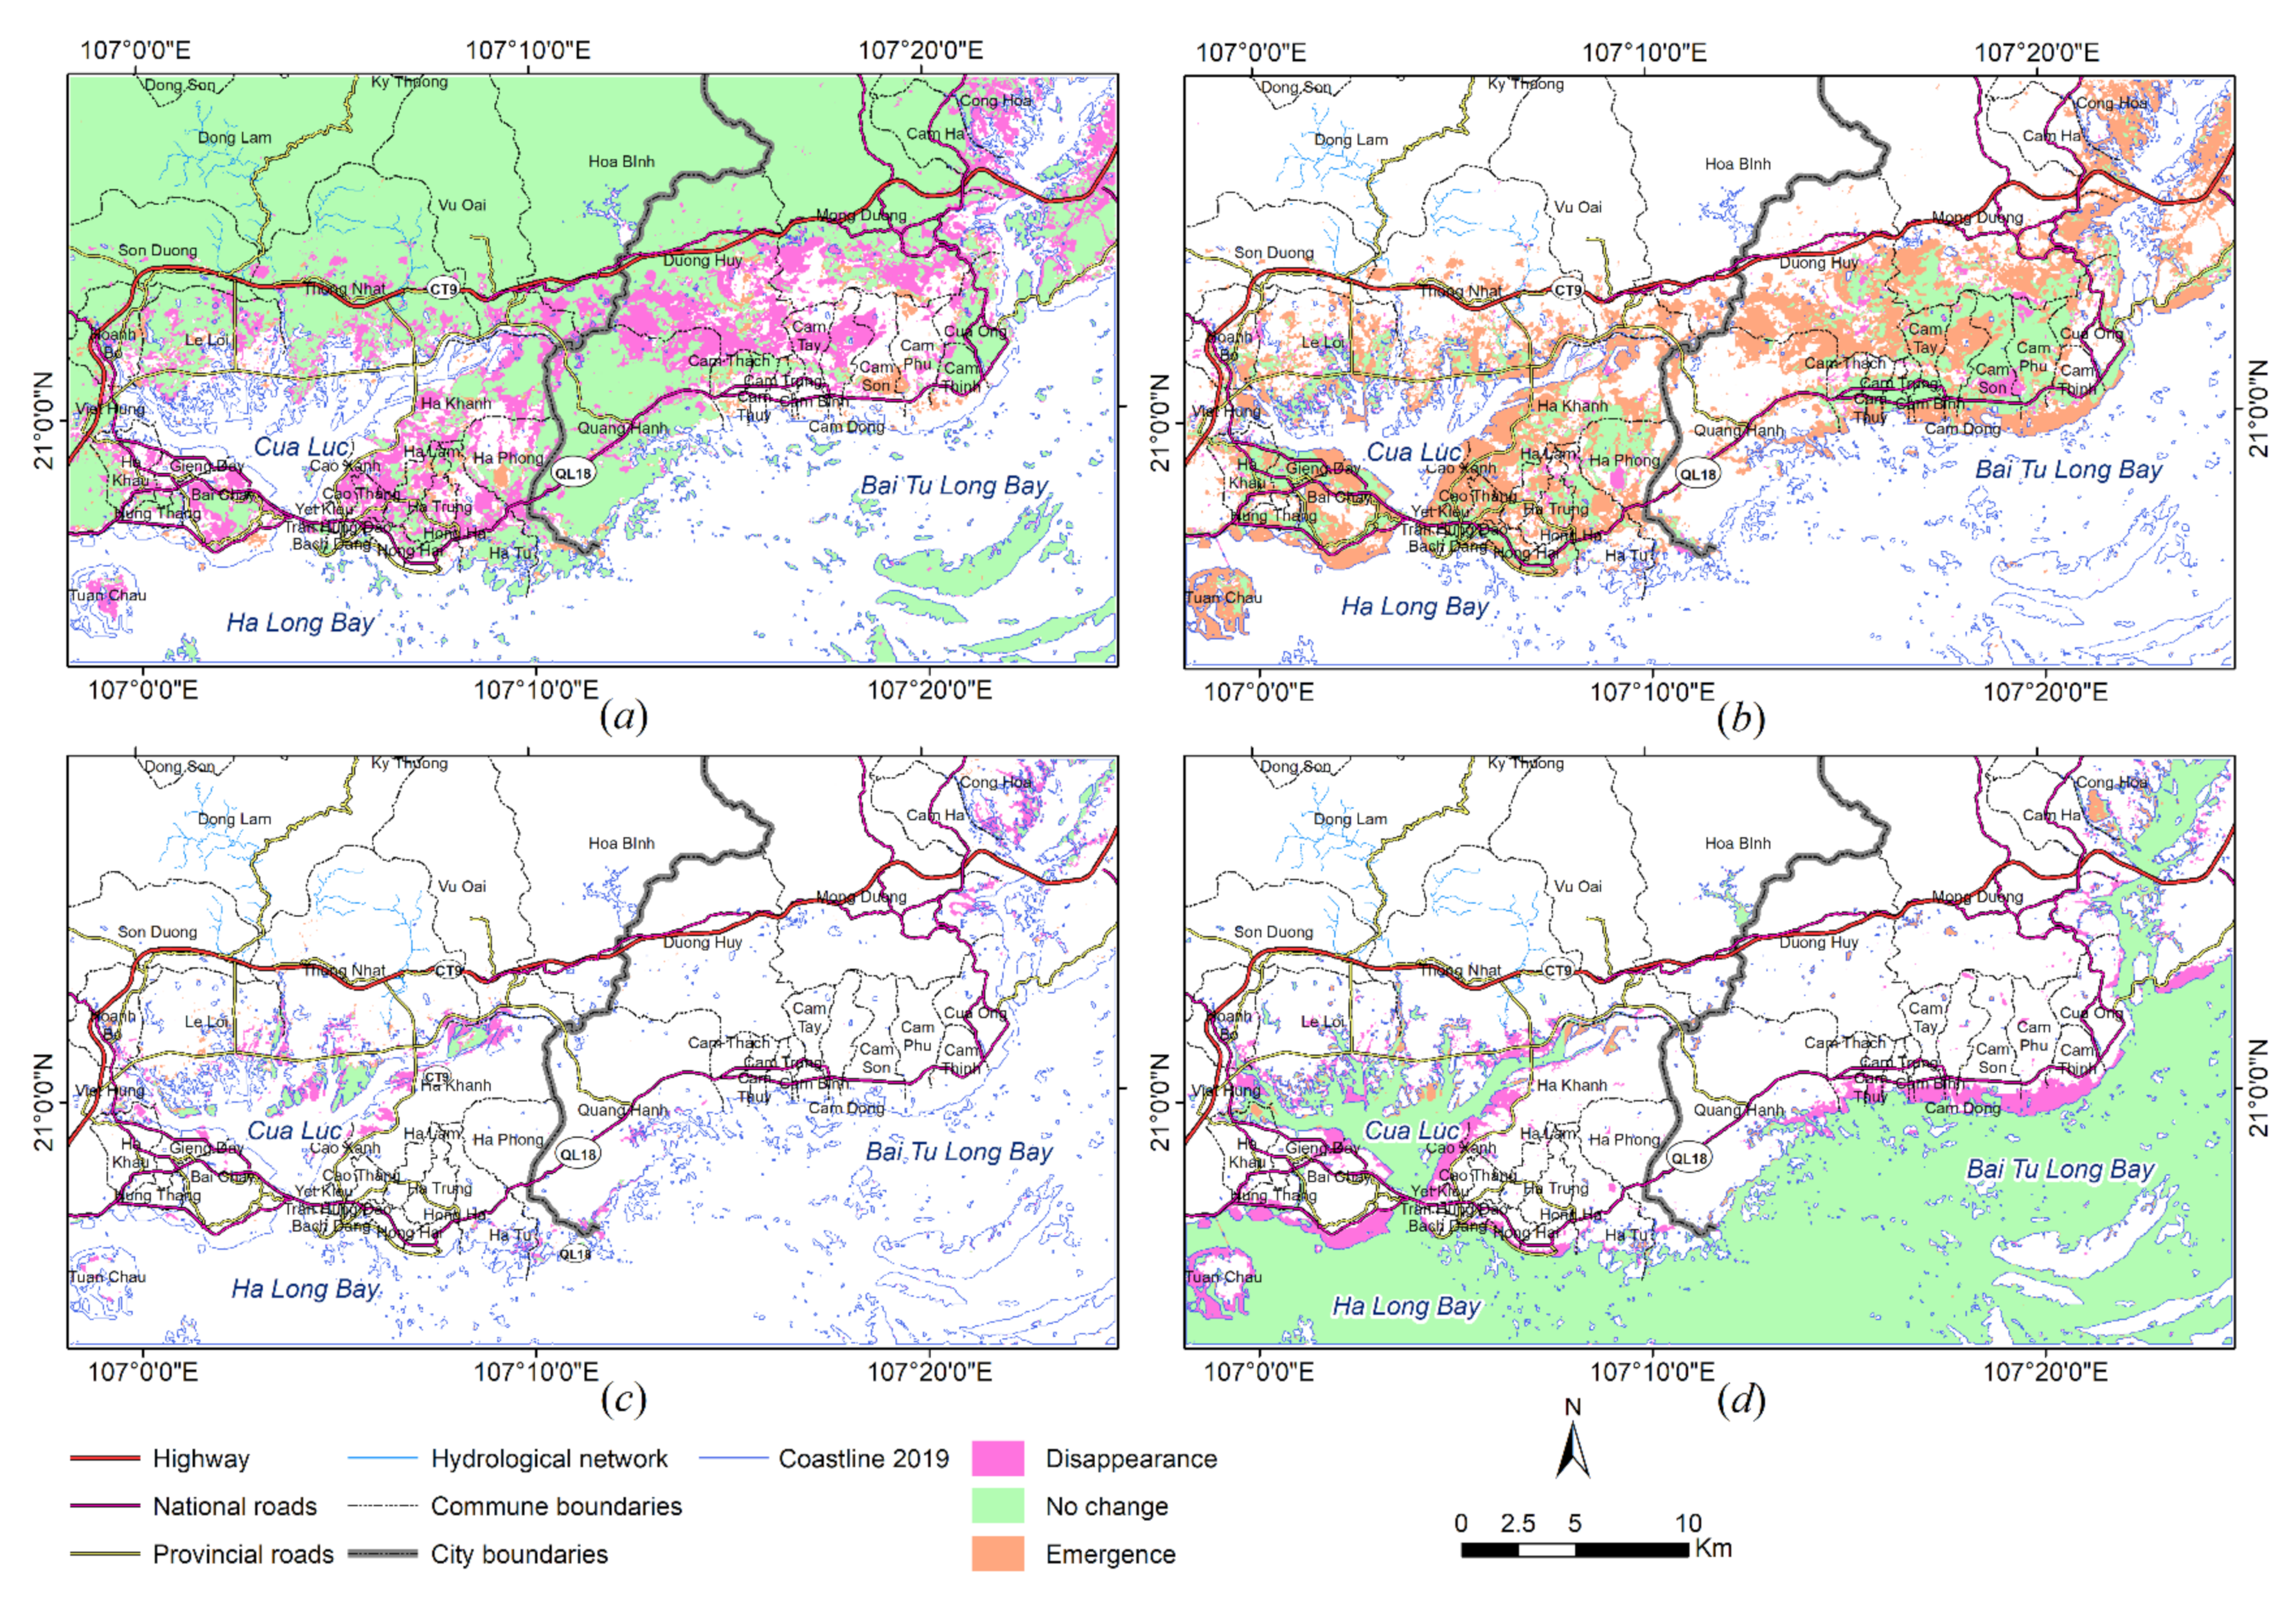
In Ha Long city, man-made features have expanded large patches causing an important reduction of about 2911 ha of water bodies in the left and right banks of Cua Luc estuary, around Tuan Chau island, Bai Chay beach, and at Viet Hung, Ha Khanh, Hung Thang, Cao Xanh, Hong Hai, Hong Ha wards (Figure 17d), where the demand of real estate has risen with the installation of infrastructures for recreation areas, residential settlements and luxury hotels due to the close proximity to world heritage site [99]. This has constituted a driving force to stimulate the widening of man-made features toward the intertidal zone, which will be described in next Section 5.3 (Figure 17b). Although provincial authorities have perceived the ecological role of mangrove jungles and they desired to preserve them, mangroves have lost 1142.55 ha in comparison with the previous period (Figure 17c). In Cam Pha city, man-made features have continued to expand toward the intertidal zone at the Cam Trung, Cam Thinh, Quang Hanh wards, occupying 744.37 ha of mangrove jungles (Figure 17c) and 1747.45 ha of water bodies; making the National Route No18 no longer adjacent to the sea, but located in the interior with the farthest distance about 1 km (Figure 17d). During this period, open-cast coal mining flourished in the territory of both cities with 23 major coal mines, which caused the expansion of man-made features for encroaching upon the natural features (Figure 17a,b). These areas are mainly located in the mountains in the central and northern part of the study area.

5.3. Analysis of the Urban Development
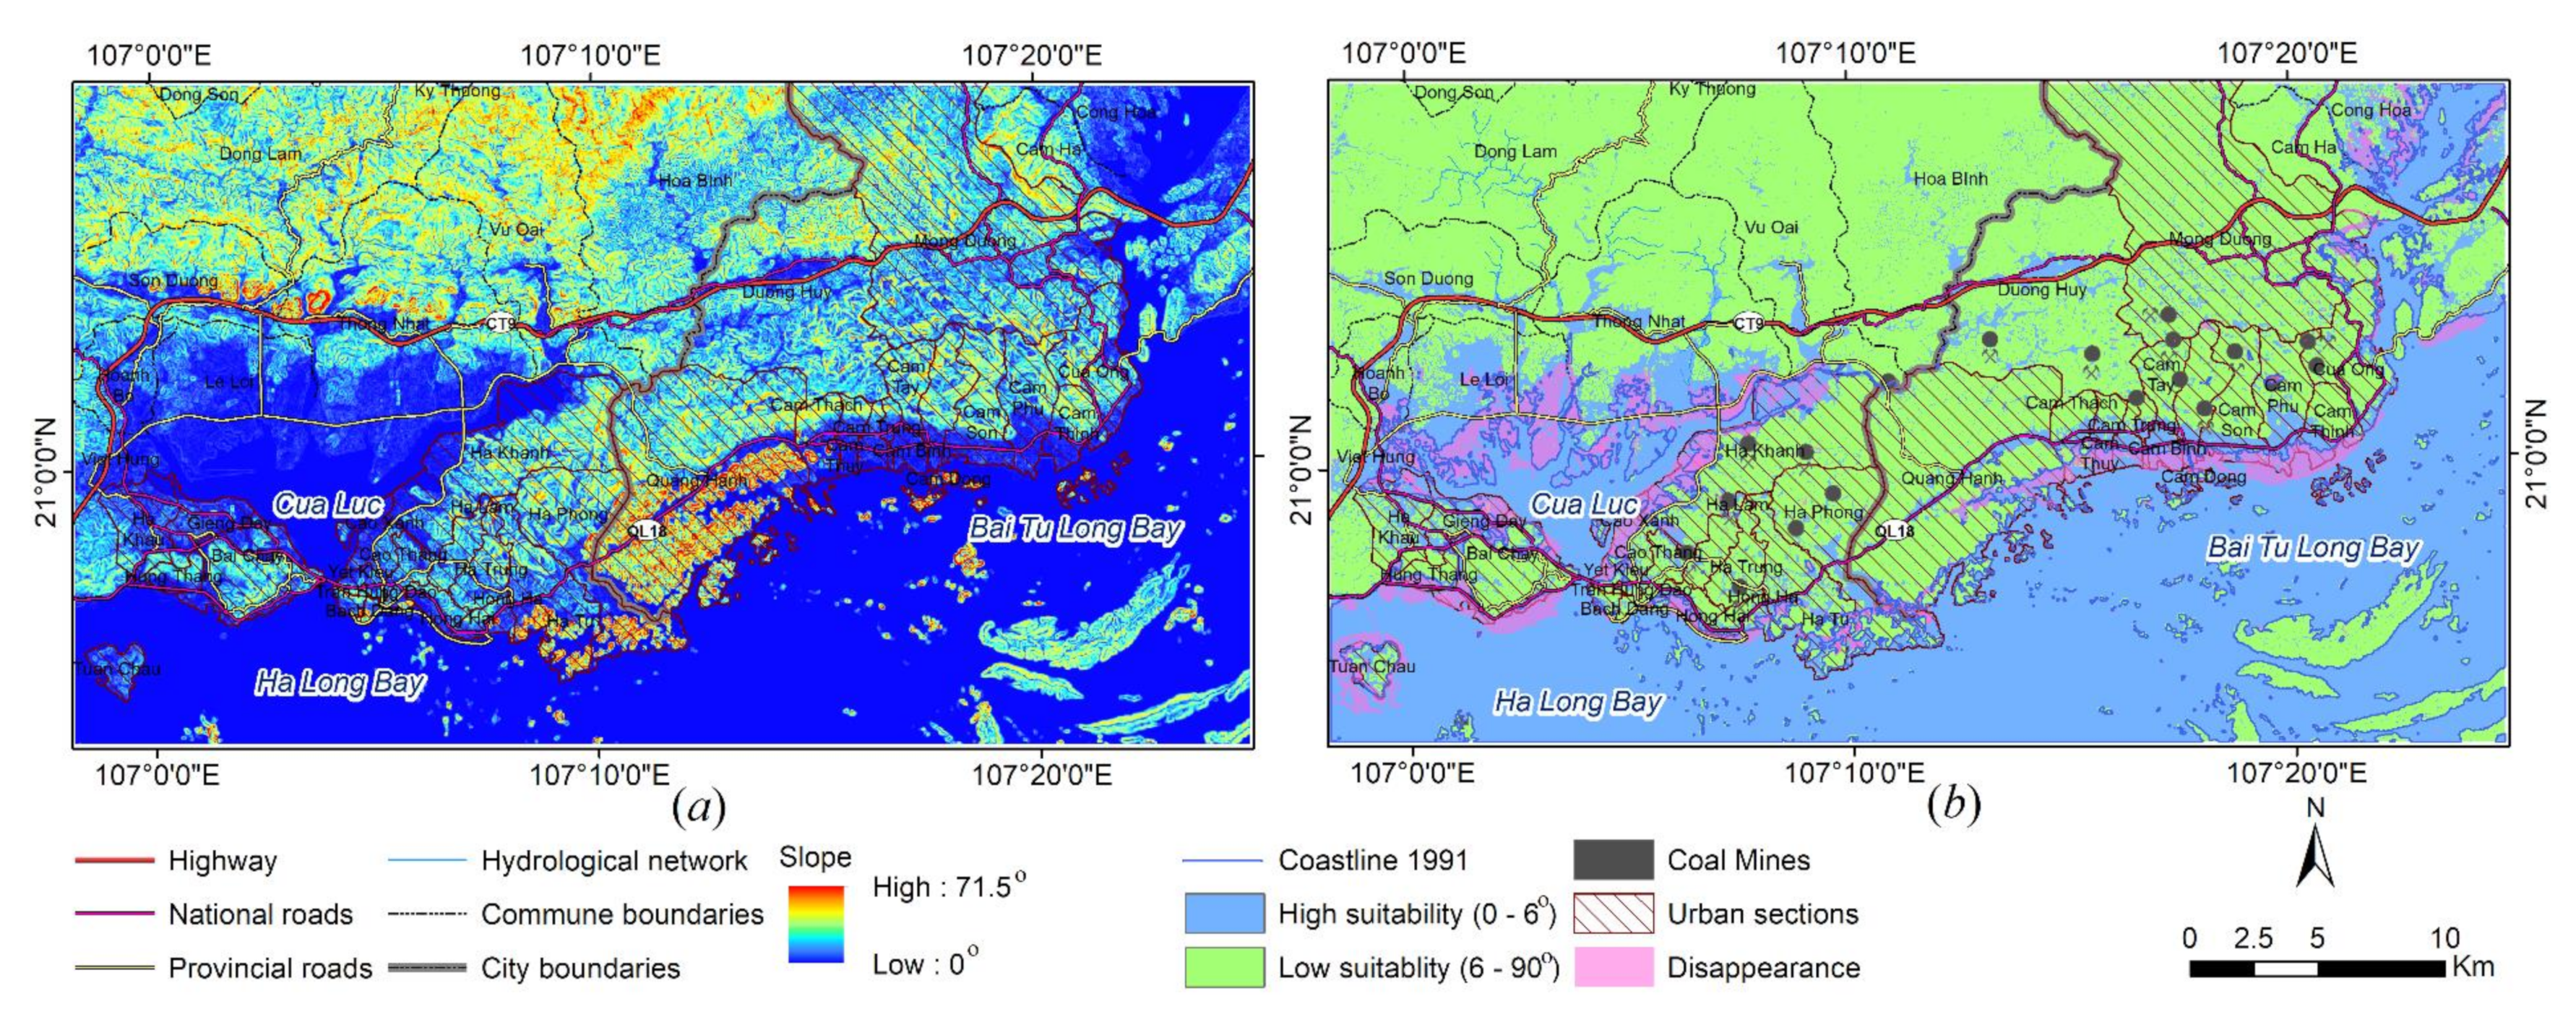
Urban development requires a suitable space to respond to the specific needs of construction. However, suitable spaces have been limited at Ha Long and Cam Pha cities due to the topographic constraint with high and steep mountains. These limited spaces are also occupied by coal mining fields in the central part of the study area. These settings make both cities face the sea and lean against the cliffs (Figure 18a). Lofrano et al. [100] have assumed that urban development is initially compelled by underlying geologic resources and overlying geomorphologic forms. In addition, Yang, He, and Xu [101] also recognized the role of terrain slope as one of the most important factors for evaluating land suitability for urban development in the mountainous area, and the perfectly suitable steepness ranges from 0° to 6°. For analyzing the relationship of urban evolution and urban development at Ha Long and Cam Pha cities, the SRTM digital elevotion model was used to calculate slope map. The values of slope have ranged from 0° to 71.5° (Figure 18a) and two gradient classes of suitability for urban development were derived as illustrated in Figure 18b together with the distribution of coal mines.
Rivkin [102] mentioned that urban evolution was the adaptation of organisms to heavily populated urban areas. Anthropogenic environmental and geographical changes brought to habitats when urbanization takes place have a significant evolutionary impact on organisms inhabiting these city areas. Whereby, people initially exploited the flat ground located in narrow ravines and along the coast to establish urban settlements, which are connected by the inadequate road network. The national route No18 is a unique backbone for serving the communication of two cities for a long time. The analysis of urban evolution in the previous section expressed that urban development in the next stages occupied suitable places in terms of steepness by filling mining waste rock into water bodies or mangrove jungles at intertidal zones. This tendency is clearly observed in Ha Long city, where man-made features extended across the Cua Luc estuary and at the Northern part of Ha Long bay, while man-made features have principally spread in the Northern part of Bai Tu Long bay in Cam Pha city. Figure 18b presents the disappearance of water bodies and mangroves jungles corresponding to the emergence of man-made features across the period from 1991 till 2019.
In fact, this phenomenon matched with the policy of provincial authority relating to the general land use planning from 2000 to 2020 of Ha Long city [103] and Cam Pha city [104]. By 2019, the flat terrain for urban development in both cities was depleted. Therefore, Ha Long city has been merged with Hoang Bo district to be able to exploit flat terrain at the Northern part of Cua Luc bay and the areas located along with highway No. 9 connecting Ha Long city with Van Don airport. However, the open space for urban development of Cam Pha city has still rested a critical problem. However, over the last decades, on the one hand, the opencast coal mining has emptied coal deposits, and on the other hand, the provincial authority would like to protect the environment by fostering tourism at the World’s Natural Heritage site—Ha Long Bay. In consequence, all opencast coal mines in this coastal area have been gradually closed in 2025 to minimize environmental pollution [105]. The reclamation then returns the disturbed land from mining activities into natural habitats. A vast surface near cities’s old centers can be exploited to decrease the pressure on open space, although it does not belong to suitable places for urban development.
Figure 18. (a) Topographic gradient (b) Suitability for urban development (location of coal mines issued from geological map [106].
Remotesensing 14 01241 g018

6. Conclusions

This study has proved the ability of Landsat datasets to produce accurate land cover maps and to analyze urban evolution at the coastal area of Ha Long—Cam Pha cities using change detection techniques with post-classification comparison approach. The application of SVMs classifier from spectral bands of Landsat images allows classifying land-cover categories at different periods of time. The accuracy assessment based on visual interpretation from Google Earth image captured at the identical period and in-situ observation provides suitable confidence with an overall accuracy of 97.99% and 94.95%, while Kappa coefficients reached 0.97 and 0.92. The study also expresses the constraint of topographic and geologic resources to urban development at the coastal area of Ha Long—Cam Pha cities. The steep slope mountains have prevented the enlargement of these cities to the North direction, while the bays and estuaries characterized by flat terrain are a lifeline for urban expansion to the South direction. Although the spatial resolution of Landsat images up to 30 m has been applied to distinguish the land cover categories, the resolution is not fine enough for features recognition because many small features are not identified in comparison with Google Earth images. However, Landsat images are the single remote sensing dataset providing freely historical image series with long enough duration. The results could help the local authorities to propose appropriate solutions and policies for conserving natural resources and developing socio-economic in a more harmonized manner for this coastal area.

Author Contributions

This research was primarily designed by G.C.N. and K.V.D.; T.A.V. provided the dataset; K.V.D. and G.C.N. executed the experiments and analyzed the results; A.K.N. and K.V.D. wrote the manuscript. C.W. and T.A.V. reviewed the manuscript and provided theoretical and technical supports; K.V.D. acted as the corresponding author. All authors have read and agreed to the published version of the manuscript.

Funding

This research was funded by the Vietnam National Foundation for Science and Technology Development (NAFOSTED) under grant number 105.08-2018.302.

Institutional Review Board Statement

Not applicable.

Informed Consent Statement

Not applicable.

Data Availability Statement

Satellite images used in this research are retrieved from USGS website. This is open source, which can be accessed through the link: https://earthexplorer.usgs.gov/ (accessed on 15 August 2021).

Acknowledgments

This research is funded by the Vietnam National Foundation for Science and Technology Development (NAFOSTED) under grant number 105.08-2018.302. The authors acknowledge the United States Geological Survey for providing Landsat images through their EarthExplorer data portal.

Conflicts of Interest

The authors declare no conflict of interest.

Abbreviations

The following abbreviation are used in this paper.
BOABottom Of Atmosphere reflectance
GDPGross Domestic Product
NAFOSTEDVietnam National Foundation for Science and Technology Development
NASANational Aeronautics and Space Administration
ROIregion of interest
SITSSatellite Image Time Series
SRTMShuttle Radar Topography Mission
SVMsSupport Vector Machines
UNESCOUnited Nations Educational, Scientific and Cultural Organization
USGSUnited States Geological Survey

References

  1. UNDP. Urban Population. Available online: https://population.un.org/wup/ (accessed on 19 August 2021).
  2. Duc, T. Vietnam Has 826 Urban Centres with Contribution of 70% GDP. Vietnam Government Electronic Paper, 26 December 2020. Available online: https://baochinhphu.vn/ca-nuoc-co-862-do-thi-dong-gop-70-gdp-102284985.htm (accessed on 21 January 2022).
  3. Hoang, C.L. Challenges in the Urbanization of Vietnam. Economy and Forecast Review, 18 June 2013. Available online: https://kinhtevadubao.vn/nhung-bat-cap-trong-qua-trinh-do-thi-hoa-o-viet-nam-9757.html (accessed on 21 January 2022).
  4. Tran, D.T. The Geological History of Ha Long Bay; The World Publishing House: Hanoi, Vietnam, 1998; p. 94. [Google Scholar] [CrossRef]
  5. GSO. Completed Results of the 2019 Vietnam Population and Housing Cencus; Statistical Publishing House: Hanoi, Vietnam, 2020. [Google Scholar]
  6. Hens, L.; Nierynck, E.; Tran, V.Y.; Nguyen, H.Q.; Le, T.T.H.; Le, A.D. Land Cover Changes in the Extended Ha Long City Area, North-Eastern Vietnam During the Period 1988–1998. Environ. Dev. Sustain. 2000, 2, 235–252. [Google Scholar] [CrossRef]
  7. Mustafin, M.G.; Tran, T.S.; Tran, M.H. Comprehensive impact assessment development of the Coal field Campha in Vietnam to the coastal territory. In Proceedings of the Construction and Architecture: Theory and Practice of Innovative Development, Kislovodsk, Russia, 1–5 October 2019; pp. 1–7. [Google Scholar]
  8. Cao, T.T.T.; Do, C.T.; Le, V.N.; Pham, T.K.; Nguyen, V.B.; Dinh, H.N. Assessment of Sea Water Quality in some Limestone Island and Archipelagos Areas, Vietnam. VNU J. Sci. Earth Environ. Sci. 2020, 36, 70–78. [Google Scholar] [CrossRef] [Green Version]
  9. Dang, V.K.; Nguyen, T.D.; Dao, N.H.; Duong, T.L.; Dinh, X.V.; Weber, C. Land subsidence induced by underground coal mining at Quang Ninh, Vietnam: Persistent scatterer interferometric synthetic aperture radar observation using Sentinel-1 data. Int. J. Remote Sens. 2021, 42, 3563–3582. [Google Scholar] [CrossRef]
  10. Bhatta, B. Causes and Consequences of Urban Growth and Sprawl. In Analysis of Urban Growth and Sprawl from Remote Sensing Data; Bhatta, B., Ed.; Springer: Berlin/Heidelberg, Germany, 2010; pp. 17–36. [Google Scholar] [CrossRef]
  11. UN-HABITAT. International Guidelines on Urban and Territorial Planning; United Nations Human Settlements Programme: Nairobi, Kenya, 2015; p. 40. [Google Scholar]
  12. Yuan, F.; Sawaya, K.E.; Loeffelholz, B.C.; Bauer, M.E. Land cover classification and change analysis of the Twin Cities (Minnesota) Metropolitan Area by multitemporal Landsat remote sensing. Remote Sens. Environ. 2005, 98, 317–328. [Google Scholar] [CrossRef]
  13. Seto, K.C.; Fragkias, M.; Güneralp, B.; Reilly, M.K. A Meta-Analysis of Global Urban Land Expansion. PLoS ONE 2011, 6, e23777. [Google Scholar] [CrossRef] [PubMed]
  14. Zhao, P.; Zhang, M. The impact of urbanisation on energy consumption: A 30-year review in China. Urban Clim. 2018, 24, 940–953. [Google Scholar] [CrossRef]
  15. Tam, B.; Gough, W.; Mohsin, T. The impact of urbanization and the urban heat island effect on day to day temperature variation. Urban Clim. 2015, 12, 1–10. [Google Scholar] [CrossRef]
  16. McGrane, S.J. Impacts of urbanisation on hydrological and water quality dynamics, and urban water management: A review. Hydrol. Sci. J. 2016, 61, 2295–2311. [Google Scholar] [CrossRef]
  17. Liu, Z.; He, C.; Wu, J. The Relationship between Habitat Loss and Fragmentation during Urbanization: An Empirical Evaluation from 16 World Cities. PLoS ONE 2016, 11, e0154613. [Google Scholar] [CrossRef]
  18. Guo, J.; Xu, Y.; Pu, Z. Urbanization and Its Effects on Industrial Pollutant Emissions: An Empirical Study of a Chinese Case with the Spatial Panel Model. Sustainability 2016, 8, 812. [Google Scholar] [CrossRef] [Green Version]
  19. Nuissl, H.; Siedentop, S. Urbanisation and Land Use Change. In Sustainable Land Management in a European Context: A Co-Design Approach; Weith, T., Barkmann, T., Gaasch, N., Rogga, S., Strauß, C., Zscheischler, J., Eds.; Springer International Publishing: Cham, Switzerland, 2021; pp. 75–99. [Google Scholar] [CrossRef]
  20. Starzomski, B. Indicators of Ecosystem Change. In Encyclopedia of Quality of Life and Well-Being Research; Michalos, A.C., Ed.; Springer: Dordrecht, The Netherlands, 2014; pp. 3205–3209. [Google Scholar] [CrossRef]
  21. Phiri, D.; Simwanda, M.; Salekin, S.; Nyirenda, V.R.; Murayama, Y.; Ranagalage, M. Sentinel-2 Data for Land Cover/Use Mapping: A Review. Remote Sens. 2020, 12, 2291. [Google Scholar] [CrossRef]
  22. Ingram, K.; Knapp, E.; Robinson, J. Change Detection Technique Development for Improved Urbanized Area Delineation; Computer Sciences Corporation: Tysons Corner, VA, USA, 1981; p. 136. [Google Scholar]
  23. Gómez, C.; White, J.C.; Wulder, M.A. Optical remotely sensed time series data for land cover classification: A review. ISPRS J. Photogramm. Remote Sens. 2016, 116, 55–72. [Google Scholar] [CrossRef] [Green Version]
  24. Kantakumar, L.N.; Neelamsetti, P. Multi-temporal land use classification using hybrid approach. Egypt. J. Remote Sens. Space Sci. 2015, 18, 289–295. [Google Scholar] [CrossRef] [Green Version]
  25. Sun, J.; Ongsomwang, S. Multitemporal Land Use and Land Cover Classification from Time-Series Landsat Datasets Using Harmonic Analysis with a Minimum Spectral Distance Algorithm. ISPRS Int. J. Geo-Inf. 2020, 9, 67. [Google Scholar] [CrossRef] [Green Version]
  26. Goward, S.; Arvidson, T.; Williams, D.; Faundeen, J.; Irons, J.; Franks, S. Historical record of Landsat global coverage: Mission operations, NSLRSDA, and international cooperator stations. Photogramm. Eng. Remote Sens. 2006, 72, 1155–1169. [Google Scholar] [CrossRef]
  27. Kloiber, S.M.; Brezonik, P.L.; Bauer, M.E. Application of Landsat imagery to regional-scale assessments of lake clarity. Water Res. 2002, 36, 4330–4340. [Google Scholar] [CrossRef]
  28. Wulder, M.A.; Loveland, T.R.; Roy, D.P.; Crawford, C.J.; Masek, J.G.; Woodcock, C.E.; Allen, R.G.; Anderson, M.C.; Belward, A.S.; Cohen, W.B.; et al. Current status of Landsat program, science, and applications. Remote Sens. Environ. 2019, 225, 127–147. [Google Scholar] [CrossRef]
  29. Markham, B.L.; Arvidson, T.; Barsi, J.A.; Choate, M.; Kaita, E.; Levy, R.; Lubke, M.; Masek, J.G. Landsat Program. In Comprehensive Remote Sensing; Liang, S., Ed.; Elsevier: Oxford, UK, 2018; pp. 27–90. [Google Scholar] [CrossRef]
  30. Wulder, M.A.; Masek, J.G.; Cohen, W.B.; Loveland, T.R.; Woodcock, C.E. Opening the archive: How free data has enabled the science and monitoring promise of Landsat. Remote Sens. Environ. 2012, 122, 2–10. [Google Scholar] [CrossRef]
  31. Hemati, M.A.; Hasanlou, M.; Mahdianpari, M.; Mohammadimanesh, F. A Systematic Review of Landsat Data for Change Detection Applications: 50 Years of Monitoring the Earth. Remote Sens. 2021, 13, 2869. [Google Scholar] [CrossRef]
  32. Bruzzone, L.; Bovolo, F. A Novel Framework for the Design of Change-Detection Systems for Very-High-Resolution Remote Sensing Images. Proc. IEEE 2013, 101, 609–630. [Google Scholar] [CrossRef]
  33. Singh, A. Review Article Digital change detection techniques using remotely-sensed data. Int. J. Remote Sens. 1989, 10, 989–1003. [Google Scholar] [CrossRef] [Green Version]
  34. Radke, R.J.; Andra, S.; Al-Kofahi, O.; Roysam, B. Image change detection algorithms: A systematic survey. IEEE Trans. Image Processing 2005, 14, 294–307. [Google Scholar] [CrossRef] [PubMed]
  35. Al-doski, J.; Mansor, S.B.; Shafri, H.Z.M. Change Detection Process and Techniques. Civ. Environ. Res. 2013, 3, 37–45. [Google Scholar]
  36. Chen, G.; Hay, G.J.; Carvalho, L.M.T.; Wulder, M.A. Object-based change detection. Int. J. Remote Sens. 2012, 33, 4434–4457. [Google Scholar] [CrossRef]
  37. Hussain, M.; Chen, D.; Cheng, A.; Wei, H.; Stanley, D. Change detection from remotely sensed images: From pixel-based to object-based approaches. ISPRS J. Photogramm. Remote Sens. 2013, 80, 91–106. [Google Scholar] [CrossRef]
  38. Lu, D.; Mausel, P.; Brondízio, E.; Moran, E. Change detection techniques. Int. J. Remote Sens. 2004, 25, 2365–2401. [Google Scholar] [CrossRef]
  39. Panuju, D.R.; Paull, D.J.; Griffin, A.L. Change Detection Techniques Based on Multispectral Images for Investigating Land Cover Dynamics. Remote Sens. 2020, 12, 1781. [Google Scholar] [CrossRef]
  40. Tewkesbury, A.P.; Comber, A.J.; Tate, N.J.; Lamb, A.; Fisher, P.F. A critical synthesis of remotely sensed optical image change detection techniques. Remote Sens. Environ. 2015, 160, 1–14. [Google Scholar] [CrossRef] [Green Version]
  41. Zhu, Z. Change detection using landsat time series: A review of frequencies, preprocessing, algorithms, and applications. ISPRS J. Photogramm. Remote Sens. 2017, 130, 370–384. [Google Scholar] [CrossRef]
  42. Salah, H.S.; Goldin, S.E.; Rezgui, A.; El-Islam, B.N.; Ait-Aoudia, S. What is a remote sensing change detection technique? Towards a conceptual framework. Int. J. Remote Sens. 2020, 41, 1788–1812. [Google Scholar] [CrossRef]
  43. Salah, H.S.; Ait-Aoudia, S.; Rezgui, A.; Goldin, S.E. Change detection in urban areas from remote sensing data: A multidimensional classification scheme. Int. J. Remote Sens. 2019, 40, 6635–6679. [Google Scholar] [CrossRef]
  44. Viana, C.M.; Oliveira, S.; Oliveira, S.C.; Rocha, J. Land Use/Land Cover Change Detection and Urban Sprawl Analysis. In Spatial Modeling in GIS and R for Earth and Environmental Sciences; Pourghasemi, H.R., Gokceoglu, C., Eds.; Elsevier: New York, NY, USA, 2019; pp. 621–651. [Google Scholar] [CrossRef]
  45. Coppin, P.; Jonckheere, I.; Nackaerts, K.; Muys, B.; Lambin, E. Digital change detection methods in ecosystem monitoring: A review. Int. J. Remote Sens. 2004, 25, 1565–1596. [Google Scholar] [CrossRef]
  46. Réjichi, S.; Chaabane, F. Satellite image time series classification and analysis using an adapted graph labeling. In Proceedings of the 2015 8th International Workshop on the Analysis of Multitemporal Remote Sensing Images (Multi-Temp), Annecy, France, 22–24 July 2015; pp. 1–4. [Google Scholar]
  47. Simoes, R.; Camara, G.; Queiroz, G.; Souza, F.; Andrade, P.R.; Santos, L.; Carvalho, A.; Ferreira, K. Satellite Image Time Series Analysis for Big Earth Observation Data. Remote Sens. 2021, 13, 2428. [Google Scholar] [CrossRef]
  48. Vatsavai, R.; Graesser, J. Probabilistic Change Detection Framework for Analyzing Settlement Dynamics Using Very High-resolution Satellite Imagery. Procedia Comput. Sci. 2012, 9, 907–916. [Google Scholar] [CrossRef] [Green Version]
  49. Thonfeld, F.; Hecheltjen, A.; Menz, G. Bi-temporal Change Detection, Change Trajectories and Time Series Analysis for Forest Monitoring. Photogramm. Fernerkund. Geoinf. 2015, 2015, 129–141. [Google Scholar] [CrossRef]
  50. Lu, D.; Batistella, M.; Moran, E. Multitemporal Spectral Mixture Analysis for Amazonian Land-Cover Change Detection. Can. J. Remote Sens. 2004, 30, 87–100. [Google Scholar] [CrossRef]
  51. Khelifi, L.; Mignotte, M. Deep Learning for Change Detection in Remote Sensing Images: Comprehensive Review and Meta-Analysis. IEEE Access 2020, 8, 126385–126400. [Google Scholar] [CrossRef]
  52. Brömme, K.; Stolpe, H.; Jolk, C.; Greassidis, S.; Borgmann, A.; Zindler, B.; Mien, T. Development of Methods for Post-Mining Land Use Planning for Coal Mines in Urban Areas in Quang Ninh, Vietnam. In Proceedings of the Beijing International Symposium Land Reclamation and Ecological Restoration, LRER, Beijing, China, 16–19 October 2014. [Google Scholar] [CrossRef]
  53. Jalilov, S.-M.; Chen, Y.; Quang, N.H.; Nguyen, M.N.; Leighton, B.; Paget, M.; Lazarow, N. Estimation of Urban Land-Use Efficiency for Sustainable Development by Integrating over 30-Year Landsat Imagery with Population Data: A Case Study of Ha Long, Vietnam. Sustainability 2021, 13, 8848. [Google Scholar] [CrossRef]
  54. Hoang, T.V.; Chou, T.-Y.; Fang, Y.-M.; Chen, M.; Yeh, M.; Nguyen, X.L. Evaluation Vulnerability of Climate Change Impacts to Quang Ninh Province, Vietnam. Int. J. Adv. Remote Sens. GIS 2018, 7, 2758–2781. [Google Scholar] [CrossRef]
  55. Huynh, S. Hydrodynamic Study of Ha Long Bay; University of Western Australia: Perth, Australia, 2002. [Google Scholar]
  56. Cerrano, C.; Azzini, F.; Bavestrello, G.; Calcinai, B. Marine lakes of Karst islands in Ha Long Bay (Vietnam). Chem. Ecol. 2006, 22, 489–500. [Google Scholar] [CrossRef]
  57. Phuong, T. Quang Ninh tourism: Efforts to Revive after a Long Hibernation due to Covid 19. Trade Mark and Public Opinion, 29 October 2021. Available online: https://thuonghieucongluan.com.vn/du-lich-quang-ninh-no-luc-hoi-sinh-sau-ky-ngu-dong-dai-vi-covid-19-a159763.html (accessed on 21 January 2022).
  58. Pham, T. Quang Ninh—Coal Mining Sector: Closely Sticking The Information Gate of Quang Ninh Province, 1 January 2021. Available online: https://www.quangninh.gov.vn/chuyen-de/dichcorona/Trang/ChiTietTinTuc.aspx?nid=95826 (accessed on 21 January 2022).
  59. EROS. Digital Elevation—Shuttle Radar Topography Mission (SRTM) Void Filled; USGS: Denver, CO, USA, 2018. [Google Scholar] [CrossRef]
  60. Cira, D.; Dastur, A.; Jewell, H.; Kilroy, A.; Lozano, N.; Phan, T.P.H.; Wang, H.G. Vietnam Urbanization Review: Technical Assistance Report; World Bank: Washington, DC, USA, 2011; p. 263. [Google Scholar]
  61. NIURP. City development strategies for medium size cities in Vietnam: Can Tho and Ha Long. In Technical Report; National Institute of Urban and Rural Planning: Hanoi, Vietnam, 2012; p. 205. [Google Scholar]
  62. Ta, D.H. Using Landsat Dataset for Assessing Urban Development of Ha Long City (Quang Ninh Province) during the Period 1990–2020; Hanoi National University of Education: Hanoi, Vietnam, 2020. [Google Scholar]
  63. Malarvizhi, K.; Kumar, S.; Porchelvan, P. Use of High Resolution Google Earth Satellite Imagery in Landuse Map Preparation for Urban Related Applications. Procedia Technol. 2016, 24, 1835–1842. [Google Scholar] [CrossRef]
  64. Lesiv, M.; See, L.; Bayas, J.C.L.; Sturn, T.; Schepaschenko, D.; Karner, M.; Moorthy, I.; McCallum, I.; Fritz, S. Characterizing the Spatial and Temporal Availability of Very High Resolution Satellite Imagery in Google Earth and Microsoft Bing Maps as a Source of Reference Data. Land 2018, 7, 118. [Google Scholar] [CrossRef] [Green Version]
  65. Farr, T.; Rosen, P.; Caro, E.; Crippen, R.; Duren, R.; Hensley, S.; Kobrick, M.; Paller, M.; Rodriguez, E.; Roth, L.; et al. The Shuttle Radar Topography Mission. Rev. Geophys. 2007, 45, RG2004. [Google Scholar] [CrossRef] [Green Version]
  66. Mishra, S.; Shrivastava, P.; Dhurvey, P. Change Detection Techniques in Remote Sensing: A Review. Int. J. Wirel. Mob. Commun. Ind. Syst. 2017, 4, 1–8. [Google Scholar] [CrossRef]
  67. Dueker, K.J.; Horton, F.E. Urban-change detection systems: Remote-sensing inputs. Photogrammetria 1972, 28, 89–106. [Google Scholar] [CrossRef]
  68. Lu, D.; Weng, Q. A survey of image classification methods and techniques for improving classification performance. Int. J. Remote Sens. 2007, 28, 823–870. [Google Scholar] [CrossRef]
  69. Franklin, J.; Phinn, S.; Woodcock, C.; Rogan, J. Rationale and conceptual framework for classification approaches to assess forest resources and properties. In Methods and Applications for Remote Sensing of Forests: Concepts and Case Studies; Wulder, M., Franklin, S., Eds.; Kluwer Academic Publishers: Boston, MA, USA, 2003; pp. 279–300. [Google Scholar]
  70. Sayler, K. Landsat 4-7-8 Collection 2 (C2) Level 2 Science Product (L2SP) Guide; US Geological Survey: Rapid City, SD, USA, 2020; p. 43. [Google Scholar]
  71. Civco, D.L. Artificial neural networks for land-cover classification and mapping. Int. J. Geogr. Inf. Syst. 1993, 7, 173–186. [Google Scholar] [CrossRef]
  72. Han, R. Land Use and Land Cover Mapping Using Fuzzy Logic. In Ecosystem Assessment and Fuzzy Systems Management; Cao, B.-Y., Ma, S.-Q., Cao, H.-H., Eds.; Springer International Publishing: New York, NY, USA, 2014. [Google Scholar]
  73. Zhou, W.; Huang, G.; Troy, A.; Cadenasso, M.L. Object-based land cover classification of shaded areas in high spatial resolution imagery of urban areas: A comparison study. Remote Sens. Environ. 2009, 113, 1769–1777. [Google Scholar] [CrossRef]
  74. Erbek, F.S.; Özkan, C.; Taberner, M. Comparison of maximum likelihood classification method with supervised artificial neural network algorithms for land use activities. Int. J. Remote Sens. 2004, 25, 1733–1748. [Google Scholar] [CrossRef]
  75. Cortes, C.; Vapnik, V. Support-vector networks. Marchine Learn. 1995, 20, 273–297. [Google Scholar] [CrossRef]
  76. Vapnik, V. The Nature of Statistical Learning Theory; Springer: New York, NY, USA, 1995; p. 314. [Google Scholar]
  77. Hermes, L.; Frieauff, D.; Puzicha, J.; Buhmann, J. Support vector machines for land usage classification in Landsat TM imagery. In Proceedings of the IEEE 1999 International Geoscience and Remote Sensing Symposium. IGARSS’99 (Cat. No.99CH36293), Hamburg, Germany, 28 June–2 July 1999; pp. 348–350. [Google Scholar]
  78. Huang, C.; Davis, L.S.; Townshend, J.R.G. An assessment of support vector machines for land cover classification. Int. J. Remote Sens. 2002, 23, 725–749. [Google Scholar] [CrossRef]
  79. Taati, A.; Sarmadian, F.; Mousavi, A.; Pour, C.T.H.; Shahir, A.H.E. Land Use Classification using Support Vector Machine and Maximum Likelihood Algorithms by Landsat 5 TM Images. Walailak J. Sci. Technol. 2014, 12, 681–687. [Google Scholar]
  80. Colas, F.; Brazdil, P. Comparison of SVM and Some Older Classification Algorithms in Text Classification Tasks; Springer: Boston, MA, USA, 2006; pp. 169–178. [Google Scholar]
  81. Medina, J.A.V.; Atehortúa, B.E.A. Comparison of maximum likelihood, support vector machines, and random forest techniques in satellite images classification. Tecnura 2019, 23, 13–26. [Google Scholar] [CrossRef]
  82. Mountrakis, G.; Im, J.; Ogole, C. Support vector machines in remote sensing: A review. ISPRS J. Photogramm. Remote Sens. 2011, 66, 247–259. [Google Scholar] [CrossRef]
  83. Shao, Y.; Lunetta, R.S. Comparison of support vector machine, neural network, and CART algorithms for the land-cover classification using limited training data points. ISPRS J. Photogramm. Remote Sens. 2012, 70, 78–87. [Google Scholar] [CrossRef]
  84. Paneque-Gálvez, J.; Mas, J.; Moré, G.; Rosselló, J.C.; Orta-Martinez, M.; Luz, A.; Gueze, M.; Macía, M.; Reyes-García, V. Enhanced land use/cover classification of heterogeneous tropical landscapes using support vector machines and textural homogeneity. Int. J. Appl. Earth Obs. Geoinf. 2013, 23, 372–383. [Google Scholar] [CrossRef]
  85. Nemmour, H.; Chibani, Y. Multiple support vector machines for land cover change detection: An application for mapping urban extensions. ISPRS J. Photogramm. Remote Sens. 2006, 61, 125–133. [Google Scholar] [CrossRef]
  86. Yongzhu, X.; Zhengdong, Z.; Feng, C. Comparison of artificial neural network and support vector machine methods for urban land use/cover classifications from remote sensing images A Case Study of Guangzhou, South China. In Proceedings of the 2010 International Conference on Computer Application and System Modeling (ICCASM 2010), Taiyuan, China, 22–24 October 2010; pp. 52–56. [Google Scholar]
  87. Andrimont, R.; Verhegghen, A.; Meroni, M.; Lemoine, G.; Strobl, P.; Eiselt, B.; Yordanov, M.; Martinez-Sanchez, L.; Velde, M. LUCAS Copernicus 2018: Earth Observation relevant in-situ data on land cover throughout the European Union. Earth Syst. Sci. Data 2020, 13, 1119–1133. [Google Scholar] [CrossRef]
  88. Labib, S.M.; Harris, A. The potentials of Sentinel-2 and LandSat-8 data in green infrastructure extraction, using object based image analysis (OBIA) method. Eur. J. Remote Sens. 2018, 51, 231–240. [Google Scholar] [CrossRef]
  89. Dorais, A.; Cardille, J. Strategies for Incorporating High-Resolution Google Earth Databases to Guide and Validate Classifications: Understanding Deforestation in Borneo. Remote Sens. 2011, 3, 1157–1176. [Google Scholar] [CrossRef] [Green Version]
  90. Tiwari, K.N.; Chatterjee, C. Remote Sensing and GIS Application. Available online: http://ecoursesonline.iasri.res.in/course/view.php?id=53 (accessed on 15 January 2022).
  91. Congalton, R.G.; Green, K. Assessing the Accuracy of Remotely Sensed Data: Principles and Practices; CRC Press: Boca Raton, FL, USA, 1999. [Google Scholar]
  92. Cohen, J. A Coefficient of Agreement for Nominal Scales; New York Univesity: New York, NY, USA, 1960. [Google Scholar]
  93. Lv, Z.; Zhang, X.; Benediktsson, J.A. Developing a general post-classification framework for land-cover mapping improvement using high-spatial-resolution remote sensing imagery. Remote Sens. Lett. 2017, 8, 607–616. [Google Scholar] [CrossRef]
  94. Su, T.-C. A filter-based post-processing technique for improving homogeneity of pixel-wise classification data. Eur. J. Remote Sens. 2016, 49, 531–552. [Google Scholar] [CrossRef] [Green Version]
  95. Tu, Z.; van der Aa, N.; Gemeren, C.v.; Veltkamp, R. A combined post-filtering method to improve accuracy of variational optical flow estimation. Pattern Recognit. 2014, 47, 1926–1940. [Google Scholar] [CrossRef]
  96. NSCEL. Construction Planning of Quang Ninh Province to 2030, Vision to 2050 and beyond 2050; Quang Ninh People Committee: Ha Long, Vietnam, 2014; p. 374. [Google Scholar]
  97. VIUP. General Planning of Ha Long City to 2040, Vision to 2050; Vietnam Institute for Urban and Rural Planning: Hanoi, Vietnam, 2021; p. 159. [Google Scholar]
  98. Pham, T. Cam Pha City: Green Economic Development. Quang Ninh Online, 23 October 2020. Available online: https://baoquangninh.com.vn/tp-cam-pha-phat-trien-kinh-te-xanh-2506178.html (accessed on 17 January 2022).
  99. VNA. Halong Property Market Sees Rising Demand for Mid-End Apartments. Vietnam Investment Review, 3 October 2018. Available online: https://vir.com.vn/halong-property-market-sees-rising-demand-for-mid-end-apartments-62841.html (accessed on 21 January 2022).
  100. Lofrano, G.; Carotenuto, M.; Maffettone, R.; Todaro, P.; Sammataro, S.; Kalavrouziotis, I.K. Water Collection and Distribution Systems in the Palermo Plain during the Middle Ages. Water 2013, 5, 1662–1676. [Google Scholar] [CrossRef]
  101. Yang, Z.S.; He, Y.M.; Xu, M.J. Analysis on the principle of terrain slope impact on land suitability for urban construction in mountainous areas. In Proceedings of the 2015 International Conference on Sustainable Development (ICSD 2015), New York, NY, USA, 23–24 September 2015; pp. 278–286. [Google Scholar]
  102. Rivkin, L.R.; Santangelo, J.S.; Alberti, M.; Aronson, M.F.J.; Keyzer, C.W.D.; Diamond, S.E.; Fortin, M.J.; Frazee, L.J.; Gorton, A.J.; Hendry, A.P.; et al. A roadmap for urban evolutionary ecology. Evol. Appl. 2019, 12, 384–398. [Google Scholar] [CrossRef] [PubMed] [Green Version]
  103. Nguyen, T.D. Decision approving the adjustment of the general construction planning of Ha Long city, Quang Ninh province to 2020. In 251/2003/QĐ-CP; 20 November 2003 Edition; Government Office: Hanoi, Vietnam, 2003; Volume 1, pp. 1–6. [Google Scholar]
  104. Ha, V.H. Decision approving the adjustment of the general construction planning of Cam Pha bourg, Quang Ninh province to 2020. In 1100/QĐ-UBND; 26 April 2000 Edition; Provincial People’s Committees: Ha Long, Vietnam, 2000; Volume 1, pp. 1–19. [Google Scholar]
  105. Pham, H. Quang Ninh Province: Close the Opencast Coal Mine of Nui Beo Company. Resources and Environment, 19 February 2021. Available online: https://baotainguyenmoitruong.vn/quang-ninh-dong-cua-mo-than-lo-thien-cua-cong-ty-cp-than-nui-beo-334022.html (accessed on 21 January 2022).
  106. Nguyen, C.L. Geological and Mineral Resources Map of Vietnam; Geological and Mineral Resources Administration: Hanoi, Vietnam, 2005. [Google Scholar]
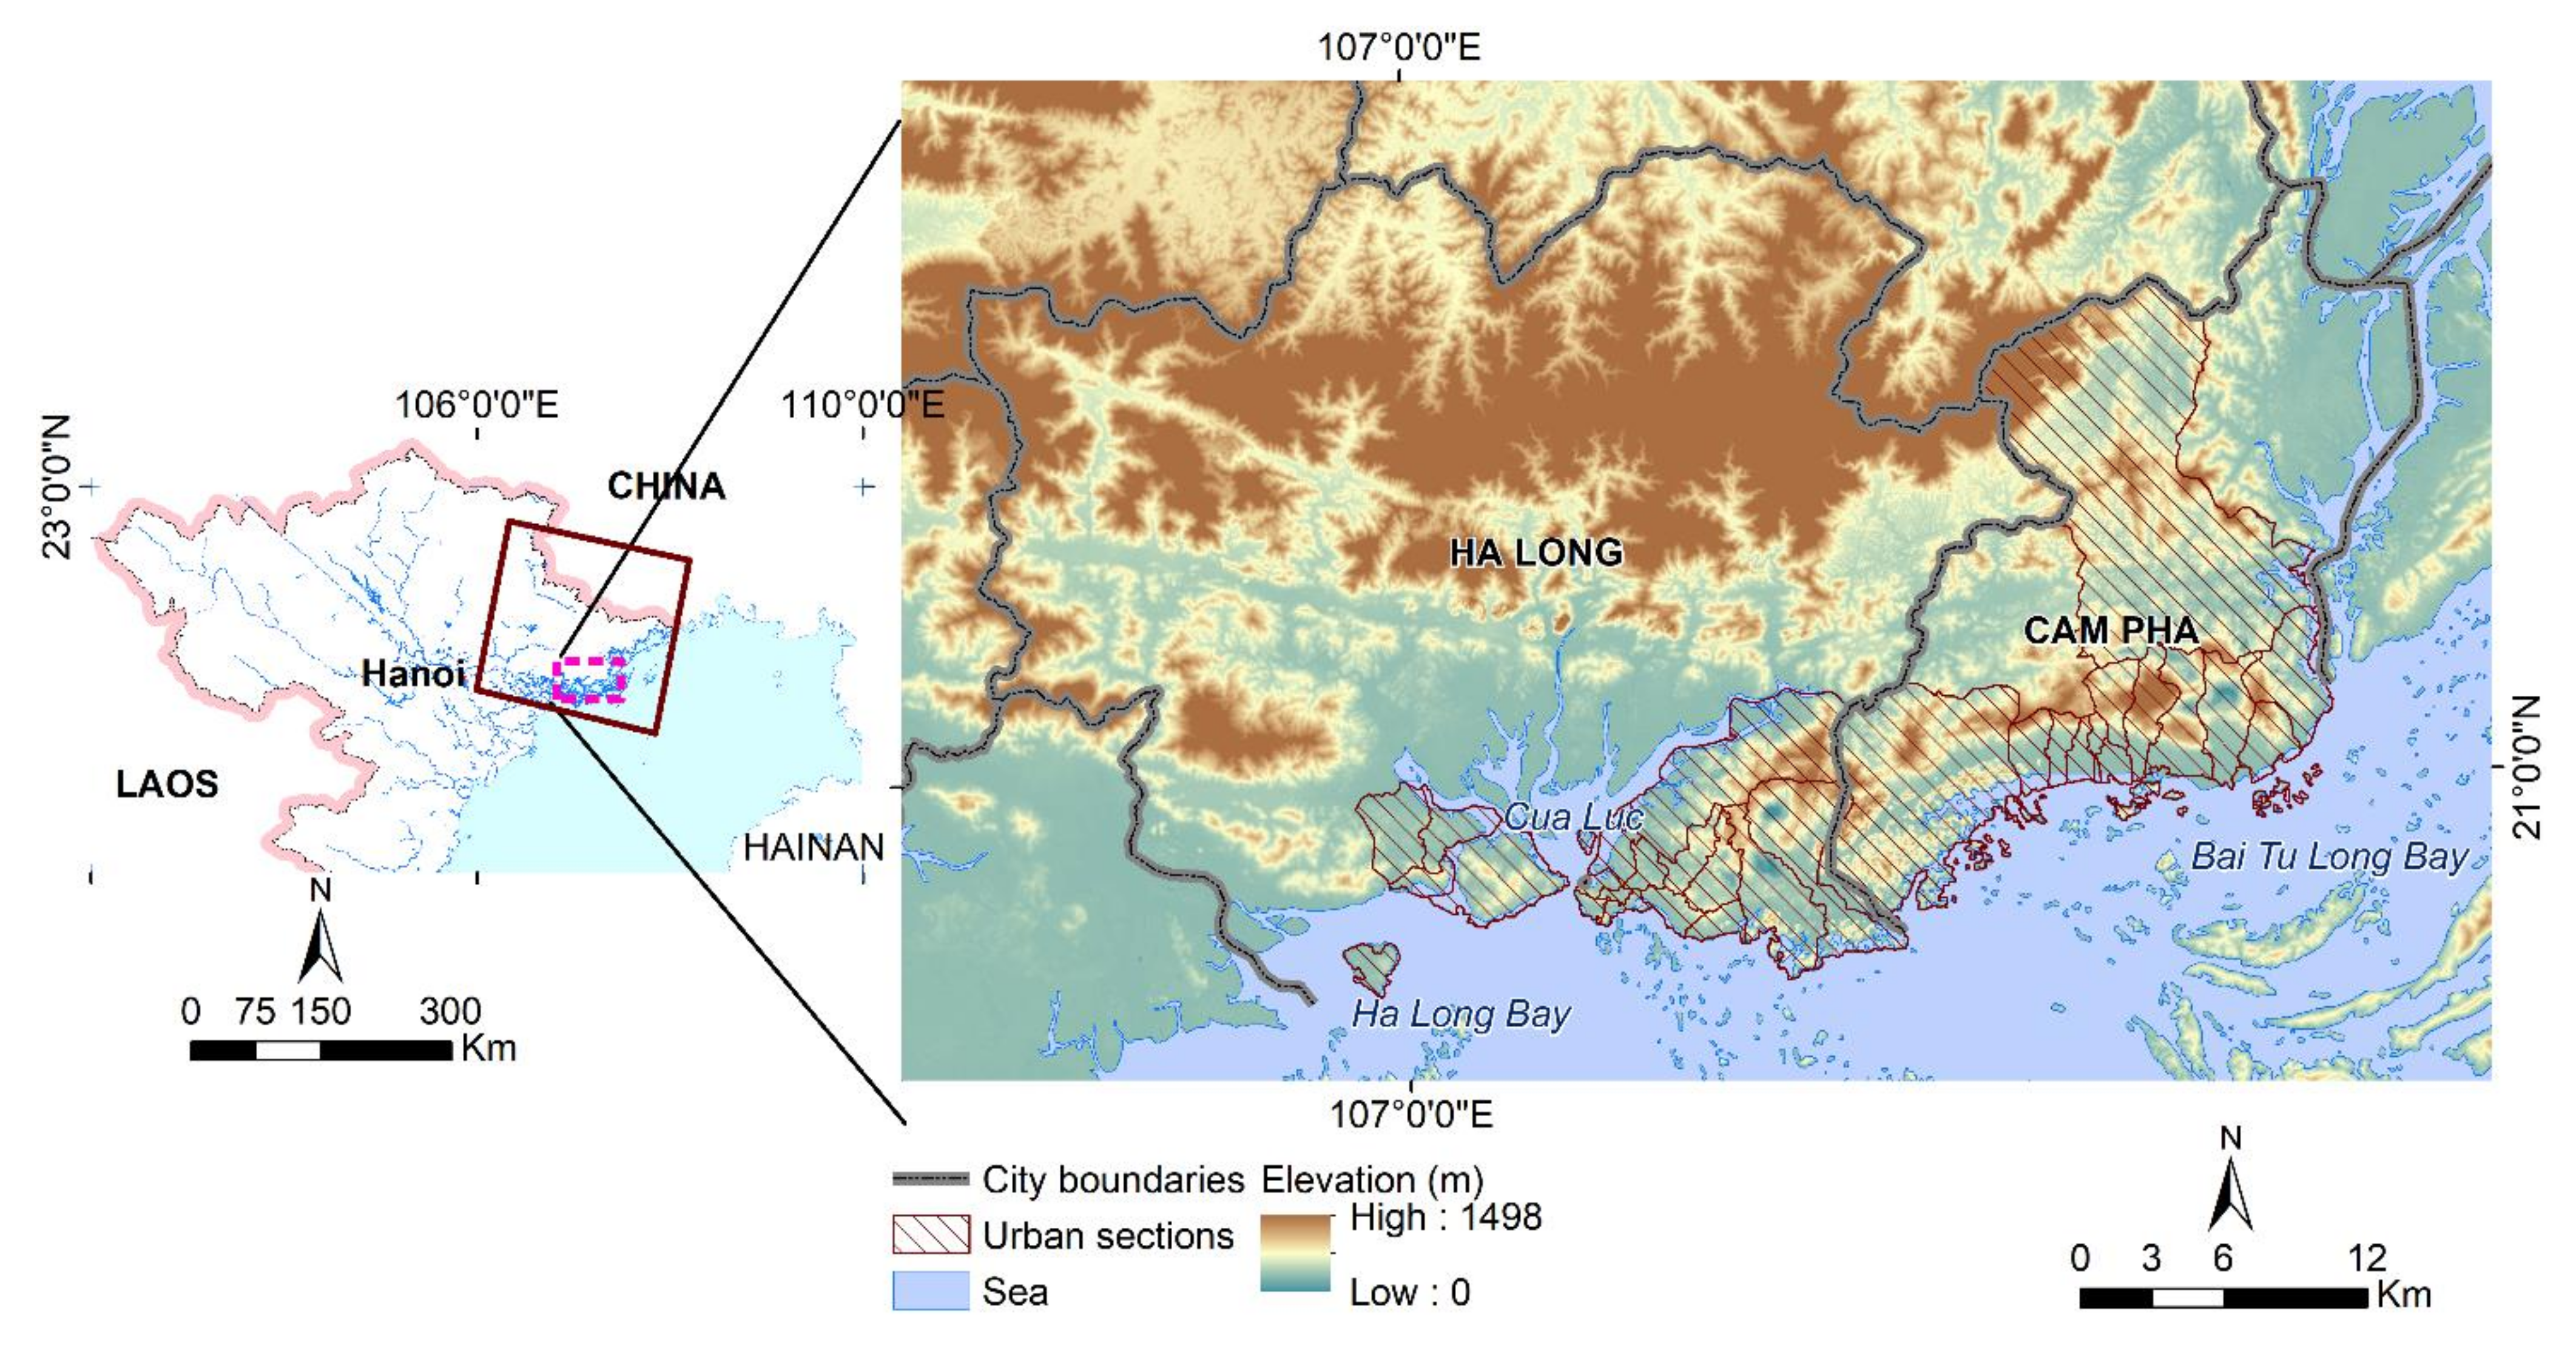
Figure 1. Map of Northern Vietnam with the delimitation of the Landsat images (brown rectangle). The pink dashed line corresponds to the territory of Ha Long—Cam Pha cities in which the Digital Elevation Model of SRTM is on the background [59].
Remotesensing 14 01241 g001
Figure 2. Administrative mutation of Ha Long, Cam Pha cities over the last three decades.
Remotesensing 14 01241 g002
Figure 4. Colors composite (b4-b5-b7) of: (a) Landsat 5 on 28 October 1991; (b) Landsat 7 on 29 September 2001; (c) (b5-b6-b7) of Landsat 8 on 23 September 2019.
Remotesensing 14 01241 g004
Figure 5. Some features observed during the field campaign on 12 November 2019: (a) rock dump at Deo Nai coal mine (Cam Pha city), (b) inland waterway port for construction material at Cua Luc estuary (Ha Long city), (c) mangrove at Cua Luc estuary (Ha Long city). For the location of photos, it refers to Figure 14c.
Remotesensing 14 01241 g005
Figure 6. The processing procedure applied in this study.
Remotesensing 14 01241 g006
Figure 7. Illustration of land cover categories from color composite (b4-b5-b7) of Landsat image (28 October 1991): (a) forest; (b) rice field; (c) coal field; (d) residence; (e) sea water; (f) logging land; (g) mangrove; (h) rock dump.
Remotesensing 14 01241 g007
Figure 8. Spectral profiles for main land cover issued from Landsat 5 image captured on 28 October 1991.
Remotesensing 14 01241 g008
Figure 9. Elements of visual interpretation. Source: [90].
Remotesensing 14 01241 g009
Figure 10. Land cover classes on Google Earth image (8 November 2019): (a) coalfield, (b) forest, (c) logging land, (d) urban residence, (e) mangrove, (f) rice field, (g) water, (h) rock dump.
Remotesensing 14 01241 g010
Figure 11. Comparison of land cover classes extracted from Landsat 8 and images of Google Earth. For the location of frames, refer to Figure 14c.
Remotesensing 14 01241 g011
Figure 12. Land cover at Cua Luc: (a) after SVMs classification, (b) after filtering.
Remotesensing 14 01241 g012
Figure 13. SVMs classification: (a) original land cover map (b) after combining.
Remotesensing 14 01241 g013
Figure 14. Land cover maps issued from Landsat images (a) 28 October 1991, (b) 29 September 2001; (c) 23 September 2019.
Remotesensing 14 01241 g014
Figure 15. Man-made features change at Ha Long, Cam Pha cities in periods I and II (ha).
Remotesensing 14 01241 g015
Figure 16. Change of land covers in the first period: (a) natural features, (b) man-made features, (c) mangrove, (d) waterbodies.
Remotesensing 14 01241 g016
Figure 17. Change of land covers in the second period: (a) natural features, (b) man-made features, (c) mangrove, (d) waterbodies.
Remotesensing 14 01241 g017
Table 1. Landsat image parameters.
SatelliteLandsat 5Landsat 7Landsat 8
SensorTMETM+OLI
Processing level2A2A2A
Date28 October 199129 September 200123 September 2019
Cloud cover0%1%0%
WRS-2 (Path, Row)126; 45126; 45126; 45
Grayscale level16 bits16 bits16 bits
Table 2. Land cover classification categories were modified from Andrimont et al. [87].
Level 1Level 2
WoodlandEvergreen forest, mangrove, etc.
Artificial landRock dump, coalfield, residence, etc.
CroplandRice field, vegetables, etc.
Bare landLogging land, outcrop, sand, etc.
Water bodiesSea, reservoir, lake, river, coal pit, etc.
Table 3. Landsat classification accuracy for 1991, 2001, and 2019.
Land Covers199120012019
Producer’sUser’sProducer’sUser’sProducer’sUser’s
Forestn/an/a100.096.099.672.3
Mangroven/an/a99.699.6100.099.1
Rock dumpn/an/a98.496.289.399.2
Coal fieldn/an/a99.599.499.5883.8
Residencen/an/a92.199.3100.076.3
Watern/an/a100.099.899.43100.0
Logging landn/an/a79.383.279.9100.0
Rice fieldn/an/a86.495.998.399.7
Table 4. Statistics of land cover and their changes in two periods deduced from the transfer matrix.
Land Cover Categories199120012019I (1991–2001)II (2001–2019)
Area (ha)Area (ha)Area (ha)Area (ha)(%)Area (ha)(%)
Natural features65,714.3164,230.9153,067.94−1483.4−1.25−11,162.97−9.39
Man-made features7473.969952.0625,693.65+2478.1+2.08+15,741.59+13.24
Mangrove3404.432661.831075.7−742.6−0.62−1586.13−1.33
Water42293.742,041.5539,048.93−252.15−0.21−2992.62−2.52
Table 5. Situation of land covers at Ha Long—Cam Pha cities in two periods deduced from the transfer matrix.
Land CoversI (1991–2001)II (2001–2019)
(−) ha(0) ha(+) ha(−) ha(0) ha(+) ha
Natural features3726.2661,988.052242.8512,908.8951,322.021747.93
Man-made features2138.315335.654616.411445.218506.8617,186.79
Mangrove1598.561805.82855.911886.92774.81300.96
Water2061.8940,231.811809.744658.6837,382.861666.07
(−) Disappearance, (0) No change, (+) Emergence.
Table 6. Distribution of economic structures of two cities [96,97,98].
Industry (%)Agriculture (%)Services (%)
201120202011202020112020
Ha Long city46.444.01.481.252.1254.8
Cam Pha city75.5473.72.00.722.4625.6
Publisher’s Note: MDPI stays neutral with regard to jurisdictional claims in published maps and institutional affiliations.