Article

Transient Scattering Echo Simulation and ISAR Imaging for a Composite Target-Ocean Scene Based on the TDSBR Method

1
The School of Physics and Optoelectronic Engineering, Xidian University, Xi’an 710071, China
2
The School of Electronic Engineering, Xidian University, Xi’an 710071, China
*
Author to whom correspondence should be addressed.
Remote Sens. 2022, 14(5), 1183; https://doi.org/10.3390/rs14051183
Submission received: 5 January 2022 / Revised: 23 February 2022 / Accepted: 25 February 2022 / Published: 27 February 2022

Abstract

:
We propose an inverse synthetic aperture radar (ISAR) imaging algorithm for a composite target-ocean scene based on time-domain shooting and bouncing rays (TDSBR) method. To do this, we develop the TDSBR method to simulate the electromagnetic scattering echoes from a composite target-ocean scene. Then, we derive the ISAR imaging formulas based on electromagnetic scattering field expressions. The demodulation, pulse compression, and azimuth inverse fast Fourier transform are performed on the scattering echo data to obtain ISAR images. Linear frequency modulation (LFM) pulses are usually used in traditional radar imaging. However, its long pulse width leads to more computation time for simulations. To increase efficiency, we replace LFM pulses with modulating Gaussian pulses. As a result, we modify the matched filter to achieve pulse compression under modulating Gaussian pulse excitations. Simulation results confirm that this proposed method improves efficiency while ensuring image quality. This proposed technique fully incorporates the electromagnetic scattering mechanism and is accurate. It effectively combines the electromagnetic scattering algorithm and the radar imaging algorithm. Finally, we present ISAR images simulated by this method. These results confirm the feasibility and efficiency of this technique.

1. Introduction

As active microwave imaging radar systems, synthetic aperture radar (SAR) and inverse synthetic aperture radar (ISAR) have been widely used in military and civil applications because they can be used continuously [1,2]. At the present, researchers pay more attention to the imaging algorithms, and few research works exist on the acquisition of the radar echo. It is undeniable, however, that the accurate and efficient acquisition of the radar echo data plays an essential role in designing radar imaging systems and the analytics of imaging algorithms. The echo data is needed for the system design to determine several parameters and evaluate its performance. During development, echo data is also required to verify the performance of each part of the system. Many researchers have studied imaging algorithms based on measured data [3,4,5,6,7,8,9,10]. Although the measured data is accurate, this approach is often very costly. For instance, the imaging of large targets requires a large anechoic chamber and a sizeable measured target model, which are both expensive to build and take a long time to construct. For the space-borne SARs, it is impossible to collect actual data before the system is developed successfully. Benefiting from the rapid development of computer technology, computational electromagnetic simulations are often used instead of experimental measurements to obtain the scattering characteristics of the targets. The electromagnetic simulation incorporates the scattering mechanism between the electromagnetic wave and the target. Such accurate simulation solutions address the issues attributed to the experimental measurement.
The research on microwave imaging based on computational electromagnetics has been developed over a long period of time. In terms of target imaging, R. Bhalla and H. Ling [11] presented an ISAR imaging technique using bistatic scattering field data based on the physical optics (PO) method. They also used a shooting and bouncing rays (SBR) method to calculate multiple scattering data. They showed that in cases where multiple scattering is the dominant scattering mechanism, ghost artifacts might appear in both the monostatic and bistatic images. In 2010, Miao Sui [12] developed a near-field electromagnetic scattering method to predict the high-frequency wideband EM scattering from the targets in the near-field region. They then proposed an approach for a two-dimensional high-resolution ISAR image sequence generation and synthesis. For composite scattering imaging, Chen [13] proposed an efficient hybrid algorithm to simulate the scattering from a ship-like target on the sea surface. The scattering model is well suited to deal with the SAR imagery simulation of a large ship on the sea surface. Ye Zhao [14] developed a bistatic SAR imaging method for metallic targets in the ocean. The image intensity distribution for the ocean surface is analyzed, and the facet scattering model is used to give the individual returns from separate facets. In 2017, Feng Xu [15] presented a simplified small perturbation method (SPM) to evaluate the scattering of finite-length conducting rough surfaces. The simplified SPM greatly facilitated the derivation of the analytical expression of the SAR image. Currently, the radar echo is often obtained using the frequency-domain electromagnetic scattering method. High range resolution is then achieved by employing frequency sweep. However, the actual electromagnetic waves emitted by radar are mostly pulse signals with a definite frequency bandwidth and a higher carrier frequency. Compared with frequency-domain (FD) electromagnetic scattering methods, TD methods can avoid the time-consuming frequency-scanning process. The total wideband scattering results can be obtained by a single Fourier transform of TD scattering echoes, which can significantly improve the computational efficiency; thus, TD electromagnetic scattering methods are more suitable for simulating radar echoes.
There is extensive research on the TD electromagnetic scattering methods. There are many classical TD numerical methods, such as the finite-difference time-domain (FDTD) [16,17] and the TD integral equation [18,19]. These methods can be used to obtain the accurate scattering echo of the target. However, with the increase of the electrical size of a target, the computational resources and simulation time required by these numerical methods are sharply increased. Hence, they are not suitable for the scattering calculation of larger targets. In order to obtain the TD scattering echoes of large targets, researchers developed a series of TD high-frequency scattering methods based on FD high-frequency scattering methods. Among them, the TDSBR method effectively combines the advantages of TD geometrical optics (TDGO) and TD physical optics (TDPO) [20,21], and fully considers the existing reflection fields on the target. This method is widely used in the electromagnetic scattering of electrically large and complex targets. In 1993, Ling and Bhalla [22] proposed a TDSBR method based on the classical FDSBR algorithm. In [22], they then derived a closed-form TD ray tube integral expression to calculate the TD response of complex targets quickly. In 2015, Zhou [23] presented a TDSBR method based on the beam-tracing (BT) technique to analyze the transient scattering responses from large PEC objects illuminated by a pulsed plane wave. In 2019, Guo [24] extended the application scope of the TDSBR method from far-field scattering to near-field scattering and proposed a near-field TDSBR method for large and complex targets. In radar imaging, Guo [25,26] proposed ISAR imaging technology based on the TDPO and TDSBR methods, respectively. However, the previously mentioned TD methods focus on a single target. There are few studies on transient scattering echo simulations of composite scenes. In particular, to the best of our knowledge, there is no research on the radar imaging of composite scenes by using TD simulated scattering echoes.
Because of the high cost of experimental measurements and the difficulty in obtaining non-cooperative target image data, we propose an ISAR imaging method for a composite target-ocean scene by using simulated scattering echoes. As the electromagnetic wave emitted by radar is a TD pulse signal with a frequency bandwidth, we use the TD electromagnetic scattering method to simulate the scattering echo. The difficulty of a composite scene scattering echo simulation is that the coupling scattering between the target and the sea surface is very complex. In this paper, based on a ray-tracing model, we propose a TDSBR method for calculating the transient scattering echo from a composite target-ocean scene. In the TDSBR method, the coupling scattering field comes from the radiation field of the equivalent electromagnetic current generated by the electromagnetic wave repeatedly bouncing between the target and the sea surface. The scattering field expressions of the conducting target and the dielectric sea surface are derived. Then, we derive the ISAR imaging formulas based on the electromagnetic scattering echo expressions used in TDSBR. In addition, to improve the simulation efficiency, we replace the LFM pulse with a modulating Gaussian pulse. We then modify the matched filter to achieve pulse compression under a modulating Gaussian pulse excitation.

2. Description of TDSBR Method

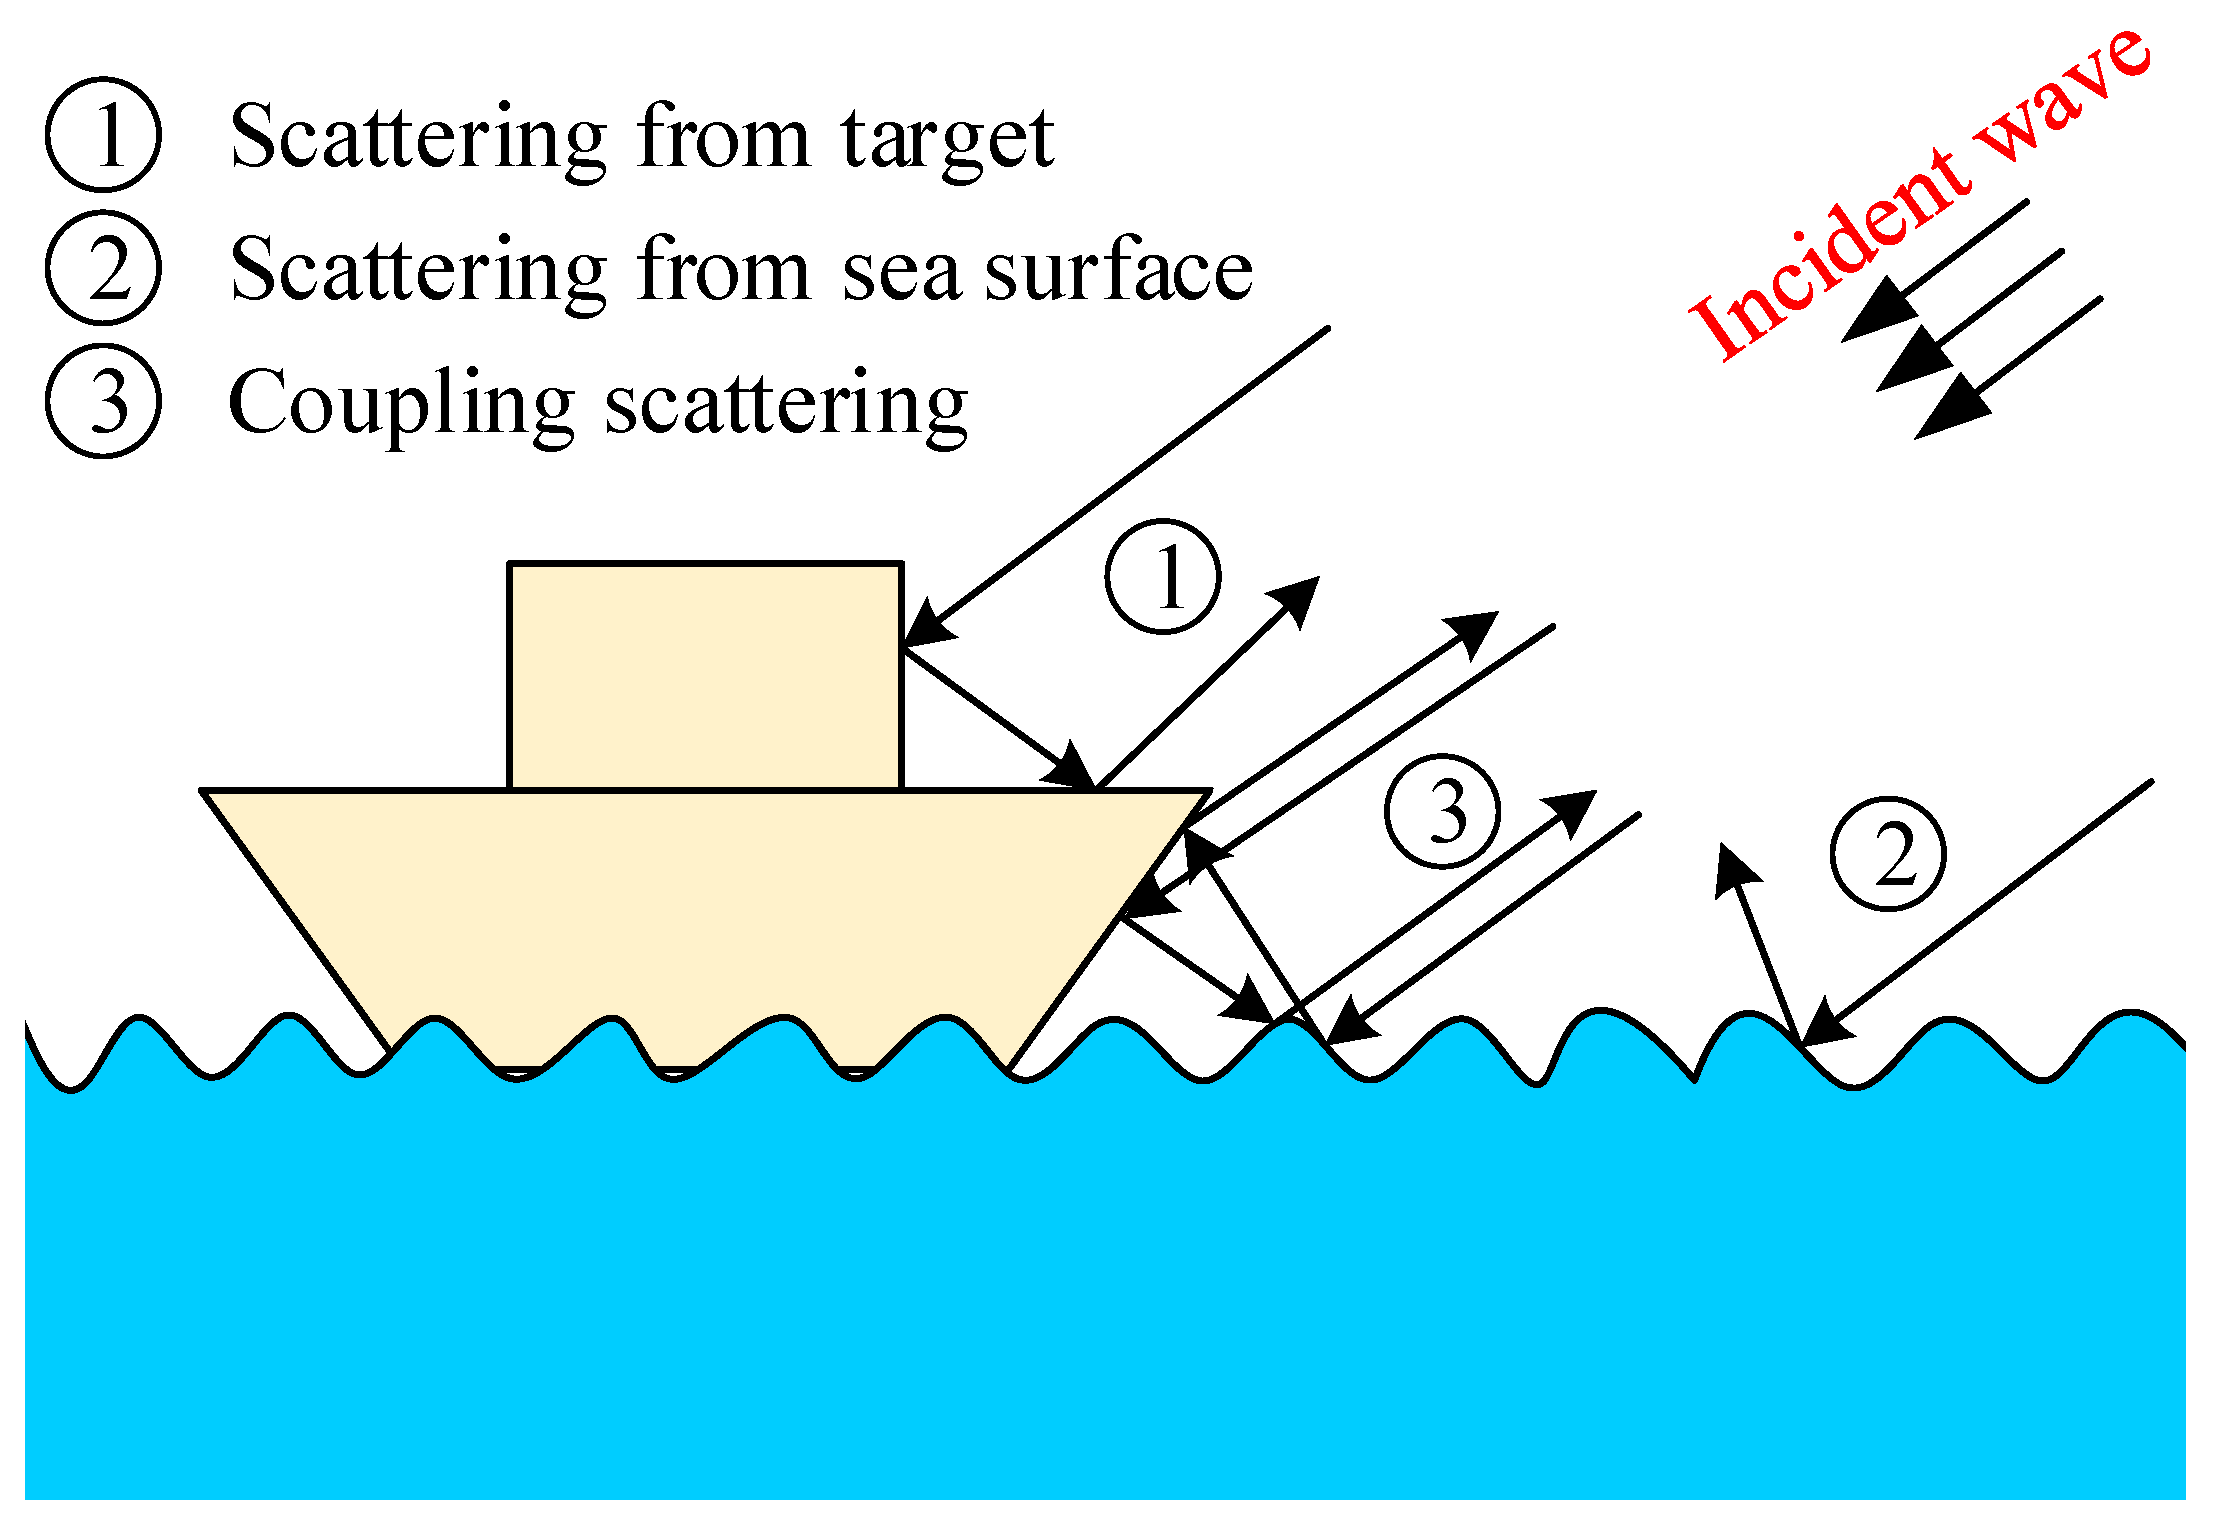
In Figure 1, we consider the composite target-ocean scene illuminated by an incident plane wave. The scattering echo consists of three parts: target scattering, sea surface scattering, and coupled scattering. The scattering echoes from these three parts can be easily obtained using the TDSBR method. The TDSBR method consists of both TDGO and TDPO. The main goal of the TDSBR method is to imitate the propagation behavior of electromagnetic waves by using rays. As shown in Figure 1, the initial rays hit the surface of the target and the sea, respectively. When a ray intersects with the surface of an object, it reflects. The reflected rays continue to travel forward, intersecting objects until no more reflections occur. The TDGO method is used to calculate the intensity and phase value of the reflected rays. The object’s surface that intersects with the rays is thought to be illuminated by electromagnetic waves. The scattering field of the illuminated surface is calculated using the TDPO method.
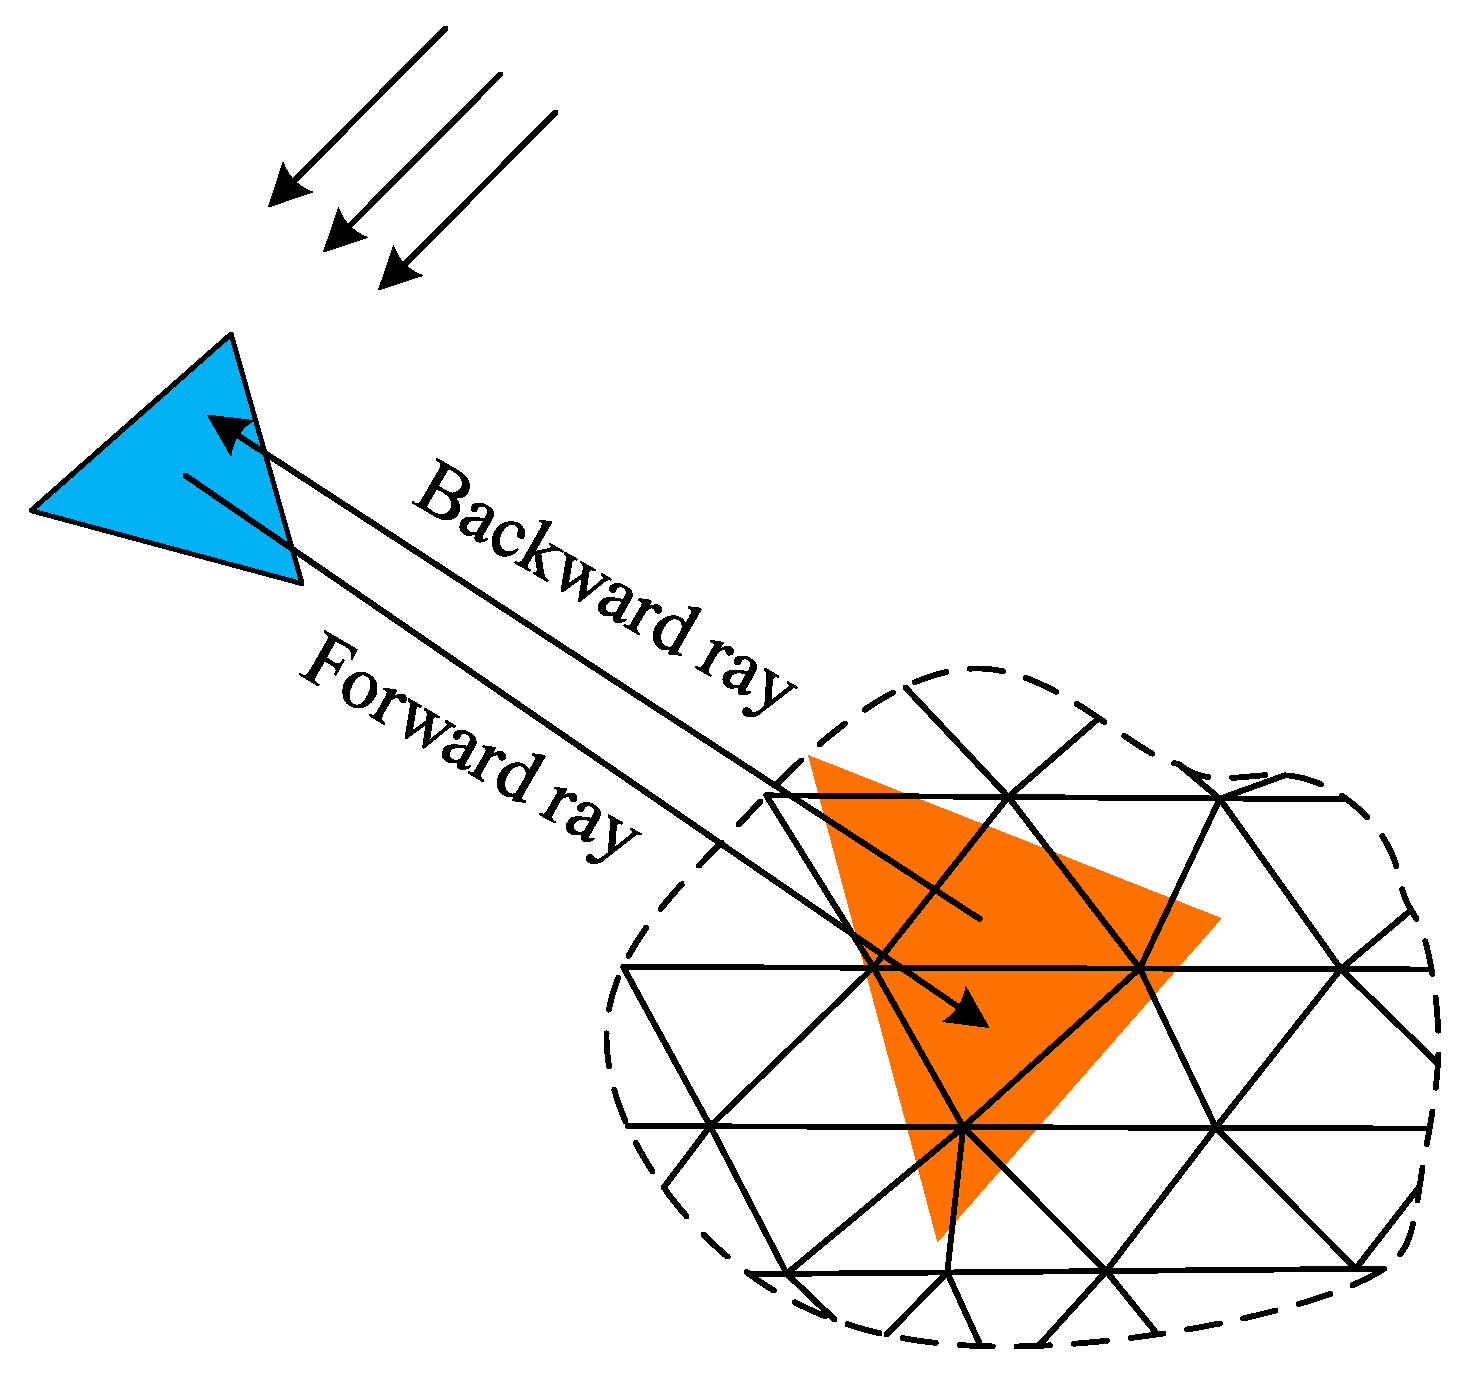
Several efficient ray-tracing techniques have been developed to find the illuminated surface of an object. In this paper, the surface of the target and sea is subdivided into triangular patches. As shown in Figure 2, we introduce the forward and backward ray tracing technology, as was previously done in [27], into the TDSBR. Forward ray tracing is used to obtain the illuminated triangle; then, backward ray tracing is used to judge whether the triangle adjacent to the illuminated triangle is illuminated.
Next, we calculate the scattering fields of the illuminated triangles. Before calculating the scattering fields, the TDGO method is used to obtain the incident fields of the triangles. The electric and magnetic fields of the initial incident plane wave with the excitation pulse p ( t ) are as follows:
E 0 i ( r , t ) = e 0 i p ( t ) δ ( t k ^ 0 i r / c )
H 0 i ( r , t ) = h 0 i p ( t ) δ ( t k ^ 0 i r / c )
where e 0 i and h 0 i are amplitude vectors. k ^ 0 i denotes the normalized incidence direction. δ ( t ) is the impulse function. c is the speed of light in free space. The symbol “ ” represents the convolution operation.
For the mth reflection, the incident fields E m i ( r , t ) and H m i ( r , t ) show the following relationship:
E m i ( r , t ) = e m i p ( t ) δ ( t τ m k ^ m i r / c )
H m i ( r , t ) = h m i p ( t ) δ ( t τ m k ^ m i r / c )
and
e m i = R T E ( e m 1 i e ^ T E ) e ^ T E + R T M ( e m 1 i e ^ T M ) ( e ^ T E × k ^ m i )
h m i = R T E ( h m 1 i e ^ T M ) ( k ^ m i × e ^ T E ) + R T M ( h m 1 i e ^ T E ) e ^ T E
τ m = j = 0 m 1 2 ( k ^ j i n ^ j ) ( n ^ j r j c ) c , τ 0 = 0
k ^ m i = k ^ 0 i j = 0 m 1 2 ( k ^ j i n ^ j ) n ^ j
where RTM and e ^ T M denote the reflection coefficients and normalized direction of the TM wave. R T E and e ^ T E indicate the reflection coefficients and normalized direction of the TE wave.
The transient scattering fields is calculated by the TDPO integrals as follows:
E s ( r , t ) = 1 4 π r c k ^ s × S [ Z 0 k ^ s × J ( r , t ) + M ( r , t ) ] δ [ t ( r k ^ s r ) / c ] d S
where r is the distance between the observation point and the coordinate origin. k ^ s denotes normalized scattering direction. The integral region S is the region where the target surface is illuminated. J ( r , t ) and M ( r , t ) are the equivalent current and equivalent magnetic current distributed on the surface, respectively. Based on Fresnel’s reflection law, J ( r , t ) and M ( r , t ) are derived as:
J ( r , t ) = ( 1 R T E ) [ H m i ( r , t ) e ^ T M ] ( k ^ m i n ^ m ) e ^ T E + ( 1 + R T M ) [ H m i ( r , t ) e ^ T E ] ( n ^ m × e ^ T E )
M ( r , t ) = ( 1 R T M ) [ E m i ( r , t ) e ^ T M ] ( k ^ m i n ^ m ) e ^ T E + ( 1 + R T E ) [ E m i ( r , t ) e ^ T E ] ( e ^ T E × n ^ m )
By substituting (3), (4), and (10) into(9), the scattering field E s ( r , t ) can be written as:
E s ( r , t ) = 1 4 π r c k ^ s × ( M a + k ^ s × J a ) p ( t r / c τ m ) I ( t )
where
I ( t ) = S δ ( t ( k ^ m i k ^ s ) r / c ) d S
J a = Z 0 [ ( 1 R T E ) ( h m i e ^ T M ) ( k ^ m i n ^ m ) e ^ T E + ( 1 + R T M ) ( h m i e ^ T E ) ( n ^ m × e ^ T E ) ]
M a = ( 1 R T M ) ( e m i e ^ T M ) ( k ^ m i n ^ m ) e ^ T E + ( 1 + R T E ) ( e m i e ^ T E ) ( e ^ T E × n ^ m )
For the triangular patch, I ( t ) can be reduced to a closed-form representation:
I ( t ) = { δ ( t ω r m c c ) Δ S ,   | β | = 0 c | β | 2 i = 1 3 ( ω × n ^ m ) Δ v i { δ ( t ω v i c ) , ω Δ v i = 0 c ω Δ v i [ ε ( t ω v i c ) ε ( t ω v i + 1 c ) ] , ω Δ v i 0 , | β | 0
In the above equation, r m c is the center of triangular patch. ω = k ^ m i k ^ s and β = ω ( ω n ^ m ) n ^ m . Δ v i = v i + 1 v i . ν i is the position vector of the vertices of Tri m in the global coordinate system, and v 4 = v 1 . ε ( t ) is a step function.
To verify the accuracy and efficiency of the TDSBR method, results from TDSBR are shown and compared with the full-wave solutions that were simulated using the multilevel fast multipole algorithm (MLFMA) obtained using FEKO commercial software. In addition, the results of the frequency domain SBR (FDSBR) are given as a reference. In the TDSBR method, the excitation pulse is the modulating Gaussian pulse:
p ( t ) = exp ( j 2 π f 0 t ) exp ( 4 π t 2 / τ 2 ) , T / 2 t T / 2
where f 0 is the carrier frequency. T = 2 τ . τ = 4 / f b . fb denotes the bandwidth.
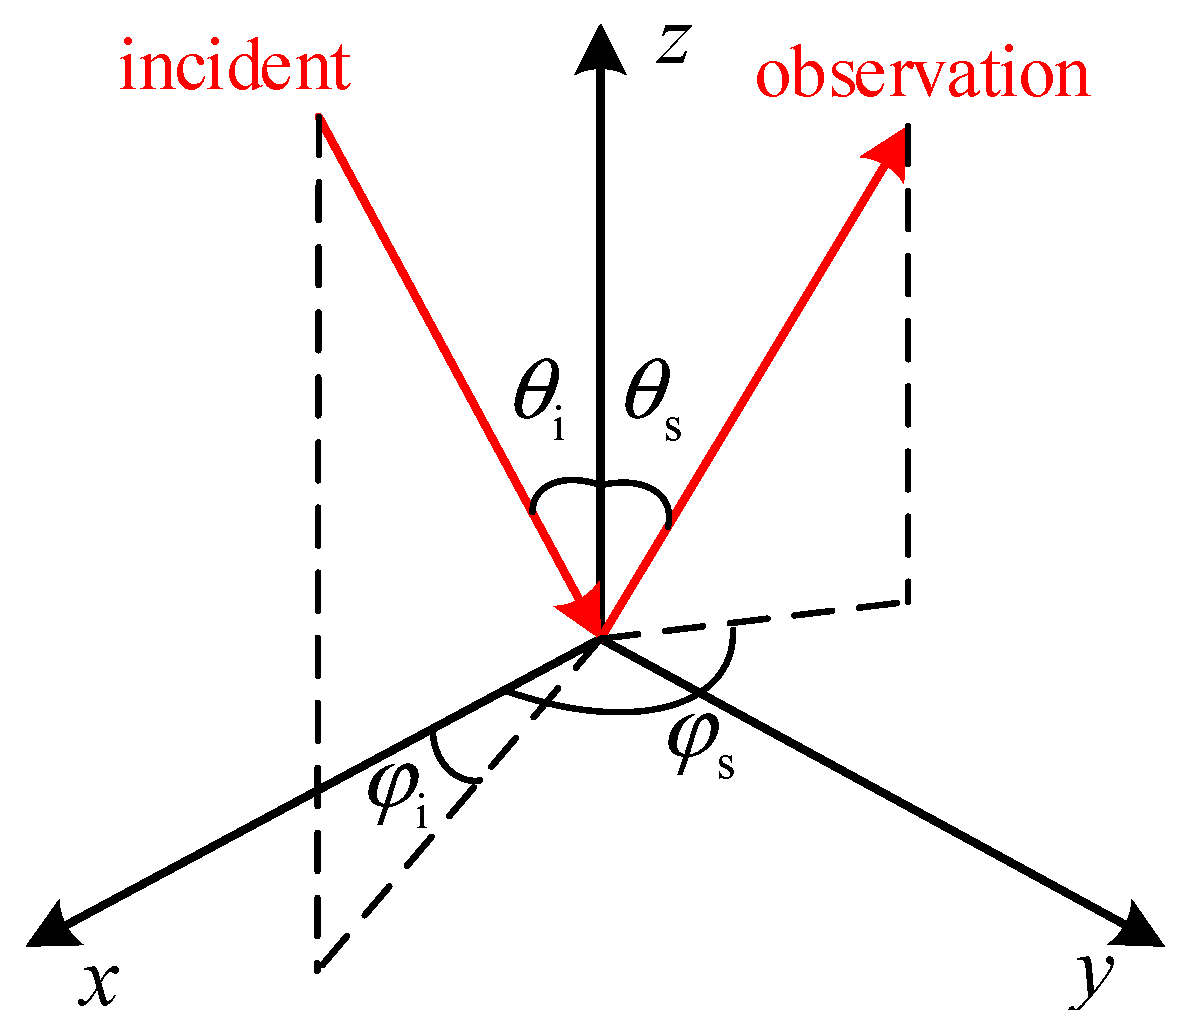
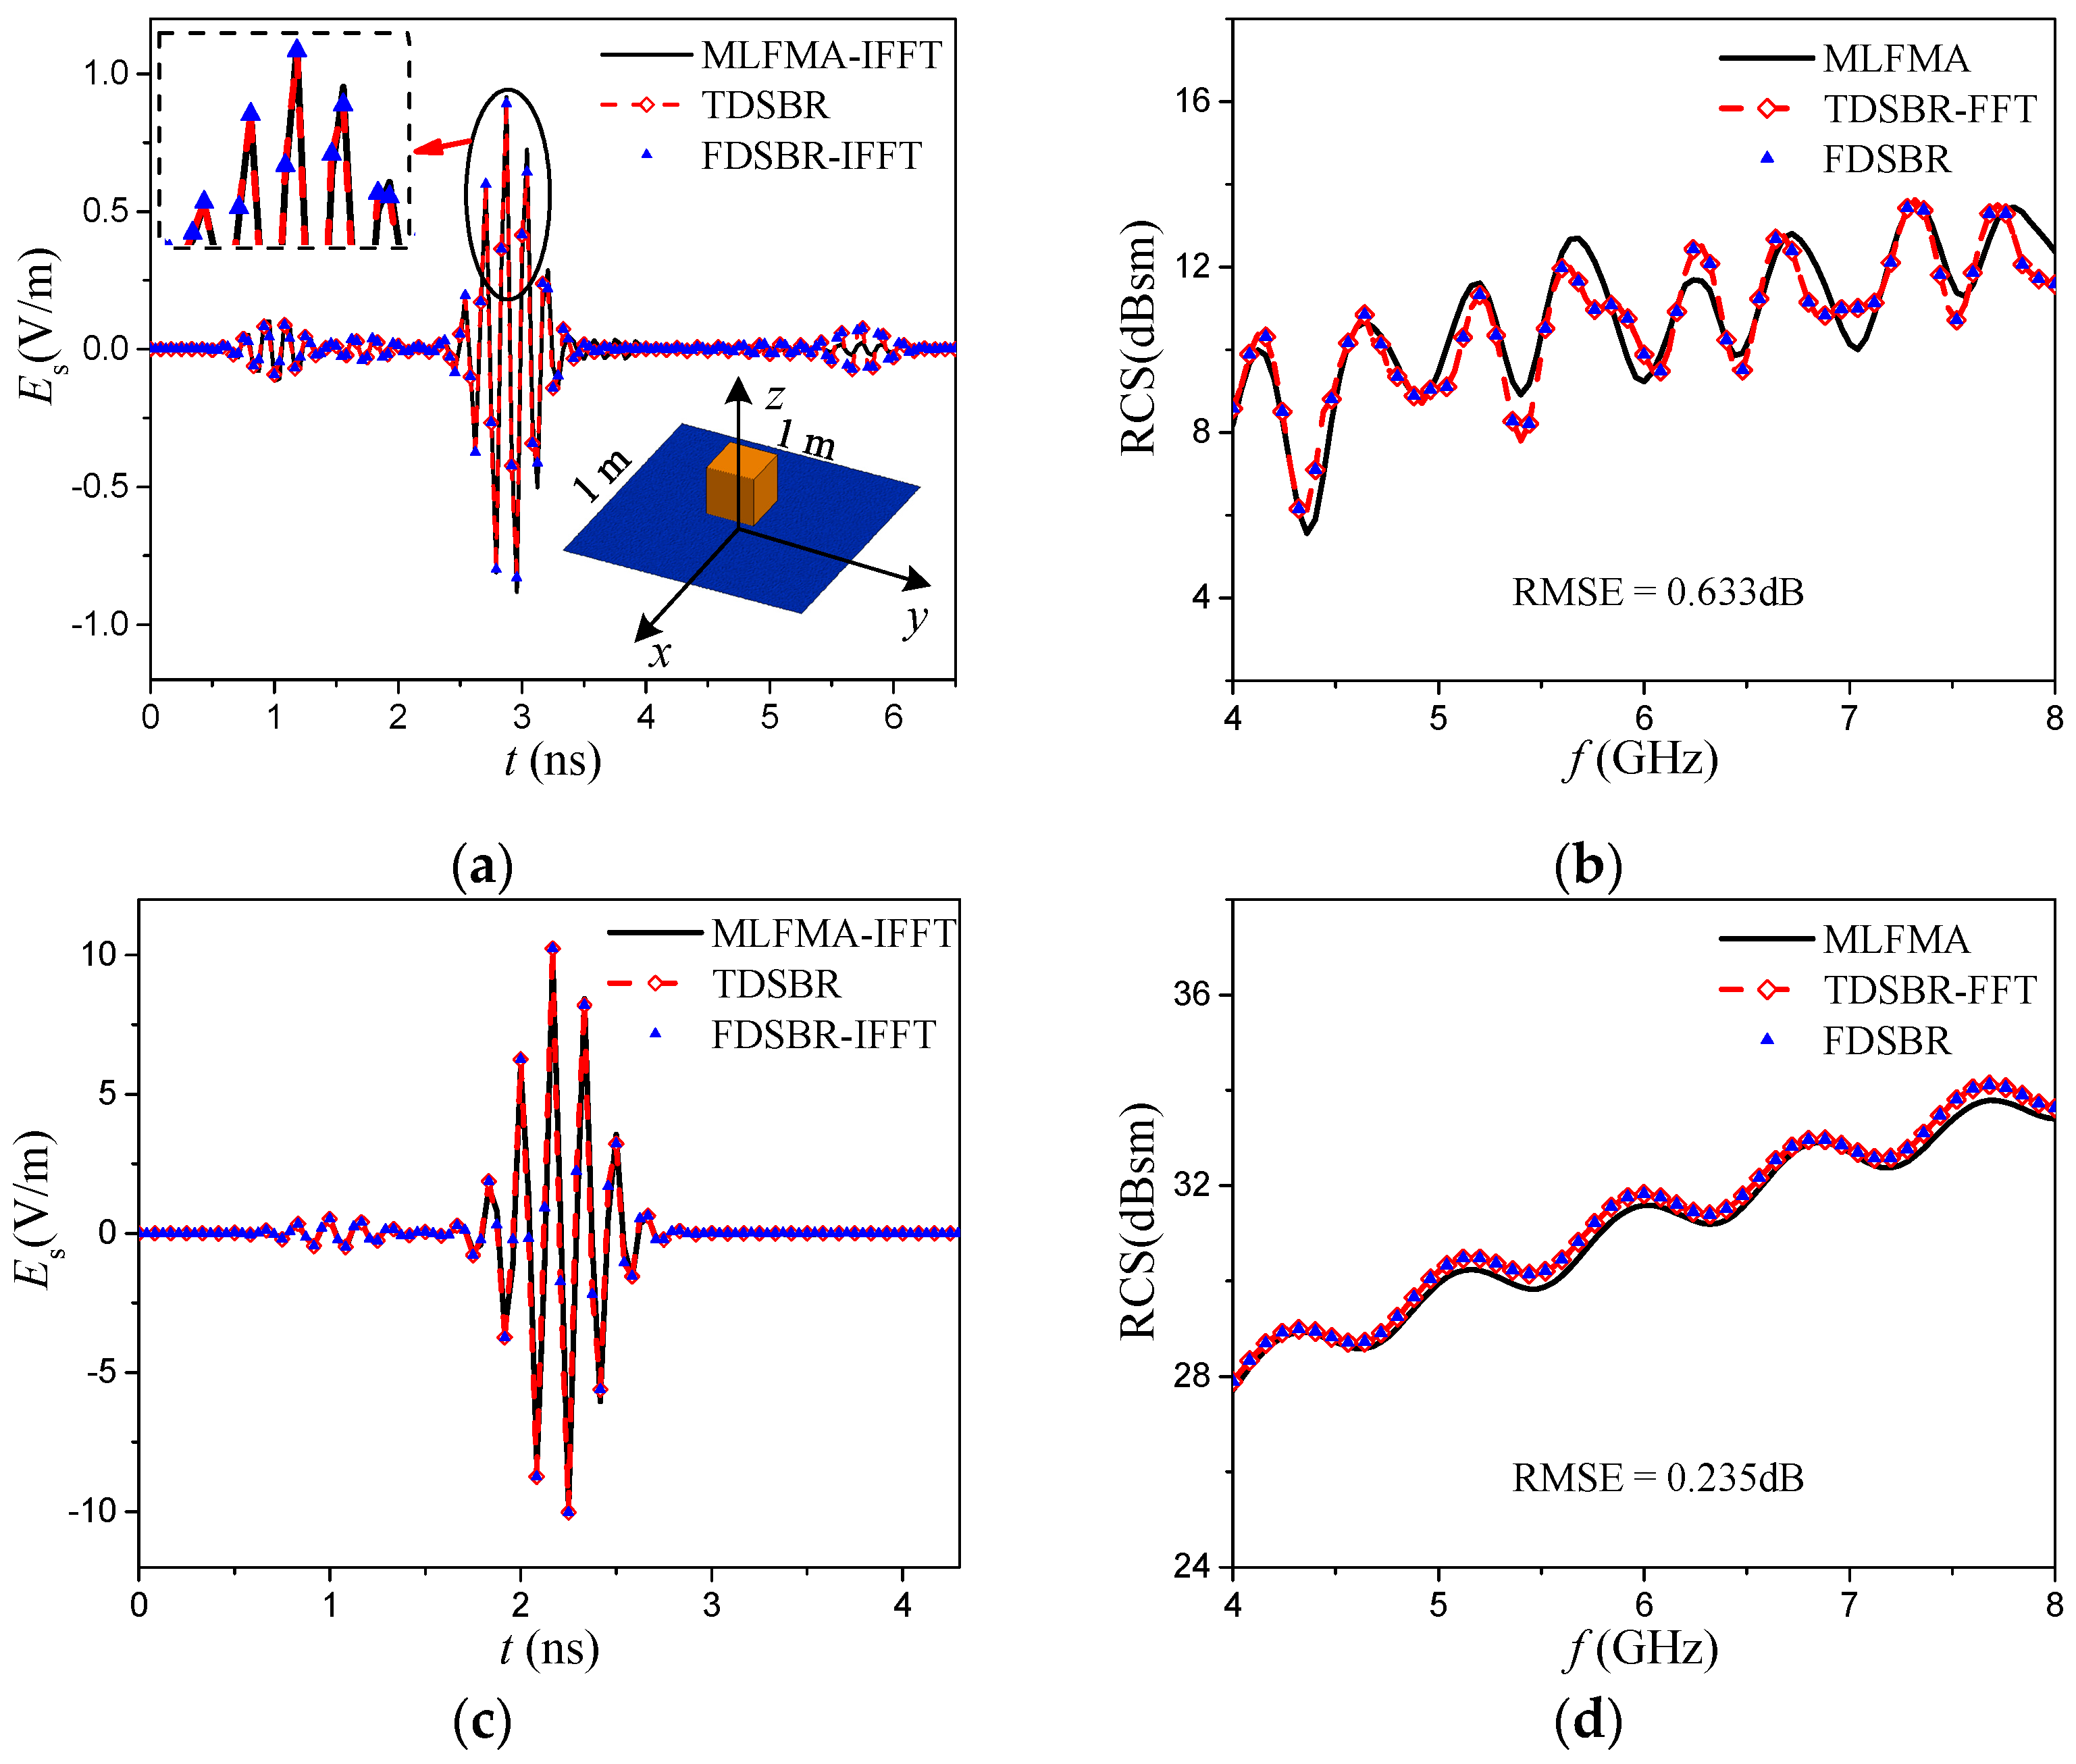
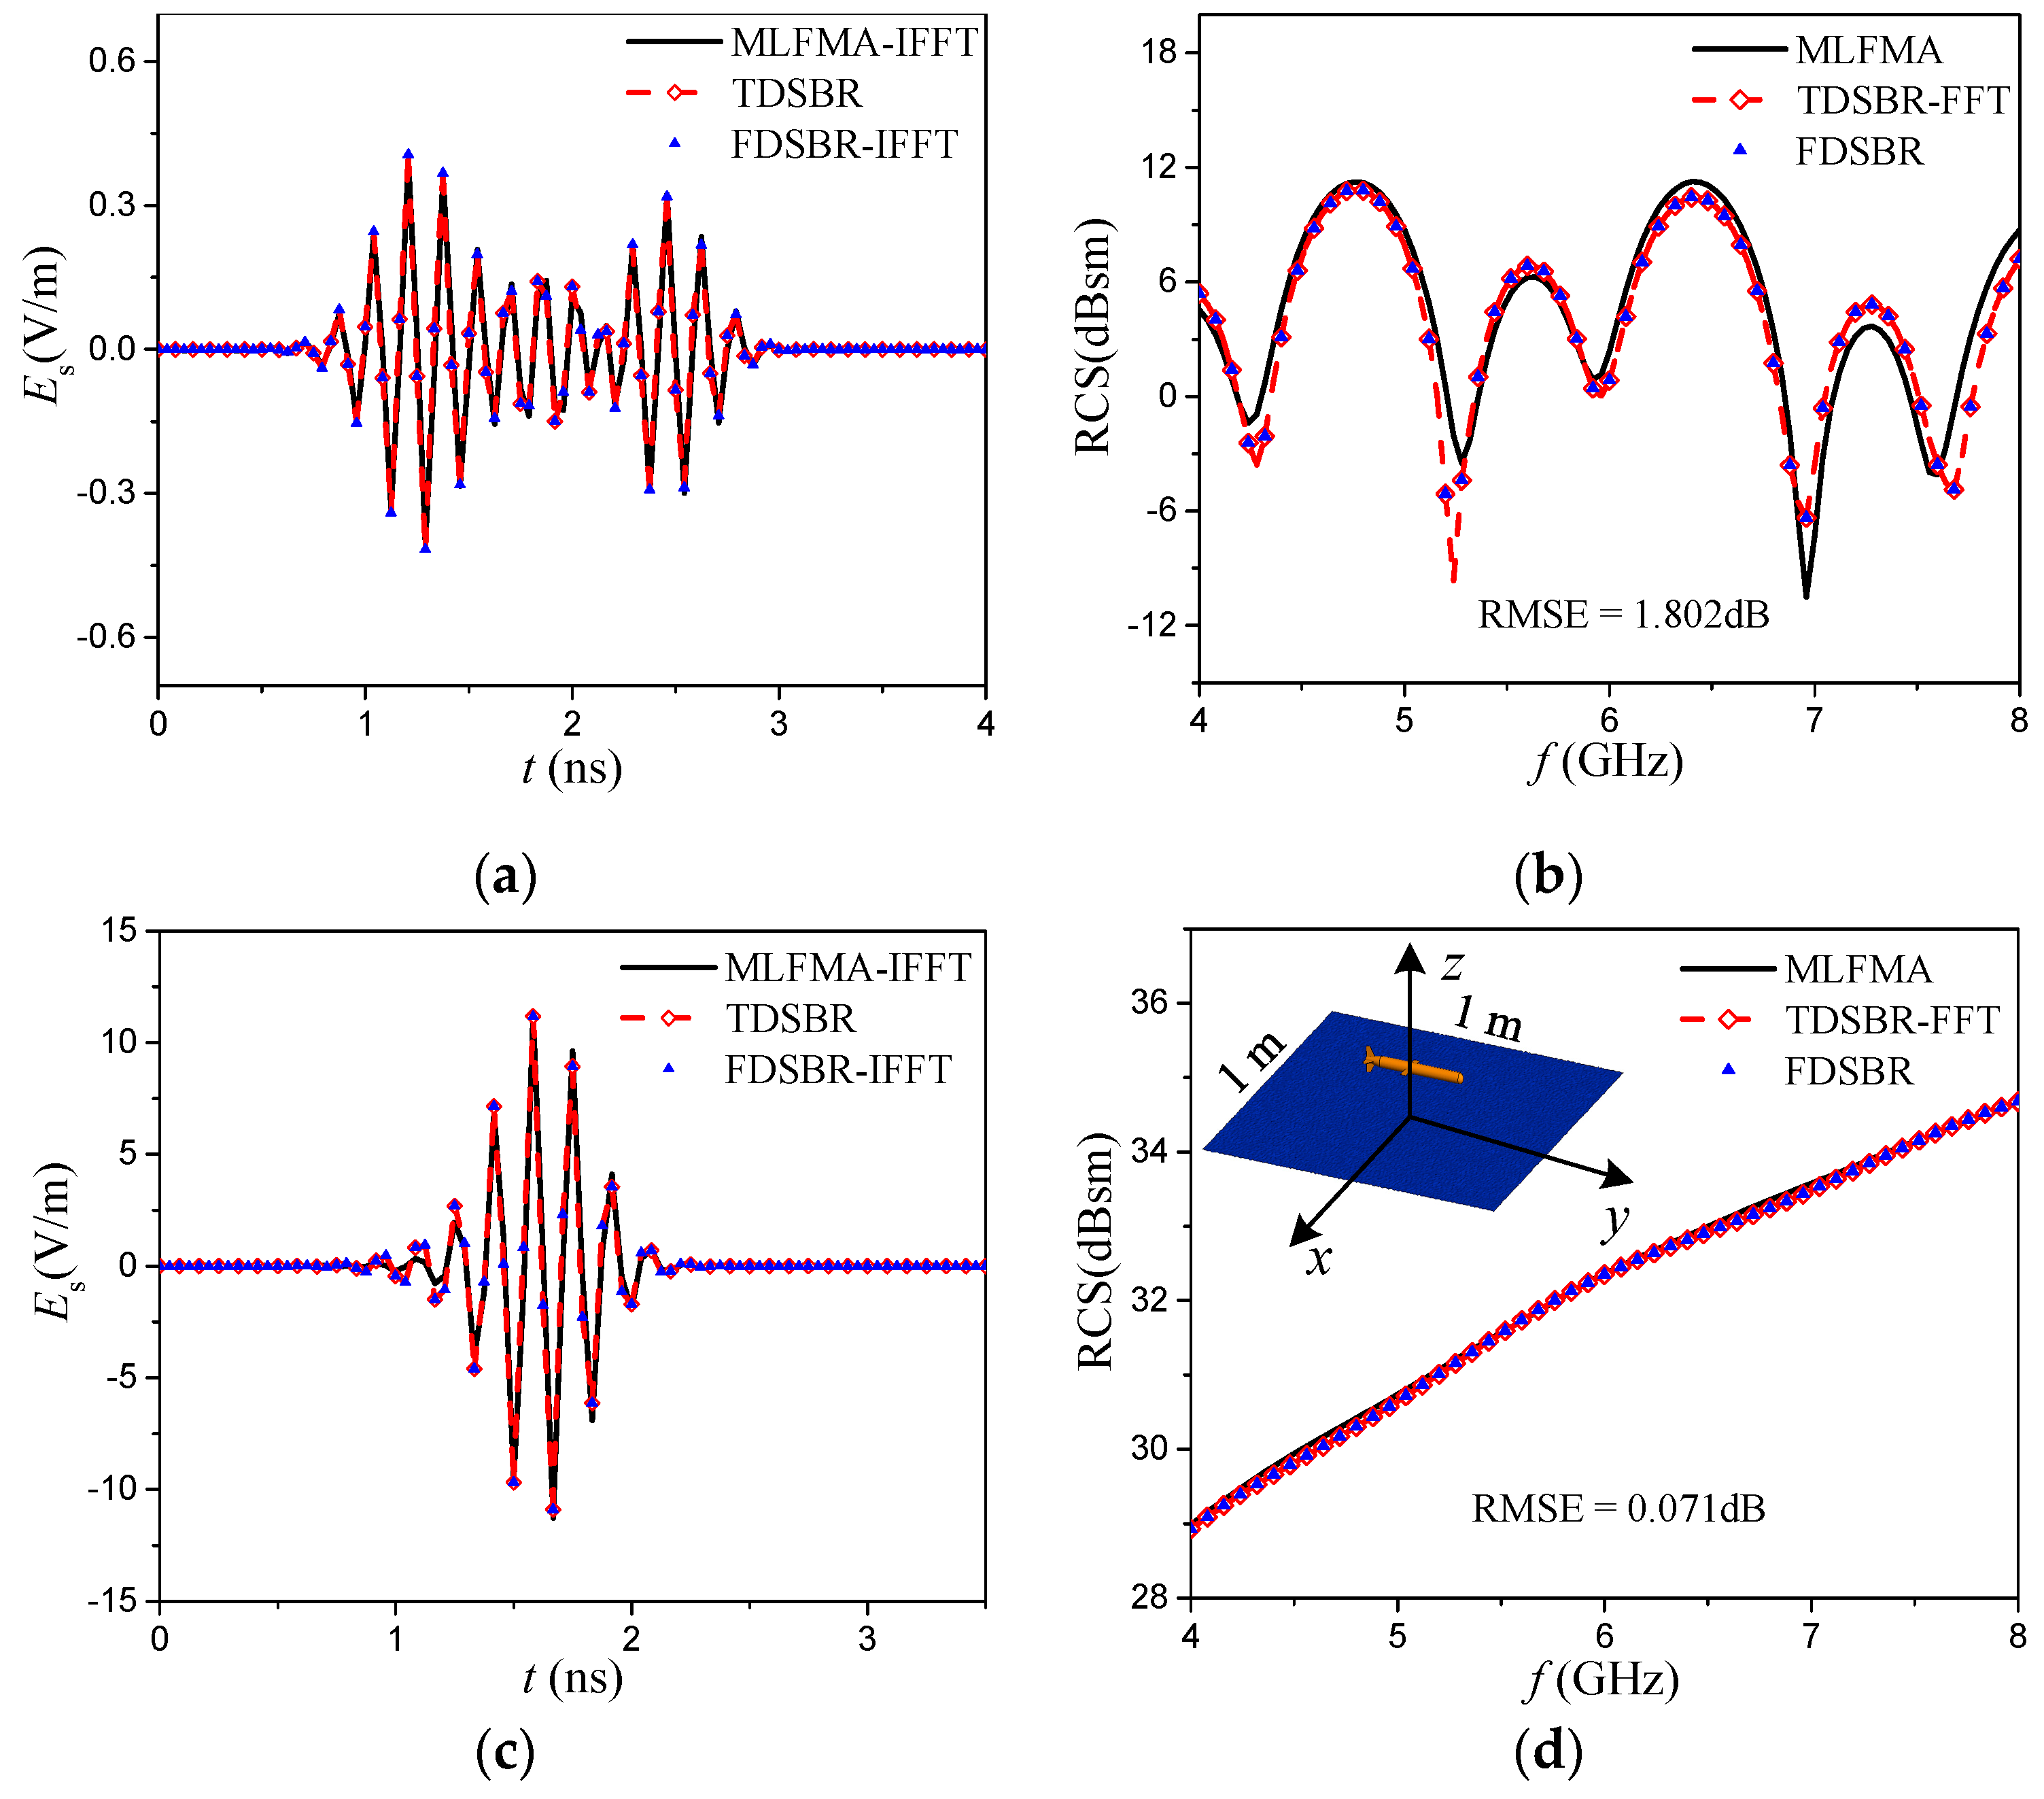
Figure 3 shows the definition of the incident and the observation direction in the global coordinate system. Figure 4 shows the monostatic (θi = 45°, φ i = 0°) and bistatic ( θ i = 45°, φ i = 0°, θ s = 45°, φ s = 180°) scattering results of a composite cube-ocean scene (see Figure 4a). The side length of the cube is 0.2 m. The height of the cube’s center is 0.15 m. The size of the rough sea surface is 1 m × 1 m. Figure 5 shows the monostatic ( θ i = 10°, φ i = 90°) and bistatic ( θ i = 45°, φ i = 0°, θ s = 45°, φ s = 180°) scattering results of a composite missile-ocean scene (see Figure 5d). The size of the missile is about 0.33 m × 0.1 m × 0.026 m. The height of the missile’s center is 0.1 m. The size of the rough sea surface is 1 m × 1 m. The power spectrum of the sea surface is PM spectrum. The wind speed is 3 m/s. The relative dielectric constant of the sea is 55.9 37 j . The rough sea surface is generated by the Monte Carlo method. The carrier frequency f 0 is 6 GHz and the bandwidth is 4 GHz.
In Figure 4 and Figure 5, the wideband scattering fields obtained by MLFAM and FDSBR are converted into TD by the inverse fast Fourier transform (IFFT) and compared with those obtained from TDSBR. The transient results by TDSBR are transformed to the FD using the fast Fourier transform (FFT). It can be seen from the figures that the results from TDSBR and FDSBR agree well, but are slightly different from those using MLFMA; TDSBR and FDSBR belong to high frequency algorithms and the error between these results and those from MLFMA is due to the use of high frequency approximation. For wideband radar cross section (RCS), we give the root mean square error (RMSE) between TDSBR-FFT and MLFMA. The RMSE is expressed as:
RMSE = i = 1 n ( X i Y i ) 2 / n
where X and Y represent the two sets of data to be compared. The “n” is the number of elements in the data.
Table 1 compares the computational costs between the three methods. The experiment platform is a desktop computer with Quad 3.2 GHz CPU and 16 GB memory. The simulation time is estimated based on the single thread using Windows 10. As we can see, the ratio of computation time of TDSBR and FDSBR is about 1:5, and MLFMA takes 106 times longer than TDSBR.

3. ISAR Imaging Algorithm

Section 2 shows that the total echo of the composite scene is the sum of the echoes from all of the illuminated triangular patches. In this section, the ISAR imaging algorithm is derived based on the scattering field expression (12) of Section 2.
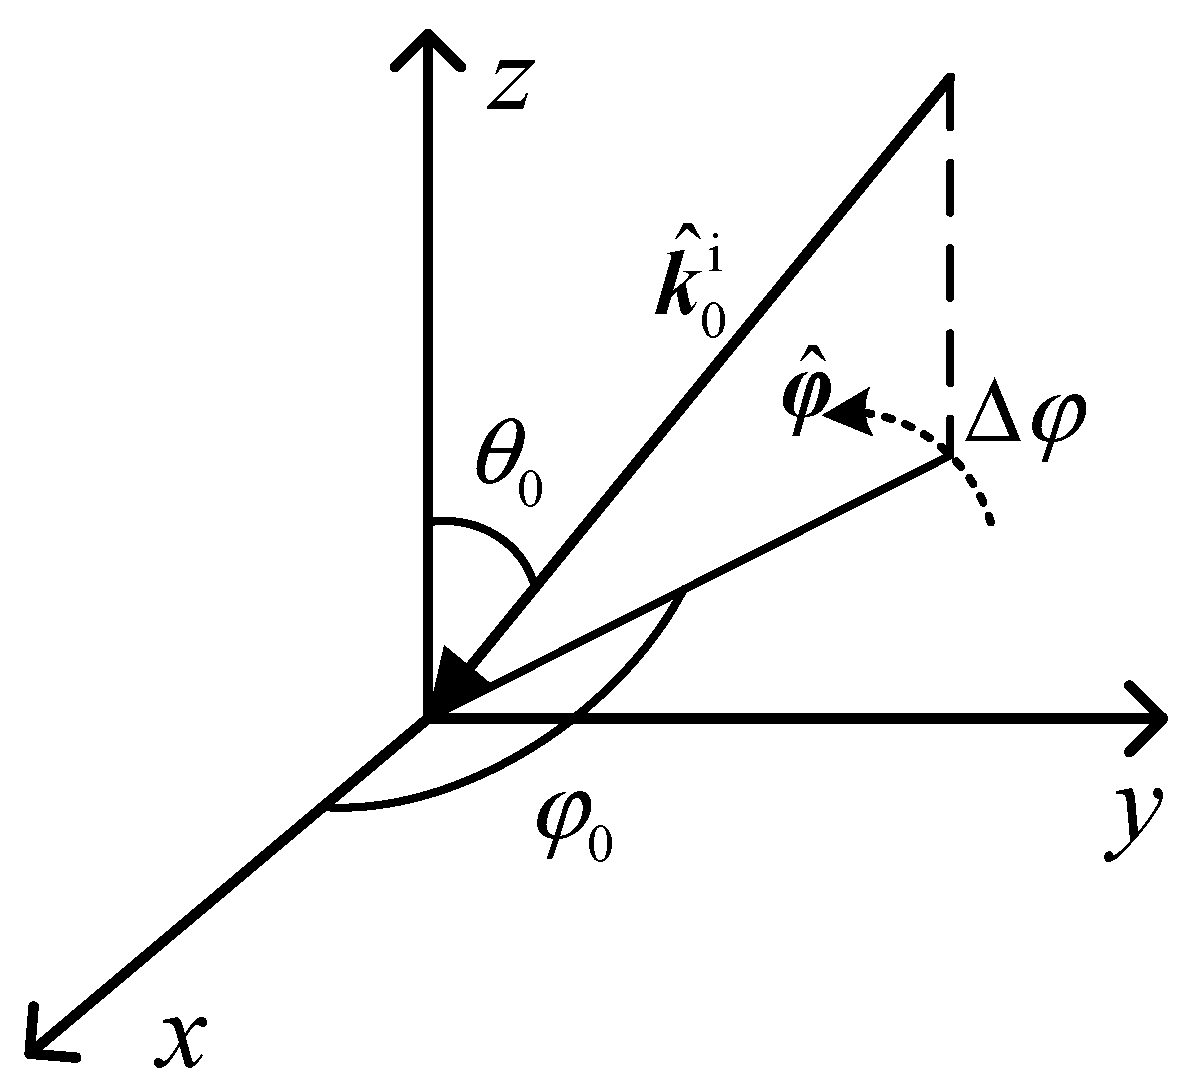
As it is shown in Figure 6, we consider a plane wave scanning a small angle Δ φ along φ ^ near φ 0 . In this example, the angular velocity is ω A . Thus, the azimuth angle φ is
φ = φ 0 + ω A η , ( Δ φ 2 ω A η Δ φ 2 ω A )
and
k ^ 0 i ( η ) = cos ( ω A η ) k ^ i 0 + k ^ i 0 + sin ( ω A η ) z ^ × k ^ i 0
where k ^ i 0 = ( k ^ 0 i ( 0 ) z ^ ) z ^ and k ^ i 0 = k ^ 0 i ( 0 ) k ^ i 0 . For backscattering, we have k ^ s ( η ) = k ^ 0 i ( η ) . ω = 2 k ^ 0 i ( η ) q m in I ( t ) and q m = j = 0 m 1 2 ( k ^ j i n ^ j ) n ^ j .
Assuming the polarization direction of the receiving antenna is p ^ , the received echo is
s ( t , η ) = A ( η ) w a ( η ) p ( t r / c τ m ) I ( t , η )
where w a ( η ) is a window function.
A ( η ) = 1 4 π r c k ^ s × ( M a + k ^ s × J a ) p ^
In general, | β | and ω Δ v i in Equation (16) are not equal to zero for most observation directions. Thus, I ( t , η ) can be written as the superposition of the step function:
I ( t , η ) = i = 1 3 j = i i + 1 a i j ε [ t ( 2 k ^ 0 i ( η ) q m ) v j / c ]
where a i j = c 2 [ ( 2 k ^ 0 i ( η ) q m ) × n ^ m ] Δ v i | β | 2 ( 2 k ^ 0 i ( η ) q m ) Δ v i ( 1 ) j i .
In general, the transmitted signal p ( t ) with carrier frequency f 0 can be expressed as:
p ( t ) = exp ( j 2 π f 0 t ) g ( t ) , T / 2 t T / 2
where g ( t ) is the baseband signal and T is the pulse width.
In order to avoid the integral operation in the convolution operation, we use the first derivative of p ( t ) as the excitation impulse. The echo expression can then be rewritten as:
s r ( t , η ) = A ( η ) w a ( η ) p ( t r / c τ m ) i = 1 3 j = i i + 1 a i j δ [ t ( 2 k ^ 0 i ( η ) q m ) v j / c ]
We then derive the imaging formula under small-bandwidth small-angle approximation based on (25). First, the echo needs to be demodulated to the baseband domain. This procedure can be completed by multiplying the echo signal by the phase factor exp ( j 2 π f 0 t ) . The echo after demodulation can be written as:
s 0 ( t , η ) = A ( η ) w a ( η ) i = 1 3 j = i i + 1 { a i j g ( t r + ( 2 k ^ 0 i ( η ) q m ) v j c τ m ) × exp [ j 2 π f 0 ( r + ( 2 k ^ 0 i ( η ) q m ) v j c + τ m ) ] }
Then, by taking the range Fourier transform of s 0 ( t , η ) , we can get
S 0 ( f , η ) = FFT t { s 0 ( t , η ) } = A ( η ) w a ( η ) G ( f ) exp [ j 2 π ( f 0 + f ) ( r / c + τ m ) ] X ( f )
G ( f ) = FFT t { g ( t ) }
X ( f ) = i = 1 3 j = i i + 1 a i j exp [ j 2 π ( f 0 + f ) ( 2 k ^ 0 i ( η ) q m ) v j / c ]
The next step is matched filtering. For the LFM pulse, the matched filter is usually set to:
H ( f ) = G ( f ) exp [ j 2 π ( f 0 + f ) r / c ]
The spectrum G ( f ) of LFM is a window function of complex-type. However, since the spectrum of the modulating Gaussian pulse is a Gaussian-type function, the matching filter is unable to achieve the pulse compression effect. Therefore, we redesign the matched filter as follows:
H ( f ) = w r ( f ) G ( f ) exp [ j 2 π ( f 0 + f ) r / c ]
where w r ( f ) is a window function. It can be seen from the filter’s expression that the filter is suitable for modulating the Gaussian pulse and for the LFM pulse.
The output of the matched filter is
S 1 ( f , η ) = S 0 ( f , η ) H ( f ) = w r ( f ) A ( η ) w a ( η ) X ( f ) exp [ j 2 π ( f 0 + f ) τ m ]
For small values of ω A η , cos ( ω A η ) can be approximated by 1 and sin ( ω A η ) can be approximated by ω A η . Therefore, k ^ 0 i ( η ) is reduced to
k ^ 0 i ( η ) = k ^ 0 i ( 0 ) + ω A η z ^ × k ^ 0 i ( 0 )
and A ( η ) can be approximated as
A ( η ) A 0 = 1 4 π r c k ^ 0 i ( 0 ) × ( M a k ^ 0 i ( 0 ) × J a ) p ^
Therefore, S 1 ( f , η ) can be simplified as:
S 1 ( f , η ) = A 0 W r ( f ) w a ( η ) i = 1 3 j = i i + 1 a i j exp { j 2 π f 0 [ 2 v j k ^ 0 i ( 0 ) c + τ m q m v j c ] } × exp { j 2 π f [ 2 v j k ^ 0 i ( 0 ) c + τ m q m v j c ] } exp { j 2 π ( f 0 + f ) ω A η 2 v j ( z ^ × k ^ 0 i ( 0 ) ) c }
By further applying the small-bandwidth approximation:
( f 0 + f ) ω A η f 0 ω A η
we can get
S 1 ( f , η ) = A 0 w r ( f ) w a ( η ) i = 1 3 j = i i + 1 a i j exp { j 2 π f 0 [ 2 v j k ^ 0 i ( 0 ) / c + τ m q m v j / c ] } × exp { j 2 π f [ 2 v j k ^ 0 i ( 0 ) c + τ m q m v j c ] } × exp { j 2 π ω A η 2 v j ( z ^ × k ^ 0 i ( 0 ) ) λ 0 }
where λ 0 = c / f 0 .
Finally, we take the range and azimuth inverse Fourier transform (IFT) of S 1 ( f , η ) . We can obtain the final ISAR image expression:
S isar ( t , α ) = A 0 i = 1 3 j = i i + 1 a i j exp { j 2 π f 0 [ 2 v j k ^ 0 i ( 0 ) / c + τ m q m v j / c ] } × p r ( t 2 v j k ^ 0 i ( 0 ) c τ m + q m v j c ) p a ( α 2 v j ( z ^ × k ^ 0 i ( 0 ) ) λ 0 )
where p r and p a are sinc-type functions. The image intensity of each triangular patch can be obtained by (38). The imaging process for one of the triangles is the same for all the triangles. The overall image is the sum of the image of all the illuminated triangles.
4. Numerical Examples

We present the ISAR images generated using simulated echo data from TDSBR. A modulating Gaussian pulse is used as the excitation pulse. For comparison, we also provide images generated using the LFM pulse and the FDSBR method to validate the accuracy and efficiency of the proposed method. The expression of the LFM pulse is:
p ( t ) = exp ( j 2 π f 0 t ) exp ( j π K t 2 ) , T / 2 t T / 2
where K is the linear frequency and K = 5 × 10¹⁵ Hz/s in this paper.

4.1. ISAR Images of Targets

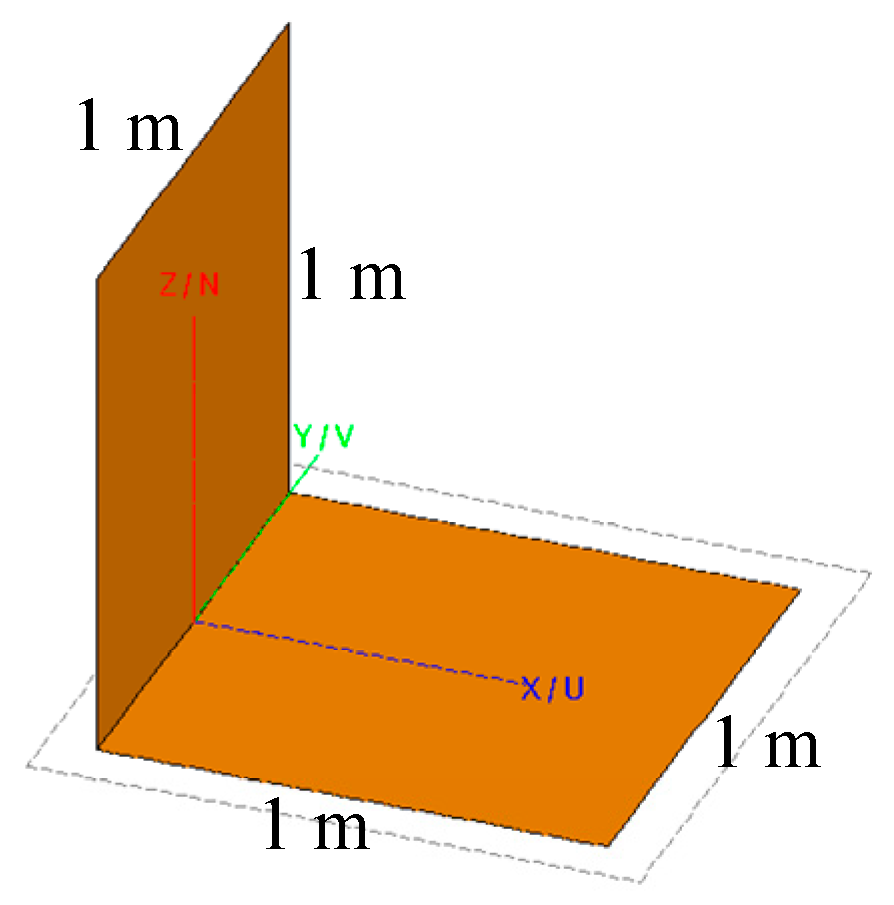
At first, we consider the ISAR images of a dihedral corner reflector with a side length of 1 m. The plane wave is polarized in HH. The carrier frequency f 0 = 10 GHz and the bandwidth is set to 1 GHz. The center azimuth angle φ 0 = 0 ° . Based on the azimuth resolution, the look angle of radar varies from −0.05 rad to 0.05 rad around φ 0 . Therefore, the resolution is 0.15 m in both range and azimuth. Figure 7 shows the geometric model of the dihedral corner reflector.
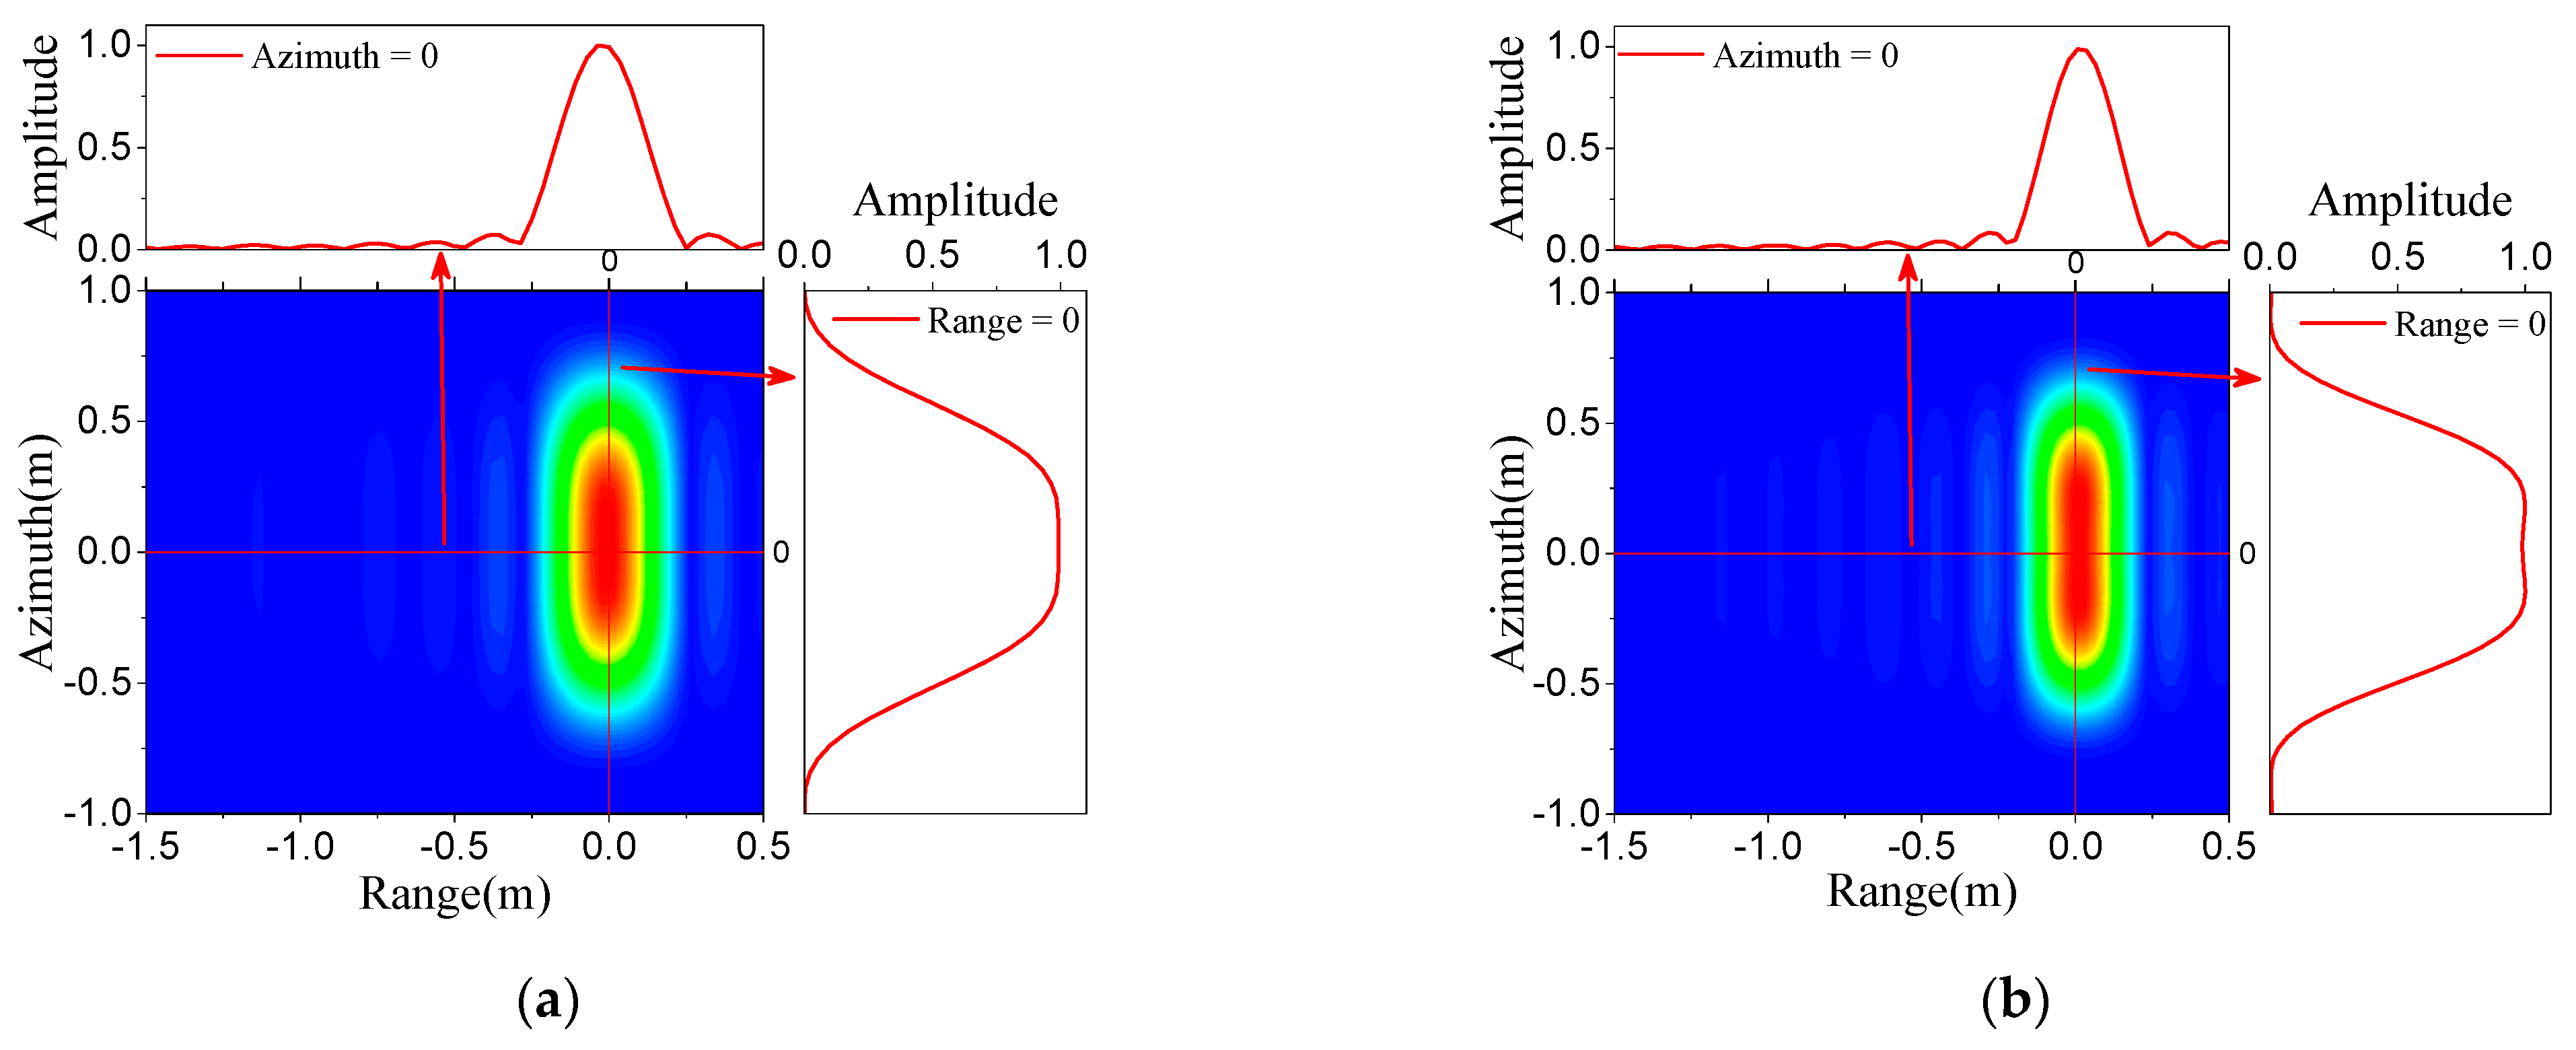
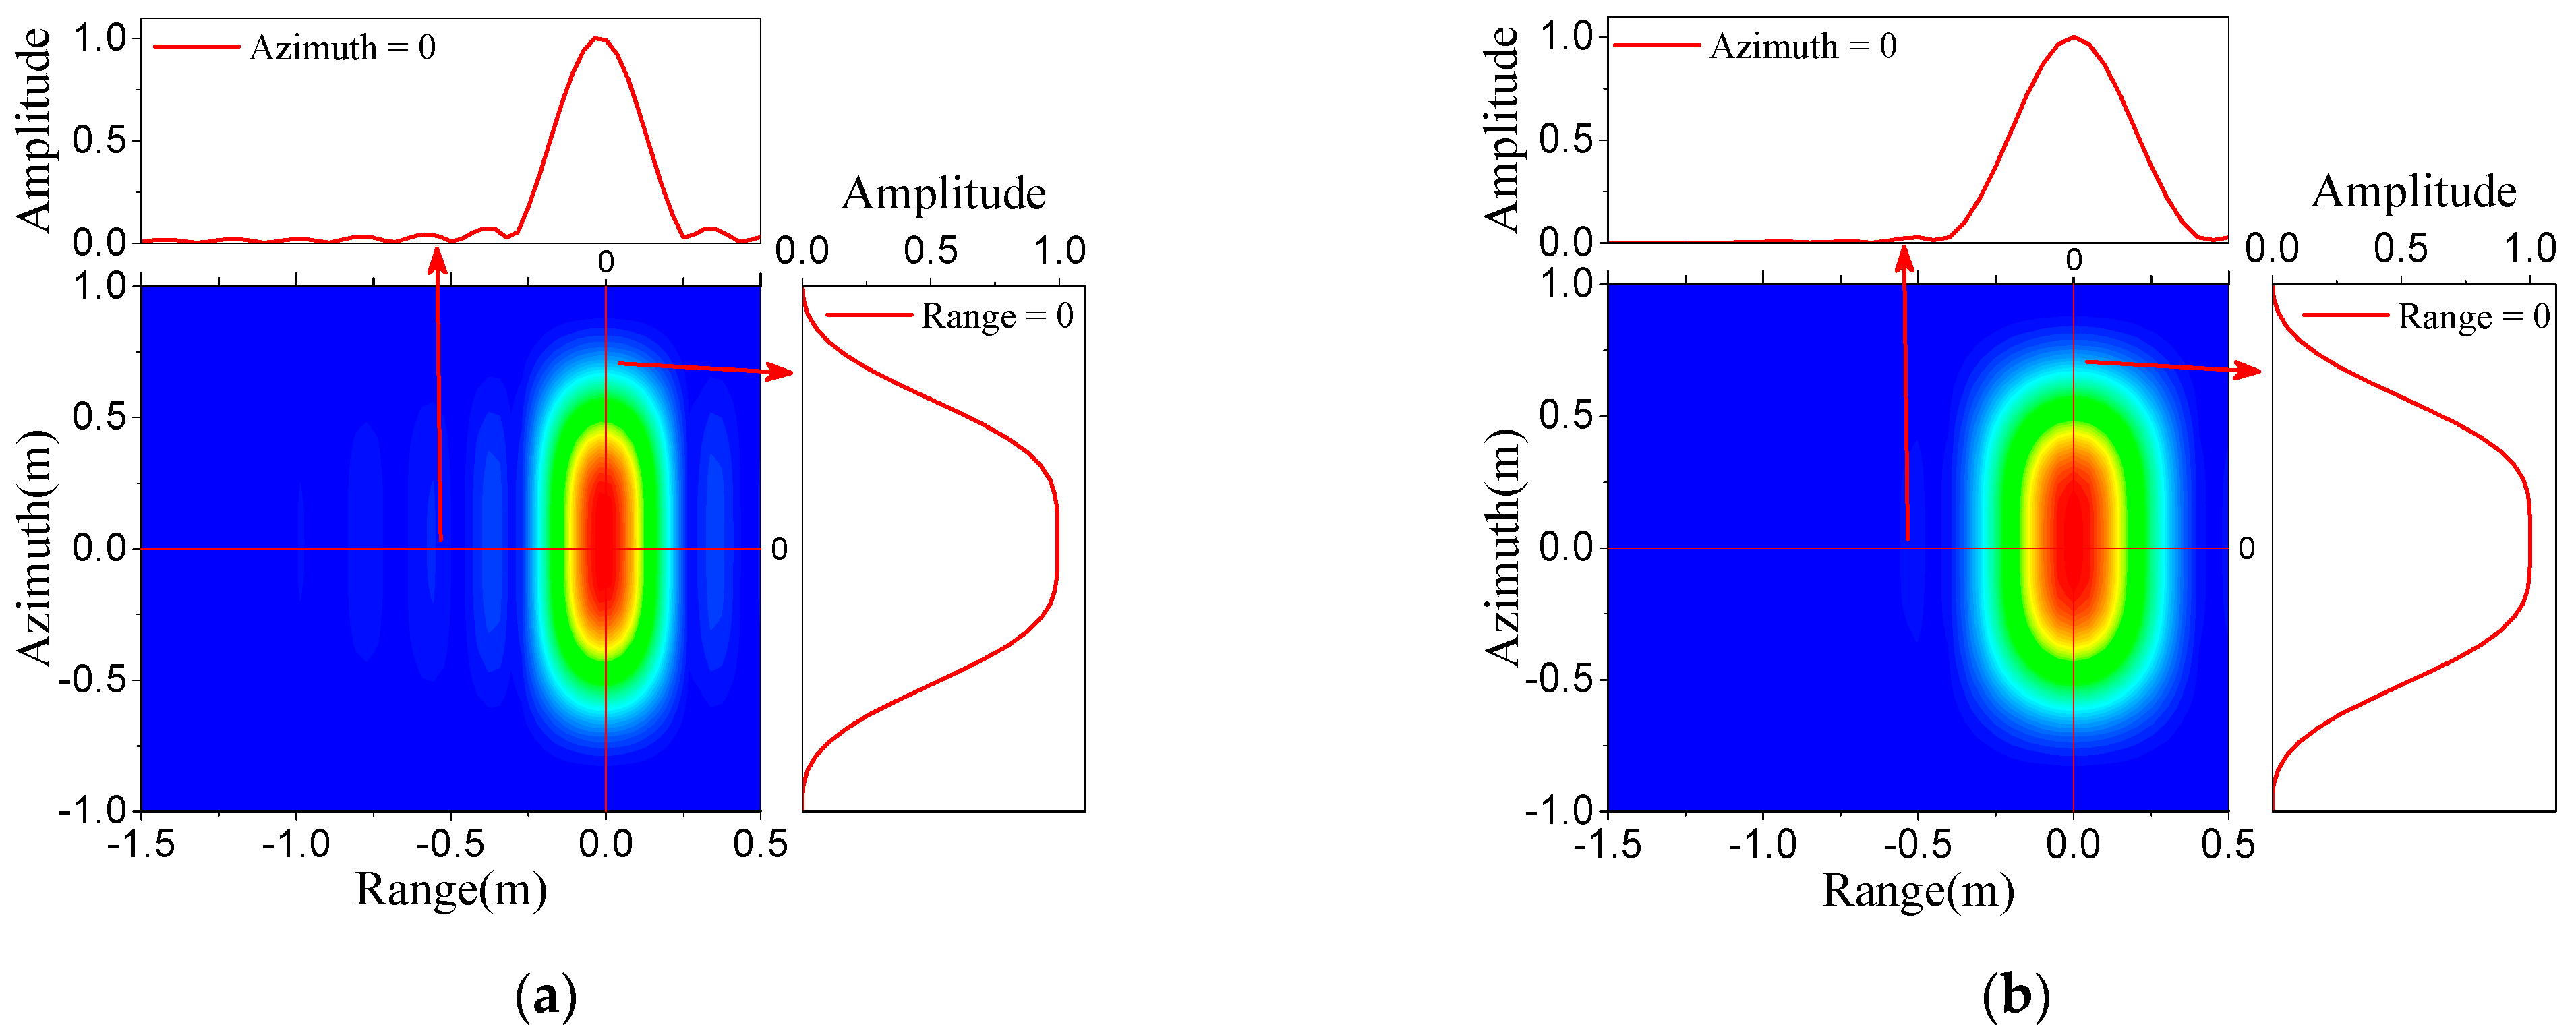
Figure 8 shows the normalized transient scattering echoes and the wideband scattering fields at θ 0 = 45 ° and φ 0 = 0 ° . Figure 9 shows the ISAR images and profile maps in range and azimuth under different incident angles θ 0 . As shown in Figure 9, the images at different incident angles are consistent. For a regular dihedral angle reflector, no matter what the incident angle is, the electromagnetic wave propagation distance caused by double bounces is the same. This is equivalent to the backscattering of an imaginary scatterer at the corner of the reflector. Figure 10 shows the ISAR images at θ 0 = 45 ° by using the LFM pulse and the FDSBR method. The two images shown in Figure 10 are almost identical to those shown in Figure 9a.
Next, we simulate the ISAR images of a complex missile target as shown in Figure 11. The size of the missile is 6.4 m × 2.12 m × 0.5 m. The carrier frequency is f 0 = 10 GHz. The incident angle is θ 0 = 45 ° and the center azimuth angle is φ 0 = 0 ° . The polarization is VV. The resolution is 0.15 m in both range and azimuth.
Figure 12 shows the normalized transient scattering echoes and wideband scattering fields of the missile at φ 0 = 0 ° . Figure 13 shows the normalized ISAR images and profile maps of the missile target using a modulating Gaussian pulse, a LFM pulse, and the FDSBR method. As shown, these images are in perfect agreement. By comparing Figure 12a and Figure 13a, it can be found that the distribution of bright spots on the image corresponds to the distribution of the pulse peaks of the echo in the range profile. From the images of Figure 13, we can see the main bright spots located around the nose, wings, and tail of the missile. Since the warhead has a hemispherical shape and a substantial backscatter contribution, it forms a bright spot in the image. In the image of wings, the appearance of one of the strips is also enhanced. This brightness occurs because the wings have a specific thickness, as shown in Figure 12. The plate of the wing parallel to the yoz plane is exposed to the electromagnetic wave and contributes to the backscattering. Therefore, the main reason for the formation of the brighter strip is that it contains the scattering contribution from the wing’s plate parallel to the yoz plane.

4.2. ISAR Images of Composite Target-Ocean Scene

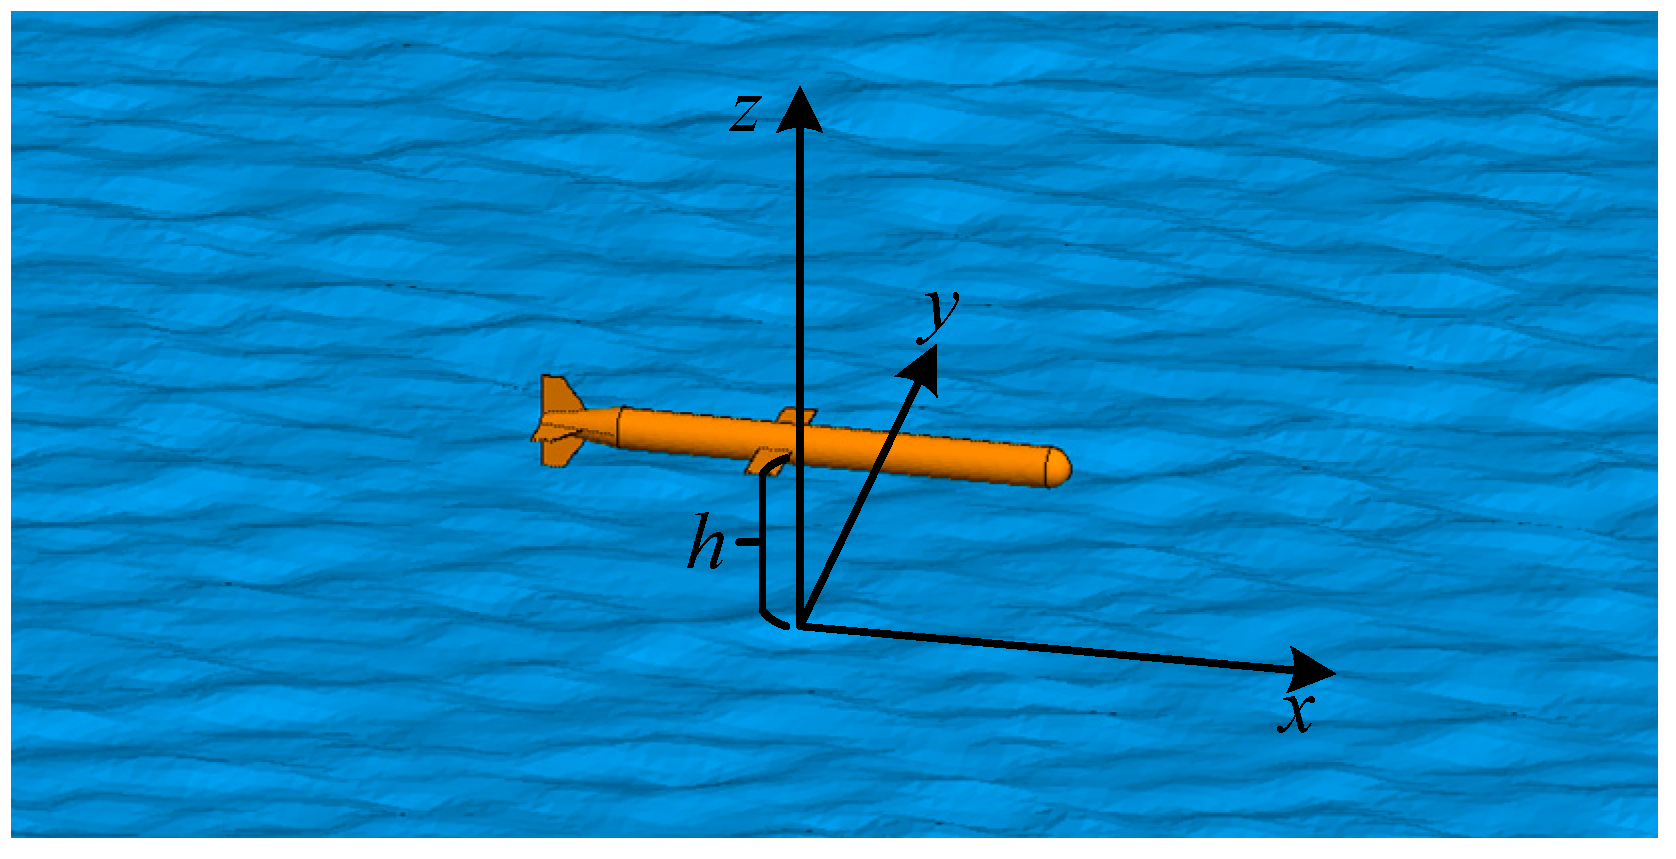
In the following example, we generate ISAR images of a composite target-ocean scene. First, we present the ISAR images of a PEC missile target above a rough sea surface. As shown in Figure 14, the missile’s dimensions are the same as in Figure 11. For this case, the size of the sea surface is 20 m × 20 m, and h is the distance from the missile to the sea. The power spectrum of the sea surface is PM spectrum. The wind speed is 5 m/s. The relative dielectric constant of the sea is 55.9 37 j . The incident angle is θ 0 = 60 ° and the center azimuth angle is φ 0 = 0 ° . The polarization is HH. The carrier frequency is f 0 = 10 GHz. The resolution is 0.15 m in both range and azimuth.
According to the ray paths shown in Figure 1, the scattered echoes from different parts of the composite scene can be easily obtained. It is helpful to analyze the influence of the rough background on the images. Figure 15 shows the ISAR images generated by total echo, differential echo, target echo, and coupling echo, respectively, at h = 3 m. The differential echo is obtained by subtracting the sea surface echo from the total echo. Equivalently, the differential echo is also the sum of the target echo and the coupling echo. The target echo is derived from the scattering contribution of the path ① in Figure 1, and the coupling echo corresponds to the path ③ in Figure 1. These images are normalized and plotted in logarithmic scale with a dynamic range. As can be seen from Figure 15b, the coupling image is located behind the target image in the range axis. This occurs because the rays exhibit multiple bounces between the target and the sea surface. These bounces delay the echo in time and cause the coupling image to be delayed in the range axis. The coupling image is the mirror image of the target. Because the sea surface is rough, this modulation effect causes the coupling image to be divergent.
Figure 16 shows the ISAR images at h = 5 m. With the increase of the missile height, the coupling path between the target and the sea surface becomes longer. By comparing Figure 15 and Figure 16, it can be found that, with the increase of h, the coupling image becomes more dispersed on the range axis and the image intensity becomes weaker.
In addition, to verify the accuracy and efficiency of the proposed method, we also present the ISAR images shown in Figure 17 by using the LFM pulse and the FDSBR method. According to this comparison, the images obtained by using the three different excitation sources (modulating Gaussian pulse, LFM pulse, and FDSBR) are in perfect agreement. Section 4.3 gives a detailed analysis of the image similarity and the simulation efficiency.
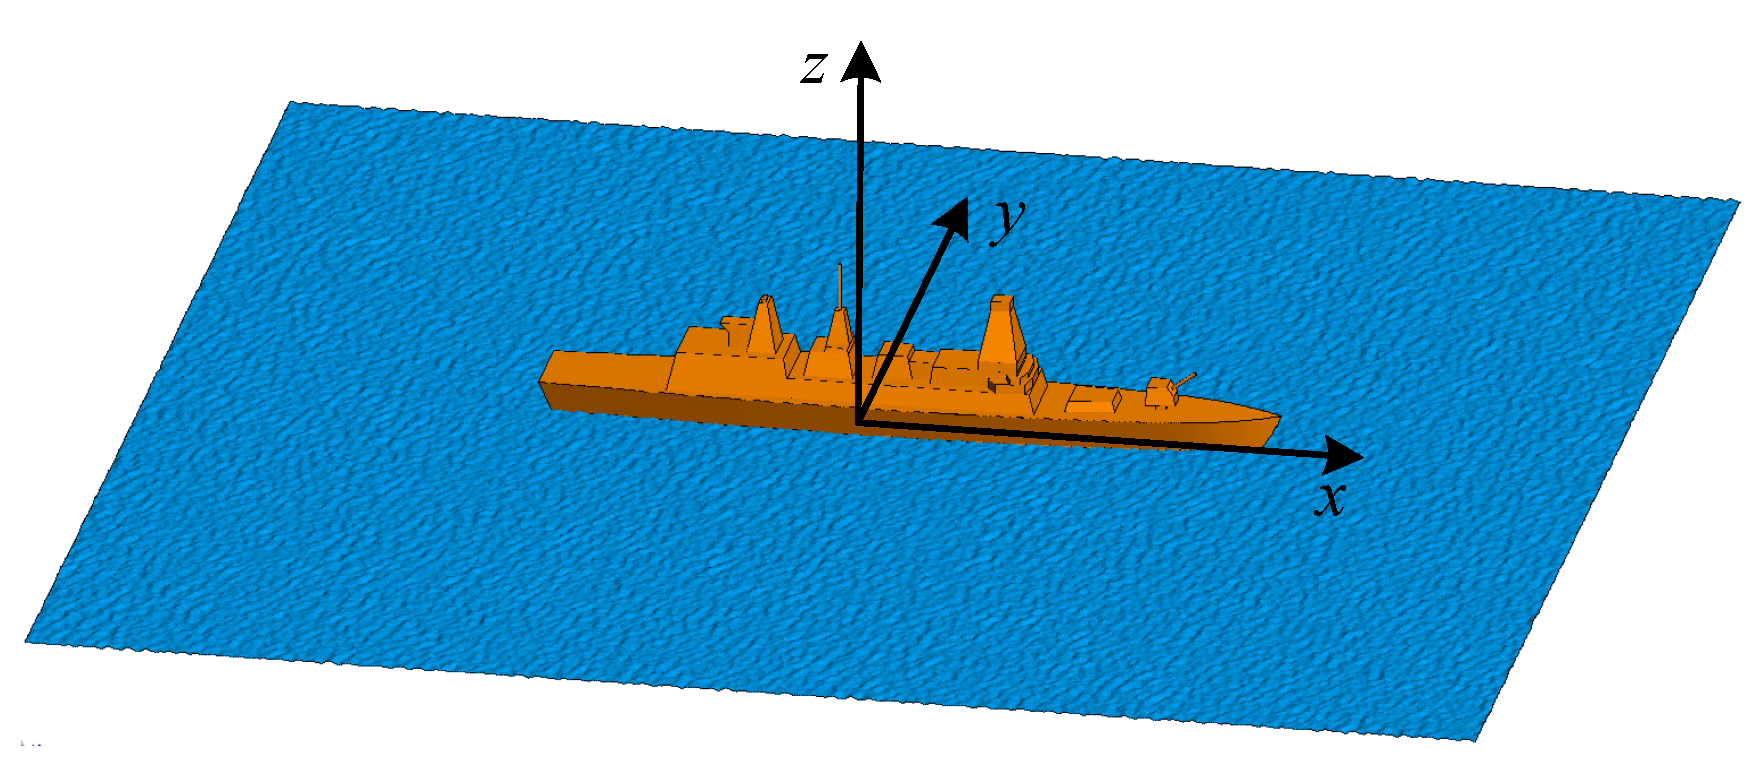
Next, we simulate the ISAR images of a ship-ocean scene, as shown in Figure 18. The ship’s size is 160 m × 20 m × 30 m. The size of the sea surface is 300 m × 300 m. The power spectrum of the sea surface is PM spectrum. The wind speed is 5 m/s. The relative dielectric constant of the sea is 55.9 37 j . The incident angle is θ 0 = 45 ° , and the center azimuth angle is φ 0 = 150 ° . The polarization is HH. The carrier frequency is f 0 = 10 GHz. The resolution is 0.3 m in both the range and azimuth.
Figure 19 shows the ISAR images generated using the total echo, the differential echo, the target echo, and the coupling echo, respectively. These images are normalized and plotted with a logarithmic scale. By comparing the differential image (Figure 19b) with the target image (Figure 19c), it can be found that the strong scattering points in the image are caused by the dihedral corner structure on the target. The size of the coupling image is larger than that of the target image due to the rough modulation of the sea surface and multiple bounces of the ray. In Figure 19d, due to the substantial coupling scattering contributions of the dihedral corner structure formed by the hull and the sea surface, the ship’s outline can be clearly seen from the coupling image. Due to the ship’s shielding to the electromagnetic wave, only one side of the ship can be shown in this image. Figure 20 shows the normalized ISAR images by using the LFM pulse and the FDSBR method. According to the comparison, the image in Figure 19a and the two images in Figure 20 are in perfect agreement.

4.3. Analysis of Efficiency and Accuracy

Table 2 presents the computation time of the images by using the modulating Gaussian pulse, the LFM pulse, and the FDSBR method. As it is shown, the computation time required for the imaging simulation using the modulating Gaussian pulse as the incident pulse is significantly less than that for the LFM pulse and the FDSBR method. The pulse width of the modulating Gaussian pulse is smaller than that of the LFM pulse under the same frequency bandwidth. Hence, the simulation time will be less. The imaging research based on the modulating Gaussian pulse, as presented in this paper, is a promising test for the imaging algorithm. Additionally, the TD method can also avoid the time-consuming frequency-sweep compared with the FD method, thus saving significant simulation time. As the size of the scene increases, the advantage of the modulating Gaussian pulse in computational efficiency becomes more significant.
Table 3 shows the similarity between the images under the modulating Gaussian pulse excitation and the images obtained by the other two methods. This similarity is quantified by the correlation coefficient shown in the following equation:
c o r r ( x , y ) = i ( x i x ¯ ) ( y i y ¯ ) i ( x i x ¯ ) 2 i ( y i y ¯ ) 2
The closer the correlation coefficient is to one, the more similar the two images become. As can be seen from Table 3, all similarities exceed 90%. The similarity between the modulating Gaussian pulse and the LFM pulse is close to one. This is because the matching filter used in this paper does not depend on the pulse. The images are nearly independent for both of the given pulse forms. The similarity between the results of modulating Gaussian pulse and the FDSBR method is slightly lower than that between the modulating Gaussian pulse and the LFM pulse. This is mainly caused by the difference between the imaging algorithm based on the FD echo and the imaging algorithm based on the TD echo, including the window function, FFT, and IFFT.

5. Conclusions

This paper proposes an accurate and efficient ISAR imaging method for the composite target-ocean scene based on the TDSBR method. The TDSBR method is used to obtain the TD electromagnetic scattering echoes of the composite target-ocean scene. Then the ISAR images are generated by performing demodulation, pulse compression, and the azimuth inverse fast Fourier transform on the scattering echo data. It is shown by a comparison with the precise full-wave method MLFMA that the performance of TDSBR can achieve good accuracy in simulating the scattering echo. Based on the echo expression, an image generation method is then proposed. This method includes echo demodulation, pulse compression, and the azimuth IFFT. To enhance efficiency, we replace LFM with a modulating Gaussian pulse and improve the matched filter to achieve pulse compression under a modulating Gaussian pulse excitation. Numerical examples verify the imaging accuracy and the efficiency of the proposed method.

Author Contributions

Conceptualization, G.G. and L.G.; methodology, G.G. and L.G.; software, G.G. and R.W.; validation, G.G., R.W., and W.L.; investigation, G.G. and L.L.; writing—original draft preparation, G.G.; funding acquisition, L.G. All authors have read and agreed to the published version of the manuscript.

Funding

This research was funded by the National Natural Science Foundation of China under grant 61871457/62071348/62101417, the Foundation for Innovative Research Groups of the National Natural Science Foundation of China under grant 61621005, and the National Natural Science Foundation of Shaanxi Province under grant 2018JQ6045.

Conflicts of Interest

The authors declare no conflict of interest.

References

  1. Cumming, I.G.; Wong, F.H. Digital Processing of Synthetic Aperture Radar Data: Algorithms and Implementation; Artech House: Norwood, MA, USA, 2005. [Google Scholar]
  2. Ozdemir, C. Inverse Synthetic Aperture Radar Imaging with MATLAB Algorithms; John Wiley and Sons: Hoboken, NJ, USA, 2012. [Google Scholar]
  3. Reigber, A.; Moreira, A. First demonstration of airborne SAR tomography using multibaseline L-band data. IEEE Trans. Geosci. Remote Sens. 2000, 38, 2142–2152. [Google Scholar] [CrossRef]
  4. Liu, H.C.; Jiu, B.; Liu, H.W.; Bao, Z. Superresolution ISAR imaging based on sparse bayesian learning. IEEE Trans. Geosci. Remote Sens. 2014, 52, 5005–5013. [Google Scholar] [CrossRef]
  5. Sun, C.; Wang, B.; Fang, Y.; Song, Z.; Wang, S. Multichannel and wide-angle SAR imaging based on compressed sensing. Sensors 2017, 17, 295. [Google Scholar] [CrossRef] [PubMed] [Green Version]
  6. Huang, Y.; Liao, G.S.; Zhang, L.; Xiang, Y.J.; Li, J.; Nehorai, A. Efficient narrowband RFI mitigation algorithms for SAR systems with reweighted tensor structures. IEEE Trans. Geosci. Remote Sens. 2019, 57, 9396–9409. [Google Scholar] [CrossRef]
  7. Zheng, J.; Su, T.; Zhang, L.; Zhu, W.; Liu, Q.H. ISAR imaging of targets with complex motion based on the chirp rate–quadratic chirp rate distribution. IEEE Trans. Geosci. Remote Sens. 2014, 52, 7276–7289. [Google Scholar] [CrossRef]
  8. Zheng, J.; Su, T.; Zhu, W.; Zhang, L.; Liu, Z.; Liu, Q.H. ISAR imaging of nonuniformly rotating target based on a fast parameter estimation algorithm of cubic phase signal. IEEE Trans. Geosci. Remote Sens. 2015, 53, 4727–4740. [Google Scholar] [CrossRef]
  9. Shao, S.; Zhang, L.; Liu, H. High-resolution ISAR imaging and motion compensation with 2-D joint sparse reconstruction. IEEE Trans. Geosci. Remote Sens. 2020, 58, 6791–6811. [Google Scholar] [CrossRef]
  10. Wei, S.; Zhang, L.; Ma, H.; Liu, H. Sparse frequency waveform optimization for high-resolution ISAR imaging. IEEE Trans. Geosci. Remote Sens. 2020, 58, 546–566. [Google Scholar] [CrossRef]
  11. Bhalla, R.; Ling, H. ISAR image formation using bistatic data computed from the shooting and bouncing ray technique. J. Electromagn. Waves Appl. 1993, 7, 1271–1287. [Google Scholar] [CrossRef]
  12. Sui, M.A.; Xu, X.J. A Novel Procedure for high resolution radar signature prediction of near field targets. IEEE Trans. Antennas Propag. 2010, 58, 2981–2993. [Google Scholar] [CrossRef]
  13. Chen, H.; Zhang, M.; Zhao, Y.W.; Luo, W. An efficient slope-deterministic facet model for SAR imagery simulation of marine scene. IEEE Trans. Antennas Propag. 2010, 58, 3751–3756. [Google Scholar] [CrossRef]
  14. Zhao, Y.; Zhang, M.; Zhao, Y.W.; Geng, X.P. A bistatic SAR image intensity model for the composite ship-ocean scene. IEEE Trans. Geosci. Remote Sens. 2015, 53, 4250–4258. [Google Scholar] [CrossRef]
  15. Xu, F.; Wang, P. Analytical modeling of rough surface SAR images under small perturbation approximation. IEEE Trans. Geosci. Remote Sens. 2017, 55, 3694–3707. [Google Scholar] [CrossRef]
  16. Saxena, A.K.; Srivastava, K.V. Higher Order LOD-FDTD Methods and their numerical dispersion properties. IEEE Trans. Antennas Propag. 2017, 65, 1480–1485. [Google Scholar] [CrossRef]
  17. Shlager, K.L.; Schneider, J.B. A selective survey of the finite-difference time-domain literature. IEEE Antennas Propag. Mag. 1995, 37, 39–57. [Google Scholar] [CrossRef] [Green Version]
  18. Lynch, D.R.; Paulsen, K.D. Time-domain integration of the maxwell equations on finite elements. IEEE Trans. Antennas Propag. 1990, 38, 1933–1942. [Google Scholar] [CrossRef]
  19. Sayed, S.B.; Ülkü, H.A.; Bağcι, H. A stable marching on-in-time scheme for solving the time-domain electric field volume integral equation on high-contrast scatterers. IEEE Trans. Antennas Propag. 2015, 63, 3098–3110. [Google Scholar] [CrossRef]
  20. Sun, E.Y.; Rusch, W.V.T. Time-domain physical-optics. IEEE Trans. Antennas Propag. 1994, 42, 9–15. [Google Scholar]
  21. Zhou, X.; Cui, T.J. A closed-form representation of time-domain far fields based on physical optics. IEEE Antennas Wirel. Propag. Lett. 2012, 11, 965–968. [Google Scholar] [CrossRef]
  22. Ling, H.; Bhalla, R. Time-Domain ray-Tube Integration Formula for the Shooting and Bouncing Ray Technique; The University of Texas: Austin, TX, USA, 1993. [Google Scholar]
  23. Zhou, X.; Zhu, J.Y.; Yu, W.M.; Cui, T.J. Time-domain shooting and bouncing rays method based on beam tracing technique. IEEE Trans. Antennas Propag. 2015, 63, 4037–4048. [Google Scholar] [CrossRef]
  24. Guo, G.B.; Guo, L.X.; Wang, R. The study on near-field scattering of a target under antenna irradiation by TDSBR method. IEEE Access 2019, 7, 113476–113487. [Google Scholar] [CrossRef]
  25. Guo, G.; Guo, L.; Wang, R. ISAR image algorithm using time-domain scattering echo simulated by TDPO method. IEEE Antennas Wirel. Propag. Lett. 2020, 19, 1331–1335. [Google Scholar] [CrossRef]
  26. Guo, G.; Guo, L.; Wang, R.; Li, L. An ISAR imaging framework for large and complex targets using TDSBR. IEEE Antennas Wirel. Propag. Lett. 2021, 20, 1928–1932. [Google Scholar] [CrossRef]
  27. Fan, T.Q.; Guo, L.X.; Lv, B.; Liu, W. An improved backward SBR-PO/PTD hybrid method for the backward scattering prediction of an electrically large target. IEEE Antennas Wirel. Propag. Lett. 2016, 15, 512–515. [Google Scholar] [CrossRef]
Figure 1. Scattering from a composite target-ocean scene.
Remotesensing 14 01183 g001
Figure 2. The forward and backward ray-tracing technology.
Remotesensing 14 01183 g002
Figure 3. The incident and observation direction in the global coordinate system.
Remotesensing 14 01183 g003
Figure 4. Monostatic and bistatic scattering results from a composite cube-ocean scene. (a,b) Monostatic transient scattering field and wideband RCS of ( θ i , φ i ) = (45°, 0°); (c,d) Bistatic transient scattering field and wideband RCS of ( θ i , φ i , θ s , φ s ) = (45°, 0°, 45°, 180°).
Remotesensing 14 01183 g004
Figure 5. Monostatic and bistatic scattering results from a composite missile-ocean scene. (a,b) Monostatic transient scattering field and wideband RCS of ( θ i , φ i ) = (10°, 90°); (c,d) Bistatic transient scattering field and wideband RCS of ( θ i , φ i , θ s , φ s ) = (45°, 0°, 45°, 180°).
Remotesensing 14 01183 g005
Figure 6. Collecting radar returns at different look angles to form the cross-range profile.
Remotesensing 14 01183 g006
Figure 7. The geometric model of the dihedral corner reflector.
Remotesensing 14 01183 g007
Figure 8. The normalized transient scattering echoes and wideband results from the dihedral corner reflector at φ 0 = 0 ° . (a) Modulating Gaussian pulse excitation; (b) LFM pulse excitation; (c) Normalized wideband scattering fields.
Remotesensing 14 01183 g008
Figure 9. The ISAR images of the dihedral corner reflector containing multiple bounces. (a) θ 0 = 45 ° ; (b) θ 0 = 60 ° .
Remotesensing 14 01183 g009
Figure 10. The ISAR images at θ 0 = 45 ° by using LFM pulse and FDSBR method. (a) LFM; (b) FDSBR.
Remotesensing 14 01183 g010
Figure 11. The geometric model of a missile target.
Remotesensing 14 01183 g011
Figure 12. The normalized echoes and wideband results from the missile at φ 0 = 0 ° . (a) Modulating Gaussian pulse excitation; (b) LFM pulse excitation; (c) Normalized wideband scattering fields.
Remotesensing 14 01183 g012
Figure 13. The normalized ISAR images and profile maps of the missile target using different impulse functions and the FDSBR method. (a) Modulating Gaussian pulse excitation; (b) LFM pulse excitation; (c) FDSBR method.
Remotesensing 14 01183 g013
Figure 14. The geometric model of the composite missile-ocean scene.
Remotesensing 14 01183 g014
Figure 15. The normalized ISAR images of the composite missile-ocean scene at h = 3 m. (a) Total image; (b) Differential image; (c) Target image; (d) Coupling image.
Remotesensing 14 01183 g015
Figure 16. The normalized ISAR images of the composite missile-ocean scene at h = 5 m. (a) Total image; (b) Differential image; (c) Target image; (d) Coupling image.
Remotesensing 14 01183 g016
Figure 17. The normalized ISAR images of the missile-ocean scene by using the LFM pulse and FDSBR method. (a) LFM at h = 3 m; (b) FDSBR at h = 3 m; (c) LFM at h = 5 m; (d) FDSBR at h = 5 m.
Remotesensing 14 01183 g017
Figure 18. The geometric model of the composite ship-ocean scene.
Remotesensing 14 01183 g018
Figure 19. The normalized ISAR images of the ship-ocean scene. (a) Total image. (b) Differential image. (c) Target image. (d) Coupling image.
Remotesensing 14 01183 g019
Figure 20. The normalized ISAR images of the ship-ocean scene by using LFM pulse and FDSBR method. (a) LFM. (b) FDSBR.
Remotesensing 14 01183 g020
Table 1. Computation time comparison between TDSBR, FDSBR, and MLFMA.
Simulation ExamplesTDSBRFDSBR-IFFTMLFMA-IFFT
Figure 4a2.3 s11.4 s1.9 × 106 s
Figure 4c1.8 s10.9 s1.7 × 106 s
Figure 5a1.8 s9.2 s1.6 × 106 s
Figure 5c1.5 s9.1 s1.4 × 106 s
Table 2. Computation time comparison of ISAR images.
Simulation ExamplesCPU Time(s)
Modulating GaussianLFMFDSBRSpeed-Up
Dihedral corner3.16156.616.541:50:2
Missile target4.93141.79.271:29:1.9
Missile-ocean at h = 3 m401.811,49153771:28:13
Missile-ocean at h = 5 m399.611,22951551:28:13
Ship-ocean21314555,6212,299,5641:26:108
Table 3. Similarity between ISAR images.
Simulation ExamplesModulating Gaussian pulse
LFMFDSBR
Dihedral corner0.99930.9676
Missile target0.98960.9627
Missile-ocean at h = 3 m0.98680.9516
Missile-ocean at h = 5 m0.98660.9502
Ship-ocean0.98510.9467
Publisher’s Note: MDPI stays neutral with regard to jurisdictional claims in published maps and institutional affiliations.