Article

Evaluation of GPM IMERG Performance Using Gauge Data over Indonesian Maritime Continent at Different Time Scales

1
Department of Physics, Universitas Andalas, Padang 25163, Indonesia
2
Department of Physics, Universitas Gajah Mada, Yogyakarta 55281, Indonesia
3
Agency for Meteorology, Climatology and Geophysics of Republic Indonesia, Jakarta 10610, Indonesia
4
Department of Environment, Land and Infrastructure Engineering, Politecnico of Turin, 10129 Turin, Italy
5
Research Institute for Sustainable Humanosphere (RISH), Kyoto University, Gokasho, Uji, Kyoto 611-0011, Japan
6
Joint Center for Earth Systems Technology, University of Maryland Baltimore County, Baltimore, MD 21250, USA
*
Author to whom correspondence should be addressed.
Remote Sens. 2022, 14(5), 1172; https://doi.org/10.3390/rs14051172
Submission received: 25 January 2022 / Revised: 20 February 2022 / Accepted: 24 February 2022 / Published: 27 February 2022

Abstract

:
Accurate precipitation observations are crucial for water resources management and as inputs for a gamut of hydrometeorological applications. Precipitation data from Integrated Multi-Satellite Retrievals for Global Precipitation Measurement (GPM) (IMERG) have recently been widely used to complement traditional rain gauge systems. However, the satellite precipitation data needs to be validated before being widely used in the applications and this is still missing over the Indonesian maritime continent (IMC). We conducted a validation of the IMERG product version 6 for this region. The evaluation was carried out using gauge data in the period from 2016 to 2020 for three types of IMERG: Early (E), Late (L), and Final (F) from annual, monthly, daily and hourly data. In general, the annual and monthly data from IMERG showed a good correlation with the rain gauge, with the mean correlation coefficient (CC) approximately 0.54–0.78 and 0.62–0.79, respectively. About 80% of stations in the IMC area showed a very good correlation between gauge data and IMERG-F estimates (CC = 0.7–0.9). For the daily assessment, the CC value was in the range of 0.39 to 0.44 and about 40% of stations had a correlation of 0.5–0.7. IMERG had a fairly good ability to detect daily rain in which the average probability of detection (POD) for all stations was above 0.8. However, the false alarm ratio (FAR) value is quite high (<0.5). For hourly data, IMERG’s performance was still poor with CC around 0.03–0.28. For all assessments, IMERG generally overestimated rainfall in comparison with rain gauge. The accuracy of the three types of IMERG in IMC was also influenced by season and topography. The highest and lowest CC values were observed for June–July–August and December–January–February, respectively. However, categorical statistics (POD, FAR and critical success index) did not show any clear seasonal variation. The CC value decreased with higher altitude, but with slight difference for each IMERG type. For all assessments conducted, IMERG-F generally showed the best rainfall observations in IMC, but with slightly difference from IMERG-E and IMERG-L. Thus, IMERG-E and IMERG-L data that had a faster latency than IMERG-F show potential to be used in rainfall observations in IMC.

1. Introduction

Precipitation drives the hydrological cycle and has a great effect on human life. Variation in the amount and type of precipitations in each location will bring an impact on planning in water resources management, hydrology, agriculture, industry, environment, as well as disaster mitigation [1,2]. Since precipitation is the input of hydrological, weather, and climate models [3,4], an accurate measurement of the number and pattern of precipitations in an area is deemed important to obtain the accurate prediction results from these models.
One of the areas with the highest level of precipitation in the world is the Maritime Continent situated between the Indian Ocean and the Pacific Ocean. Most of the Maritime Continent area is covered by the sea and absorbs high levels of shortwave radiation, making this area to have a high rainfall throughout the year. The Maritime Continent area consists of several countries such as Indonesia, Malaysia, Singapore, and the Philippines. In the Maritime Continent, Indonesia is the country with the most extensive area—commonly known as the Indonesian maritime continent (IMC). IMC receives very high rainfall reaching above 5000 mm per year [5,6]. This is not only a great source of water but also causes the frequent occurrence of hydrometeorological disasters, followed by high economic losses. Therefore, accurate observations and estimations of precipitation in IMC area are urgently required.
Precipitation observations can be carried out directly and indirectly (remote sensing) [7]. The most accurate precipitation measurements are the ones made directly on the surface using a rain gauge [8], but such observations are merely limited to the installed locations [9]. Furthermore, rain gauge data are also subject to errors such as those induced from the instrument and observer [10,11]. The low number of rain gauge networks can cause random or systematic errors when interpolating over a large area [12,13]. This condition is also found in IMC where the rain gauge networks are still sparse [9]. Many factors can cause the limitations of rain gauge network, including: first, the uneven distribution of the population and the large number of uninhabited islands; second, the IMC area is located in the ring of fire, causing the IMC land to be dotted with many mountains and making it difficult for the installation of the rain gauge networks; third, the prevalence of sea in IMC area represents an obstacle in installing rain gauges. To cope with the lack of rain gauge network, indirect measurement from radar and simulation model can be the alternatives, but model observations are still unreliable [14], particularly in MC [15].
The most common indirect observation to measure precipitation is using ground-based radar or satellite products. The number of weather radars in IMC is still insufficient and does not cover the entire region. For this, precipitation from satellite observations represents the best choice. The use of precipitation data from satellite product is massively used for various applications [9,16,17]. The accessible observational data, minimum delays in data updates, and wide spatial coverage by satellite product have made its utilization more attractive compared to the surface radar. However, uncertainties and errors associated with satellite data limit their use in operational applications [18]. Hence, it is deemed necessary to validate the precipitation observation data from the satellite before their use.
There are multi-satellite precipitation products that are widely used, including Global Satellite Mapping of Precipitation (GSMaP) [19], Climate Prediction Center morphing technique (CMORPH) [20], Climate Hazards group Infrared Precipitation with Stations (CHIRPS) [21], Precipitation Estimation from Remotely Sensed Information using Artificial Neural Networks (PERSIANN) [22], and Tropical Rainfall Measuring Mission multi-satellite precipitation analysis (TMPA) [23]. In 2014, a new era began with the launch of the Global Precipitation Measurement (GPM) core satellite carrying the Ka- and Ku-Dual-frequency Precipitation Radar (DPR) and GPM Microwave Imager (GMI). The GPM core satellite observations have broader coverage, finer spatial-temporal resolution, and more accurate rainfall and snowfall estimations than TRMM [15,24,25,26,27,28,29]. One of the precipitation products of GPM is the Integrated Multi-satellite Retrievals for GPM (IMERG) [30,31]. It is based on observations of a constellation of more than 10 satellites equipped with passive microwave radiometers [32] that provide uniformly calibrated precipitation measurements every 2–4 h around the globe [33].
Although IMERG is a relatively new satellite product, such product has been used extensively [30,31,34]. In addition to the higher spatial-temporal resolution, IMERG provides three runs, to accommodate different user requirements for latency and accuracy, including IMERG Early (IMERG-E), IMERG Late (IMERG-L) and IMERG Final (IMERG-F). These three types of data are differentiated by the delay in data availability, with IMERG-E having a delay of 4 h, IMERG-L a delay of 12–14 h, and IMERG-F a delay of 2.5–3.5 months [30]. IMERG-E and IMERG-L data are the direct processing from satellites, while IMERG-F is a combination of processing satellite data and surface observation data by rain gauges from the Global Precipitation Climatology Center (GPCC) data base [35,36]. IMERG-E and IMERG-L data that are close to real time can be used for application with shorter latency requirements. In fact, even the same application—e.g., flood modeling—may have different latency requirements depending on the region.
The wide use of IMERG data has encouraged many researchers to assess the performance of these data. Most of the tests have been conducted by comparing the IMERG with TRMM multi-satellite precipitation analysis (TMPA) 3B42/3B42RT [15,24,25,26,27,28,29]. The results overall showed that IMERG was more accurate than TRMM. These studies also showed that the performance of the IMERG varied with the resolution of observations, altitude, rainfall intensity, and season. For the Maritime Continent area, several validation activities for IMERG use rain gauges and surface radar, such as in Malaysia [37,38], Singapore [25], the Philippines [38,39], and Indonesia [40,41]. Observations in Malaysia showed that IMERG underestimated precipitation for light rainfall (0–1 mm/day) and heavy rainfall (>50 mm/day), while overestimated it for moderate rainfall (1–50 mm/day) [37]. The same pattern has been also found in Indonesia [40,41]. The performance of IMERG in the Philippines showed that the correlation value between IMERG and rain gauge observations was found quite good for an integration time of 10 days and one month [39], and the same results were also found in Indonesia [40,41]. The observation of IMERG performance in Singapore showed good accuracy for monthly scale whereas moderate at the daily scale [25].
Although GPM-IMERG validation activities in Indonesia have been carried out, previous research was limited only to a small area with a short duration. Validation conducted in the IMC previously was limited to Bali Island from 2015 to 2017 [40] and from 2014 to 2019 [41]. The validated data type was IMERG version 4 (V04) where IMERG data is now in version 6 (V06). Additionally, the temporal resolution of the data validated in the previous study was daily. IMERG V06 validation for one observation point in Sumatra has been carried out by Helmi et al. [42] and Ramadhan et al. [43]. Thus, the existing validation activities are not able to assess the overall IMERG performance for the IMC area; a comprehensive validation for the entire IMC area is timely.
This study validated the IMERG performance in IMC using rain data from rain gauge observation for 5 years. All data types from IMERG-E, IMERG-L and IMERG-F version 6 (V06) were validated for different time scales including hourly, daily, monthly, and annual data. Although IMERG-F has undergone a gauge adjustment with GPCC data at a 1° monthly resolution, we still carry out monthly validation of IMERG-F in Indonesia as is often conducted in other regions, (e.g., [29,44]). GPCC, unfortunately, does not release information about which gauges they use, so we cannot know what percentage of our rain gauge overlaps with the GPCC product. However, gauge adjustment with GPCC data is highly dependent on the rain gauge density. At IMC, the number of rain gauges of GPCC is still very small [9]. Because our evaluation is at a scale finer than 1° monthly, there is therefore still information there even if gauge information is used to adjust IMERG-F.

2. Materials and Methods

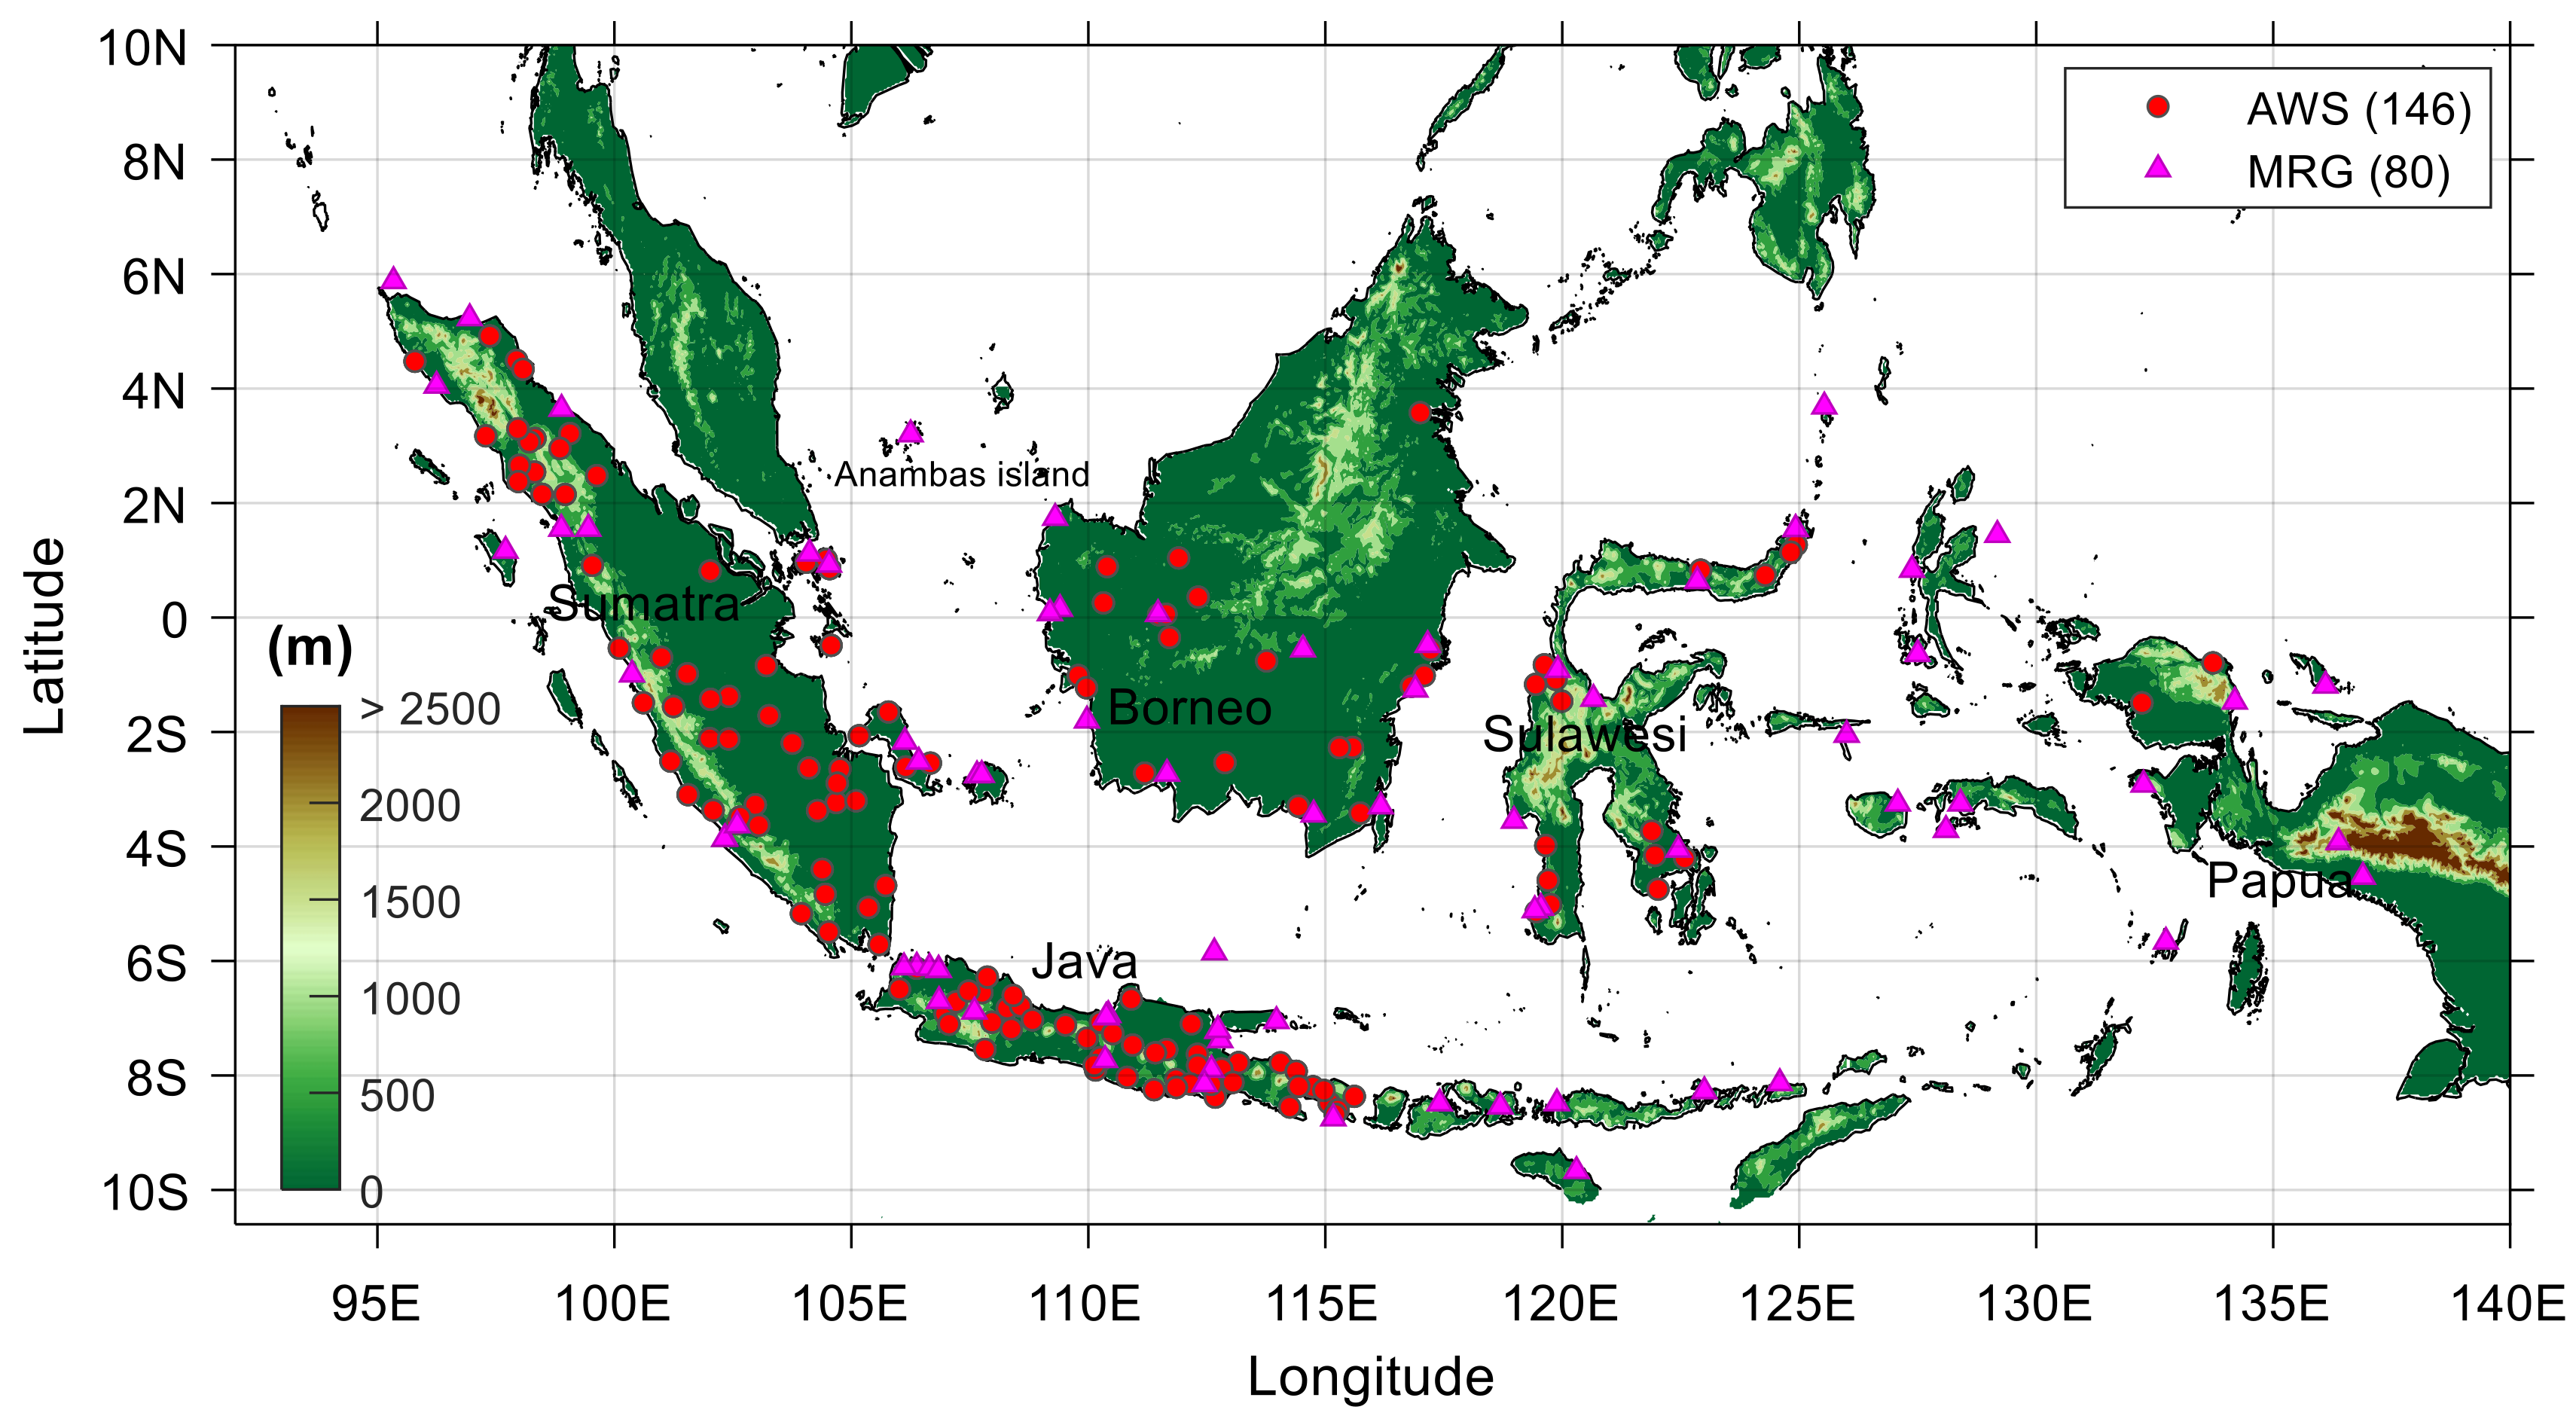
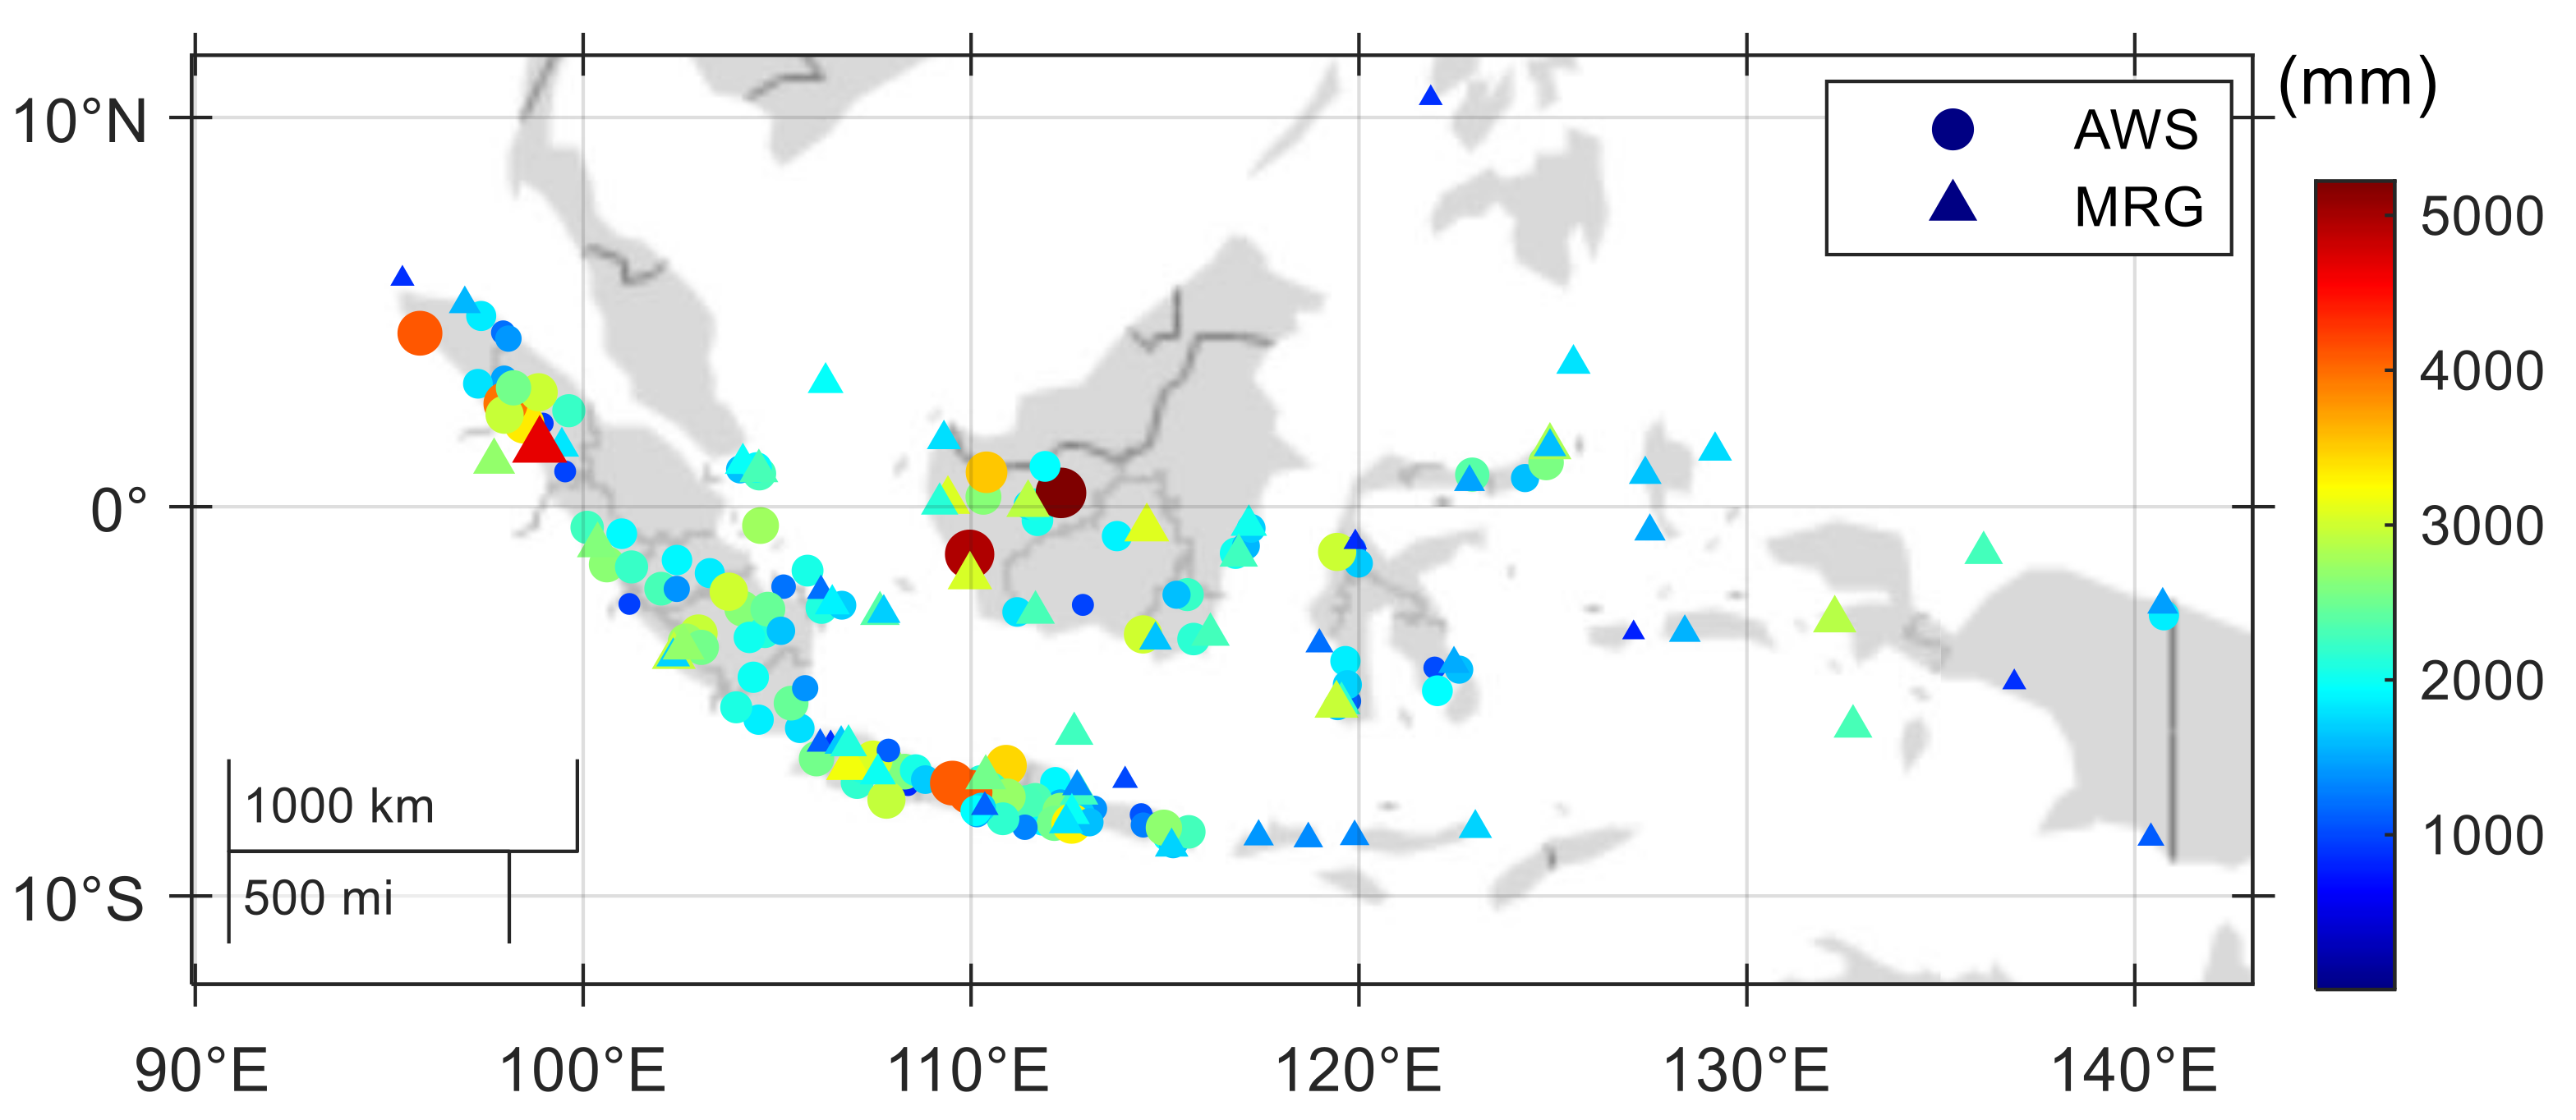
2.1. Study Area and Rain Gauge Data

The IMERG GPM is validated for the IMC, which spans from 92°E to 140°E longitude and 10°S to 10°N latitude (Figure 1). IMC is the largest archipelagic country in the world consisting of more than 17,000 islands and it has a very diverse topography from 0 m to 4884 m above sea level.
Rain gauge data used was the semi-automatic rain gauge (abbreviated MRG) and automatic rain gauge installed in weather observation station of the Indonesia Agency for Meteorology, Climatology, and Geophysics (BMKG). The semi-automatic rain gauge refers to Hellman type. Hellman rain gauge utilizes a floating gauge connected to the pen sleeve through a water draining mechanism via a siphon tube. This rain gauge has a funnel area of 200 cm2. Rainfall data are recorded on millimeter block paper mounted on a drum under the Hellman rain gauge funnel. The designation of the pen on the paper corresponds to the volume of water that enters the tube. If the pen has pointed to the number 10 mm, then the water in the tube will come out through the siphon tube and return to 0 mm [45]. The automatic rain gauge used was the automatic tipping bucket integrated in the Automatic Weather Station (AWS). AWS measures rainfall with an accuracy of 0.2 mm [46]. An automatic rain gauge that was not equipped with a weather station sensor was also used (called as ARG in the BMKG database). Because the rain sensors of ARG and AWS are the same, these two instruments are grouped as AWS only in this study. Figure 1 shows the location of each rain gauge. The MRG data used had an observation resolution of 1 h, while the AWS observation resolution was within 10 min. The data used were in a 5-year range from January 2016 to December 2020. BMKG operates many rain gauges throughout Indonesia, especially AWS, which is targeted as a substitute for all conventional observations, including MRG. However, only 146 AWS and 80 MRG stations have a fairly good record of observations during the 2016–2020 period. Of these, neither AWS nor MRG is in the same location, so we cannot compare the performance of these two types of rain gauges. However, Wicaksana et al. [45] showed that rainfall observations from AWS and MRG were in excellent agreement, with a correlation coefficient of 0.98. AWS and MRG data have been used in several studies in Indonesia [6,17,47].
Figure 1. The location of the rain gauge station used. MRG shows the semi-automatic rain gauge and AWS indicates the automatic rain gauge. The elevation data were taken from a 15 arc-second grid released by the General Bathymetric Chart of the Oceans (GEBCO) [48].
Remotesensing 14 01172 g001
A rigorous quality control procedure was carried out to ascertain the suitability of the rain gauge data used for validating GPM-IMERG. The validation process carried out is the same as that conducted by Ramadhan et al. [47]. Missing data or outliers were not included as IMERG validation data. Errors in the instrument and by the observer can cause missing data and outliers in rain gauge data [10,11]. Some outliers were identified based on the hourly rainfall observed at each observation station. If necessary, we consulted with the BMKG staff directly to ascertain whether there were errors in data entry by the operator. In some rain gauge stations, the process of transferring data from the station to the online data base is performed manually, so there is a potential for operator error. Evaluation of data quality starts from the smallest observation resolution of each rain gauge to annual rainfall. Only data that were totally complete for 24 h time range were used for daily validation. For monthly and annual data, we used rain gauge data with the availability of monthly and annual observation above 90%. Data availability percentage was the ratio of recorded samples to the total number of samples that would have been recorded if there were no measurement failures during a specific time scale. For monthly and annual data, it was difficult to acquire data availability of 100% due to several factors such as an interrupted power source, the process of transferring data from the logger, the small capacity of the data logger, and other factors [49]. We only used MRG data for the annual assessment as only two AWS stations had annual data availability above 90% during 2016–2020.

2.2. GPM IMERG Precipitation Products

This study validated IMERG data version 6 (V06). GPM IMERG produces precipitation data with temporal resolution up to 30 min and a spatial resolution of 0.1° × 0.1° [30]. In order to merge passive microwave (PMW) observations, a morphing process of movement vector data is carried out using water vapor data from numerical models on IMERG V06 [30]. In the latest version of IMERG V06 data, the numerical models used to determine the motion vector are Goddard Earth Observing System (GEOS), Forward Processing (FP) [50] and Modern-Era Retrospective Analysis for Research and Applications, version 2 (MERRA-2) [51].
This study validated the observations of precipitation from the IMERG-E, IMERG-L, and IMERG-F, each of which used a different numerical model. The GEOS model was used on the IMERG-E and L, while the MERRA-2 model was used on the IMERG-F. IMERG-E uses a forward morphing scheme, while IMERG-L and F use a forward and backward morphing scheme, but the IMERG-F data morphing process was corrected using monthly rainfall data of GPCC [52]. IMERG-E and L are the near real time data with a delay of 4 and 12 h on IMERG V06 that can be used for weather prediction, early detection of potential disasters, or geological monitoring. IMERG-F V06 has a delay of 2.5 months, and it can be used for agricultural forecasting, drought monitoring, and hydrological modeling [52]. In the IMERG-F data, there are two types of data, i.e., PrecipitationCal (with rain gauge adjustment) and PrecipitationUnCal (without rain gauge adjustment). The gauge adjustment is conducted by correcting the satellite-only estimate (PrecipitationUnCa) to the GPCC Monitoring Product, which is provided at a 1° monthly resolution via multiplicative ratios. The ratios are then applied to the 0.1° half-hour satellite-only field to get the final gauge-adjusted estimates (PrecipitationCal). The details of this process can be found in Sec. 3.8 of the Algorithm Theoretical Basis Document [53]. This study used PrecipitationCal in that several previous studies have shown that PrecipitationCal is better in measuring the surface rainfall [31,54]. Although IMERG-F has undergone a gauge adjustment with GPCC data at a 1° monthly resolution, our evaluation is at a scale finer than 1° monthly, therefore, there is still merit in this validation. The degree of overlap of our rain gauge with the GPCC cannot be determined because GPCC does not release information about which gauges they use. However, the number of rain gauges of GPCC is still very small in the IMC [9].
The comparison between IMERG and rain gauge was carried out using a point-to-pixel grid point approach as performed in previous studies [55,56]. One pixel of IMERG data represents precipitation in 0.1° × 0.1° area, so point to pixel matching (rain gauge observation and corresponding satellite estimates) was carried out within ±0.05° from the grid point of IMERG data. The rain gauge point observations, which are closest to the grid point in the satellite grid (less than 0.05 degrees off the grid points), are evaluated [56]. The pixel from the IMERG Grid used in this study had at least 1 rain gauge observation point in it. If in one pixel there were more than one point of the same type of rain gauge (MRG or AWS), then the amount of rainfall from the rain gauges would be averaged. In addition, as the lowest rainfall that can be observed by the rain gauge is 0.2 mm/h, the lowest value considered as rain from the two observing systems is set at 0.2 mm/h. For daily data, the threshold for wet days (rain) is set if the rainfall is at least 1 mm/day, as used in several previous studies [27,57].
Figure 2 shows the examples of the IMERG products time series of four different station locations. The station ID (located above sea level) as shown in Figure 2 were 96071 (328 m above sea level/ASL), 96581 (2 m ASL), 150010 (43 m ASL), and 150146 (184 m ASL). Rain gauge (AWS and MRG) and IMERG captured hourly and daily precipitation temporal trend, which is consistent with a previous study in West Sumatra [42].

2.3. Error Analysis of IMERG Products

The performance of IMERG’s precipitation measurement was analyzed by two types of tests: general assessment (continuous statistical metrics) and precipitation detection capability (categorical statistical metrics). The assessment was carried out for several temporal variations, namely yearly, monthly, daily, and hourly. As the influence of seasons is very strong on rainfall in Indonesia [58,59], validation was also carried out for seasonal variations by dividing monthly rainfall data into four seasons, including December–January–February (DJF), March–April–May (MAM), June–July–August (JJA), and September–October–November (SON). DJF referred to the peak of monsoon wind movement from Asia to Australia, while JJA referred to the peak of monsoon wind movement from Australia to Asia. MAM and SON themselves referred to a time of transition from the monsoon movement of the Asian and Australian continents [58,60]. The effect of topography on IMERG performance was also carried out as performed in previous studies [7,61,62]. Both data were processed in Coordinated Universal Time (UTC).
As shown in Table 1, there were 3 kinds of continuous statistical metrics used, including Pearson correlation coefficient (CC), Root Mean Square Error (RMSE), and Relative Bias (RB) [63,64]. This test aimed to quantitatively compare the performance of IMERG observations relative to the MRG and AWS rain gauges on the surface used as a reference. CC was used to evaluate the level of linear correlation between IMERG and the rain gauge. RMSE was used to measure the average absolute error magnitude of IMERG. The smaller the RMSE value obtained, the smaller the error of the IMERG measurement compared to the rain gauge. The RB showed a systematic bias from satellite observations compared to the rain gauge. The positive RB value indicated that IMERG measured the rainfall higher, whereas a negative RB value indicated that IMERG measured lower than the rain gauge.
Categorical statistical metrics were performed using 3 statistical metrics: Probability of Detection (POD), False Alarm Ratio (FAR), and Critical Succession Index (CSI) [65]. These three statistical variables had the values ranging from 0 to 1. POD represented the ratio of precipitation events detected by IMERG correctly to the actual total precipitation. FAR, represented the ratio of events without precipitation but detected as precipitation by IMERG to the actual total incidence. CSI, also known as the threat score, described the overall ratio of rainfall events detected correctly by the IMERG products. The perfect score for POD and CSI was 1 while the perfect score for FAR was 0.

3. Results

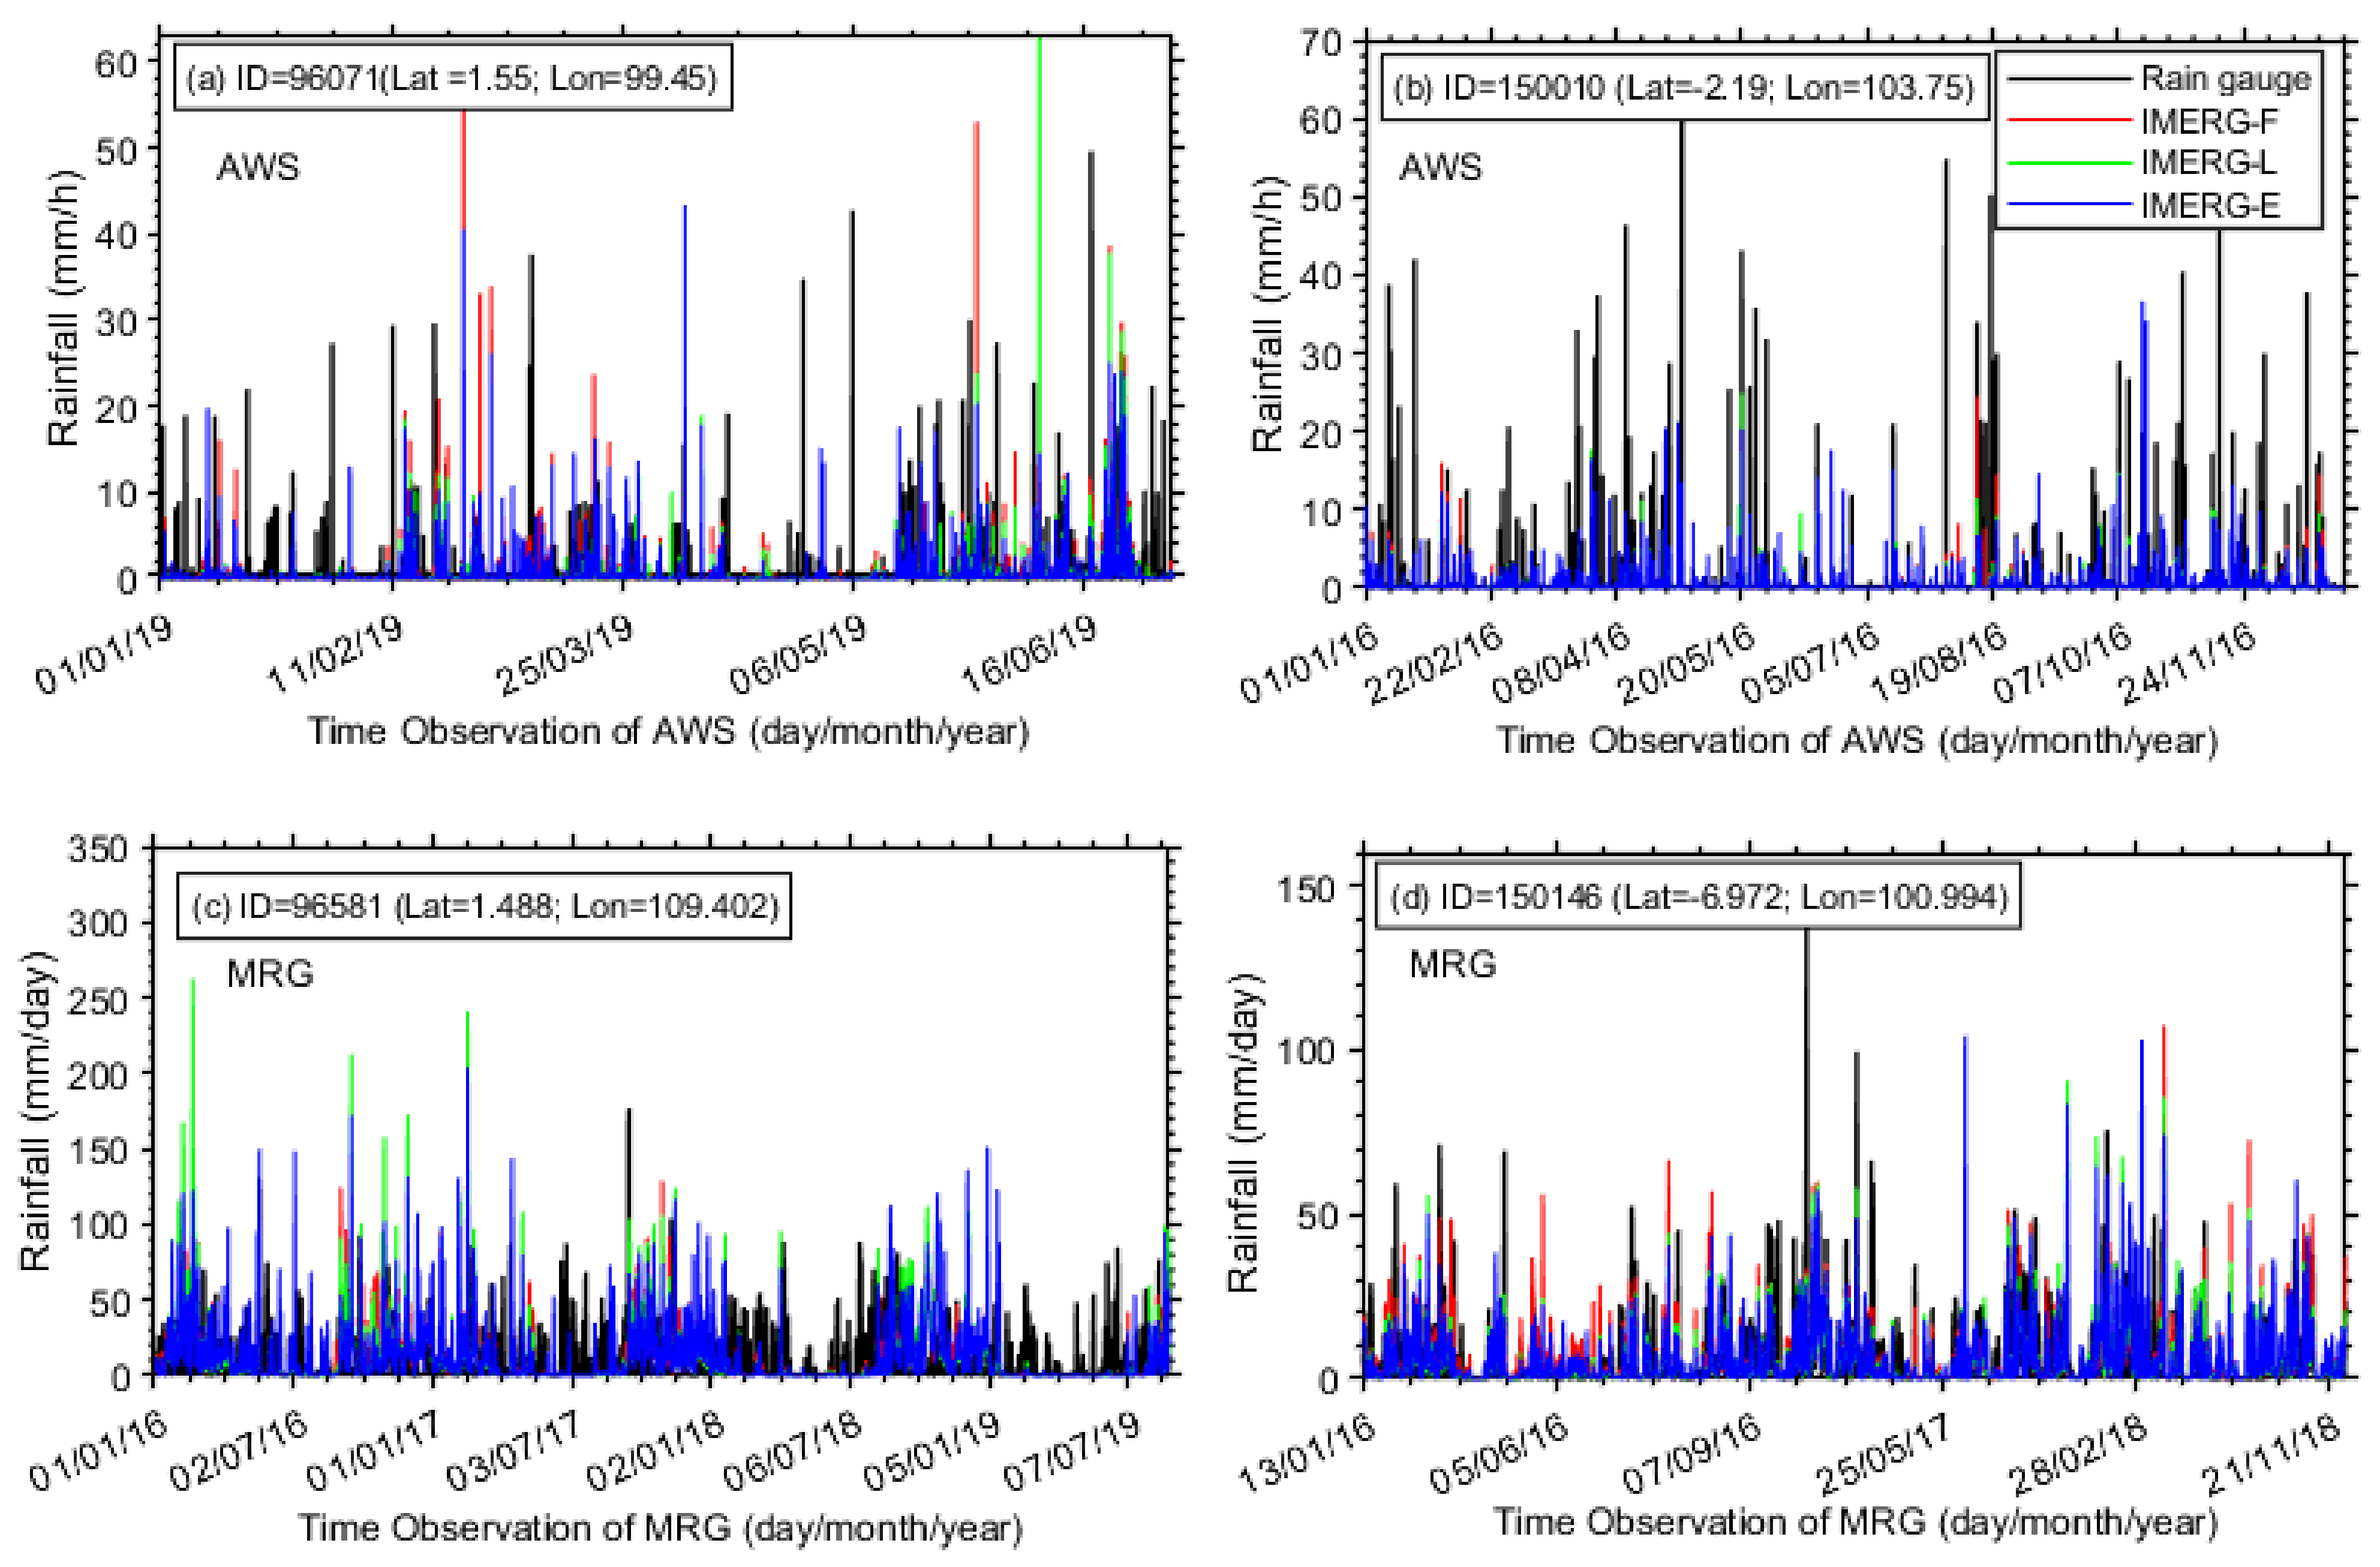
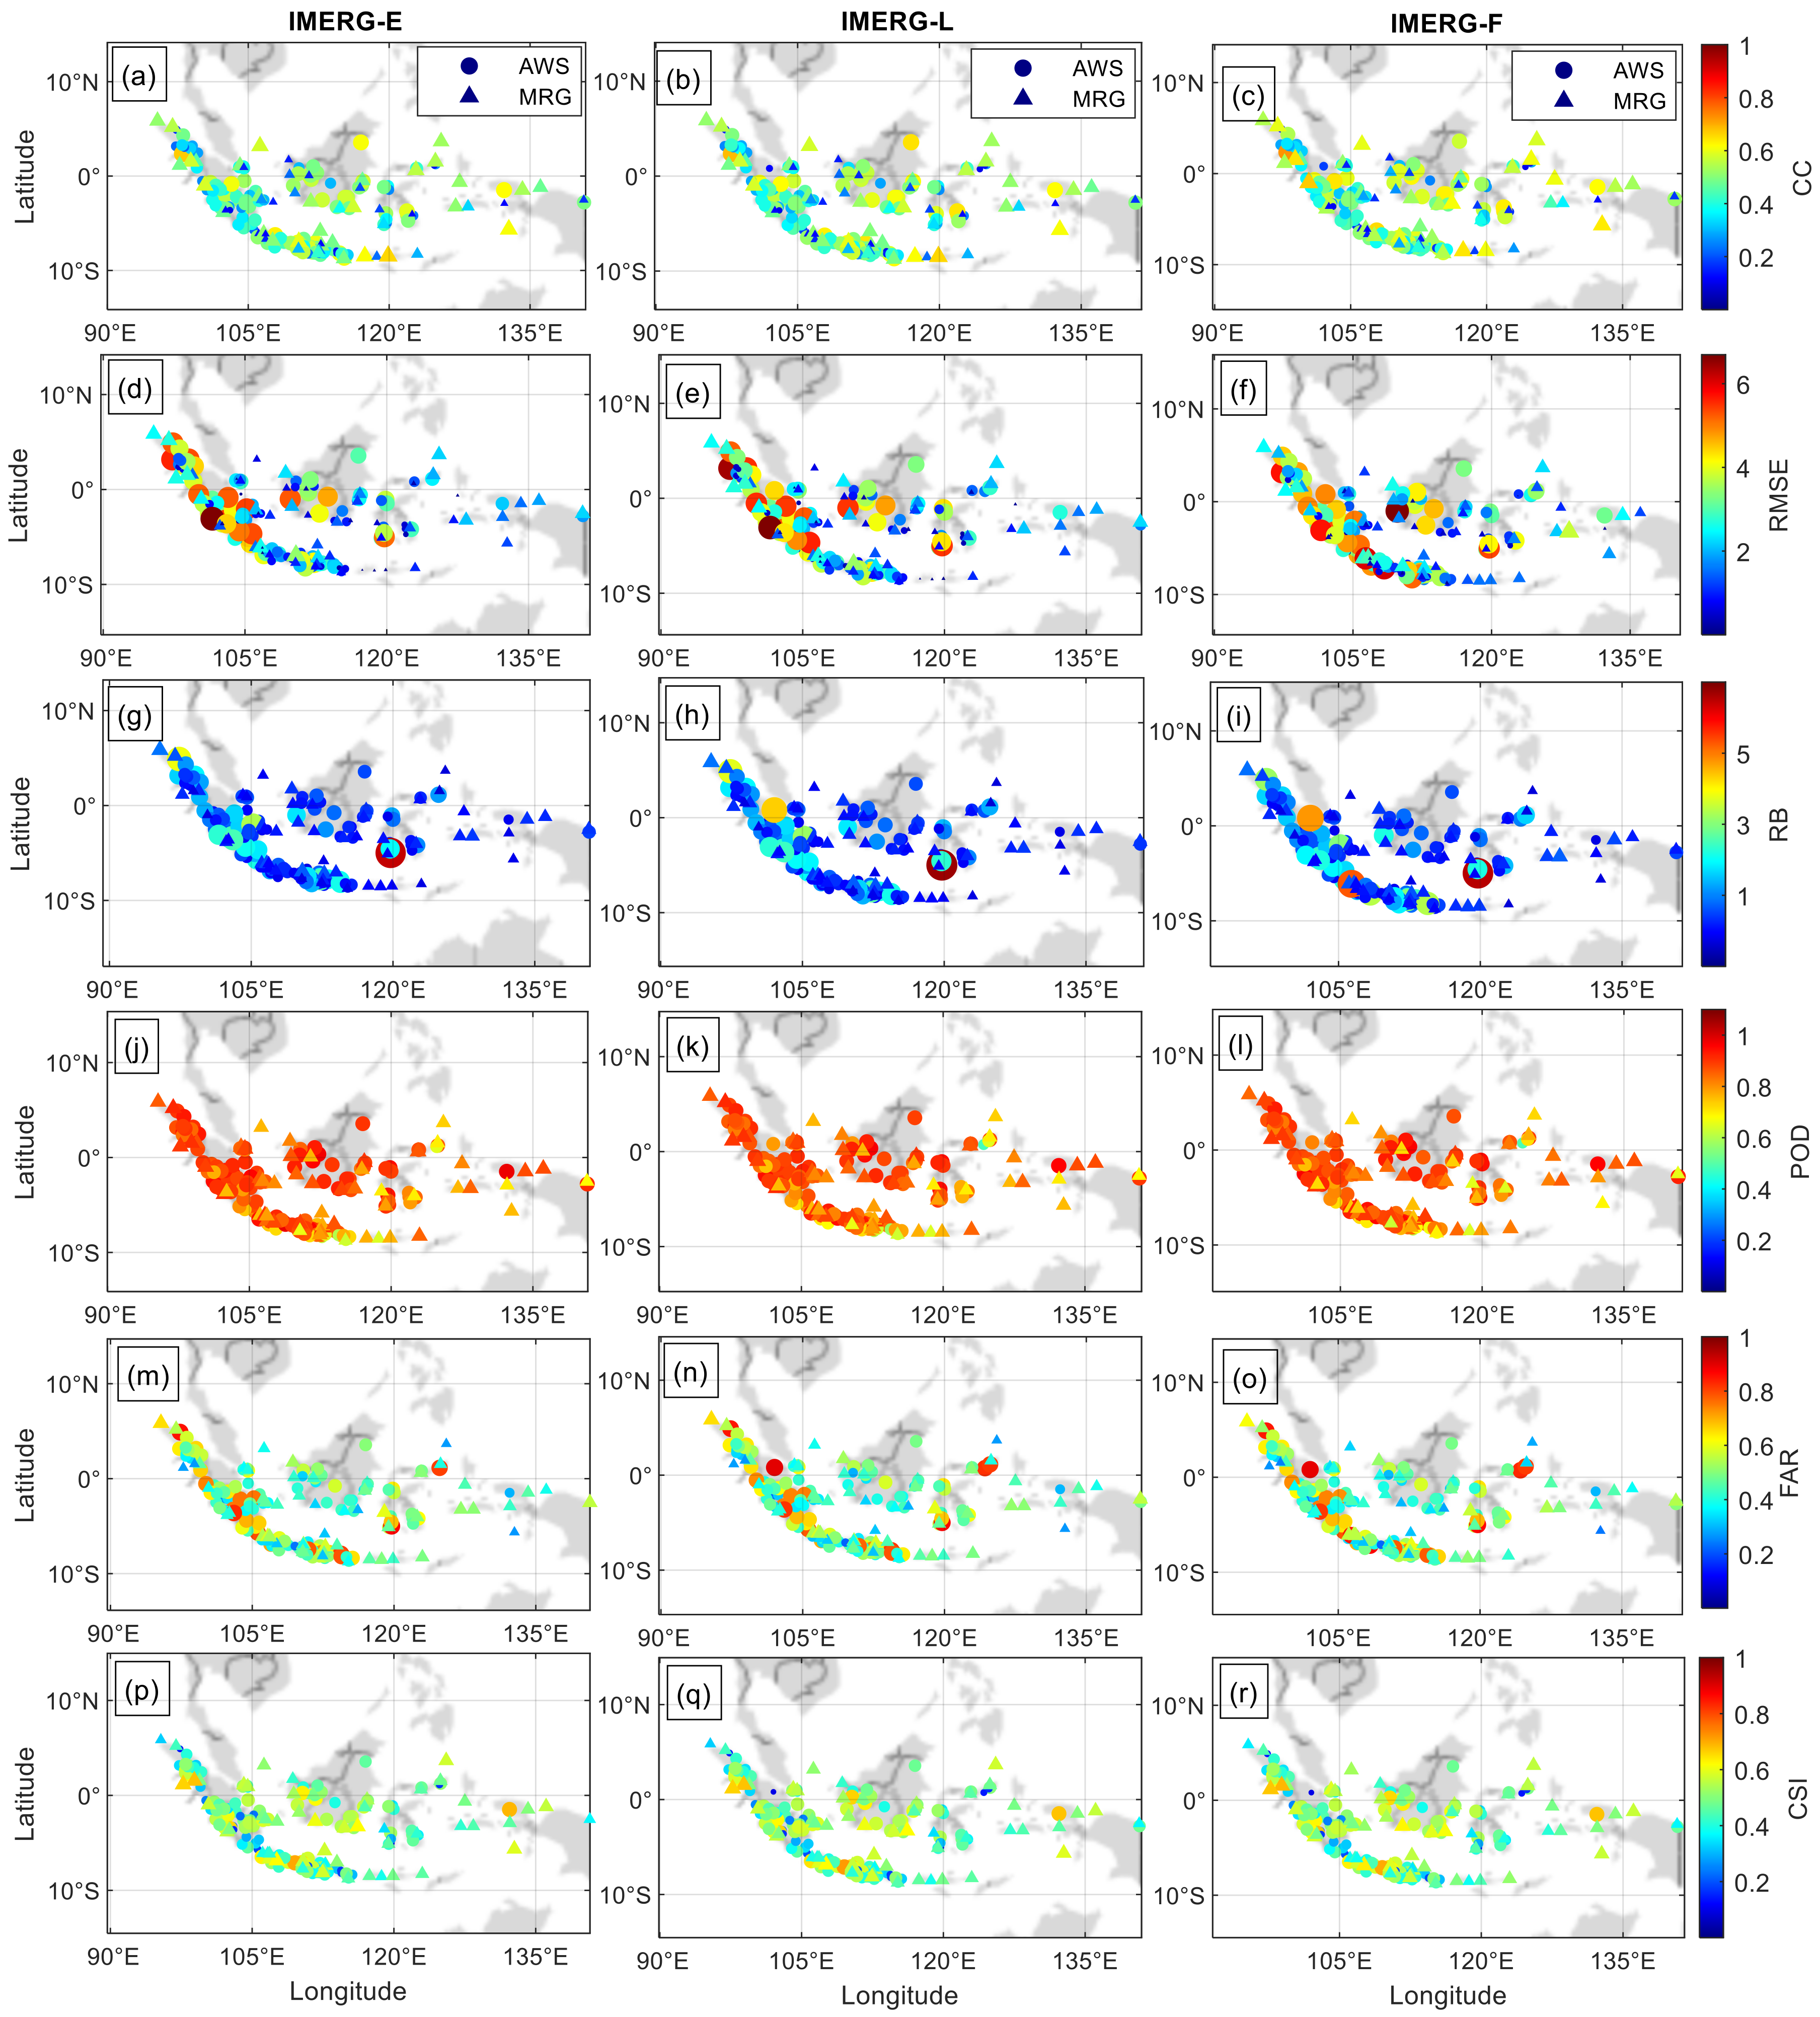
3.1. Hourly Assessment

The validation of hourly satellite rainfall products is challenging data [66]. For the Maritime Continent area itself, the validation of rainfall in hourly resolution has never been done, with the highest temporal resolution validated so far in Maritime Continent being daily. The accuracy of hourly rainfall data is critical for IMC in view of the dominant diurnal variation of rainfall in this area [5,17,67].
Figure 3 shows the spatial variation of each statistical quantities for the entire IMC regions. The rainfall correlation between IMERG and MRG data was found very low for all stations (CC < 0.2). On the other hand, the correlation between IMERG and AWS showed a much better value. Approximately 25.2%, 16.8%, and 19.3% of AWS stations showed the correlations between 0.3 and 0.5 for the IMERG-E, IMERG-L, and IMERG-F observations, respectively (Figure 3a–c). The maximum correlation values of hourly data validated using AWS are 0.45 (IMERG-E), 0.49 (IMERG-L), and 0.48 (IMERG-F).
In general, IMERG overestimated the hourly rainfall in IMC area as seen from the average RMSE (Figure 3d–f) and RB (Figure 3g–i). RB was positive as also observed for daily, monthly, and yearly data, as discussed in next sections. The mean RB values between IMERG and AWS were 17.4% (IMERG-E), 16.0% (IMERG-L), and 19.6% (IMERG-F), while with MRG it was 15.4% (IMERG-E), 12.8% (IMERG-L), and 17.9% (IMERG-F). The overestimate of the hourly data was followed by a relatively small RMSE value with the largest values around 0.18 mm/h (MRG) and 0.42 mm/h (AWS). Although most stations showed that IMERG overestimated rainfall, 35.4% of MRG and 41.8% of AWS stations showed that IMERG underestimated it. The dominance of the overestimated value from the observations of hourly rainfall found in this study was consistent with the pattern of overestimation often found from IMERG observations [15,42,67,68]. From all continuous statistical quantities, it can be seen that the accuracy of hourly rainfall observations from IMERG at IMC still needs to be improved.
Categorical statistical metrics showed a diversified picture across the IMC (Figure 3j–r). The highest (average) values of POD between IMERG and MRG data were 0.44 (0.29), 0.48 (0.30), and 0.48 (0.30) for IMERG-E, IMERG-L, and IMERG-F, respectively. AWS gave the better scores with the highest POD values (average) of 0.82 (0.59), 0.84 (0.62), and 0.85 (0.63) for IMERG-E, IMERG-L, and IMERG-F, respectively. This POD value was consistent with the CC value between IMERG and AWS data that were also higher than the MRG. Thus, IMERG is quite good at detecting the rain events in hourly resolution for the IMC region. Although the ability to detect rain events was quite good (from the POD value), the error in detecting rain events was also quite large as illustrated by the FAR value. The minimum FAR values from the hourly data were 0.82 (MRG) and 0.48 (AWS). The average FAR value of the hourly data between IMERG and MRG was 0.90 (IMERG-E, L, F), while, when compared to AWS, it was 0.69 (IMERG-E), and 0.68 (IMERG-L, F). A high FAR value has caused a low CSI value of ~0.08 (MRG) and ~0.26 (AWS). All categorical statistical metrics values indicated that the accuracy of the IMERG data still needs an improvement in the observation of rainfall over time at IMC, as also seen from the continuous statistical test. Although IMERG’s ability is good in observing rain events (from the POD value), IMERG tends to over predict rain occurrences (high number of false alarms). This behavior of IMERG at hourly scale has also been reported for studies over Canada [68], Brazil [69] and mainland China [70].

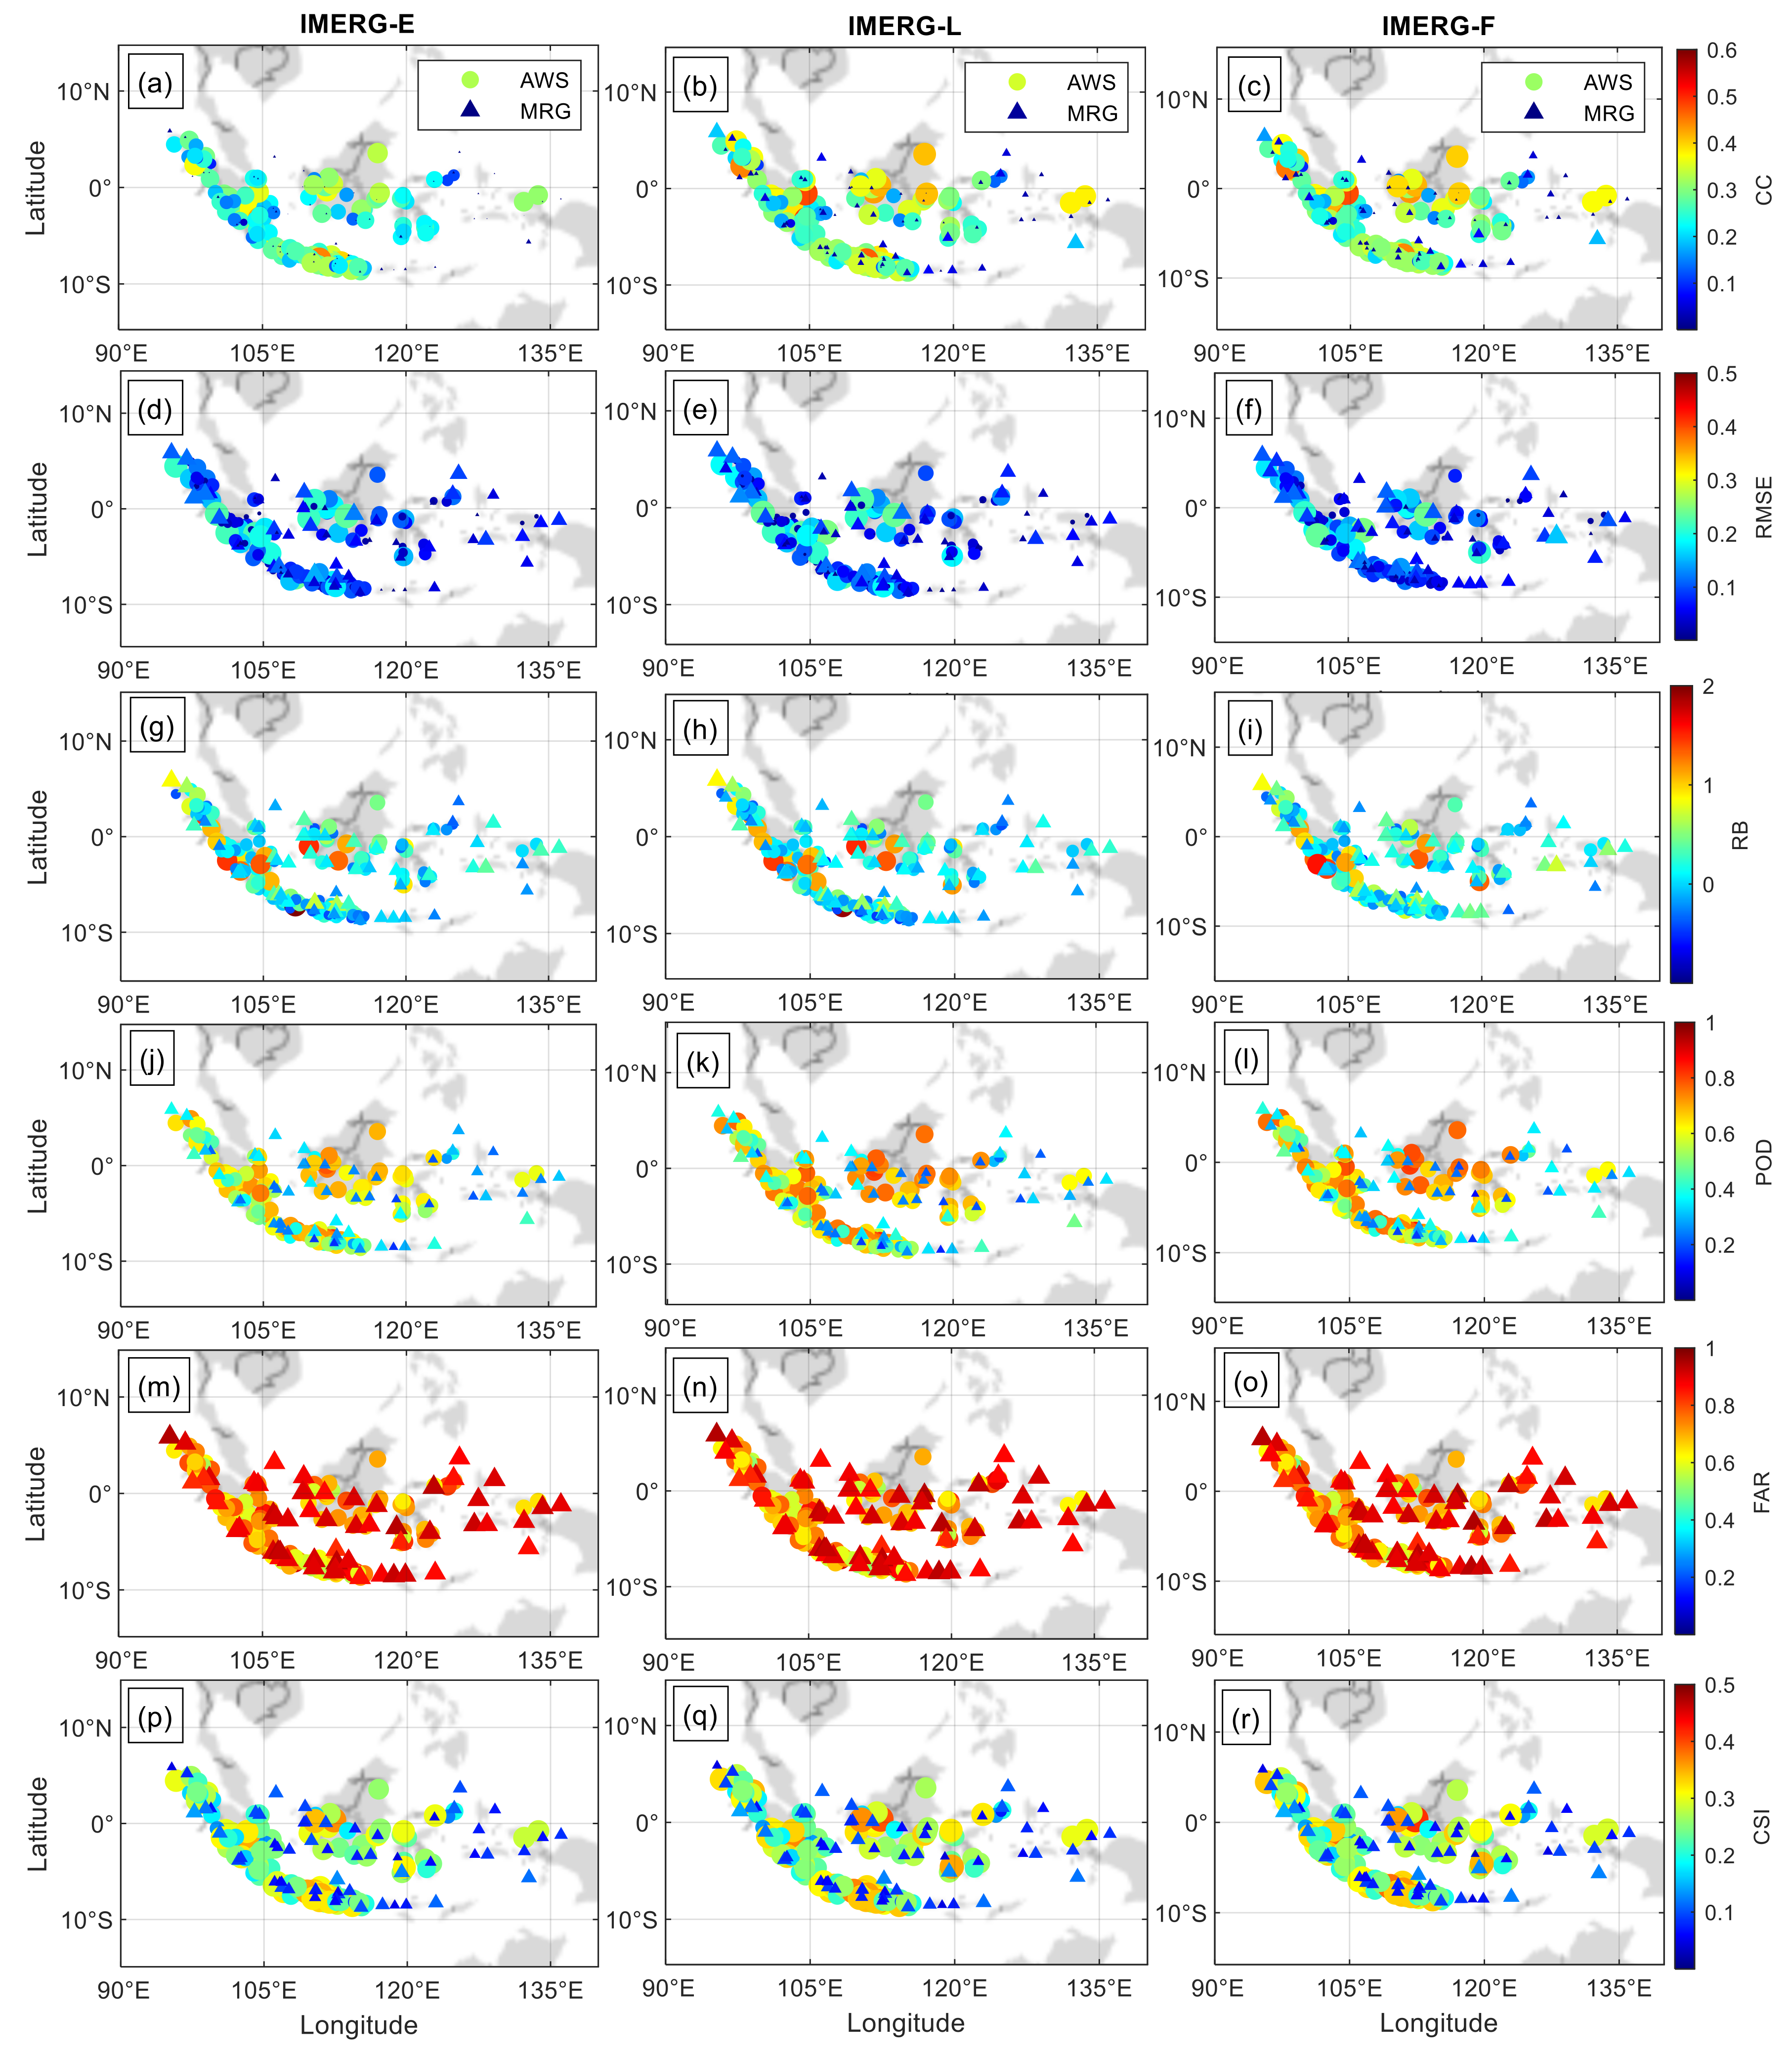
3.2. Daily Assessment

The validation of daily rainfall is critical since daily rainfall data provide the input to hydrological models [71]. However, in areas with complex terrain such as in the IMC, daily rainfall observation using satellites tends to be less reliable, as seen in Bali, with poor correlation (CC = 0.32) between the IMERG-F observation and the rain gauge [40]. Therefore, we attempted to see the performance of IMERG in measuring daily rainfall for the entire IMC regions.
Figure 4 shows the distribution of statistical quantities from daily rainfall observation. Overall, the average CC value for daily data was in the low correlation category (0.3–0.5) (Figure 4a–c). The correlation between IMERG and MRG showed average CC values around 0.39, 0.40, and 0.41 for IMERG-E, IMERG-L, and IMERG-F. Furthermore, IMERG and AWS showed the averages of CC at 0.43, 0.43, and 0.44 for IMERG-E, IMERG-L, and IMERG-F, respectively. Though the average CC value from IMERG showed a poor correlation, some stations showed a moderate correlation value (0.5–0.7). Approximately 40.7%, 40.7%, and 45.8% of MRG stations showed moderate CC for IMERG-E, IMERG-L, and IMERG-F with the maximum CC values of 0.66, 0.67, and 0.68, respectively. On the other hand, 30.5%, 34.6%, and 38.8% of AWS stations showed moderate CC for IMERG-E, IMERG-L, and IMERG-F, respectively. The CC values of the two types of rain gauge are almost the same. The maximum daily CC values obtained by IMERG-E and IMERG-L, and IMERG-F, when compared to AWS, were 0.67, 0.69, and 0.72, respectively. The rain gauge station with the highest CC is located at 2.37°N, 97.97°E with the elevation of 33 m ASL. Thus, IMERG, specifically IMERG-F, shows potential in observing daily rainfall in IMC.
Most stations showed that the IMERG overestimated daily rainfall (Figure 4d–i). Approximately 66.1 (86.3)%, 64.4 (84.2)%, and 69.5 (89.6)% of AWS (MRG) stations showed overestimated values for IMERG-E, IMERG-L, and IMERG-F, respectively. The overestimated value of the daily IMERG data was followed by a RMSE value with a maximum value of 3.80 mm/day (MRG) and 6.90 mm/day (AWS). The continuous statistical tests overall showed that the daily rainfall observations using IMERG at IMC still needs to be improved. The accuracy of daily rainfall observations, however, is still better than some other satellite rainfall data (GSMaP and CHRIPS) in IMC [40]. Therefore, IMERG daily rainfall data observations can be used as an alternative to replace rain gauge data in places where there is no rain gauge network available in IMC.
The ability of IMERG to detect daily rain events was also observed from categorical statistical metrics. POD values from all stations showed fairly similar and good values for the entire IMC region (Figure 4j–l). The average POD values of all stations were 0.81 (IMERG-E), 0.80 (IMERG-L), and 0.81 (IMERG-F) using MRG, and 0.87 (IMERG-E), 0.85 (IMERG-L), and 0.86 (IMERG-F) using AWS. Thus, on average, more than 80% of daily rainfall events in IMC could be detected by the three types of IMERG. However, the good ability of IMERG to detect daily rainfall was accompanied by a fairly high FAR value. The average FAR value for all stations was almost equal with FAR values from AWS equal to ~0.50 and from MRG equal to ~0.43. This showed that IMERG still often misses daily rain events. This pattern was also observed in the evaluation of IMERG performance in Bali [40]. The FAR value of daily data in IMC was found higher than observations in Singapore [25] and Malaysia [37]. This was probably due to the more complex orography. Furthermore, the POD and FAR values were not much different for the three types of IMERG causing the CSI values to be almost similar, i.e., ~0.50 (MRG) and ~0.45 (AWS). Furthermore, this observation showed that the three types of IMERG did not show a robust difference in their ability to detect daily rainfall events.

3.3. Monthly Assessment

For the monthly assessment, we used 120 AWS stations and 64 MRG stations, all with a percentage of data availability > 90%. Monthly observation of rainfall showed a good correlation for all IMERG observations (Table 2) with the CC value of 0.7. This was similar to the one obtained in Bali [40] and in Malaysia [37]. The IMERG data showed a better monthly correlation when compared to the MRG than compared to AWS, especially for IMERG-F.
The best (lowest) correlation of the monthly assessment was observed in the IMERG-F (IMERG-E) data when compared to the MRG with the CC value of 0.79 (0.71). Thus, IMERG-F showed a better ability to determine the monthly rainfall in IMC. For AWS, the correlation values for the three IMERG data types were found to be almost equal. IMERG overestimated monthly rainfall in IMC as indicated by a positive RB value, when compared to MRG and AWS. This condition was consistent with the one found in Bali [40]. The same pattern was also found in the Maritime Continent region, such as in Singapore [25] and Malaysia [37] for IMERG-F. The patterns of overestimation of monthly rainfall were also found in areas near the Maritime Continent, such as in Myanmar [72] and Thailand [73]. However, in Malaysia the IMERG-E and IMERG-L data estimated lower rainfall than the rain gauges [37].
IMERG observation showed that monthly RMSE was in the range of 88.72 mm/month (IMERG-F) to 103.10 mm/month (IMERG-E) when compared to MRG observation and in the range of 101.80 mm/month (IMERG-L) to 104.20 mm/month (IMERG-F) when compared to AWS observation. The obtained RMSE value was closely equal to the value obtained in previous research in the Maritime Continent region with a value of 136.60 mm/month in Bali [40], 97.01 mm/month in Malaysia [37], and 54.75 mm/month in Singapore [25] for IMERG-F. Additionally, Tan et al. [37] obtained a higher RMSE value for IMERG-E and IMERG-L observations in Malaysia with the monthly RMSE values of 114.33 and 118.37 mm/month, respectively. The continuous matrix tests (CC, RMSE, and RB) entirely showed that IMERG-E, L, and F have great potential to be used as monthly rainfall data in the IMC area such as for the estimation of water balance analysis.
IMERG’s performance of rainfall measurement in IMC also showed a strong spatial variation (Figure 5). The correlation between IMERG-F and MRG data showed the best value where 20.3% of stations showed an almost perfect correlation (>0.9) and 59.4% of stations showed a very good correlation (0.7–0.9). There was no poor correlation (<0.3) when compared to MRG observations. Thus, 79.7% of stations in the IMC area showed a very good correlation with IMERG-F, particularly in Sumatra and Java where the highest rain gauge density is present (Figure 5). The worst correlation value was observed in IMERG-E observations in which 4.7% (10.1%) stations were with CC < 0.3 when compared to MRG (AWS). However, the number of stations showing good CC (>0.7) from IMERG-E observations was also quite large, i.e., 60.9% (38.7%) in comparison to MRG data (AWS).
Though IMERG overall overestimated monthly rainfall in IMC as indicated by a positive RB value (Table 2), some MRG (AWS), approximately ~35% (~17%), respectively, stations showed negative RB values (Figure 5). However, the RB value obtained was relatively small, close to zero (Figure 5g–i). Thus, the IMERG product tended to overestimate monthly rainfall in IMC.

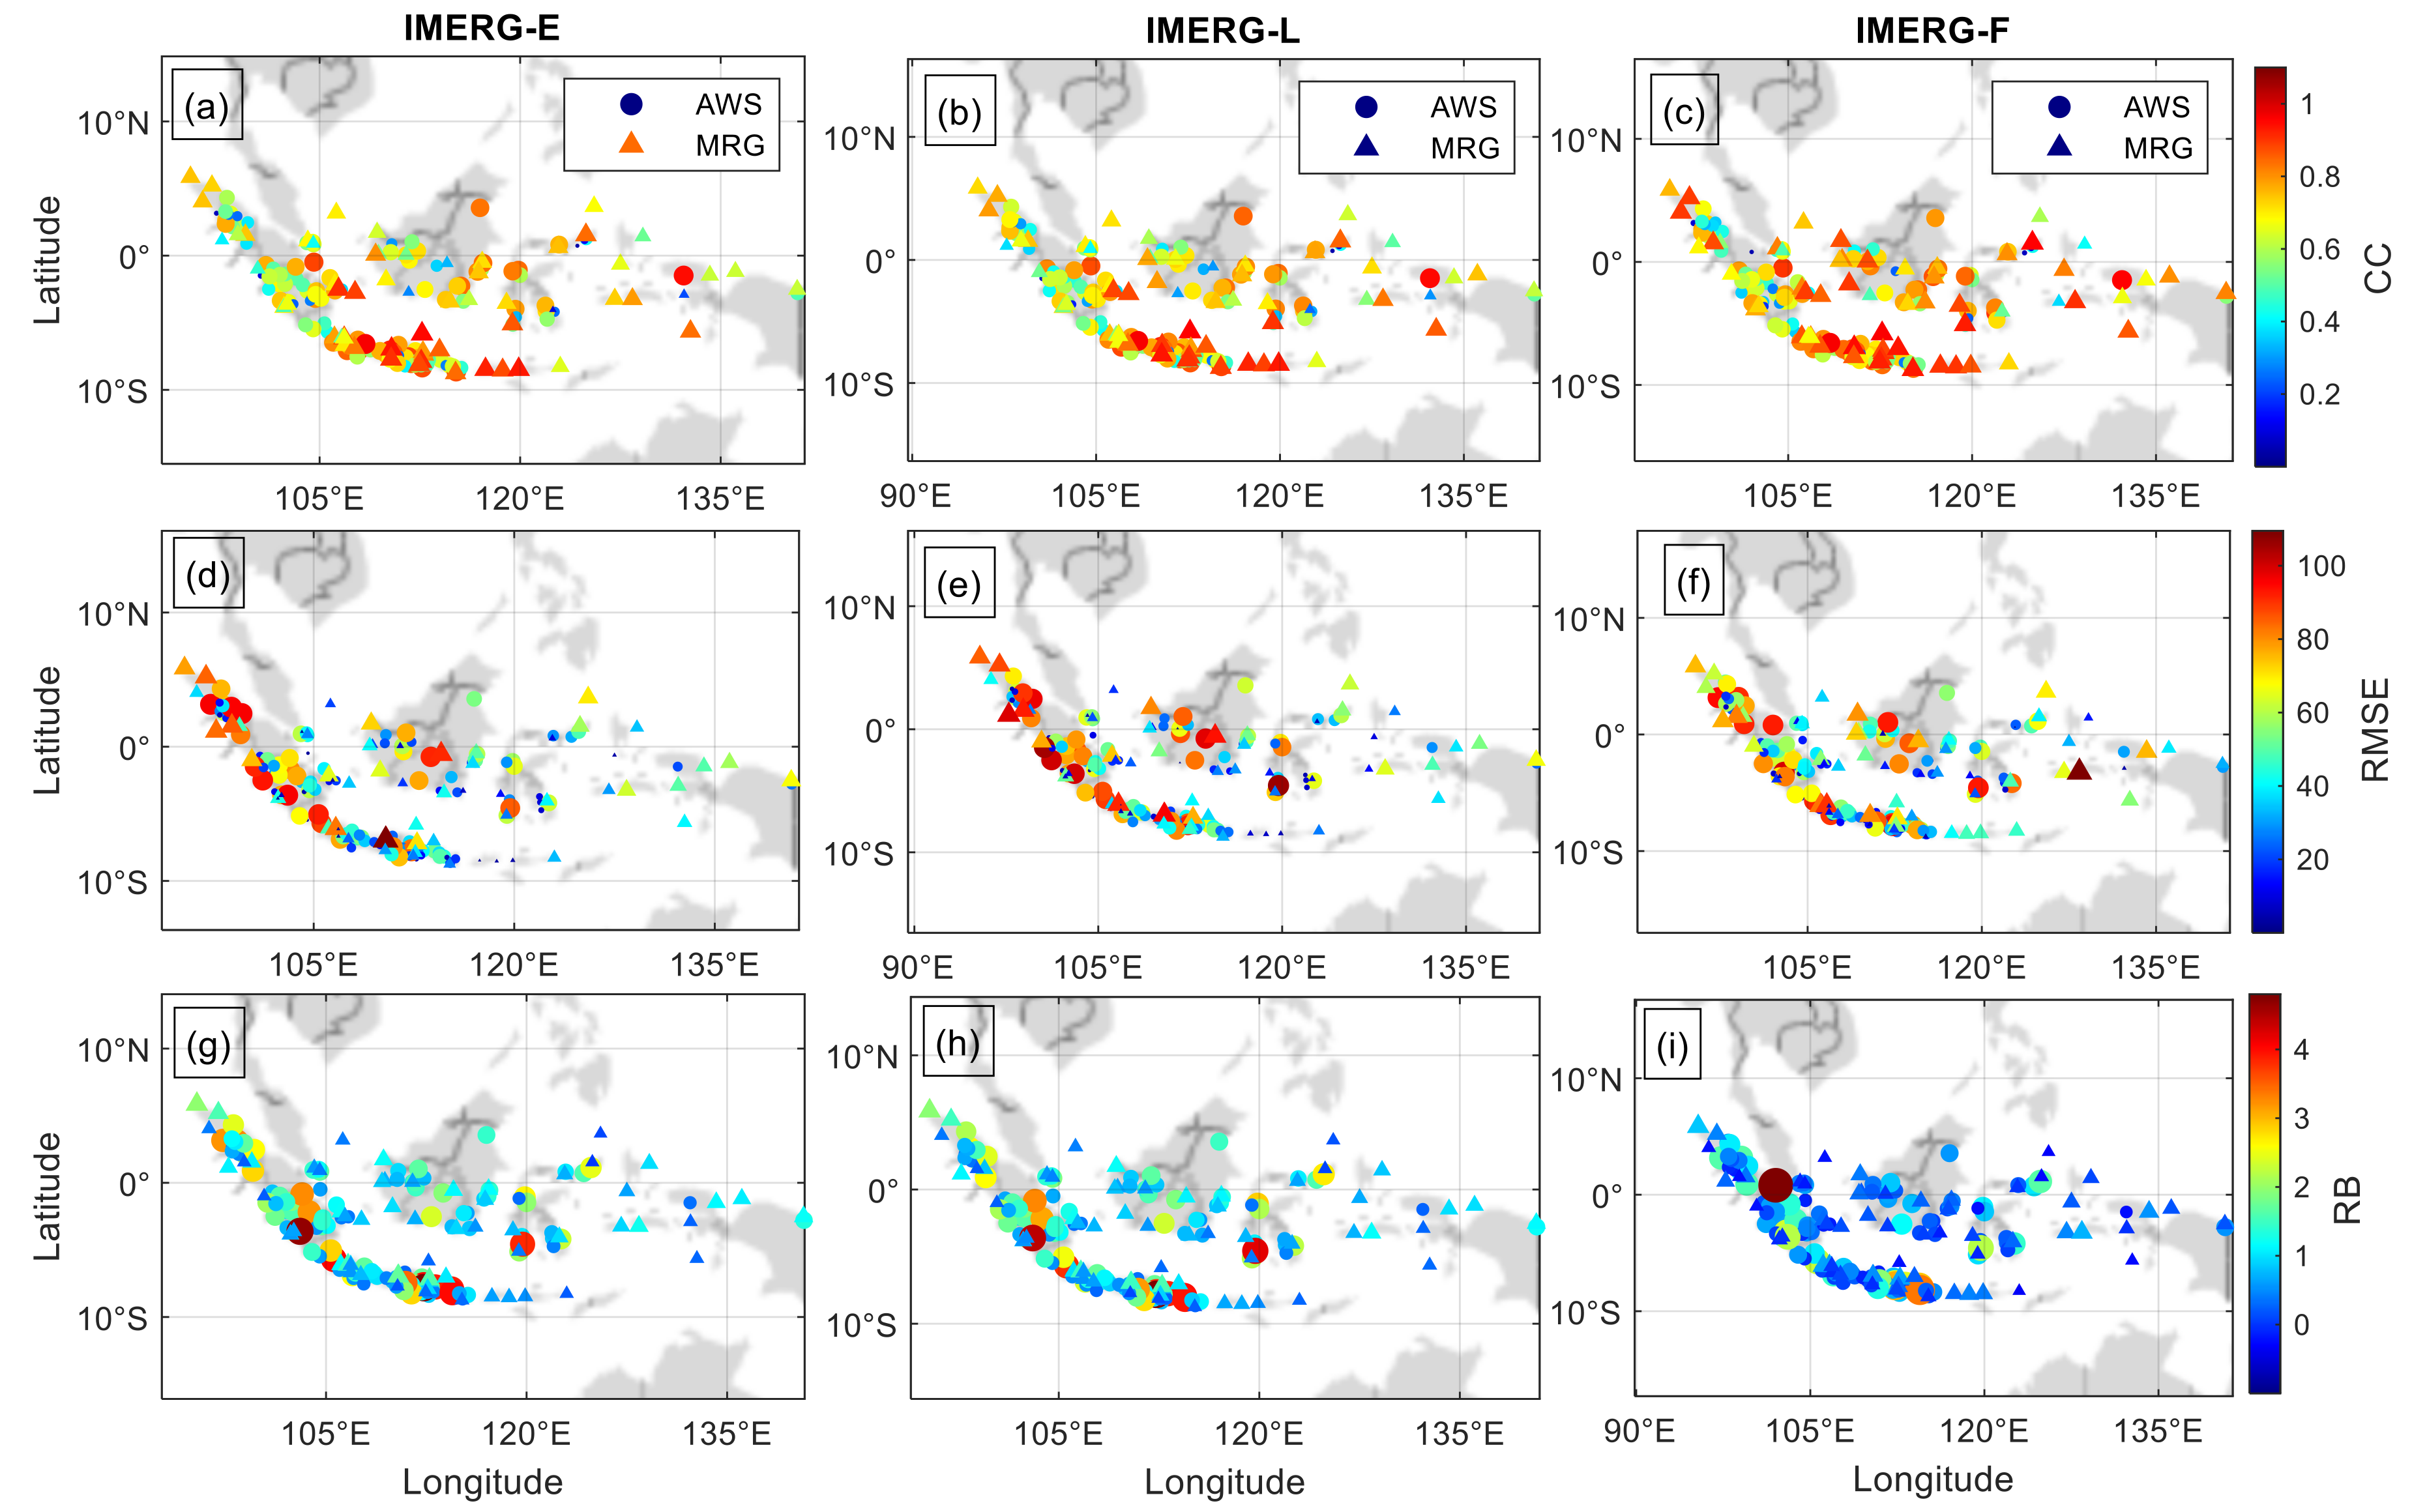
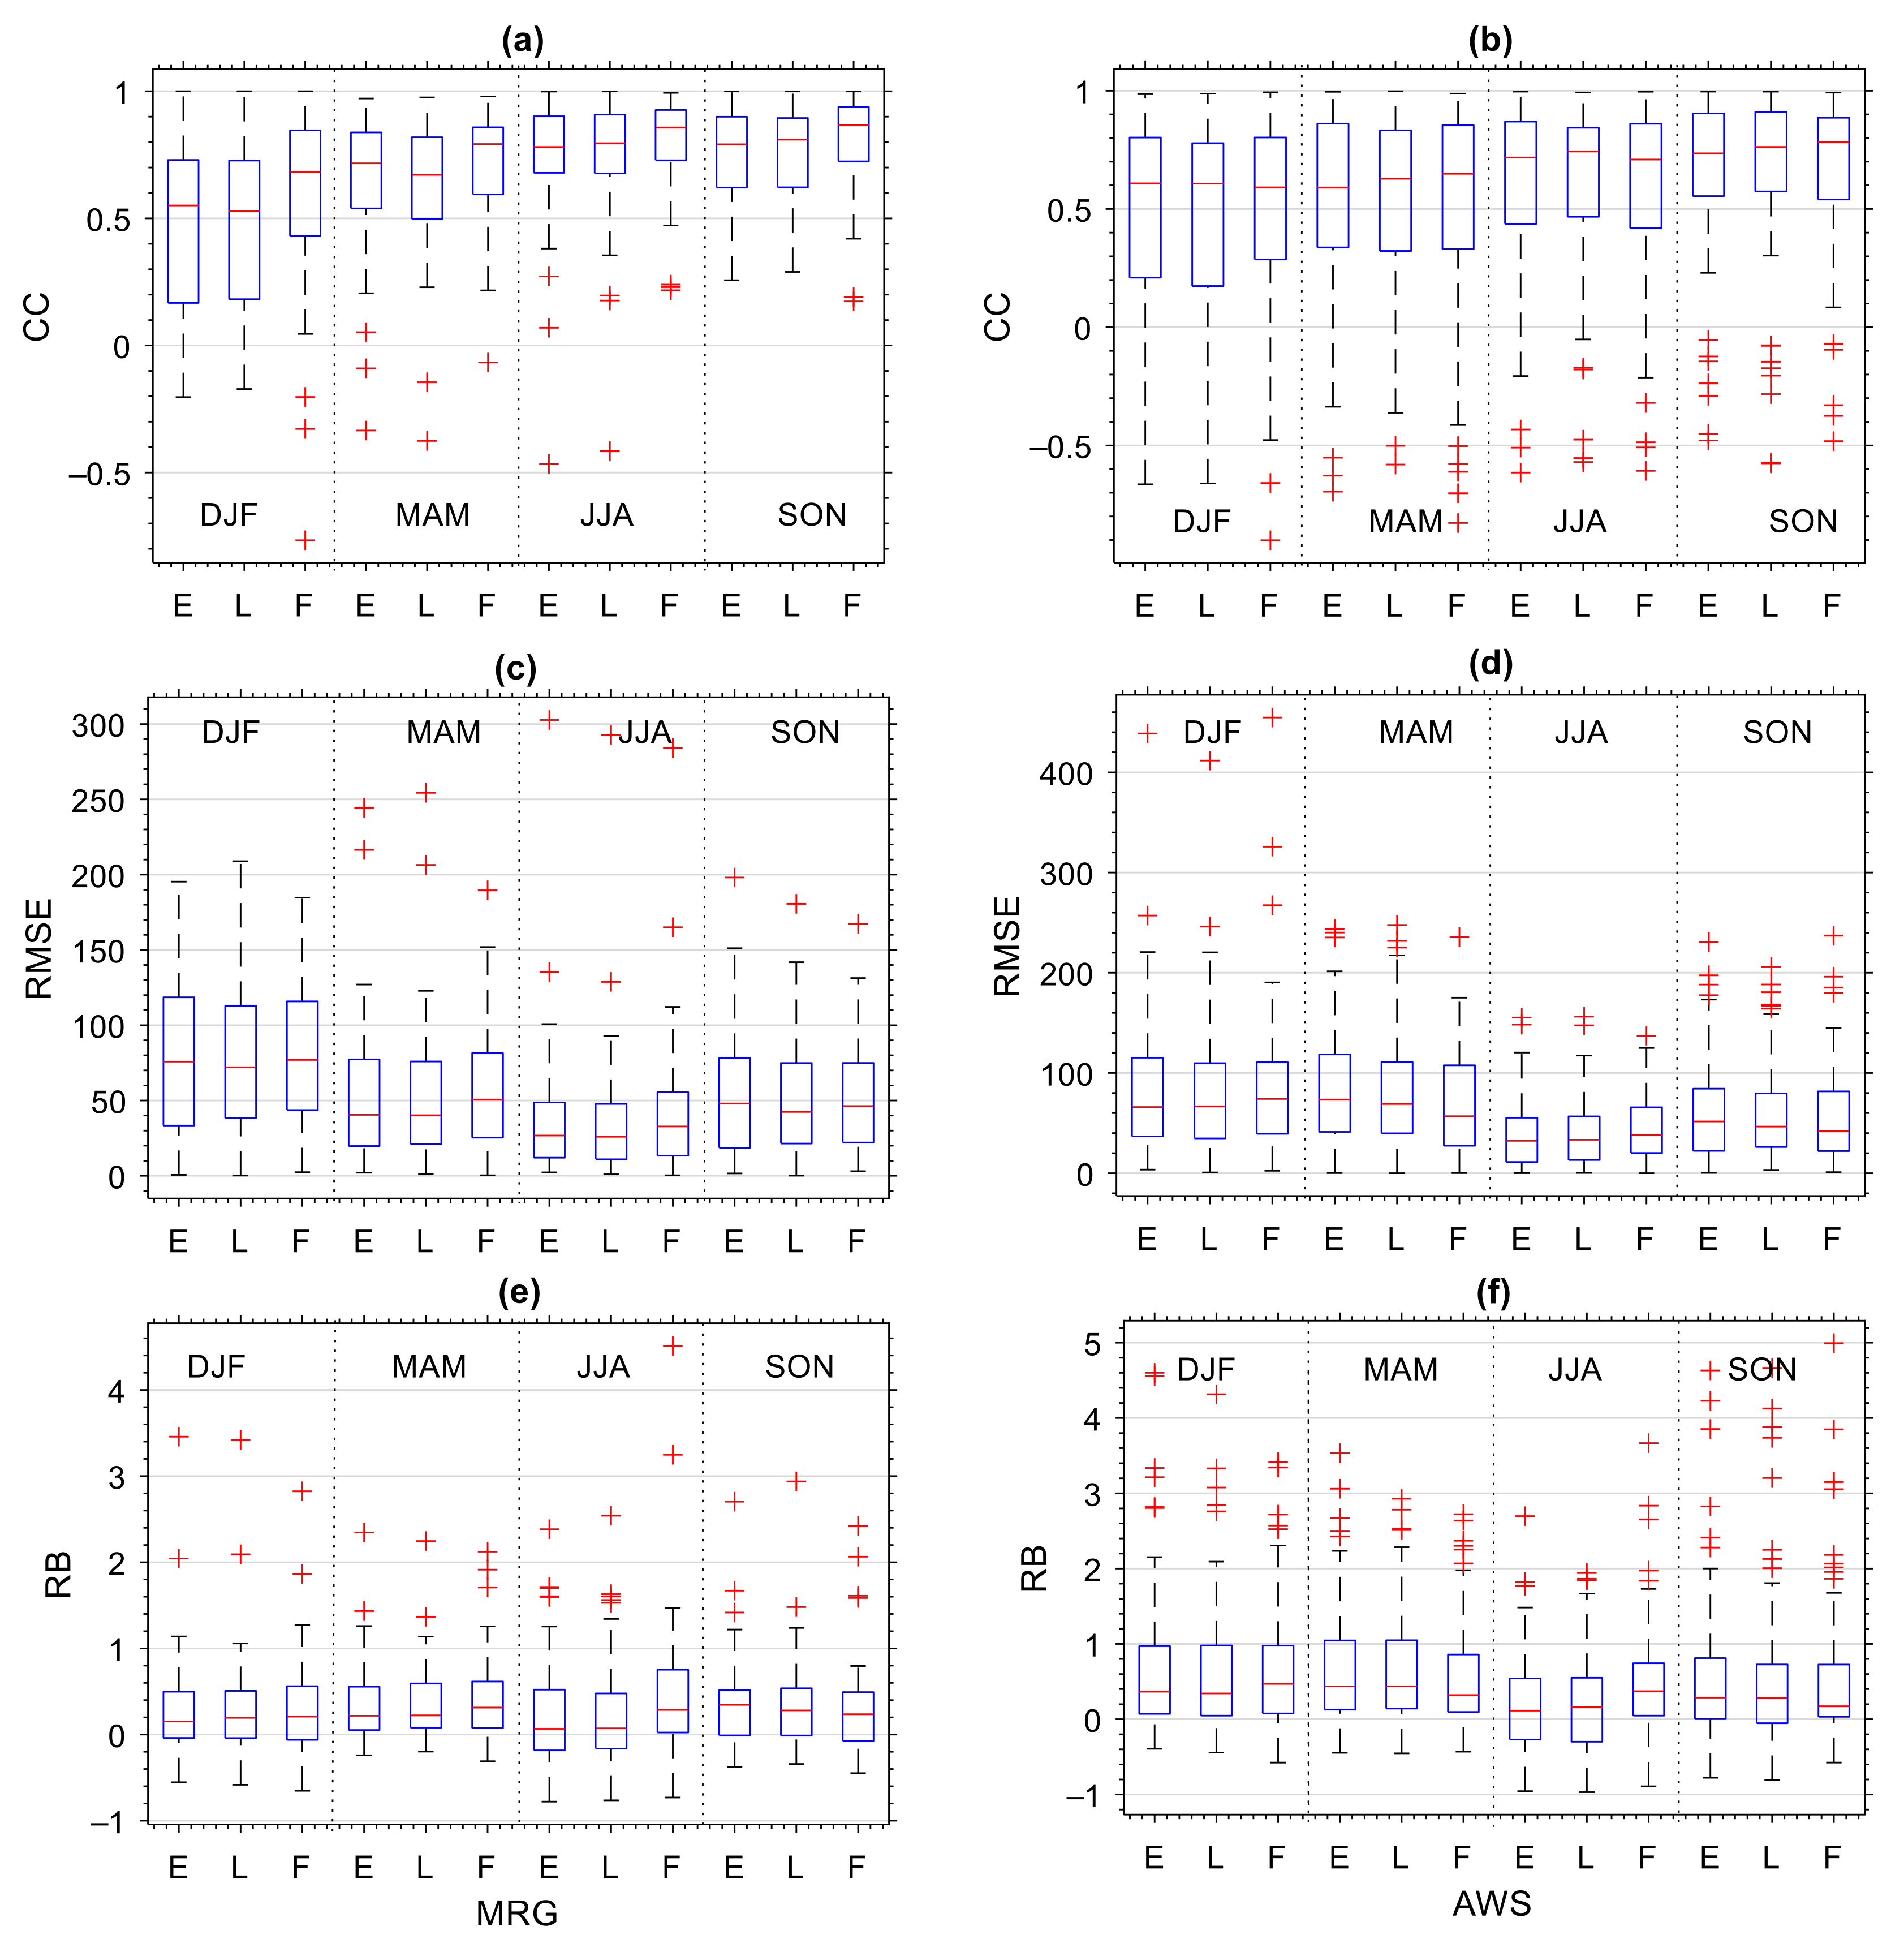
3.4. Seasonal Assessment

Figure 6 shows the seasonal boxplot diagram of the monthly continuous matrices as shown in Figure 5. IMERG showed a good performance in observing monthly rainfall in each season as indicated by a good CC value (>0.7) (Figure 6a,b). IMERG showed a trend of overestimation in monthly rainfall observations in all seasons, as observed in the dominantly positive RB value (Figure 6e,f). This is consistent with the annual and monthly assessments as discussed above. This overestimated value was followed by a dominantly low RMSE value (<100 mm/month) in all seasons.
Though IMERG generally had good accuracy in monthly rainfall observation for all seasons, the accuracy of IMERG was dependent upon the season and IMERG data type. The highest correlation was observed in JJA, specifically IMERG-F (Figure 6a,b). In JJA, most of the IMC areas had low monthly rainfall, especially in southern Indonesia from south Sumatra to Timor island, southern Kalimantan (Borneo), Sulawesi and part of Papua [58]. This was consistent with previous research in Bali showing a better correlation in the dry season in comparison to the rainy season [40]. Other observations in Myanmar [72] and Mekong River [74] also found similar results. Furthermore, the lowest correlation was shown in the DJF season (Figure 6a). The DJF season is the peak of monthly rainfall which occurred in most of the IMC areas [58]. This shows that in the wetter season, IMERG shows a lower correlation. In addition, the variation in IMERG performance against data types is much clearer during the DJF season. IMERG-F showed the highest correlation value, while IMERG-E showed the lowest one. This was followed by the RMSE and RB values, where the smallest values were observed in IMERG-F (Figure 6c–f). Overall, statistical tests showed the best accuracy of IMERG-F in observing the seasonal rainfall in IMC.

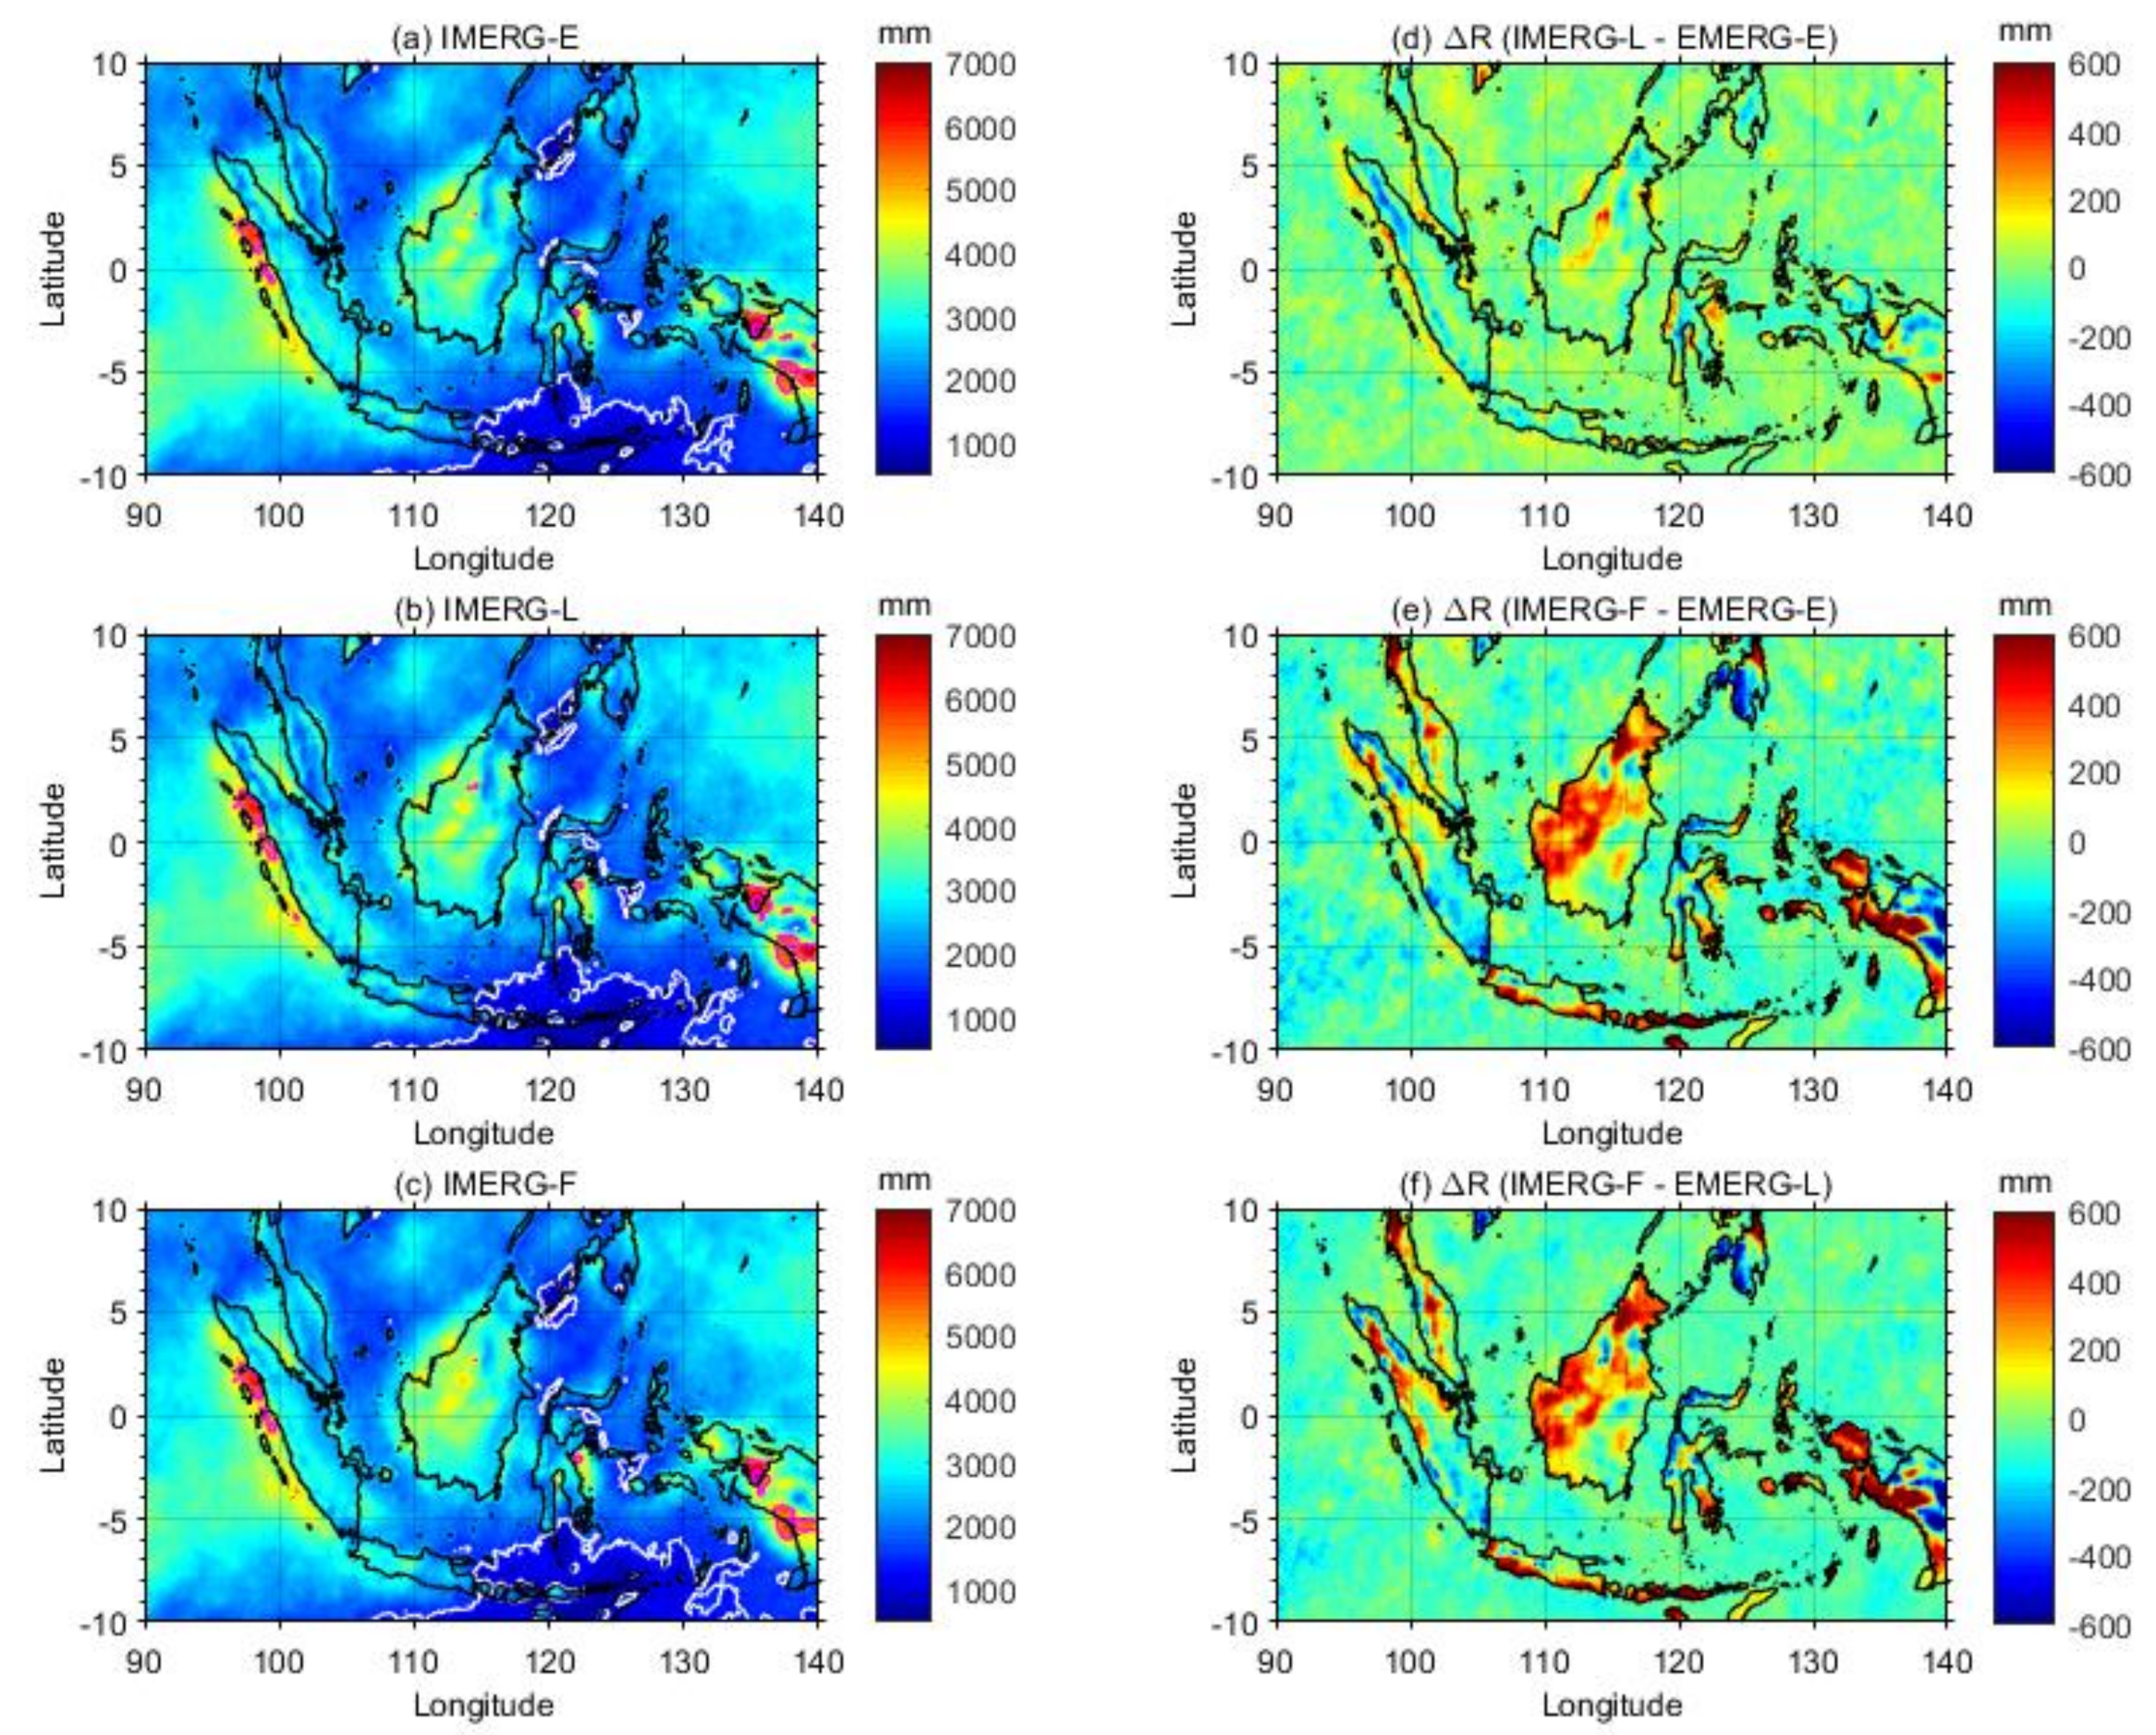
3.5. Annual Assessment

The observation in MRG and AWS showed the high annual rainfall in Sumatra, Kalimantan and Java (Figure 7). The average annual rainfall in Indonesia from MRG (AWS) observation was found at 2295 (2355) mm/year. From MRG observation, the values of annual rainfall varied between 664 mm/year to 4687 mm/year. For AWS, the value varied from 820 mm/year to 5221 mm/year. The highest observations from MRG observations were observed at ID 96073 (1.550°N, 98.88°E) in Sumatra Island, while for AWS, the highest annual rainfall was observed in station ID 150327 (0.357°N, 112.317°E), in Kalimantan Island. As explained in Section 2.1, the percentage of annual data availability for AWS is lower than MRG. All MRG stations in Figure 7 have data availability above 90%, while AWS only has two stations with data availability above 90%, the remaining having 80–90%. The regional variation of rainfall in the IMC is very strong [75] which is influenced by global, regional, and local atmospheric circulation. This is clearly seen from the mean annual rainfall of the IMERG data (Figure 8). High rainfall (>2500 mm/year) was observed in Sumatra, Kalimantan, Java, and Papua. Some areas in the coastal region of Sumatra, Kalimantan, and Papua have rainfall above 4000 mm/year, and some locations even reach 7000 mm/year. Dry areas with rainfall < 1500/year were observed in Nusa Tenggara. This spatial variability of annual rainfall is consistent with the climatological rain map developed by BMKG using rain gauge data from 1981 to 2010 [76] and with annual rainfall obtained by TRMM 3G68/PR [5]. The annual rainfall produced by the three types of IMERG is different (Figure 8d–f). In general, there is an increase in annual rainfall with an increase in data latency which is indicated by the positive AR when the highest latency is subtracted by a shorter latency.
Figure 9 illustrates annual precipitation scatter plots for IMERG precipitation versus ground-based rain gauge. Annual rainfall observation from the MRG and IMERG showed a good correlation (>0.7) for MRG. The IMERG-L data showed the highest CC value, i.e., 0.78 (Figure 9c). In general, the CC values found in this study were consistent with the values found in several previous studies. Moderate CC for annual IMERG data was found in Pakistan [29], China’s Diverse Sub Region [77], and Brazil [78]. Furthermore, the values of good correlation and most perfect correlation of annual IMERG data were also found in Maritime Continent areas such as Bali [40], Singapore [25], and Malaysia [37]. The factor that greatly influenced the level of annual correlation was the density of the rain gauge data. The lower density of rain gauge in IMC has caused a correlation value lower than other observations such as in Singapore [25]. CC values are expected to increase when coarsening the IMERG product resolution, e.g., to 0.25° [78].
IMERG data in IMC overestimated annual rainfall compared to the surface rain gauges. This was indicated by the positive RB values for all IMERG -E, -L, and -F observations (Figure 9). The observation of the annual rainfall value of IMERG showed a more accurate value when compared to the MRG with the smallest RB value of 4.5%, namely in the IMERG-L (Figure 9c). This overestimation was also found in annual rainfall in the Maritime Continent region [25,37], and in other areas with high annual rainfall intensity, such as Pakistan [29] and Brazil [78]. Thus, the IMERG tended to overestimate annual rainfall in areas with high rainfall. A fairly large RMSE value was also found in the annual data. The highest RMSE was observed in IMERG-E when compared to MRG and in IMERG-F in comparison to AWS. The RMSE value was 663.76 mm/year and 579.45 mm/year, respectively in comparison to the average annual rainfall at IMC reaching 4687 and 1965. The RMSE percentage value was not much different from that the one observed in Plateau Brazil [78], Tibet [79], and Plain China [80].

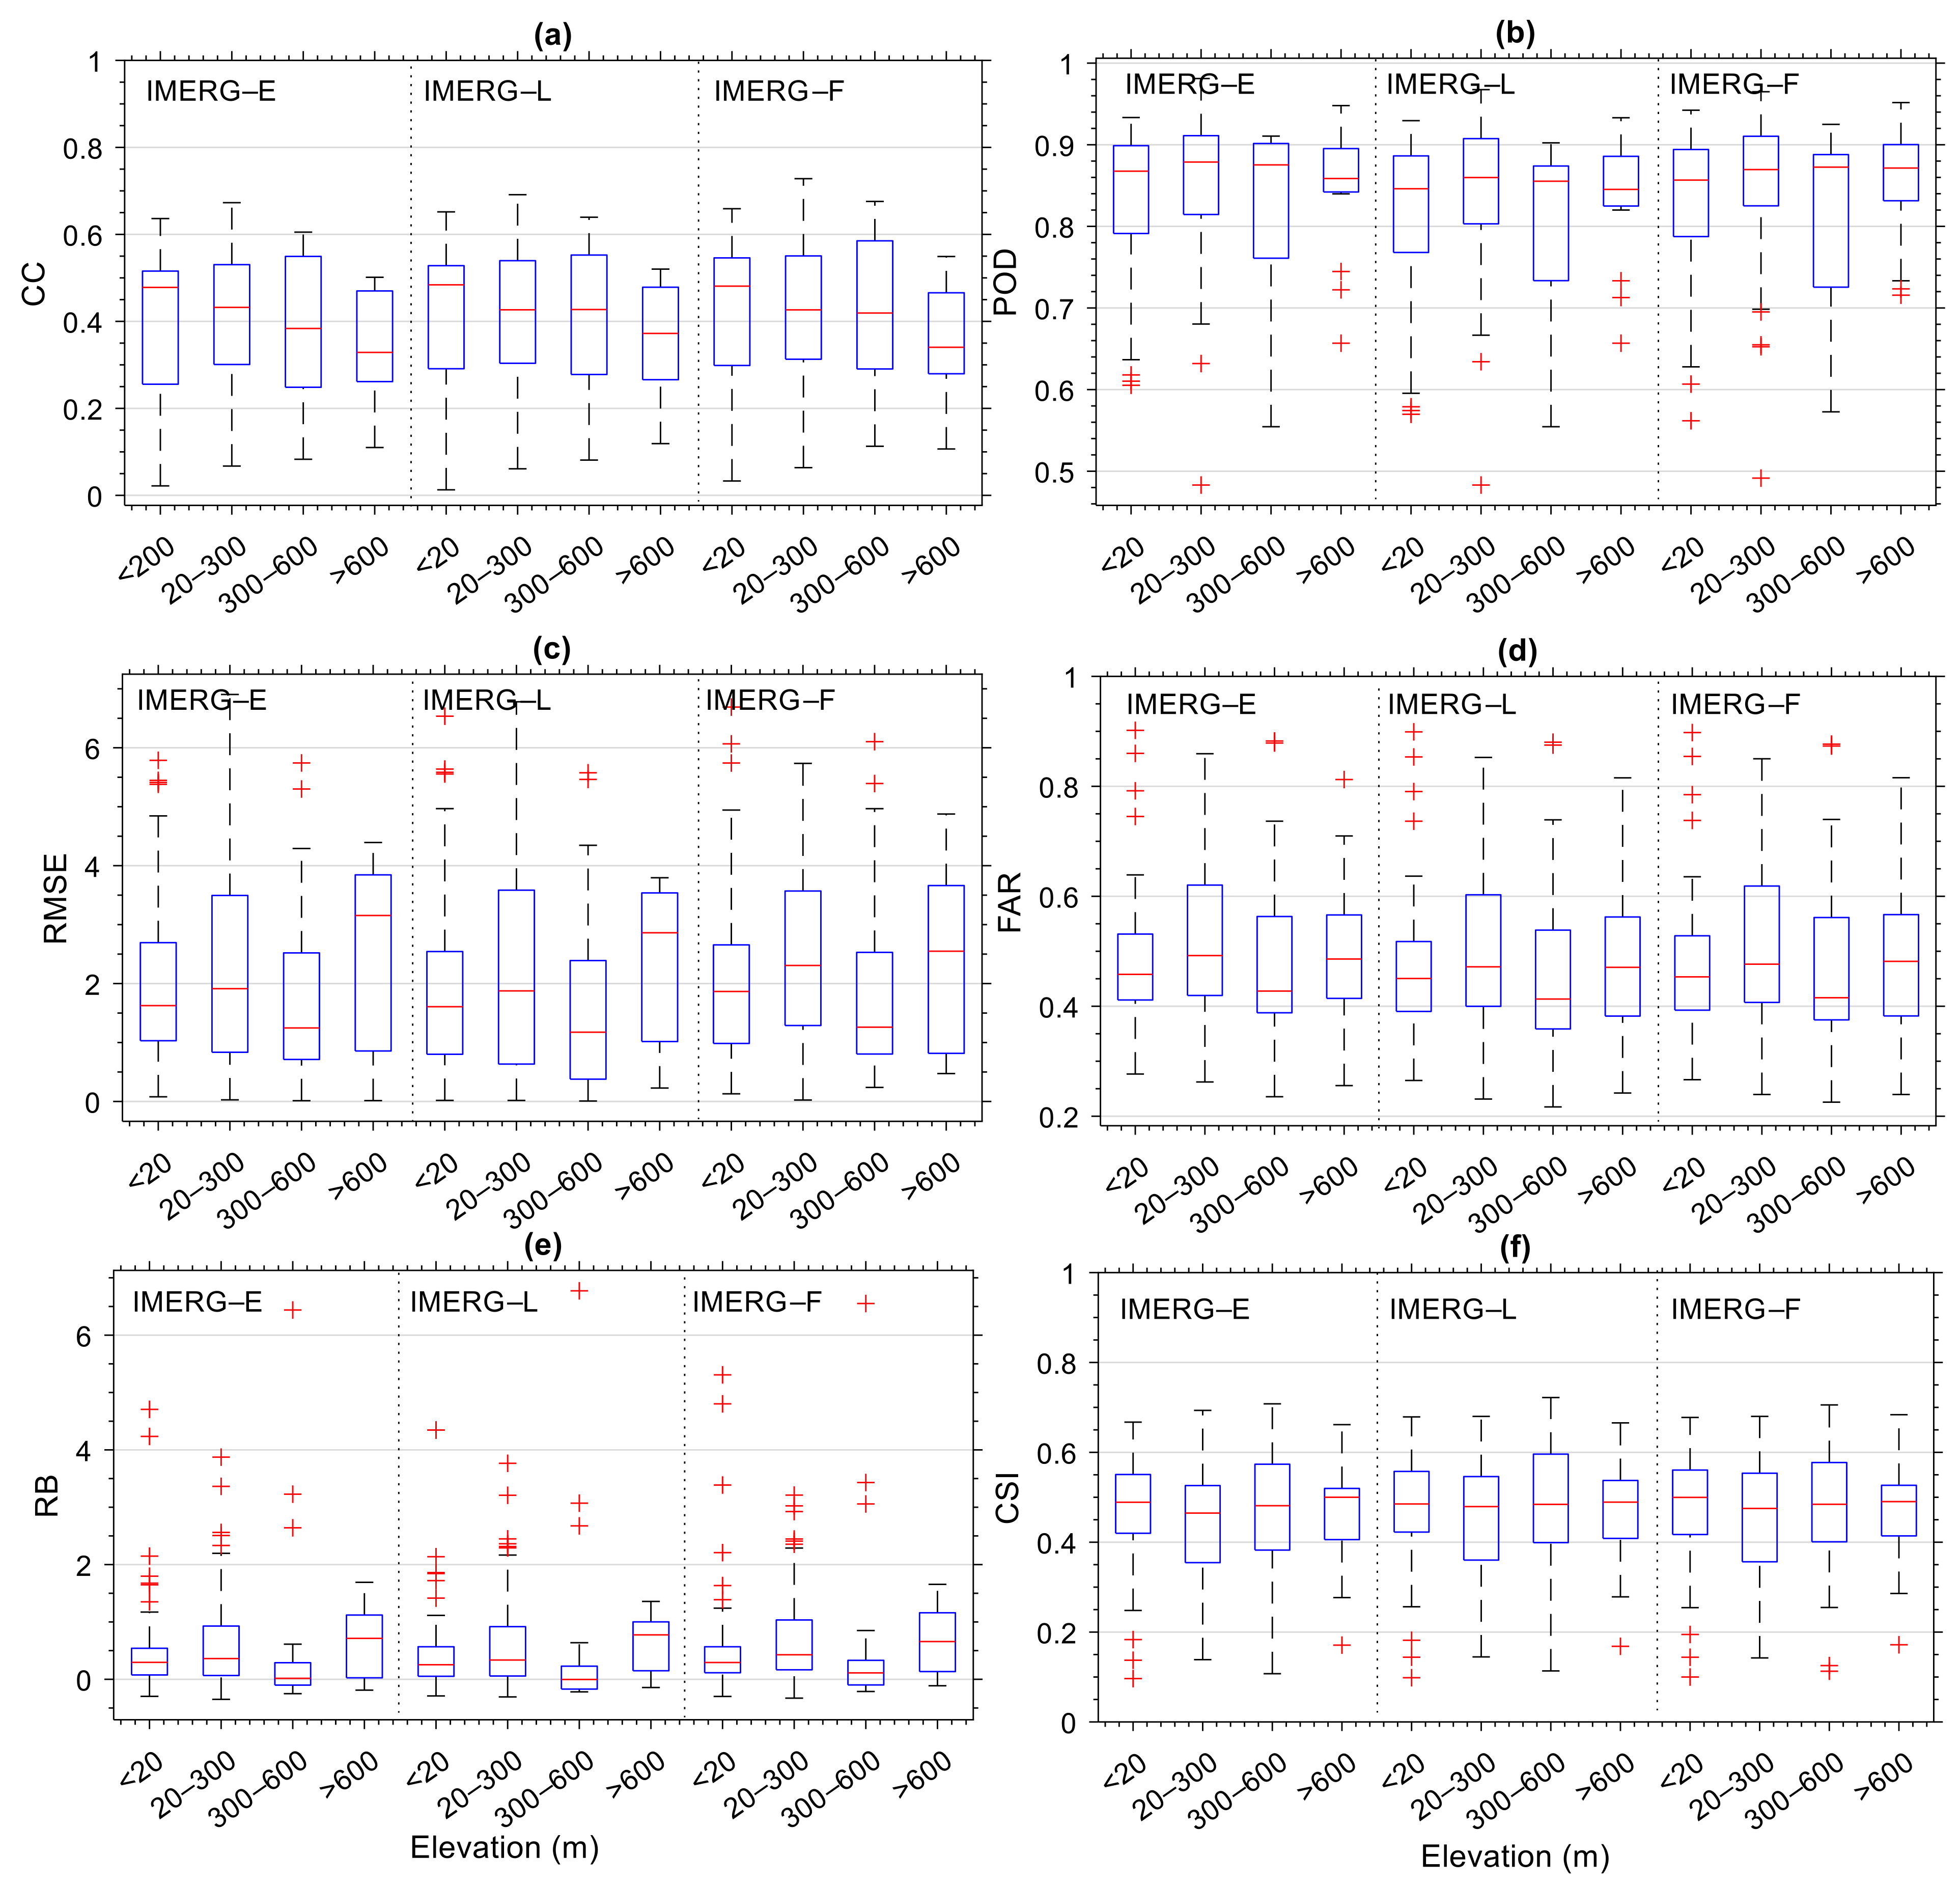
3.6. Effect of Topography

One of the factors determining the accuracy of rainfall observations by IMERG is orography [80]. Here, we attempted to analyze the effect of topography on the accuracy of IMERG measurements in IMC using daily rainfall data. Daily rainfall data was selected because this data is often used as input for hydrological models [71]. The daily data is the temporal resolution closest to real-time with the best accuracy value since the hourly resolution is not reliable yet, as discussed in Section 3.4. The elevation of all MRG and AWS stations in IMC varies from 0 to 1260 m above sea level (ASL). To determine the effect of topography, all rain gauge stations were divided into four elevation categories: coastal and low-level plains (<20 m ASL), lowlands (20–300 m ASL), highlands (300–600 ASL), and hills (>600 m ASL). Then, the statistical quantities for each station were calculated and compared for each of these elevation categories.
Figure 10 shows a boxplot of statistical quantities from IMERG-E, L, and F data for all elevations of rain gauge stations. The most obvious effect of topography was on the CC value that decreased with the increasing station elevation (Figure 10a). This was not surprising as the ability of satellites to estimate rainfall is commonly better in flat areas rather than in complex terrain [81]. Coastal and low elevation areas have the best CC values with prevalently negative RB. This underestimation of rainfall in the lowlands and especially in the coastal areas has also been found in Guangdong China [74]. Lower CC values in hills were followed by higher RMSE and RB values (Figure 10c), consistent with those found in Cyprus [82]. A decrease in the correlation of IMERG and rain gauge data with increasing elevation was also found across China [83]. Hence, daily rainfall observations using IMERG data in the hills still needs an improvement.
Although the accuracy of the IMERG observations showed a dependence on elevation, the impact of elevation was not as clear when looking at rain detection performances. (Figure 10b,d,f). There was a slight difference in POD values for different station elevations, but this was not consistent with the FAR values. The best POD was observed in the highlands, but the FAR value in the highlands was also quite high. As a result, the CSI was nearly similar for all elevation categories (Figure 10f).

4. Discussion

In general, we find that the accuracy of the IMERG data increases with increasing averaging time scales. This is similar to what was found in other regions [25,27,37,39,66,68,70,74,80,84,85,86,87,88,89,90]. All previous studies show that monthly and annual IMERG data have the best accuracy with correlations above 0.7, similar to those obtained in this study. On daily time scales, the accuracy of the IMERG data varies more than on monthly and annual time scales. Several studies show IMERG’s daily data has a fairly good accuracy (CC > 0.7) [39,80,86,91,92] while others show a moderate (0.5 < CC < 0.7) [15,37,68,73,84,86,87,90,93] and poor correlations (CC < 0.5) [26,74,85,89]. Such variation is influenced by topography conditions and the density of the rain gauge network. The higher the rain gauge density [94], the more accurate the validation results. In addition, the number of rain gauge networks from GPCC data used in calibrating IMERG data is also a factor that affects the accuracy. For daily data, we found that approximately 34.6% of the MRG and 42.4% of AWS stations had a moderate correlation with IMERG. Furthermore, for hourly validation, we found a poor correlation between rain gauge and IMERG. The average CC is 0.03 for MRG and 0.25 for AWS. Such low CCs are associated with high FAR value (Figure 3). This high FAR value can be caused by the high variability of rainfall in an IMERG grid, so that one point observation may not be adequate to represent rainfall from the grid. High FAR value can also contribute to the high overestimation of the IMERG data compared to the rain gauge [42]. However, for extreme rain events, which are especially associated with short-term and limited spatial extent events (few km2), IMERG underestimates rainfall [43,47]. IMERG current spatial resolution (10 × 10 km2) will tend to smooth out extreme values of rainfall at short time scales.
The IMERG data combined ten satellites observation [32] that provide uniformly calibrated precipitation measurements every 2–4 h around the globe [33]. The poor agreement between IMERG and rain gauge data may demonstrate that interpolation of multiple satellites data with a coarser spatial/temporal resolution for forming hourly data or smaller temporal resolution does not yield much useful information at the unresolved scales (for satellite). However, multiple satellite observations must be combined because a single satellite observation rarely has hourly resolution at a particular location. Poor accuracy of hourly data was also found in Canada [68], Brazil [69] and mainland China [70]. However, the accuracy of the IMERG hourly data shows an increase compared to other satellite precipitation datasets [27].
The accuracy of IMERG monthly data shows seasonal variations (Figure 6). Higher accuracy was observed in the season with lower rainfall, namely in JJA, and lower accuracy in the rainy season, namely DJF. One of the possible reasons is that extreme rainfall occurred more frequently in IMC during the wet season and that IMERG is less accurate in observing extreme rainfall in the tropics [37], espescially in IMC [43,47]. In addition, low CC can also be related to the high FAR value in the rainy season. As a consequence, the accuracy of observations in general decreases during DJF.
Different types of rain gauges show different levels of accuracy. For daily (Figure 4) and monthly time scales (Table 2), the comparison of IMERG with MRG shows slightly better accuracy than when compared to AWS. However, on hourly time scales (Figure 3), AWS shows a better correlation than MRG. Although the performance evaluation of MRG and AWS operated by BMKG showed very good accuracy [45,95], it is possible for these rain gauges to have errors in operation. AWS uses the automatic tipping-bucket rain gauge. A comparison between the Hellmann gauge and the tipping bucket at the Airport of Geneva shows that the tipping-bucket gauge shows less precipitation than the Hellmann gauge [96]. This is generally also found in BMKG instruments, where rainfall from AWS (tipping-bucket gauge) is smaller than MRG (Hellmann gauge). The percentage differences in daily precipitation amounts between Hellmann and tipping buckets depend on wind speed and the intensity of the precipitation [97]. The error of the tipping-bucket rain gauge increases with increasing rainfall intensity and decreases with increasing time scale. For example, at moderate rainfall intensities of 10 mm/h, the tipping bucket shows relative standard errors of 6.4% for the 5 min and 2.3% for 15 min timescales [98]. In this study, the smallest scale used is daily, so systematic and random instrumental errors are likely to be quite small. Another factor that might affect our results is the impact of the data recording system, with MRG introducing errors associated with its semi-automatic logging system.
In addition to the type of rain gauge, the altitude of the rain gauge sitealso affects the accuracy of the precipitation products [80]. For IMC the ability of the satellite product to detect and quantify rainfall was not much different for elevations (the highest elevation of rain gauge station was 1260 m) (Figure 10). consistent with previous studies which found similar results for stations below 2000 m [40,82,83].
The accuracy of daily, monthly, and yearly data from IMERG is reasonable and can complement data from traditional rain gauge systems in IMC. As expected, the accuracy of the IMERG is best at the greatest latency (i.e., Final > Late > Early), thus the use of IMERG-F is recommended. The greater the latency, the more information/processing gets into the satellite estimates, the better its performance on average. However, the choice of the product is highly dependent on the requirements of the application. If an application can accept the 18 h latency of IMERG-L, then IMERG-L should be used instead of IMERG-F. Applications that expect fast and near real-time (NRT) results can use the IMERG-E [99], such as flash flood forecasting [100] and NRT hurricane rainfall forecasting [101], NRT erosion, and fires nowcasting. For daily and long-term applications such as agricultural forecasting or drought monitoring [101], we can use the IMERG-L. The IMERG-F offers significant benefits on monthly applications such as hydrological modeling [102] and climate study. However, all of these applications depend on the latency needed because even the same application may have different latency requirements depending on needs.
Considerable biases exist in the IMERG data for all latency, so bias adjustments based on local gauge networks are recommended before the data is used. Several methods can be used to correct the bias of precipitation data from satellite products. First, the correction can be performed using a mean-based approach. This method typically uses a monthly correction factor based on the ratio between grid-based precipitation and observed values, such as local intensity (LOCI) [103] and linear scaling (LS) [104]. Second, we can use a distribution-based approach. This method uses a probability distribution transfer function derived from the observed and simulated cumulative distribution function (CDF) [105]. The mean-based approach is relatively simple and easy to apply. However, the distribution-based approach is considered better because it corrects errors in the bias of the mean and the shape of the distribution [106].

5. Conclusions

The accuracy of IMERG in observing the rainfall in the Indonesian maritime continent (IMC) was quite good for daily, monthly, and yearly data, as seen from the CC, RMSE and RB values. IMERG was found to be very effective in detecting the rainfall in IMC as reflected in the POD value. However, the falsely detected precipitation events (FAR) were still high for daily and hourly data. Hourly data also have a poor correlation. Thus, daily, monthly, and yearly data from IMERG have the potential to complement data from traditional rain gauge systems in IMC. However, it can be seen that considerable biases exist in the IMERG data, so bias adjustment needs to be performed before the data is used for water resources management and hydrological applications. For all assessments conducted, IMERG-F overall showed the best performance in IMC, but the differences with IMERG-E and IMERG-L were minimal. Thus, IMERG-E and IMERG-L data, which have a faster latency than IMERG-F have also the potential to be used in rainfall observations in IMC. Seasons and topography affect the IMERG product quality. The highest and lowest CC values were observed in the dry season (JJA) and wet season (DJF). However, the influence of the season was not so visible in the categorical statistics (POD, FAR and CSI). The CC value decreased with increasing elevation, but the difference was low for the different IMERG products. Meanwhile, topography did not show noteworthy effects on categorical statistics though a caveat of the study was that all the rain gauges were located at elevations below 2000 m. In this study it was also found that the type of rain gauge could affect the validation results, as reported in previous studies. Semi-automatic rain gauge showed a better correlation than AWS for yearly, monthly and daily data whereas AWS was found better for validating hourly data. The accuracy of IMERG observations may also be affected by the intensity of rainfall. Research related to this, particularly in relation to extreme rain has been published in a companion paper [47]. The current study validated one IMERG grid point with one-point observation. The high FAR value found for hourly data may be due to the strong small-scale variability of convective intense rainfall in one IMERG-F grid (0.1° × 0.1°) which cannot be captured by a single point observation. Therefore, testing with locations where several rain gauge stations are present in one IMERG-F grid point should be pursued when assessing the performance of IMERG at hourly scales. Furthermore, we are investigating an appropriate bias correction method for IMERG based on local gauge networks, and the result will be published elsewhere.

Author Contributions

Conceptualization, R.R. and M.M.; methodology, M.M. and R.R.; software, R.R., H.Y. and M.M.; validation, M.M.; formal analysis, R.R., M.M. and H.Y.; investigation, R.R., M.M. and H.Y.; resources, M.M., R.R., H.Y. and R.M.; data curation, A.P.N., M.M., R.R., H.Y. and R.M.; writing—original draft preparation, R.R. and H.Y.; writing—review and editing, M.M., R.R., W.S., S.S., R.M., M.V., A.B., A.T. and H.H. (Harmadi Harmadi); visualization, R.R. and H.Y.; supervision, M.M., A.B., H.H. (Hiroyuki Hashiguchi), W.S. and S.S.; project administration, H.Y.; funding acquisition, M.M. All authors have read and agreed to the published version of the manuscript.

Funding

This study was supported by 2021 World Class Research Grants from Ministry of Research, Technology and Higher Education/Ministry of Education, Culture, Research, and Technology of Indonesia (Contract no: 104/SP2H/LT/DRPM/2021).

Data Availability Statement

All data used in this study are available upon request.

Acknowledgments

Rain gauges were operated by Agency for Meteorology, Climatology and Geophysics of Republic Indonesia (BMKG). We also thank the National Aeronautics and Space Administration (NASA) for providing IMERG data. We would like to express our very great appreciation to Jackson Tan of NASA Goddard Space Flight Center for his valuable and constructive suggestions for this research work.

Conflicts of Interest

The authors declare no conflict of interest.

References

  1. Lee, J.; Lee, E.H.; Seol, K.H. Validation of Integrated MultisatellitE Retrievals for GPM (IMERG) by using gauge-based analysis products of daily precipitation over East Asia. Theor. Appl. Climatol. 2019, 137, 2497–2512. [Google Scholar] [CrossRef]
  2. Gehne, M.; Hamill, T.M.; Kiladis, G.N.; Trenberth, K.E. Comparison of global precipitation estimates across a range of temporal and spatial scales. J. Clim. 2016, 29, 7773–7795. [Google Scholar] [CrossRef]
  3. Katiraie-Boroujerdy, P.S.; Nasrollahi, N.; Hsu, K.L.; Sorooshian, S. Evaluation of satellite-based precipitation estimation over Iran. J. Arid Environ. 2013, 97, 205–219. [Google Scholar] [CrossRef] [Green Version]
  4. Mahmoud, M.T.; Al-Zahrani, M.A.; Sharif, H.O. Assessment of global precipitation measurement satellite products over Saudi Arabia. J. Hydrol. 2018, 559, 1–12. [Google Scholar] [CrossRef]
  5. Mori, S.; Jun-Ichi, H.; Tauhid, Y.I.; Yamanaka, M.D.; Okamoto, N.; Murata, F.; Sakurai, N.; Hashiguchi, H.; Sribimawati, T. Diurnal land-sea rainfall peak migration over Sumatera Island, Indonesian Maritime Continent, observed by TRMM satellite and intensive rawinsonde soundings. Mon. Weather Rev. 2004, 132, 2021–2039. [Google Scholar] [CrossRef]
  6. Marzuki, M.; Yusnaini, H.; Tangang, F.; Muharsyah, R.; Vonnisa, M.; Harmadi, H. Land-Sea Contrast of Diurnal Cycle Characteristics and Rain Event Propagations over Sumatra According to Different Rain Duration and Seasons. Atmos. Res. 2022, in press. [Google Scholar] [CrossRef]
  7. Hosseini-Moghari, S.M.; Araghinejad, S.; Ebrahimi, K. Spatio-temporal evaluation of global gridded precipitation datasets across Iran. Hydrol. Sci. J. 2018, 63, 1669–1688. [Google Scholar] [CrossRef]
  8. Sun, Q.; Miao, C.; Duan, Q.; Ashouri, H.; Sorooshian, S.; Hsu, K.L. A Review of Global Precipitation Data Sets: Data Sources, Estimation, and Intercomparisons. Rev. Geophys. 2018, 56, 79–107. [Google Scholar] [CrossRef] [Green Version]
  9. Kidd, C.; Becker, A.; Huffman, G.J.; Muller, C.L.; Joe, P.; Skofronick-Jackson, G.; Kirschbaum, D.B. So, how much of the Earth’s surface is covered by rain gauges? Bull. Am. Meteorol. Soc. 2017, 98, 69–78. [Google Scholar] [CrossRef] [PubMed]
  10. Metcalfe, J.R.; Routledge, B.; Devine, K. Rainfall measurement in Canada: Changing observational methodsand archive adjustment procedures. J. Clim. 1997, 10, 92–101. [Google Scholar] [CrossRef]
  11. New, M.; Todd, M.; Hulme, M.; Jones, P. Precipitation measurements and trends in the twentieth century. Int. J. Climatol. J. R. Meteorol. Soc. 2001, 21, 1889–1922. [Google Scholar] [CrossRef]
  12. Ma, Y.; Zhang, Y.; Yang, D.; Farhan, S. Bin Precipitation bias variability versus various gauges under different climatic conditions over the Third Pole Environment (TPE) region. Int. J. Climatol. 2015, 35, 1201–1211. [Google Scholar] [CrossRef]
  13. Yong, B.; Wang, J.; Ren, L.; You, Y.; Xie, P.; Hong, Y. Evaluating four multisatellite precipitation estimates over the Diaoyu Islands during typhoon seasons. J. Hydrometeorol. 2016, 17, 1623–1641. [Google Scholar] [CrossRef]
  14. Anagnostopoulos, G.G.; Koutsoyiannis, D.; Christofides, A.; Efstratiadis, A.; Mamassis, N. A comparison of local and aggregated climate model outputs with observed data. Hydrol. Sci. J. 2010, 55, 1094–1110. [Google Scholar] [CrossRef]
  15. Wang, D.; Wang, X.; Liu, L.; Wang, D.; Huang, H.; Pan, C. Evaluation of TMPA 3B42V7, GPM IMERG and CMPA precipitation estimates in Guangdong Province, China. Int. J. Climatol. 2019, 39, 738–755. [Google Scholar] [CrossRef]
  16. Kucera, P.A.; Ebert, E.E.; Turk, F.J.; Levizzani, V.; Kirschbaum, D.; Tapiador, F.J.; Loew, A.; Borsche, M. Precipitation from space: Advancing earth system science. Bull. Am. Meteorol. Soc. 2013, 94, 365–375. [Google Scholar] [CrossRef]
  17. Marzuki, M.; Suryanti, K.; Yusnaini, H.; Tangang, F.; Muharsyah, R.; Vonnisa, M.; Devianto, D. Diurnal variation of precipitation from the perspectives of precipitation amount, intensity and duration over Sumatra from rain gauge observations. Int. J. Climatol. 2021, 41, 4386–4397. [Google Scholar] [CrossRef]
  18. Hong, Y.; Hsu, K.; Moradkhani, H.; Sorooshian, S. Uncertainty quantification of satellite precipitation estimation and Monte Carlo assessment of the error propagation into hydrologic response. Water Resour. Res. 2006, 42, W08421. [Google Scholar] [CrossRef] [Green Version]
  19. Okamoto, K.I.; Ushio, T.; Iguchi, T.; Takahashi, N.; Iwanami, K. The global satellite mapping of precipitation (GSMaP) project. In Proceedings of the 2005 IEEE International Geoscience and Remote Sensing Symposium, Seoul, Korea, 29–29 July 2005; IEEE: Manhattan, NY, USA, 2005; Volume 5, pp. 3414–3416. [Google Scholar]
  20. Joyce, R.J.; Janowiak, J.E.; Arkin, P.A.; Xie, P. CMORPH: A method that produces global precipitation estimates from passive microwave and infrared data at high spatial and temporal resolution. J. Hydrometeorol. 2004, 5, 487–503. [Google Scholar] [CrossRef]
  21. Funk, C.; Peterson, P.; Landsfeld, M.; Pedreros, D.; Verdin, J.; Shukla, S.; Husak, G.; Rowland, J.; Harrison, L.; Hoell, A. The climate hazards infrared precipitation with stations—a new environmental record for monitoring extremes. Sci. Data 2015, 2, 150066. [Google Scholar] [CrossRef] [PubMed] [Green Version]
  22. Hsu, K.; Gao, X.; Sorooshian, S.; Gupta, H. V Precipitation estimation from remotely sensed information using artificial neural networks. J. Appl. Meteorol. 1997, 36, 1176–1190. [Google Scholar] [CrossRef]
  23. Huffman, G.J.; Bolvin, D.T.; Nelkin, E.J.; Wolff, D.B.; Adler, R.F.; Gu, G.; Hong, Y.; Bowman, K.P.; Stocker, E.F. The TRMM Multisatellite Precipitation Analysis (TMPA): Quasi-global, multiyear, combined-sensor precipitation estimates at fine scales. J. Hydrometeorol. 2007, 8, 38–55. [Google Scholar] [CrossRef]
  24. Kim, K.; Park, J.; Baik, J.; Choi, M. Evaluation of topographical and seasonal feature using GPM IMERG and TRMM 3B42 over Far-East Asia. Atmos. Res. 2017, 187, 95–105. [Google Scholar] [CrossRef]
  25. Tan, M.L.; Duan, Z. Assessment of GPM and TRMM precipitation products over Singapore. Remote Sens. 2017, 9, 720. [Google Scholar] [CrossRef] [Green Version]
  26. Rozante, J.R.; Vila, D.A.; Chiquetto, J.B.; Fernandes, A.d.A.; Alvim, D.S. Evaluation of TRMM/GPM blended daily products over Brazil. Remote Sens. 2018, 10, 882. [Google Scholar] [CrossRef] [Green Version]
  27. Tang, G.; Clark, M.P.; Papalexiou, S.M.; Ma, Z.; Hong, Y. Have satellite precipitation products improved over last two decades? A comprehensive comparison of GPM IMERG with nine satellite and reanalysis datasets. Remote Sens. Environ. 2020, 240, 111697. [Google Scholar] [CrossRef]
  28. Zhang, Y.; Hanati, G.; Danierhan, S.; Liu, Q.; Xu, Z. Evaluation and comparison of daily gpm/trmm precipitation products over the tianshan mountains in china. Water 2020, 12, 3088. [Google Scholar] [CrossRef]
  29. Arshad, M.; Ma, X.; Yin, J.; Ullah, W.; Ali, G.; Ullah, S.; Liu, M.; Shahzaman, M.; Ullah, I. Evaluation of GPM-IMERG and TRMM-3B42 precipitation products over Pakistan. Atmos. Res. 2021, 249, 105341. [Google Scholar] [CrossRef]
  30. Huffman, G.J.; Bolvin, D.T.; Braithwaite, D.; Hsu, K.; Joyce, R.; Kidd, C.; Nelkin, E.J.; Xie, P. NASA Global Precipitation Measurement (GPM) Integrated Multi-satellitE Retrievals for GPM (IMERG). In Algorithm Theoretical Basis Document (ATBD) Version 4.5; National Aeronautics and Space Administration: Washington, DC, USA, 2015. [Google Scholar]
  31. Huffman, G.J.; Bolvin, D.T.; Braithwaite, D.; Hsu, K.; Joyce, R.; Kidd, C.; Nelkin, E.J.; Sorooshian, S.; Tan, J.; Xie, P. NASA Global Precipitation Measurement (GPM) Integrated Multi-satellitE Retrievals for GPM (IMERG). In Algorithm Theoretical Basis Document (ATBD) Version 06; National Aeronautics and Space Administration: Washington, DC, USA, 2019. [Google Scholar]
  32. Watters, D.; Battaglia, A. The NASA-JAXA Global Precipitation Measurement mission—Part I: New frontiers in precipitation. Weather 2021, 76, 41–44. [Google Scholar] [CrossRef]
  33. Hou, A.Y.; Kakar, R.K.; Neeck, S.; Azarbarzin, A.A.; Kummerow, C.D.; Kojima, M.; Oki, R.; Nakamura, K.; Iguchi, T. The global precipitation measurement mission. Bull. Am. Meteorol. Soc. 2014, 95, 701–722. [Google Scholar] [CrossRef]
  34. Pradhan, R.K.; Markonis, Y.; Vargas Godoy, M.R.; Villalba-Pradas, A.; Andreadis, K.M.; Nikolopoulos, E.I.; Papalexiou, S.M.; Rahim, A.; Tapiador, F.J.; Hanel, M. Review of GPM IMERG performance: A global perspective. Remote Sens. Environ. 2022, 268, 112754. [Google Scholar] [CrossRef]
  35. Schneider, U.; Becker, A.; Finger, P.; Meyer-Christoffer, A.; Ziese, M.; Rudolf, B. GPCC’s new land surface precipitation climatology based on quality-controlled in situ data and its role in quantifying the global water cycle. Theor. Appl. Climatol. 2014, 115, 15–40. [Google Scholar] [CrossRef] [Green Version]
  36. Tan, J.; Huffman, G.J.; Bolvin, D.T.; Nelkin, E.J. IMERG V06: Changes to the morphing algorithm. J. Atmos. Ocean. Technol. 2019, 36, 2471–2482. [Google Scholar] [CrossRef]
  37. Tan, M.L.; Santo, H. Comparison of GPM IMERG, TMPA 3B42 and PERSIANN-CDR satellite precipitation products over Malaysia. Atmos. Res. 2018, 202, 63–76. [Google Scholar] [CrossRef]
  38. Da Silva, N.A.; Webber, B.G.M.; Matthews, A.J.; Feist, M.M.; Stein, T.H.M.; Holloway, C.E.; Abdullah, M.F.A.B. Validation of GPM IMERG Extreme Precipitation in the Maritime Continent by Station and Radar Data. Earth Sp. Sci. 2021, 8, e2021EA001738. [Google Scholar] [CrossRef]
  39. Veloria, A.; Perez, G.J.; Tapang, G.; Comiso, J. Improved rainfall data in the Philippines through concurrent use of GPM IMERG and ground-based measurements. Remote Sens. 2021, 13, 2859. [Google Scholar] [CrossRef]
  40. Liu, C.Y.; Aryastana, P.; Liu, G.R.; Huang, W.R. Assessment of satellite precipitation product estimates over Bali Island. Atmos. Res. 2020, 244, 105032. [Google Scholar] [CrossRef]
  41. Yuda, I.W.A.; Prasetia, R.; As-Syakur, A.R.; Osawa, T.; Nagai, M. An assessment of IMERG rainfall products over Bali at multiple time scale. In Proceedings of the International Conference on Sustainability Science and Management: Advanced Technology in Environmental Research (CORECT-IJJSS 2019), Bali, Indonesia, 14–15 November 2019; E3S Web of Conferences: Cergy-Pontoise, France, 2020; Volume 153. [Google Scholar]
  42. Yusnaini, H.; Ramadhan, R.; Marzuki, M.; Ningsih, A.P.; Hashiguchi, H.; Shimomai, T.; Vonnisa, M.; Harmadi, H.; Suryanto, W.; Sholihun, S. Statistical Comparison of IMERG Precipitation Products with Optical Rain Gauge Observations over Kototabang, Indonesia. J. ILMU Fis. Univ. ANDALAS 2022, 14, 10–20. [Google Scholar]
  43. Ramadhan, R.; Marzuki, M.; Yusnaini, H.; Ningsih, A.P.; Hashiguchi, H.; Shimomai, T.; Vonnisa, M.; Ulfah, S.; Suryanto, W.; Sholihun, S. Ground Validation of GPM IMERG-F Precipitation Products with the Point Rain Gauge Records on the Extreme Rainfall Over a Mountainous Area of Sumatra Island. J. Penelit. Pendidik. IPA 2022, 8, 163–170. [Google Scholar] [CrossRef]
  44. Alsumaiti, T.S.; Hussein, K.; Ghebreyesus, D.T.; Sharif, H.O. Performance of the CMORPH and GPM IMERG products over the United Arab Emirates. Remote Sens. 2020, 12, 1426. [Google Scholar] [CrossRef]
  45. Wicaksana, H.S.; Putra, M.; Djenal, D.P. Evaluation of Automatic Weather Station Performance Based on Parallel Observations at Kemayoran Meteorological Station (in Bahasa). In Proceedings of the Seminar Nasional Teknik Elektro, Bandung, Indonesia, 22 October 2021; Volume 6, pp. 59–64. [Google Scholar]
  46. Masturyono; Heryanto, D.T.; Mulyani, T. Prototype of Automatic Rain Water Sampler ARWS_GSM SYS. 2010. Available online: https://library.wmo.int/pmb_ged/wmo-td_1546_en/P1_26_Masturyono_Indonesia.doc (accessed on 18 November 2021).
  47. Ramadhan, R.; Marzuki, M.; Yusnaini, H.; Muharsyah, R.; Suryanto, W.; Sholihun, S.; Vonnisa, M.; Battaglia, A.; Hashiguchi, H. Capability of GPM IMERG Products for Extreme Precipitation Analysis over the Indonesian Maritime Continent. Remote Sens. 2022, 14, 412. [Google Scholar] [CrossRef]
  48. GEBCO. Gridded Bathymetry Data. Available online: https://www.gebco.net/data_and_products/gridded_bathymetry_data/ (accessed on 18 November 2021).
  49. Kurniawan, A. Evaluasi Pengukuran Curah Hujan Antara Hasil Pengukuran Permukaan (AWS, HELLMAN, OBS) dan Hasil Estimasi (Citra Satelit =GSMaP) Di Stasiun Klimatologi Mlati Tahun 2018. J. Geogr. Edukasi Lingkung. 2020, 4, 1–7. [Google Scholar] [CrossRef]
  50. Keller, C.A.; Knowland, K.E.; Duncan, B.N.; Liu, J.; Anderson, D.C.; Das, S.; Lucchesi, R.A.; Lundgren, E.W.; Nicely, J.M.; Nielsen, E.; et al. Description of the NASA GEOS Composition Forecast Modeling System GEOS-CF v1.0. J. Adv. Model. Earth Syst. 2021, 13, e2020MS002413. [Google Scholar] [CrossRef]
  51. Gelaro, R.; McCarty, W.; Suárez, M.J.; Todling, R.; Molod, A.; Takacs, L.; Randles, C.A.; Darmenov, A.; Bosilovich, M.G.; Reichle, R.; et al. The modern-era retrospective analysis for research and applications, version 2 (MERRA-2). J. Clim. 2017, 30, 5419–5454. [Google Scholar] [CrossRef] [PubMed]
  52. Sungmin, O.; Foelsche, U.; Kirchengast, G.; Fuchsberger, J.; Tan, J.; Petersen, W.A. Evaluation of GPM IMERG Early, Late, and Final rainfall estimates using WegenerNet gauge data in southeastern Austria. Hydrol. Earth Syst. Sci. 2017, 21, 6559–6572. [Google Scholar] [CrossRef] [Green Version]
  53. Huffman, G.J.; Bolvin, D.T.; Braithwaite, D.; Hsu, K.; Joyce, R.; Xie, P.; Yoo, S.H. Algorithm Theoretical Basis Document (ATBD) Version 06. Available online: https://gpm.nasa.gov/sites/default/files/2020-05/IMERG_ATBD_V06.3.pdf (accessed on 4 December 2021).
  54. Huang, W.R.; Chang, Y.H.; Liu, P.Y. Assessment of IMERG precipitation over Taiwan at multiple timescales. Atmos. Res. 2018, 214, 239–249. [Google Scholar] [CrossRef]
  55. Mahmoud, M.T.; Mohammed, S.A.; Hamouda, M.A.; Mohamed, M.M. Impact of topography and rainfall intensity on the accuracy of imerg precipitation estimates in an arid region. Remote Sens. 2021, 13, 13. [Google Scholar] [CrossRef]
  56. Sharifi, E.; Steinacker, R.; Saghafian, B. Assessment of GPM-IMERG and other precipitation products against gauge data under different topographic and climatic conditions in Iran: Preliminary results. Remote Sens. 2016, 8, 135. [Google Scholar] [CrossRef] [Green Version]
  57. Yong, B.; Ren, L.L.; Hong, Y.; Wang, J.H.; Gourley, J.J.; Jiang, S.H.; Chen, X.; Wang, W. Hydrologic evaluation of Multisatellite Precipitation Analysis standard precipitation products in basins beyond its inclined latitude band: A case study in Laohahe basin, China. Water Resour. Res. 2010, 46, W07542. [Google Scholar] [CrossRef] [Green Version]
  58. Aldrian, E.; Dwi Susanto, R. Identification of three dominant rainfall regions within Indonesia and their relationship to sea surface temperature. Int. J. Climatol. 2003, 23, 1435–1452. [Google Scholar] [CrossRef]
  59. As-syakur, A.R.; Tanaka, T.; Osawa, T.; Mahendra, M.S. Indonesian rainfall variability observation using TRMM multi-satellite data. Int. J. Remote Sens. 2013, 34, 7723–7738. [Google Scholar] [CrossRef]
  60. Marzuki, M.; Hashiguchi, H.; Yamamoto, M.K.; Yamamoto, M.; Mori, S.; Yamanaka, M.D.; Carbone, R.E.; Tuttle, J.D. Cloud episode propagation over the Indonesian Maritime Continent from 10 years of infrared brightness temperature observations. Atmos. Res. 2013, 120, 268–286. [Google Scholar] [CrossRef]
  61. Lu, C.; Ye, J.; Fang, G.; Huang, X.; Yan, M. Assessment of gpm imerg satellite precipitation estimation under complex climatic and topographic conditions. Atmosphere 2021, 12, 780. [Google Scholar] [CrossRef]
  62. Rojas, Y.; Minder, J.R.; Campbell, L.S.; Massmann, A.; Garreaud, R. Assessment of GPM IMERG satellite precipitation estimation and its dependence on microphysical rain regimes over the mountains of south-central Chile. Atmos. Res. 2021, 253, 105454. [Google Scholar] [CrossRef]
  63. Vila, D.A.; de Goncalves, L.G.G.; Toll, D.L.; Rozante, J.R. Statistical evaluation of combined daily gauge observations and rainfall satellite estimates over continental South America. J. Hydrometeorol. 2009, 10, 533–543. [Google Scholar] [CrossRef]
  64. Wilks, D.S. Statistical Methods in the Atmospheric Sciences; Academic Press: Cambridge, MA, USA, 2011. [Google Scholar]
  65. Ebert, E.E.; Janowiak, J.E.; Kidd, C. Comparison of near-real-time precipitation estimates from satellite observations and numerical models. Bull. Am. Meteorol. Soc. 2007, 88, 47–64. [Google Scholar] [CrossRef] [Green Version]
  66. Watters, D.; Battaglia, A.; Allan, R.P. The diurnal cycle of precipitation according to multiple decades of global satellite observations, three CMIP6 models, and the ECMWF reanalysis. J. Clim. 2021, 34, 5063–5080. [Google Scholar] [CrossRef]
  67. Marzuki, M.; Yusnaini, H.; Ramadhan, R.; Tangang, F.; Amirudin, A.A.B.; Hashiguchi, H.; Shimomai, T.; Vonnisa, M. Characteristics of Precipitation Diurnal Cycle over a Mountainous Area of Sumatra Island including MJO and Seasonal Signatures Based on the 15-Year Optical Rain Gauge Data, WRF Model and IMERG. Atmosphere 2022, 13, 63. [Google Scholar] [CrossRef]
  68. Moazami, S.; Najafi, M.R. A comprehensive evaluation of GPM-IMERG V06 and MRMS with hourly ground-based precipitation observations across Canada. J. Hydrol. 2021, 594, 125929. [Google Scholar] [CrossRef]
  69. Freitas, E.d.S.; Coelho, V.H.R.; Xuan, Y.; Melo, D.d.C.D.; Gadelha, A.N.; Santos, E.A.; Galvão, C.d.O.; Ramos Filho, G.M.; Barbosa, L.R.; Huffman, G.J.; et al. The performance of the IMERG satellite-based product in identifying sub-daily rainfall events and their properties. J. Hydrol. 2020, 589, 10–20. [Google Scholar] [CrossRef]
  70. Xu, S.; Shen, Y.; Niu, Z. Evaluation of the IMERG version 05B precipitation product and comparison with IMERG version 04A over mainland China at hourly and daily scales. Adv. Sp. Res. 2019, 63, 125128. [Google Scholar] [CrossRef]
  71. Wong, J.S.; Razavi, S.; Bonsal, B.R.; Wheater, H.S.; Asong, Z.E. Inter-comparison of daily precipitation products for large-scale hydro-climatic applications over Canada. Hydrol. Earth Syst. Sci. 2017, 21, 2387–2398. [Google Scholar] [CrossRef] [Green Version]
  72. Mohsan, M.; Acierto, R.A.; Kawasaki, A.; Zin, W.W. Preliminary assessment of GPM satellite rainfall over Myanmar. J. Disaster Res. 2018, 13, 2163–2185. [Google Scholar] [CrossRef]
  73. Li, R.; Shi, J.; Ji, D.; Zhao, T.; Plermkamon, V.; Moukomla, S.; Kuntiyawichai, K.; Kruasilp, J. Evaluation and hydrological application of TRMM and GPM precipitation products in a tropical monsoon basin of Thailand. Water 2019, 11, 818. [Google Scholar] [CrossRef] [Green Version]
  74. Wang, W.; Lu, H.; Zhao, T.; Jiang, L.; Shi, J. Evaluation and comparison of daily rainfall from latest GPM and TRMM products over the Mekong River Basin. IEEE J. Sel. Top. Appl. Earth Obs. Remote Sens. 2017, 10, 818. [Google Scholar] [CrossRef]
  75. Lee, H. General Rainfall Patterns in Indonesia and the Potential Impacts of Local Seas on Rainfall Intensity. Water 2015, 7, 2540–2549. [Google Scholar] [CrossRef]
  76. Bappenas. RAN API Review: Scientific Base Study of Atmospheric Climate Projections; Bappenas: Jakarta, Indonesia, 2018. [Google Scholar]
  77. Ma, Q.; Li, Y.; Feng, H.; Yu, Q.; Zou, Y.; Liu, F.; Pulatov, B. Performance evaluation and correction of precipitation data using the 20-year IMERG and TMPA precipitation products in diverse subregions of China. Atmos. Res. 2021, 249, 105304. [Google Scholar] [CrossRef]
  78. Salles, L.; Satgé, F.; Roig, H.; Almeida, T.; Olivetti, D.; Ferreira, W. Seasonal effect on spatial and temporal consistency of the new GPM-based IMERG-v5 and GSMaP-v7 satellite precipitation estimates in Brazil’s Central Plateau region. Water 2019, 11, 668. [Google Scholar] [CrossRef] [Green Version]
  79. Ma, Z.; He, K.; Tan, X.; Xu, J.; Fang, W.; He, Y.; Hong, Y. Comparisons of spatially downscaling TMPA and IMERG over the Tibetan Plateau. Remote Sens. 2018, 10, 1883. [Google Scholar] [CrossRef] [Green Version]
  80. Xu, F.; Guo, B.; Ye, B.; Ye, Q.; Chen, H.; Ju, X.; Guo, J.; Wang, Z. Systematical Evaluation of GPM IMERG and TRMM 3B42V7 Precipitation Products in the Huang-Huai-Hai Plain, China. Remote Sens. 2019, 11, 697. [Google Scholar] [CrossRef] [Green Version]
  81. El Kenawy, A.M.; Lopez-Moreno, J.I.; McCabe, M.F.; Vicente-Serrano, S.M. Evaluation of the TMPA-3B42 precipitation product using a high-density rain gauge network over complex terrain in northeastern Iberia. Glob. Planet. Chang. 2015, 133, 188–200. [Google Scholar] [CrossRef] [Green Version]
  82. Retalis, A.; Katsanos, D.; Tymvios, F.; Michaelides, S. Comparison of GPM imerg and TRMM 3B43 products over Cyprus. Remote Sens. 2020, 12, 3212. [Google Scholar] [CrossRef]
  83. Yu, L.; Leng, G.; Python, A.; Peng, J. A comprehensive evaluation of latest GPM IMERG V06 early, late and final precipitation products across China. Remote Sens. 2021, 13, 1208. [Google Scholar] [CrossRef]
  84. Yuan, F.; Zhang, L.; Soe, K.M.W.; Ren, L.; Zhao, C.; Zhu, Y.; Jiang, S.; Liu, Y. Applications of TRMM- and GPM-era multiple- satellite precipitation products for flood simulations at sub-daily scales in a sparsely gauged watershed in Myanmar. Remote Sens. 2019, 11, 140. [Google Scholar] [CrossRef] [Green Version]
  85. Wang, S.; Liu, J.; Wang, J.; Qiao, X.; Zhang, J. Evaluation of GPM IMERG V05B and TRMM 3B42V7 Precipitation products over high mountainous tributaries in Lhasa with dense rain gauges. Remote Sens. 2019, 11, 2080. [Google Scholar] [CrossRef] [Green Version]
  86. Tapiador, F.J.; Navarro, A.; García-Ortega, E.; Merino, A.; Sánchez, J.L.; Marcos, C.; Kummerow, C. The contribution of rain gauges in the calibration of the IMERG product: Results from the first validation over Spain. J. Hydrometeorol. 2020, 21, 161–182. [Google Scholar] [CrossRef]
  87. Tan, M.L.; Samat, N.; Chan, N.W.; Roy, R. Hydro-meteorological assessment of three GPM Satellite Precipitation Products in the Kelantan River Basin, Malaysia. Remote Sens. 2018, 10, 1011. [Google Scholar] [CrossRef] [Green Version]
  88. Maghsood, F.F.; Hashemi, H.; Hosseini, S.H.; Berndtsson, R. Ground validation of GPM IMERG precipitation products over Iran. Remote Sens. 2020, 12, 48. [Google Scholar] [CrossRef] [Green Version]
  89. Ma, Z.; Xu, J.; Zhu, S.; Yang, J.; Tang, G.; Yang, Y.; Shi, Z.; Hong, Y. AIMERG: A new Asian precipitation dataset (0.1°/half-hourly, 2000-2015) by calibrating the GPM-era IMERG at a daily scale using APHRODITE. Earth Syst. Sci. Data 2020, 12, 1544. [Google Scholar] [CrossRef]
  90. Zhou, Z.; Guo, B.; Xing, W.; Zhou, J.; Xu, F.; Xu, Y. Comprehensive evaluation of latest GPM era IMERG and GSMaP precipitation products over mainland China. Atmos. Res. 2020, 246, 105132. [Google Scholar] [CrossRef]
  91. Gao, Z.; Huang, B.; Ma, Z.; Chen, X.; Liu, D.; Qiu, J. Comprehensive comparisons of state-of-the-art gridded precipitation estimates for hydrological applications over southern China. Remote Sens. 2020, 12, 3997. [Google Scholar] [CrossRef]
  92. Gadelha, A.N.; Coelho, V.H.R.; Xavier, A.C.; Barbosa, L.R.; Melo, D.C.D.; Xuan, Y.; Huffman, G.J.; Petersen, W.A.; Almeida, C. das N. Grid box-level evaluation of IMERG over Brazil at various space and time scales. Atmos. Res. 2019, 218, 231–244. [Google Scholar] [CrossRef] [Green Version]
  93. Shi, J.; Yuan, F.; Shi, C.; Zhao, C.; Zhang, L.; Ren, L.; Zhu, Y.; Jiang, S.; Liu, Y. Statistical evaluation of the latest GPM-Era IMERG and GSMaP satellite precipitation products in the Yellow River source region. Water 2020, 12, 1006. [Google Scholar] [CrossRef] [Green Version]
  94. Tian, F.; Hou, S.; Yang, L.; Hu, H.; Hou, A. How does the evaluation of the GPM IMERG rainfall product depend on gauge density and rainfall intensity? J. Hydrometeorol. 2018, 19, 339–349. [Google Scholar] [CrossRef]
  95. Maftukhah, T.; Wijonarko, S.; Rustandi, D. Comparison and correlation among measurement results of observatory, Hellman, and tipping bucket sensors. Instrumentasi 2016, 40, 7–14. [Google Scholar] [CrossRef] [Green Version]
  96. Sevruk, B. Adjustment of tipping-bucket precipitation gauge measurements. Atmos. Res. 1996, 42, 237–246. [Google Scholar] [CrossRef]
  97. Ciach, G.J. Local random errors in tipping-bucket rain gauge measurements. J. Atmos. Ocean. Technol. 2003, 20, 752–759. [Google Scholar] [CrossRef]
  98. Habib, E.; Krajewski, W.F.; Kruger, A. Sampling errors of tipping-bucket rain gauge measurements. J. Hydrol. Eng. 2001, 6, 159–166. [Google Scholar] [CrossRef]
  99. Skofronick-Jackson, G.; Kirschbaum, D.; Petersen, W.; Huffman, G.; Kidd, C.; Stocker, E.; Kakar, R. The Global Precipitation Measurement (GPM) mission’s scientific achievements and societal contributions: Reviewing four years of advanced rain and snow observations. Q. J. R. Meteorol. Soc. 2018, 144, 27–48. [Google Scholar] [CrossRef] [PubMed] [Green Version]
  100. Ma, M.; Wang, H.; Jia, P.; Tang, G.; Wang, D.; Ma, Z.; Yan, H. Application of the GPM-IMERG Products in Flash Flood Warning: A Case Study in Yunnan, China. Remote Sens. 2020, 12, 1954. [Google Scholar] [CrossRef]
  101. Kim, T.; Yang, T.; Zhang, L.; Hong, Y. Near real-time hurricane rainfall forecasting using convolutional neural network models with Integrated Multi-satellitE Retrievals for GPM (IMERG) product. Atmos. Res. 2022, 270, 106037. [Google Scholar] [CrossRef]
  102. Su, J.; Li, X.; Ren, W.; Lü, H.; Zheng, D. How reliable are the satellite-based precipitation estimations in guiding hydrological modelling in South China? J. Hydrol. 2021, 602, 126705. [Google Scholar] [CrossRef]
  103. Schmidli, J.; Frei, C.; Vidale, P.L. Downscaling from GCM precipitation: A benchmark for dynamical and statistical downscaling methods. Int. J. Climatol. J. R. Meteorol. Soc. 2006, 26, 679–689. [Google Scholar] [CrossRef]
  104. Teutschbein, C.; Seibert, J. Bias correction of regional climate model simulations for hydrological climate-change impact studies: Review and evaluation of different methods. J. Hydrol. 2012, 456, 12–29. [Google Scholar] [CrossRef]
  105. Vrac, M.; Noël, T.; Vautard, R. Bias correction of precipitation through Singularity Stochastic Removal: Because occurrences matter. J. Geophys. Res. Atmos. 2016, 121, 5237–5258. [Google Scholar] [CrossRef] [Green Version]
  106. Chen, J.; Brissette, F.P.; Chaumont, D.; Braun, M. Finding appropriate bias correction methods in downscaling precipitation for hydrologic impact studies over North America. Water Resour. Res. 2013, 49, 4187–4205. [Google Scholar] [CrossRef]
Figure 2. Example of the results in the matching of rainfall data in the hourly resolution (a,b) and daily resolution (c,d) in IMC.
Remotesensing 14 01172 g002
Figure 3. Spatial distribution of CC (ac), RMSE (df), RB (gi), POD (jl), FAR (mo), and CSI (pr) of IMERG’s hourly rainfall data with MRG and AWS in IMC.
Remotesensing 14 01172 g003
Figure 4. Spatial distribution of CC (ac), RMSE (df), RB (gi), POD (jl), FAR (mo), and CSI (pr) of IMERG’s daily rainfall data with MRG and AWS in IMC.
Remotesensing 14 01172 g004
Figure 5. Spatial distribution of CC (ac), RMSE (df), and RB (gi) in the inter-comparison between IMERG’s monthly rainfall data relative to MRG and AWS in IMC.
Remotesensing 14 01172 g005
Figure 6. The boxplot of CC (a,b), RMSE (c,d), and RB (e,f) of monthly rainfall data of IMERG data with MRG (left) and AWS (right) for each season where E is IMERG-E, L is IMERG-L, and F is IMERG-F. Red crosses indicate outliers.
Remotesensing 14 01172 g006
Figure 7. Spatial distribution of the average of annual rainfall from MRG and AWS during the period of 2016–2020. All MRG stations have annual data availability above 90%, while AWS only has two stations with data availability above 90%, the remaining having 80–90%.
Remotesensing 14 01172 g007
Figure 8. Annual rainfall from IMERG-E (a), IMERG-L (b), and IMERG-F (c) averaged over 2016–2020, and difference in annual rainfall (ΔR) between IMERG-L and EMERG E (d), IMERG-F and EMERG E (e), and between IMERG-F and EMERG-L (f). Contour lines for annual rainfall < 1500 mm (white line) and ≥4000 m (pink line) are also given in (ac).
Remotesensing 14 01172 g008
Figure 9. The scattering plot of average annual rainfall from all MRG stations in IMC against IMERG-E (a), IMERG-L (b), and IMERG-F (c) during 2016–2020. Color bar indicates the number of gauge stations.
Remotesensing 14 01172 g009
Figure 10. The boxplot of continuous statistical matrics (a,c,e) and categorical statistical matrics (b,d,f) of daily rainfall data from IMERG data with MRG and AWS for all elevation categories. The total stations for each elevation category are 74 (<20 m ASL), 93 (20–300 m ASL), 18 (300–600 m ASL), and 15 (>600 m ASL). Red crosses indicate outliers.
Remotesensing 14 01172 g010
Table 1. Statistical quantities used to evaluate the performance of GPM IMERG data. N is number of samples; Gi, rain-gauge observed precipitation; Si, satellite precipitation estimates; σG and σS, standard deviation of rain-gauge and satellite precipitation, respectively. Every satellite gauge match-up can be classified as a hit (H, observed rain correctly detected), a miss (M, observed rain not detected), a false alarm (F, rain detected but not observed) event.
Statistical QuantitiesEquationPerfect Value
CC 1 N i = 1 N S i S ¯ G i G ¯ / σ S σ G 1
RMSE 1 N i = 1 N S i G i 2 0
RB i = 1 N S i G i / i = 1 N G i 0
POD H / H + M 1
FAR F / H + F 0
CSI H / H + F + M 1
Table 2. Statistical quantities for the monthly rainfall.
Statistical
Quantities
MRGAWS
IMERG-EIMERG-LIMERG-FIMERG-EIMERG-LIMERG-F
CC0.710.730.790.690.700.69
RMSE103.10102.5488.72102.02101.8104.2
RB0.1250.1350.1330.1850.1850.258
Publisher’s Note: MDPI stays neutral with regard to jurisdictional claims in published maps and institutional affiliations.

