1. Introduction
In high-resolution earth observation systems, object detection in high spatial resolution remote sensing images (HSRIs) is the key technology for automatic extraction, analysis and understanding of image information [
1,
2,
3]. It also plays an important role in the application of high-resolution earth observation systems to ocean monitoring, precision strike and military reconnaissance [
4,
5,
6]. Object detection for HSRIs refers to the process of determining whether there are objects of interest and locating the objects of interest in the image [
7]. In this paper, the objects detected are artificial geographical objects (e.g., storage-tanks, cars or airplanes) that have a clear boundary and have nothing to do with the HSRI background.
For object detection of HSRIs, scholars have carried out a lot of research. Mostly object detection methods usually use a three-stage mode of ① extracting object candidate regions, ② obtaining the features of object candidate regions, and ③ classifying object candidate regions using the features to detect objects in HSRIs [
7]. For example, Xiao et al. [
8] extracted object candidate regions using slide windows in various scales. Then, histograms of oriented gradients (HOG) of the object candidate regions were obtained. Finally, the object candidate regions were classified using support vector machines (SVM) to realize airplane and car detection in HSRIs. Cheng et al. [
9] extracted object candidate regions using a slide window. Then, the HOG feature pyramid of the object candidate regions was obtained. Finally, according to the HOG feature pyramid, the object candidate regions were classified using SVM to detect airplanes in HSRIs. Diao et al. [
10] used visual saliency to extract object candidate regions. Then, the features of object candidate regions were obtained and classified using deep belief networks to realize airplanes detection in HSRIs. Han et al. [
11] extracted object candidate regions based on saliency map and visual attention computational model. Then, the features of object candidate regions were obtained and classified using fisher discrimination dictionary learning to realize multi-class object detection in HSRIs. The three-stage mode can achieve acceptable object detection results for object detection tasks in specific scenes [
7]. However, remote sensing satellites in near-earth orbit acquire a large number of HSRIs from a top-down perspective every day, which is a way that is susceptible to illumination and weather conditions [
12]. The three-stage mode cannot be effectively applied to detect objects of a large number of images in different complex scenes [
3]. The universality and robustness of this mode are poor.
In recent years, many studies on deep learning have been carried out. The convolutional neural network (CNN) model is the most widely used deep learning model [
13,
14,
15,
16,
17,
18,
19,
20,
21,
22]. CNN does not need to use artificially designed features and can learn and extract effective features of the image using massive images and annotations. Moreover, with sufficient training data, CNN has good generalization ability, and can also maintain good universality and robustness in different complex scenes [
3]. Therefore, the object detection methods based on CNN have been widely adopted to detect objects for HSRIs [
23,
24,
25,
26,
27]. Long et al. [
28] used regional CNN (R-CNN) to detect multi-class objects for HSRIs. Han et al. [
12] applied transfer learning and Faster R-CNN to detect multi-class objects in HSRIs. Guo et al. [
29] proposed a multi-scale CNN to detect objects in HSRIs, and obtained acceptable object detection results for HSRIs using an object detection framework based on multi-scale CNN. Chen et al. [
30] applied a single shot multi-box detector (SSD) to detect airplanes of HSRIs. Li et al. [
31] proposed an object detection framework based on CNN for object detection of remote sensing images. In the framework, there are two networks: region proposal network (RPN) and local-contextual feature fusion network. In the region proposal network (RPN), multiangle anchors were added. The double-channel feature fusion network was used to learn local and contextual properties. Deng et al. [
32] proposed an object detection framework based on CNN for simultaneously detecting multi-class objects in remote sensing images with large scales variability. There were two subnetworks in the object detection framework. The object-like regions were generated in different scale layers using a multi-scale object proposal network. The object-like regions were classed based on fused feature maps using an accurate object detection network. Dong et al. [
33] proposed an object detection framework based on CNN with suitable object scale features (CNN-SOSF) for multi-class object detection in HSRIs. CNN-SOSF provided acceptable multi-class object detection results in HSRIs. Liu et al. [
34] designed an effective multiclass objects detection framework based on You Only Look Once version 2 (YOLOv2) to obtain acceptable object detection results for HSRIs. Ma et al. [
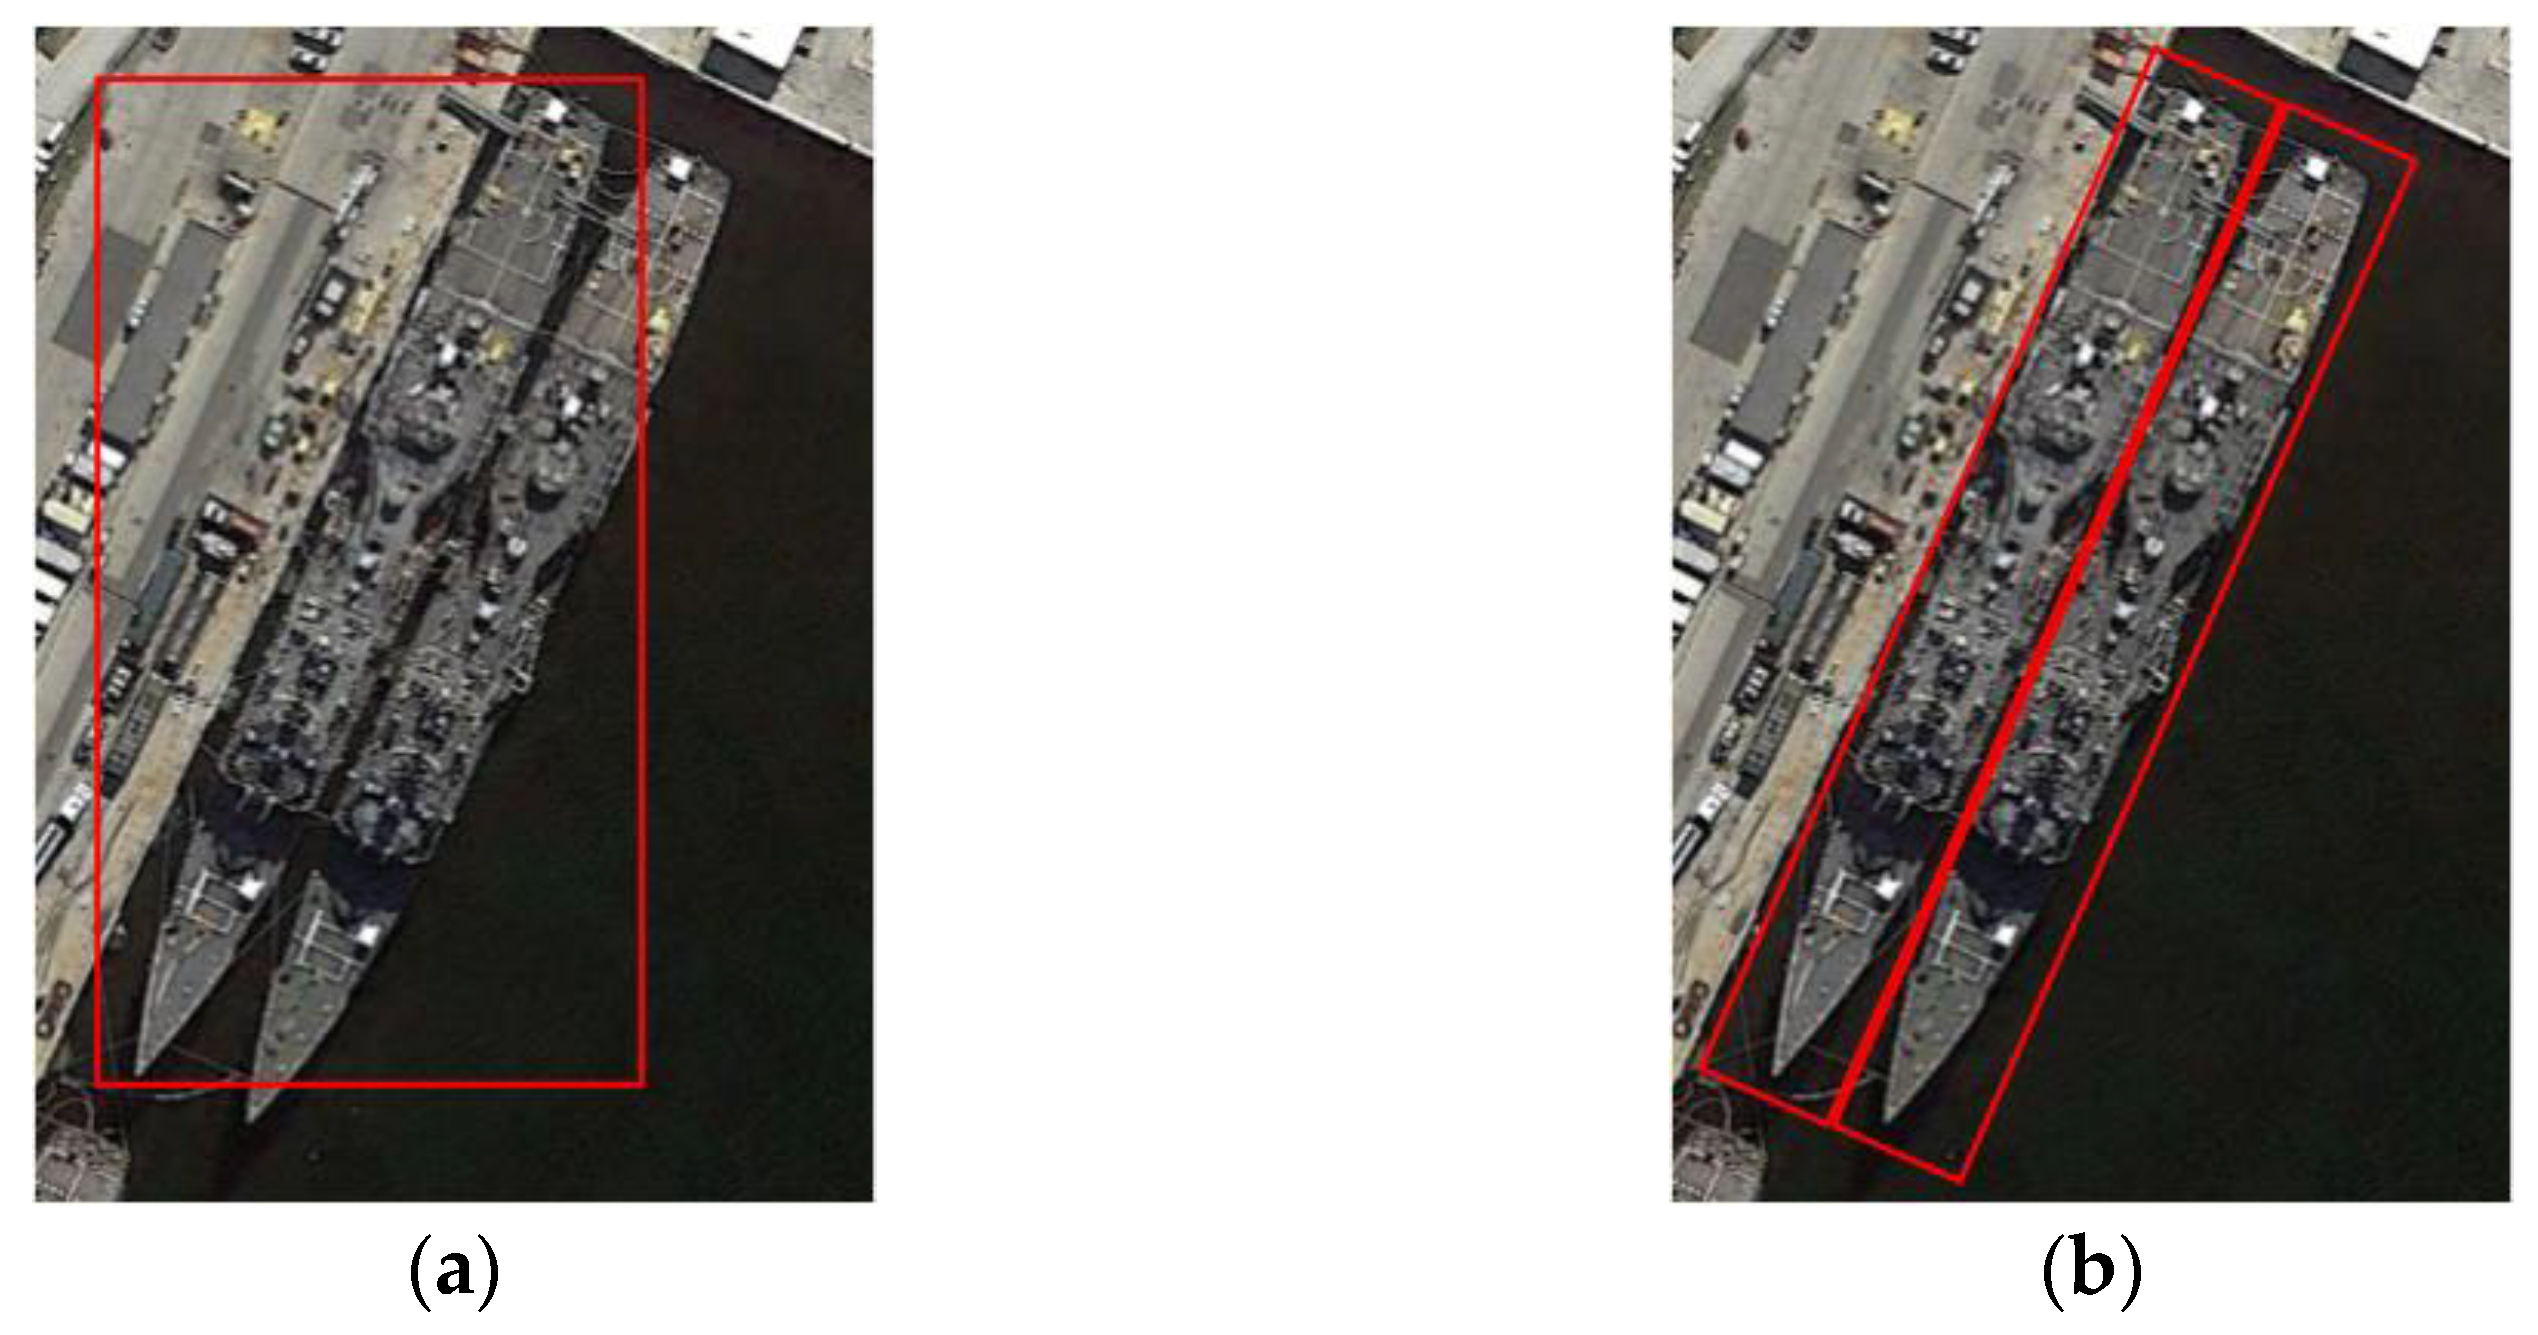
35] proposed the improved YOLOv3 framework to detect collapsed buildings in HSRIs. However, in the above literature object detection frameworks based on CNN, all use the horizontal bounding box to detect objects in HSRIs, they are difficult to adapt to the densely packed object detection with a large aspect ratio, as shown in
Figure 1a. In
Figure 1a, there is a missed detection for the adjacent ships with a large aspect ratio. There is a large redundant area in the detection result of the ship. Therefore, for the objects detection of HSRIs, the object detection framework based on CNN needs to use the oriented bounding box (OBB) to improve the detection accuracy of the densely packed objects with a large aspect ratio, as shown in
Figure 1b.
For using OBB to detect objects in HSRIs, some studies have been carried out. For example, Ding et al. [
36] designed a Rotated Region of Interests (RRoI) learner to transform a Horizontal Region of Interest (HRoI) into an RRoI. The designed RRoI transformer was embedded into an object detector for orient object detection. Li et al. [
37] proposed a feature-attentioned object detection framework to detect orient objects in HSRIs. The proposed framework consisted of three components: feature-attentioned feature pyramid networks, multiple receptive fields attention-based RPN, and proposal-level attention-based ROI module. Yang et al. [
38] proposed a multi-category rotation detector for small, cluttered and rotated objects. In the rotated detector, the supervised pixel attention network and the channel attention network were jointly explored for small and cluttered object detection by suppressing the noise and highlighting the object’s features. For more accurate rotation estimation, the IOU constant factor was added to smooth L1 loss to address the boundary problem for the rotating bounding box. Wang et al. [
39] provided a semantic attention-based mask oriented bounding box representation for multi-category object detection for HSRIs. In the proposed oriented object detector, an inception lateral connection network was used to enhance the FPN. Furthermore, a semantic attention network was adopted to provide the semantic feature to help distinguish the object of interest from the cluttered background effectively. Compared with HBB, object detectors based on OBB are more suitable for object detection of HSRIs. Therefore, object detection based on OBB has become a research hotspot.
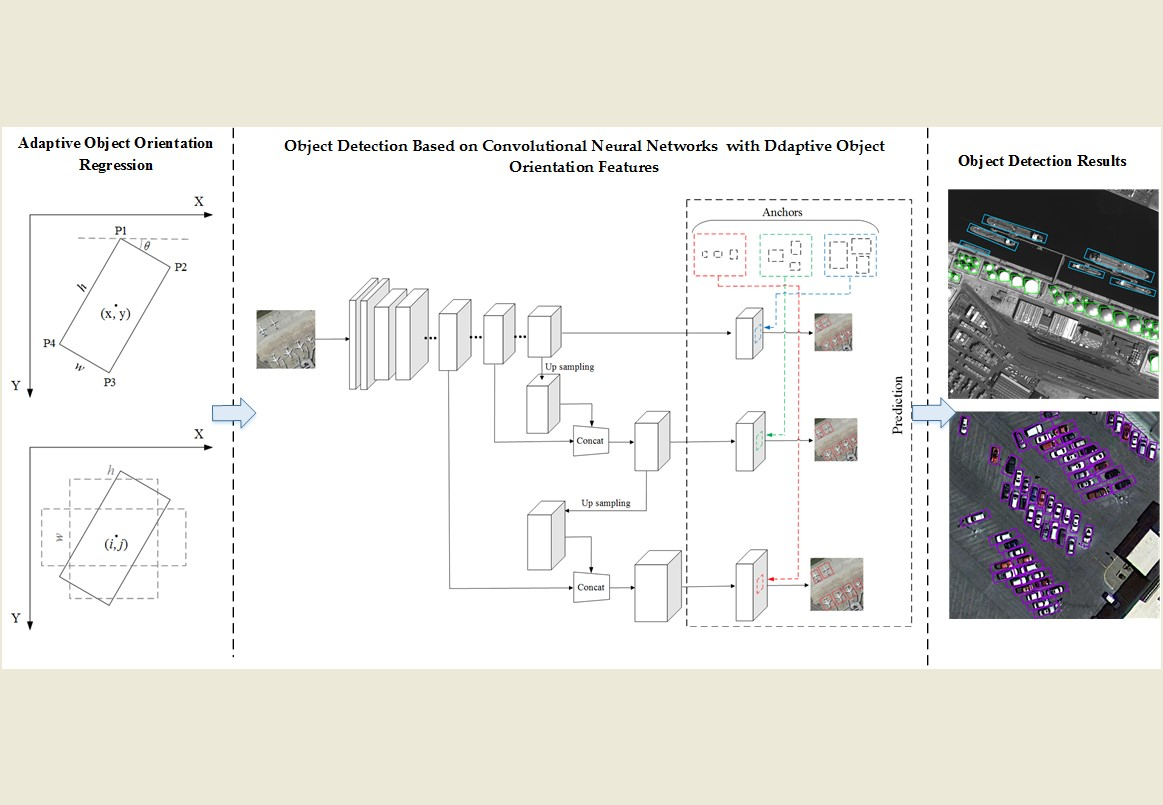
With respect to the multi-angle features of object orientation in HSRIs object detection, this paper presents a novel HSRIs object detection method based on CNN with adaptive object orientation features (CNN-AOOF). First, an adaptive object orientation regression method is proposed. Then, a CNN framework for object detection in HSRIs is designed using the adaptive object orientation regression method.
The main contributions of this paper are as follows:
An HSRI object detection dataset with OBB, WHU-RSONE-OBB, is established and published to promote the development of object detection for HSRIs.
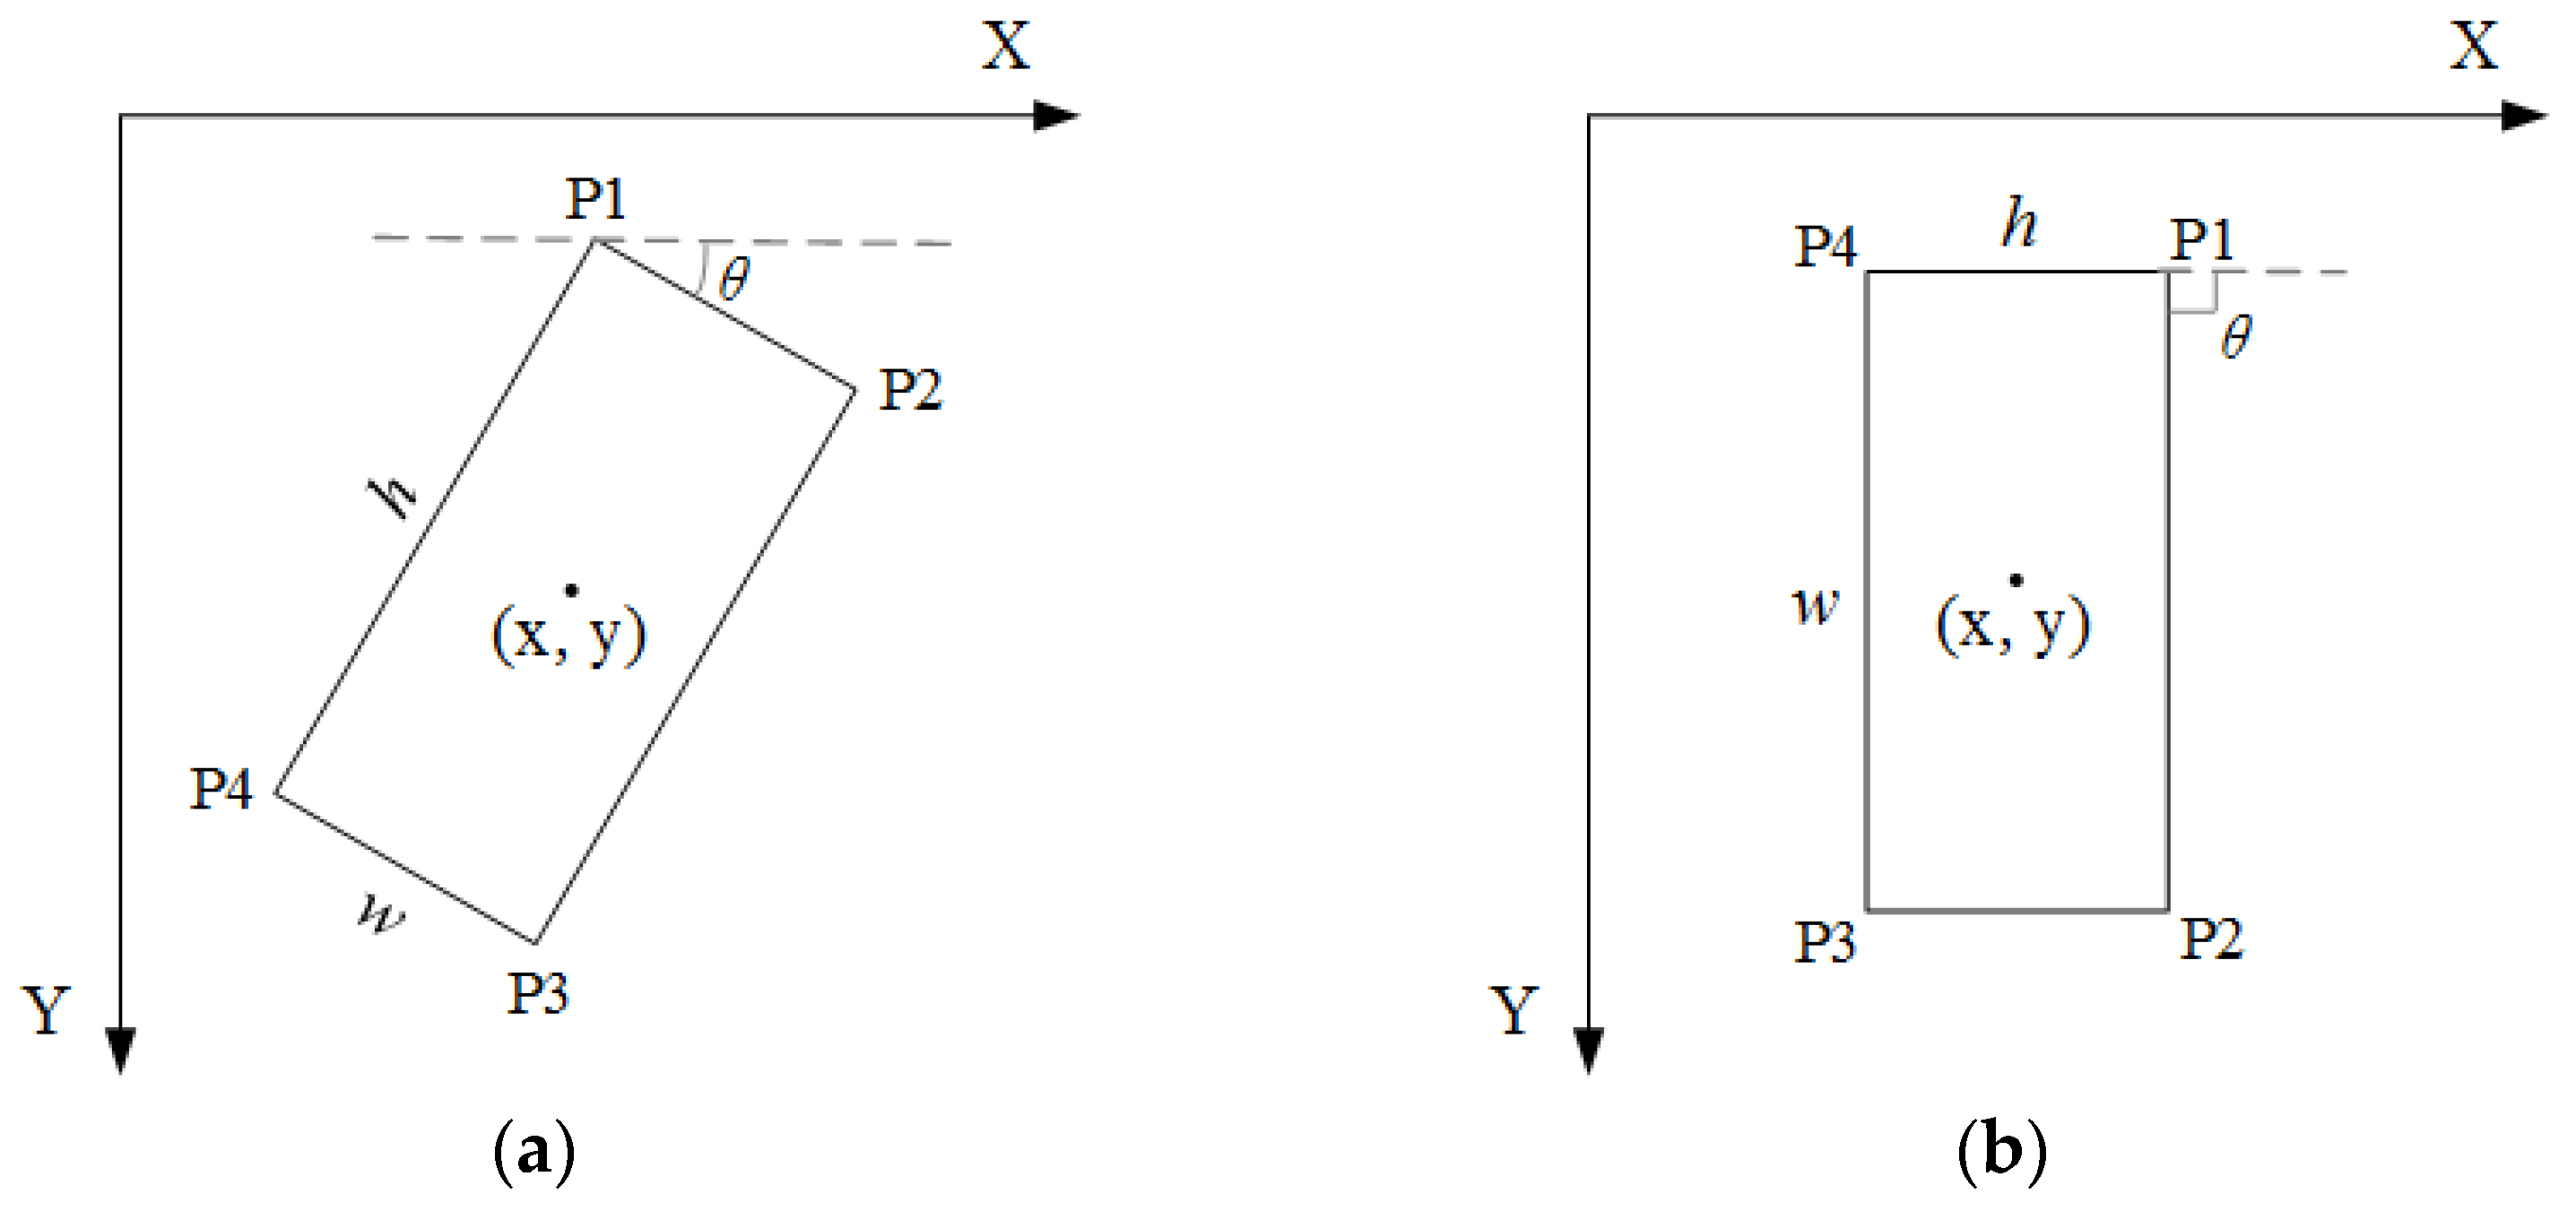
An adaptive object orientation regression method is proposed to obtain object regions in any direction.
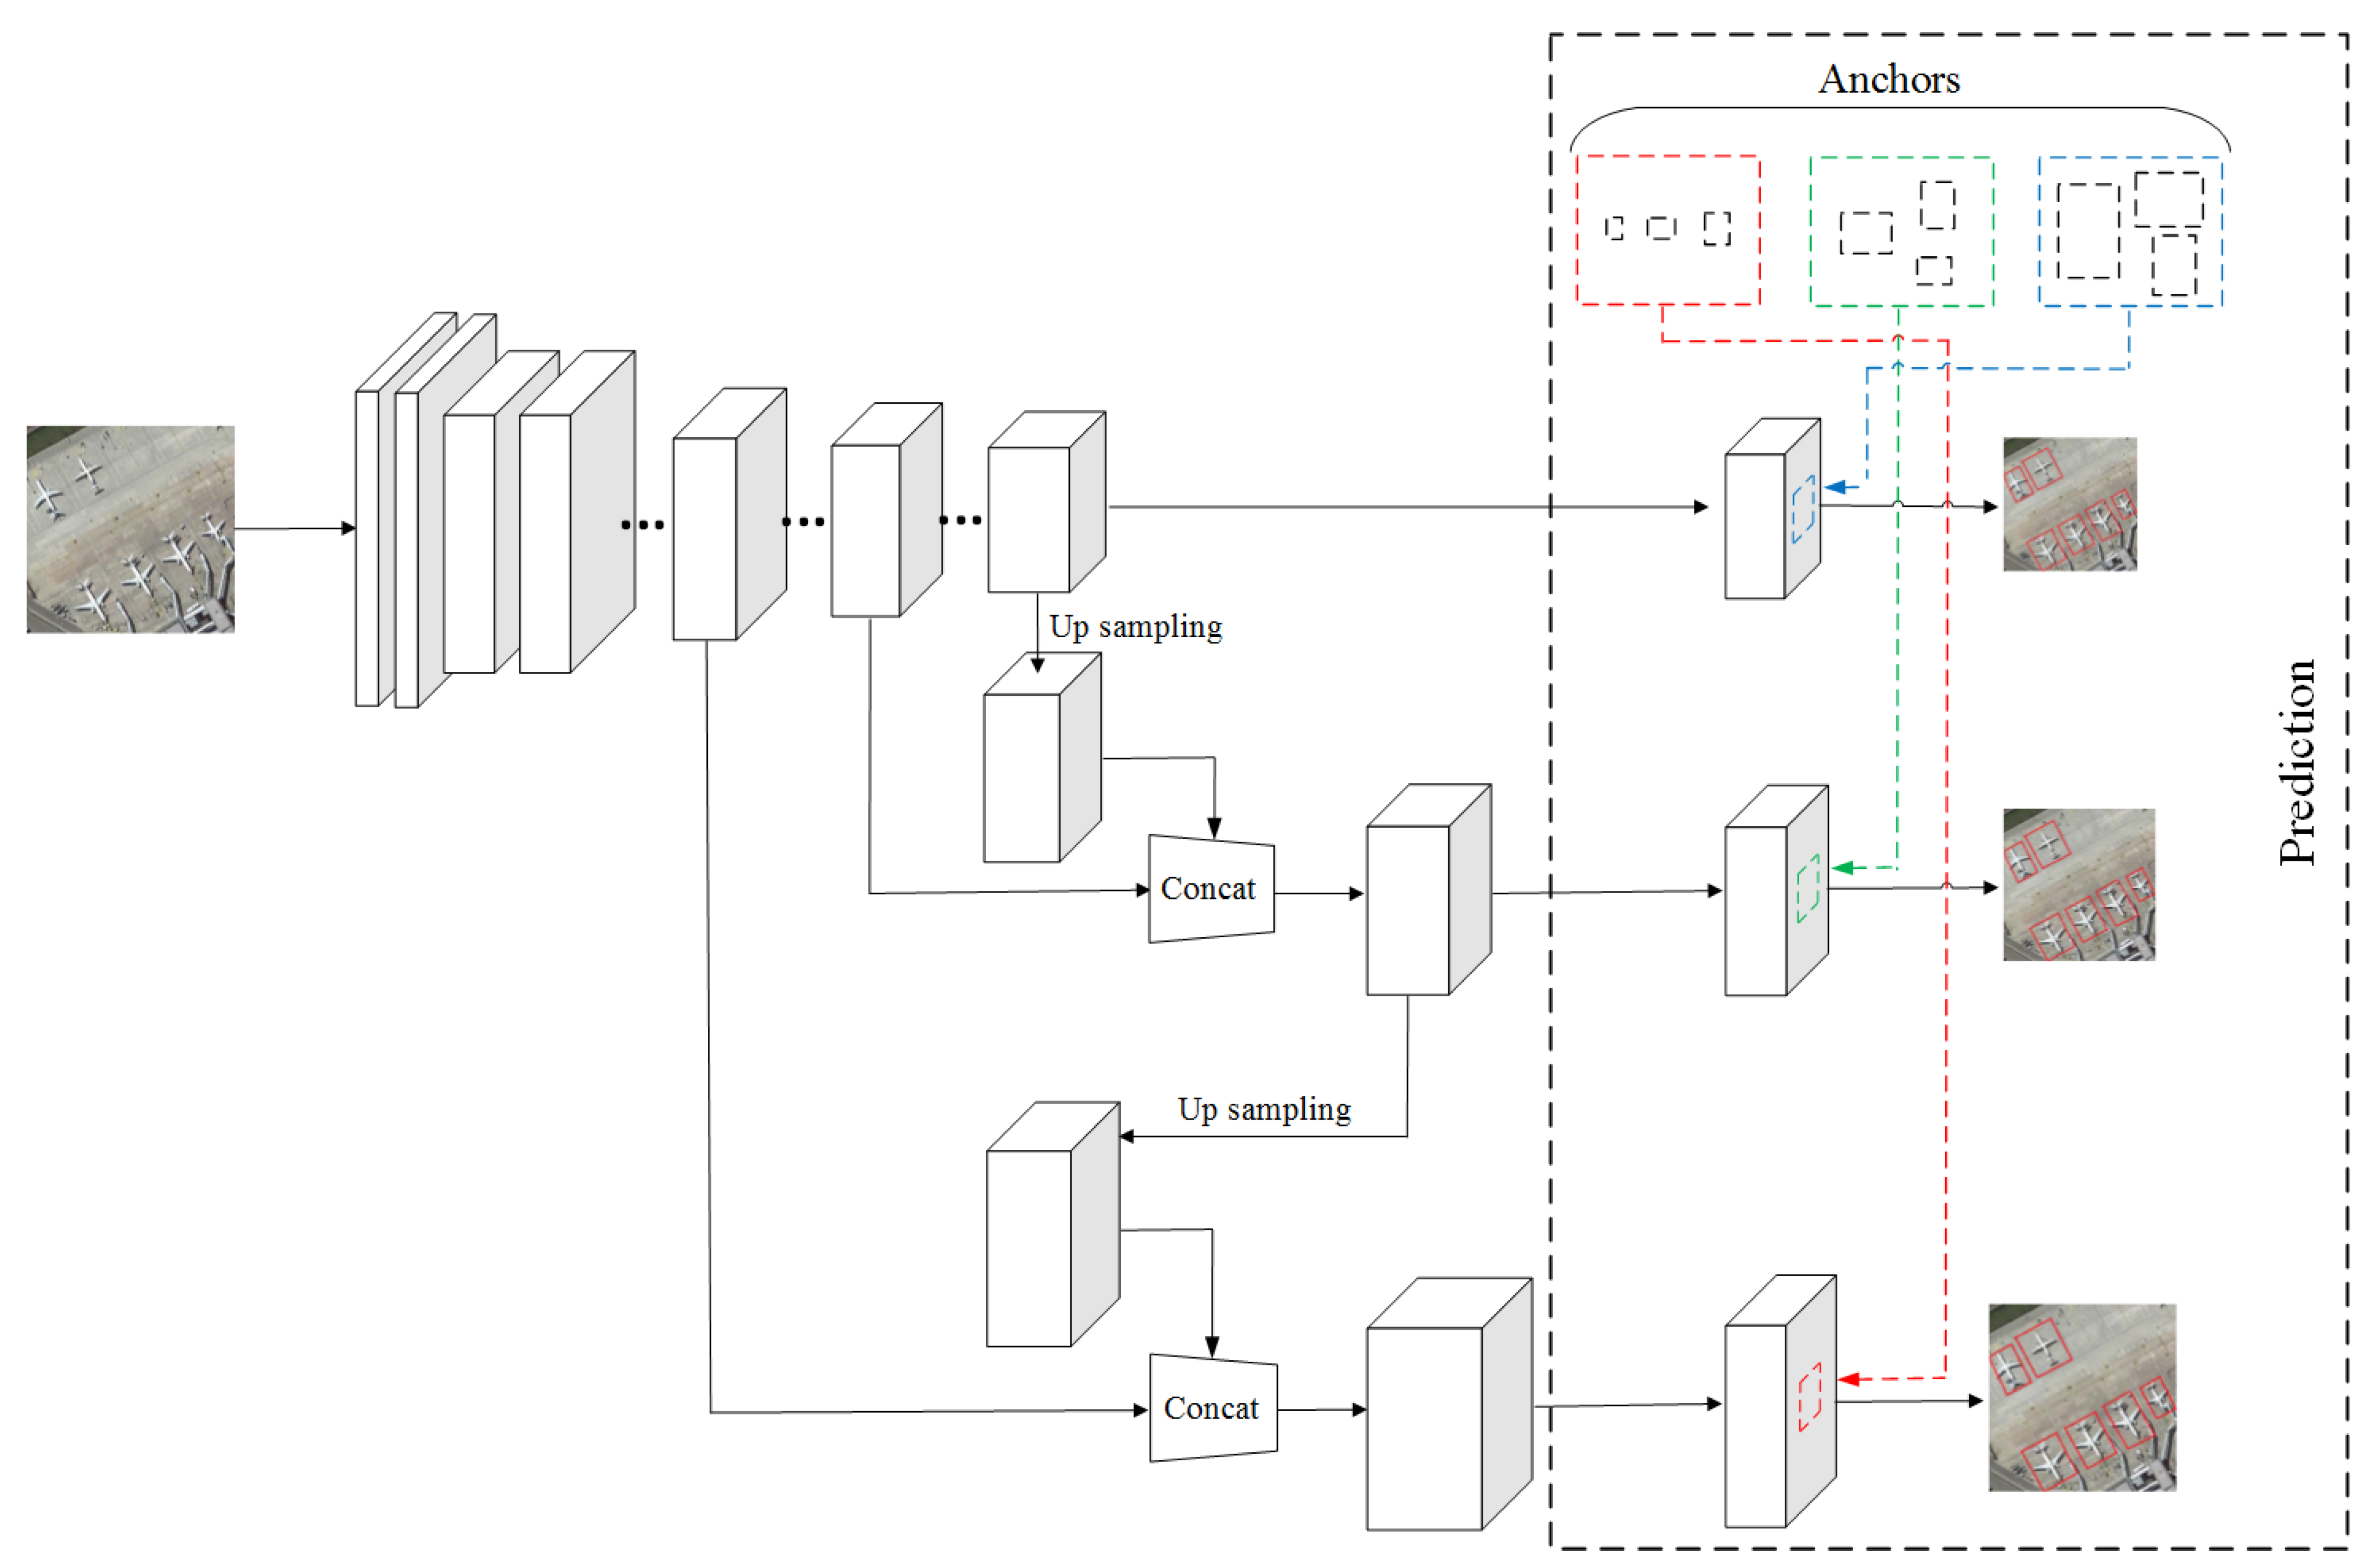
An object detection framework based on CNN with adaptive object orientation features is designed to detect various objects for HSRIs.
The proposed method can more accurately detect objects with large aspect ratios and densely distributed objects than object detectors using a horizontal bounding box.
The rest of this paper is organized as follows. In
Section 2, the CNN-AOOF framework is introduced in detail. In
Section 3 and
Section 4, the datasets are described, and experimental results are discussed and analyzed. In
Section 5, the experimental results are summarized, and the conclusions are drawn.
4. Discussion
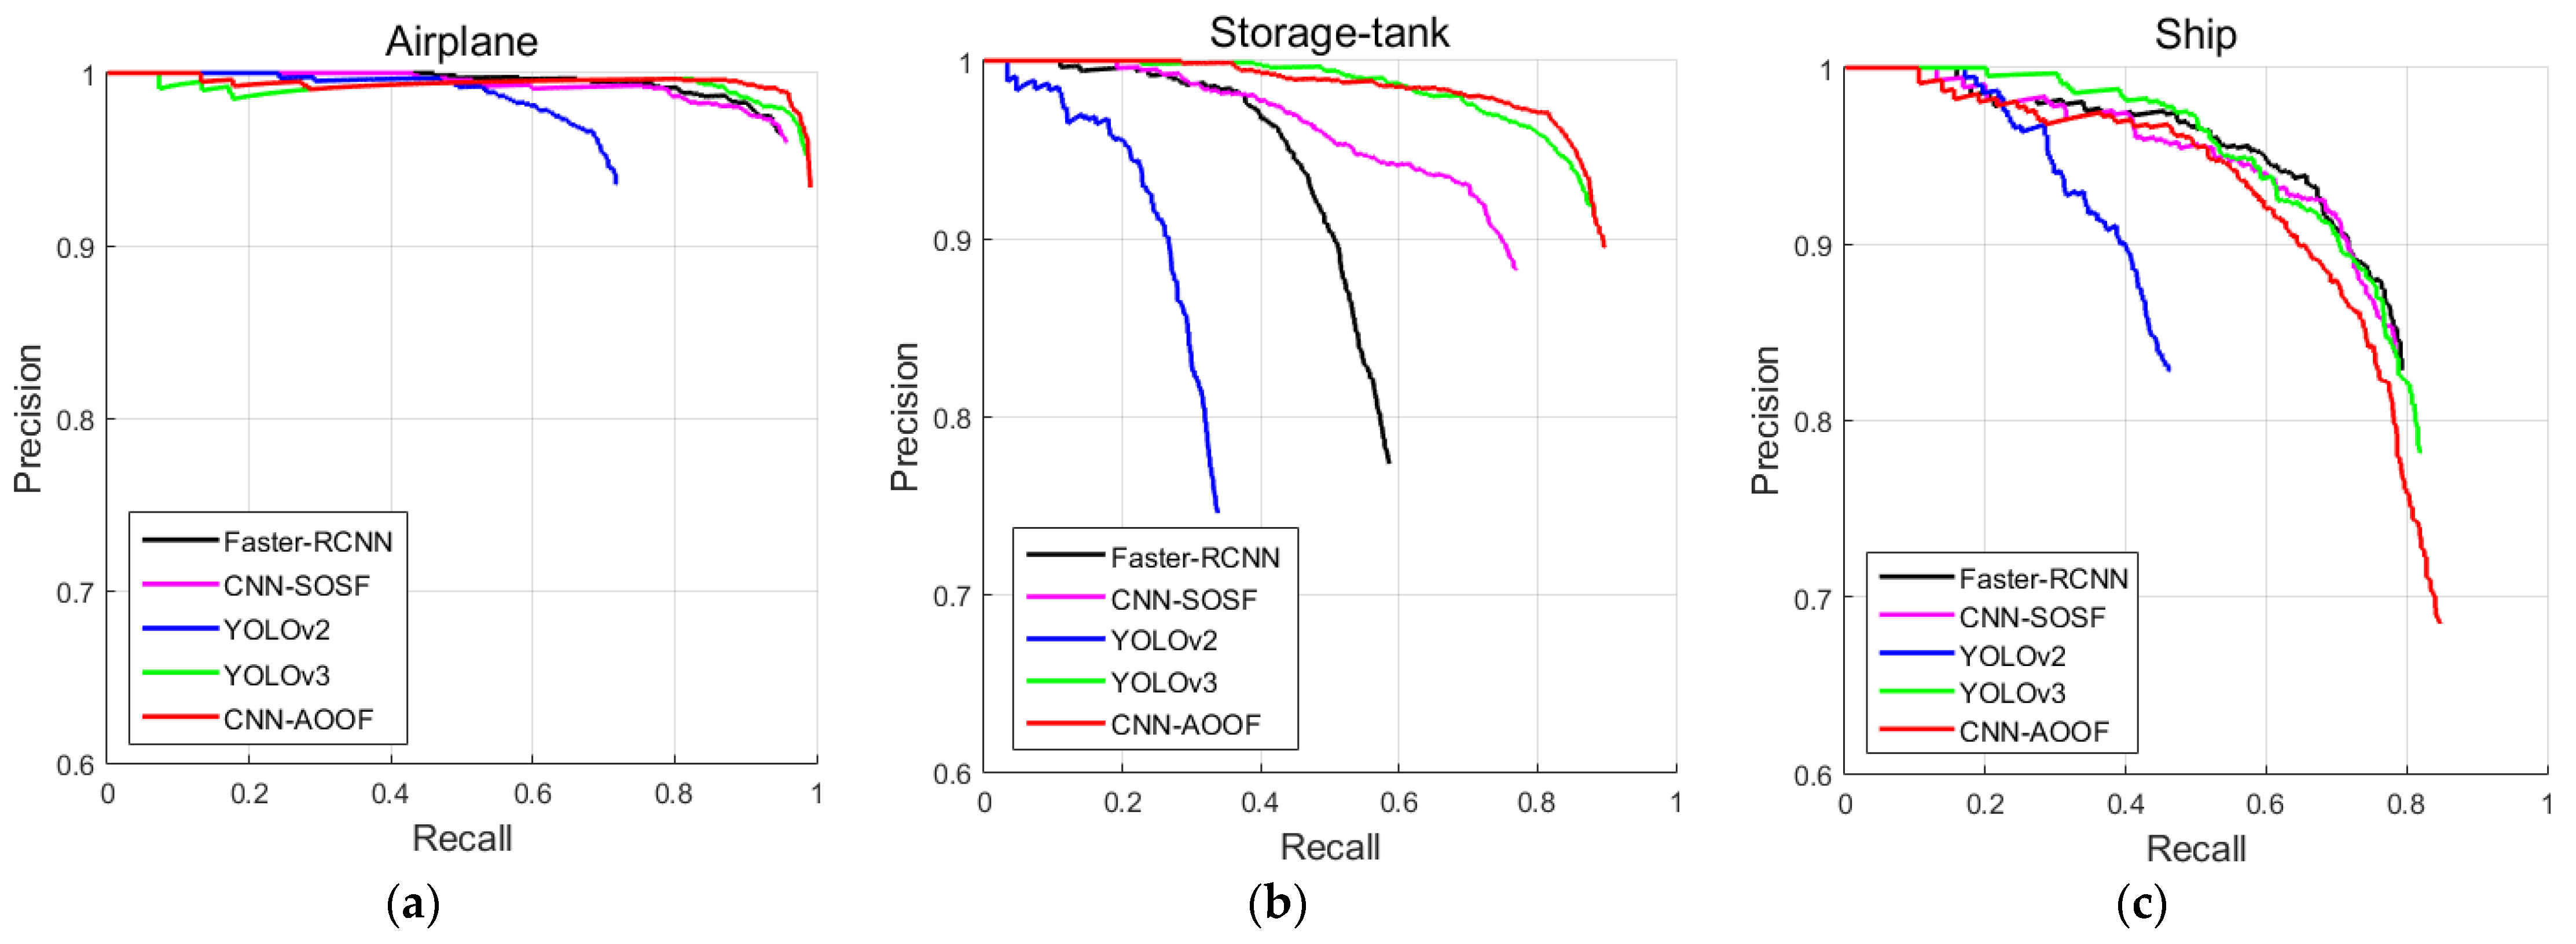
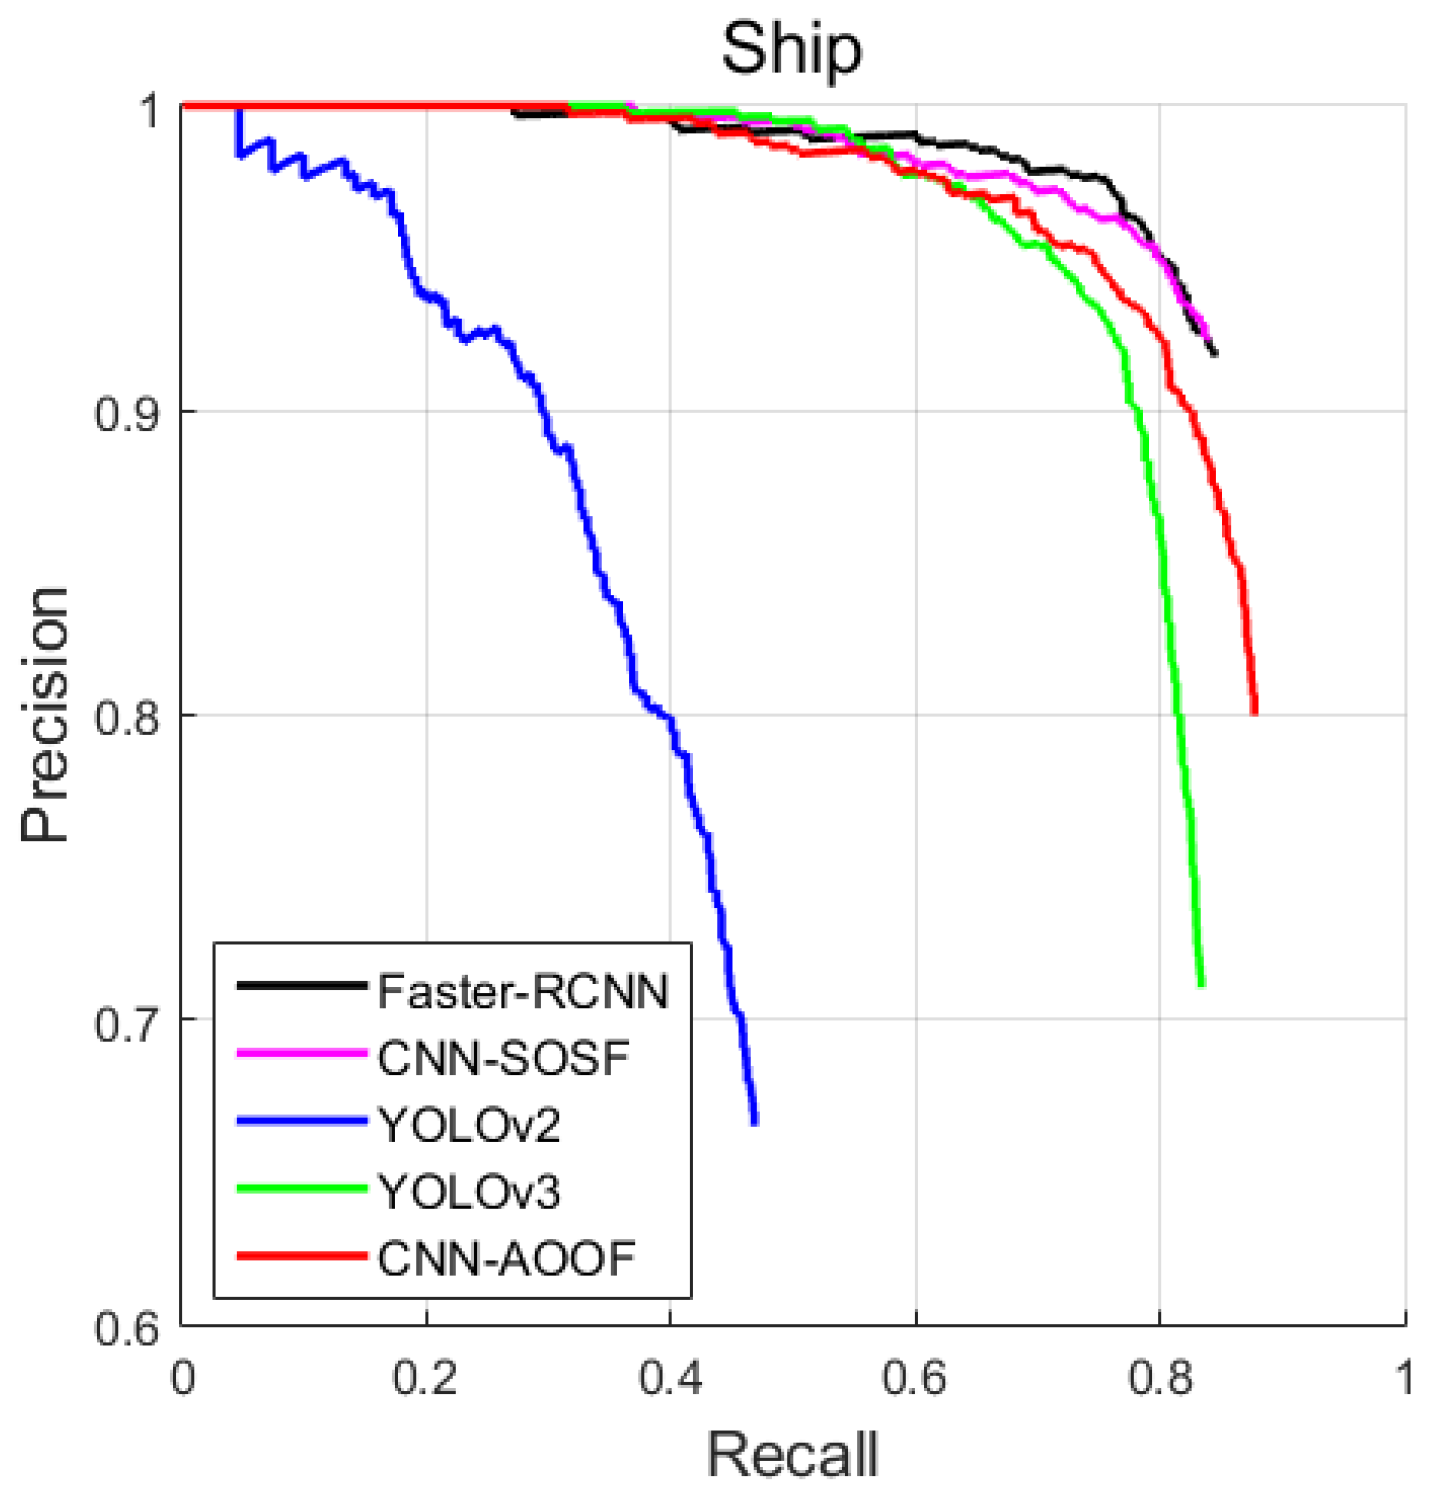
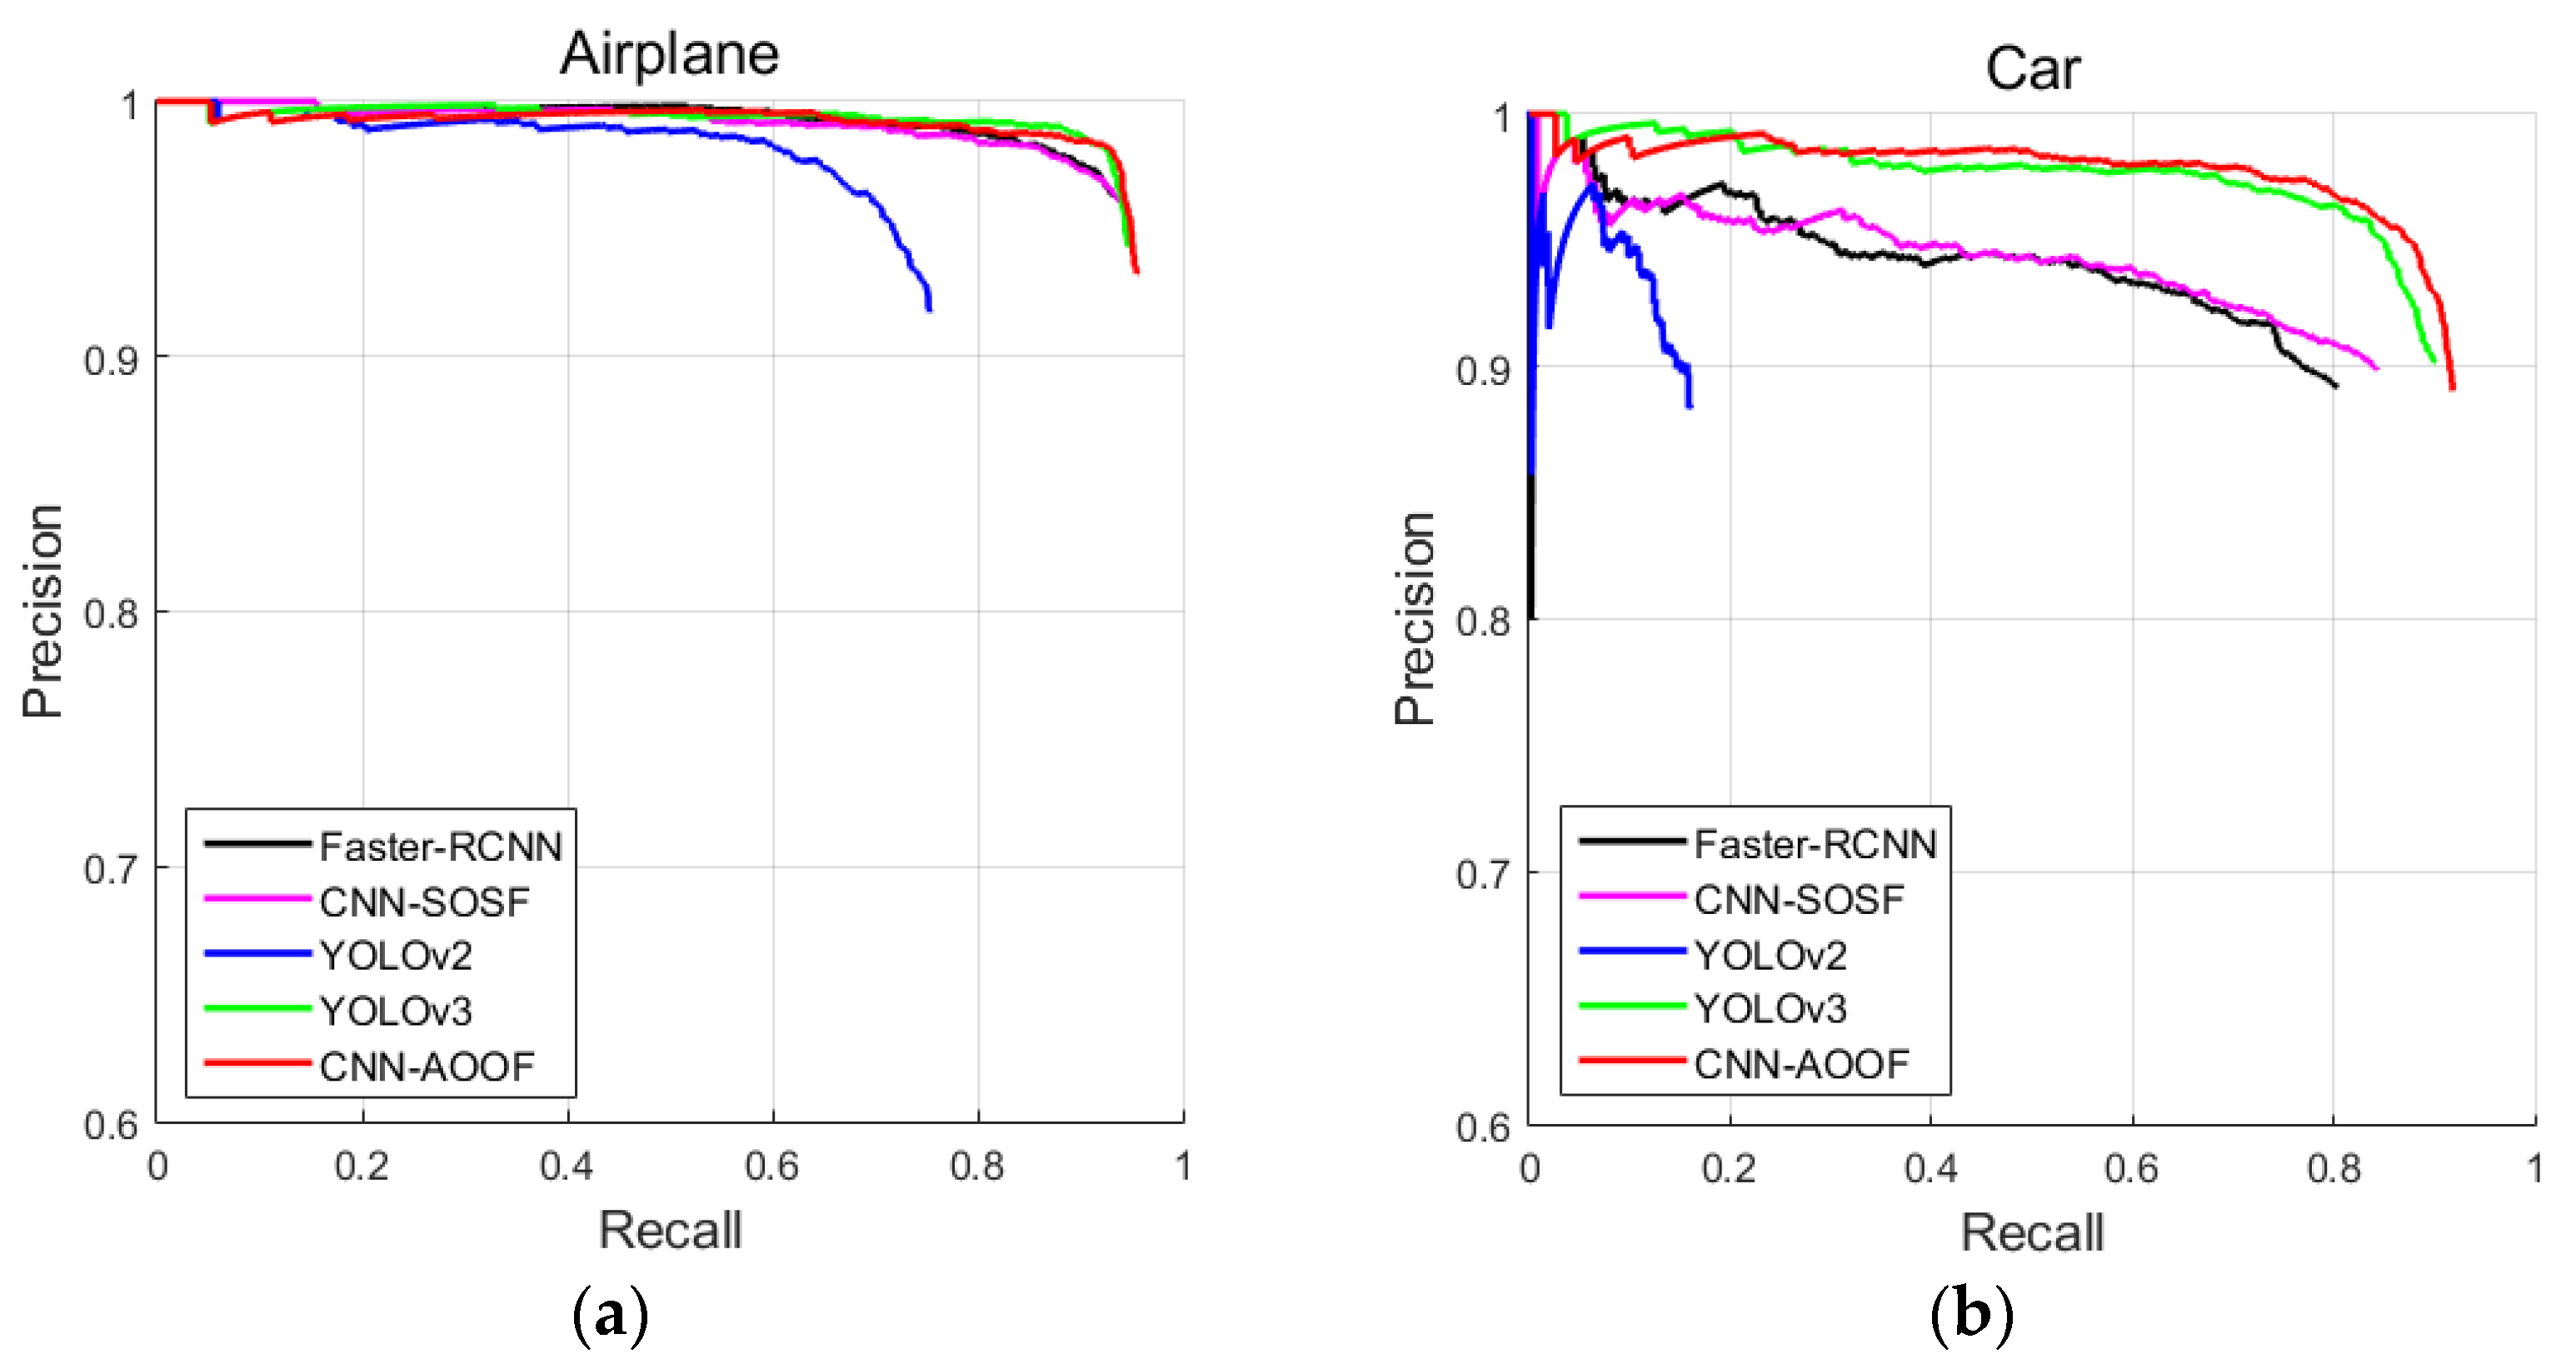
In this section, CNN-AOOF is compared with other object detection algorithms by using visual evaluation. In two-stage object detectors, the object detection accuracy of CNN-SOSF is better than that of Faster-RCNN for WHU-RSONE, UCAS-AOD and HSRC2016 datasets. In single-stage object detectors, the object detection accuracy of YOLOv3 is better than that of YOLOv2. Therefore, CNN-AOOF is compared with CNN-SOSF and YOLOv3 which have greater detection accuracy by using visual discrimination.
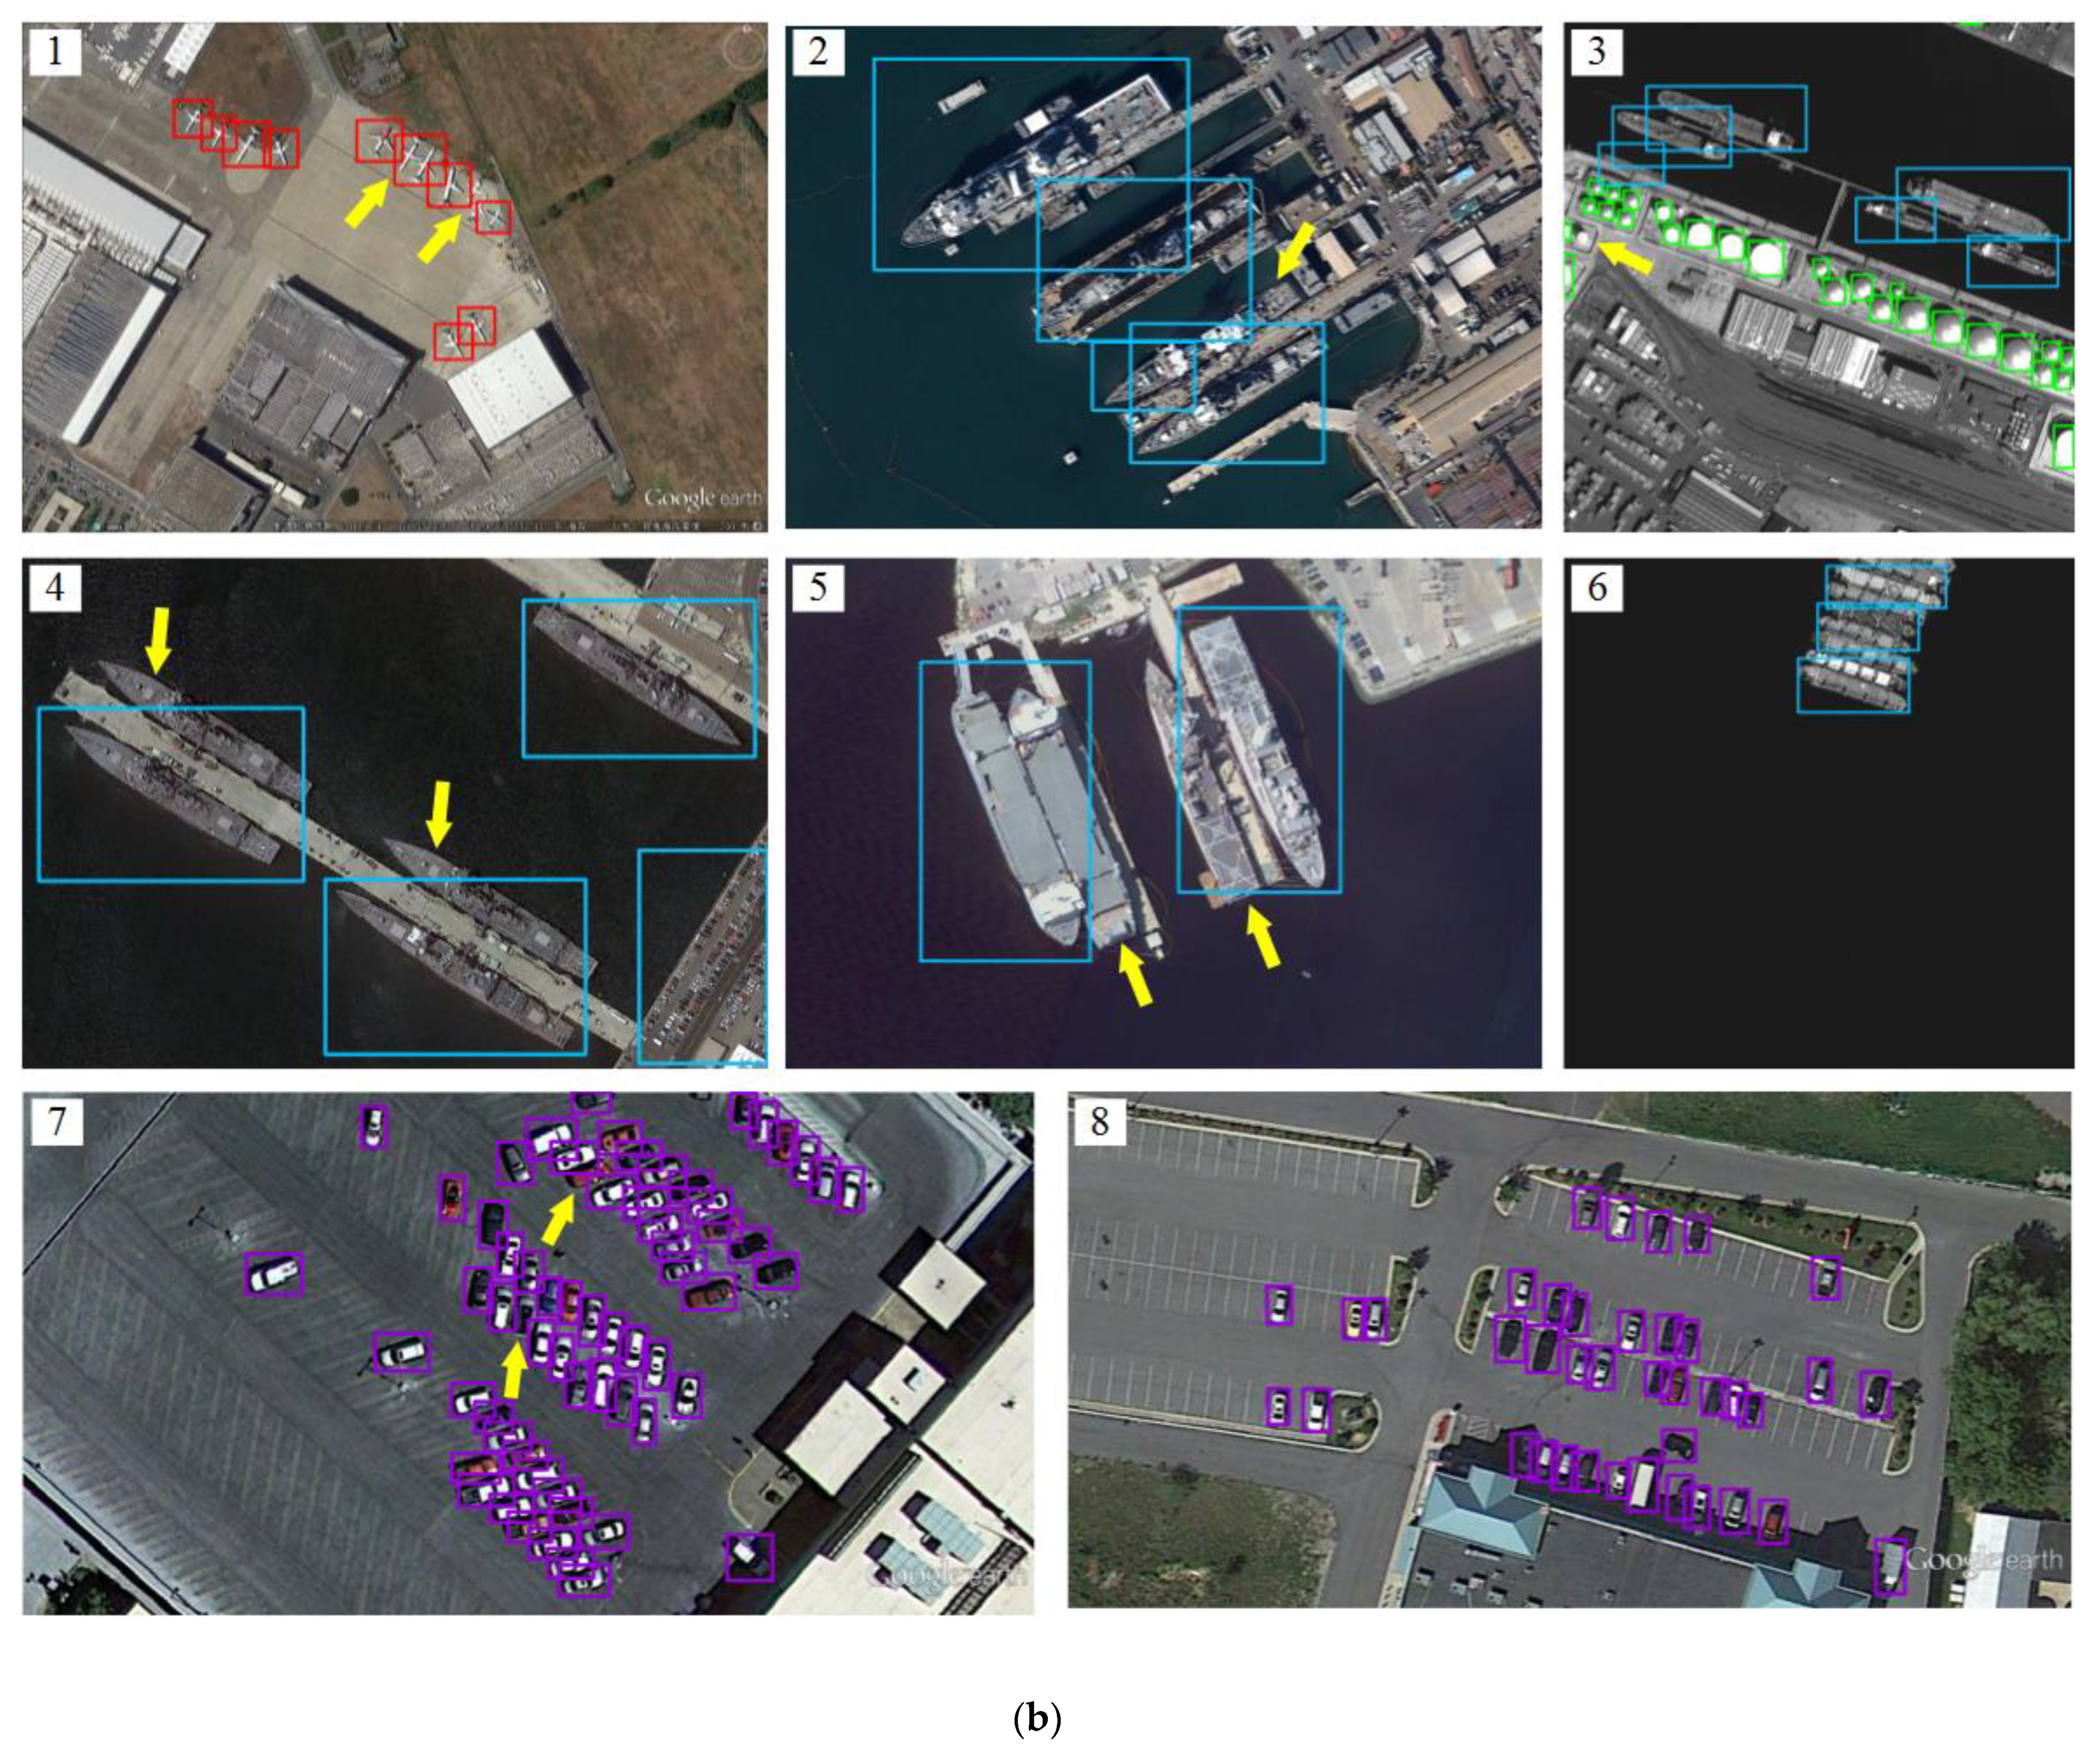
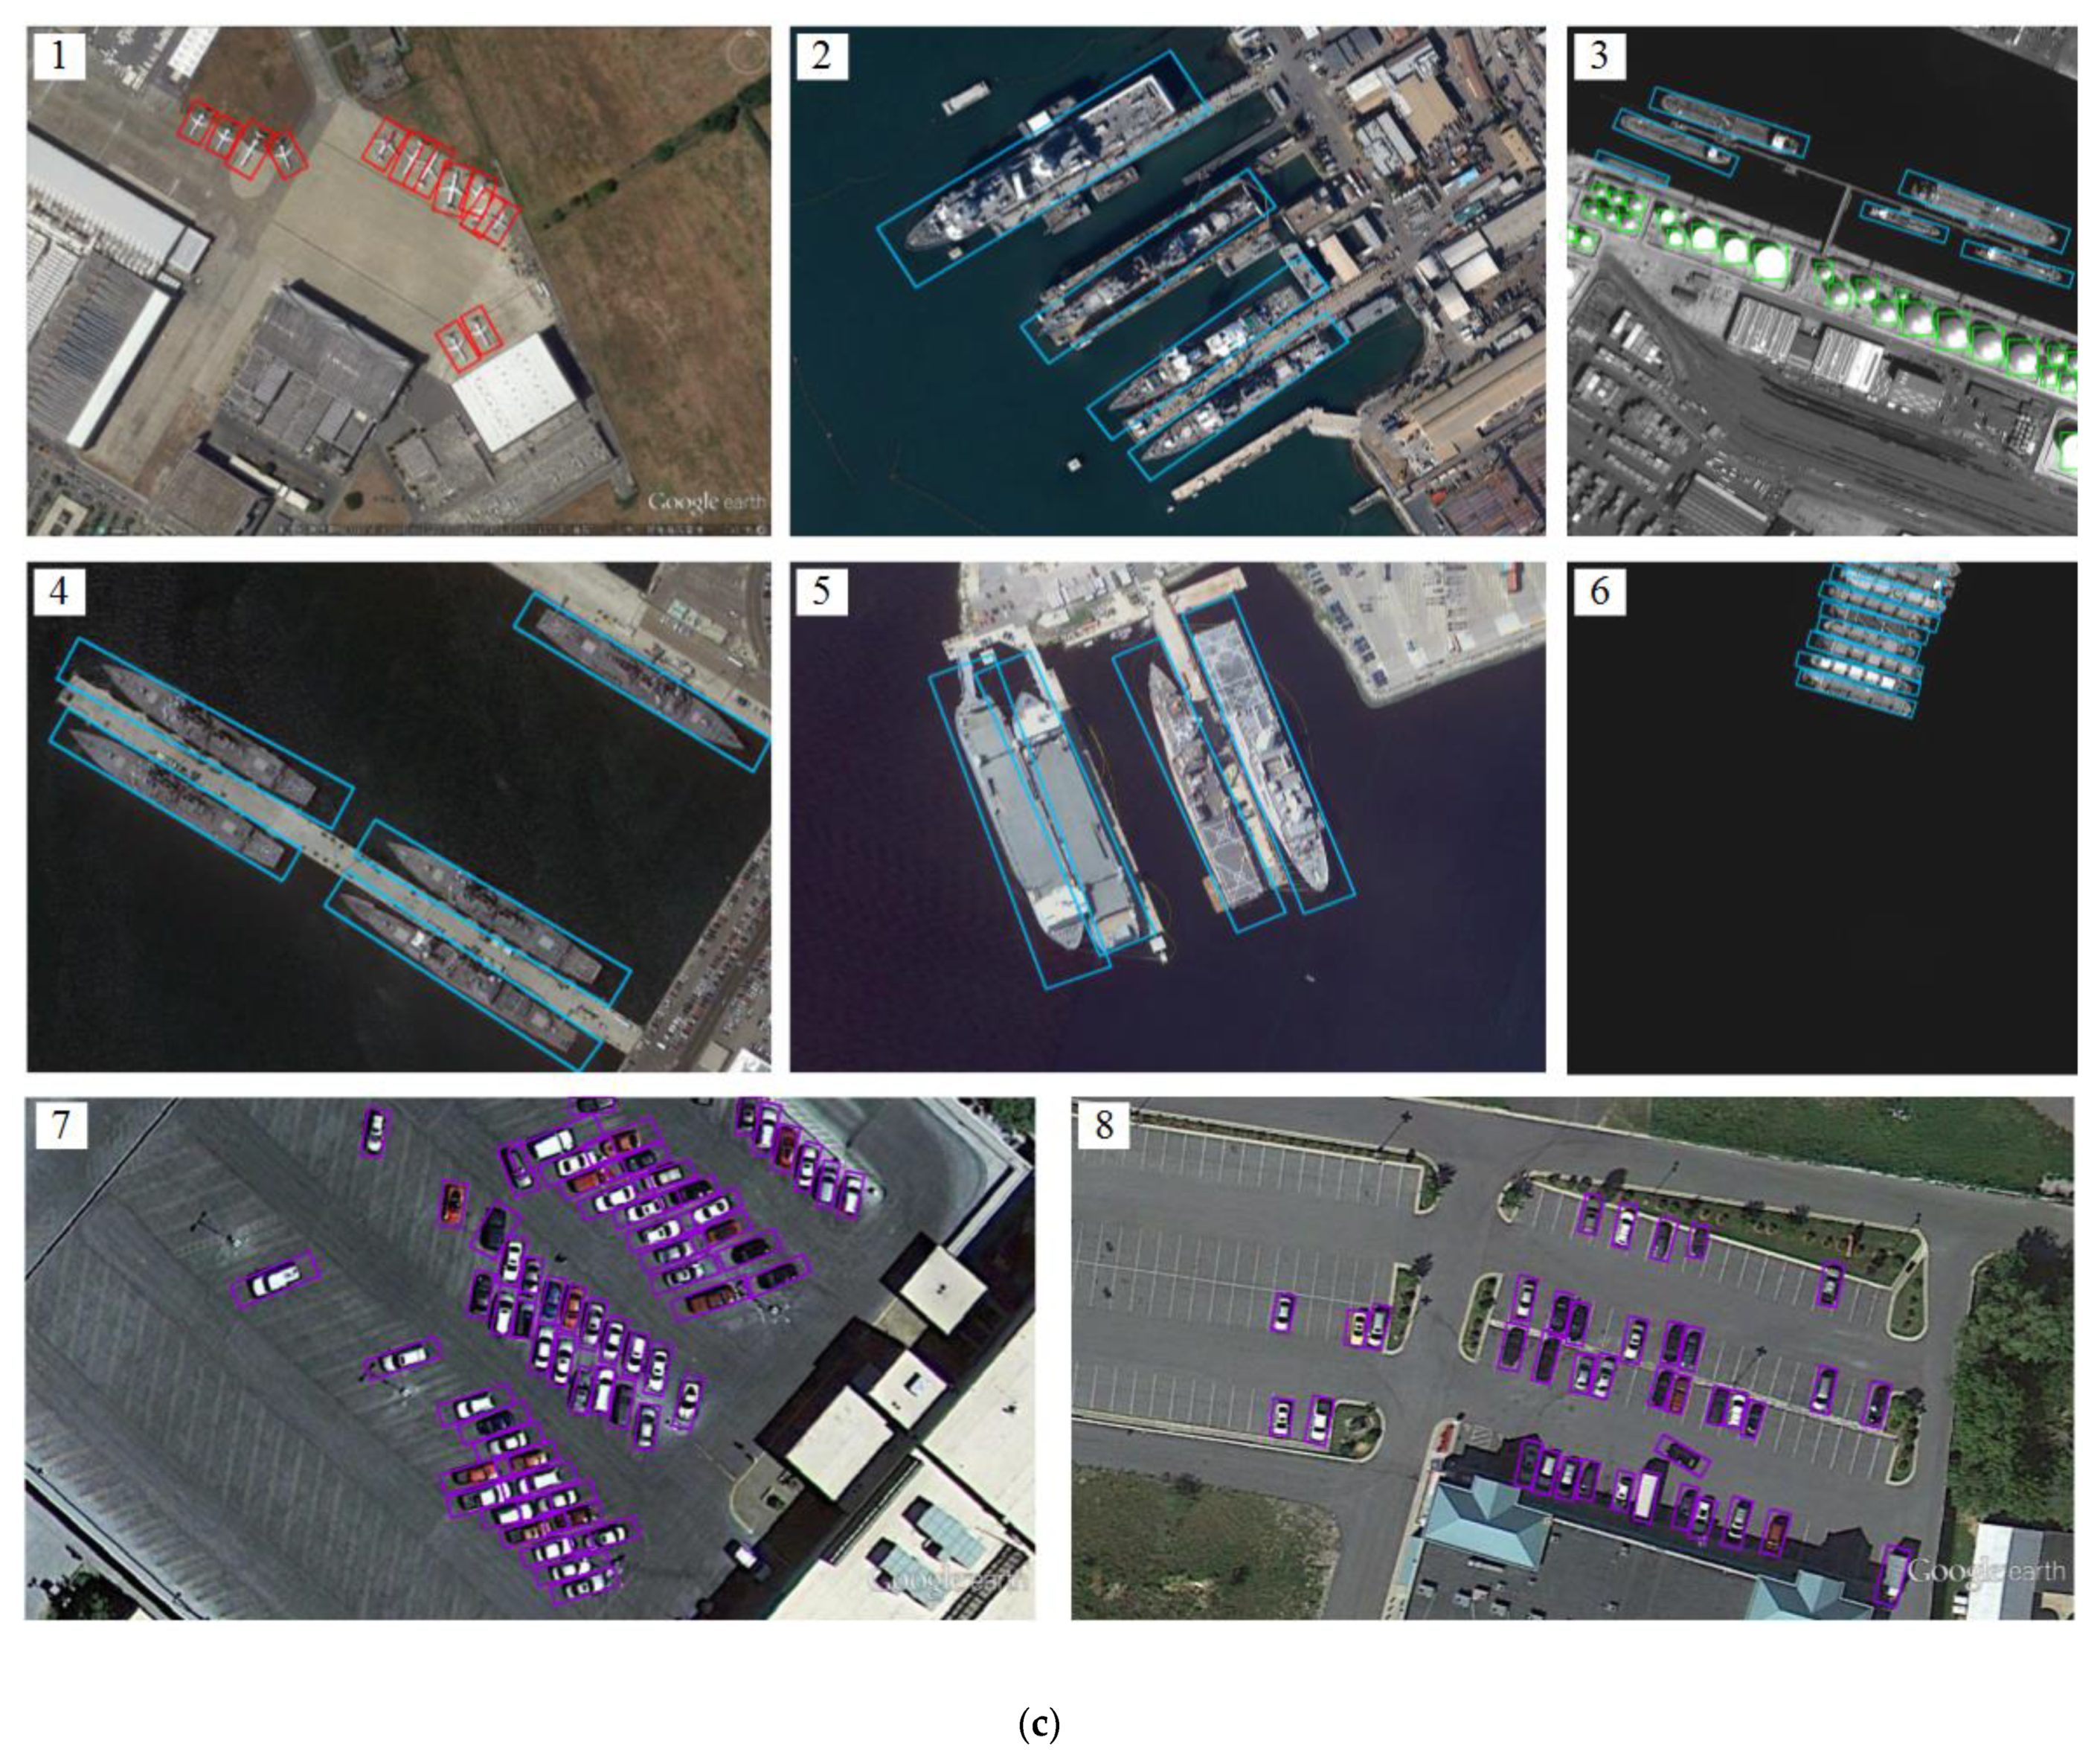
Figure 11 shows some object detection result samples of CNN-SOSF, YOLOv3 and CNN-AOOF for WHU-RSONE, UCAS-AOD and HSRC2016 datasets.
Figure 11a–c are object detection results of CNN-SOSF, YOLOv3 and CNN-AOOF, respectively.
In
Figure 11(a1,b1), due to the dense distribution of the airplanes, the airplanes indicated by the yellow arrow cannot be detected correctly using CNN-SOSF and YOLOv3. In
Figure 11(c1), airplanes are correctly detected using CNN-AOOF.
In
Figure 11(a2,b2), due to the ship with large aspect ratios, the ship indicated by the yellow arrow cannot be detected correctly using CNN-SOSF and YOLOv3. There are large redundant areas in the detection results of other ships. In
Figure 11(c2), ships are correctly detected using CNN-AOOF.
In
Figure 11(a3), due to the large aspect ratios and dense distribution of the ships, the ships indicated by the yellow arrow cannot be detected correctly using CNN-SOSF. In
Figure 11(b3), the storage-tank indicated by the yellow arrow cannot be detected correctly using YOLOv3. In
Figure 11(c3), ships and storage-tanks are correctly detected using CNN-AOOF.
In
Figure 11(a4,b4), due to the ships with large aspect ratios, the ships indicated by the yellow arrow cannot be detected correctly using CNN-SOSF and YOLOv3. There are large redundant areas in the detection results of other ships. In
Figure 11(c4), ships are correctly detected using CNN-AOOF.
In
Figure 11(a5,b5), due to the ships with large aspect ratios, the ships indicated by the yellow arrow cannot be detected correctly using CNN-SOSF and YOLOv3. There are large redundant areas in the detection results of other ships. In
Figure 11(c5), ships are correctly detected using CNN-AOOF.
In
Figure 11(a6,b6), dense ships cannot be detected accurately using CNN-SOSF and YOLOv3. In
Figure 11(c6), dense ships are detected accurately using CNN-AOOF.
In
Figure 11(a7,b7), due to the dense distribution of cars, the cars indicated by the yellow arrow cannot be detected accurately using CNN-SOSF and YOLOv3. In
Figure 11(c7), dense cars are detected accurately using CNN-AOOF.
In
Figure 11(a8), due to the dense distribution of cars, the cars indicated by the yellow arrow cannot be detected accurately using CNN-SOSF. In
Figure 11(b8,c8), cars are detected accurately using CNN-AOOF.
The experimental results show that CNN-SOSF and YOLOv3 are difficult to accurately detect objects with large aspect ratios and densely distributed objects because they use horizontal bounding boxes to detect objects. However, CNN-AOOF uses OBB to detect objects, and can accurately detect objects with large aspect ratios and densely distributed objects. Therefore, CNN-AOOF is superior to CNN-SOSF and YOLOv3 for WHU-RSONE-OBB, UCAS-AOD and HSRC2016 datasets.


