Article

Determination of the Optimal Orientation of Chinese Solar Greenhouses Using 3D Light Environment Simulations

1
College of Horticulture, Shenyang Agricultural University, Shenyang 110866, China
2
National & Local Joint Engineering Research Center of Northern Horticultural Facilities Design & Application Technology (Liaoning), Shenyang 110866, China
3
Key Laboratory of Protected Horticulture, Shenyang Agricultural University, Ministry of Education, Shenyang 110866, China
4
Plant Sciences Core Facility, CEITEC-Central European Institute of Technology, Masaryk University, 60177 Brno, Czech Republic
5
Leibniz Institute of Plant Genetics and Crop Plant Research (IPK), OT Gatersleben, D-06466 Stadt Seeland, Germany
6
College of Engineering, Shenyang Agricultural University, Shenyang 110866, China
*
Author to whom correspondence should be addressed.
These authors contributed equally to this work.
Remote Sens. 2022, 14(4), 912; https://doi.org/10.3390/rs14040912
Submission received: 3 December 2021 / Revised: 10 February 2022 / Accepted: 11 February 2022 / Published: 14 February 2022
(This article belongs to the Special Issue 3D Modelling and Mapping for Precision Agriculture)

Abstract

:
With the continuous use of resources, solar energy is expected to be the most used sustainable energy. To improve the solar energy efficiency in Chinese Solar Greenhouses (CSG), the effect of CSG orientation on intercepted solar radiation was systematically studied. By using a 3D CSG model and a detailed crop canopy model, the light environment within CSG was optimized. Taking the most widely used Liao-Shen type Chinese solar greenhouse (CSG-LS) as the prototype, the simulation was fully verified. The intercepted solar radiation of the maintenance structures and crops was used as the evaluation index. The results showed that the highest amount of solar radiation intercepted by the maintenance structures occurred in the CSG orientations of 4–6° south to west (S-W) in 36.8° N and 38° N areas, 8–10° S-W in 41.8° N areas, and 2–4° south to east (S-E) in 43.6° N areas. The solar radiation intercepted by the crop canopy displayed the highest value at an orientation of 2–4° S-W in 36.8° N, 38° N, 43.6° N areas, and 4–6° S-W in the 41.8° N area. Furthermore, the proposed model could provide scientific guidance for greenhouse crop modelling.

Graphical Abstract

1. Introduction

As a typical energy-saving horticultural facility, solar greenhouses ease the anti-seasonal production of vegetables. To the best of our knowledge, most countries are currently using solar greenhouses for the production of crops, among which China ranks first in the world with 28 million hectares of greenhouses [1]. However, it remains a challenge to produce vegetables in these facilities during winter without additional heating systems. Thus, the energy efficiency demand generated by a further increasing number of solar greenhouses is a major environmental and economic problem for crop producers worldwide [2,3].
To provide a suitable environment for the production of vegetables during the winter season using CSGs, the efficient use of renewable energy sources, including solar energy is essential [4,5]. A greenhouse is a permanent structure whose productivity highly depends on its location, orientation, and shape. Nevertheless, when the location of the greenhouse is selected, it is imperative to choose the best shape and orientation to capture the better solar radiation. In this context, scholars have carried out a significant number of studies to improve solar energy utilization in greenhouses. El–Maghlany et al. [6] analyzed the effects of different orientations and shapes on solar energy capture and heating cost and concluded that greenhouses with an east–west orientation and elliptical surface aspect ratio of four are the most suitable for the northern tropical areas. Dragićević [7] investigated the performance of uneven-span single shape greenhouses in Serbia under different climatic conditions and determined that the greenhouse with the best performance in the whole year was that with the east–west orientation. Papadakis et al. [8] carried out an experimental study on the solar transmittance of single-span greenhouses in Greece by using a scale model. The results recommended that the light environment of greenhouses with an east–west orientation was better than those with the north–south orientations in the winter of 37° N latitude. According to these findings, it can be concluded that the average solar radiation received by greenhouses with the east–west orientation is better than that with the north–south orientation. However, these greenhouses are pretty different from the CSG type.
CSG is designed as energy-saving solar greenhouses that makes full use of solar energy. As shown in Figure 1, the CSG type is widely used, especially in the north of China. Compared with other greenhouse types, the CSG type requires unique maintenance structures such as the back wall, roof, and quilt to guarantee the winter production of vegetables without any additional heating [9,10]. Previous studies on light optimization of CSG have mainly focused on greenhouse structures [11,12,13] and optical properties of plastic films [14,15], while the orientation of the CSGs has not been considered. Due to the lack of theoretical information for greenhouse construction, the orientation of the CSGs is usually determined by either experience or simply following the local topography [16].
To solve the above problems, Chen et al. [17] used the extreme value theory to determine the optimal orientation of CSG in northern China and concluded that the orientation of CSGs should be south to west. Cao et al. [18] measured the temperature on a CSG scale model and concluded that the indoor temperature of the greenhouse with S-W orientation was higher than that with due south or S-E orientation. In addition, on cloudy days, the orientation of CSG has no significant effect on indoor temperatures. Furthermore, to increase the applicability of the optimal orientation and shorten the experimental period, the simulation model was applied to guide the actual production. Ahamed et al. [19] created a complete energy budget model for CSGs using the TRNSYS architectural simulation software designed by the Solar Energy Laboratory, University of Wisconsin, USA. Herein, considering different orientations of the greenhouse, the solar radiation module integrated into TRNSYS software was used to calculate the total solar radiation intercepted by the lighting roof at each time step. Yang et al. [20] used a self-built radiation model to calculate the cumulative light interception of greenhouses with different orientations (10° S-E, 5° S-E, due south, 5° S-W, and 10° S-W). The results indicated that the cumulative solar radiation interception of CSG with a south orientation reached a maximum value, which was only 0.45 MJ higher than the minimum value. It is important to note that the current research on optimizing greenhouse orientation using scale model experiments or simulations is usually performed considering empty greenhouses. Thus, the influence of the presence of cops has not been taken into account. The purpose of optimizing the structure and orientation of CSGs is to provide a better growing environment for crops. The presence of crops is bound to produce shading and other effects inside the greenhouse [21]. However, it is still unknown if crops may affect the optimization process of the greenhouse structure or if the optimized greenhouse may enhance the lighting effect of crops.
The novelty of this paper is the use of the three-dimensional (3D) interactive modelling platform GroIMP, developed and described to build a simulation model of CSG light environment optimization [22,23], which includes the presence of crops according to the actual planting system. To further determine the best orientation and evaluation index, a reverse Monte-Carlo ray-tracing method [24] was used to simulate and analyze the solar radiation intercepted by lighting roof, maintenance structures, and crops in different orientations of CSG. For comparison, the optimization of greenhouse orientation without crops was also considered. Moreover, it is expected that the simulation results will provide new knowledge on the evaluation index of the optimal CSG orientation at different latitudes and may further lead to a new method for greenhouse architectural designs.

2. Materials and Methods

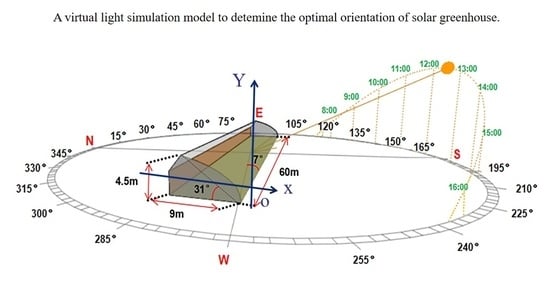
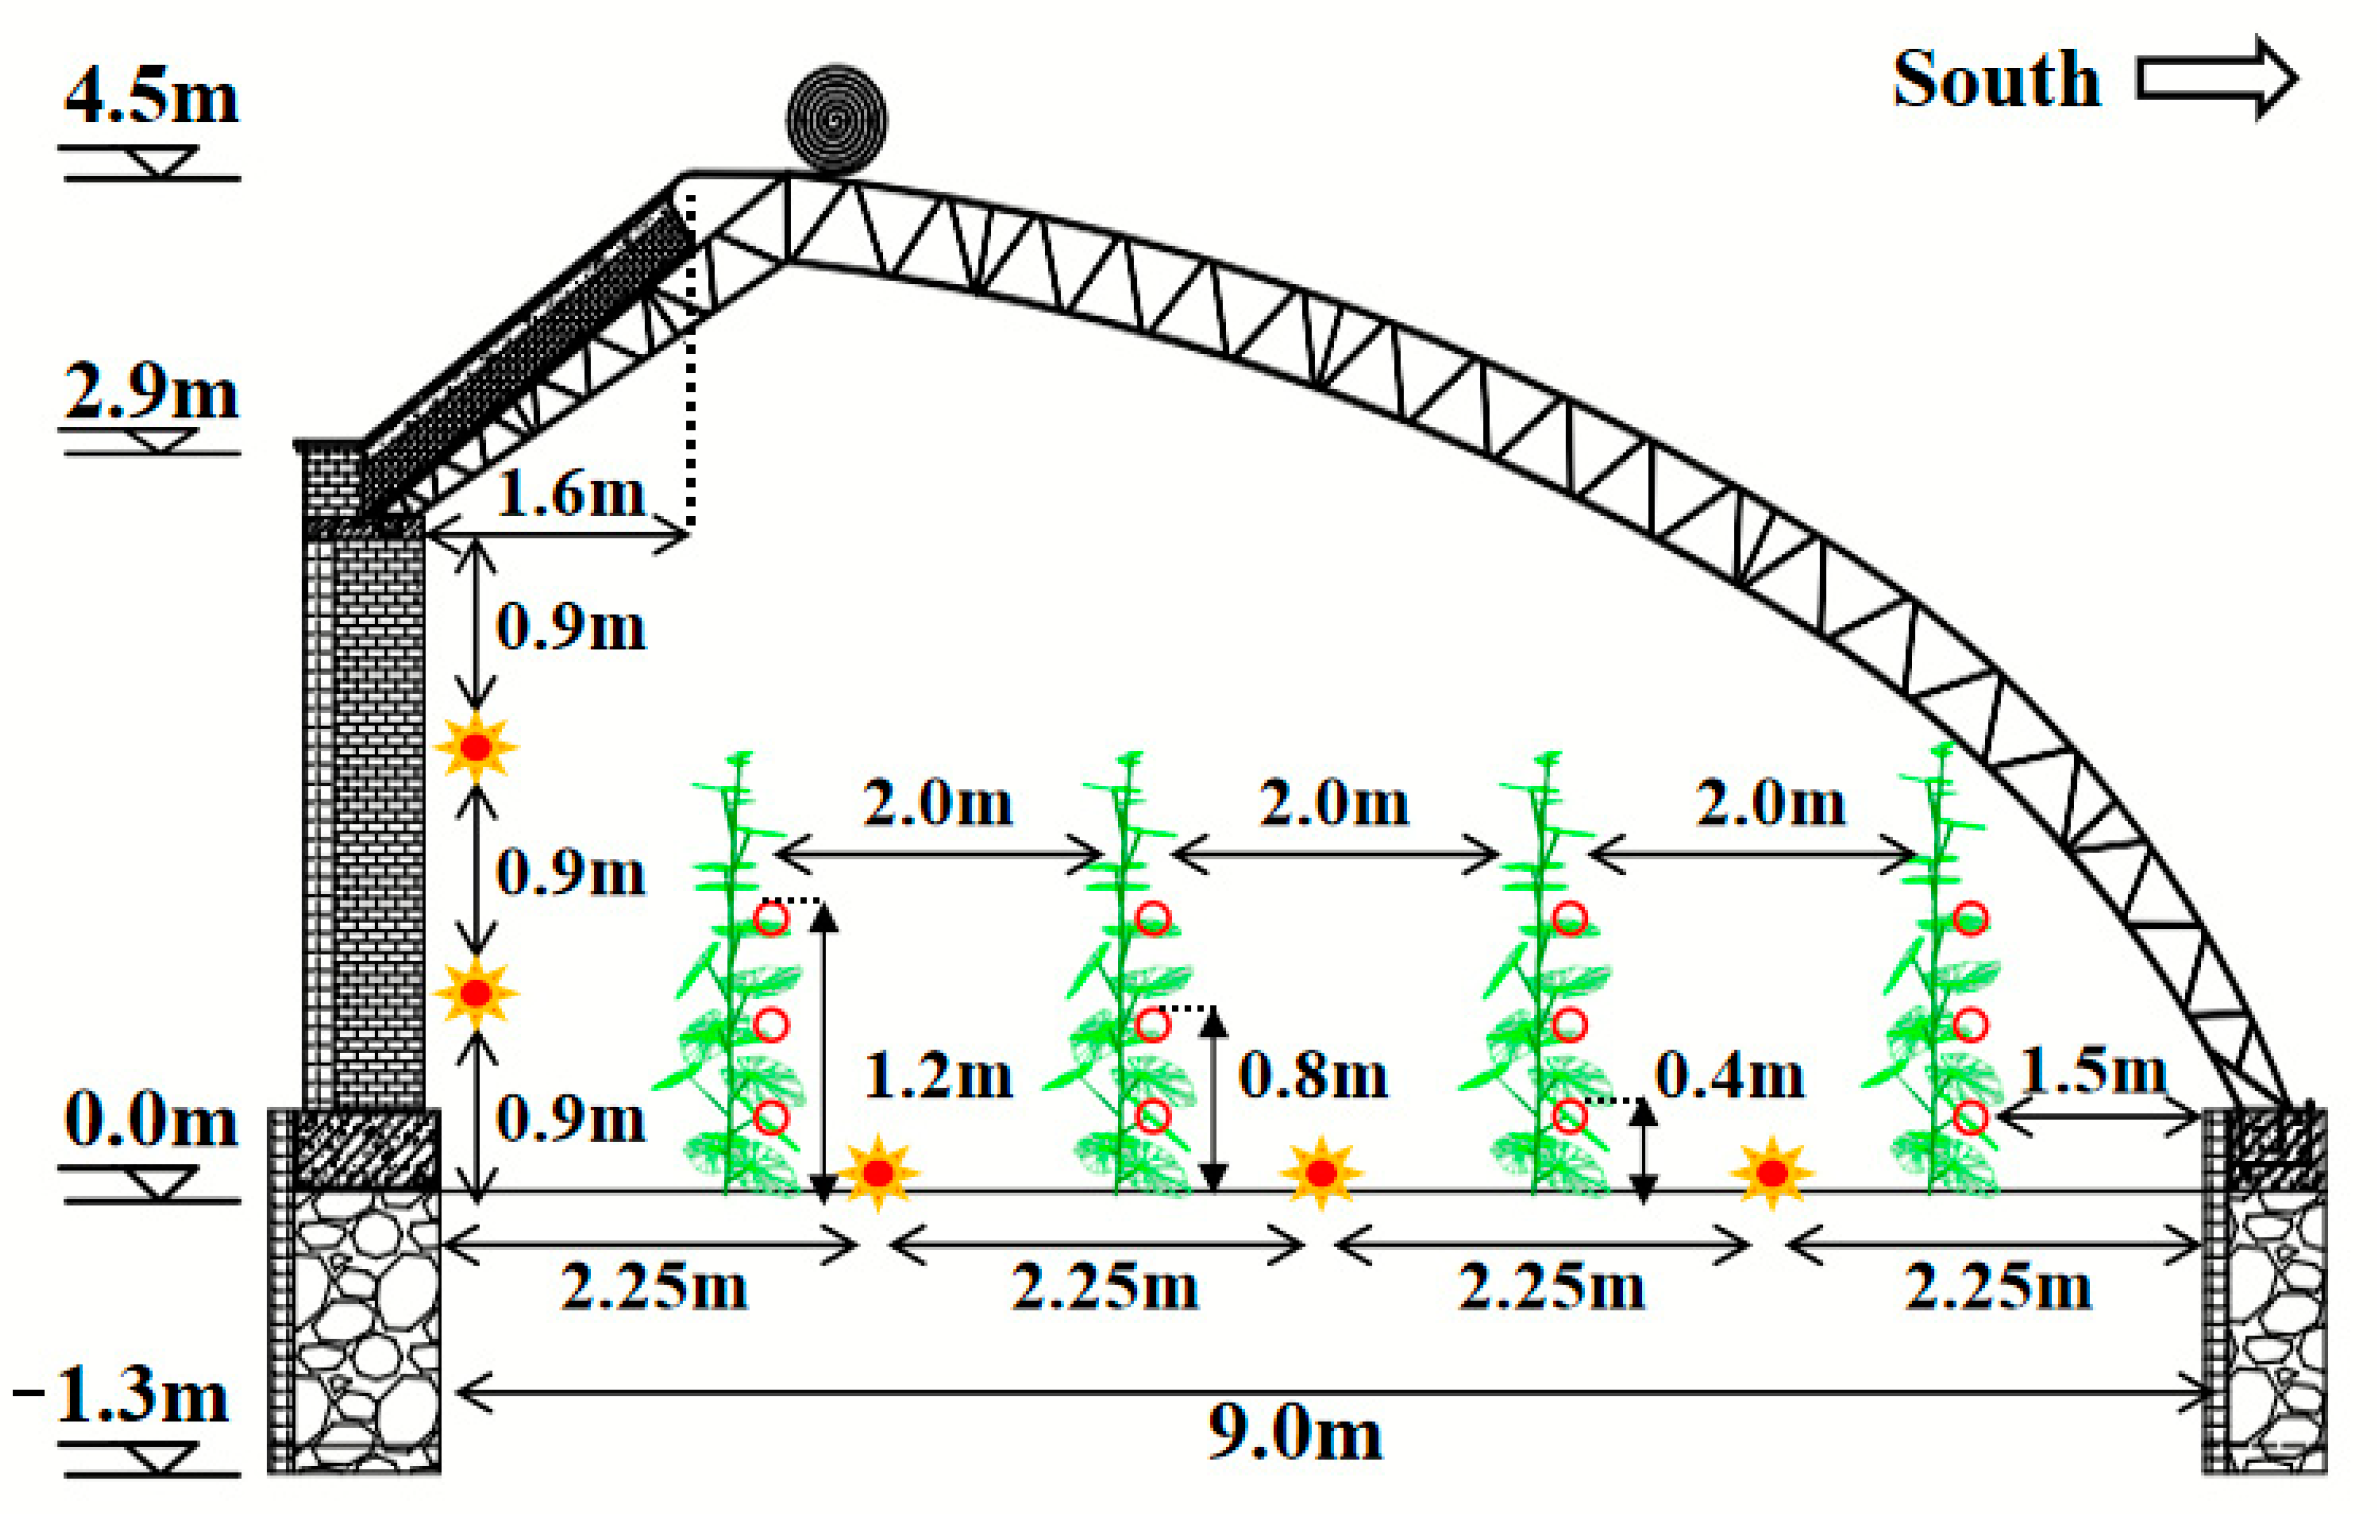
2.1. Construction of a Virtual Greenhouse

A virtual 3D CSG-LS was completely rebuilt using the open-source 3D modelling platform GroIMP and the dedicated modelling language XL [22,23,24]. CSG-LS is the primarily used greenhouse type in northern China. The concrete structure and corresponding structural parameters of the CSG-LS are given in Figure 2. The building materials used for the wall were composed of 370 mm-thick fly ash bricks and 110 mm-thick insulation boards. The roof was composed of the board, a cement layer, and a waterproof layer. The lighting roof covering material was made of a 0.15 mm polyolefin (PO) film, which provides optimal optical properties. At night, the lighting roof is covered with a cotton insulation blanket to keep the accumulated energy inside the greenhouse slowly dissipated. The plant canopy modelled inside the virtual greenhouse was fabricated based on the CSG-LS, which was used to verify the simulation model. One of the reference greenhouses was located at Shenyang Agricultural University (41.8° N and 123.6° E), displaying an orientation of 7° S-W. For this study, oriental melon (Cucumis melo var. makuwa Makino) was chosen as the testing crop. The melon plants were planted on 10 September 2020, using the most common field configuration, with plant spacing of 40 cm, wide row spacing of 90 cm, and narrow row spacing of 70 cm. Another reference greenhouse was located in the Kerqin region of Tongliao (43.6° N and 122.2° E), displaying an orientation of 5° S-W. The structural parameters and planting pattern of this greenhouse was highly consistent with that of the experimental greenhouse in Shenyang.
At maturity (mid-December), melon plants of similar size (20 plants) inside the experimental greenhouse of Shenyang were selected for measurements. Internode length, petiole inclination, and other morphological parameters were measured (Table 1), and the average values were used for the actual reconstruction of the crop population model. As shown in Figure 3, the 3D modelling process of melon plants inside a CSG was divided into five parts. Firstly, a large number of melon leaves were collected. In the process of collection, a ruler was set next to the leaves to calibrate the image scale (Figure 3b), and ImageJ (National Institutes of Health, Bethesda, MD, USA) was further used for image analysis [25]. Similar to the digitalization process of cucumber leaves [26], it was found that selecting 28 landmarks can effectively restore the shape of melon leaves through data comparison (Figure 3c). By defining the base of the leaf as the origin, the space coordinates of 28 landmarks were obtained to realize the virtual reconstruction of the leaf (Figure 3d). Moreover, the spatial position of the leaf was also set by defining the base of the leaf as the basic point (Figure 3e). Furthermore, the internodes, petioles, and leaves were reconstructed according to the measured spatial positions to obtain a representative plant (Figure 3f). The optical properties of the maintenance structures and melon plants within the 3D model were set according to measured field values and then simulated using parameterized Phong shaders, which were mapped on geometric primitive objects representing maintenance structures and plant organs [27]. Furthermore, the orientation of each plant was randomly selected to increase the accuracy of the simulation [28].

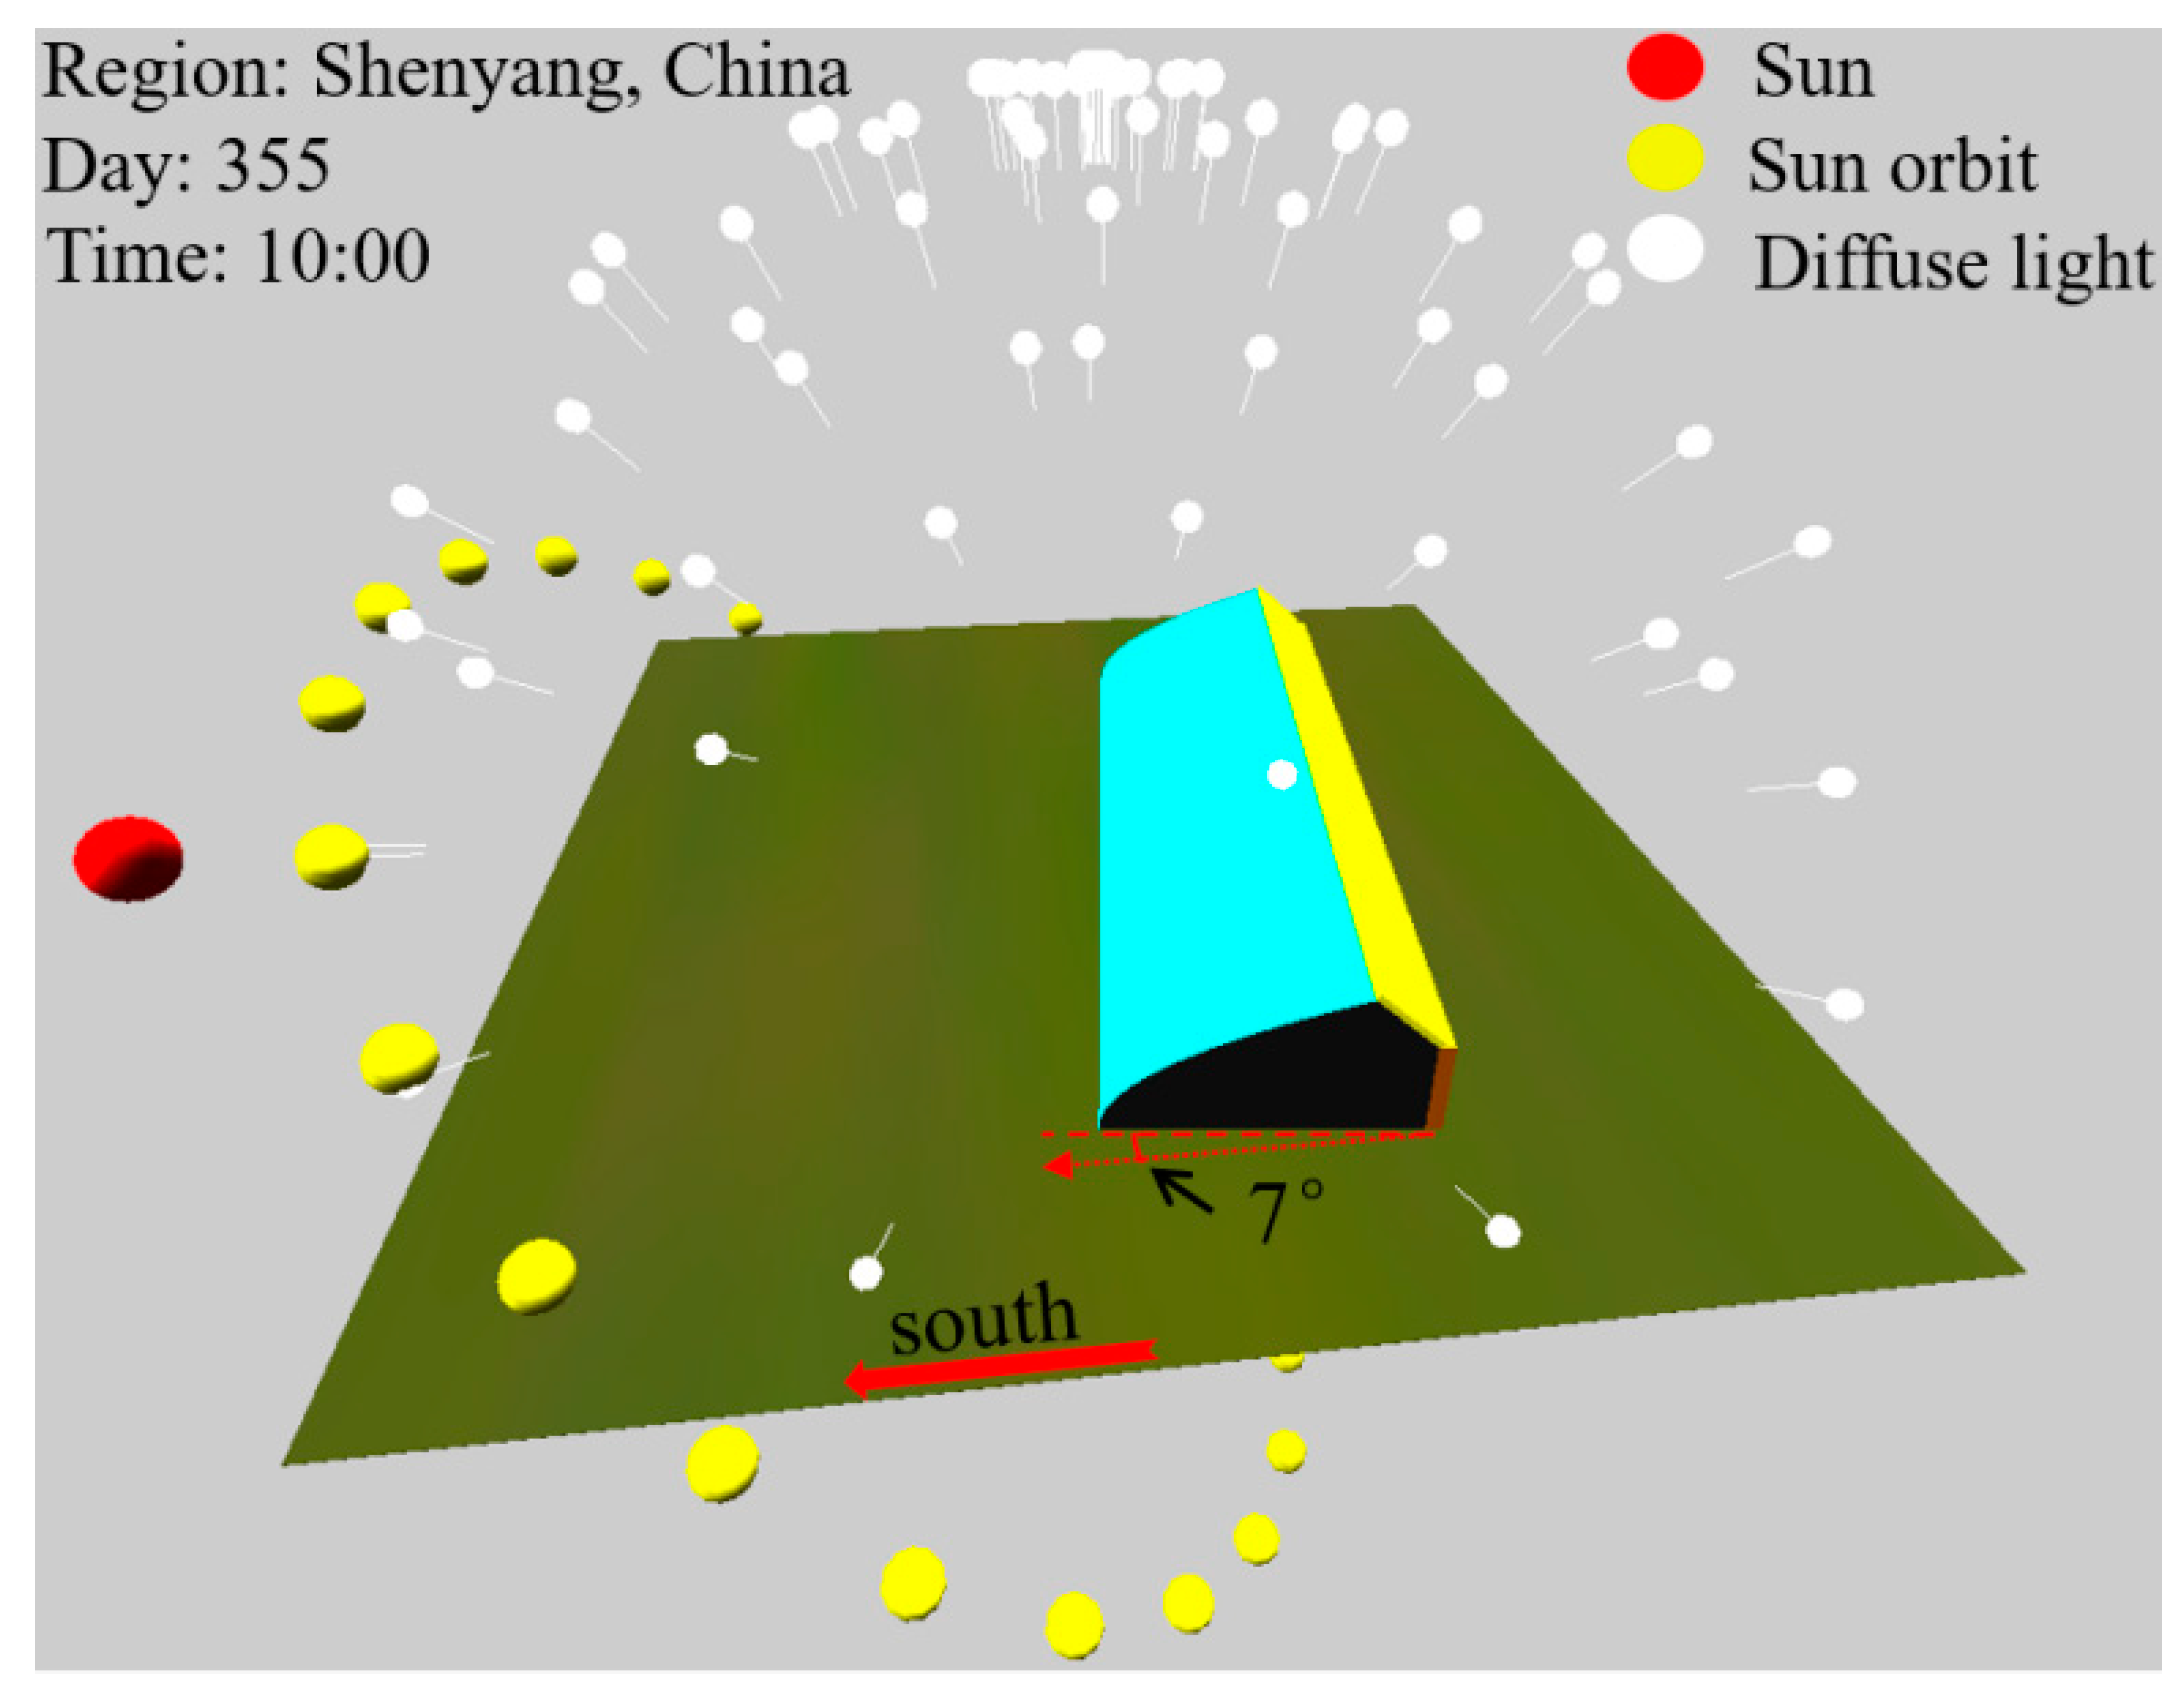
2.2. Description of the Solar Radiation Model

To accurately simulate the light distribution within the crops canopy, a virtual sky hemisphere was selected to simulate the skylight environment [29]. In general, virtual solar radiation consists of two aspects. One corresponds to the direct solar radiation reaching the ground in parallel light and the other to the diffuse light whose propagation direction changes through various particles present in the atmosphere [30]. The assignment of these two radiation intensities depends on the average level of light measured outdoors. Moreover, the output power and position of the sun are represented by dynamic functions of latitude, day of the year, and hour of the day [31]. The direct solar radiation source consists of 24 points uniformly distributed around the virtual sky hemisphere, representing the sun’s trajectory. The position of each direct radiation source varies with the length of the day, the solar azimuth angle, and the solar altitude angle. That is, the orbit of the direct radiation source varied with time [32].
To simulate the diffuse light environment, the sky area was divided into 72 radiation sources. These sources were arranged according to the shape of the hemisphere, which was further divided into six concentric rings with different altitude angles. Each ring contained 12 radiation sources, and the light from these sources is also parallel. According to the azimuth angle, each ring evenly distributed the radiation sources. The parallel light converges from all directions to the center to simulate diffuse radiation [33]. Then, the reverse Monte-Carlo ray tracing was used to calculate the emission, propagation, and absorption of light (Figure 4), specifically, the light received by virtual sensor objects in 3D scenarios. In these cases, the light pathway and potential absorption, reflection, or transmission depend on the optical properties, shape of the geometric objects, and the distribution of objects. To achieve realistic and reproducible light distribution within the virtual scene, the number of light rays used during light simulation (ray-tracing) was set to 60 million using a maximal recursion depth of 15 reflections [34,35].

2.3. Validation of Model

To verify the accuracy of the optimization using the CSG model, the light environment inside the verification field greenhouses was measured on representative days before and after the winter solstice (21 December to 23 December). The total solar radiation was measured using an MP-200 handheld pyranometer manufactured by Apogee Instrument, Inc, Logan, UT, USA. The measurement range corresponded to 280–1120 nm, range 0–1999 W/m2, calibration error ±5%, and response time < 1 ms. The solar radiation intercepted by the ground and wall was monitored for three consecutive days, starting when the system for quilt was open until its closure. The layout of the specific measurement points was shown in Figure 5.
In addition, the solar radiation intercepted by the melon canopy inside CSG-LS of Shenyang was measured on the winter solstice. Measurements were performed at heights of 0.4, 0.8, and 1.2 m. As shown in Figure 5, each height contained four horizontal positions. As the simulation time interval, the measured data were recorded once every hour, and the order of measurement went from south to north and back again. To eliminate errors caused by time differences, average values are used during calculations.
As shown in Figure 6, the overall trend of the simulated value calculated by the model is consistent with the measured value. Furthermore, the evaluation coefficient (R2) of the evaluation index was calculated. The evaluation coefficients (R2) of the ground and wall inside the CSGs of Shenyang varied from 0.9472 to 0.9878 and 0.9852 to 0.9911, respectively. The evaluation coefficients (R2) of ground and wall inside CSG of Tongliao varied from 0.9598 to 0.9895 and 0.9843 to 0.9905, respectively. Moreover, the evaluation coefficients (R2) of crops inside the CSGs of Shenyang varied from 0.9847 to 0.9884. All the value of evaluation coefficients were greater than 0.9 and close to 1, indicating that a high reliability of the orientation optimization model built for CSG.

3. Results

The purpose of the present investigation is to identify the optimal greenhouse orientation that captures the maximum solar radiation during winter, especially when the solar radiation intensity is relatively low. Reaching this goal may improve the slow growth of crops in greenhouses caused by low temperatures. Sunlight enters the CSG first through the lighting roof and afterward becomes intercepted by the maintenance structures and crops. Thus, the interception of the lighting roof, the light distribution on the opaque maintenance structures, and the light interception of crops are essential parameters that should be included in the evaluation of the greenhouse orientation.

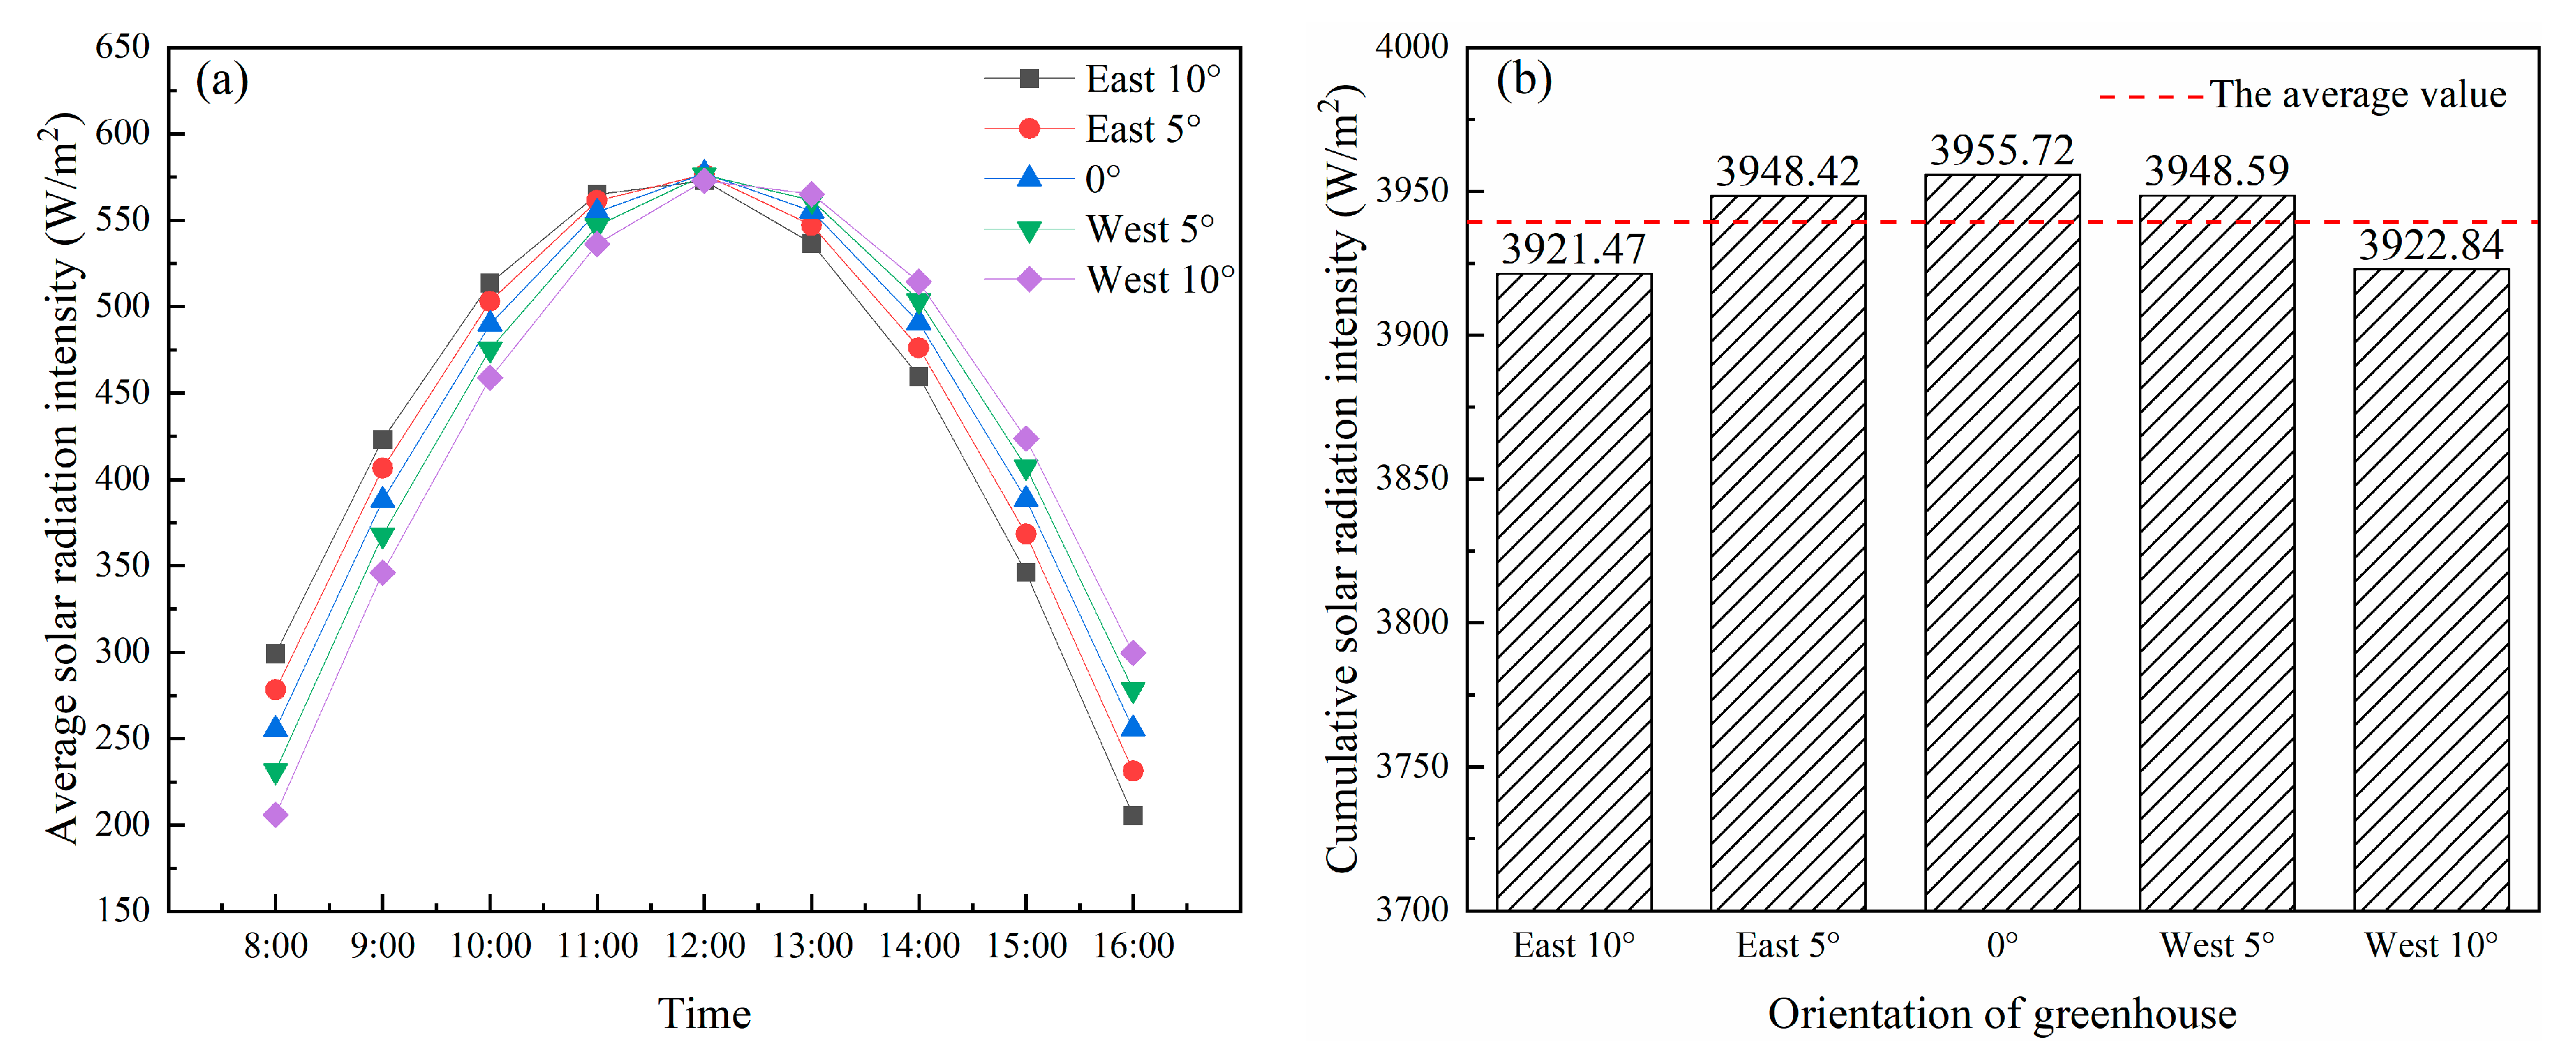
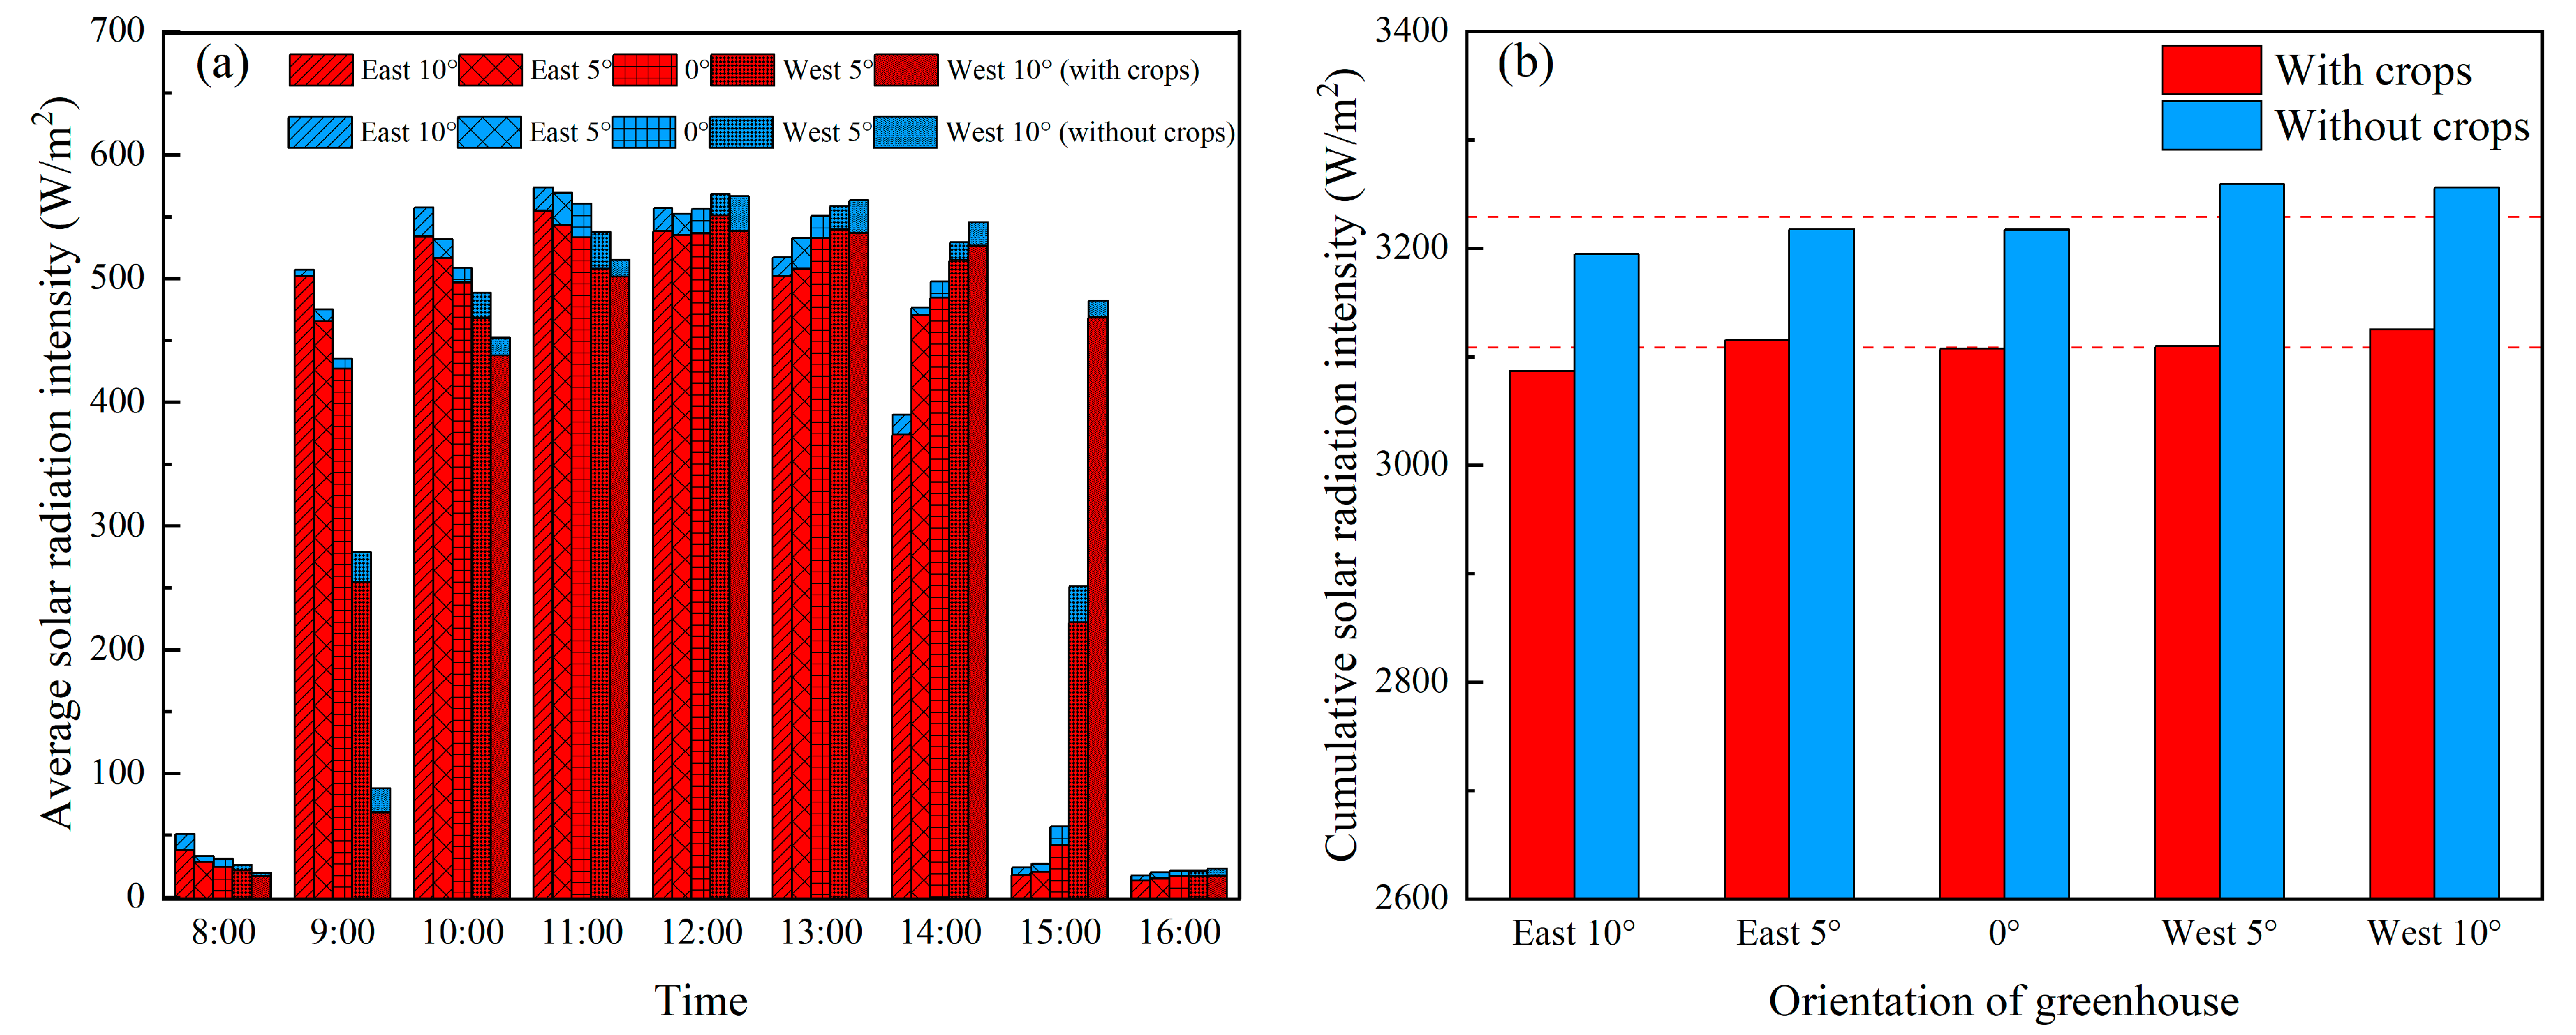
3.1. Interception of Solar Energy on Lighting Roof of CSG with Different Orientations

The lighting roof is the only channel through which CSG intercepts solar radiation. The radiance of the lighting roof and the transparency of the plastic film are the dominant factors that determine the performance of greenhouse light absorption and resulting energy performance. Previous studies on the optical properties of the lighting roof have achieved remarkable outcomes and recommended that the diffuse light plastic films can improve the homogeneity of the canopy light distribution and increase crop production [14,36]. However, only a few studies have investigated the effect of greenhouse orientation on light interception [16]. To determine the influence of greenhouse orientation on solar radiation interception by lighting roof, the widely used CSG of the Liao-Shen type was used. Furthermore, the city of Shenyang (Φ = 41.8° N) in the northeast province Liaoning of China was chosen as an example in the present research (Figure 1). The most representative orientations (10° S-E, 5° S-E, due south, 5° S-W, and 10° S-W) of the CSG-LS [20] were selected to simulate and calculate light interception during the winter solstice.
As shown in Figure 7a, the diurnal variation of the solar radiation interception of lighting roof in all orientations presented a normal distribution. Additionally, every orientation reached the peak value of solar radiation at noon. The maximum difference between the lowest and highest radiation was only 4.4 W/m2. To analyze the impact of orientation on light interception, the amount of intercepted solar radiation was cumulatively registered. As shown in Figure 7b, the south-oriented CSG displayed the highest total intercepted solar radiation. It was also observed that the total solar radiation intercepted by CSG with the same deflection angles and different orientations was approximately symmetrical, with a maximum difference of only 0.87%. These results were in line with those reported by Yang et al. [20]. Thus, the solar radiation interception of the lighting roof should not be the only parameter used to evaluate the orientation of greenhouses.

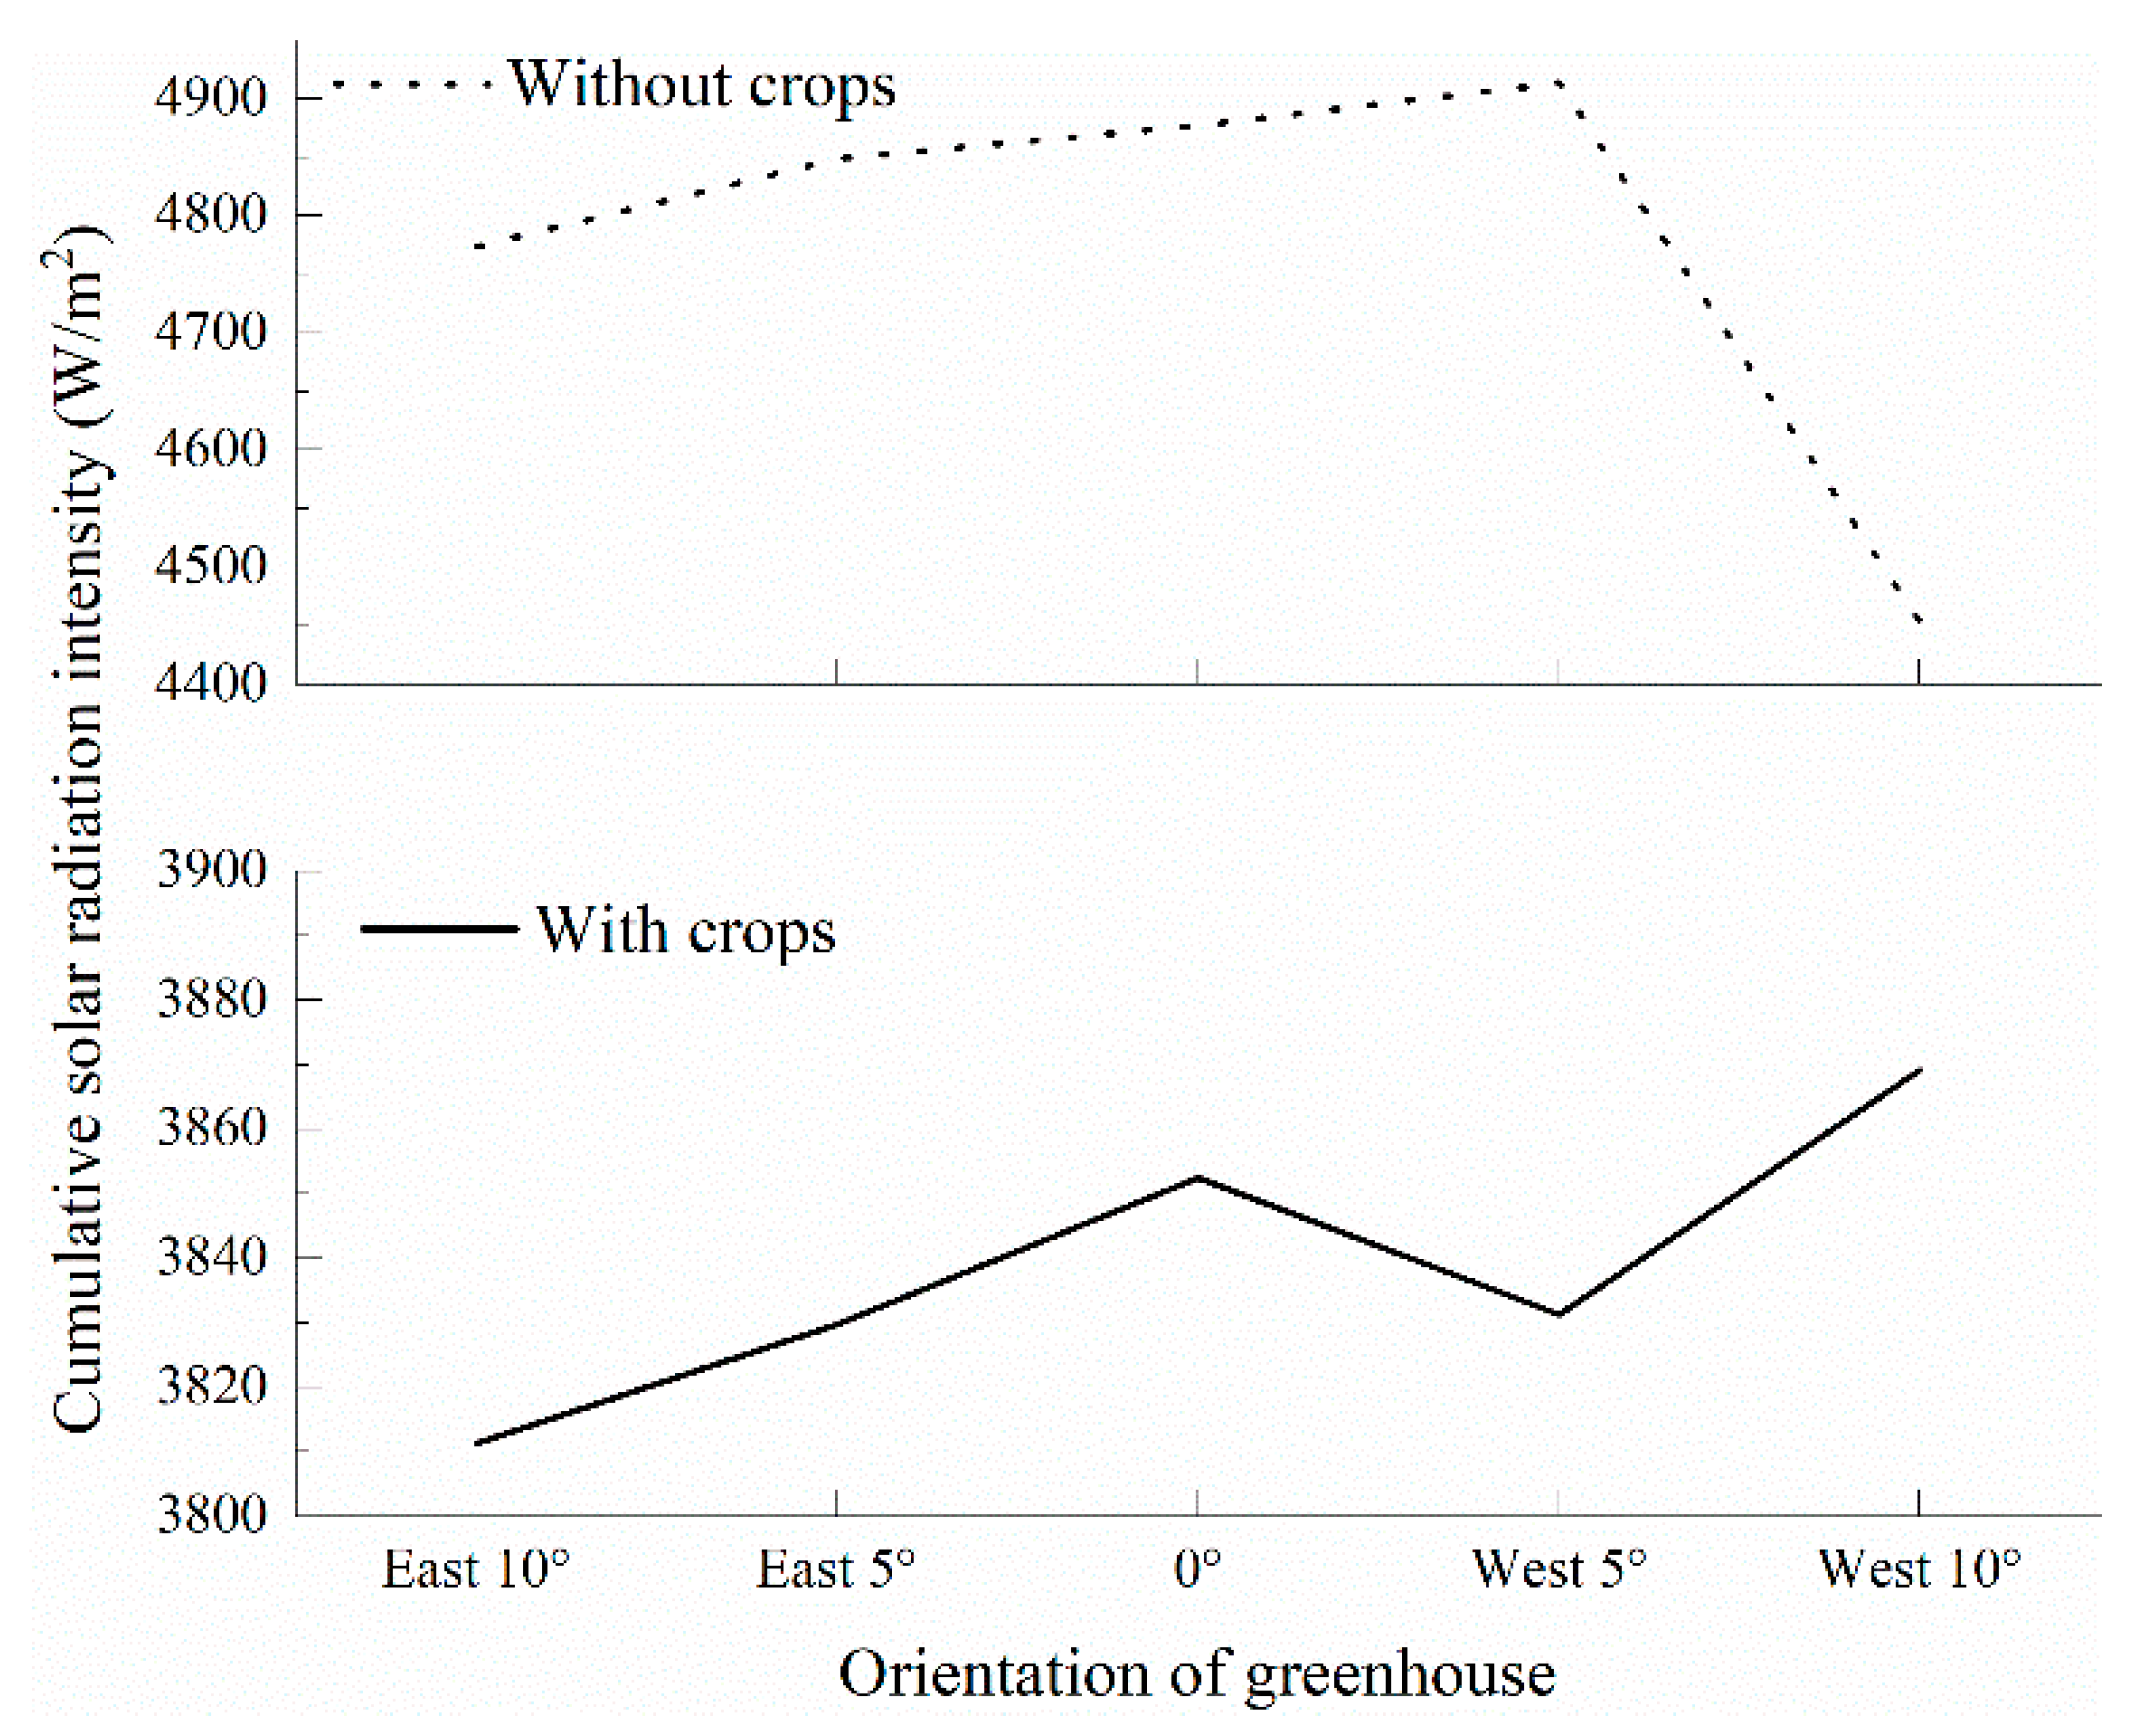
3.2. Interception of Solar Energy by CSG Maintenance Structures with Different Orientations

Solar radiation entering the greenhouse through the lighting roof is strongly affected by orientations. For this reason, the distribution of the radiation in each maintenance structure is different, indirectly affecting the lighting and heat inside the CSG. Moreover, the presence of crops in the CSG produces a shading phenomenon on the ground and walls and also modifies the light distribution. In this investigation, five different orientations of greenhouses were selected to simulate the light interception of CSG maintenance structures in the presence and absence of crops. As shown in Figure 8, with the change in orientation, the diurnal variation of the light interception on the wall of the CSG with and without crops was approximately the same. When the crops were present, the light interception was slightly lower than that in the empty greenhouse. In addition, the variation with time of light interception by the wall was different from that of the lighting roof. Regardless of the presence of crops in the greenhouse facing east, the value of the light interception reached its peak at 11:00 A.M. On the other hand, the one facing west presented the peak value of light interception at noon. The results also indicated that the change of orientation did not affect the cumulative solar radiation intercepted by the wall of greenhouses where crops were present. However, the contrary was observed on the structures when no crops were present. The difference in average cumulative solar radiation between these two walls was about 120 W/m2. This difference indirectly indicated that the shading rate of the crops on the wall was about 3.86%.
In the actual production process, the greenhouse where crops are grown displays more shade than the wall, as shown in Figure 9a. Unlike the light interception of the wall, the changing trend of solar radiation interception of the ground with or without crops was not regular. To determine the influence of crops on the solar radiation interception of the ground, the obtained values for different orientations were summed up. As shown in Figure 9b, the cumulative solar radiation interception of ground with and without crops presented slightly different trends in orientation. The difference in light interception was about 125%.
In addition to the wall and ground, the roof is another important maintenance structure for a CSG, which is located above the wall and connected to the lighting roof. The presence of crops has no direct shading effect on the light interception on the roof. As shown in Figure 10, the light interception on the roof of the empty greenhouse with different orientations was slightly higher, compared to the CSG where crops were planted. This most probably occurred because of the presence of crops affected the reflection of light on the ground. Considering the cumulative solar radiation interception, the change in orientation produced consistent variations in the roof light interception in the CSG, regardless of the presence or absence of crops. The maximum amount of light interception was observed on the roof when the CSG orientation was between zero and five degrees S-W.
The results reported herein indicated that the change of orientation and the presence of crops presented different degrees of influence on the light interception of each maintenance structure inside the greenhouse. Moreover, it was not trivial to determine the optimal CSG orientation when light interception was calculated considering single structures. Therefore, a comprehensive parameter to determine the reasonable orientation of CSG was proposed. The solar radiation entering CSG has two functions. The first one is to participate in the photosynthetic process of the crops. Another one is that solar radiation is the energy source of the greenhouse during the winter season. In terms of thermal energy, the roof is made of wood, which presents insufficient thermal storage capacity. Thus, it has no significant effect on the thermal stability of the CSG [10]. Consequently, the light interception on the roof could be neglected. To further evaluate the orientation of CSG, the interception of solar radiation on the wall and the ground was accumulated. As shown in Figure 11, the simulation results based on the empty greenhouse showed an optimal orientation between zero and five degrees S-W. In addition, when crops were present, the optimal orientation was slightly shifted by 5 degrees to 5 to 10 degrees S-W.

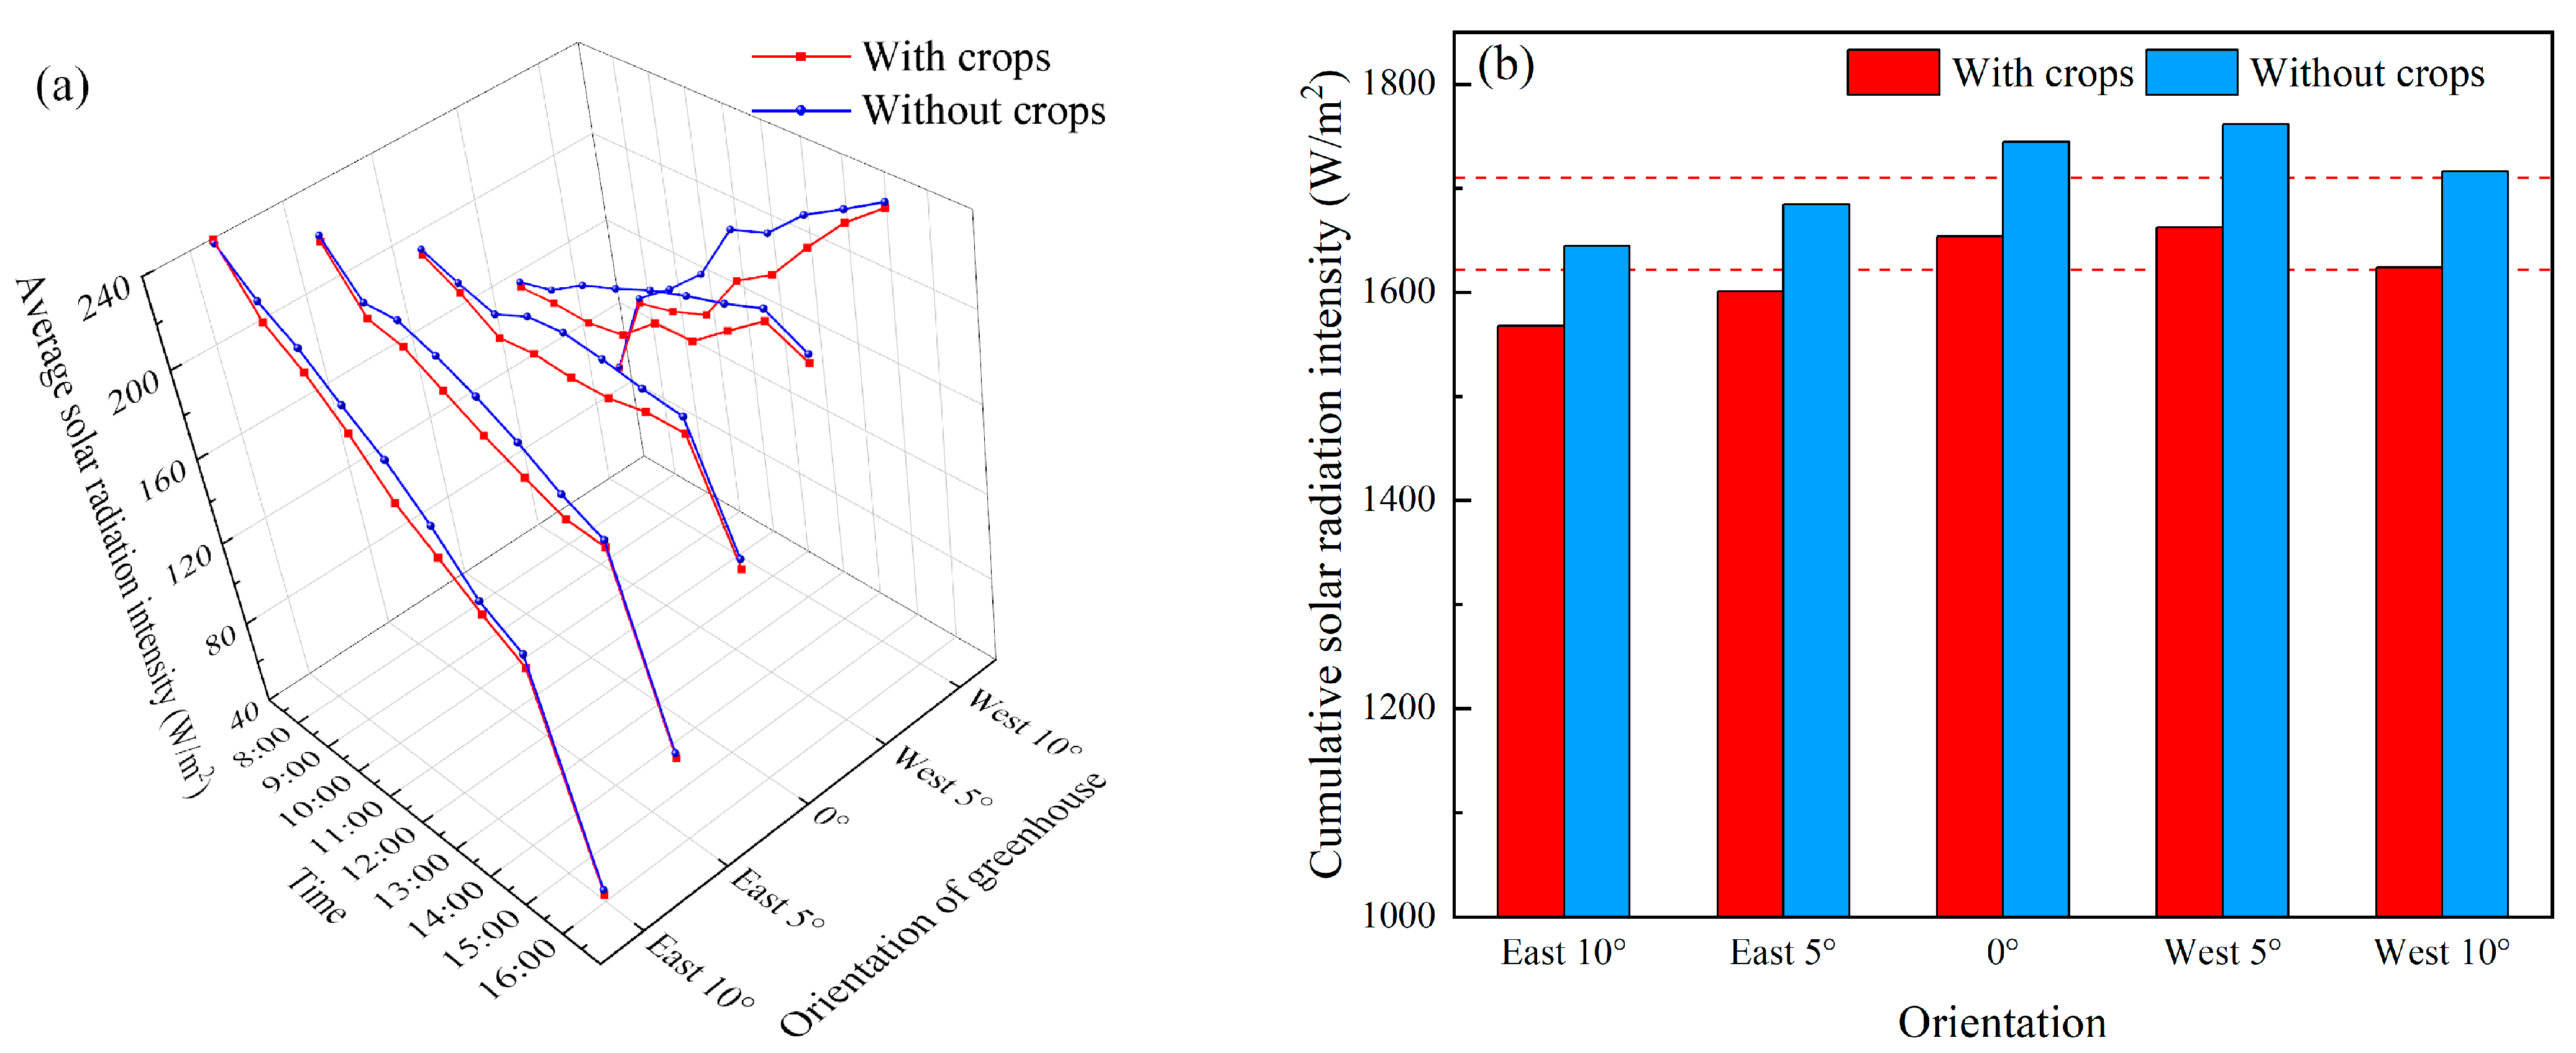
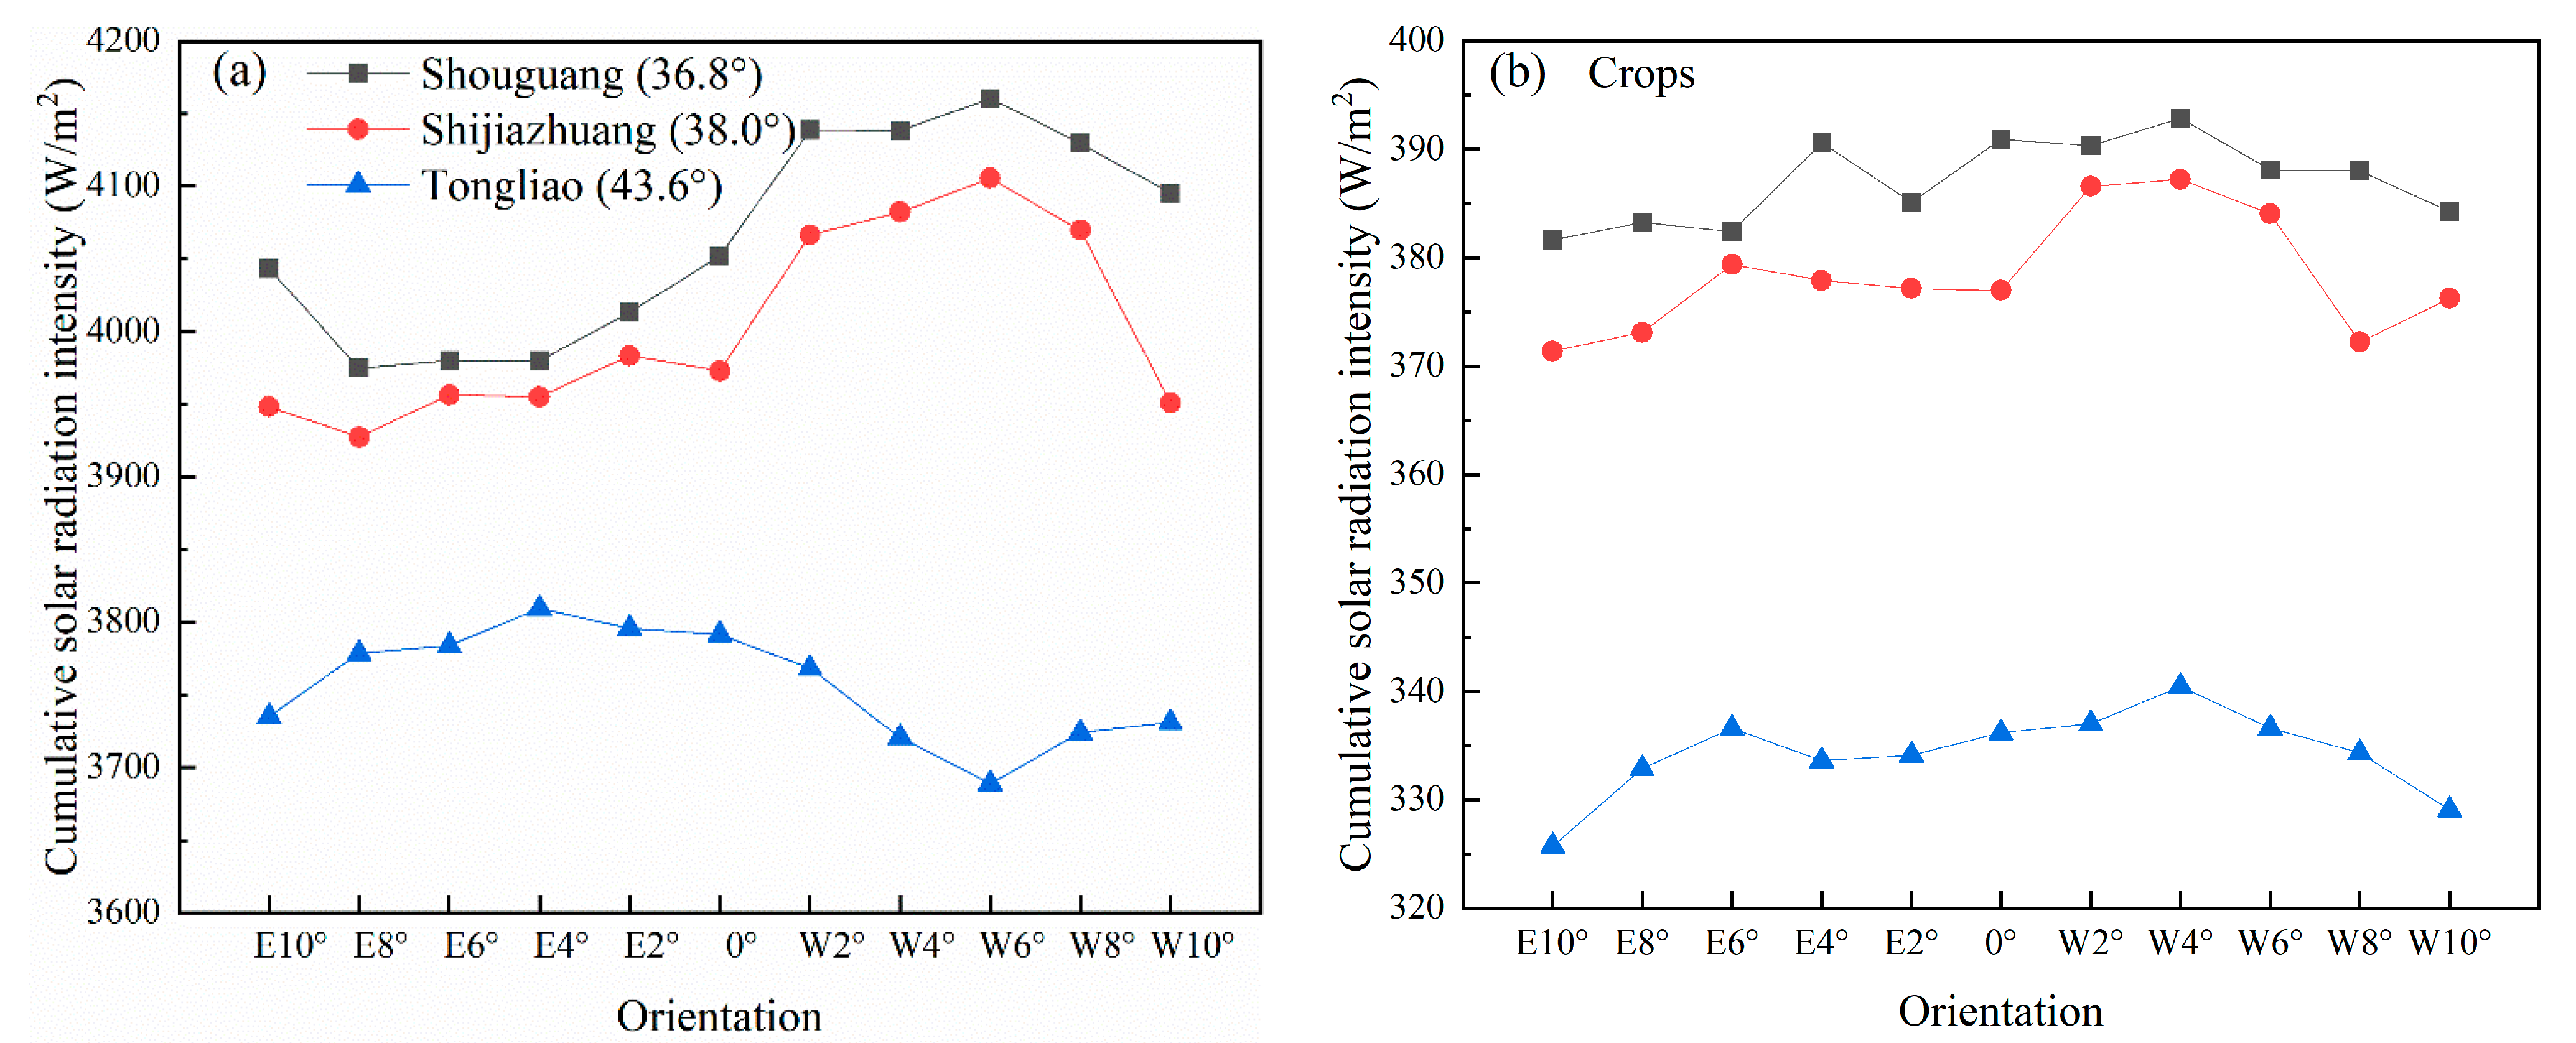
3.3. Interception of Solar Energy on Crops of CSG with Different Orientations

The primary function of light entering a greenhouse is to promote the photosynthesis of plants in terms of light energy directly used for photosynthesis but also as the main source for thermal energy. In most northern areas of China, the intensity of solar radiation is generally low during the winter. For this reason, the growth and consequent yield of melons and other heliophiles tend to reduce significantly. The dominant factor affecting photosynthesis is the light interception of crops, which directly depends on the greenhouse orientation. Therefore, it is essential to investigate the optimal orientation of CSG in close combination with the light interception of crops. As shown in Figure 12a, the variation of light intercepted by the crops per day did not show a significant trend. In addition, the cumulative solar radiation of crops indicated that the most suitable CSG orientation was 0–5° S-W (Figure 12b). Moreover, the maximum difference in the light interception of crops present in CSG with different orientations was about 3.77%.

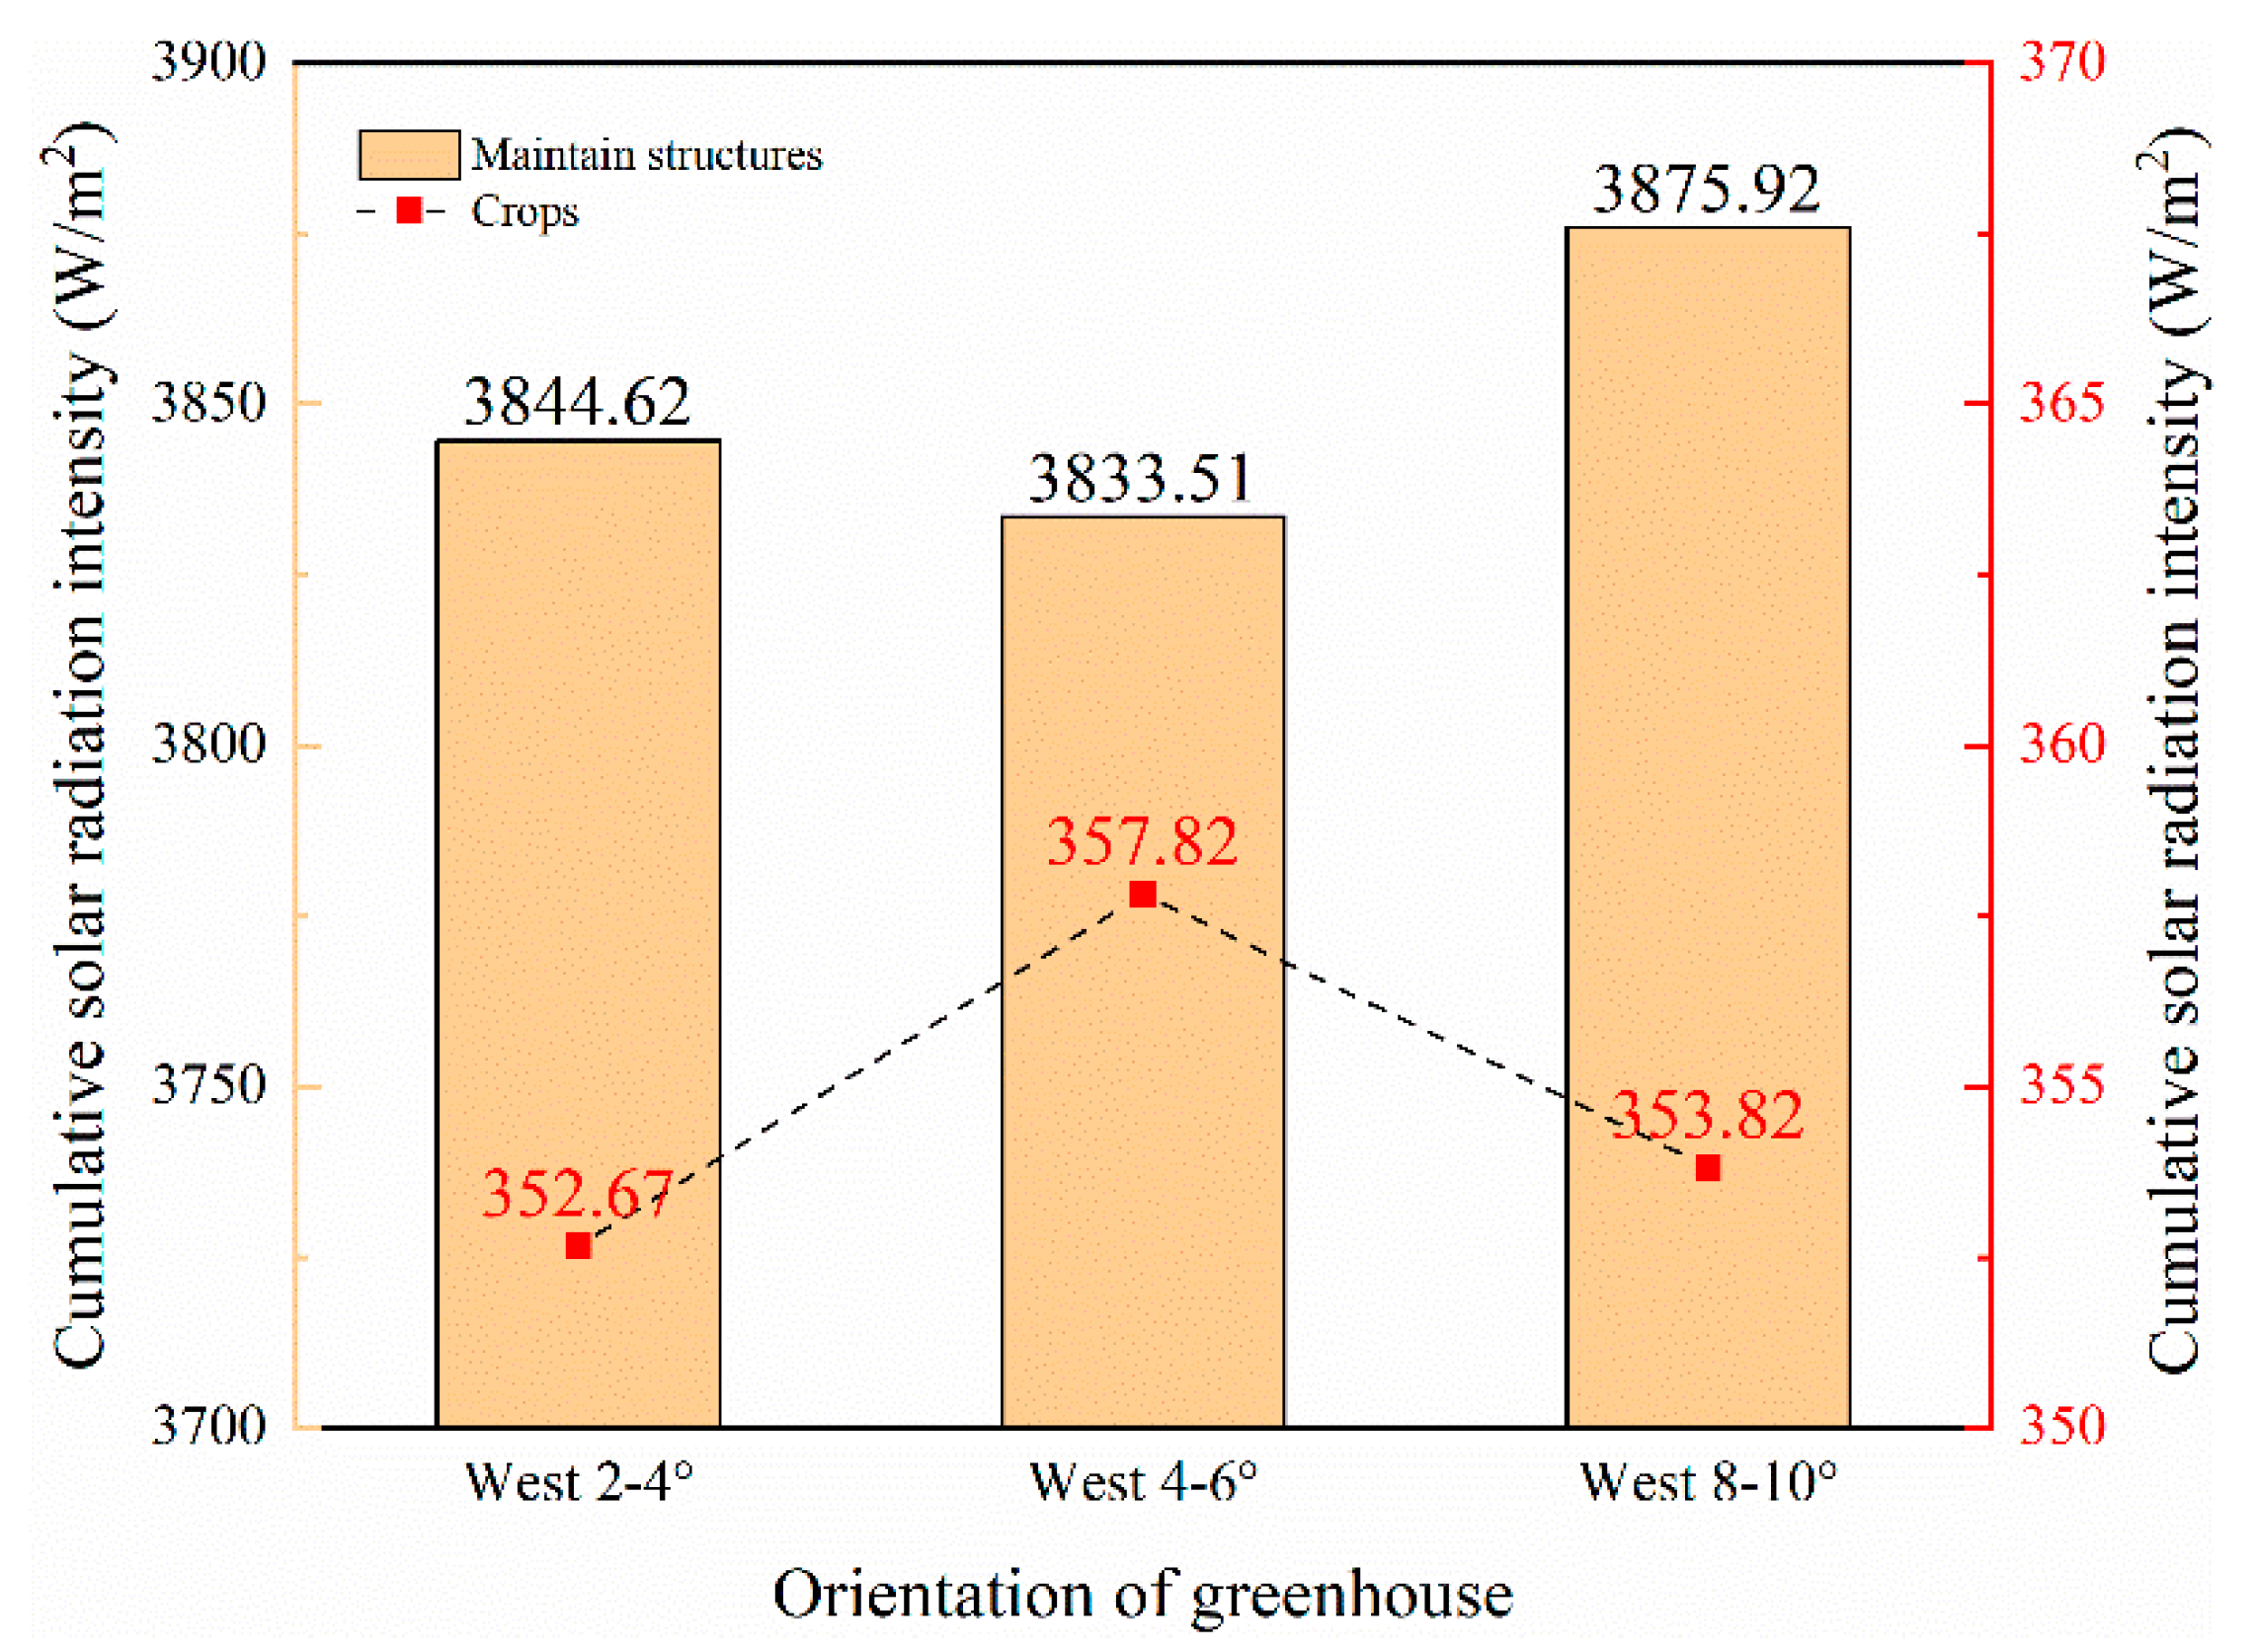
3.4. Optimal CSG Orientation in Different Areas

The obtained results indicated that the optimal CSG orientation in Shenyang should fall within the range of 9 and 10 degrees S-W. To further determine the best orientation, a step size of two degree was used to analyze the optimal range. As shown in Figure 13, to reach the maximum light interception of (a) crops, (b) maintenance structures in CSG with crops, and (c) maintenance structures in CSG without crops, the orientation of CSG in the Shenyang area should be 4–6° S-W, 8–10° S-W, and 2–4° S-W, respectively.
To clear the effect of optimization for greenhouse orientation based on the maintenance structures and crops, three common evaluation indices for the optimization were compared (the maximum light interception of crops, the maximum light interception of maintenance structures in CSG with crops, the maximum light interception of maintenance structures in CSG without crops), while the best orientation was selected for comparative analysis. The three selected CSG orientations were 2–4°, 4–6°, and 8–10° S-W. Meanwhile, the model of crop population was implemented into the CSG, which considered the maximum light interception of the maintenance structures inside empty greenhouse to control the consistency of the three basic CSG environments. The presence of crops was considered in the analysis process, and the maximum light interception of the structures was used as the basis of the optimization process. The results indicated that the values of light interception for maintenance structures in CSG with 8–10° S-W were 1.11% and 0.81% higher than those in CSG with 4–6° and 2–4° S-W, respectively. As shown in Figure 14, considering the maximum light interception of crops to determine orientation, results indicated that the values of the CSG with 4–6° S-W orientation were 1.46% and 1.14% higher than those with 2–4° and 8–10° S-W, respectively. In summary, the orientation optimization of the greenhouse should be based on planted greenhouses, and the evaluation of the orientation should include two aspects: (a) the light interception of the CSG maintenance structures and (b) the light interception of crops.

4. Discussion

In this paper, the optimization model of CSGs based on the crop light environment proposed is of universal significance. Considering the fact that the light environment is different at different geographical latitudes, simulations on four greenhouses areas were also conducted in the present study. In addition to Shenyang, Shouguang, Shijiazhuang, and Tongliao (Figure 1) are further investigated; these four cities are the major vegetable-producing areas in China’s cold regions. Meanwhile, considering that the quilts in the production process of CSGs in these areas under cloudy conditions in winter are usually in the half open or closed state, therefore, a typical sunny day is taken as the boundary condition in the simulation analysis process [18].
As shown in Figure 15, the influence of the different latitudes leads to significantly different solar radiation intensities of the CSG, and Tongliao has the lowest of among all the regions. Similarly, to maximize the radiation intercepted by the maintenance structures, the greenhouse orientations in each region corresponded to 4–6° S-W for Shouguang, 4–6° S-W for Shijiazhuang, and 2–4° S-E for Tongliao. To achieve the maximum intercepted radiation by the canopy of crops, the orientations of CSGs in each region corresponded to 2–4° S-W for Shouguang, 2–4° S-W for Shijiazhuang, and 2–4° S-W for Tongliao.
The optimal greenhouse orientations for the three productive regions and those for the Shenyang region were evaluated. Furthermore, the results were summarized in Table 2 in comparison with the light interception effect of maintenance structures and crops under the optimal orientation based on the empty greenhouse. The data indicated that considering the maximization of light interception of maintenance structures in CSG with the presence of crops, the light interception of each part of the optimized greenhouse increased by various degrees except the one corresponding to Shouguang. This indicated that for Shouguang, the optimal orientation based on the empty greenhouse or maintenance structures was consistent. In addition, when considering optimizing the lighting environment for crops, the obtained results showed that the light interception of the maintenance structures inside CSG decreased slightly, except the Tongliao one. According to this, it can be concluded that actual field needs can determine the selection of greenhouse orientation. Taking Shouguang as an example, the data indicated that if the CSG needs more heat storage, the proper orientation is 4–6° S-W. Moreover, if the crops present in the CSG need intense light radiation, the orientation can be selected as 2–4° S-W.
The aim of this study is to determine the optimal orientation of solar greenhouse. A suitable greenhouse orientation can be more suitable for crop growth and effectively reduce the waste of resources [6,16,17]. Moreover, choosing the optimal orientation will not increase the cost of solar greenhouse construction. According to the above results, it is necessary to optimize the orientation of CSG considering the existence of crops. These obtained results are also very common sense. The significance of the invention of the greenhouse is to provide a more suitable growing environment for crops. Especially in the mature stage of greenhouse crops, it not only needs better photosynthesis but also has a great influence on the distribution of solar radiation in CSG. Most of the previous studies on the optimization of greenhouse structure have not fully considered the existence of crops. This is because the spatial structure of crops is more complex than that of greenhouses [37].
In fact, the research on the 3D modelling of crops has been carried out for many years, and various methods have been proposed [38,39,40]. It is worth noting that most of these models were applied to the field crops and rarely consider the interaction between greenhouse environment and crop populations [41,42]. The significance of constructing 3D model with GroIMP is to clarify the interaction between CSG and crops, so as to improve the high-precision production of facility agriculture [35,43]. In addition, the GroIMP modelling platform can also be used for artificial light supplements for crops and other research [44,45]. Especially in the greenhouse crop photosynthesis simulation accuracy, GroIMP is so far a more ideal modelling platform [43,46].
Based on determining the optimal structure of solar greenhouses, the layout of internal facilities and crops can be further quantitatively optimized. This can greatly shorten the experimental period and improve the precision of agricultural management. However, there is still much room for improvement in the automation of crop phenotypic data acquisition. In further research, the rapid acquisition of crop phenotypic data and the rapid modeling of crops should be focused on. This may be achieved by connecting 3D scanning software [47,48] to the GroIMP modelling platform. In this way, it can provide basic conditions for the simulation study of crop dynamic growth model, so as to realize higher precision agricultural management.

5. Conclusions

In the presented work, the optimal orientation of CSGs based on the light environment and planting or the absence of crops are investigated using the open-source advanced 3D modelling techniques and physics-based light simulation. The data obtained from the field measurements were used to verify the model’s accuracy to identify its potential application in practical production processes, and the evaluation coefficients (R2) were above 0.9472.
Through comprehensive simulation, this research compared and determined the differences between the optimal orientation obtained considering: (a) an empty greenhouse, and (b) a planted greenhouse. The evaluation index of the optimal orientation was determined for each scenario. The model was further used to determine the optimal CSG orientation at different geographical latitudes, considering the light interception of maintenance structures and crops. Taking Shenyang as an example, the solar interception rate of crops can be increased by 1.46% after the optimization of CSG orientation.
The positive simulation results further indicate that the model framework may be applied to optimize other parameters, including the ridge height and cropping systems. In this way, it can provide basic conditions for the simulation study of crop dynamic growth model, so as to realize higher precision agricultural production management.

Author Contributions

Conceptualization, D.X. and A.L.; methodology, M.H. and Y.Z.; software, M.H.; validation, D.X., Y.Z. and A.L.; formal analysis, D.X.; investigation, Y.L.; writing—original draft preparation, D.X. and A.L.; writing—review and editing, X.L. and T.L.; supervision, T.L.; funding acquisition, X.L. All authors have read and agreed to the published version of the manuscript.

Funding

This research was funded by the National Key Research and Development Program of China, grant number 2019YFD1001905, the work of M.H. was supported from European Regional Development Fund-Project "SINGING PLANT", grant number CZ.02.1.01/0.0/0.0/16_026/0008446.

Data Availability Statement

Not applicable.

Conflicts of Interest

The authors declare no conflict of interest.

References

  1. Sahdev, R.K.; Kumar, M.; Dhingra, A.K. A comprehensive review of greenhouse shapes and its applications. Front. Energy 2019, 13, 427–438. [Google Scholar] [CrossRef]
  2. Yildirim, N.; Bilir, L. Evaluation of a hybrid system for a nearly zero energy greenhouse. Energy Convers. Manag. 2017, 148, 1278–1290. [Google Scholar] [CrossRef]
  3. Ezzaeri, K.; Fatnassi, H.; Wifaya, A.; Bazgaou, A.; Aharoune, A.; Poncet, C.; Bekkaoui, A.; Bouirden, L. Performance of photovoltaic canarian greenhouse: A comparison study between summer and winter seasons. Sol. Energy 2020, 198, 275–282. [Google Scholar] [CrossRef]
  4. Chargui, R.; Sammouda, H. Effects of different collector’s area on the coupling of a thermosiphon collector and a single zone. Energy Convers. Manag. 2014, 77, 356–368. [Google Scholar] [CrossRef]
  5. Perea-Moreno, A.J.; Juaidi, A.; Manzano-Agugliaro, F. Solar greenhouse dryer system for wood chips improvement as biofuel. J. Clean. Prod. 2016, 135, 1233–1241. [Google Scholar] [CrossRef]
  6. El-Maghlany, W.M.; Teamah, M.A.; Tanaka, H. Optimum design and orientation of the greenhouses for maximum capture of solar energy in North Tropical Region. Energy Convers. Manag. 2015, 105, 1096–1104. [Google Scholar] [CrossRef]
  7. Dragićević, S.M. Determining the optimum orientation of a greenhouse on the basis of the total solar radiation availability. Therm. Sci. 2011, 15, 215–221. [Google Scholar] [CrossRef]
  8. Papadakis, G.; Manolakos, D.; Kyritsis, S. Solar radiation transmissivity of a single-span greenhouse through measurements on scale models. J. Agric. Eng. Res. 1998, 71, 331–338. [Google Scholar] [CrossRef]
  9. Zhang, X.; Lv, J.; Xie, J.; Yu, J.; Zhang, J.; Tang, C.; Li, J.; He, Z.; Wang, C. Solar radiation allocation and spatial distribution in Chinese solar greenhouses: Model development and application. Energies 2020, 13, 1108. [Google Scholar] [CrossRef] [Green Version]
  10. Tong, G.; Christopher, D.M.; Li, B. Numerical modelling of temperature variations in a Chinese solar greenhouse. Comput. Electron. Agric. 2009, 68, 129–139. [Google Scholar] [CrossRef]
  11. Chen, C.; Ling, H.; Zhai, Z.J.; Li, Y.; Yang, F.; Han, F.; Wei, S. Thermal performance of an active-passive ventilation wall with phase change material in solar greenhouses. Appl. Energy 2018, 216, 602–612. [Google Scholar] [CrossRef]
  12. Choab, N.; Allouhi, A.; El Maakoul, A.; Kousksou, T.; Saadeddine, S.; Jamil, A. Review on greenhouse microclimate and application: Design parameters, thermal modeling and simulation, climate controlling technologies. Sol. Energy 2019, 191, 109–137. [Google Scholar] [CrossRef]
  13. Esmaeli, H.; Roshandel, R. Optimal design for solar greenhouses based on climate conditions. Renew. Energy 2020, 145, 1255–1265. [Google Scholar] [CrossRef]
  14. Shin, J.; Hwang, I.; Kim, D.; Moon, T.; Kim, J.; Kang, W.H.; Son, J.E. Evaluation of the light profile and carbon assimilation of tomato plants in greenhouses with respect to film diffuseness and regional solar radiation using ray-tracing simulation. Agric. For. Meteorol. 2021, 296, 108219. [Google Scholar] [CrossRef]
  15. Wu, G.; Yang, Q.; Fang, H.; Zhang, Y.; Zheng, H.; Zhu, Z.; Feng, C. Photothermal/day lighting performance analysis of a multifunctional solid compound parabolic concentrator for an active solar greenhouse roof. Sol. Energy 2019, 180, 92–103. [Google Scholar] [CrossRef]
  16. Xu, D.; Li, Y.; Zhang, Y.; Xu, H.; Li, T.; Liu, X. Effects of orientation and structure on solar radiation interception in Chinese solar greenhouse. PLoS ONE 2020, 15, e0242002. [Google Scholar] [CrossRef]
  17. Chen, C.; Li, Y.; Li, N.; Wei, S.; Yang, F.; Ling, H.; Yu, N.; Han, F. A computational model to determine the optimal orientation for solar greenhouses located at different latitudes in China. Sol. Energy 2018, 165, 19–26. [Google Scholar] [CrossRef]
  18. Cao, W.; Li, Y.; Bai, Y. Relationship between Azimuth Angle of Solar Greenhouse and inside Temperature. J. Agric. Mech. Res. 2009, 31, 184–189. (In Chinese) [Google Scholar]
  19. Ahamed, M.S.; Guo, H.; Tanino, K. Modeling heating demands in a Chinese-style solar greenhouse using the transient building energy simulation model TRNSYS. J. Build. Eng. 2020, 29, 101114. [Google Scholar] [CrossRef]
  20. Yang, W.; Ma, C. Simulation Study on the Effect of Greenhouse Azimuth on Light Environment of Sunlight Greenhouse. North. Hortic. 2016, 19, 52–54. (In Chinese) [Google Scholar]
  21. Marien, H.; Coussement, J.R.; Steppe, K. Quantifying the importance of a realistic tomato (Solanum lycopersicum) leaflet shape for 3-D light modelling. Ann. Bot. 2020, 126, 661–670. [Google Scholar] [CrossRef] [Green Version]
  22. Kniemeyer, O. Design and Implementation of a Graph Grammar Based Language for Functional-Structural Plant Modelling. Ph.D. Thesis, BTU Cottbus, Cottbus, Germany, 2008. Available online: http://nbnresolving.de/urn/resolver.pl?urn=urn:nbn:de:kobv:co1-opus-5937 (accessed on 2 February 2022).
  23. Kniemeyer, O. Rule-based Modelling with the XL/GroIMP Software. In Proceedings of the 6th German Workshop on Artificial Life, Bamberg, Germany, 14–16 April 2004; Schaub, H., Detje, F., Bruggemann, U., Eds.; AKA Akademische Verlagsgesellschaft: Berlin, Germany, 2004; pp. 56–65. [Google Scholar]
  24. Hemmerling, R.; Kniemeyer, O.; Lanwert, D.; Kurth, W.; Buck-Sorlin, G. The rule-based language XL and the modelling environment GroIMP illustrated with simulated tree competition. Funct. Plant Biol. 2008, 35, 739–750. [Google Scholar] [CrossRef] [PubMed]
  25. Sarlikioti, V.; De Visser, P.H.B.; Marcelis, L.F.M. Exploring the spatial distribution of light interception and photosynthesis of canopies by means of a functionalstructural plant model. Ann. Bot. 2011, 107, 875–883. [Google Scholar] [CrossRef] [PubMed] [Green Version]
  26. Schmidt, D.; Kahlen, K. Towards more realistic leaf shapes in functional-structural plant models. Symmetry 2018, 10, 278. [Google Scholar] [CrossRef] [Green Version]
  27. Phong, B.T. Graphics and Illumination for Computer Generated Pictures. Commun. ACM 1975, 18, 311–317. [Google Scholar] [CrossRef] [Green Version]
  28. Kalaitzoglou, P.; Van Ieperen, W.; Harbinson, J.; Van Der Meer, M.; Martinakos, S.; Weerheim, K.; Nicole, C.C.S.; Marcelis, L.F.M. Effects of continuous or end-of-day far-red light on tomato plant growth, morphology, light absorption, and fruit production. Front. Plant Sci. 2019, 10, 322. [Google Scholar] [CrossRef] [Green Version]
  29. Evers, J.B.; Vos, J.; Yin, X.; Romero, P.; Van Der Putten, P.E.L.; Struik, P.C. Simulation of wheat growth and development based on organ-level photosynthesis and assimilate allocation. J. Exp. Bot. 2010, 61, 2203–2216. [Google Scholar] [CrossRef] [Green Version]
  30. Buck-Sorlin, G.H.; De Visser, P.H.B.; Henke, M.; Sarlikioti, V.; Van Der Heijden, G.W.A.M.; Marcelis, L.F.M.; Vos, J. Towards a functionalstructural plant model of cut-rose: Simulation of light environment, light absorption, photosynthesis and interference with the plant structure. Ann. Bot. 2011, 108, 1121–1134. [Google Scholar] [CrossRef]
  31. De Visser, P.H.B.; Buck-Sorlin, G.H.; Van Der Heijden, G.W.A.M.; Marcelis, L.F.M. A 3D model of illumination, light distribution and crop photosynthesis to simulate lighting strategies in greenhouses. Acta Hortic. 2012, 956, 195–200. [Google Scholar] [CrossRef] [Green Version]
  32. Spitters, C.J.T. Separating the diffuse and direct component of global radiation and its implications for modeling canopy photosynthesis Part II. Calculation of canopy photosynthesis. Agric. For. Meteorol. 1986, 38, 231–242. [Google Scholar] [CrossRef]
  33. De Visser, P.H.B.; Buck-Sorlin, G.H.; Van Der Heijden, G.W.A.M. Optimizing illumination in the greenhouse using a 3D model of tomato and a ray tracer. Front. Plant Sci. 2014, 5, 48. [Google Scholar] [CrossRef] [Green Version]
  34. Henke, M.; Buck-Sorlin, G.H. Using a full spectral raytracer for calculating light microclimate in functional-structural plant modelling. Comput. Inform. 2017, 36, 1492–1522. [Google Scholar] [CrossRef]
  35. Zhang, Y.; Henke, M.; Li, Y.; Yue, X.; Xu, D.; Liu, X.; Li, T. High resolution 3D simulation of light climate and thermal performance of a solar greenhouse model under tomato canopy structure. Renew. Energy 2020, 160, 730–745. [Google Scholar] [CrossRef]
  36. Zheng, L.; Zhang, Q.; Zheng, K.; Zhao, S.; Wang, P.; Cheng, J.; Zhang, X.; Chen, X. Effects of diffuse light on microclimate of solar greenhouse, and photosynthesis and yield of greenhouse-grown tomatoes. HortScience 2020, 55, 1605–1613. [Google Scholar] [CrossRef]
  37. Sarlikioti, V.; De Visser, P.H.B.; Buck-Sorlin, G.H.; Marcelis, L.F.M. How plant architecture affects light absorption and photosynthesis in tomato: Towards an ideotype for plant architecture using a functionalstructural plant model. Ann. Bot. 2011, 108, 1065–1073. [Google Scholar] [CrossRef] [Green Version]
  38. Kim, D.; Kang, W.H.; Hwang, I.; Kim, J.; Kim, J.H.; Park, K.S.; Son, J.E. Use of structurally-accurate 3D plant models for estimating light interception and photosynthesis of sweet pepper (Capsicum annuum) plants. Comput. Electron. Agric. 2020, 177, 105689. [Google Scholar] [CrossRef]
  39. Xu, L.; Henke, M.; Zhu, J.; Kurth, W.; Buck-Sorlin, G.H. A functionalstructural model of rice linking quantitative genetic information with morphological development and physiological processes. Ann. Bot. 2011, 107, 817–828. [Google Scholar] [CrossRef] [Green Version]
  40. Chéné, Y.; Rousseau, D.; Lucidarme, P.; Bertheloot, J.; Caffier, V.; Morel, P.; Belin, É.; Chapeau-Blondeau, F. On the use of depth camera for 3D phenotyping of entire plants. Comput. Electron. Agric. 2012, 82, 122–127. [Google Scholar] [CrossRef]
  41. Coussement, J.; Henke, M.; Lootens, P.; Roldán-Ruiz, I.; Steppe, K.; De Swaef, T. Modelling leaf spectral properties in a soybean functional-structural plant model by integrating the prospect radiative transfer model. Ann. Bot. 2018, 122, 669–676. [Google Scholar] [CrossRef]
  42. Wang, Y.; Wen, W.; Wu, S.; Wang, C.; Yu, Z.; Guo, X.; Zhao, C. Maize plant phenotyping: Comparing 3D laser scanning, multi-view stereo reconstruction, and 3D digitizing estimates. Remote Sens. 2019, 11, 63. [Google Scholar] [CrossRef] [Green Version]
  43. Zhang, Y.; Henke, M.; Buck-Sorlin, G.H.; Li, Y.; Xu, H.; Liu, X.; Li, T. Estimating canopy leaf physiology of tomato plants grown in a solar greenhouse: Evidence from simulations of light and thermal microclimate using a Functional-Structural Plant Model. Agric. For. Meteorol. 2021, 307, 108494. [Google Scholar] [CrossRef]
  44. Hitz, T.; Henke, M.; Graeff-Hönninger, S.; Munz, S. Three-dimensional simulation of light spectrum and intensity within an LED growth chamber. Comput. Electron. Agric. 2019, 156, 540–548. [Google Scholar] [CrossRef]
  45. Chen, T.-W.; Nguyen, T.M.N.; Kahlen, K.; Stützel, H. High temperature and vapor pressure deficit aggravate architectural effects but ameliorate non-architectural effects of salinity on dry mass production of tomato. Front. Plant Sci. 2015, 6, 887. [Google Scholar] [CrossRef] [Green Version]
  46. Chen, T.-W.; Henke, M.; De Visser, P.H.B.; Buck-Sorlin, G.H.; Wiechers, D.; Kahlen, K.; Stützel, H. What is the most prominent factor limiting photosynthesis in different layers of a greenhouse cucumber canopy? Ann. Bot. 2014, 114, 677–688. [Google Scholar] [CrossRef] [Green Version]
  47. Paturkar, A.; Sen Gupta, G.; Bailey, D. Making use of 3d models for plant physiognomic analysis: A review. Remote Sens. 2021, 13, 2232. [Google Scholar] [CrossRef]
  48. Gao, T.; Zhu, F.; Paul, P.; Sandhu, J.; Doku, H.A.; Sun, J.; Pan, Y.; Staswick, P.; Walia, H.; Yu, H. Novel 3d imaging systems for high-throughput phenotyping of plants. Remote Sens. 2021, 13, 2113. [Google Scholar] [CrossRef]
Figure 1. Regional distribution of CSGs in China: (a) geographical location and corresponding scale of four major greenhouse producing areas; (b) an irregular distribution of greenhouse orientation in an actual production.
Remotesensing 14 00912 g001
Figure 2. Comparison of a real CSG-LS: (a) the real greenhouse in Shenyang; (b) the virtual greenhouse model used in the simulation; (c) the melon plants in CSG-LS. Note: The images of the greenhouse and the melon plant were taken on 15 December 2020 in CSG-LS, which is located at Shenyang Agricultural University.
Remotesensing 14 00912 g002
Figure 3. Process of 3D modelling of melon plants inside CSG: (a) a real melon plant CSG-LS; (b) digital measurement of melon leaf; (c) the meshing process of leaf; (d) 3D virtual restoration of leaf; (e) 3D spatial layout of leaf; (f) 3D reconstruction of a representative melon plant.
Remotesensing 14 00912 g003
Figure 4. Diagram of the virtual light scenario: The red sphere stands for the sun. The yellow spheres are the visual trajectory of the sun every hour in simulated time. The white spheres represent the 72 radiation sources of the diffuse sky model.
Remotesensing 14 00912 g004
Figure 5. Schematic profile of a greenhouse, highlighting the positions of the field measurement points. Red circles mark the positions of the pyranometer to verify the light interception of crops (horizontal upper part of the leaf). The sun symbols indicate the locations of the arrangement of pyranometer used for continuous monitoring the light interception of the ground and wall.
Remotesensing 14 00912 g005
Figure 6. Comparison of measured and simulated data for (a) greenhouse structures in Shenyang; (b) greenhouse structures in Tongliao; (c) crops inside CSG of Shenyang.
Remotesensing 14 00912 g006
Figure 7. Interception of solar radiation by lighting roof in different CSG orientations: (a) hourly variation; (b) cumulative daily change.
Remotesensing 14 00912 g007
Figure 8. Interception of solar radiation on the wall of CSG with different orientations: (a) hourly variation; (b) cumulative daily change.
Remotesensing 14 00912 g008
Figure 9. Interception of solar radiation on the ground of CSG with different orientations: (a) hourly variation; (b) cumulative daily change.
Remotesensing 14 00912 g009
Figure 10. Interception of solar radiation on the roof of CSG with different orientations: (a) hourly variation; (b) cumulative daily change.
Remotesensing 14 00912 g010
Figure 11. Comparison of cumulative solar radiation in CSG with and without crops. The cumulative value is the intercepted solar radiation intensity of maintenance structures inside CSG with or without plants during the daylighting period (8:00 A.M. to 4:00 P.M.).
Remotesensing 14 00912 g011
Figure 12. Interception of solar radiation on crops of CSG with different orientations: (a) hourly variation; (b) cumulative daily change.
Remotesensing 14 00912 g012
Figure 13. Results of the optimization of greenhouse orientation with increased perspectives of two degree at each simulation step. The cumulative value is the intercepted solar radiation intensity of crops or maintenance structures inside CSG during the daylighting period (8:00 A.M. to 4:00 P.M.).
Remotesensing 14 00912 g013
Figure 14. Comparison of optimization effects under three evaluation indices which are the maximum light interception of crops, and the maximum light interception of maintenance structures in CSG with or without crops.
Remotesensing 14 00912 g014
Figure 15. Determination of greenhouse orientation in different latitudes: (a) light interception of the maintenance structures; (b) light interception of the crops.
Remotesensing 14 00912 g015
Table 1. Specific parameter values of virtual greenhouse.
DescriptionValue RangeUnit
Greenhouse size
Lighting roof (L, W, H)60, 9.2, 0.00015meter
Wall (L, W, H)60, 2.9, 0.48meter
Ground (L, W, H)60, 9, 0.5meter
Roof (L, W, H)60, 2.5, 0.3meter
Plant arrangement
Width of the plant wide row0.9meter
Width of the plant narrow row0.7meter
Melon plant spacing0.4meter
Number of rows74-
Number of plants per row20-
Melon plant
Maximal leaf rank per plant19-
Averaged plant height1.3meter
Averaged petiole length per rank0.094, 0.075, 0.07, 0.08, 0.14, 0.12, 0.1, 0.1,
0.11, 0.11, 0.11, 0.12, 0.1, 0.1, 0.11, 0.02,
0.02, 0.02, 0.02
meter
Averaged internode length per rank0.074, 0.076, 0.056, 0.068, 0.054, 0.063, 0.062, 0.077, 0.056, 0.073, 0.053, 0.08, 0.069, 0.072, 0.083, 0.06, 0.079, 0.082, 0.048meter
Averaged leaf angle per rank−20, −26, −25, −18, −21, −24, −10, −6,
−33, 28, −18, −26, −14, −10, −23, −28,
−28, −34
°
Averaged petiole angle per rank40, 46, 55, 58, 51, 34, 20, 26, 23, 28, 18,
26, 14, 20, 13, 28, 18, 22
°
Table 2. Analysis of the optimal CSG orientation in main productive regions at different geographical latitudes.
Evaluation
Index
Empty GreenhouseMaintain StructuresCrops
AreaAzimuthStructureCropAzimuthStructureRateCropRateAzimuthStructureRateCropRate
Shouguang (Φ = 36.8° N)W 4–6°4149.4390.5W 4–6°4149.40.00%390.50.00%W 2–4°4138.5−0.26%391.60.28%
Shijiazhuang (Φ = 38.0° N)W6–8°4087.6378.4W 4–6°4093.90.15%385.91.98%W 2–4°4074.4−0.32%387.62.43%
Shenyang
(Φ = 41.8° N)
W 2–4°3844.6352.7W 8–10°3875.90.81%353.81.14%W 4–6°3833.5−0.29%357.81.46%
Tongliao
(Φ = 43.6° N)
W 8–10°3727.4331.7E 2–4°3802.42.01%333.90.66%W 2–4°3744.30.45%338.82.14%
Publisher’s Note: MDPI stays neutral with regard to jurisdictional claims in published maps and institutional affiliations.

