Article

Identification and Correlation Analysis of Engineering Environmental Risk Factors along the Qinghai–Tibet Engineering Corridor

1
State Key Laboratory of Frozen Soil Engineering, Northwest Institute of Eco-Environment and Resources, CAS, Lanzhou 730000, China
2
University of Chinese Academy of Sciences, Beijing 100049, China
3
State Key Laboratory of Mountain Bridge and Tunnel Engineering, Chongqing Jiaotong University, Chongqing 400074, China
4
School of Civil Engineering, Chongqing Jiaotong University, Chongqing 400074, China
5
Department of Environmental Sciences, University of California, Riverside, CA 92521, USA
*
Author to whom correspondence should be addressed.
Remote Sens. 2022, 14(4), 908; https://doi.org/10.3390/rs14040908
Submission received: 22 January 2022 / Revised: 9 February 2022 / Accepted: 10 February 2022 / Published: 14 February 2022

Abstract

:
Global warming has increased the security risk of permafrost environment in the Tibetan Plateau, which has been threatening infrastructures along the Qinghai–Tibet Engineering Corridor (QTEC). Combined with the traditional risk identification and the causal feedback relationship of system dynamics, the authors present a novel engineering environment risk identification model including five risk subsystems, i.e., regional geomorphology, climate change, ecological environment, permafrost environment and water environment. Our model could successfully identify the interaction relationships and transmission path among risk factors of the environment of the QTEC. The basic data calculation, interaction degree analysis and regional distribution characteristic analysis of the identified risk factors were carried out by using a geographic information system (GIS), a partial correlation analysis and a zoning analysis. The results show that the static factors (i.e., elevation, slope, aspect, relief degree of land surface and volume ice content) mainly affected the spatial distribution of environmental risk factors, while the climate change factors (i.e., mean annual air temperature, mean annual precipitation and surface solar radiation), among the dynamic factors, were the root factors of the dynamic changes in environmental risks. The model identified five types of parallel risk paths in the QTEC. This novel method and proposed model can be used to identify and assess multi-scale engineering environmental risks in the cryosphere.

Graphical Abstract

1. Introduction

Global warming has led to great changes in the cryosphere, including ice sheet melting [1,2], glacier melting [3,4], permafrost degradation [5,6,7], land desertification [8] and snow cover reduction [9,10], resulting in frequent disasters [11,12,13]. As an important part of the cryosphere of the Qinghai–Tibet Plateau [14,15], permafrost has the characteristics of high ground temperature, poor hydrothermal stability and climate sensitivity [16,17]. The increasing air temperature, due to the climate change on the Qinghai–Tibet Plateau, warms the underlying permafrost, deepens the active layer, melts the underground ice and, finally, increases the depth of the permafrost table [18]. Followed by the increasing air temperature, permafrost degradation triggers more frequently thermal hazards [19], which greatly affects the ecological and hydrological environment in permafrost regions and threatens the safety of residents [20,21,22] and engineering infrastructures built on permafrost [23,24,25]. Similarly, the linear engineering of the QTEC also faces more serious permafrost thawing disasters [26,27,28,29,30,31,32,33,34,35,36].
The current assessment of environmental disasters in permafrost areas is carried out qualitatively and quantitatively. The qualitative assessment mainly focuses on the evaluation of the engineering geological conditions on the Qinghai–Tibet Plateau and risk factors are selected on the basis of field surveys, monitoring data of permafrost and engineering buildings, and experimental data [27,37]. The quantitative evaluation mostly adopts the following eight methods. (1) Catastrophe progression method: risk factors are selected from the perspective of thermal stability of permafrost and natural environment for engineering geological evaluation [38]. (2) Hazard degree analysis: according to the disaster environment, the characteristics of the disaster and the relevant literature, the disaster-causing factors of different geological disasters are selected [39]. (3) The settlement index (Is): the active layer thickness and volume ice content are selected to analyze the thaw settlement hazard [32,33,40,41,42]. (4) The risk zonation index (Ir): factors such as surface properties, volume ice content, soil texture and active layer thickness are selected to analyze the degree of thaw settlement disaster [43,44]. (5) The permafrost settlement hazard index (Ip): the effects of ecological factors such as soil texture, vegetation and organic content of soil on permafrost thawing disasters are considered [45]. (6) The allowable bearing capacity index (Ia): the effects of soil type and mean annual ground temperature on the stability distribution of permafrost on the Qinghai–Tibet Plateau are considered [46]. (7) The AHP-based Geo-hazard index (Ig): an analytic hierarchy process is used to select the corresponding thawing settlement risk factors [18,41]. (8) The combined index (Ic): the influence of three Geo-hazard indexes (Is, Ir and Ia) on permafrost thawing disasters is comprehensively analyzed [47]. The main risk factors considered in the above methods include mean annual ground temperature, active layer thickness and volume ice content. At present, for the risk assessment of permafrost environmental disasters, the selection of risk factors usually adopts the traditional risk identification methods (expert investigation method, fault tree analysis method, checklist method, etc.) [48,49,50]. The traditional method, mainly based on the qualitative and static thinking approaches, identifies and establishes a set of risk factors by considering the relevant normative data, the experts’ experience and the field survey. However, many influencing factors need to be considered in the process of risk identification and cannot be quantitatively described. These limitations restrict the application of the traditional methods, which can only simply identify and list the influencing factors of a certain risk and cannot analyze the interactions among the influencing factors. Therefore, traditional methods may cause one to miss the consideration of potential risk factors for a certain risk.
As the environment in the QTEC changes with time and climate, the environmental risk factors faced by the infrastructures in the Corridor are constantly changing. Therefore, it is necessary to dynamically identify the environmental risk factors and study their mutual influence [51]. The objectives of this study are as follows: (1) to provide a dynamic engineering environment risk identification model which can trace the causes and analyze the consequences; (2) to figure out the degree of influence among dynamic risk factors through partial correlation analysis; (3) to identify the distribution characteristics of each factor in different static risk factor zones.
In order to achieve the research objectives of this paper, we selected the remote sensing data of five risk subsystems, i.e., regional geomorphology, climate change, ecological environment, permafrost environment and water environment, from 2003 to 2016 and put forward the following hypotheses: (1) climate risk is the root factor that leads to the dynamic change in engineering environmental risk factors at all times; (2) climate risk factors have a greater impact on other dynamic risk factors.

2. Study Area, Dataset and Calculation Methods

2.1. Study Area

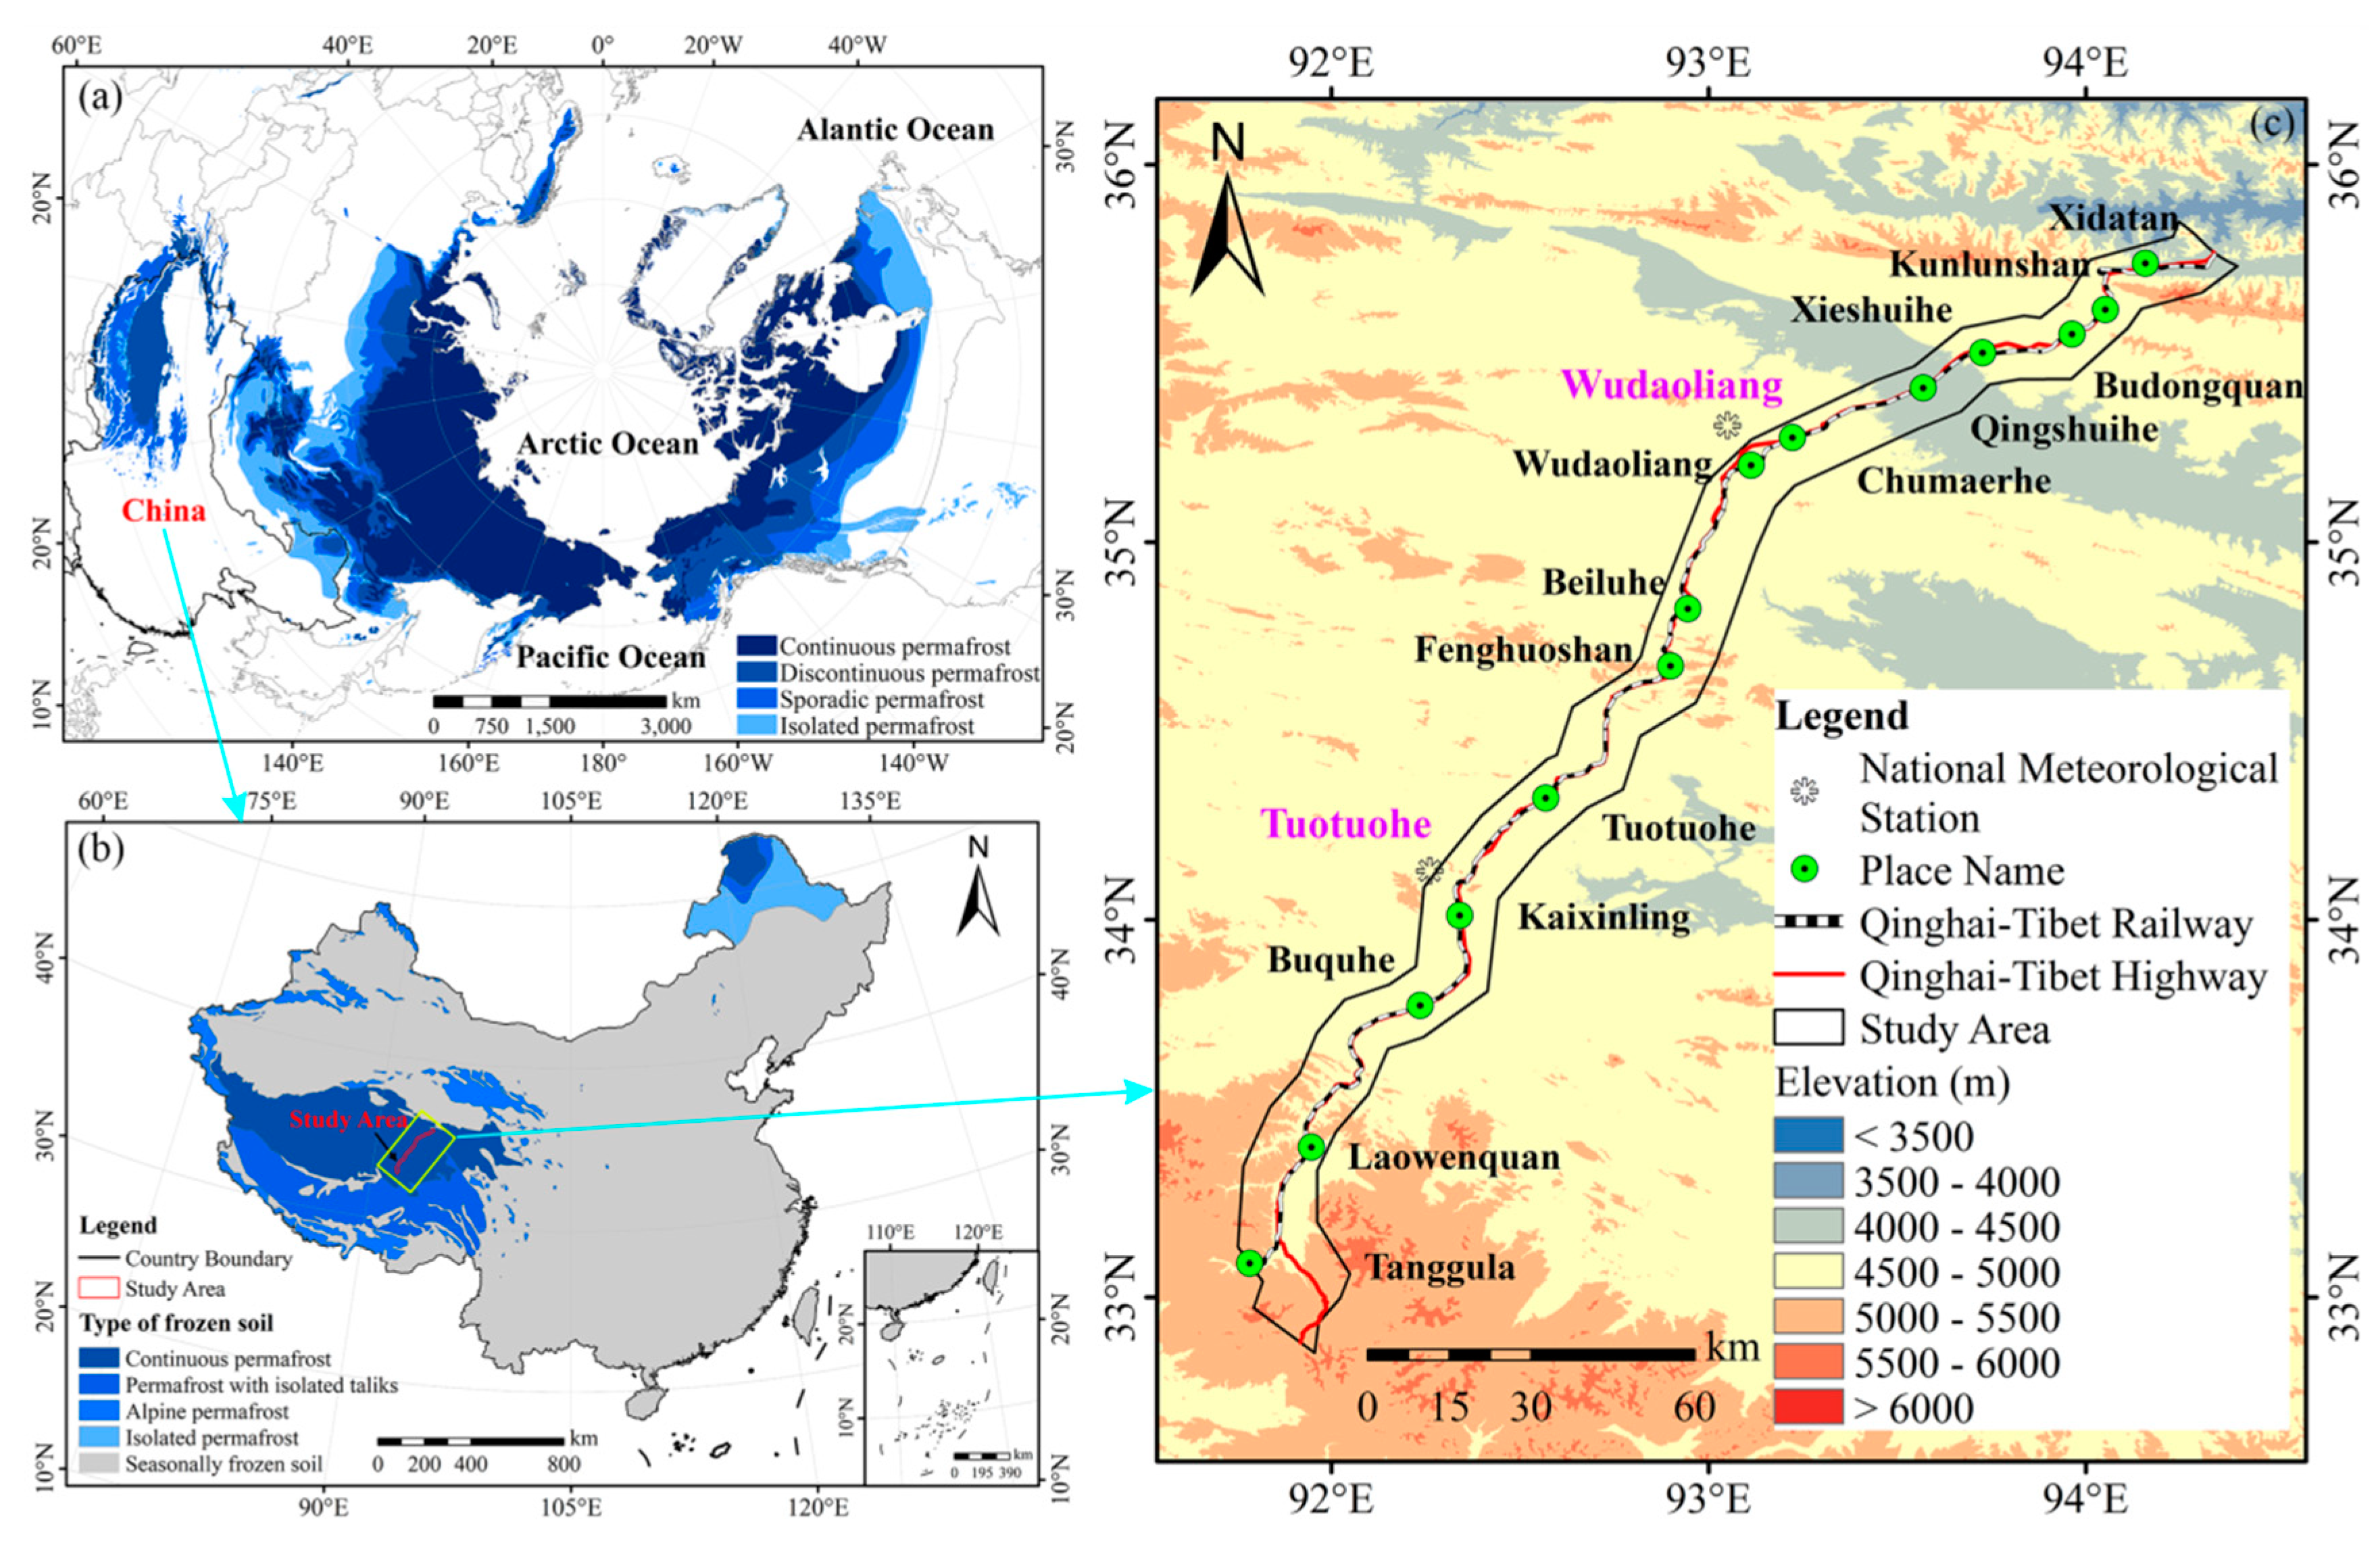
The permafrost in the Northern Hemisphere, mainly distributed in the middle and high latitudes, accounts for about 25% of its land surface (Figure 1a). The permafrost in China is mainly distributed in the northern part of Northeast China and the Qinghai–Tibet Plateau (Figure 1b). The QTEC, an important channel between the mainland and Tibet, is 1120 km long, from Golmud to Lhasa, and the permafrost region that passes through accounts for 50% of the total length (about 550 km). The QTEC includes many important linear infrastructures, such as the Qinghai–Tibet highway, the Qinghai–Tibet railway, the Golmud–Lhasa products pipeline and the Qinghai–Tibet DC transmission engineering [47,52,53]. This paper takes the permafrost region in the Corridor (Xidatan–Tanggula) as the study area and dynamically identifies the engineering environmental risk factors and the driving factors of each risk source in the study area. As shown in Figure 1c, the study area is located at 91°E~95°E, 32°N~36°N and the elevation is between 3945 m and 6171 m, mainly high altitude (3500 m~5000 m, accounting for 85.75%). The topography in the study area is complex, mainly including plains, platforms, hills and low-relief mountains, and the relief degree of the land surface ranges from 0 m to 780 m.
The study area has high altitude and continental climate with a mean annual air temperature of about −7.29~−3.21 °C [54,55]. In recent years, the temperature and precipitation in the QTEC have increased [55,56]. The permafrost in the study area is mainly characterized by high ground temperature and high ice content [25] and is also extremely sensitive to climate change, which makes the environmental risks faced by the infrastructures in the study area present with complex dynamic changes.

2.2. Dataset

The basic data used in our novel model mainly comes from three websites, Geospatial Data Cloud (http://www.gscloud.cn/, accessed date: 18 November 2021), National Aviation Corporation of America (https://ladsweb.modaps.eosdis.nasa.gov/, accessed date: 18 November 2021) and National Tibetan Plateau Data Center (http://data.tpdc.ac.cn/zh-hans/, accessed date: 18 November 2021), and the specific data information is shown in the Supplementary Materials (Table S1) [58,59,60,61,62,63,64,65,66]. By using the Kriging interpolation method and resampling method, the spatial resolution of all data was maintained at 1 km and the data span is from 2003 to 2016.

2.3. Calculation Methods

In this paper, six risk factors, including the relief degree of land surface, the fractional vegetation coverage, the active layer thickness, the annual mean ground temperature, the volume ice content and the allowable bearing capacity, were calculated and processed. The relations among the risk factors was analyzed using the partial correlation coefficient. The specific calculation method is detailed in previous references [30,46,67,68,69,70,71,72,73,74,75,76,77,78,79,80].

3. Risk Identification Based on System Dynamics

3.1. Initial Risk Identification

In this paper, the method of data collection and literature survey were used to consult the information related to the environmental risks of the QTEC and some risk factors were initially identified (Table 1).
Due to its characteristics of vertical, latitude and arid zonality on the Qinghai–Tibet Plateau, the permafrost distribution in the Corridor under different geomorphological factors is significantly different [81]. Climate warming and extreme events in a short period of time aggravate the melting of permafrost, ice and snow in the Corridor, causing different thermal hazards (thaw slumping, glacier debris flow, etc.) [39,82,83]. The degradation of permafrost caused by climate change and the intensification of human activities would aggravate ecological risks such as soil desertification and vegetation degradation [84,85]. The sensitivity of permafrost to external environmental disturbances makes the permafrost environment prone to major changes, leading to various disasters [23,86]. The development of thermokarst lakes would lead to the warming of the permafrost environment, which indicates the degradation of permafrost [87,88,89]. These factors not only would result in the damage to the ecological environment over time [90], but would also impact the safety and stability of the foundations of structures built on permafrost in their service life [91,92].

3.2. Risk Identification Model Based on System Dynamics

System dynamics (SD) is a top-down information feedback method proposed by Professor Forrester [93]. The essence of this method is a high-order, multi-loop and nonlinear feedback structure. The SD approach is a mature method to visualize, analyze and understand complex dynamic feedback.
The causal loop diagram (CLD) can reflect how a complex system is dynamically affected by the interaction of all variables. A CLD is composed of variables connected by arrows and the arrow indicates the causal influence between variables. Each causality is given a polarity, either positive (+) or negative (-), to show how dependent variables are affected by independent variables. The positive feedback shows that the change in any variable in the causal loop would eventually affect itself in a positive way, while the negative feedback means that it would ultimately affect itself in a negative way [94].
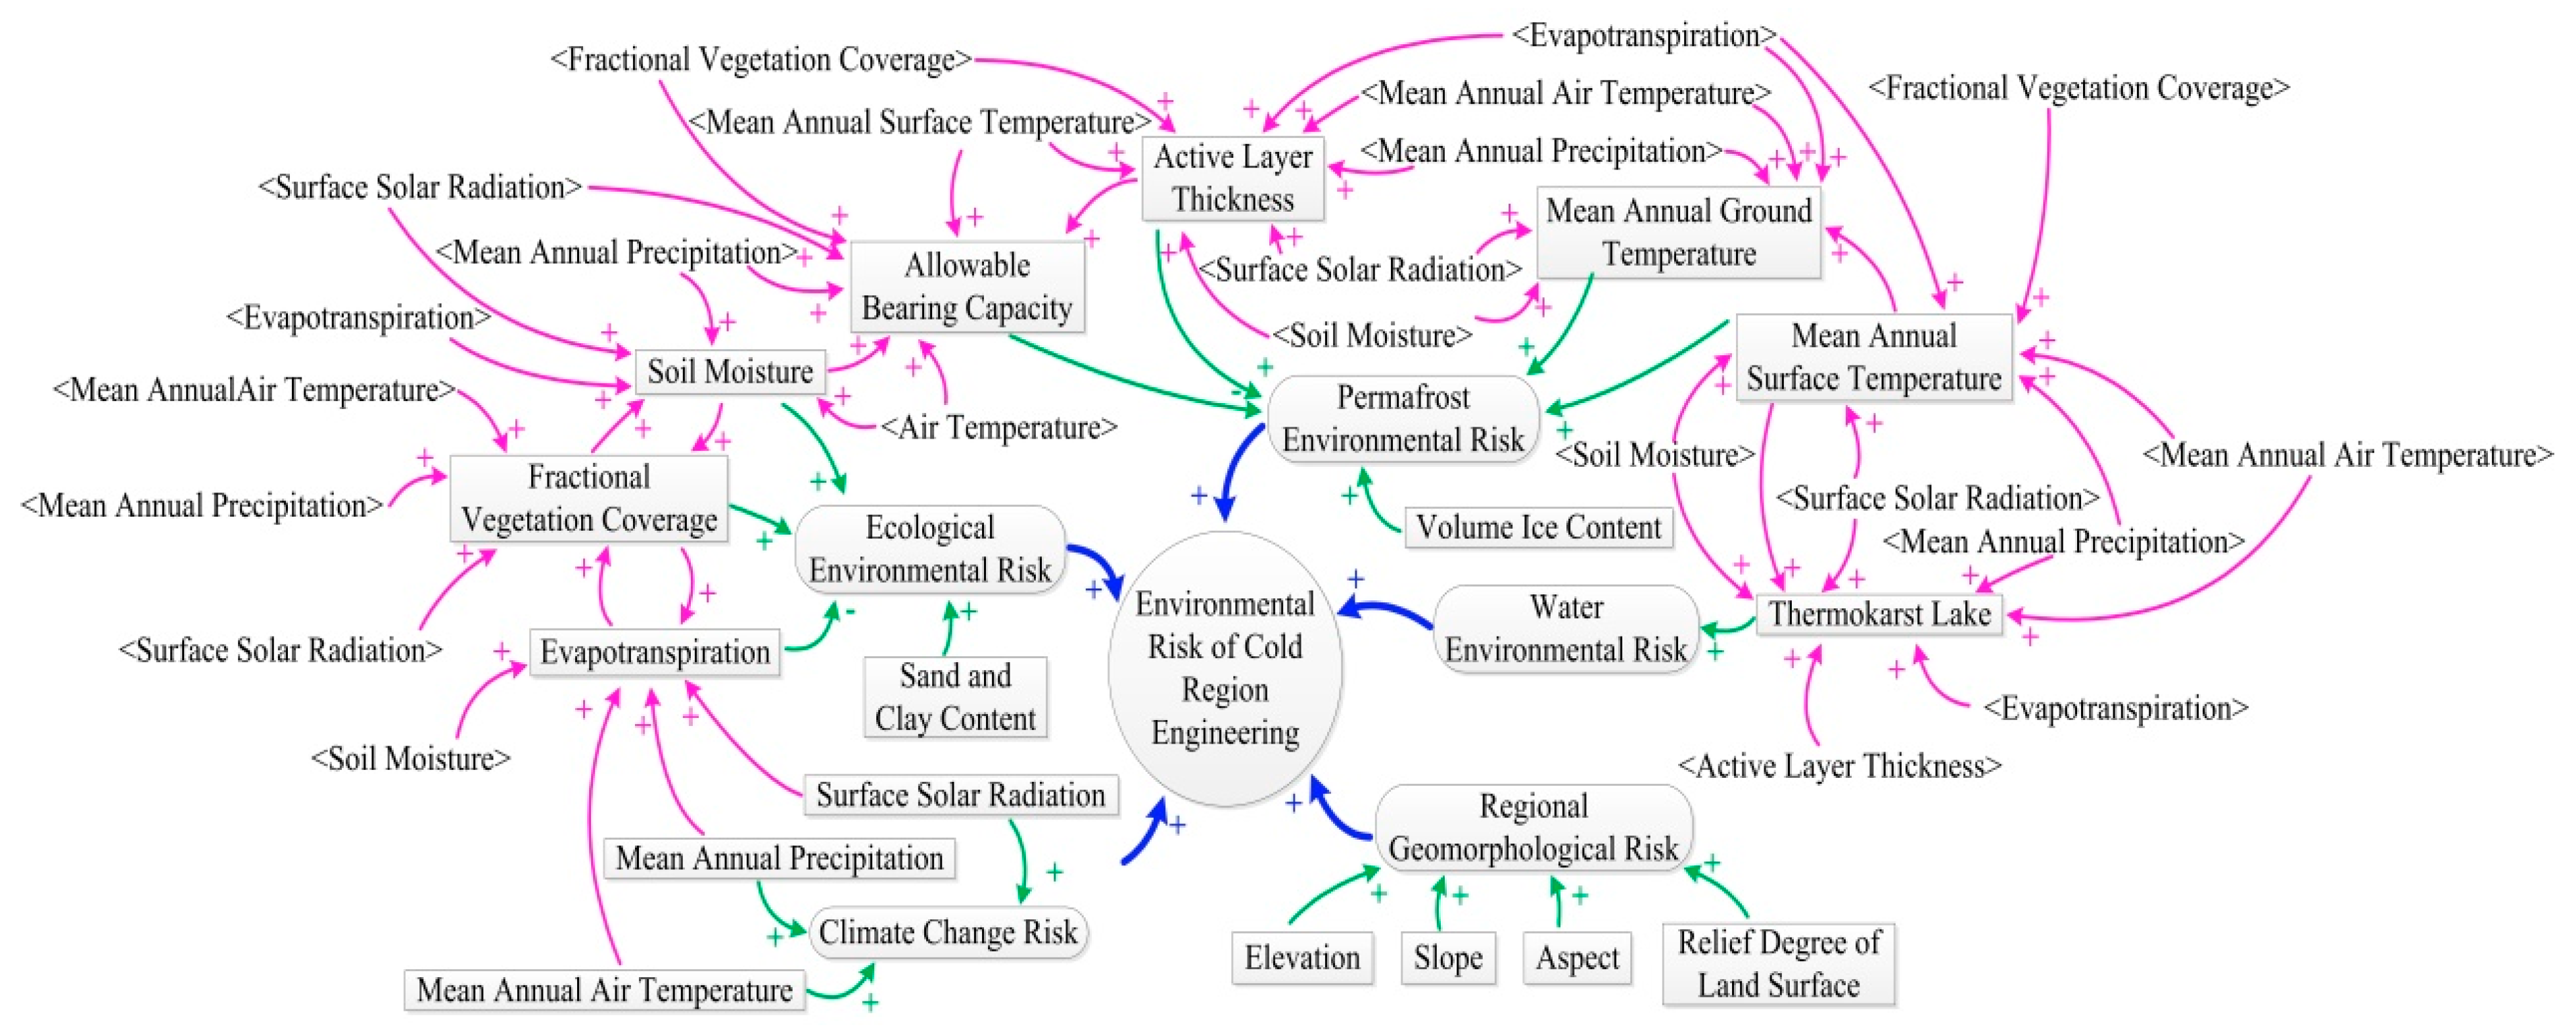
The risk factors in the preliminary risk identification list and the logical relationships between them were used as the input conditions of the risk identification model in this paper and the causal loop diagram was formed as shown in Figure 2. Firstly, the overall risk is represented by a round frame, the subsystem risk is represented by a rounded rectangular frame and the other risk factors are represented by a rectangular frame. Moreover, the corresponding names are marked inside each frame. Secondly, the arrow is used to represent the logical relationship between multi-source risks. The risk factors pointed at by the arrow are independent variables and the risk factors at the other end of the arrow are dependent variables. ‘+’ on the arrow indicates a positive correlation between risk factors, while ‘-’ indicates a negative correlation between risk factors. The shadow variable represented by ‘< >’ is used to clarify the causal logic in the model diagram.
The model takes the engineering environmental risk in cold regions as the overall system and takes regional geomorphology, climate change, ecological environment, permafrost environment and water environment as the five cores necessary to construct five risk factors subsystems [51], as shown in Figure 2.

3.3. Risk Factor Identification

After the establishment of the risk factor identification model, any risk source can be selected to conduct a “causes tree” or “uses tree” risk identification analysis, which can trace the root of the selected risk source and other risk sources and consequences affected by the selected risk factor. All analyses were realized in R 4.0.3 [95].

3.3.1. Risk Cause Identification

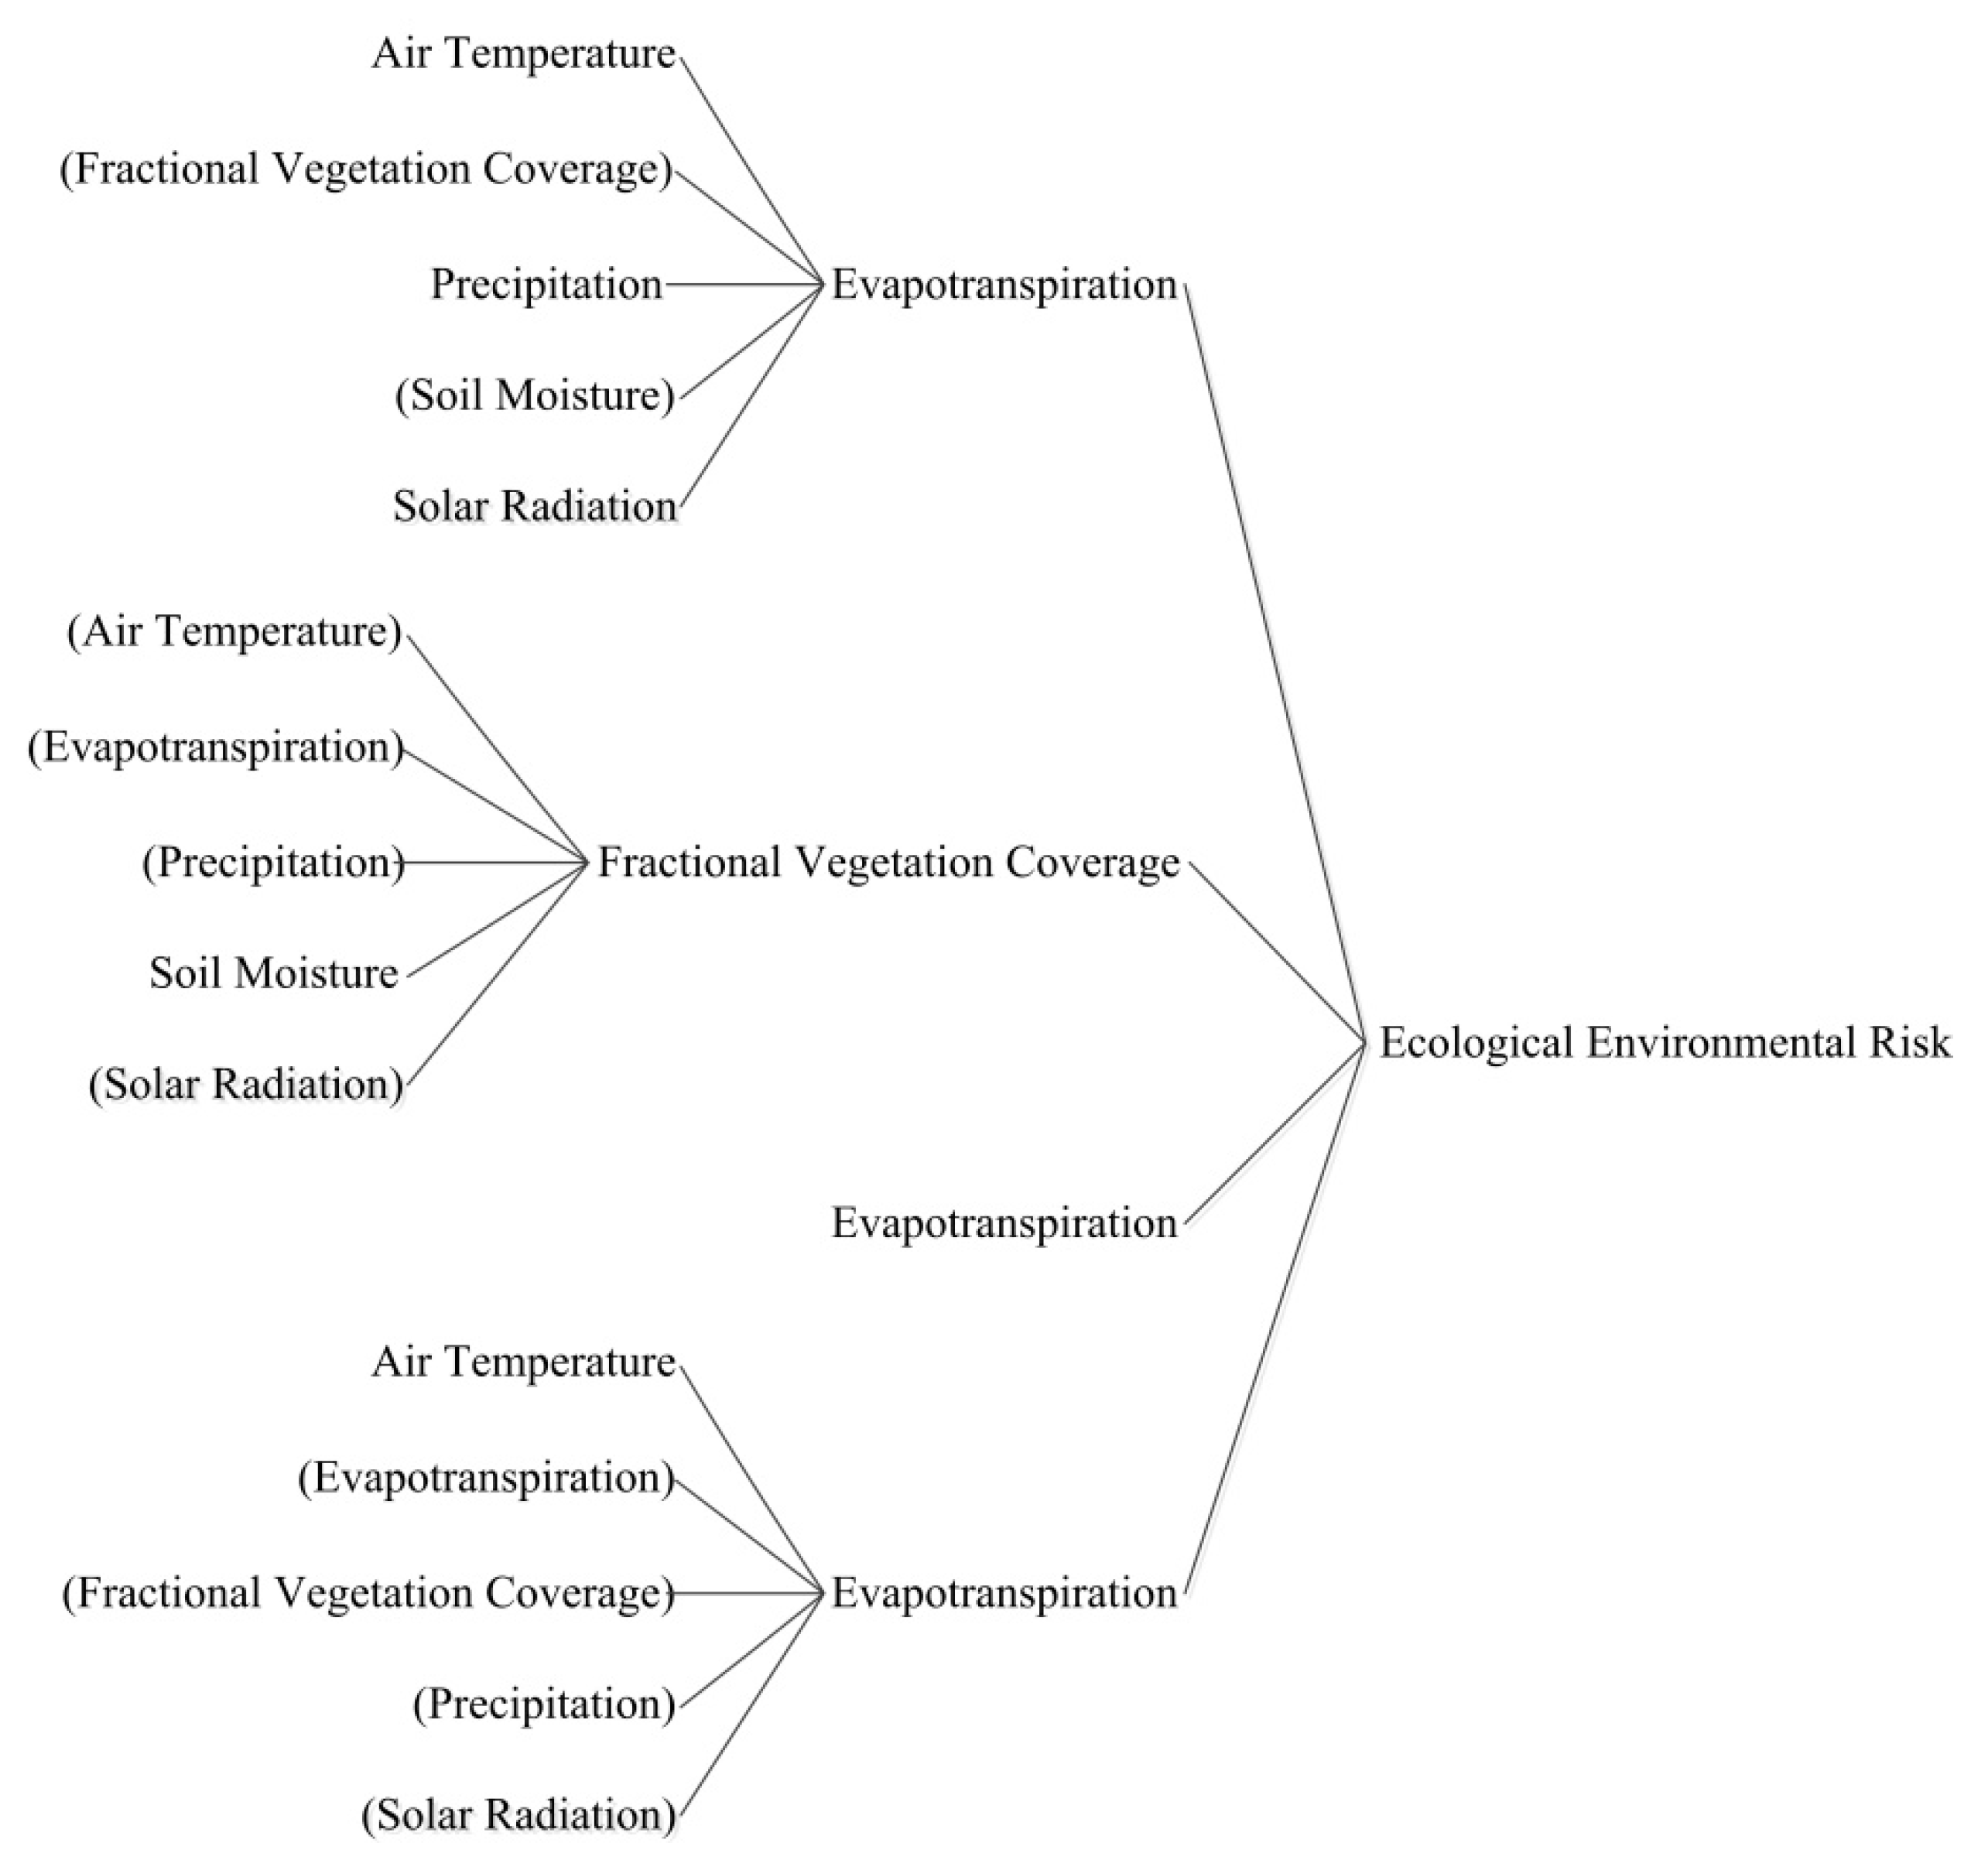
Taking “ecological environment risk” as an example, the causes of ecological environment risk were identified based on the risk identification model. The causes’ tree of the “ecological environment risk” could be obtained by cause identification, as shown in Figure 3. According to the causes’ tree, the root factors that cause the risk could be traced all the way and then they could be monitored and analyzed effectively.

3.3.2. Risk Consequence Identification

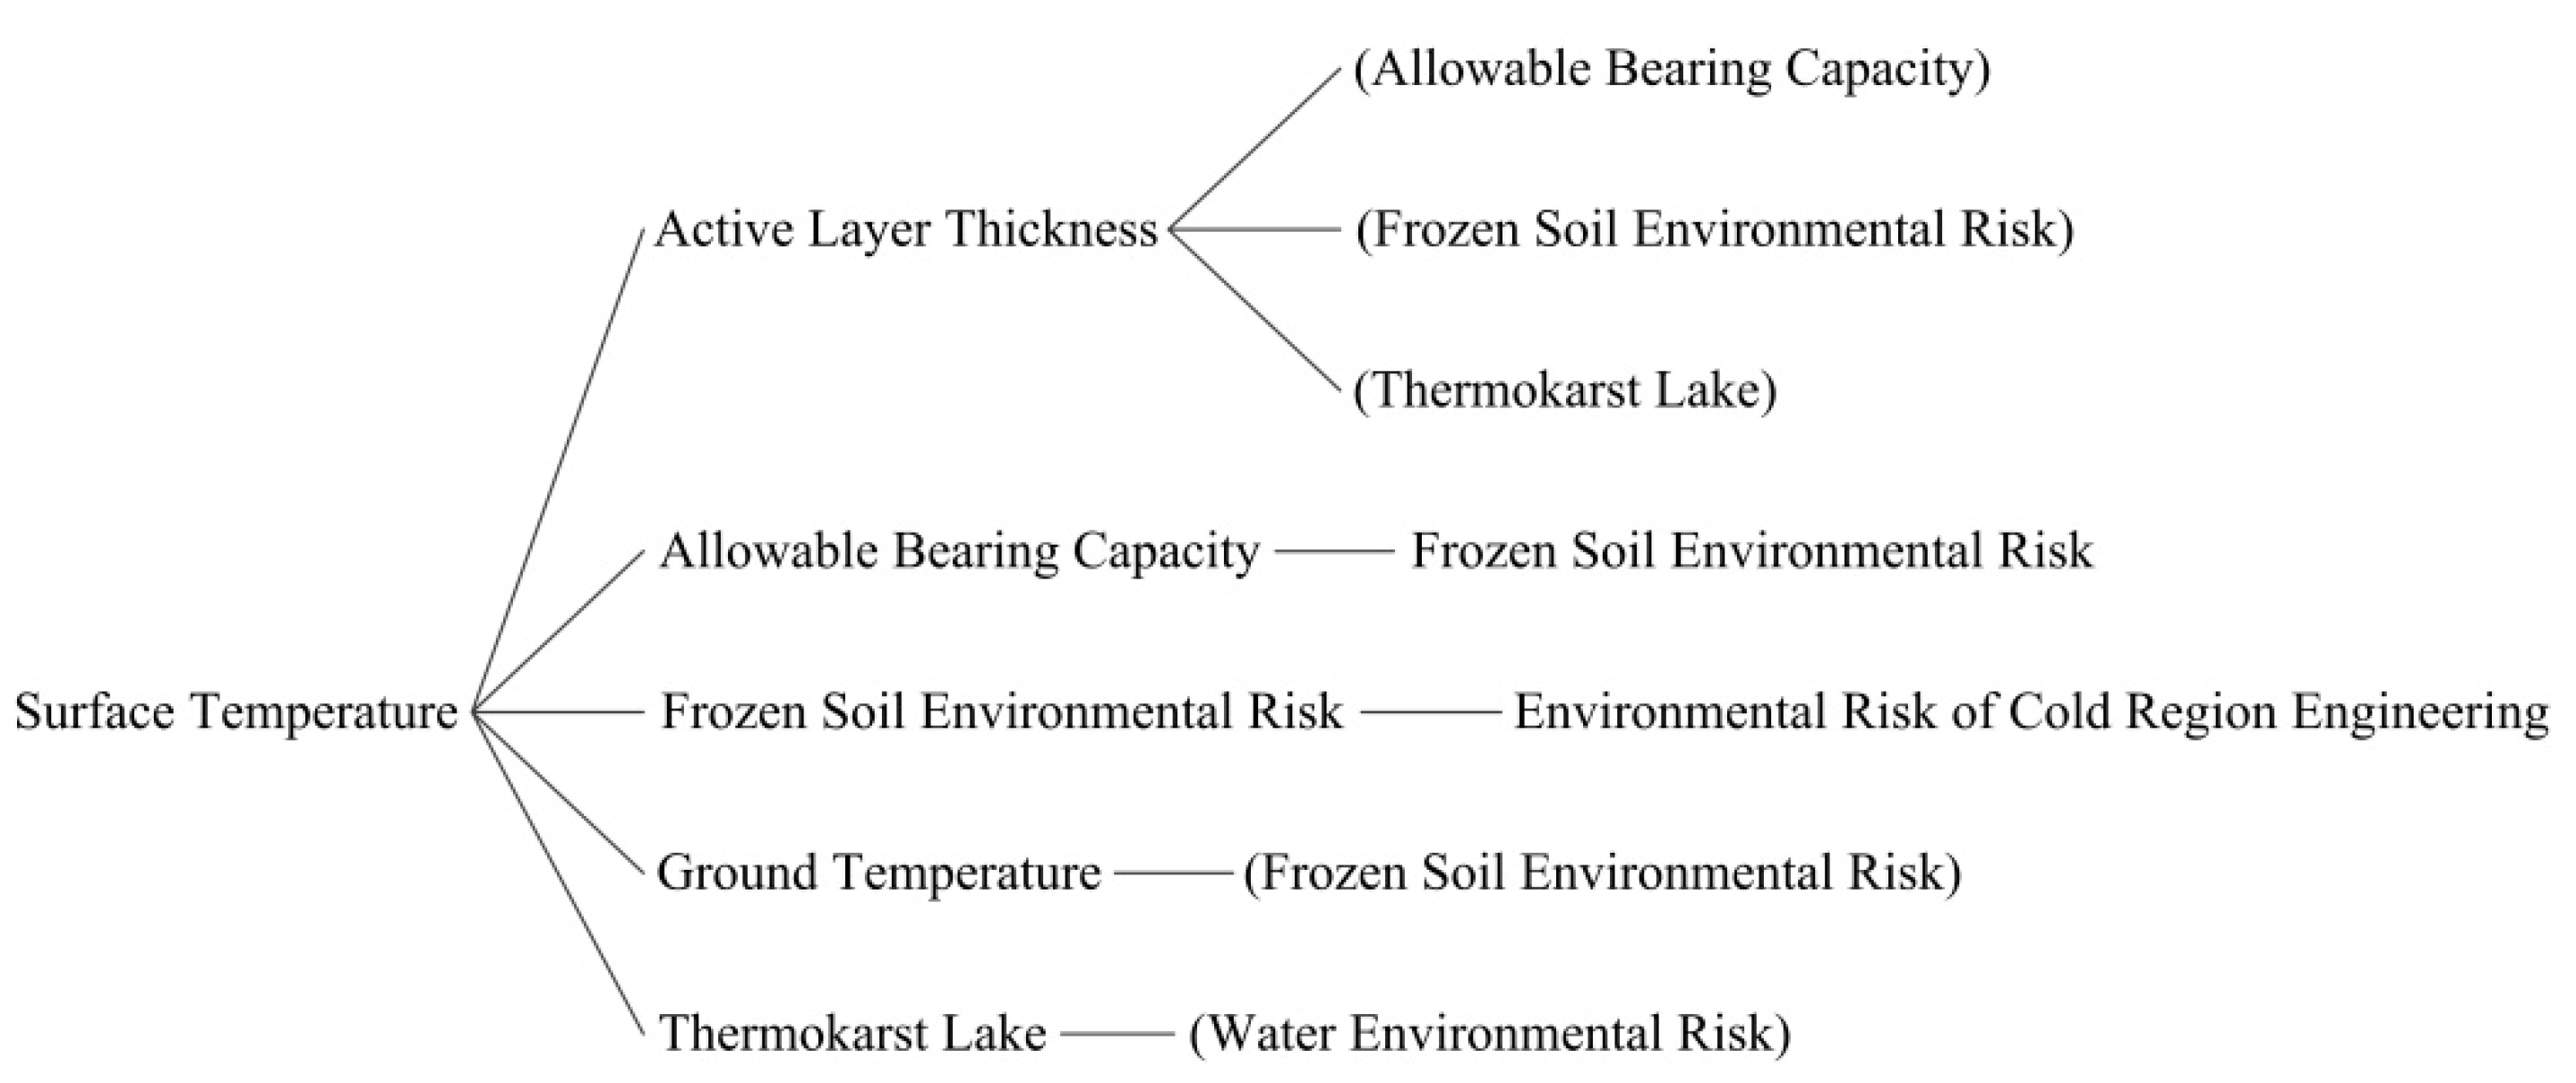
Taking “surface temperature” as an example, the possible consequences caused by the surface temperature were identified based on the risk identification model. The uses’ tree of “surface temperature” could be obtained, as shown in Figure 4.
It can be seen from Figure 4 that surface temperature, a risk factor, could directly affect the four risk factors of the active layer thickness, the allowable bearing capacity, the ground temperature and the thaw lake, as well as the overall risk of permafrost environment. The active layer thickness would also affect the allowable bearing capacity, the thaw lake and the overall risk of permafrost environment. It follows that the more outcomes a single risk factor leads to, the greater the impact or damage that occurs and vice versa.
The method of system dynamics mainly regards the whole engineering environmental risk as a large system and identifies and analyzes the causal relationships among the risk factors affecting the system from the perspective of the system. Combined with the causes’ tree and uses’ tree obtained from the two examples above, it can be seen that the two risk factors above are not separate risk factors, in that not only they affect other risk sources, but they are also affected by other risk sources.

3.3.3. Risk Transmission Path Analysis

According to the functions causes’ tree and uses’ tree of the model, it could be analyzed that the transmission path of permafrost engineering environmental risk could be divided into five categories, including (i) climate change risk → ecological environmental risk → engineering environmental risk; (ii) climate change risk → permafrost environmental risk → engineering environmental risk; (iii) climate change risk → water environmental risk → engineering environment risk; (iv) climate change risk → ecological environmental risk → permafrost environmental risk → engineering environmental risk; (v) climate change risk → ecological environmental risk → water environmental risk → engineering environmental risk. It could be found that mean annual air temperature, mean annual precipitation and surface solar radiation in climate change risk were the root factors leading to the dynamic change of environmental risk of permafrost engineering.

4. Driving Factor Analysis of Risk Sources

4.1. Relationship between Static Risk Factors and Other Risk Factors

According to the risk identification model, the static risk factors in the study area were divided into five categories, elevation, slope, aspect, RDLS and VIC. The topography of the study area was divided into high altitude (3500~5000 m) and extremely high altitude (>5000 m) [96]. In order to analyze the relationship between elevation and risk factors more accurately, in this paper, we classified the elevation of the study area, as shown in Table 2 [97].
The slope range of the study area is 0~46.23°. Based on the susceptibility of thaw slumping disasters in the study area, the slope was divided into five grades, as shown in Table 3 [98].
The aspect of the study area was divided into eight grades, according to Table 4 [97].
According to the digital topography mapping specification, the relief degree of land surface (RDLS) was divided into seven levels, as shown in Table 5 [99]. The elevation difference of the study area is 0~780 m, mainly plains and hills.
According to the volume of ice content, the study area was divided into seven categories, as shown in Table 6 [100].

4.1.1. Relationship between Elevation and Other Risk Factors

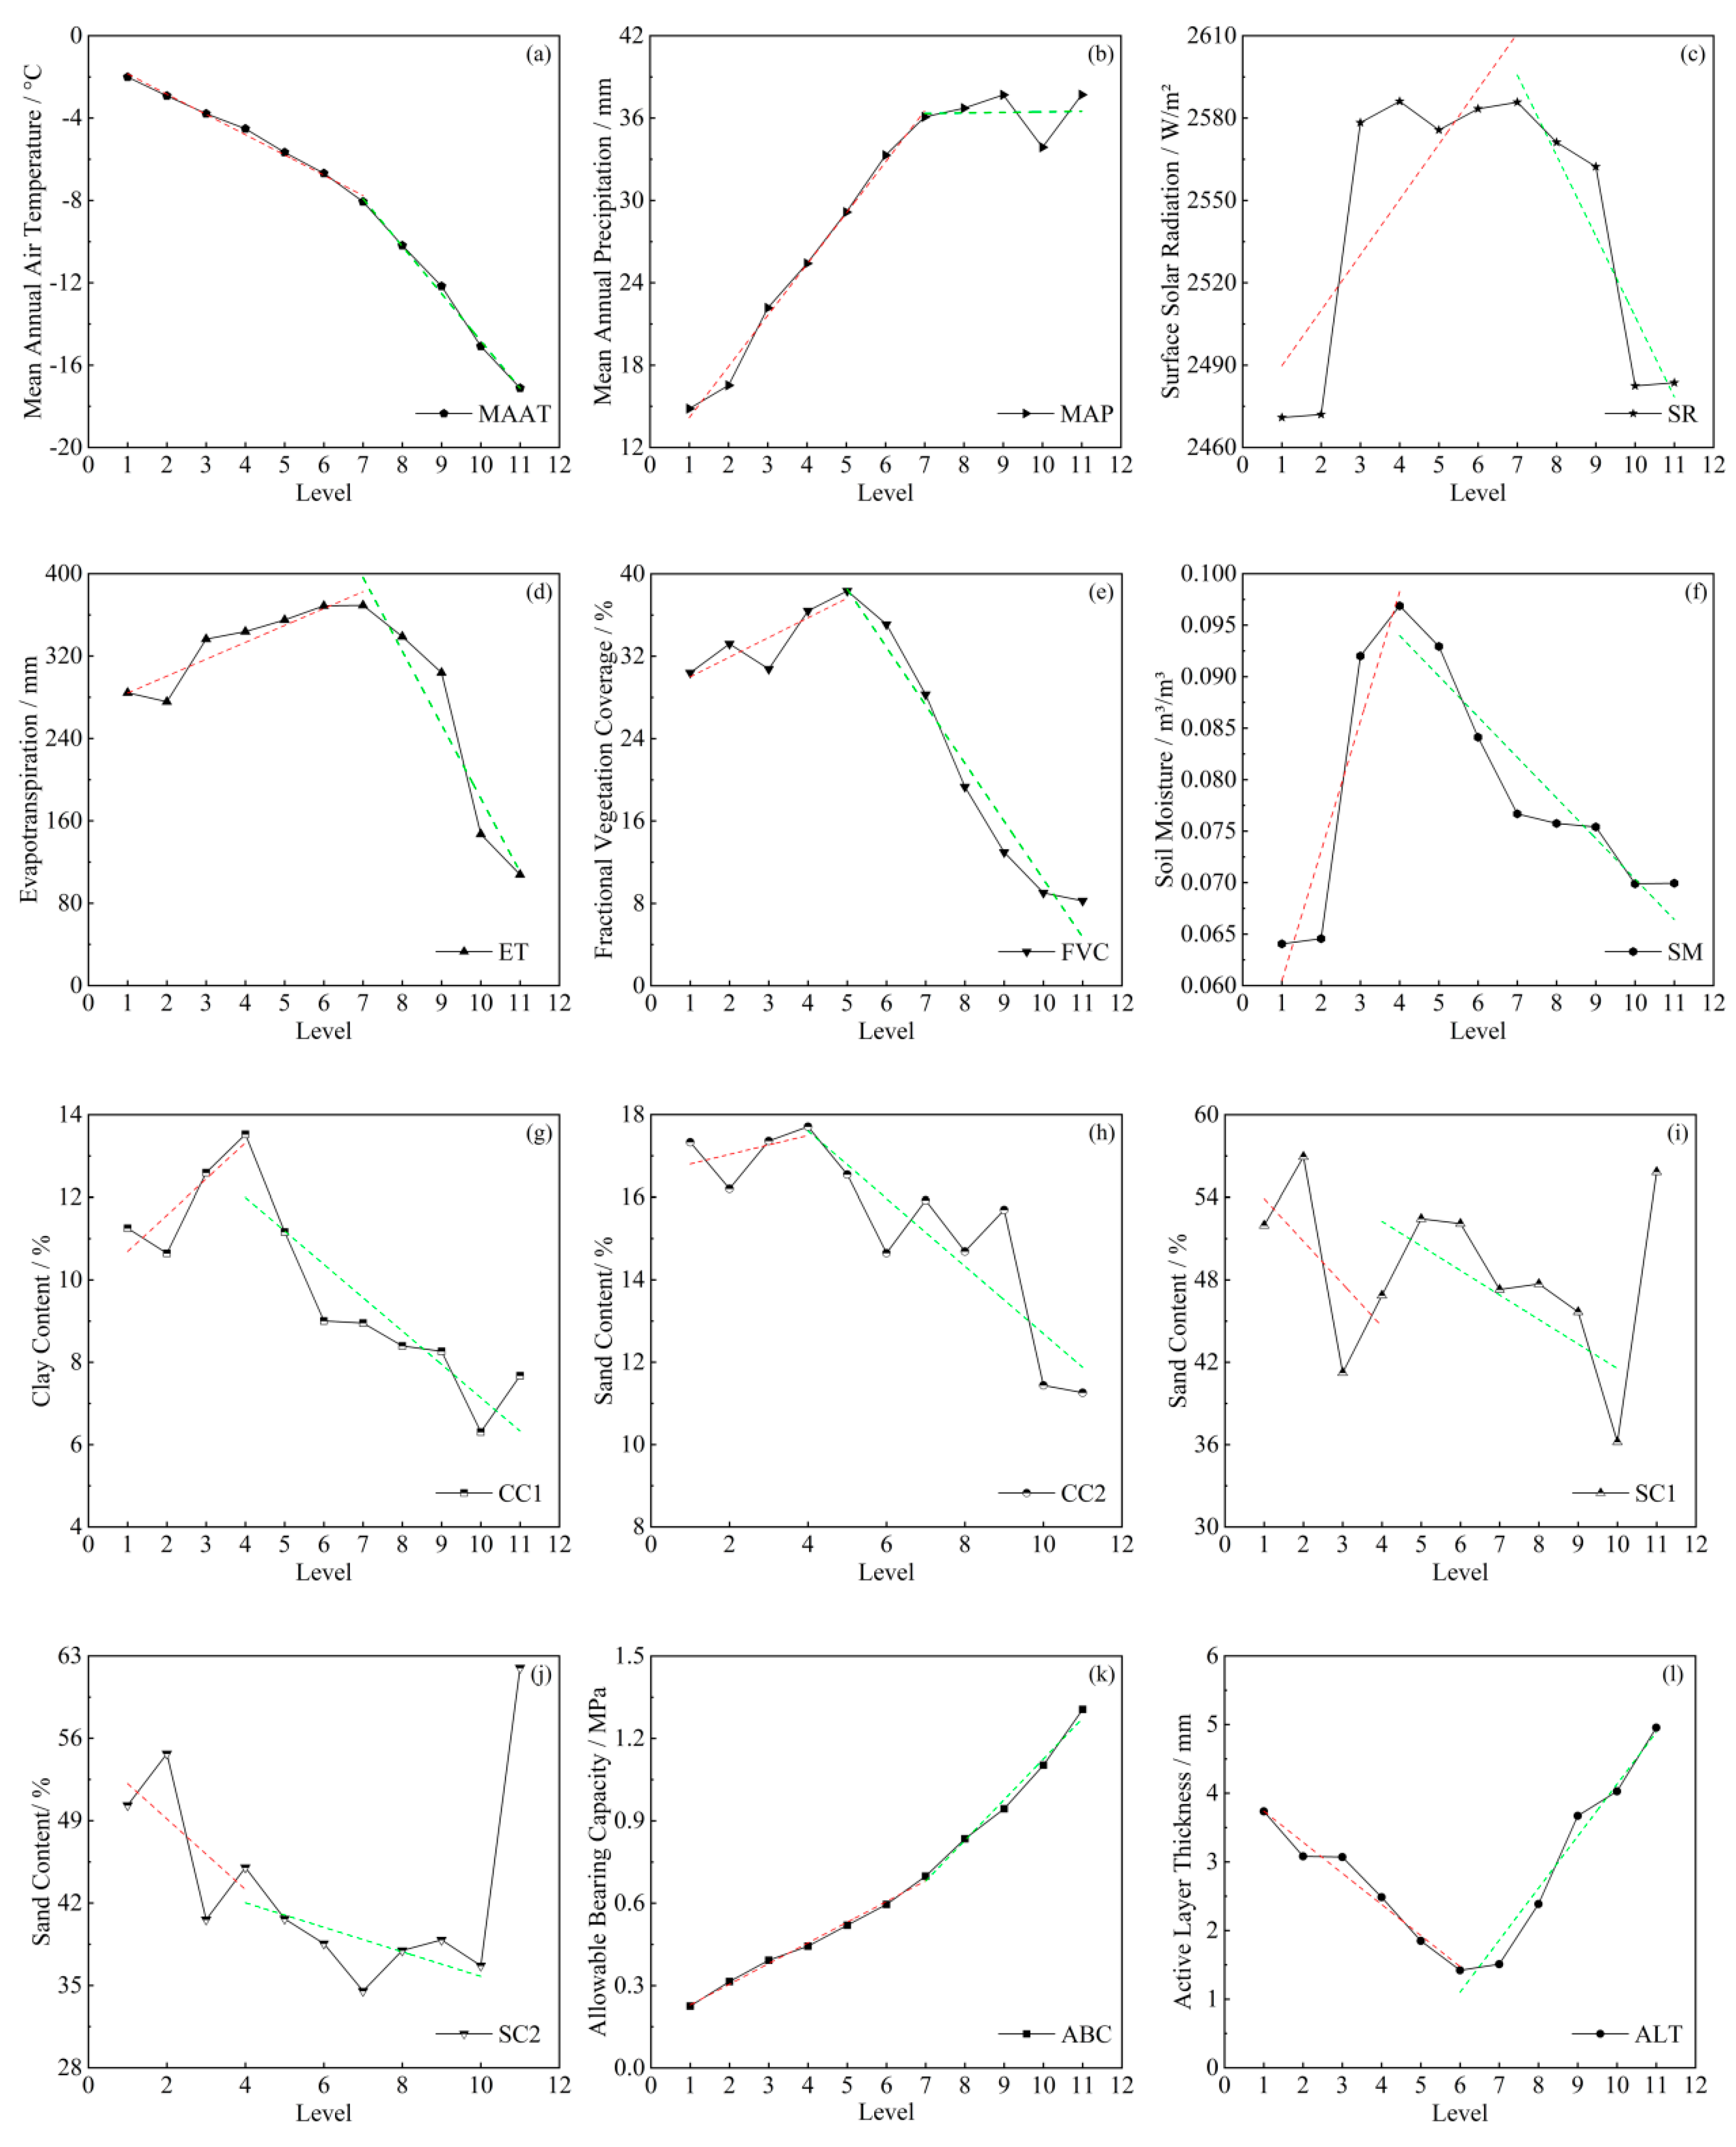
According to the elevation classification of Table 3, the distribution characteristics of the mean values of the risk factors in different elevation areas were analyzed by using the line chart, as shown in Figure 5. According to the analysis of the relationship between risk factors and elevation, reported in the Supplementary Materials (Table S2), it was found that the high-value areas and low-value areas of the risk factors mainly appeared in areas with elevations below 4200 m, near 5000 m and above 6000 m. In the area below 4200 m, the climatic factors affected the change in SM, ABC, MAGT and MAST; in the area above 6000 m, MAAT, MAP affected the change in ET, FVC, ABC, ALT, MAGT and MAST; in the area of 5200~5400 m, SR affected ET and VIC; in other regions, all risk factors affect each other.

4.1.2. Relationship between Slope and Other Risk Factors

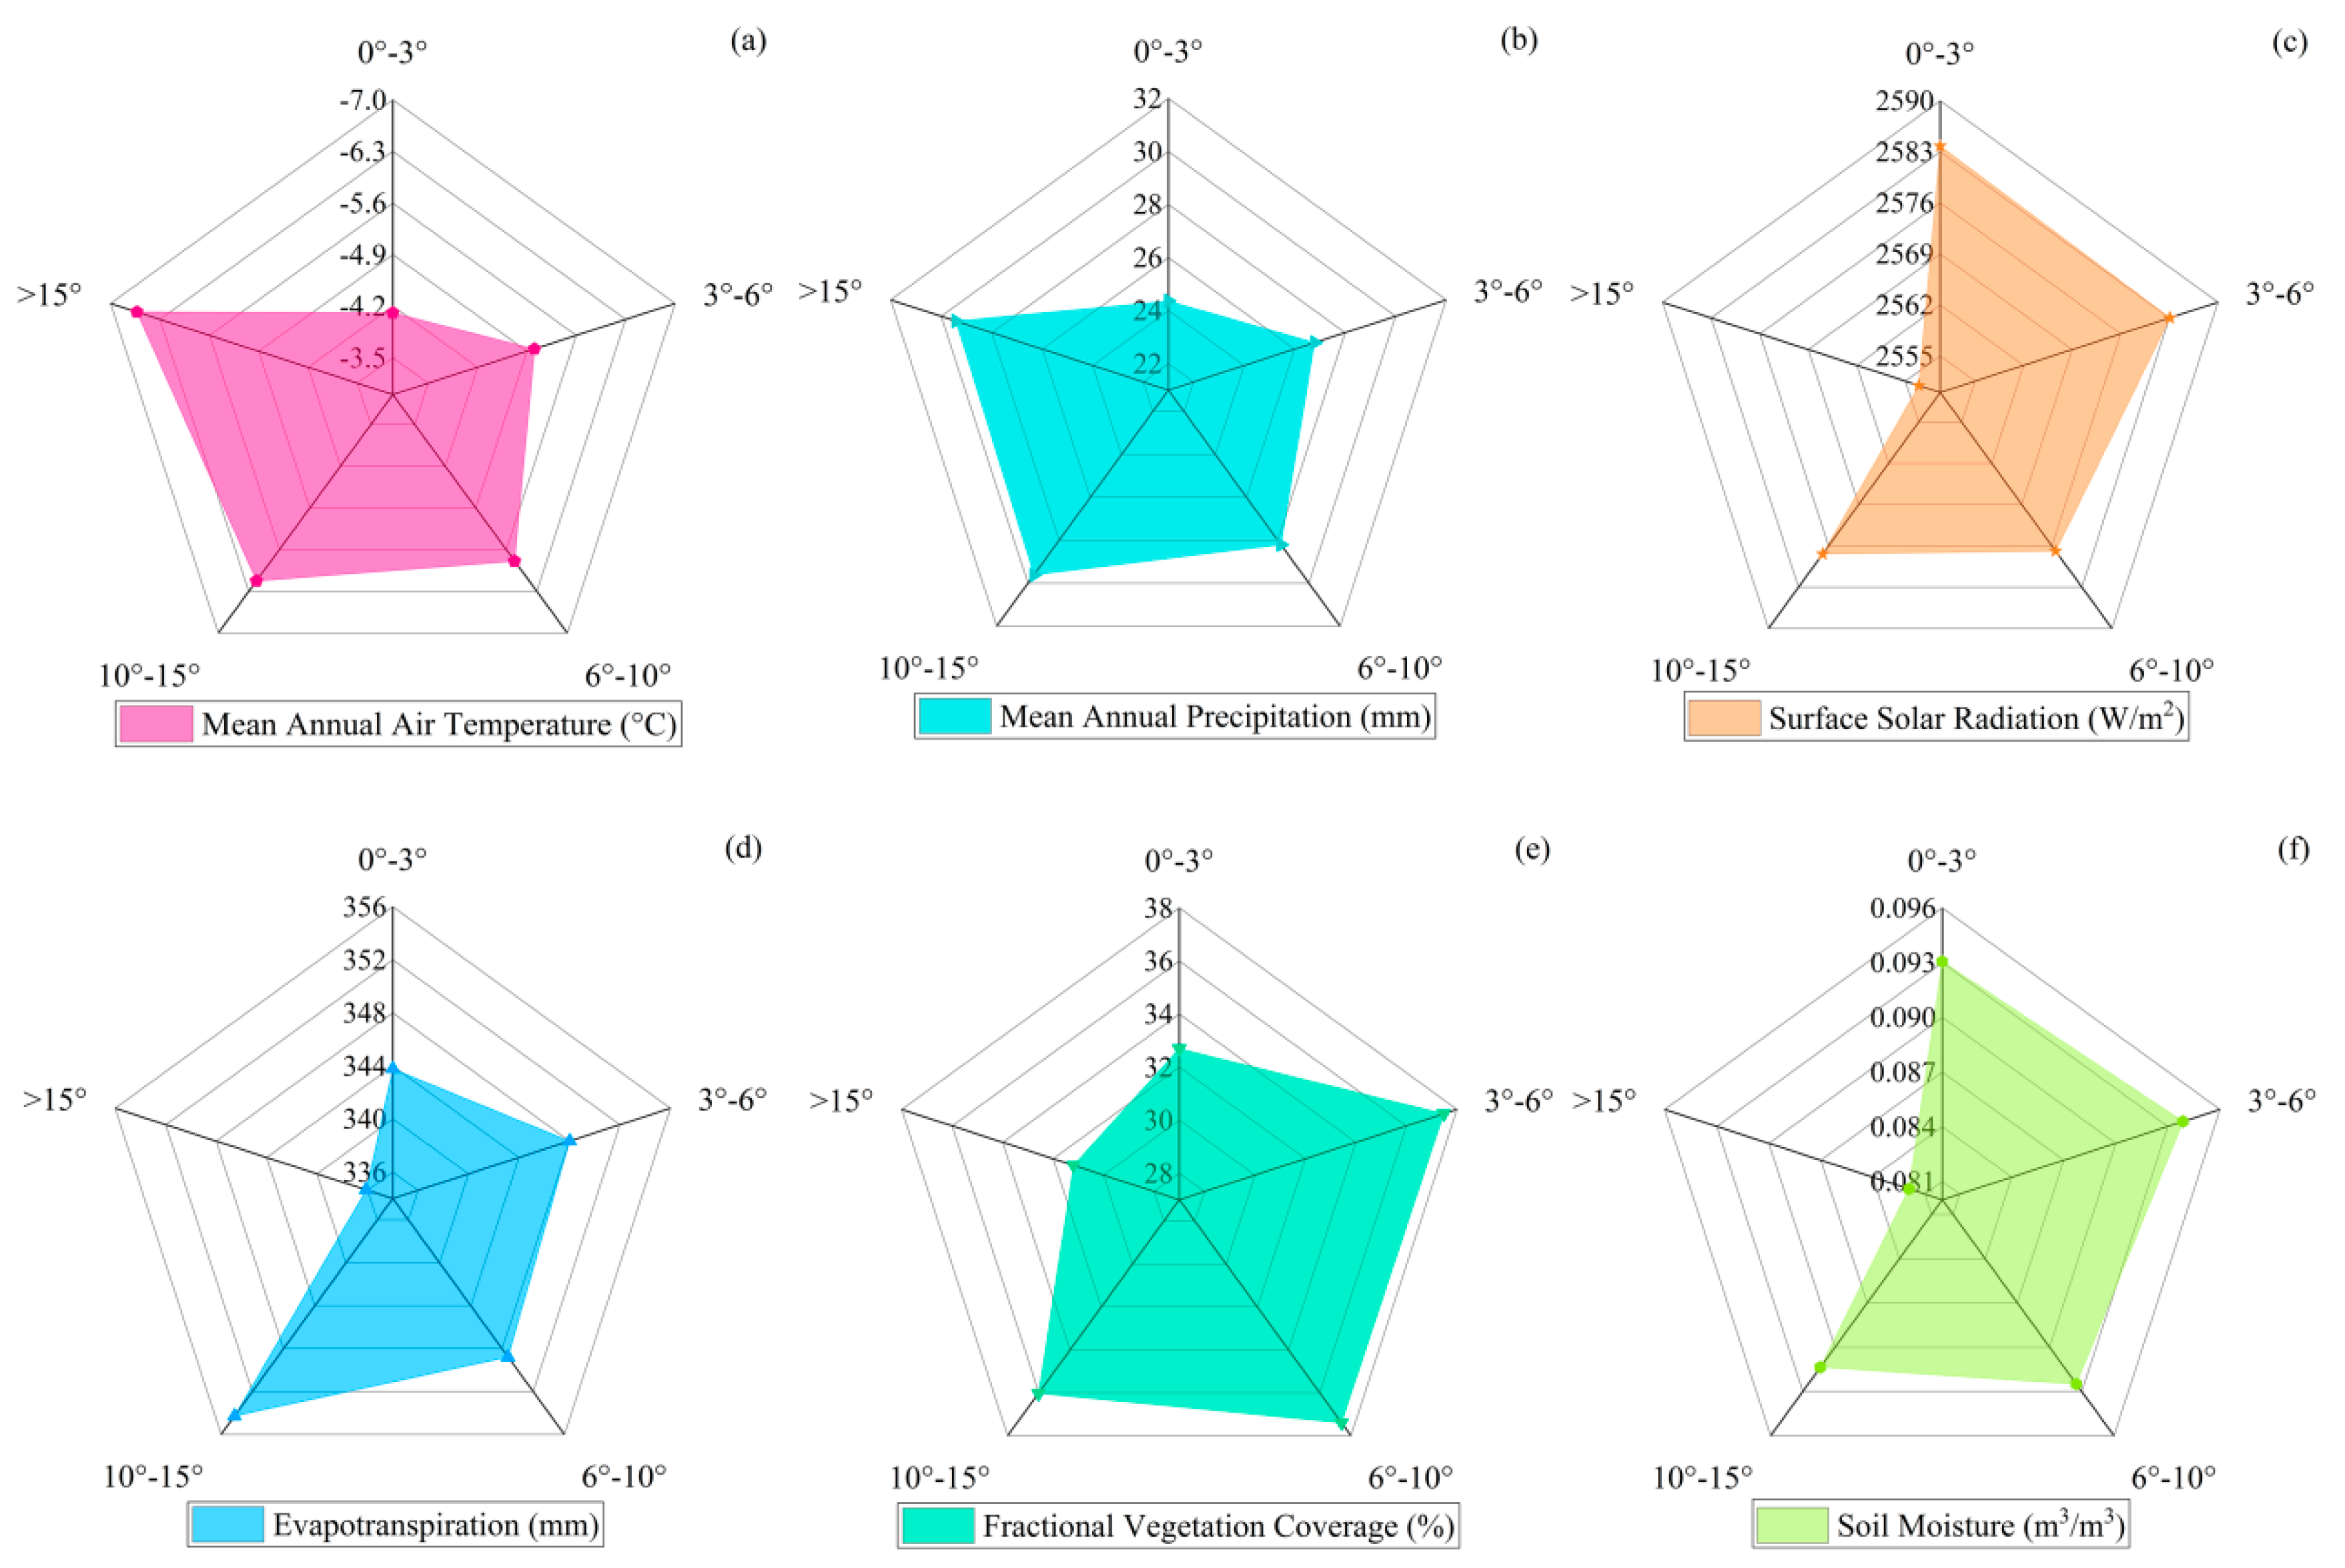
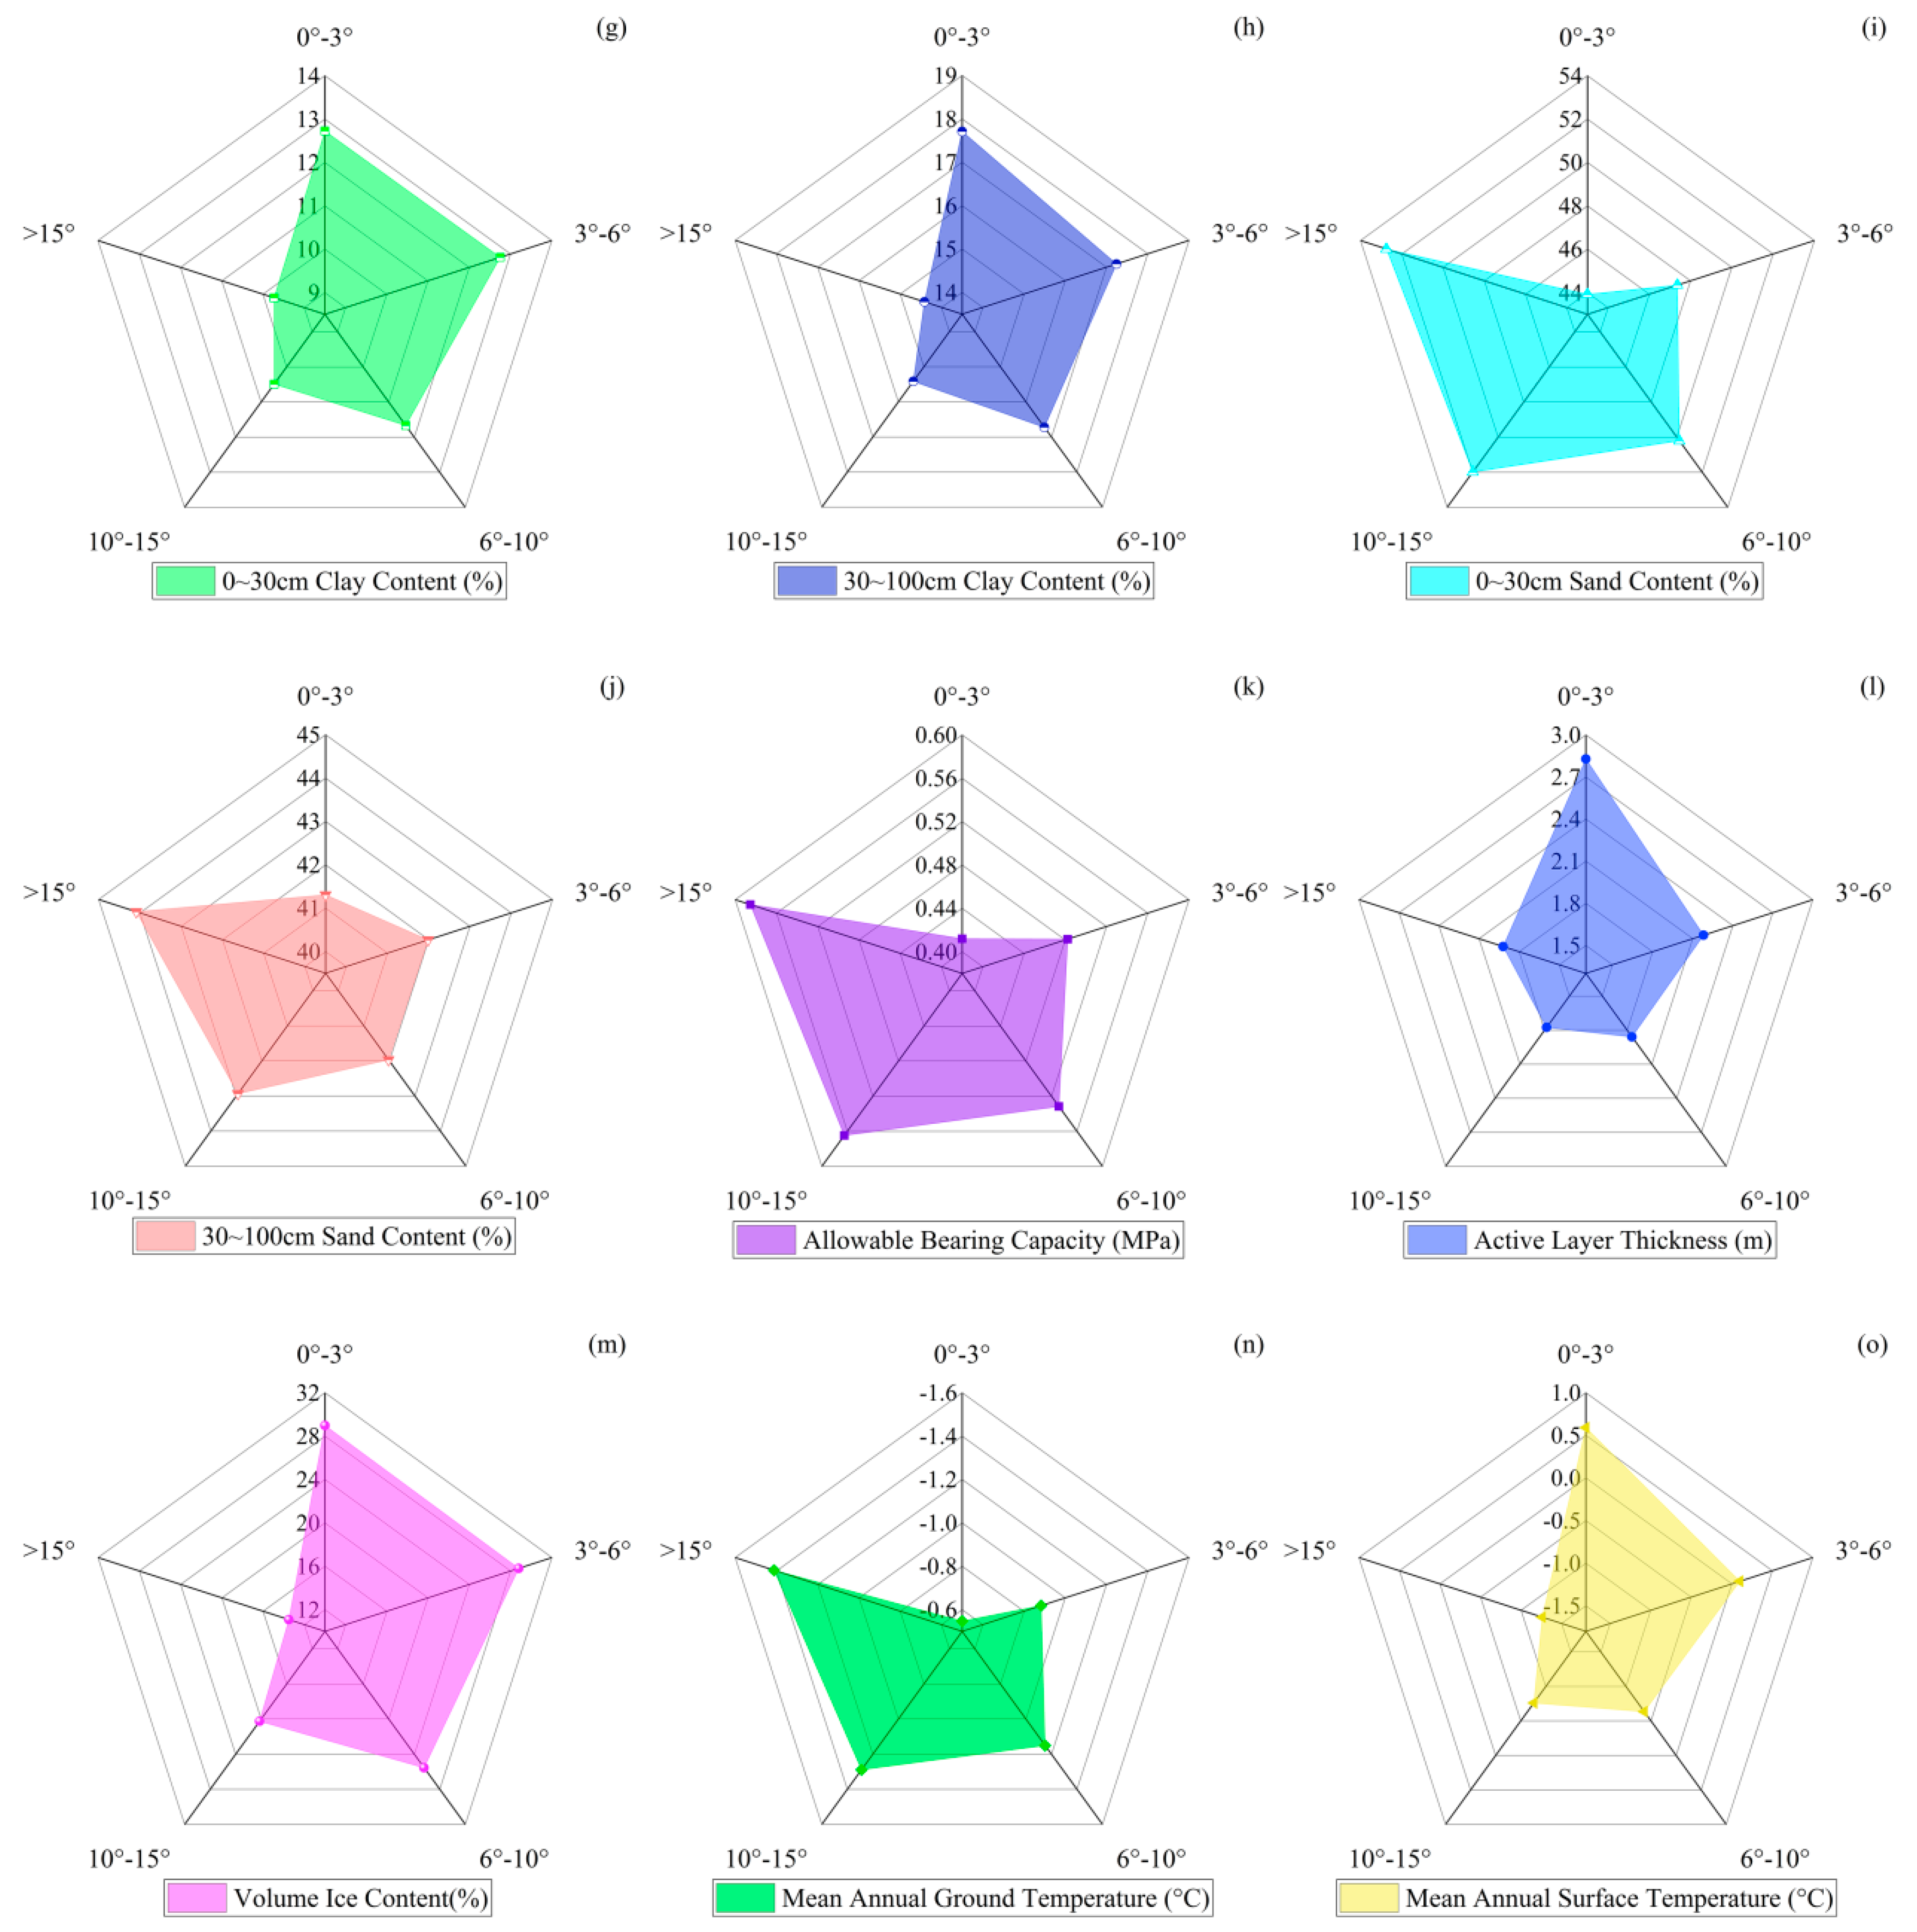
According to the slope classification shown in Table 4, the distribution characteristics of the mean values of the risk factors in different slope areas were analyzed by using the radar chart, as shown in Figure 6. According to the analysis of the relationship between the risk factors and slope, reported in the Supplementary Materials (Table S3), it was found that the high-value areas and low-value areas of the risk factors mainly appeared in the area of 0~3° and above 10°. In the area of 0~3°, the climatic factors affected the change in permafrost environmental factors directly; in the area of 3~6°, MAAT and SR affected the change in FVC and SM indirectly; in the area of 10~15°, MAP affected ET and ALT; in the area above 15°, MAAT and SR affected ET, FVC, SM, ABC, VIC, MAGT and MAST directly.

4.1.3. Relationship between Aspect and Other Risk Factors

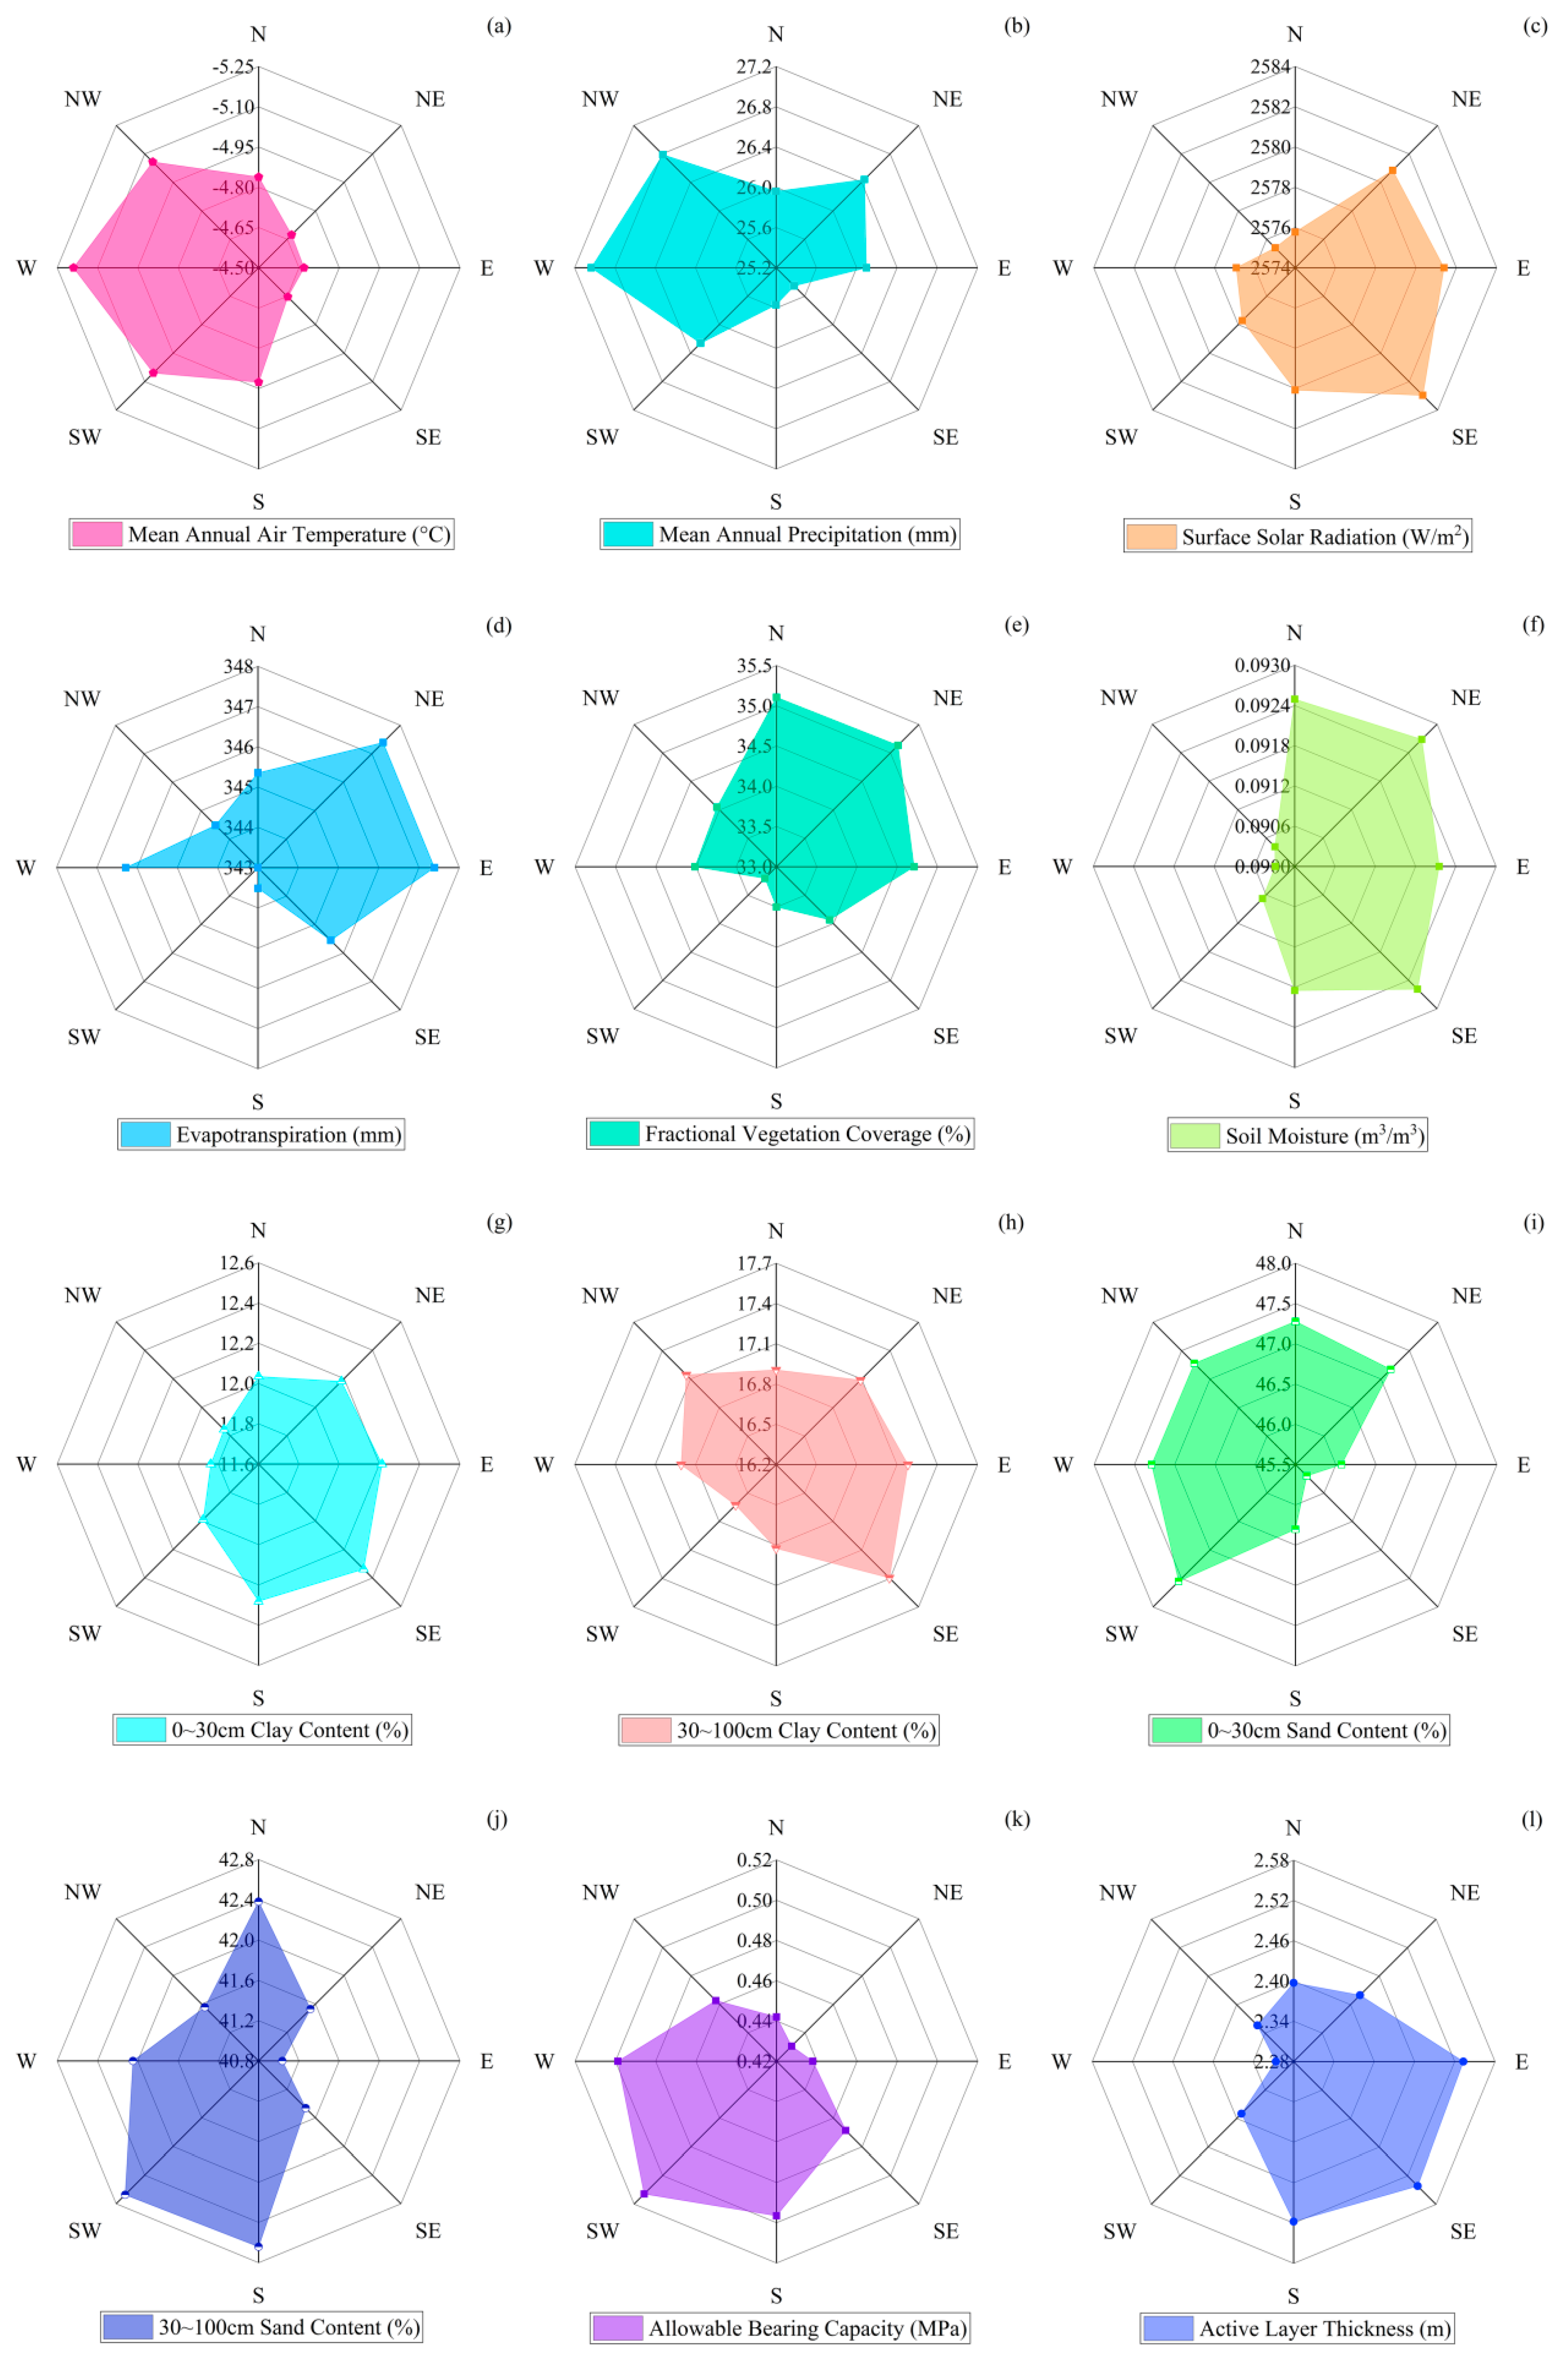
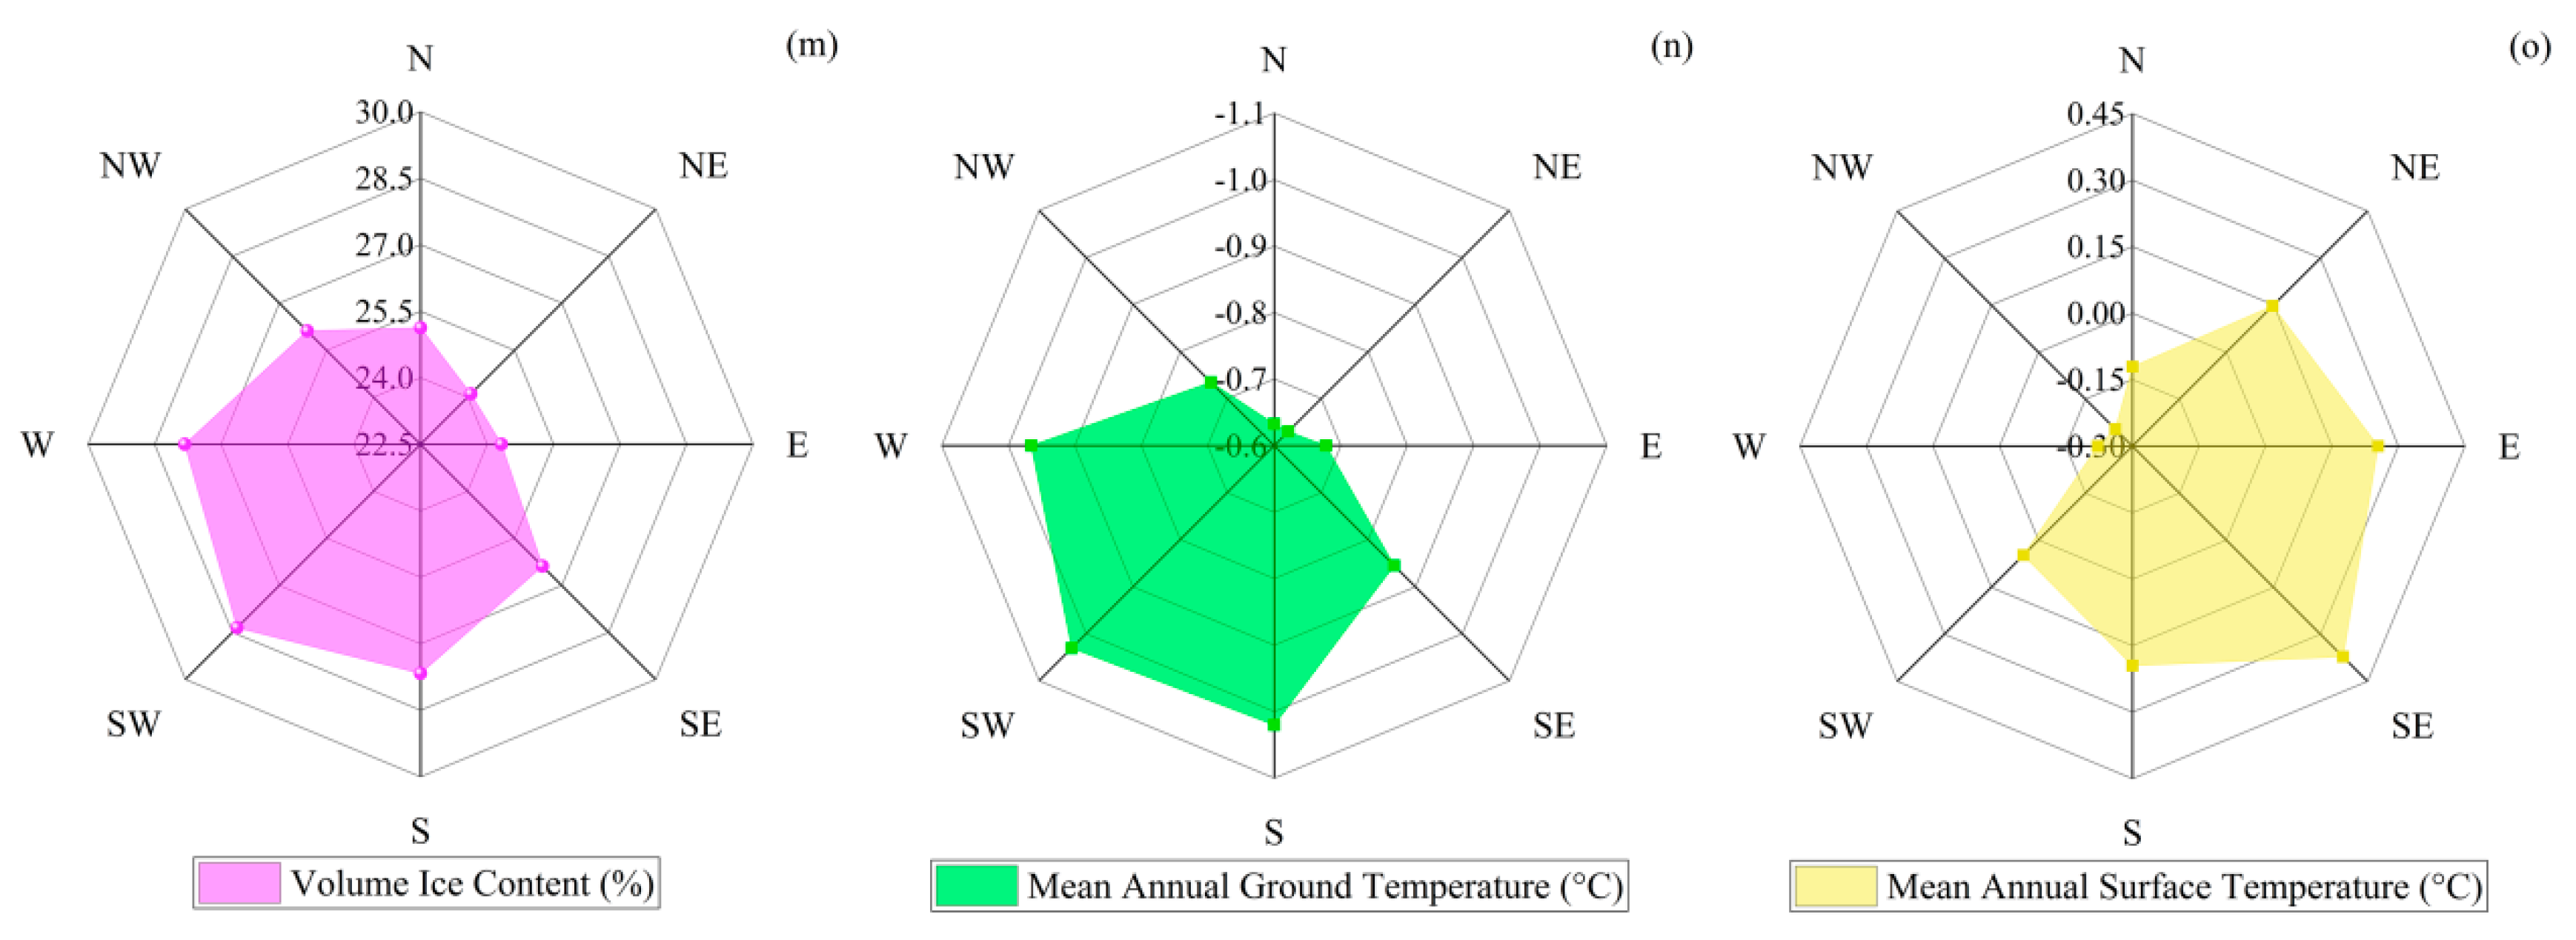
According to the aspect classification shown in Table 5, the distribution characteristics of the mean values of the risk factors in different aspect areas were analyzed by using the radar chart, as shown in Figure 7. According to the analysis of the relationship between the risk factors and aspect, reported in the Supplementary Materials (Table S4), it was found that the high-value areas and low-value areas of the risk factors mainly appeared in the northeastern, southeastern, southwestern and western regions. ET, FVC, SM, ABC, VIC and MAGT affected each other in the northeastern region; the climatic factors affected ALT and MAST directly in the southeastern region; ET, FVC, ABC, VIC and MAGT affected each other in the southwestern region; MAAT and MAP affected ALT directly in the western region; SR affected MAST directly in the northwestern region.

4.1.4. Relationship between RDLS and Other Risk Factors

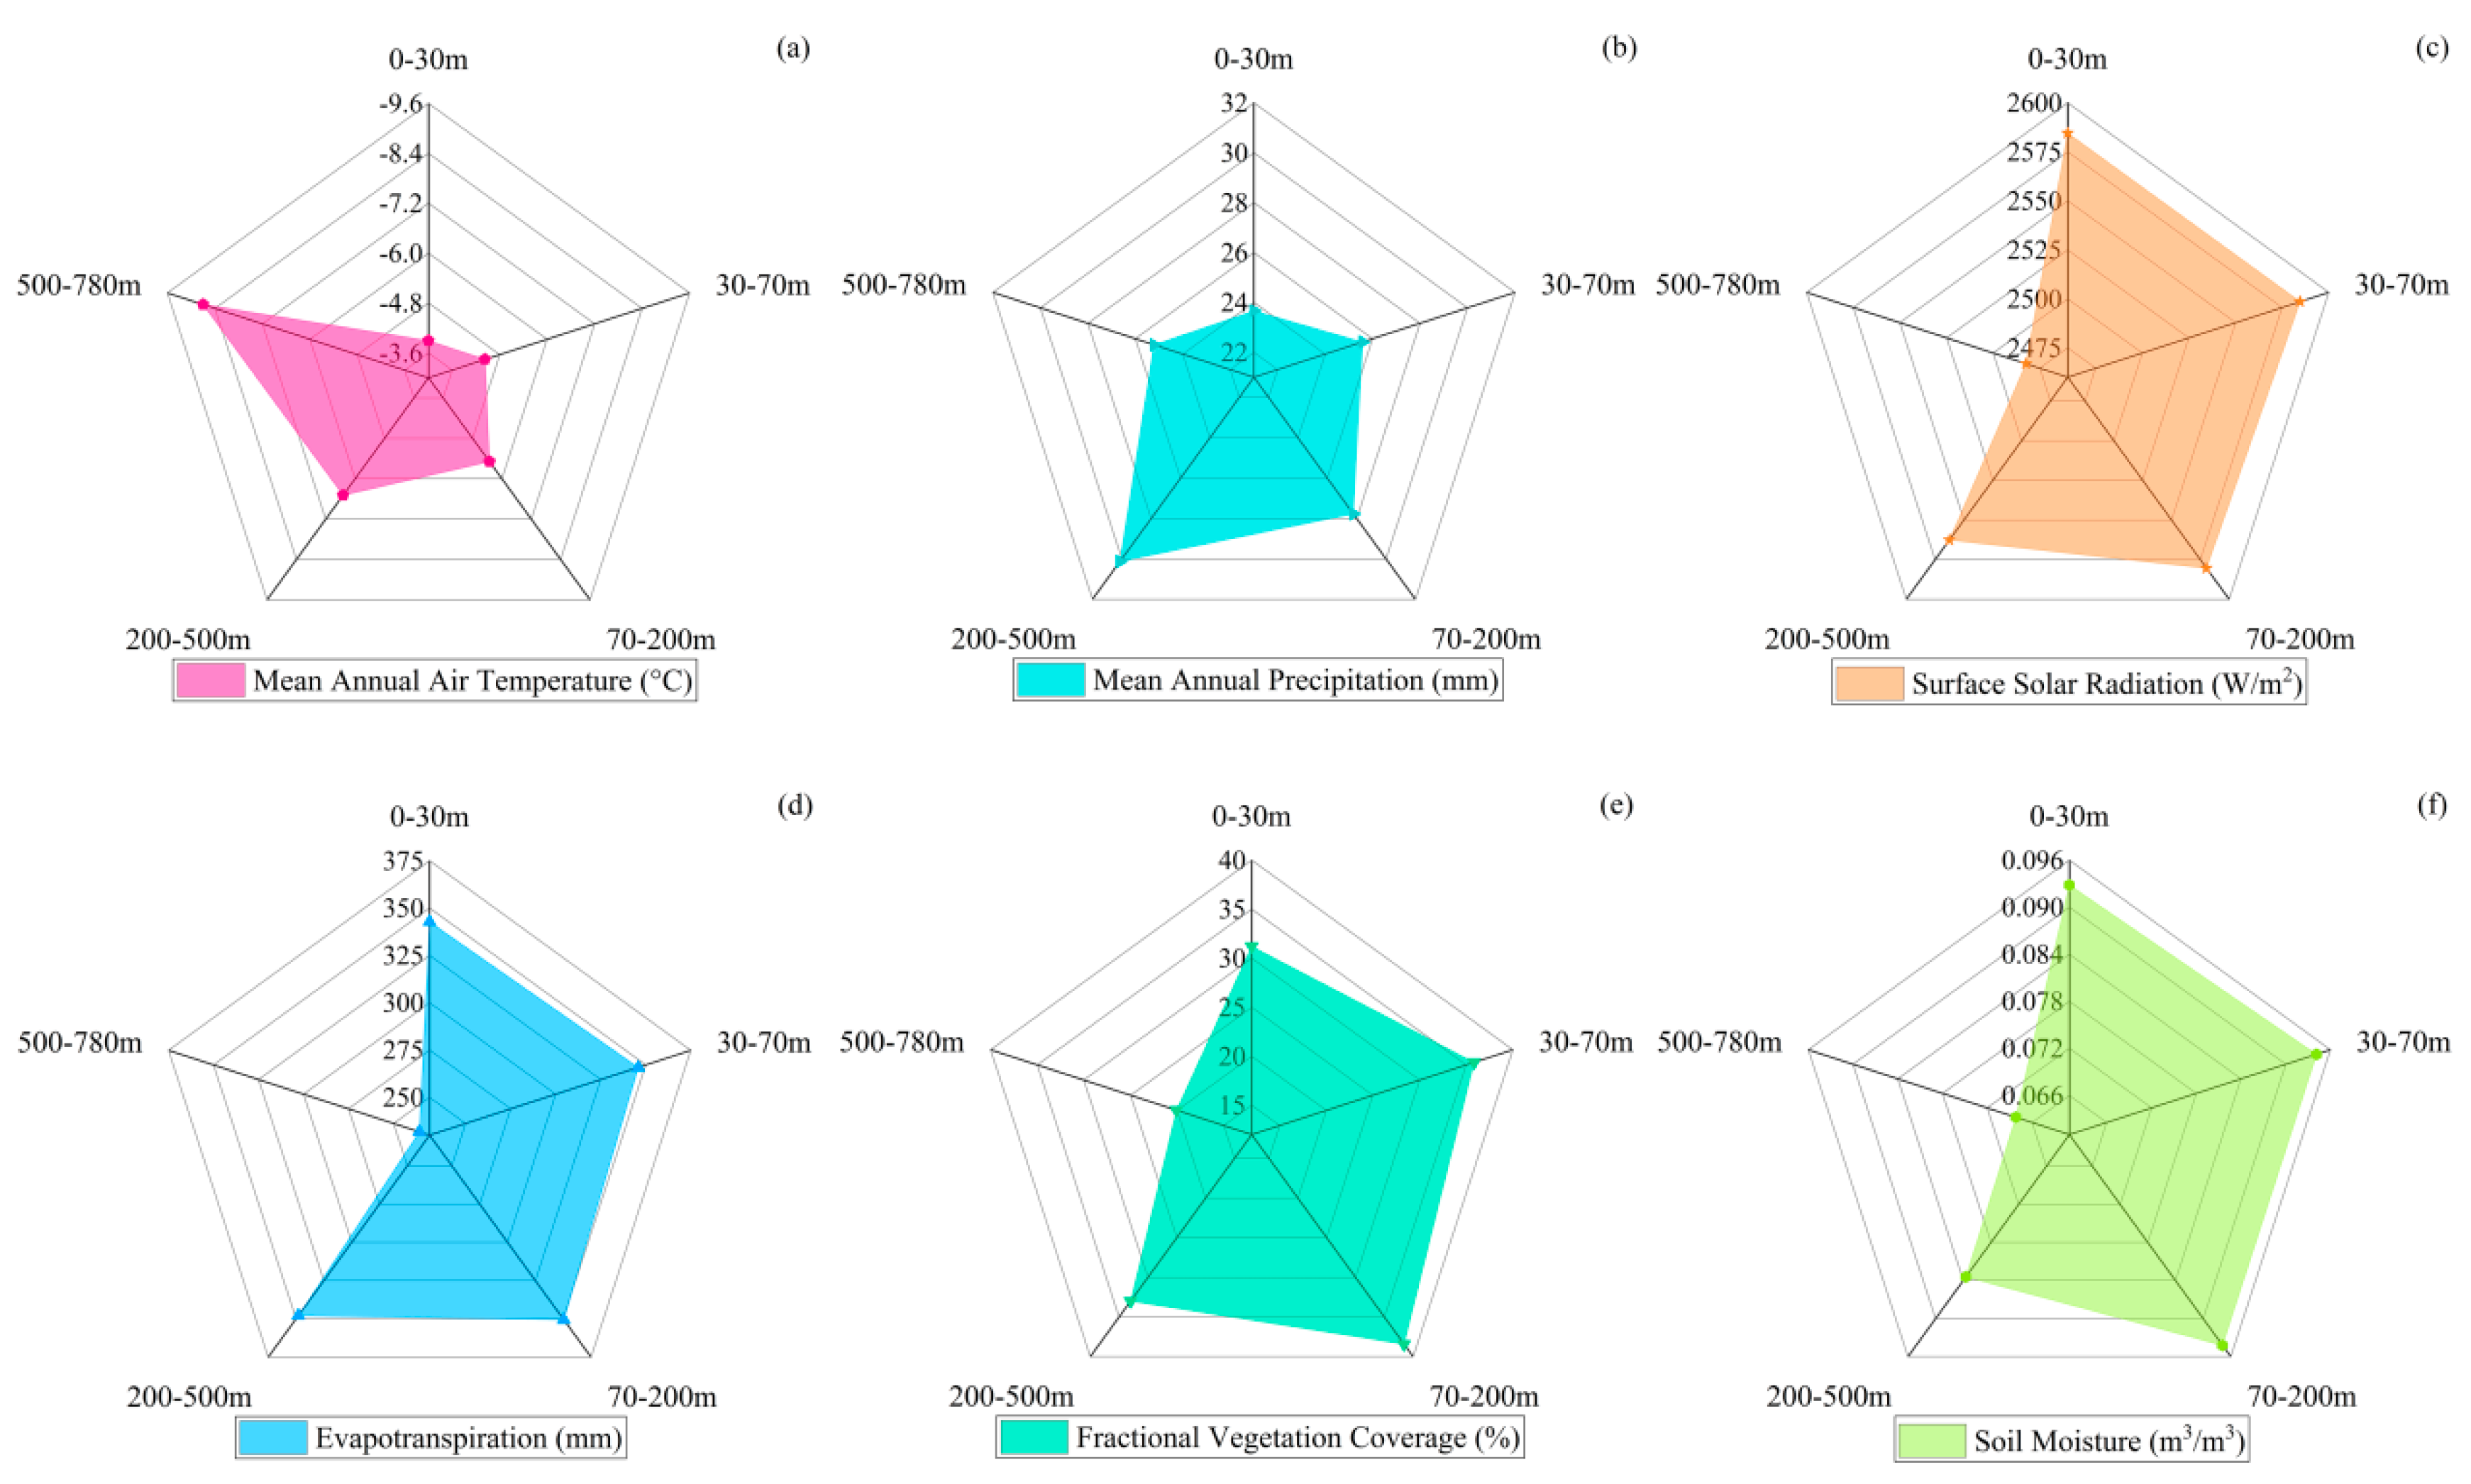
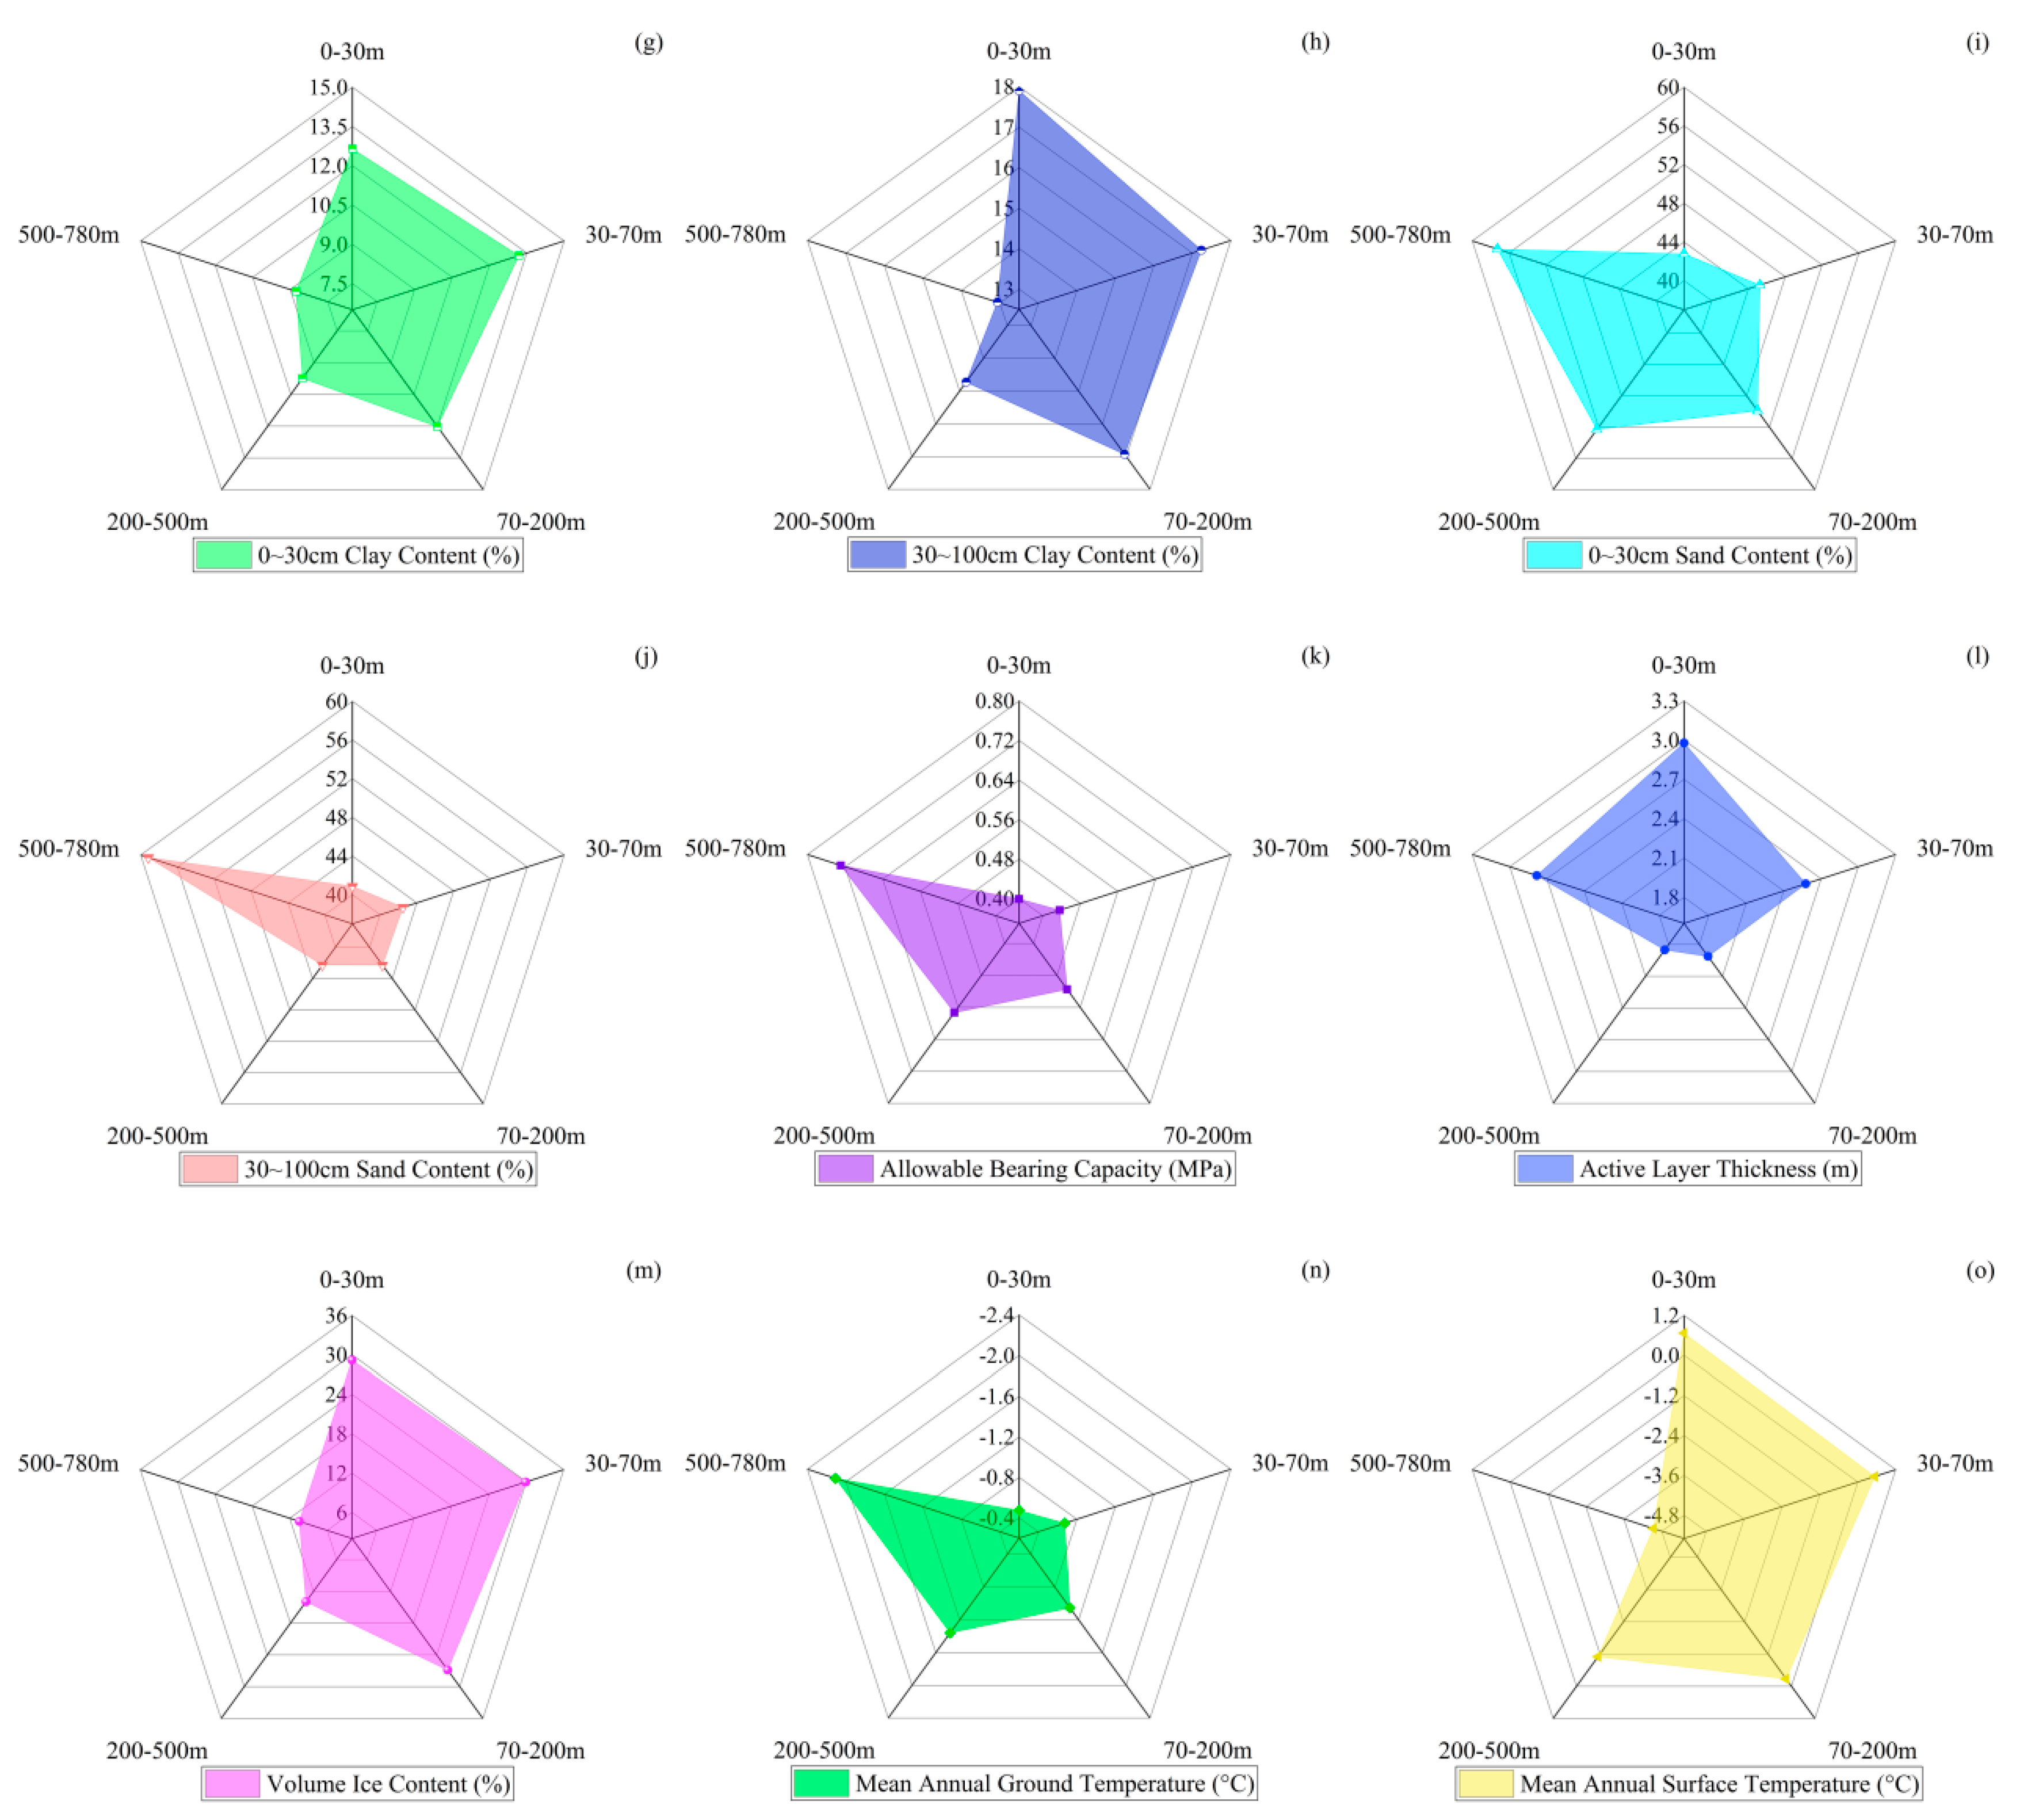
According to the aspect classification shown in Table 6, the distribution characteristics of the mean values of the risk factors in different RDLS areas were analyzed by using the radar chart, as shown in Figure 8. According to the analysis of the relationship between risk factors and aspect, reported in the Supplementary Materials (Table S5), it was found that the high-value areas and low-value areas of the risk factors mainly appeared in the plain and moderate-relief mountain regions. MAAT and AP affected FVC, ABC, ALT, MAGT and MAST in the plain region; SR affected VIC directly in the platform region; AP affected ALT directly in the low-relief mountain region; MAAT and SR affected ET, FVC, SM, ABC, VIC, MAGT and MAST directly in the moderate-relief mountain region.

4.1.5. Relationship between VIC and Other Risk Factors

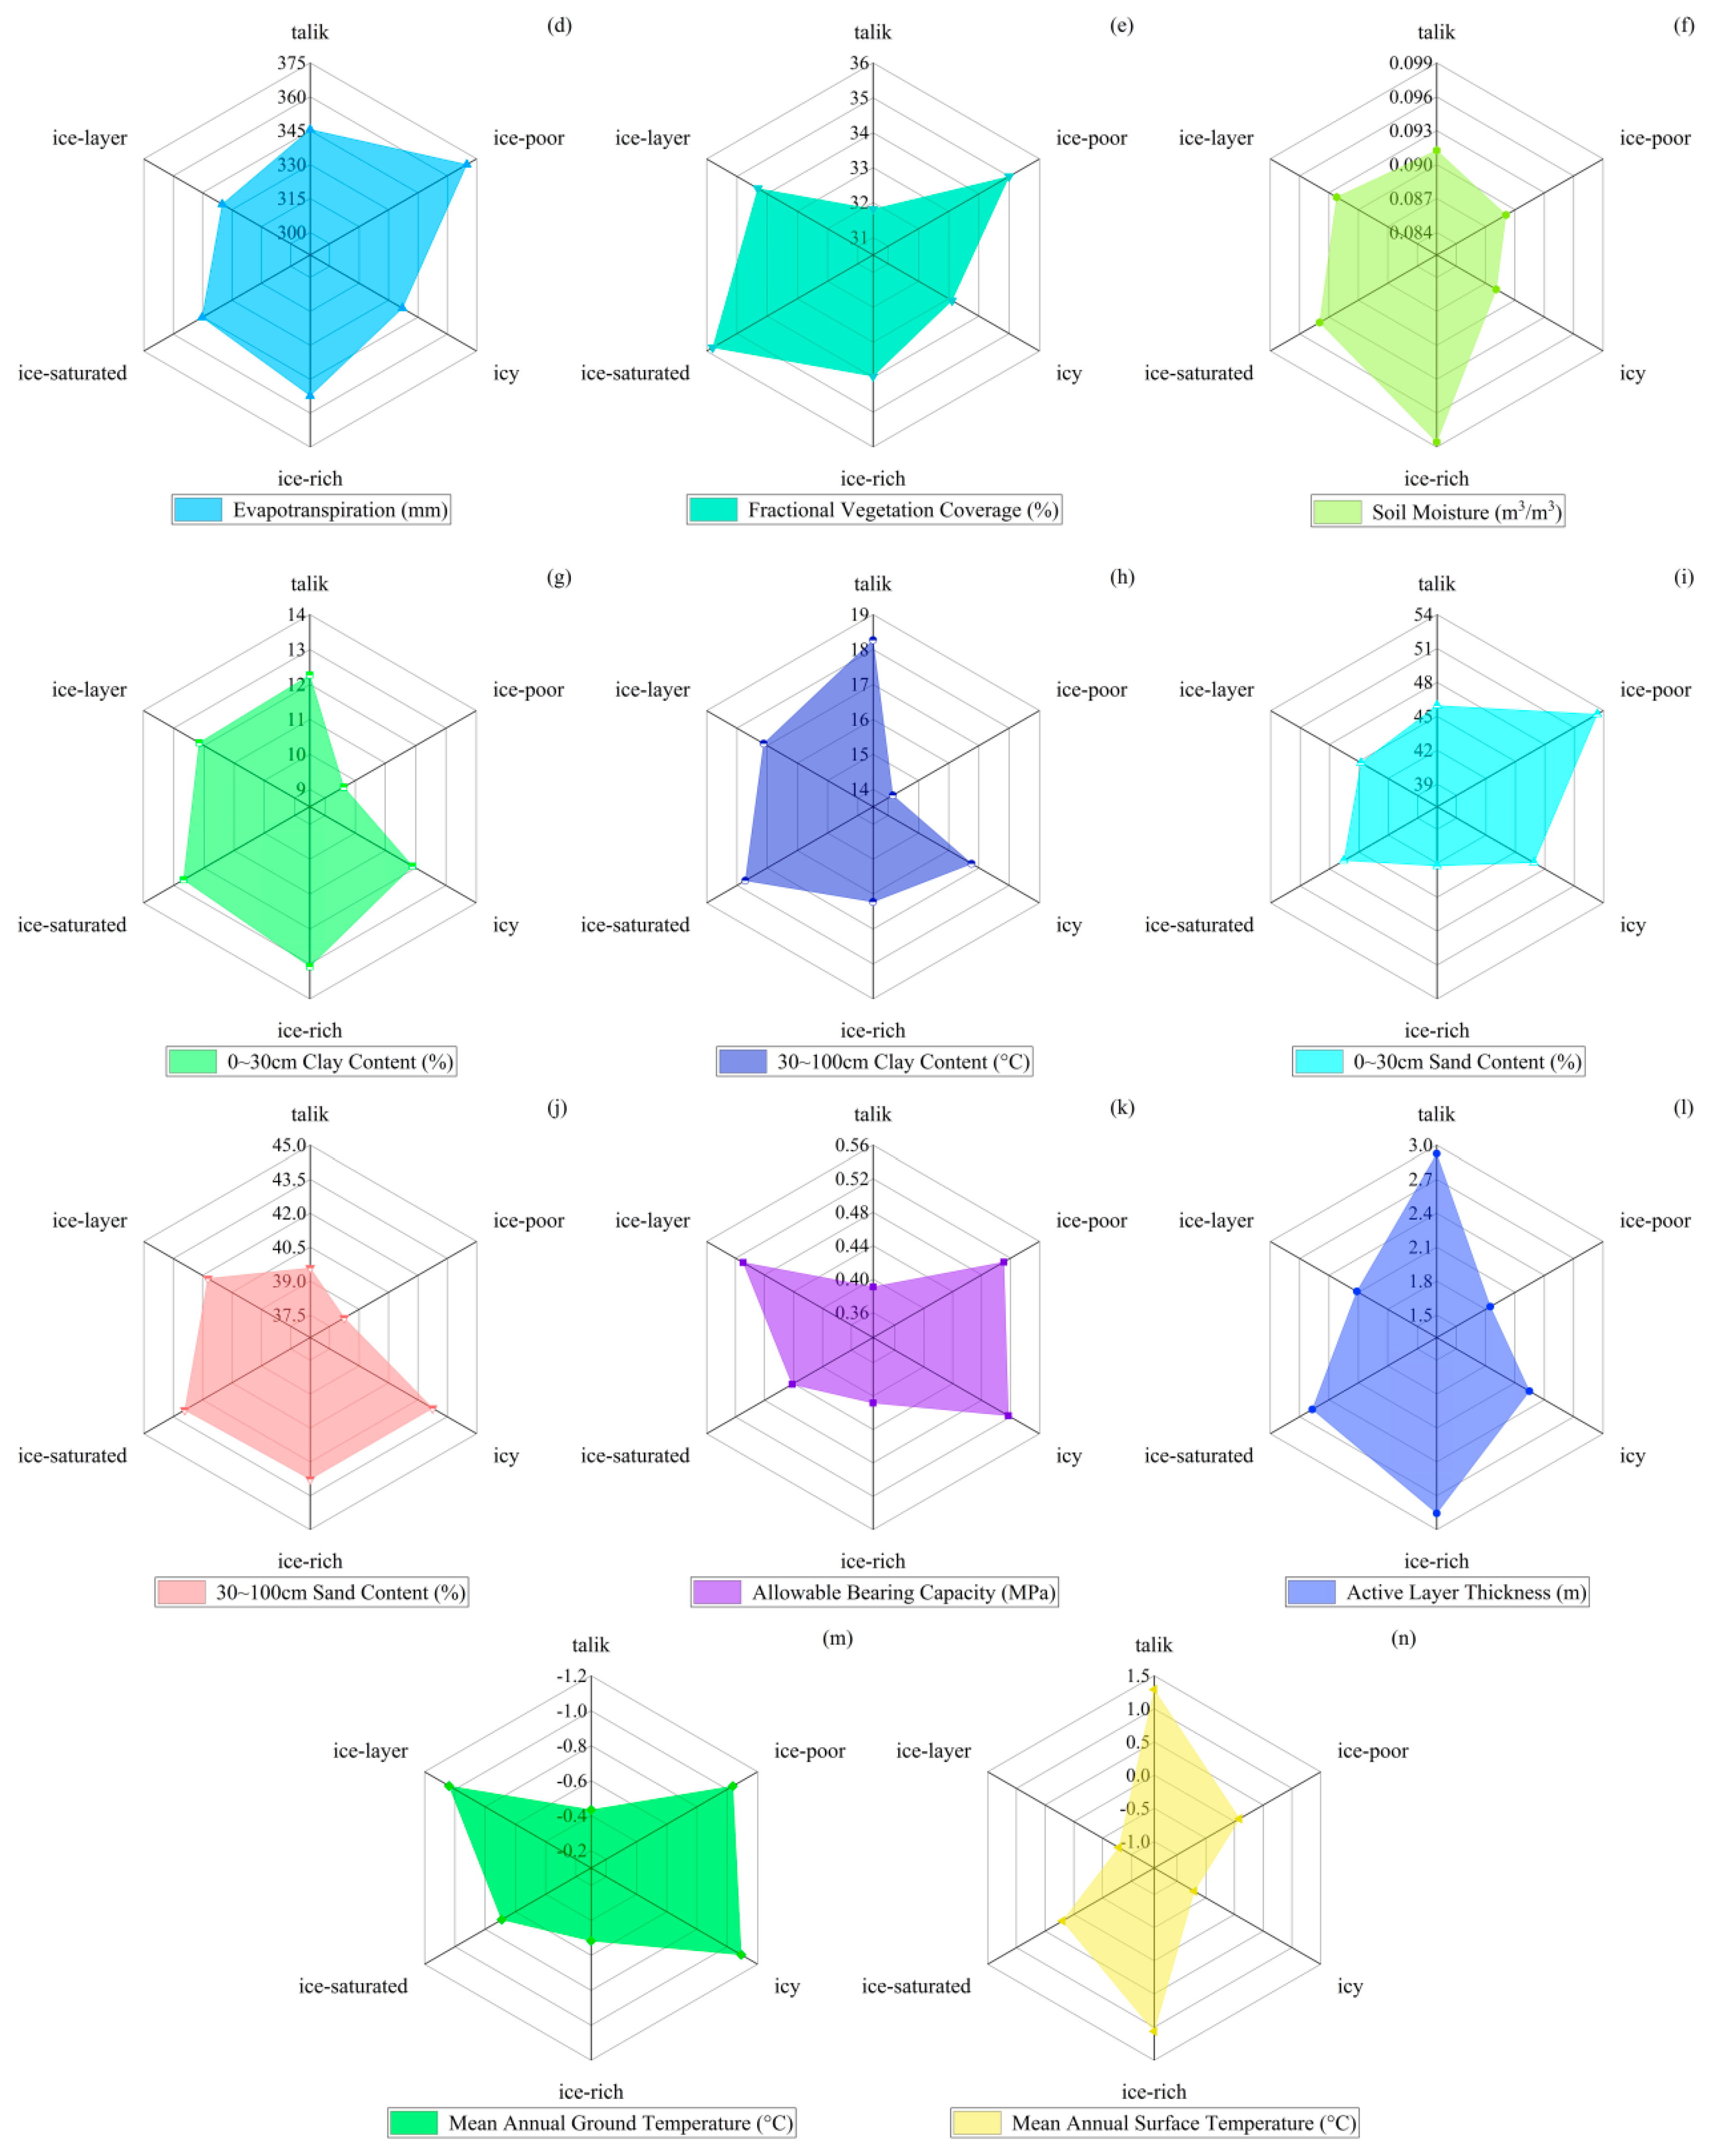
A radar chart was used to analyze the variation distribution of the mean values of each risk factor under different VIC regions, as shown in Figure 9. The variation characteristics of the mean values of each risk factor with VIC are shown in the Supplementary Materials (Table S6). The peak and valley areas of each risk factor were mainly concentrated in the talik, ice-poor permafrost zone and zone of ice layer with soil. MAAT affected FVC, ABC, ALT, MAGT and MAST in the talik; climatic factors affected ET and ABC directly in the ice-poor permafrost zone; MAP and SR affected ET and MAST directly in the zone of ice layer with soil.

4.2. Driving Factor Analysis of Dynamic Risk Factors

According to the risk identification model, the dynamic risk factors in the study area were divided into ET, FVC, SM, ABC, ALT, MAGT, MAST and thermokarst lake.

4.2.1. Driving Factor Analysis of ET

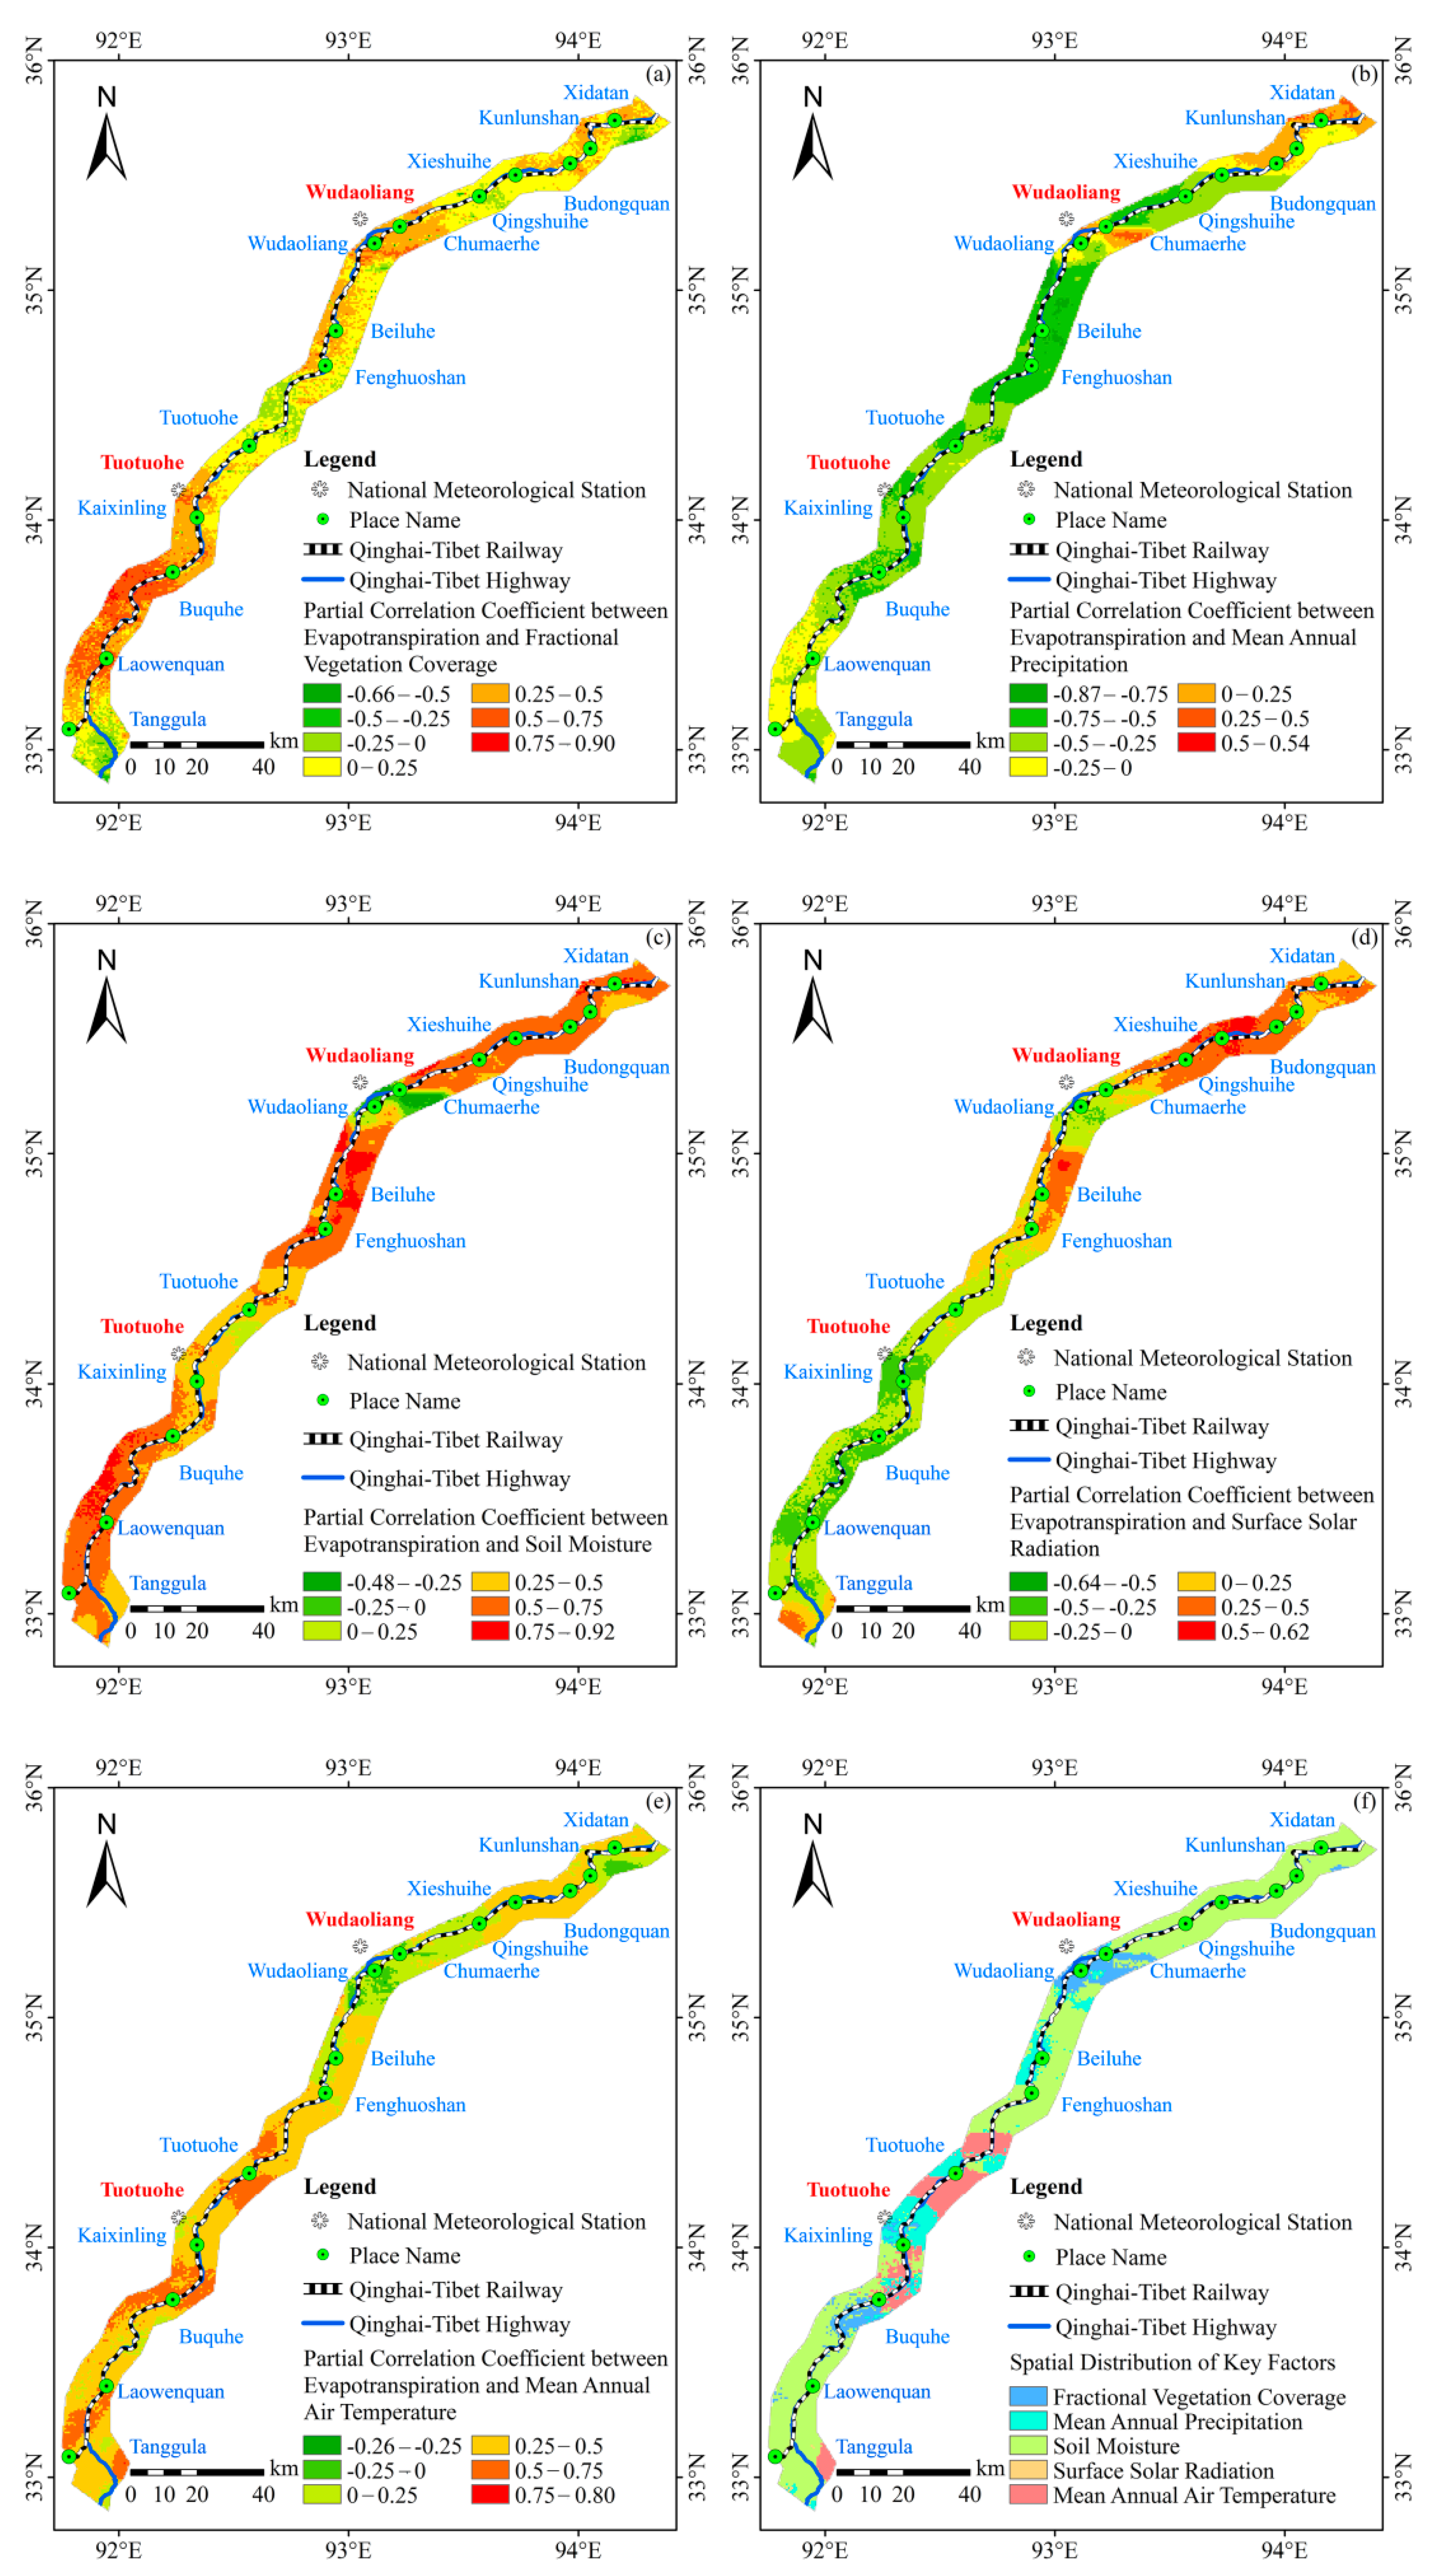
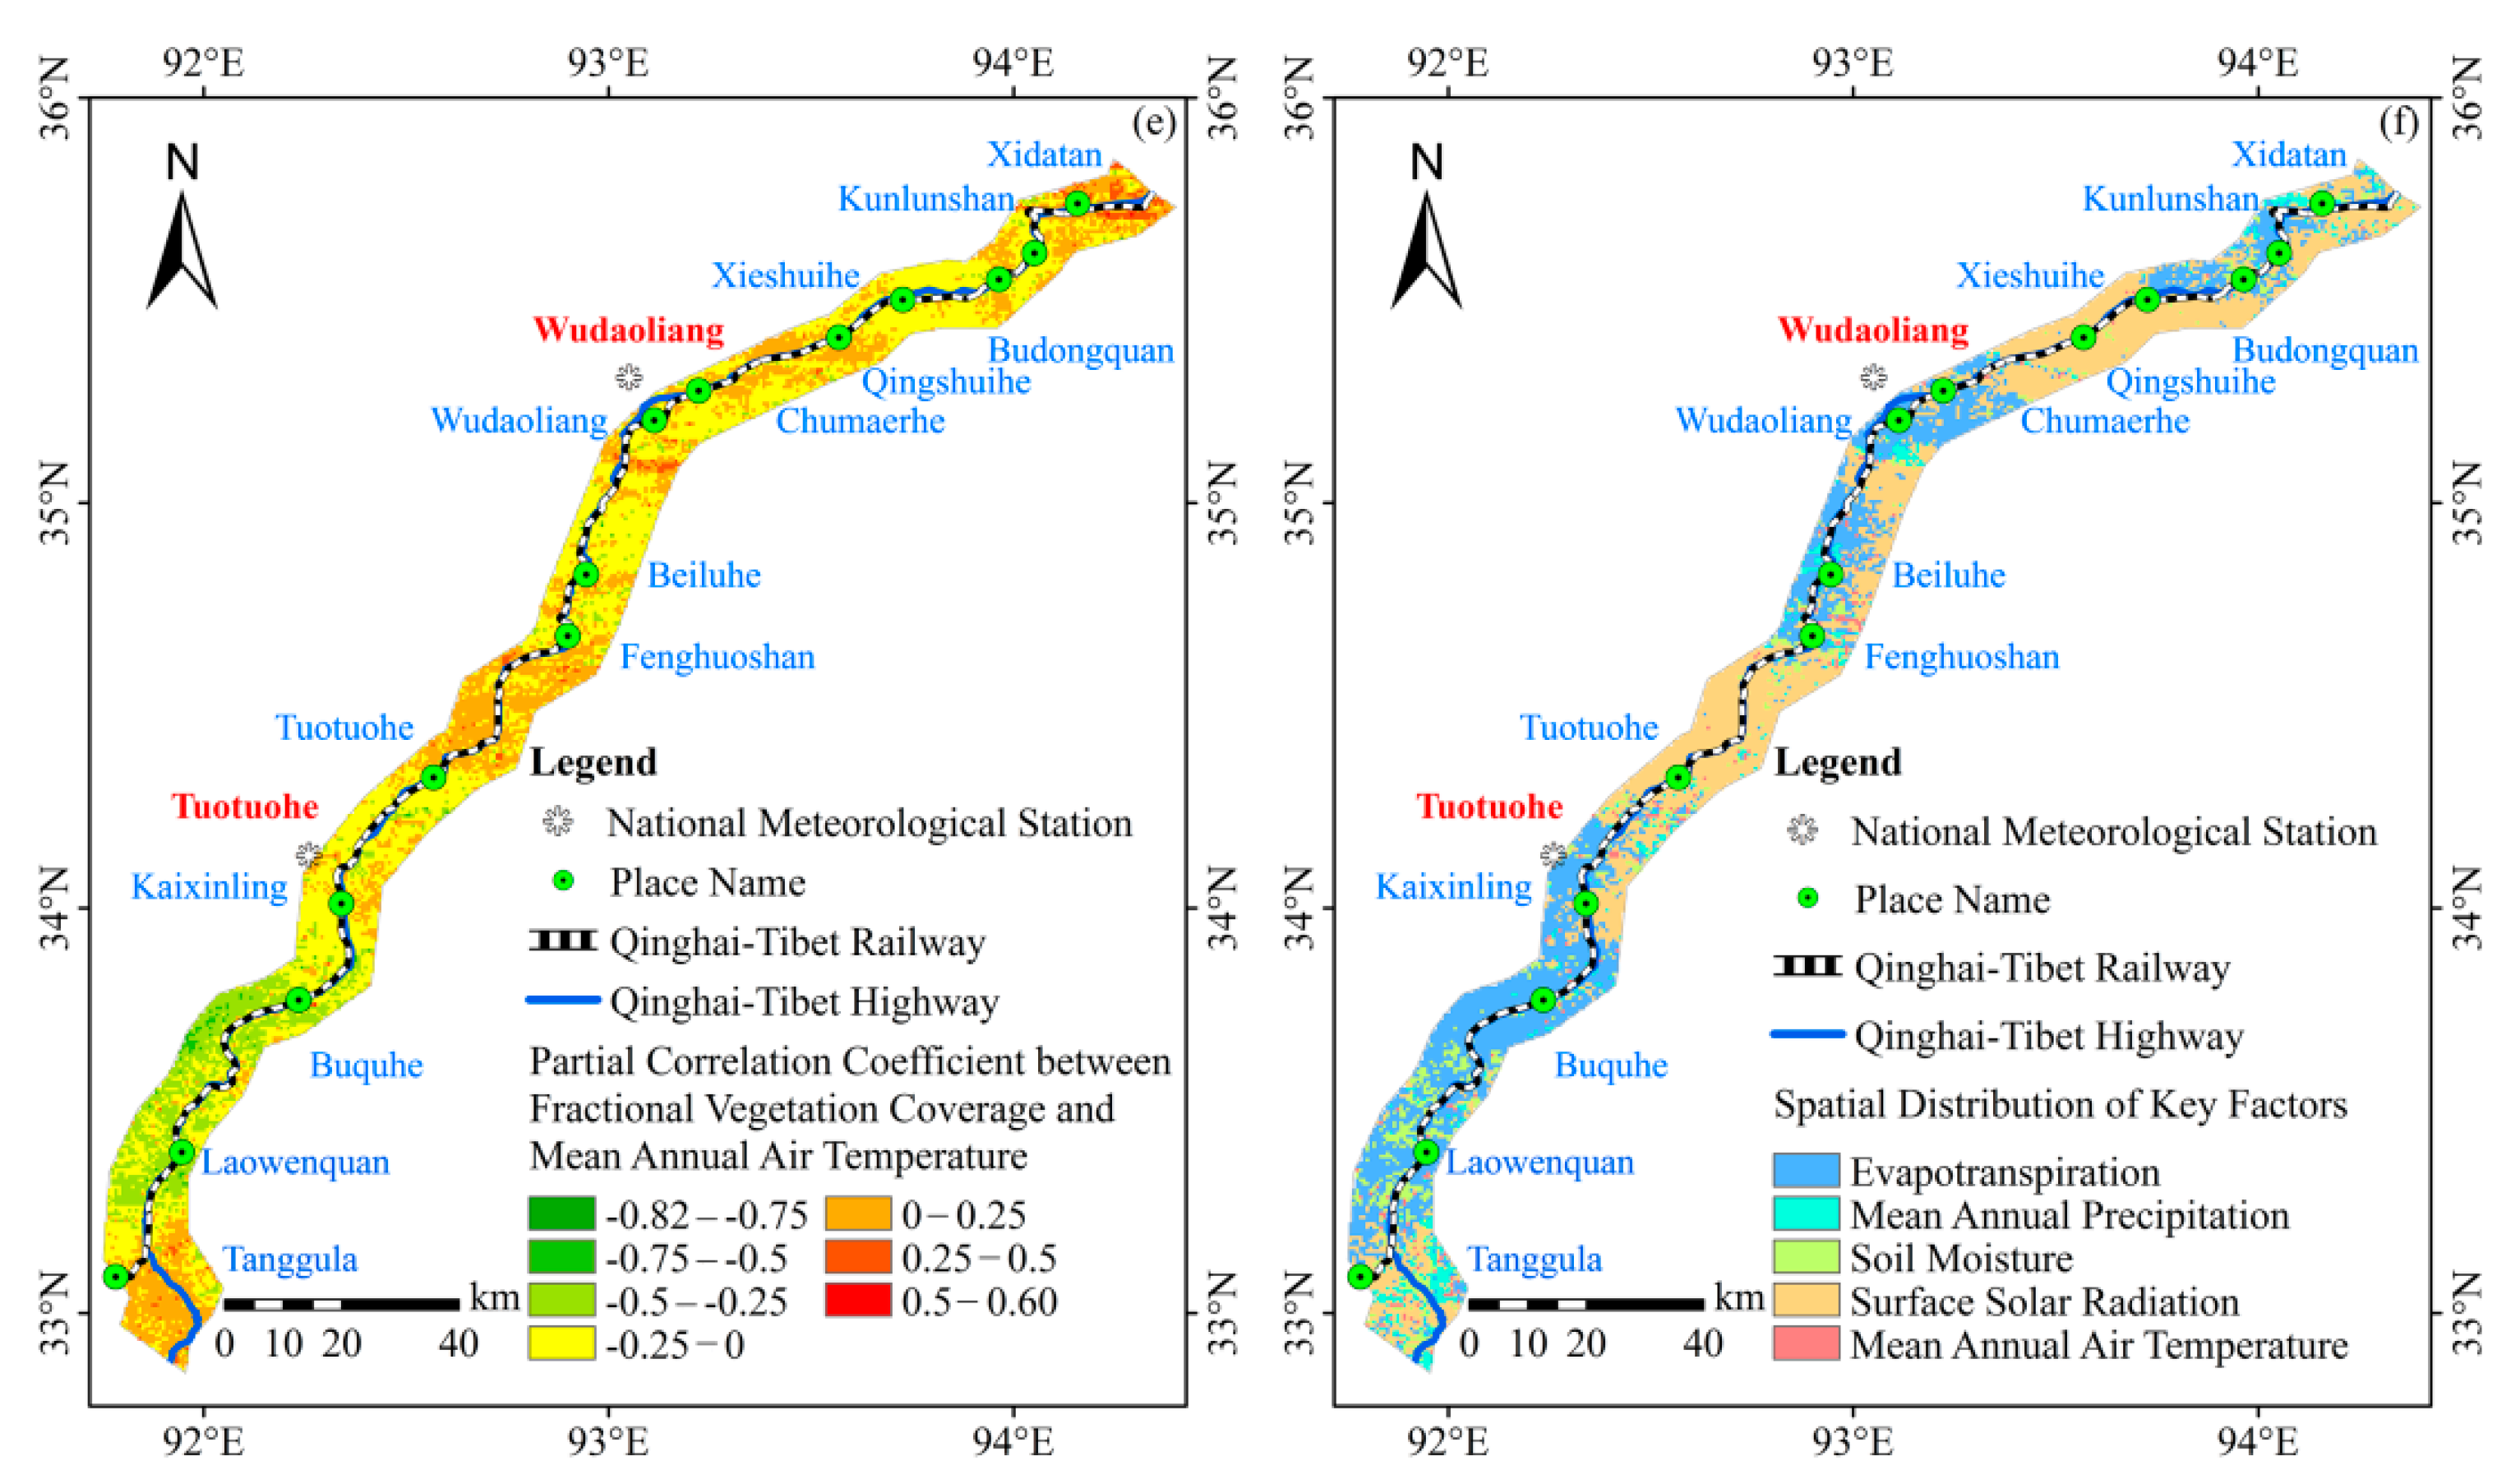
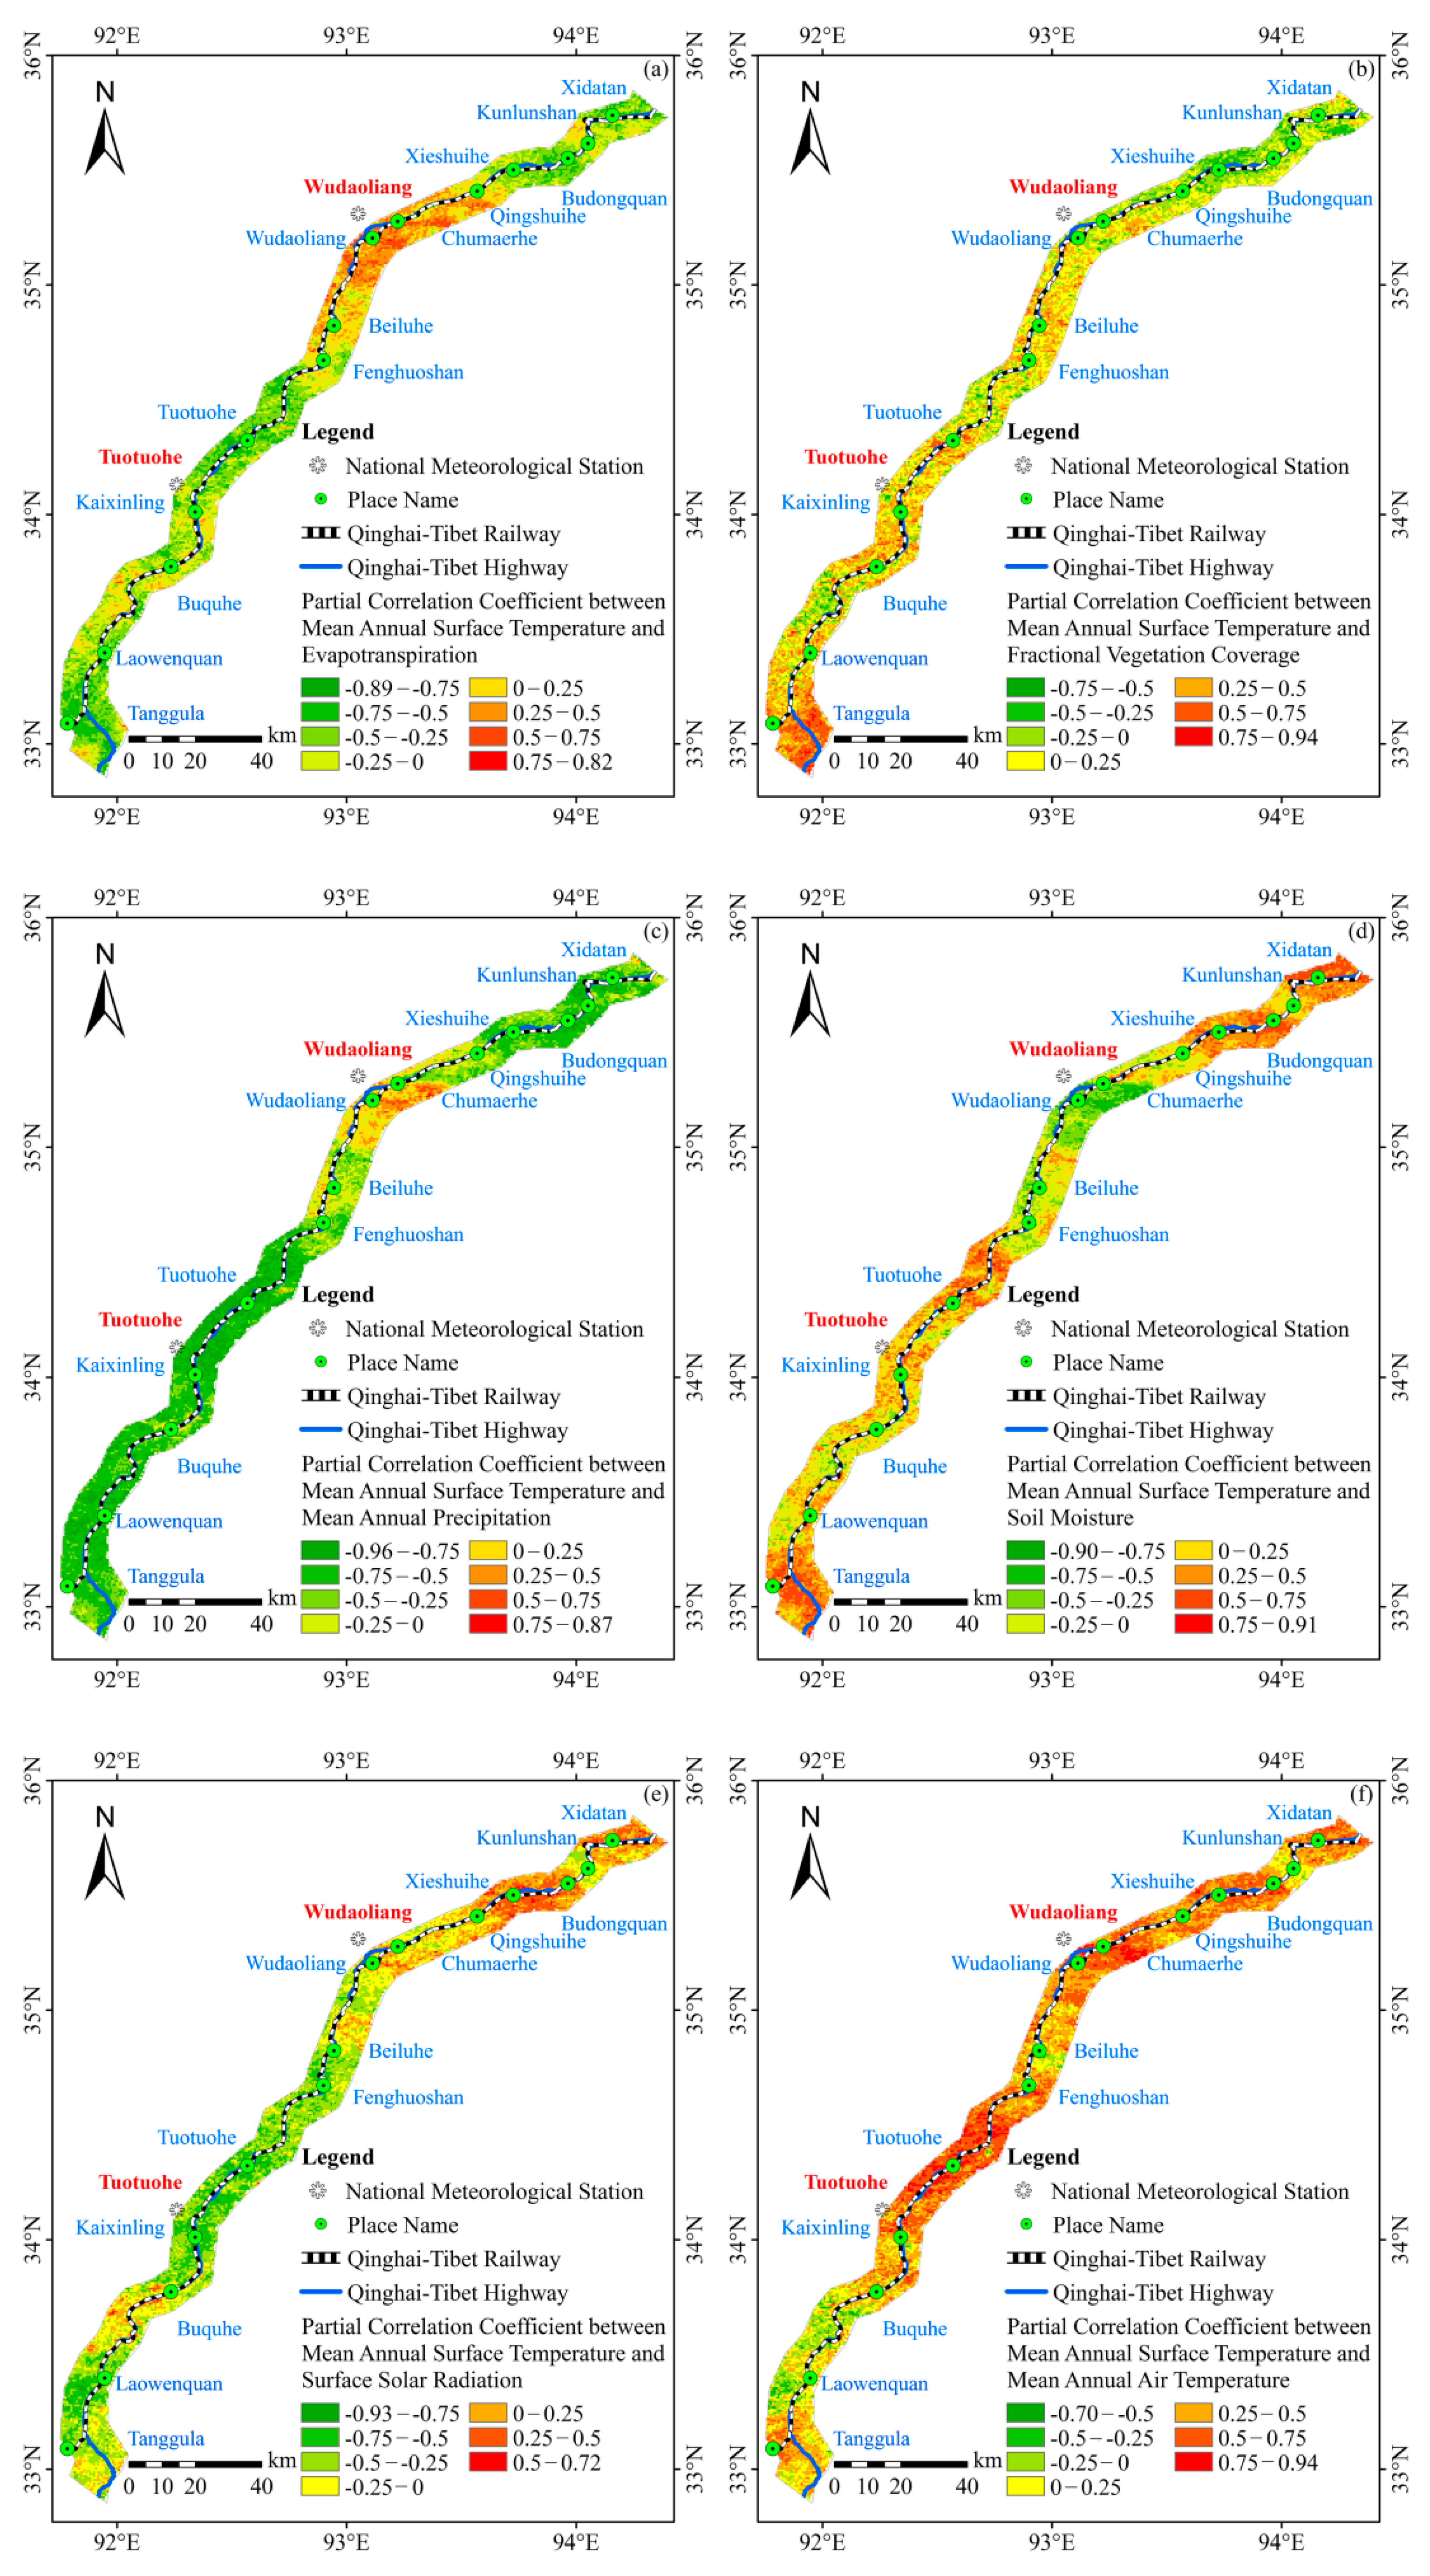
The correlation between ET and FVC, MAP, SM, SR and MAAT in the study area from 2003 to 2016 was analyzed. The spatial distribution characteristics are shown in Figure 10 and the spatial analysis results are shown in the Supplementary Materials (Table S7).
ET, a risk factor of ecological environmental risk, was also affected by other risk factors to varying degrees. Therefore, the risk factor with the largest absolute value of the partial correlation coefficient on the pixel could be regarded as the main influencing factor of this pixel. It can be seen, from Figure 10f, that FVC, MAP, SM, SR and MAAT affected 9.24%, 12.46%, 66.42%, 0.08% and 11.80% of the area, respectively. Therefore, the influence degree of each influencing factor on ET in the study area was SM > MAP > MAAT > FVC > SR, indicating that SM, MAP and MAAT were the main influencing factors of ET in the study area from 2003 to 2016.

4.2.2. Driving Factor Analysis of FVC

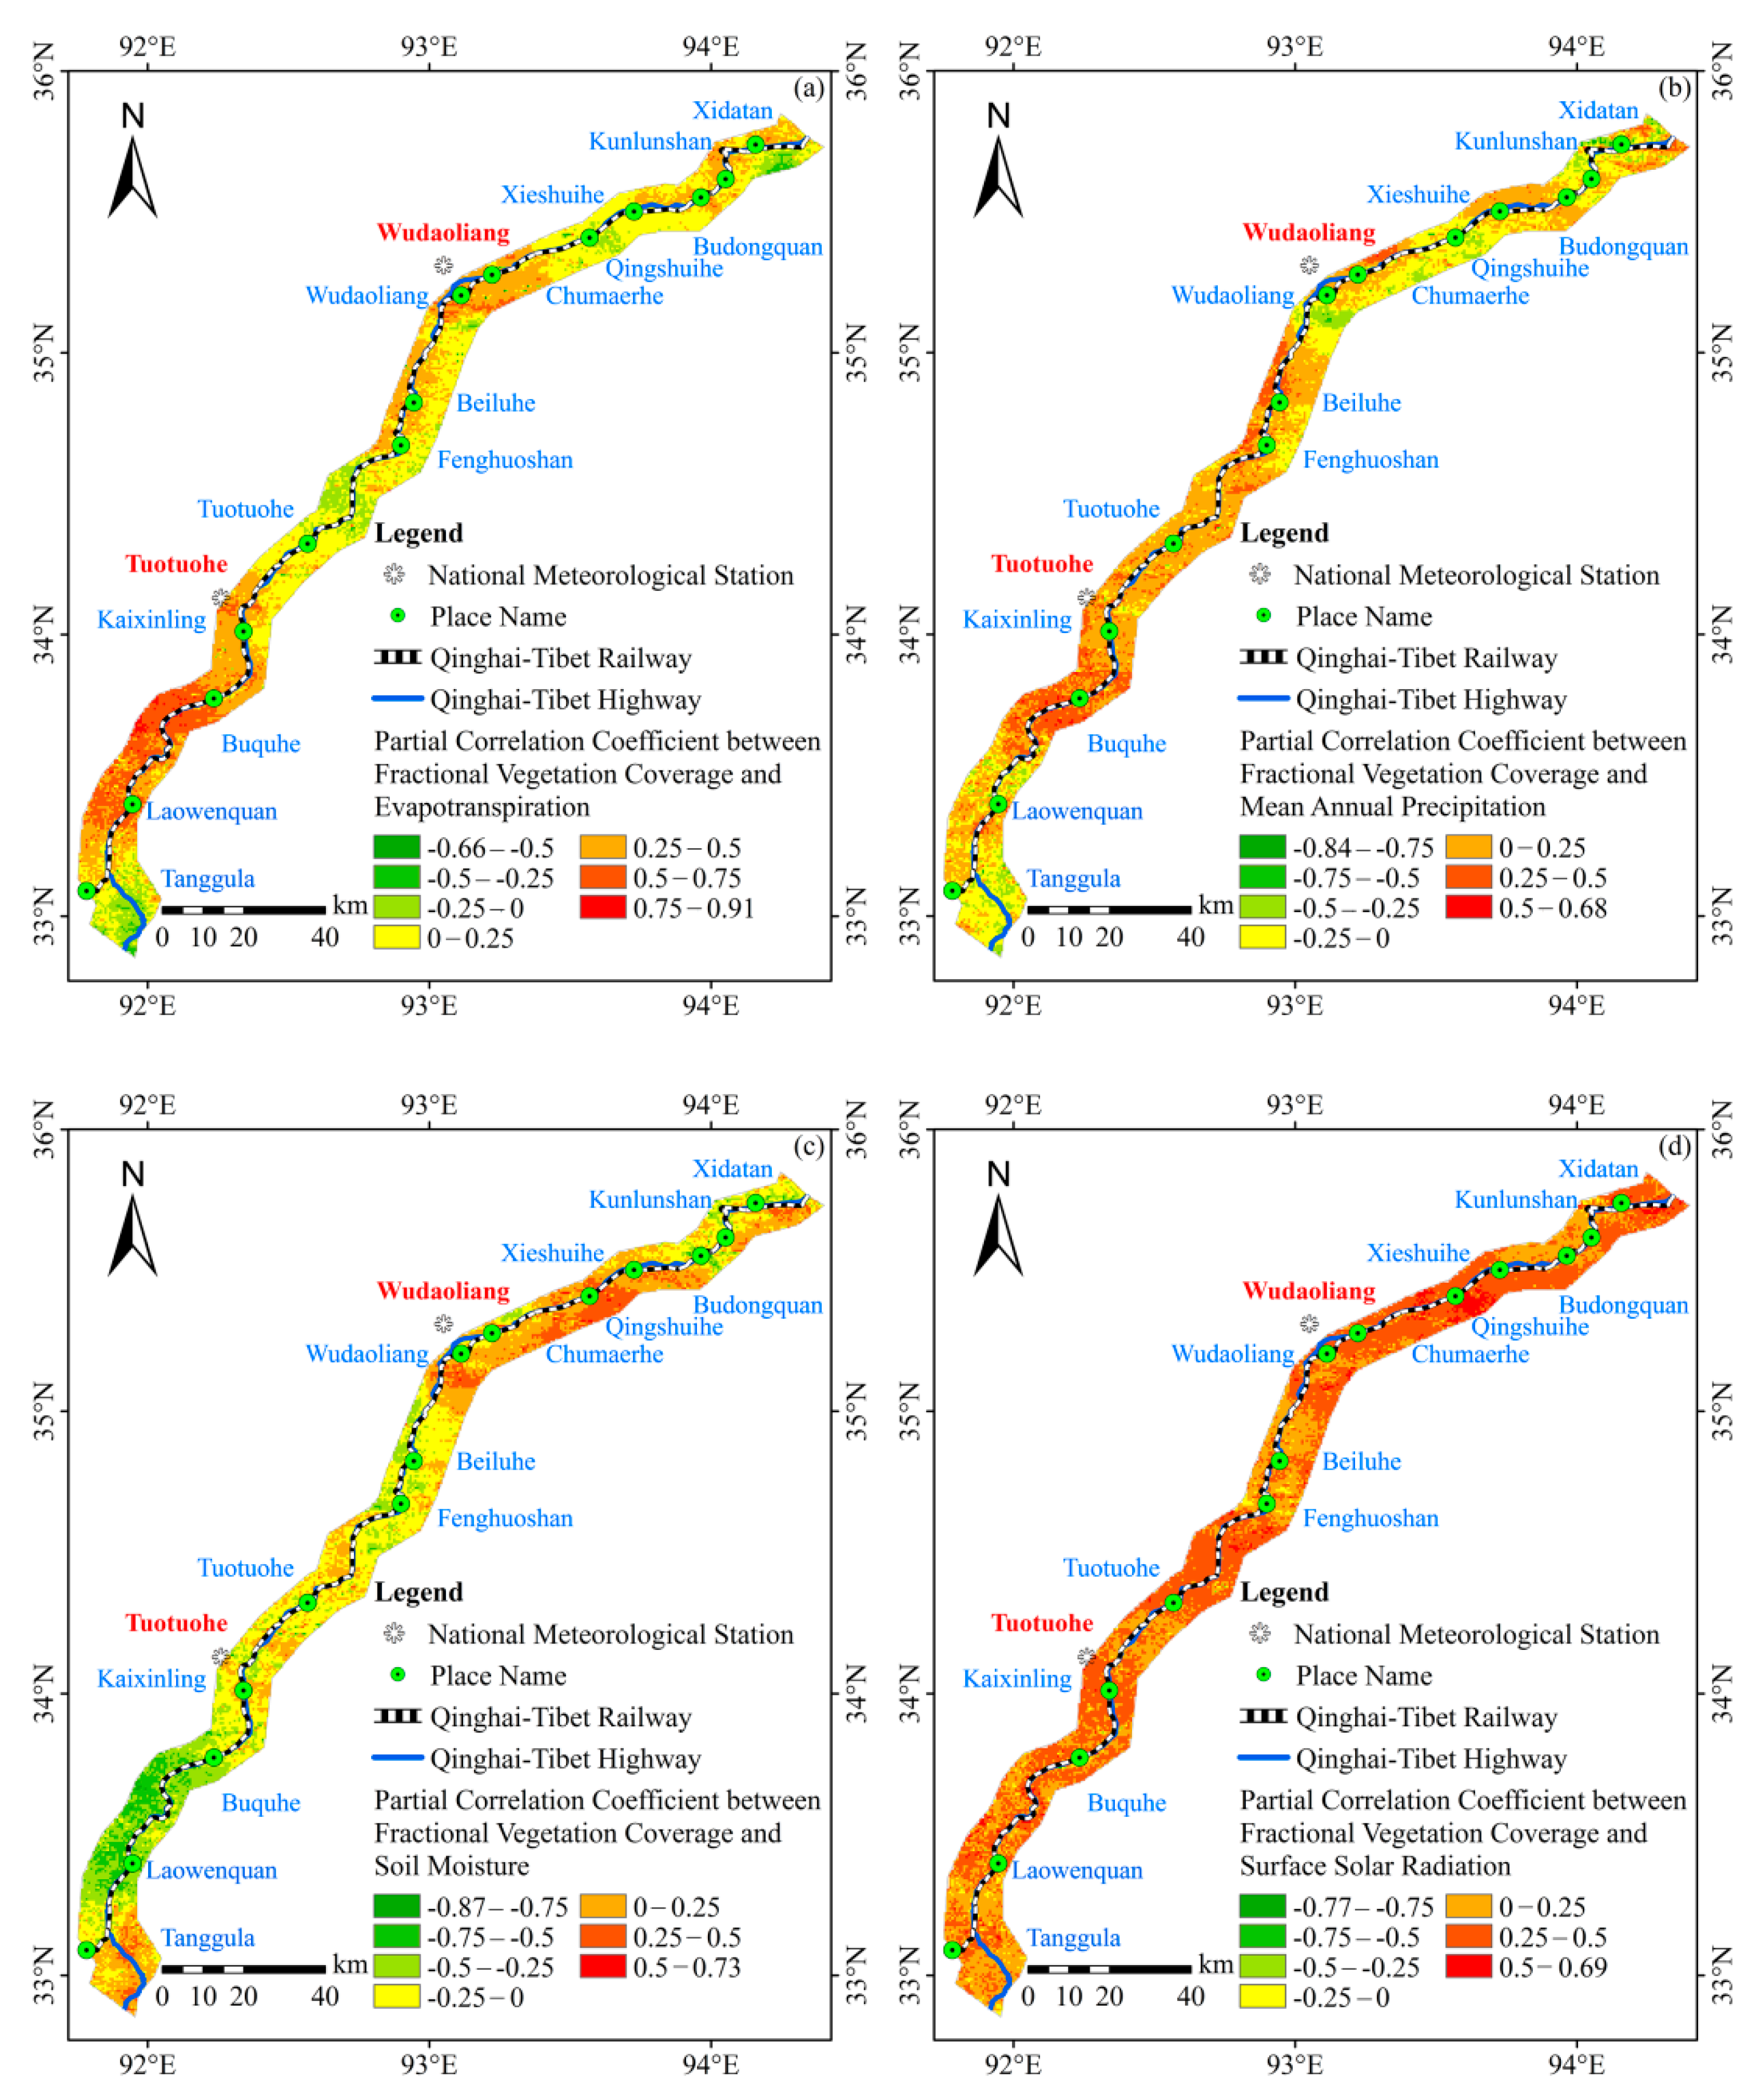
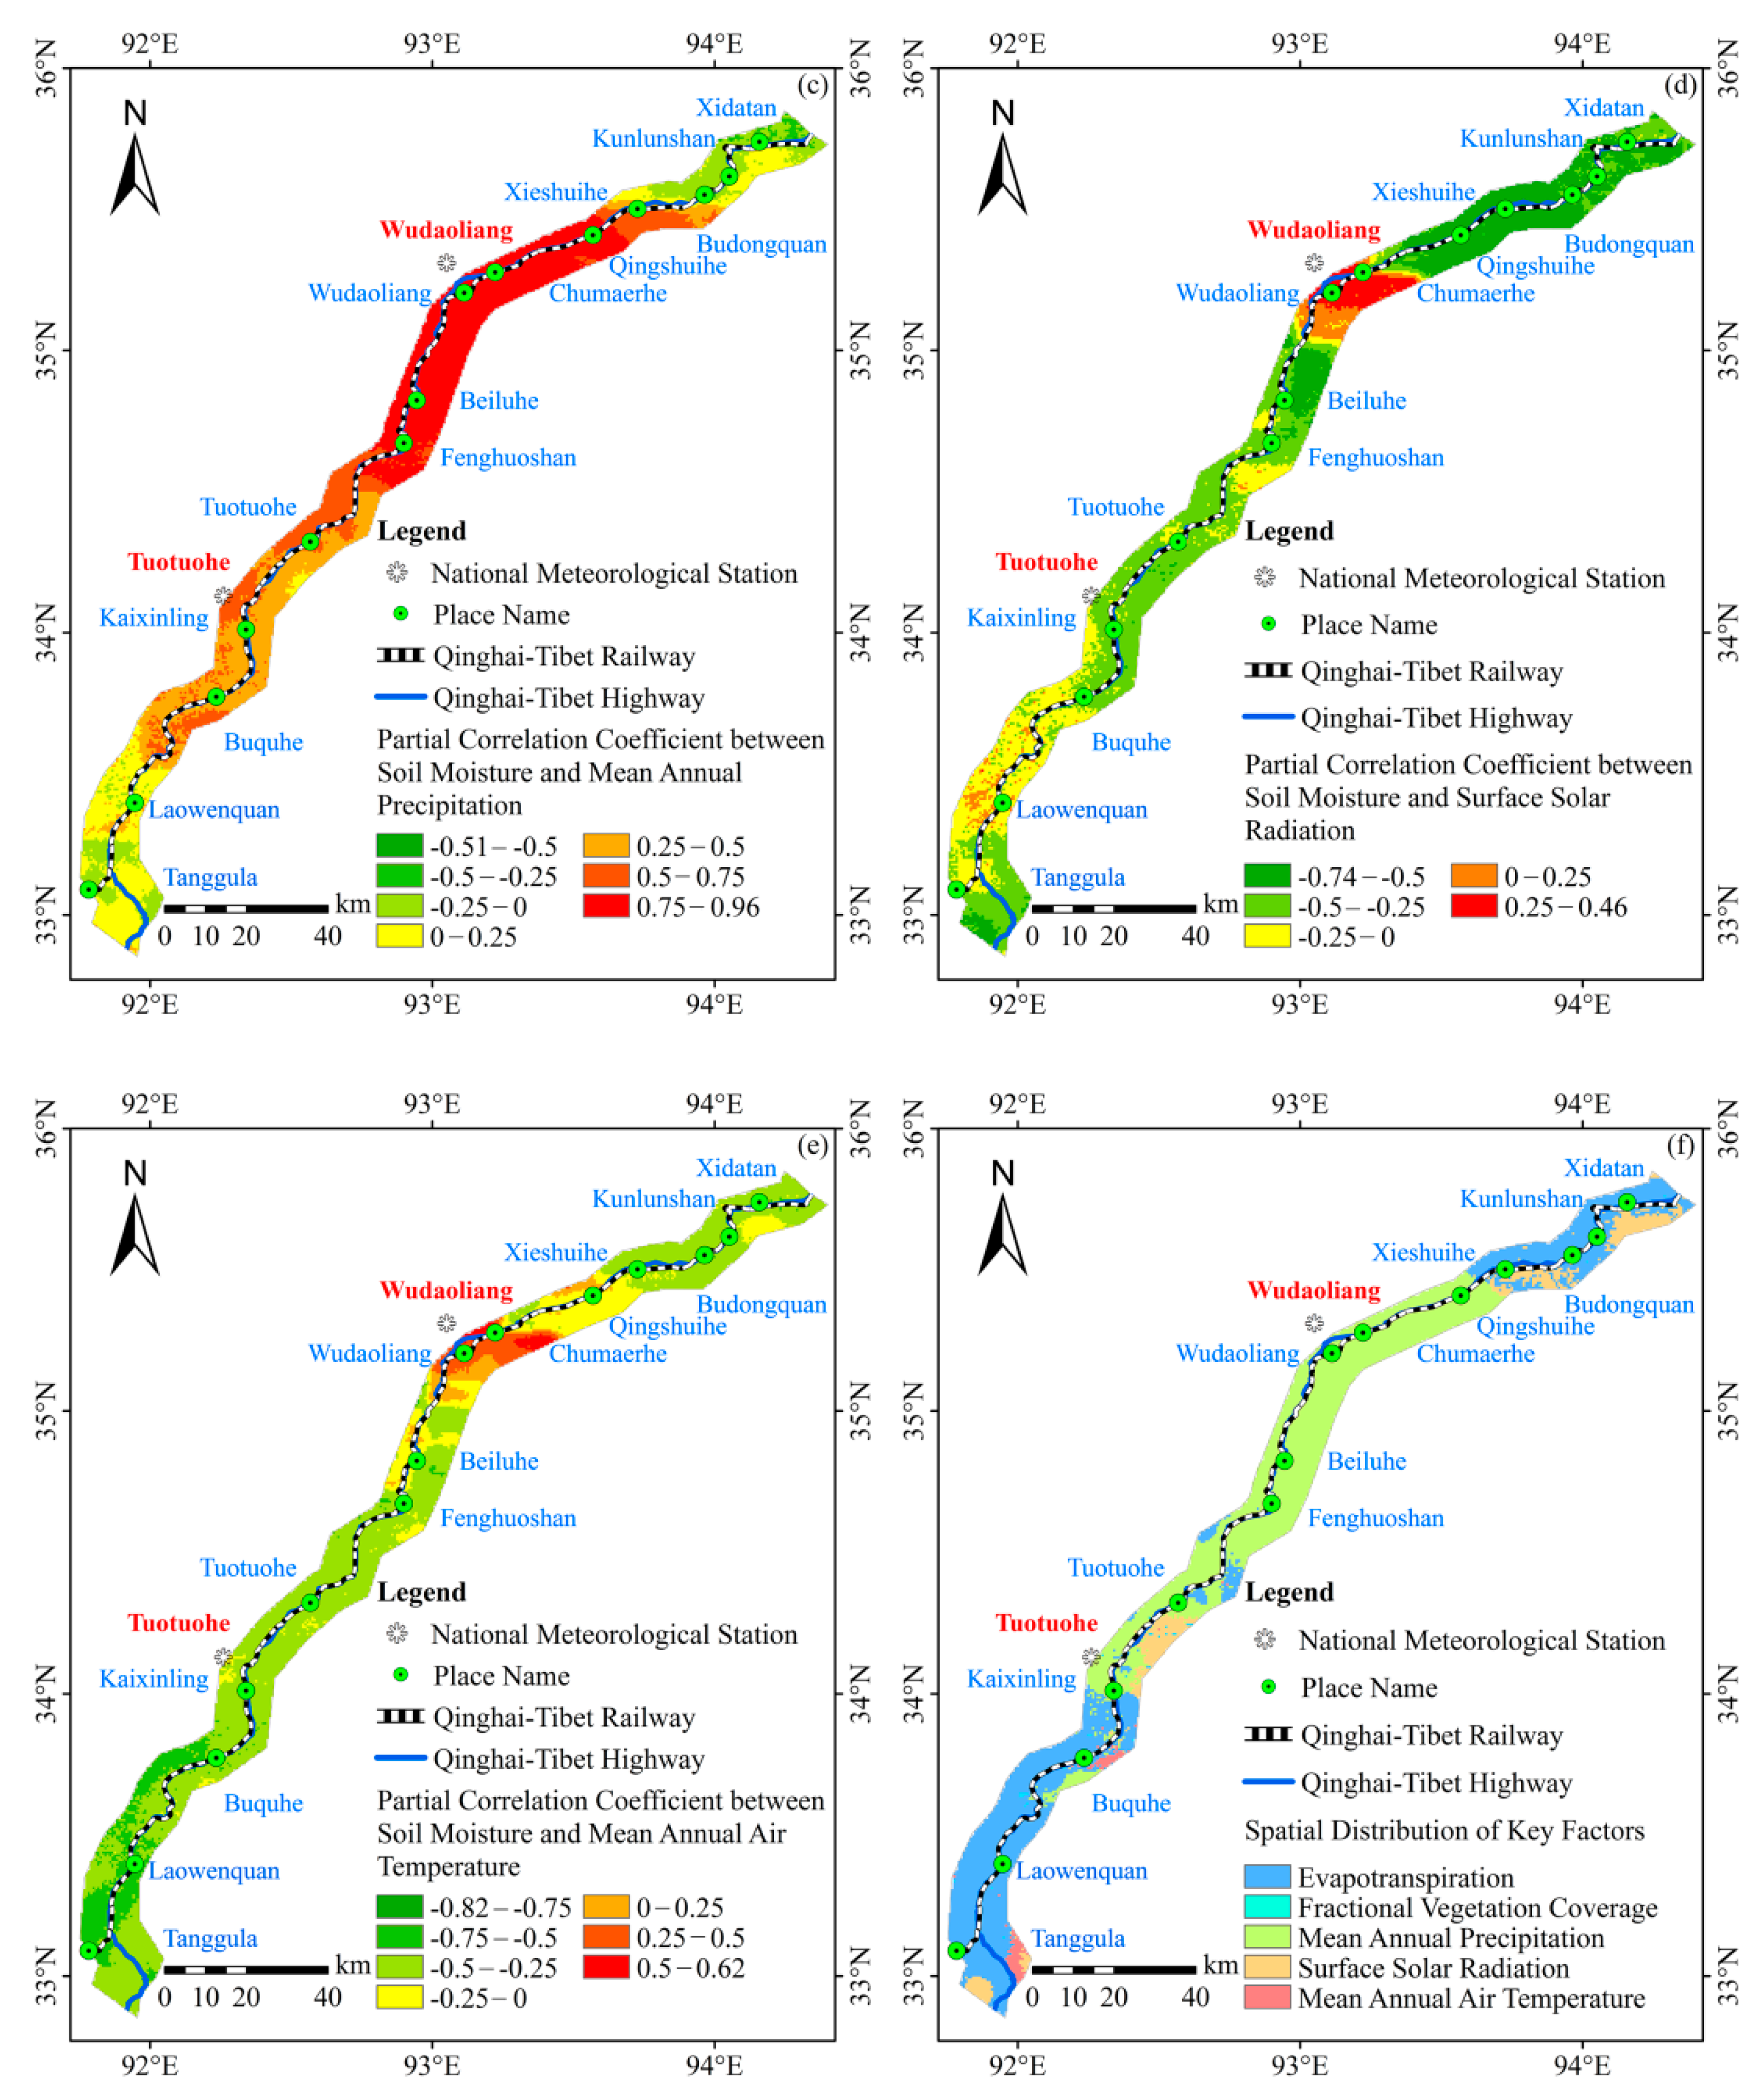
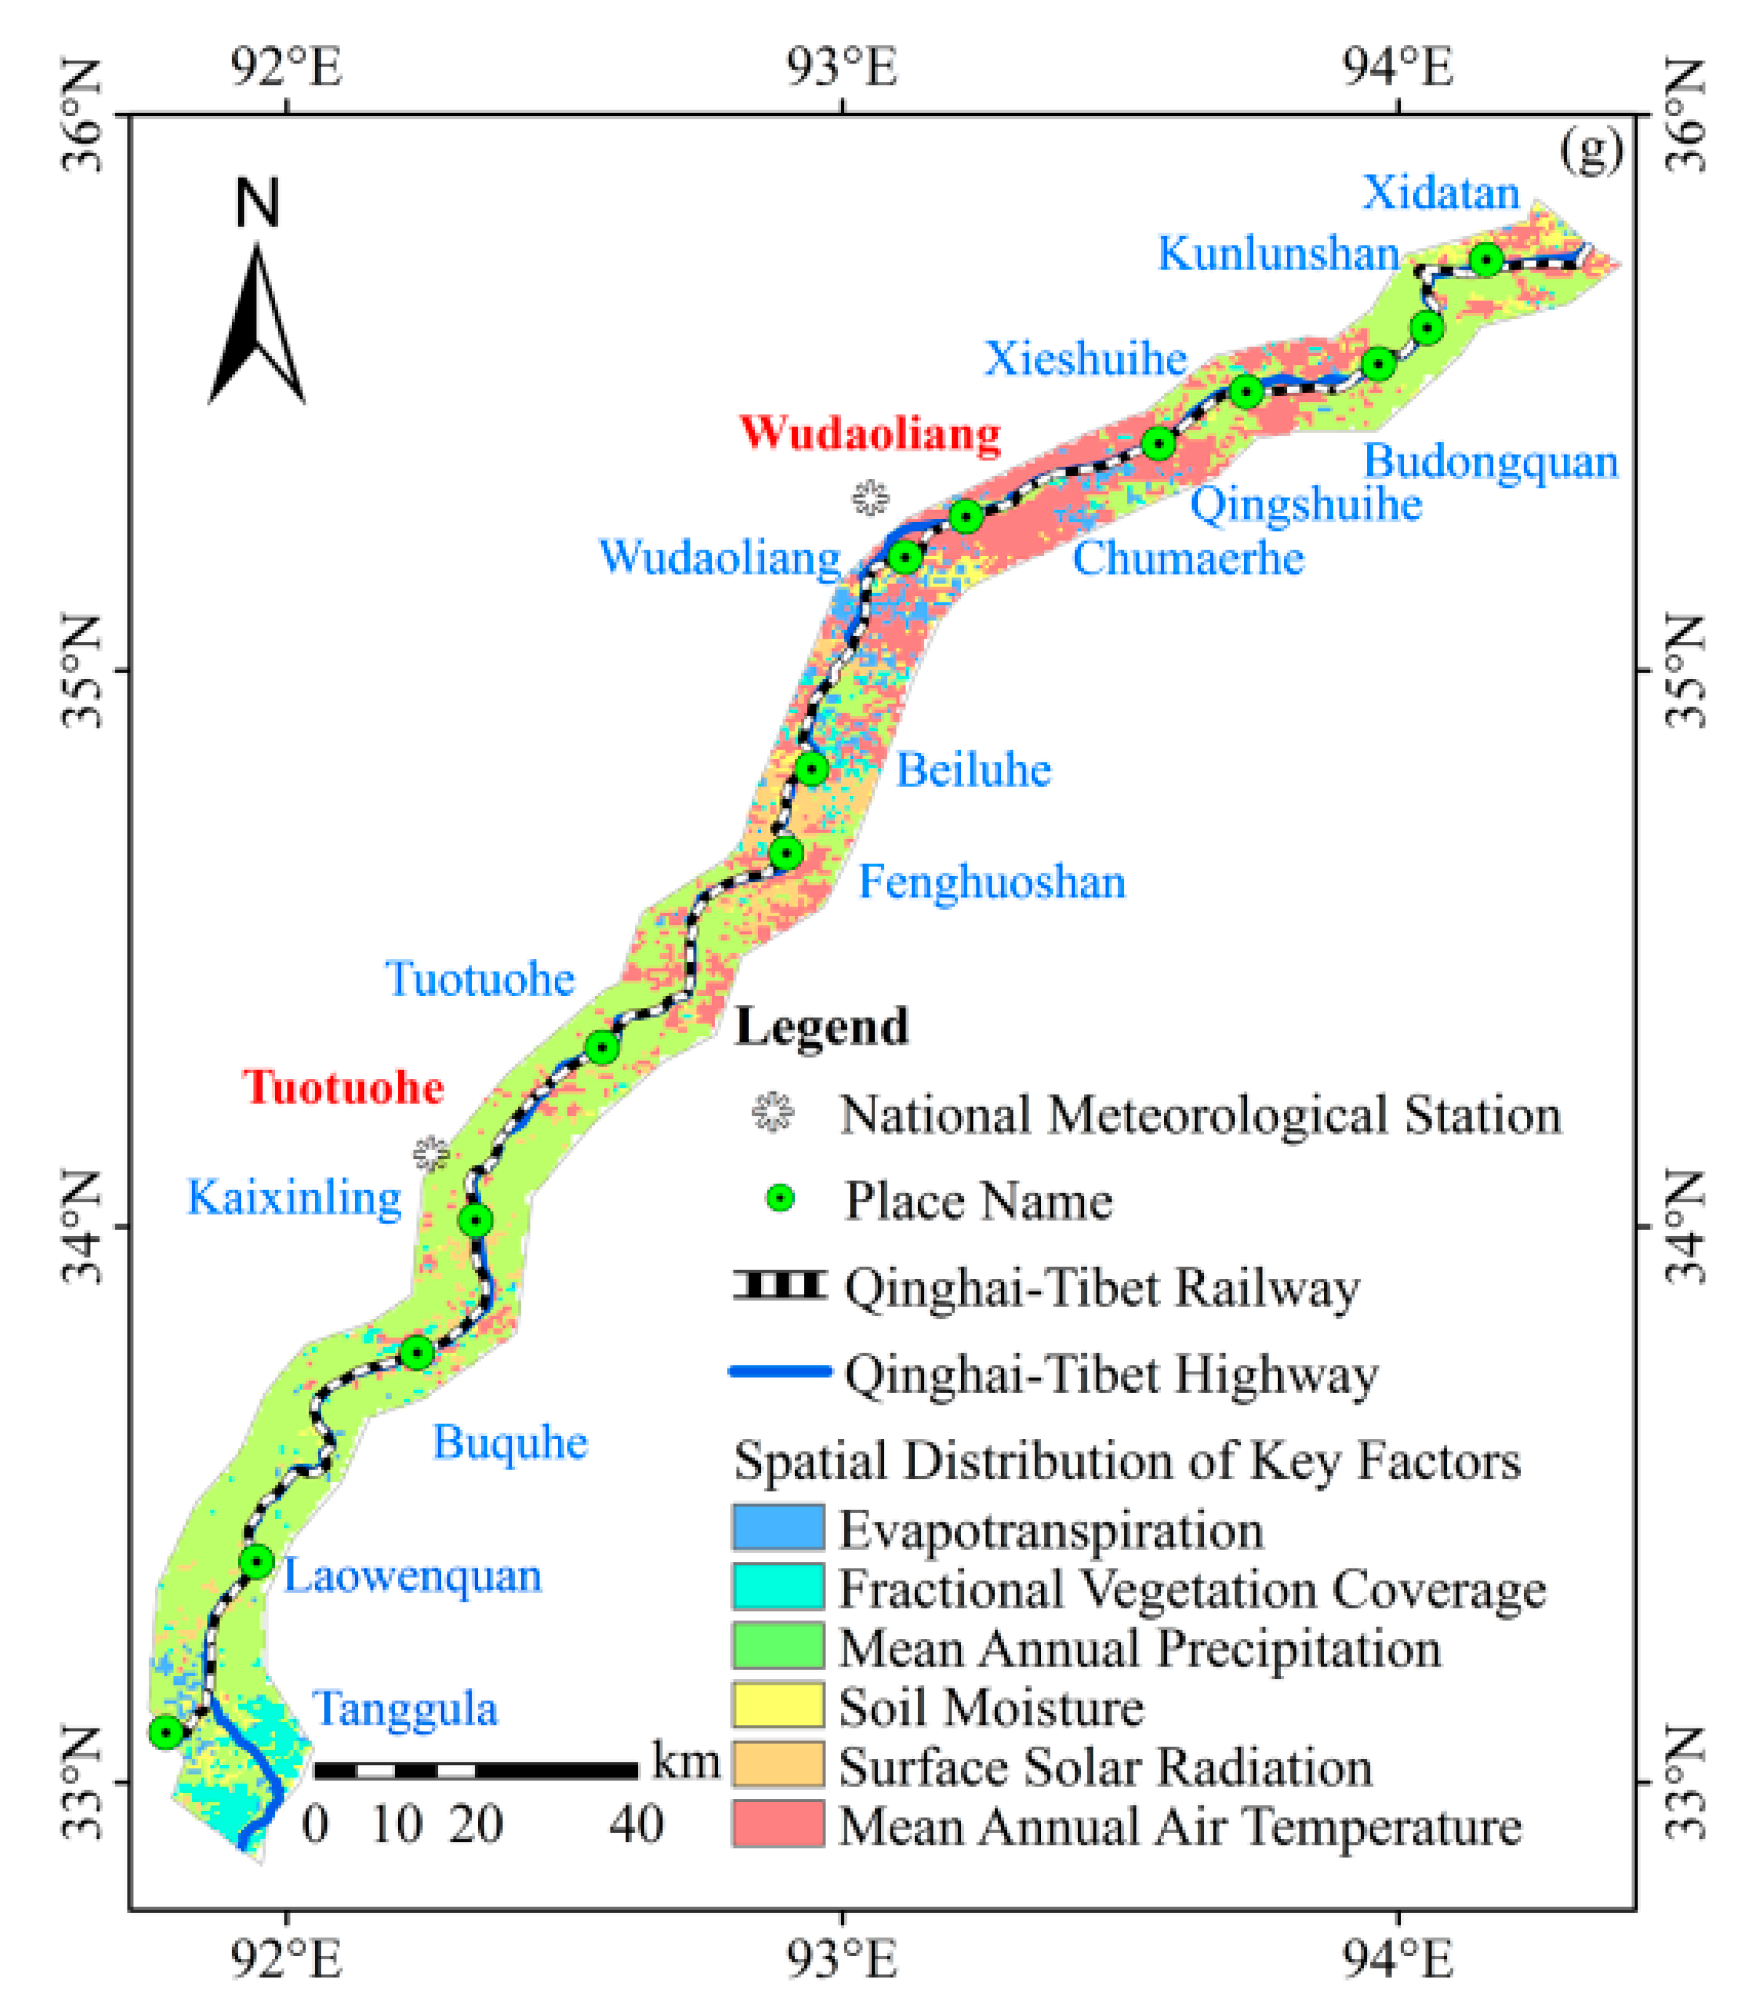
The correlation between the FVC and ET, MAP, SM, SR and MAAT in the study area from 2003 to 2016 was analyzed. The spatial distribution characteristics are shown in Figure 11 and the spatial analysis results are shown in the Supplementary Materials (Table S8).
FVC, a risk factor of ecological environmental risk, was also affected by other risk factors to varying degrees. Therefore, the factor with the maximum absolute value of the partial correlation coefficient on the pixel was selected as the main risk factor. It can be seen, from Figure 11f, that, in the entire study area, ET, FVC, MAP, SM, SR and MAAT affected 39.48%, 5.76%, 7.66%, 45.09% and 2.01% of the area, respectively. Therefore, the influence degree of each influencing factor on FVC in the study area was expressed as SR > ET > SM > MAP > MAAT, indicating that SR and ET were the main influencing factors of FVC in the study area from 2003 to 2016.

4.2.3. Driving Factor Analysis of SM

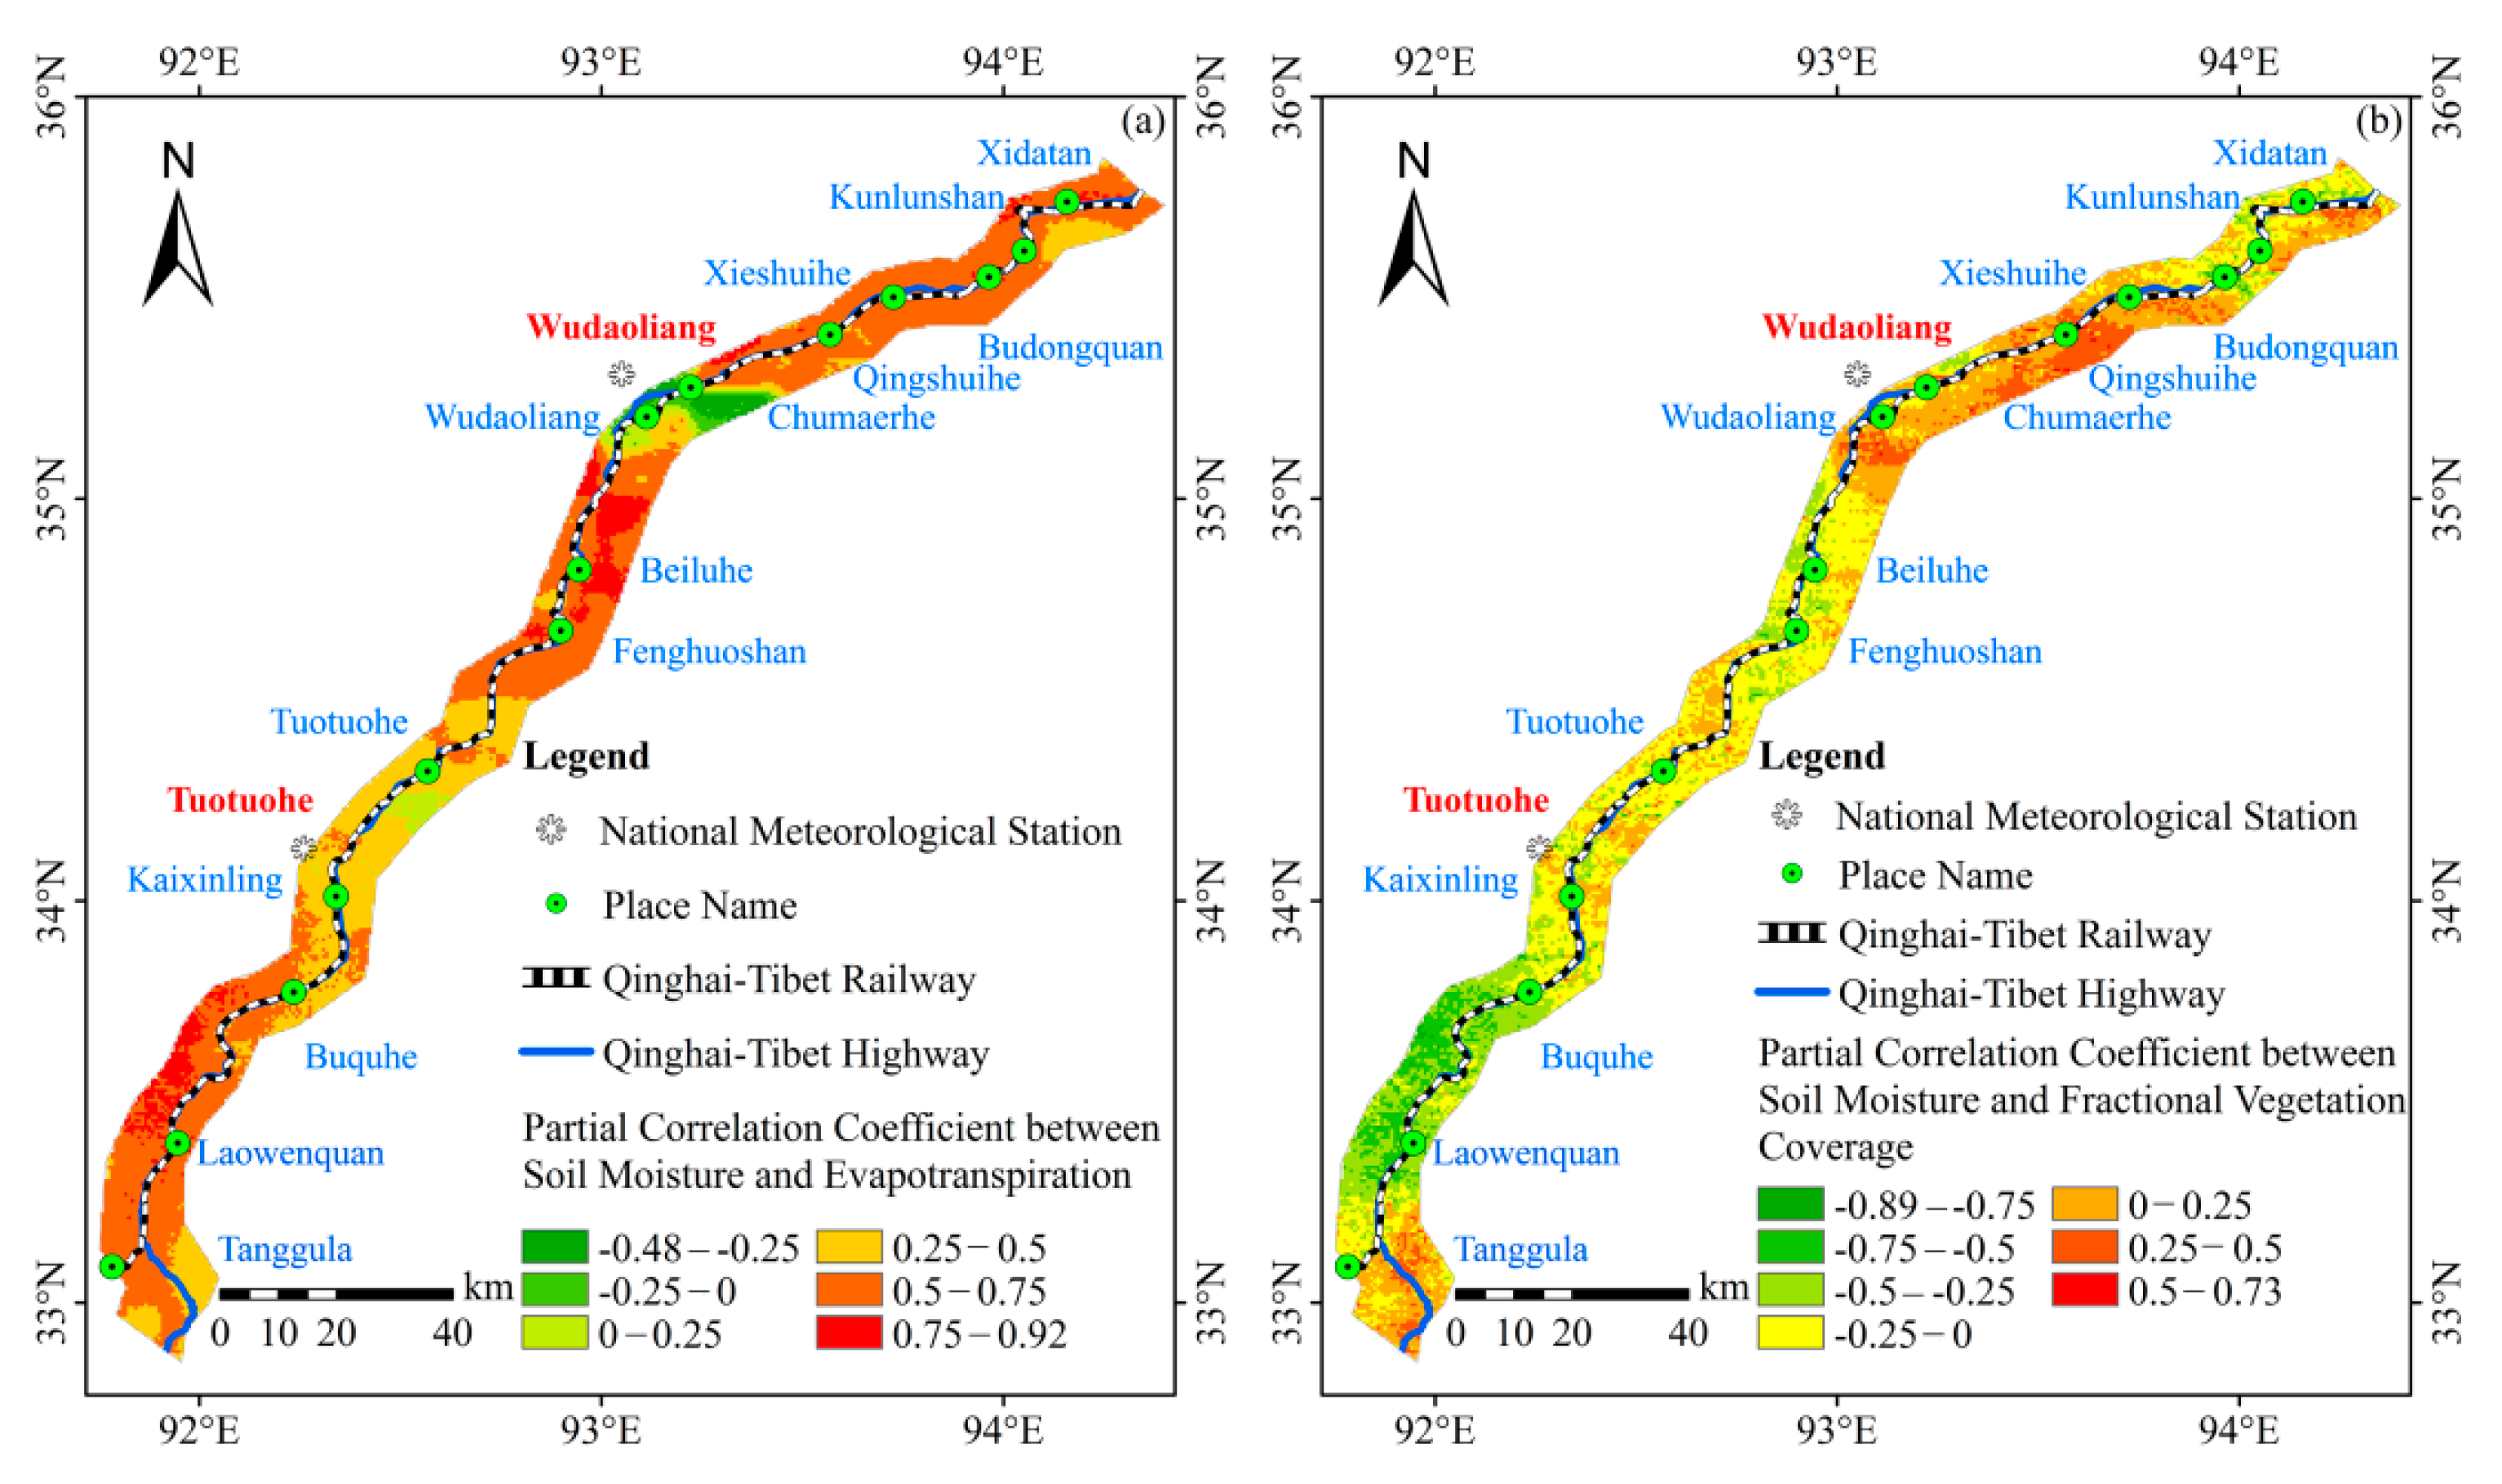
The partial correlation between the SM and ET, MAP, FVC, SR and MAAT in the study area from 2003 to 2016 was analyzed. The spatial distribution characteristics are shown in Figure 12 and the spatial analysis results are shown in the Supplementary Materials (Table S9).
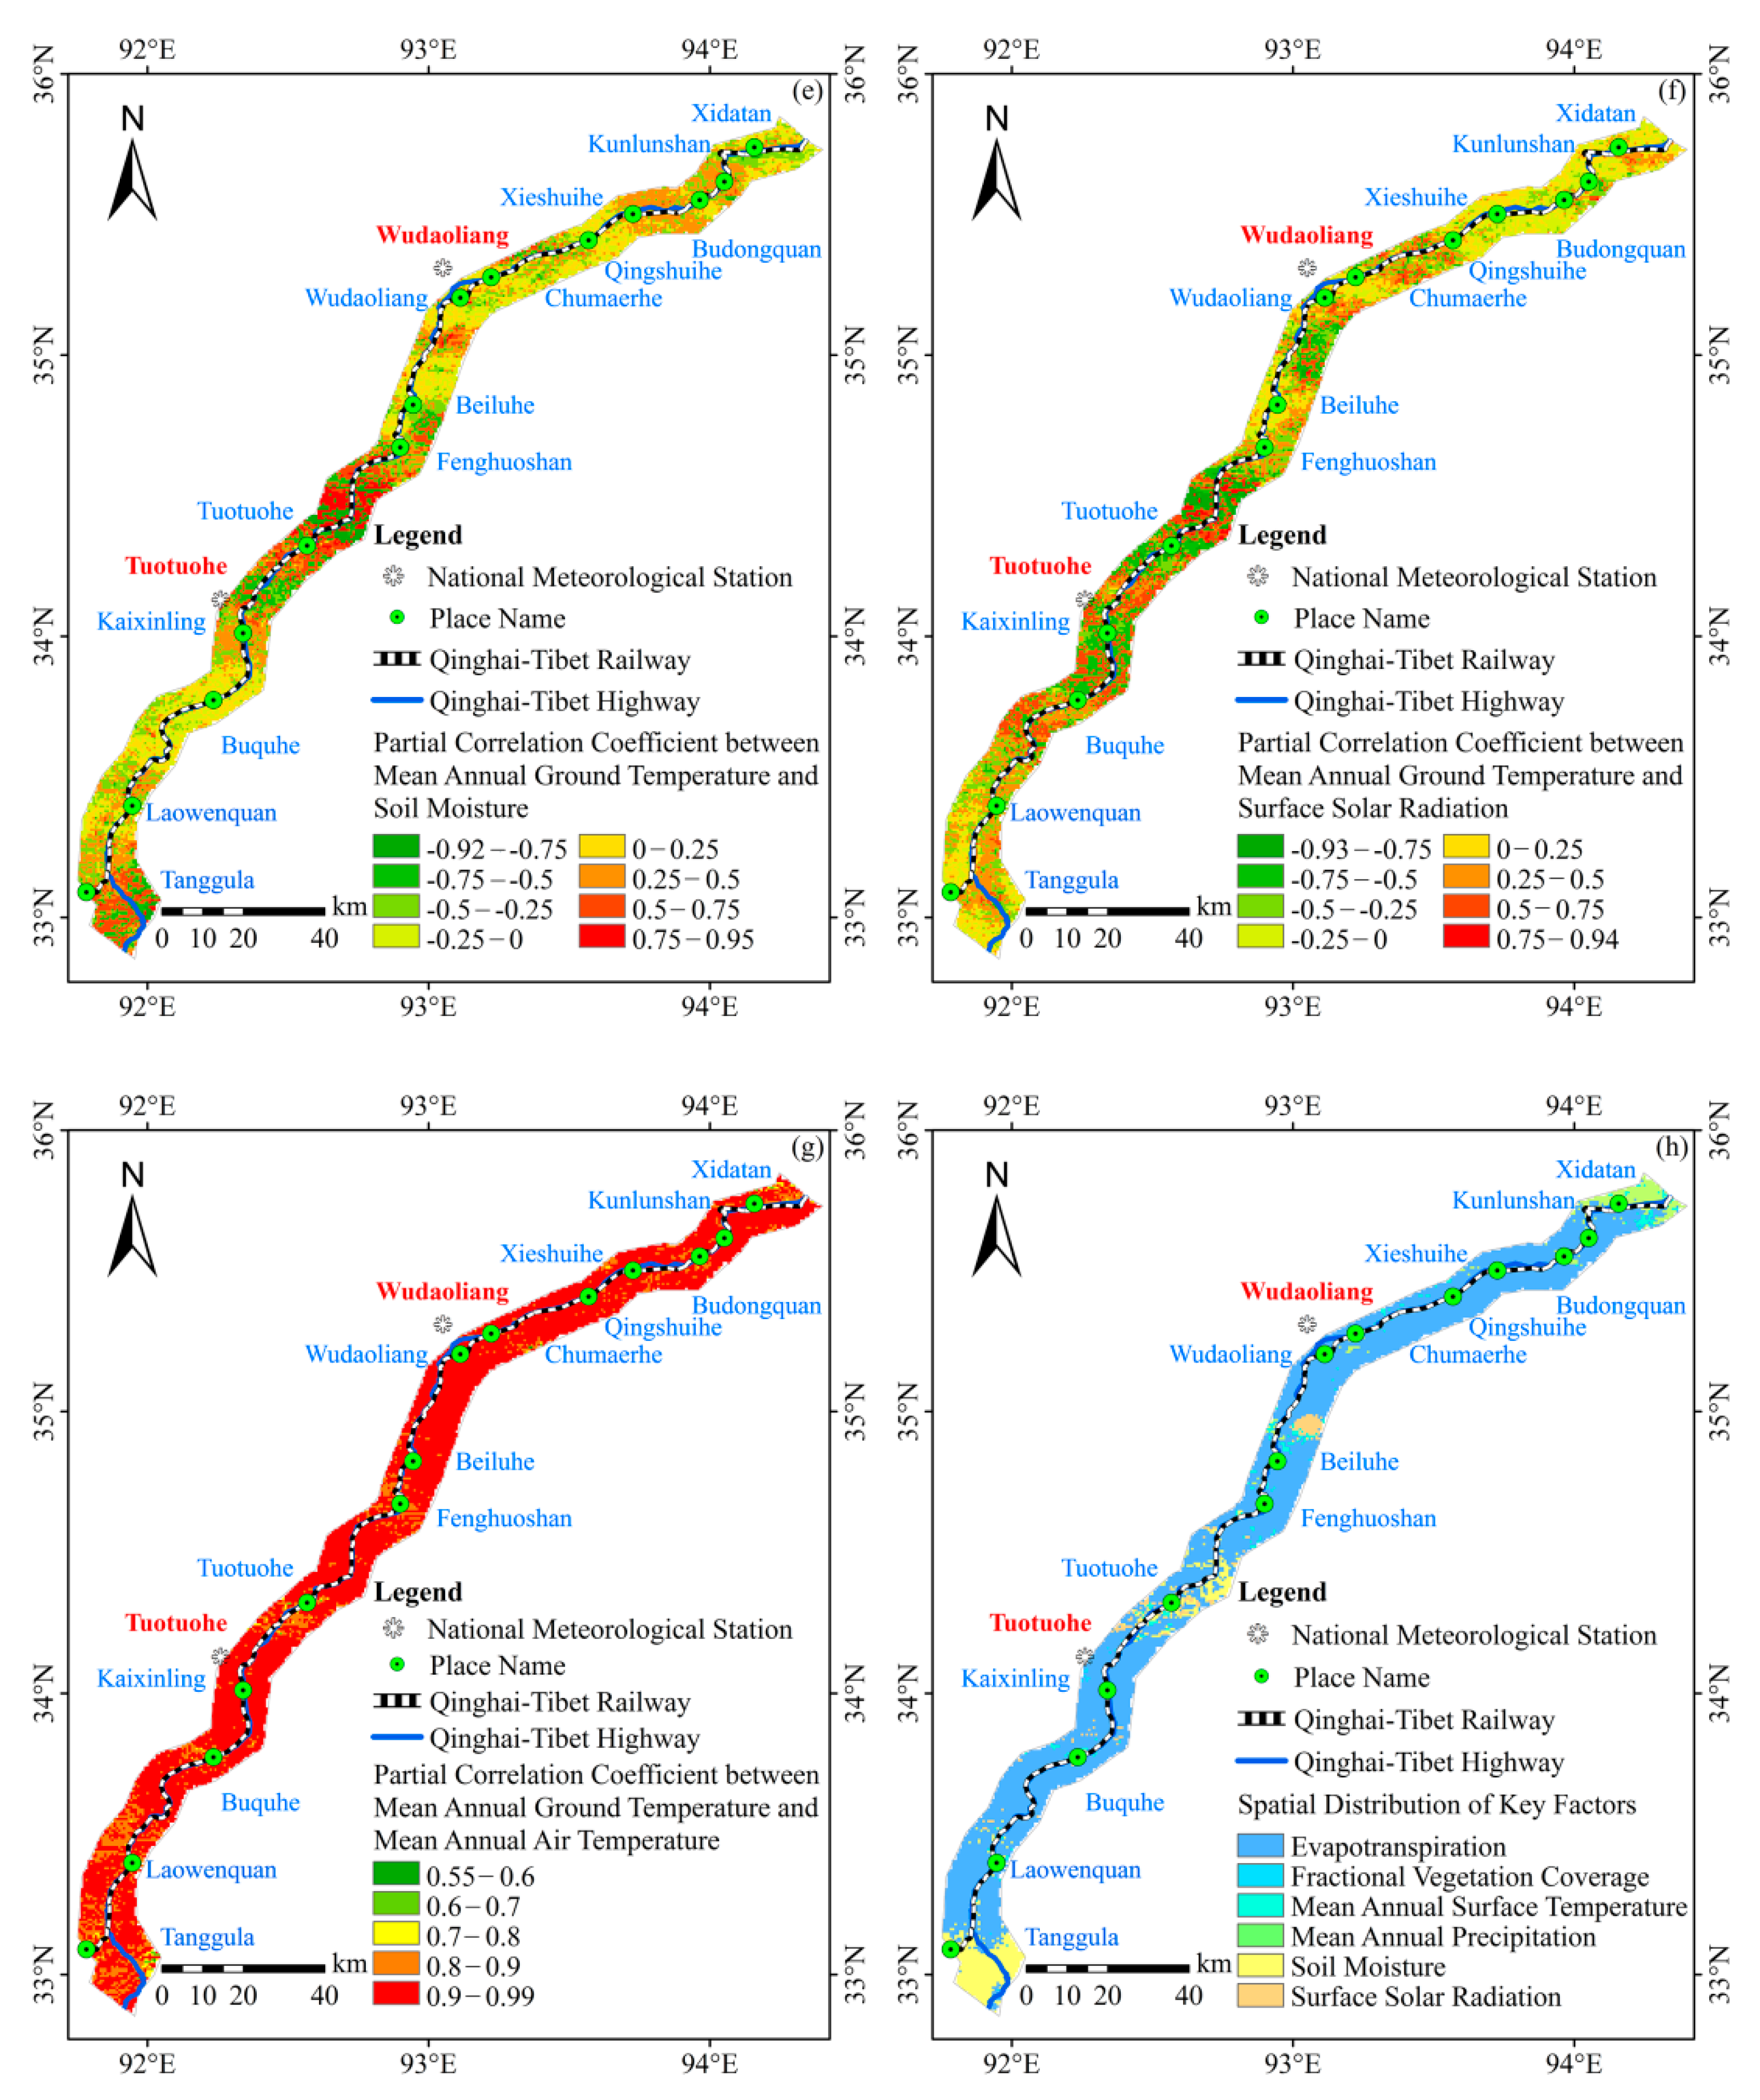
SM, a risk factor of ecological environmental risk, was also affected by other risk factors to varying degrees. Therefore, the factor with the maximum absolute value of the partial correlation coefficient on the pixel was selected as the main risk factor. It can be seen, from Figure 12f, that, in the entire study area, ET, FVC, MAP, SR and MAAT affected 43.30%, 0.31%, 45.67%, 9.04% and 1.67% of the area, respectively. Therefore, the influence degree of each influencing factor on soil moisture in the study area was expressed as MAP > ET > SR > MAAT > FVC, indicating that MAP and ET were the main influencing factors of MAP in the study area from 2003 to 2016.

4.2.4. Driving Factor Analysis of ABC

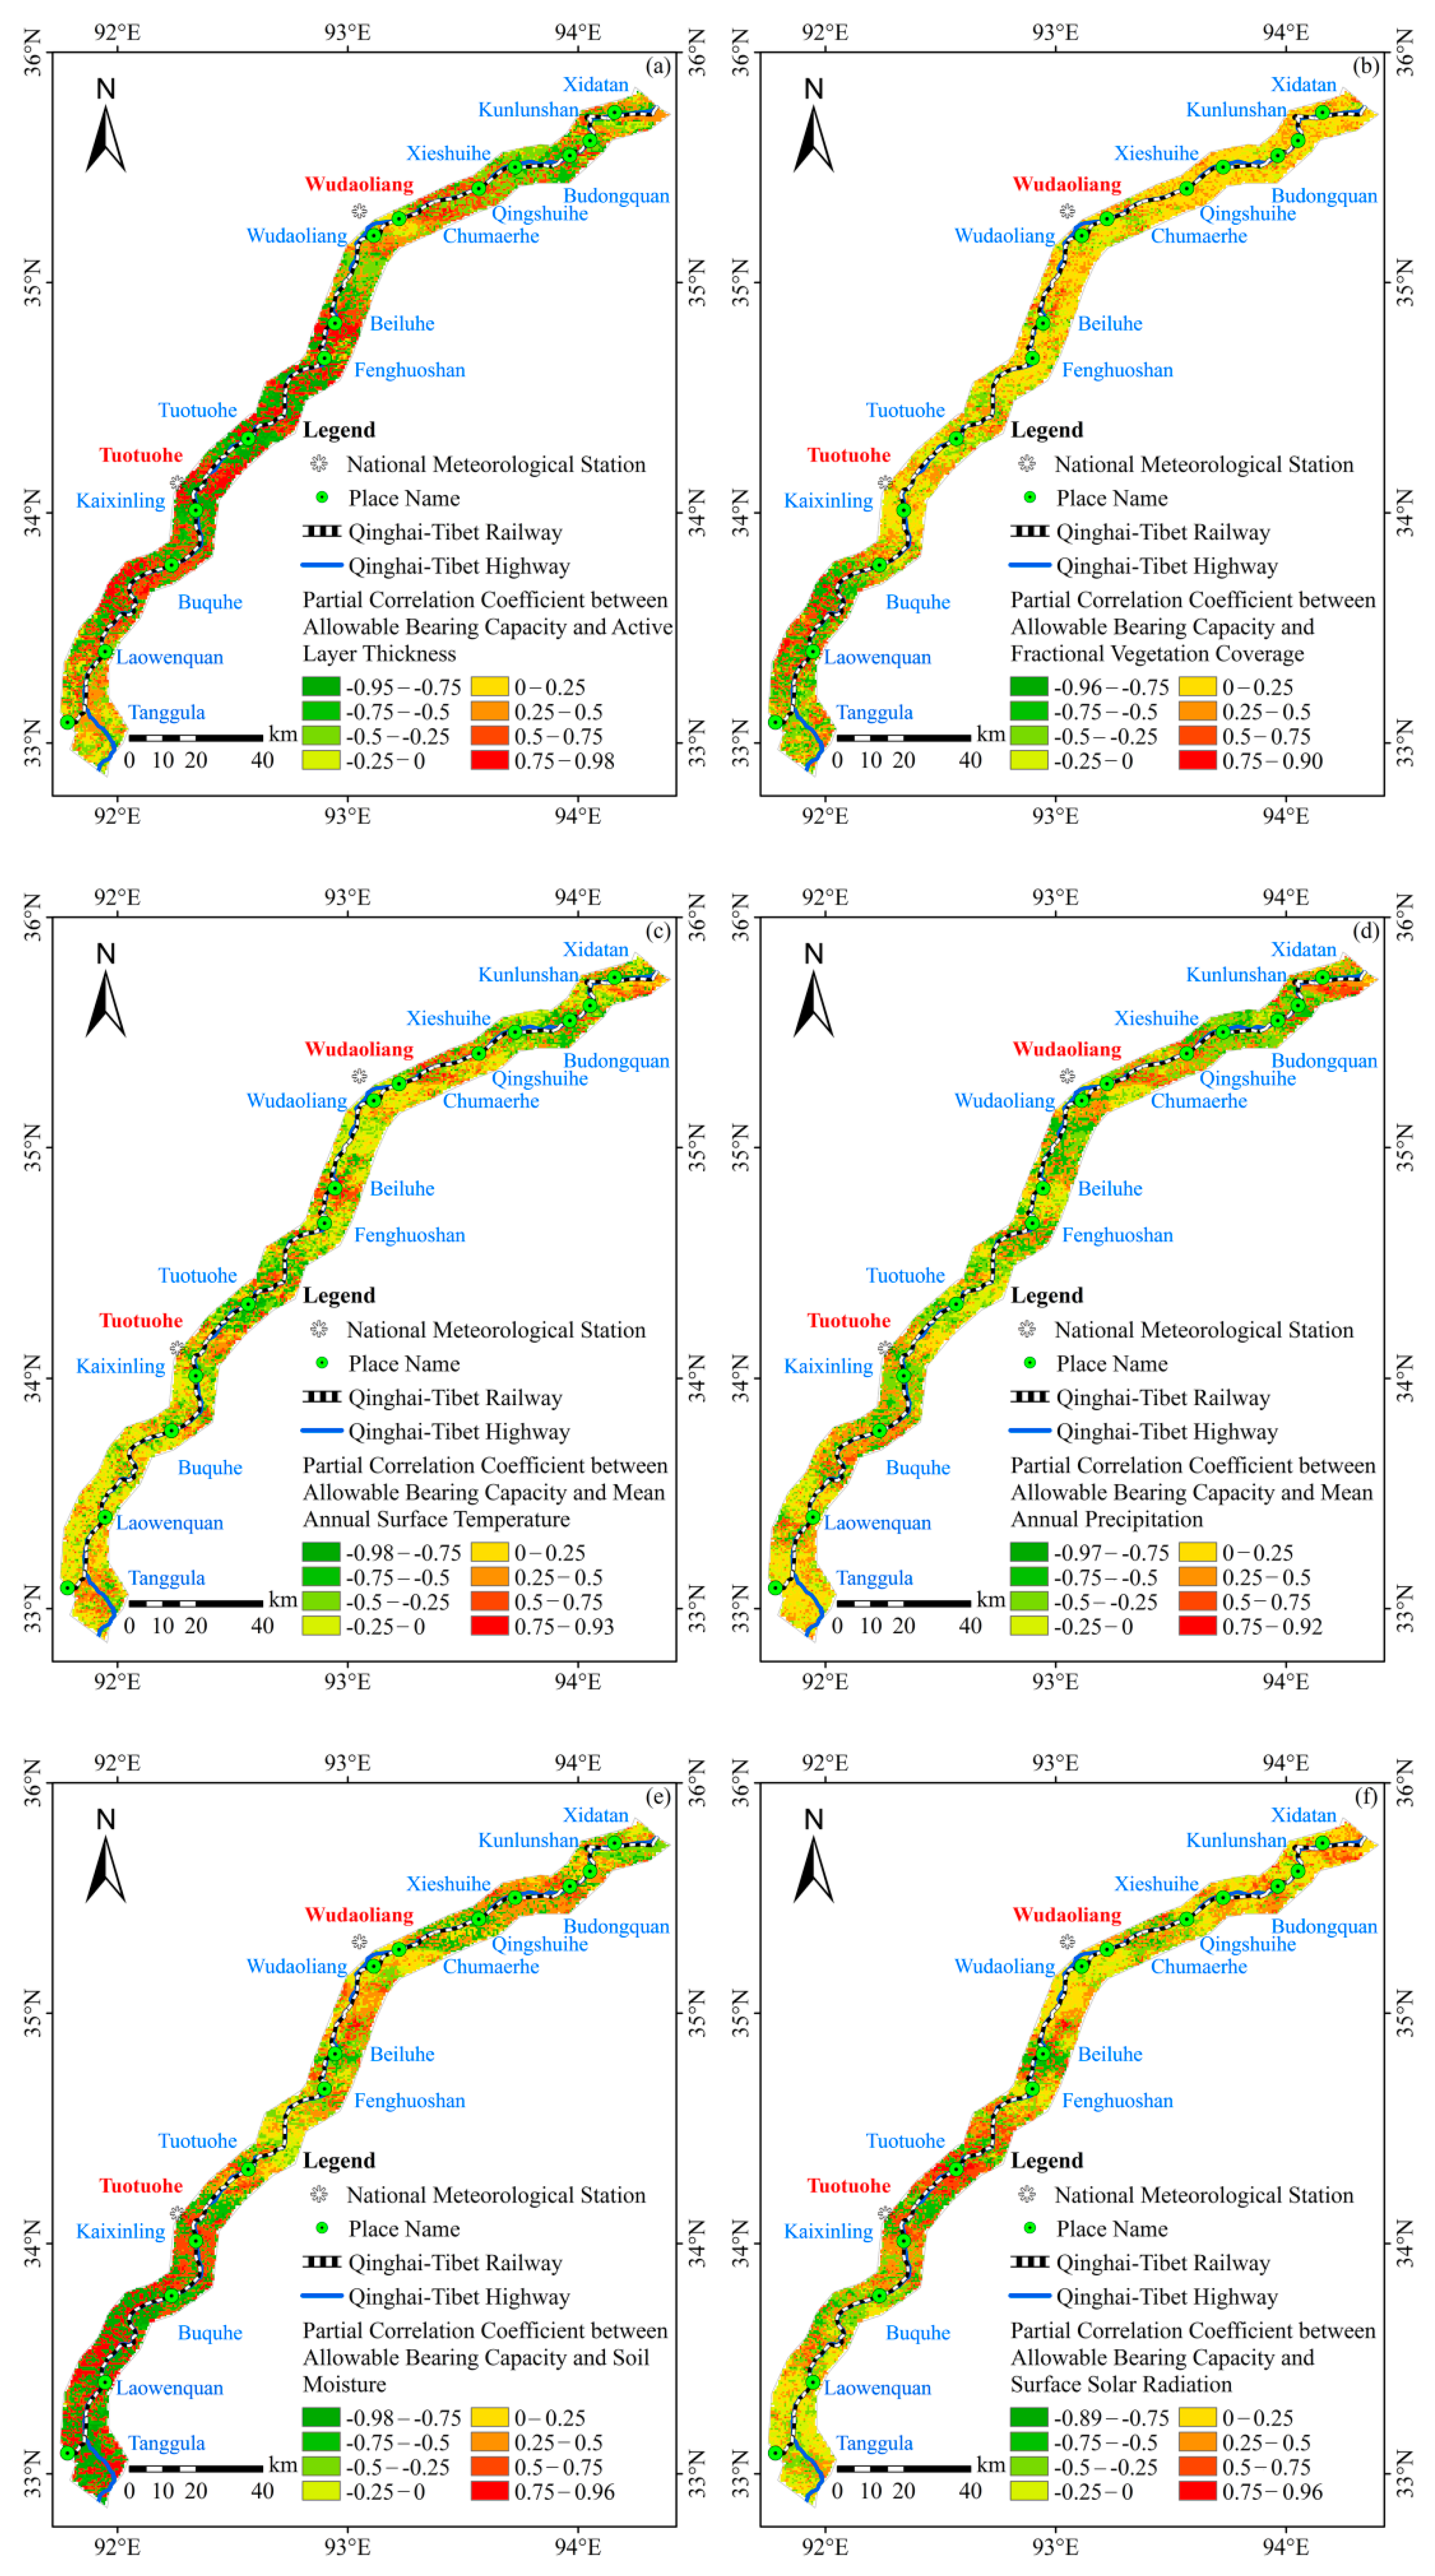
The partial correlation between ABC and ALT, FVC, LST, MAP, SM, SR and MAAT in the study area from 2003 to 2016 was analyzed. The spatial distribution characteristics are shown in Figure 13 and the spatial analysis results are shown in the Supplementary Materials (Table S10).
ABC, a risk factor of permafrost environmental risk, was also affected by other risk factors to varying degrees. Therefore, the same method was used to select the main risk factors. Due to the high correlation between ABC and MAAT, the influence of other factors on ABC was analyzed after removing its influence. It can be seen, from Figure 13, that, in the entire study area, ALT, FVC, LST, MAP, SM and SR affected 45.88%, 0.88%, 5.25%, 13.35%, 32.76% and 1.89% of the area, respectively. Therefore, the influence degree of each influencing factor on soil moisture in the study area was expressed as ALT > SM > MAP > LST > SR > FVC, indicating that MAAT, ALT, SM and MAP were the main influencing factors of ABC in the study area from 2003 to 2016.

4.2.5. Driving Factor Analysis of ALT

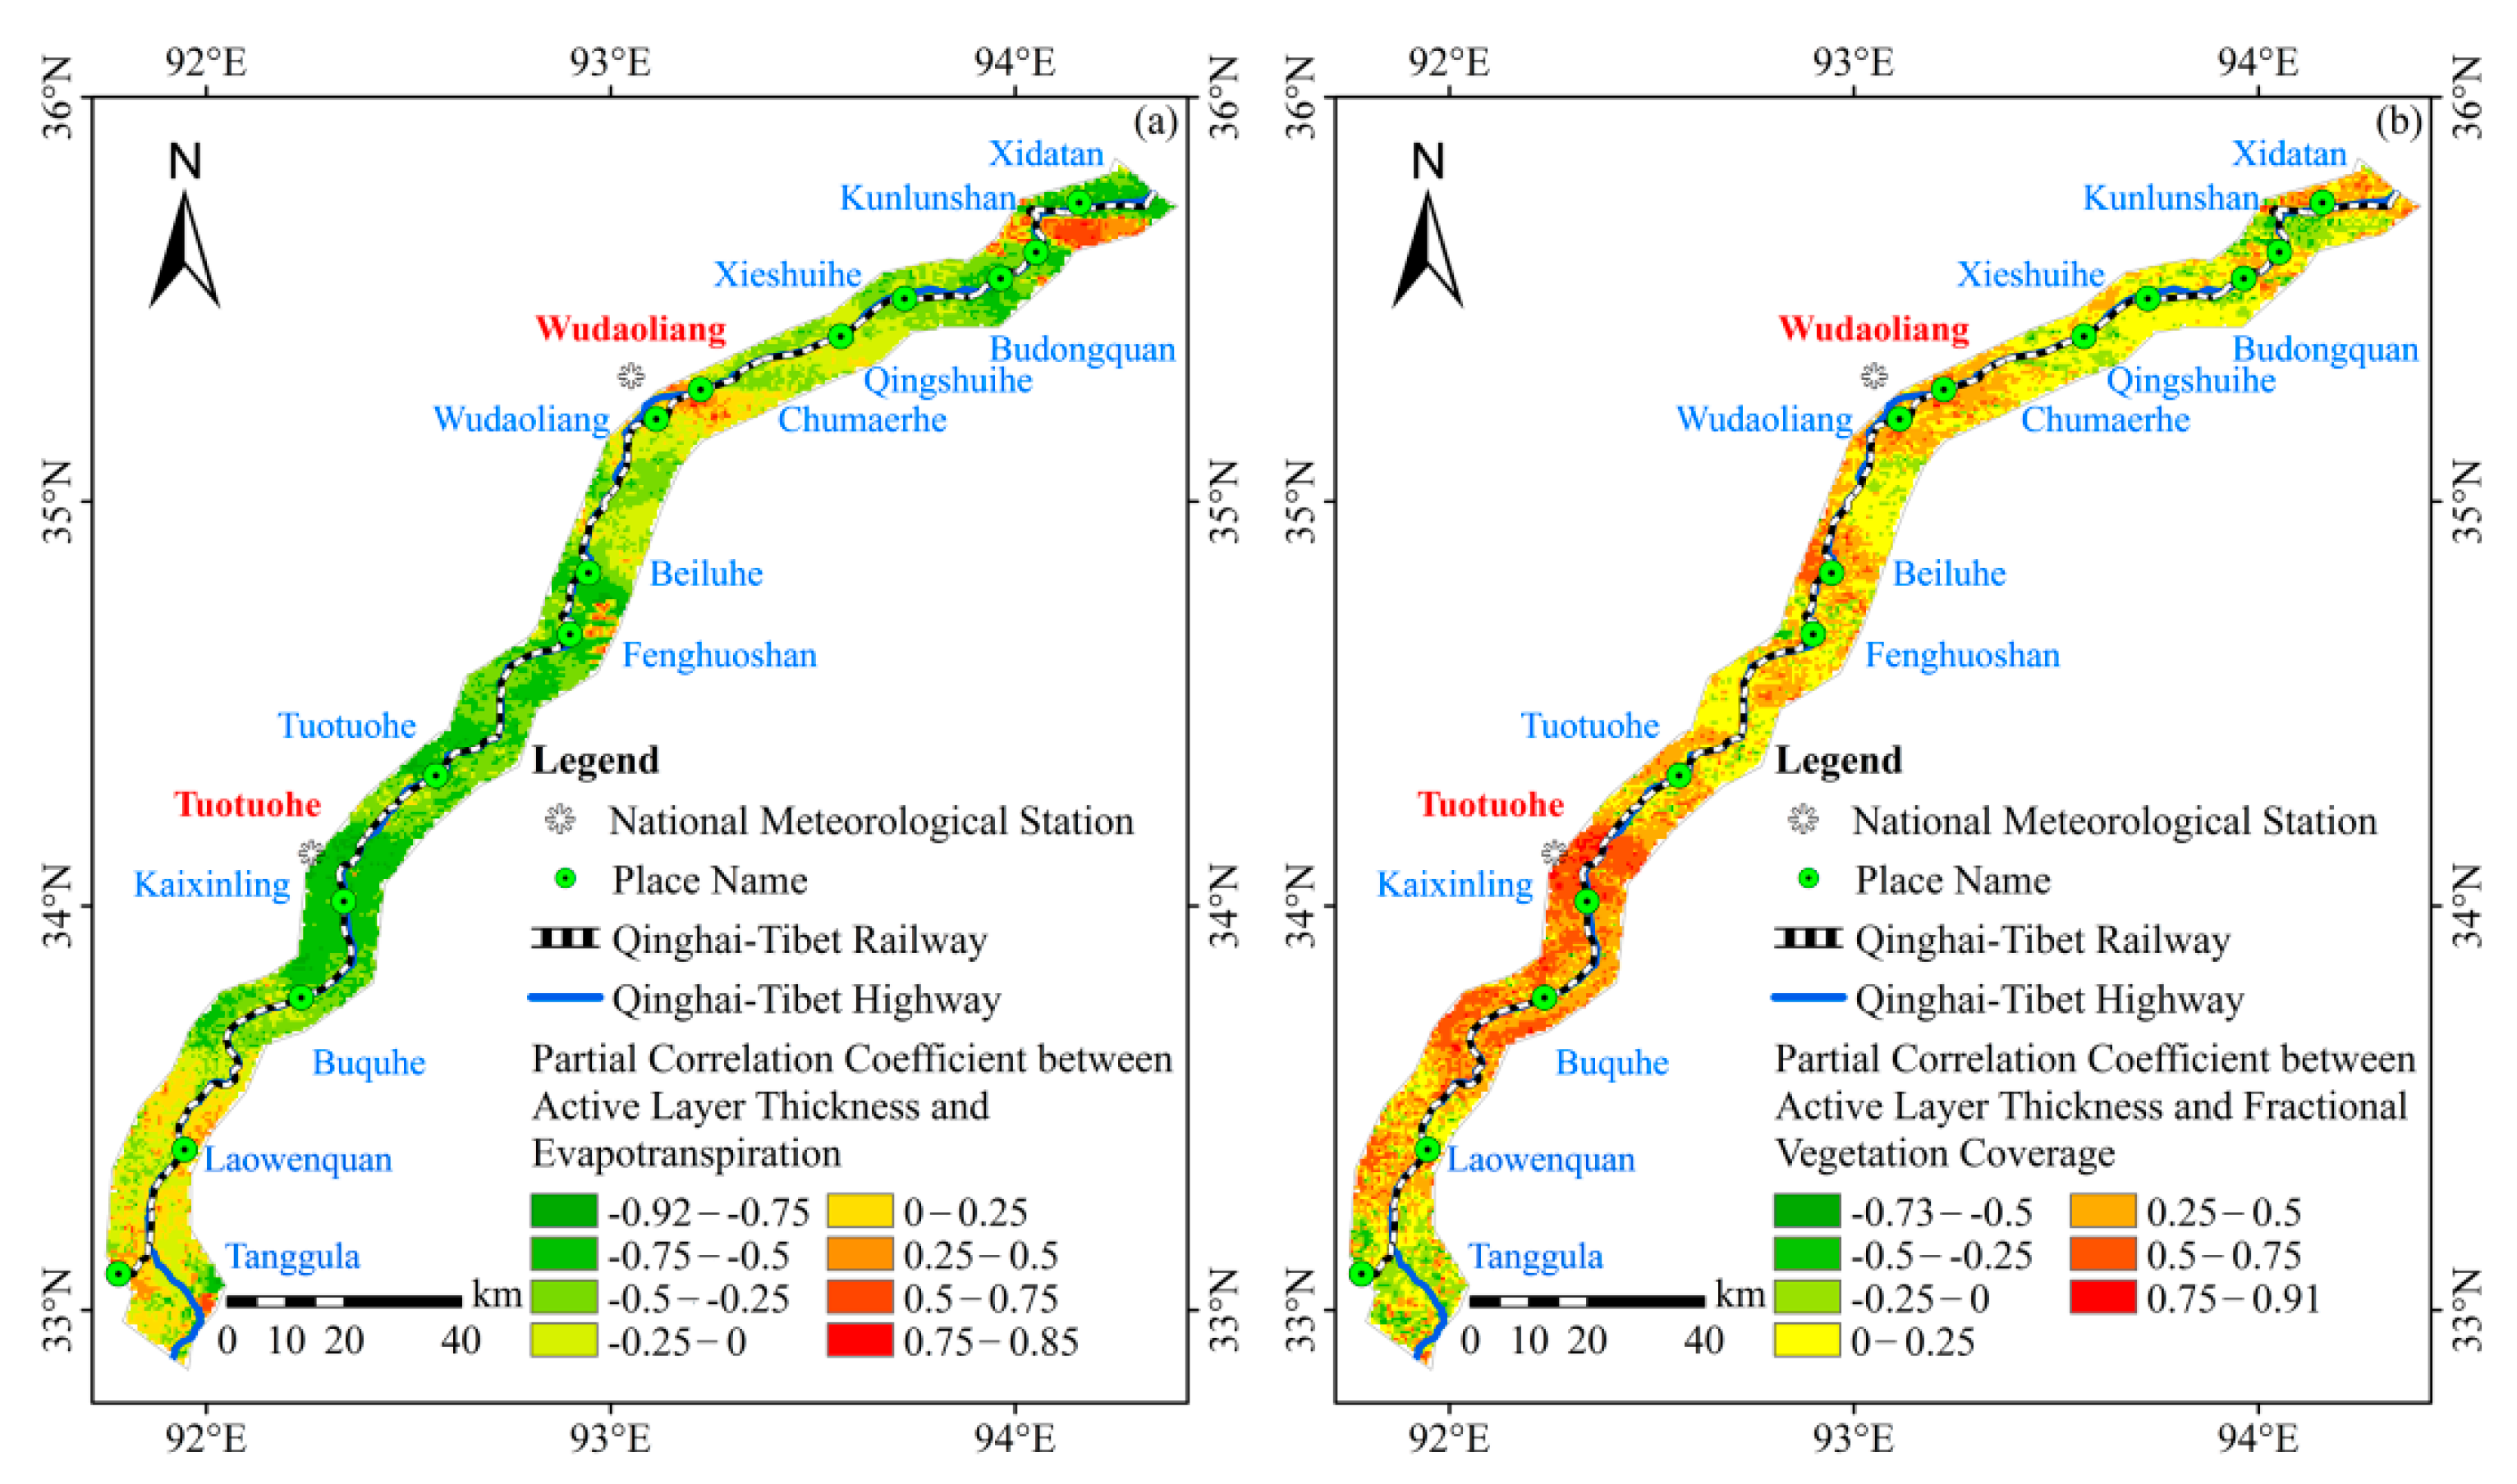
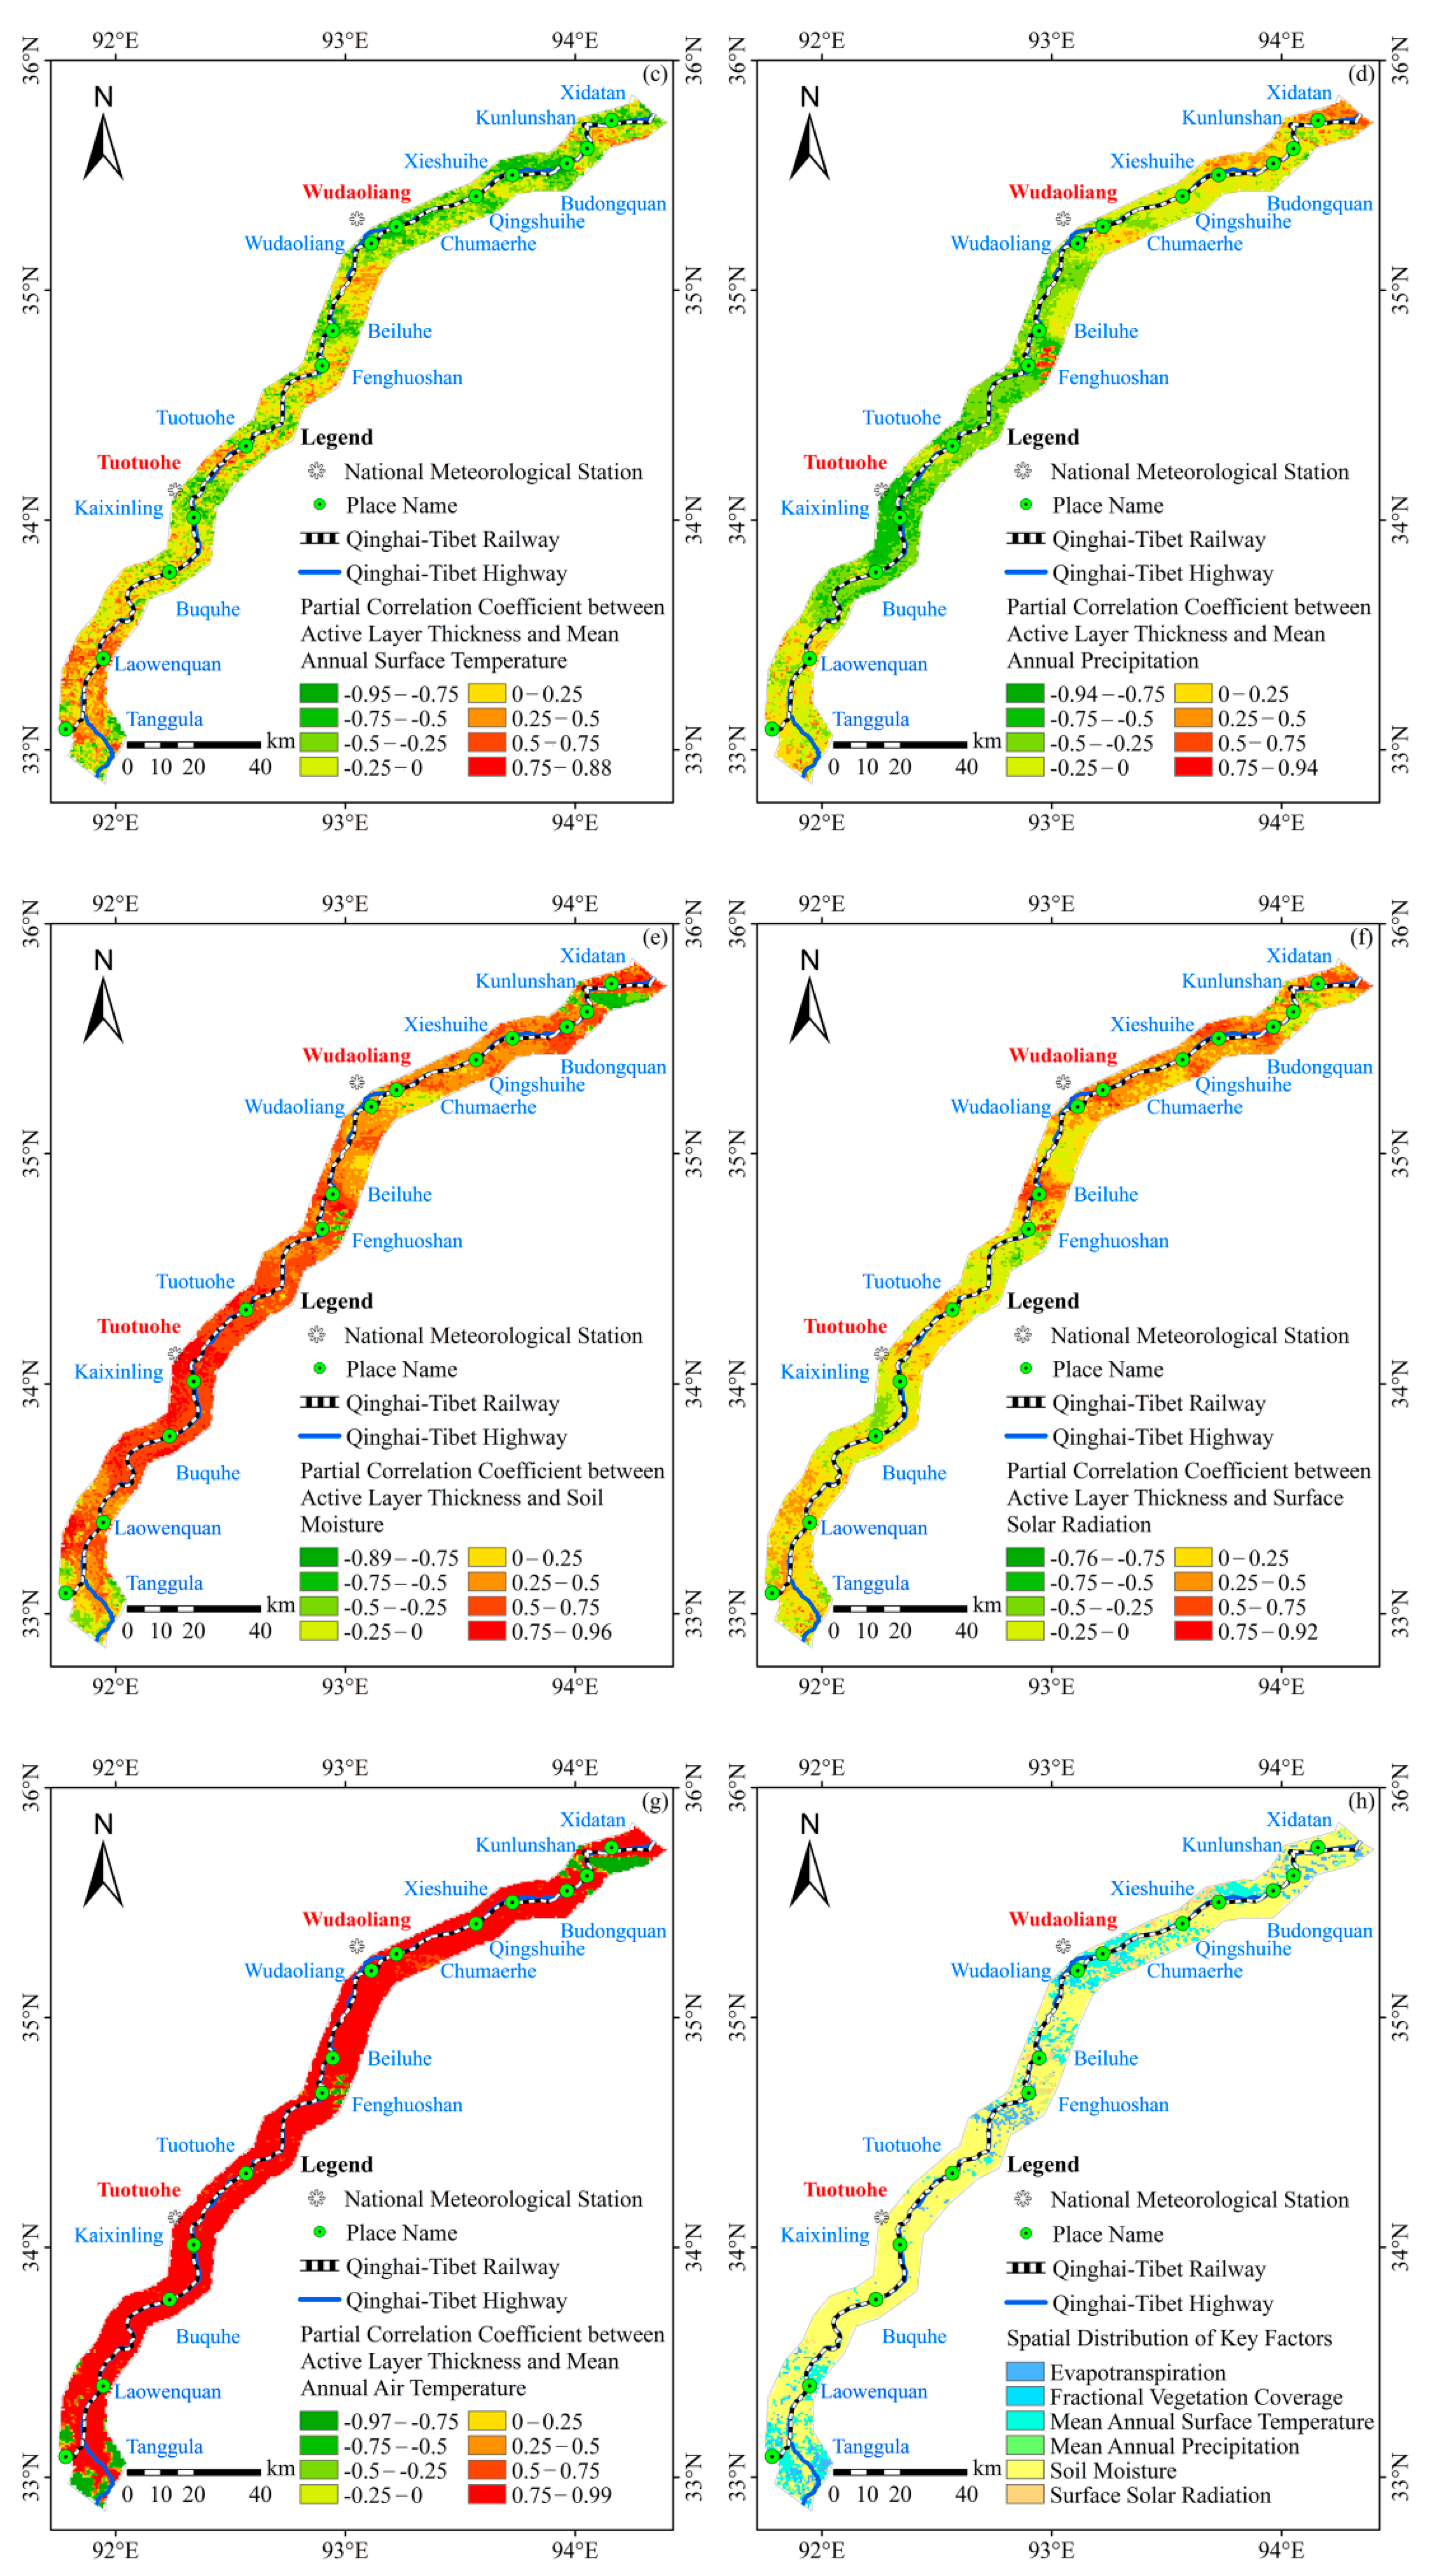
The correlation between the ALT and ET, FVC, MAST, MAP, SM, SR and MAAT in the study area from 2003 to 2016 was analyzed. The spatial distribution characteristics are shown in Figure 14 and the spatial analysis results are shown in the Supplementary Materials (Table S11).
ALT, a risk factor of permafrost environmental risk, was also affected by other risk factors to varying degrees. Therefore, the same method was used to select the main risk factors. Due to the high correlation between ALT and MAAT, the influence of other factors on ALT was analyzed after removing its influence. It can be seen, from Figure 14h, that, in the entire study area, ET, FVC, MAST, MAP, SM and SR affected 4.95%, 3.01%, 14.35%, 1.24%, 71.87% and 4.58% of the area, respectively. Therefore, the influence degree of each influencing factor on soil moisture in the study area was expressed as SM > MAST > ET > SR > FVC > MAP, indicating that MAAT, SM and MAST were the main influencing factors of ALT in the study area from 2003 to 2016.

4.2.6. Driving Factor Analysis of MAGT

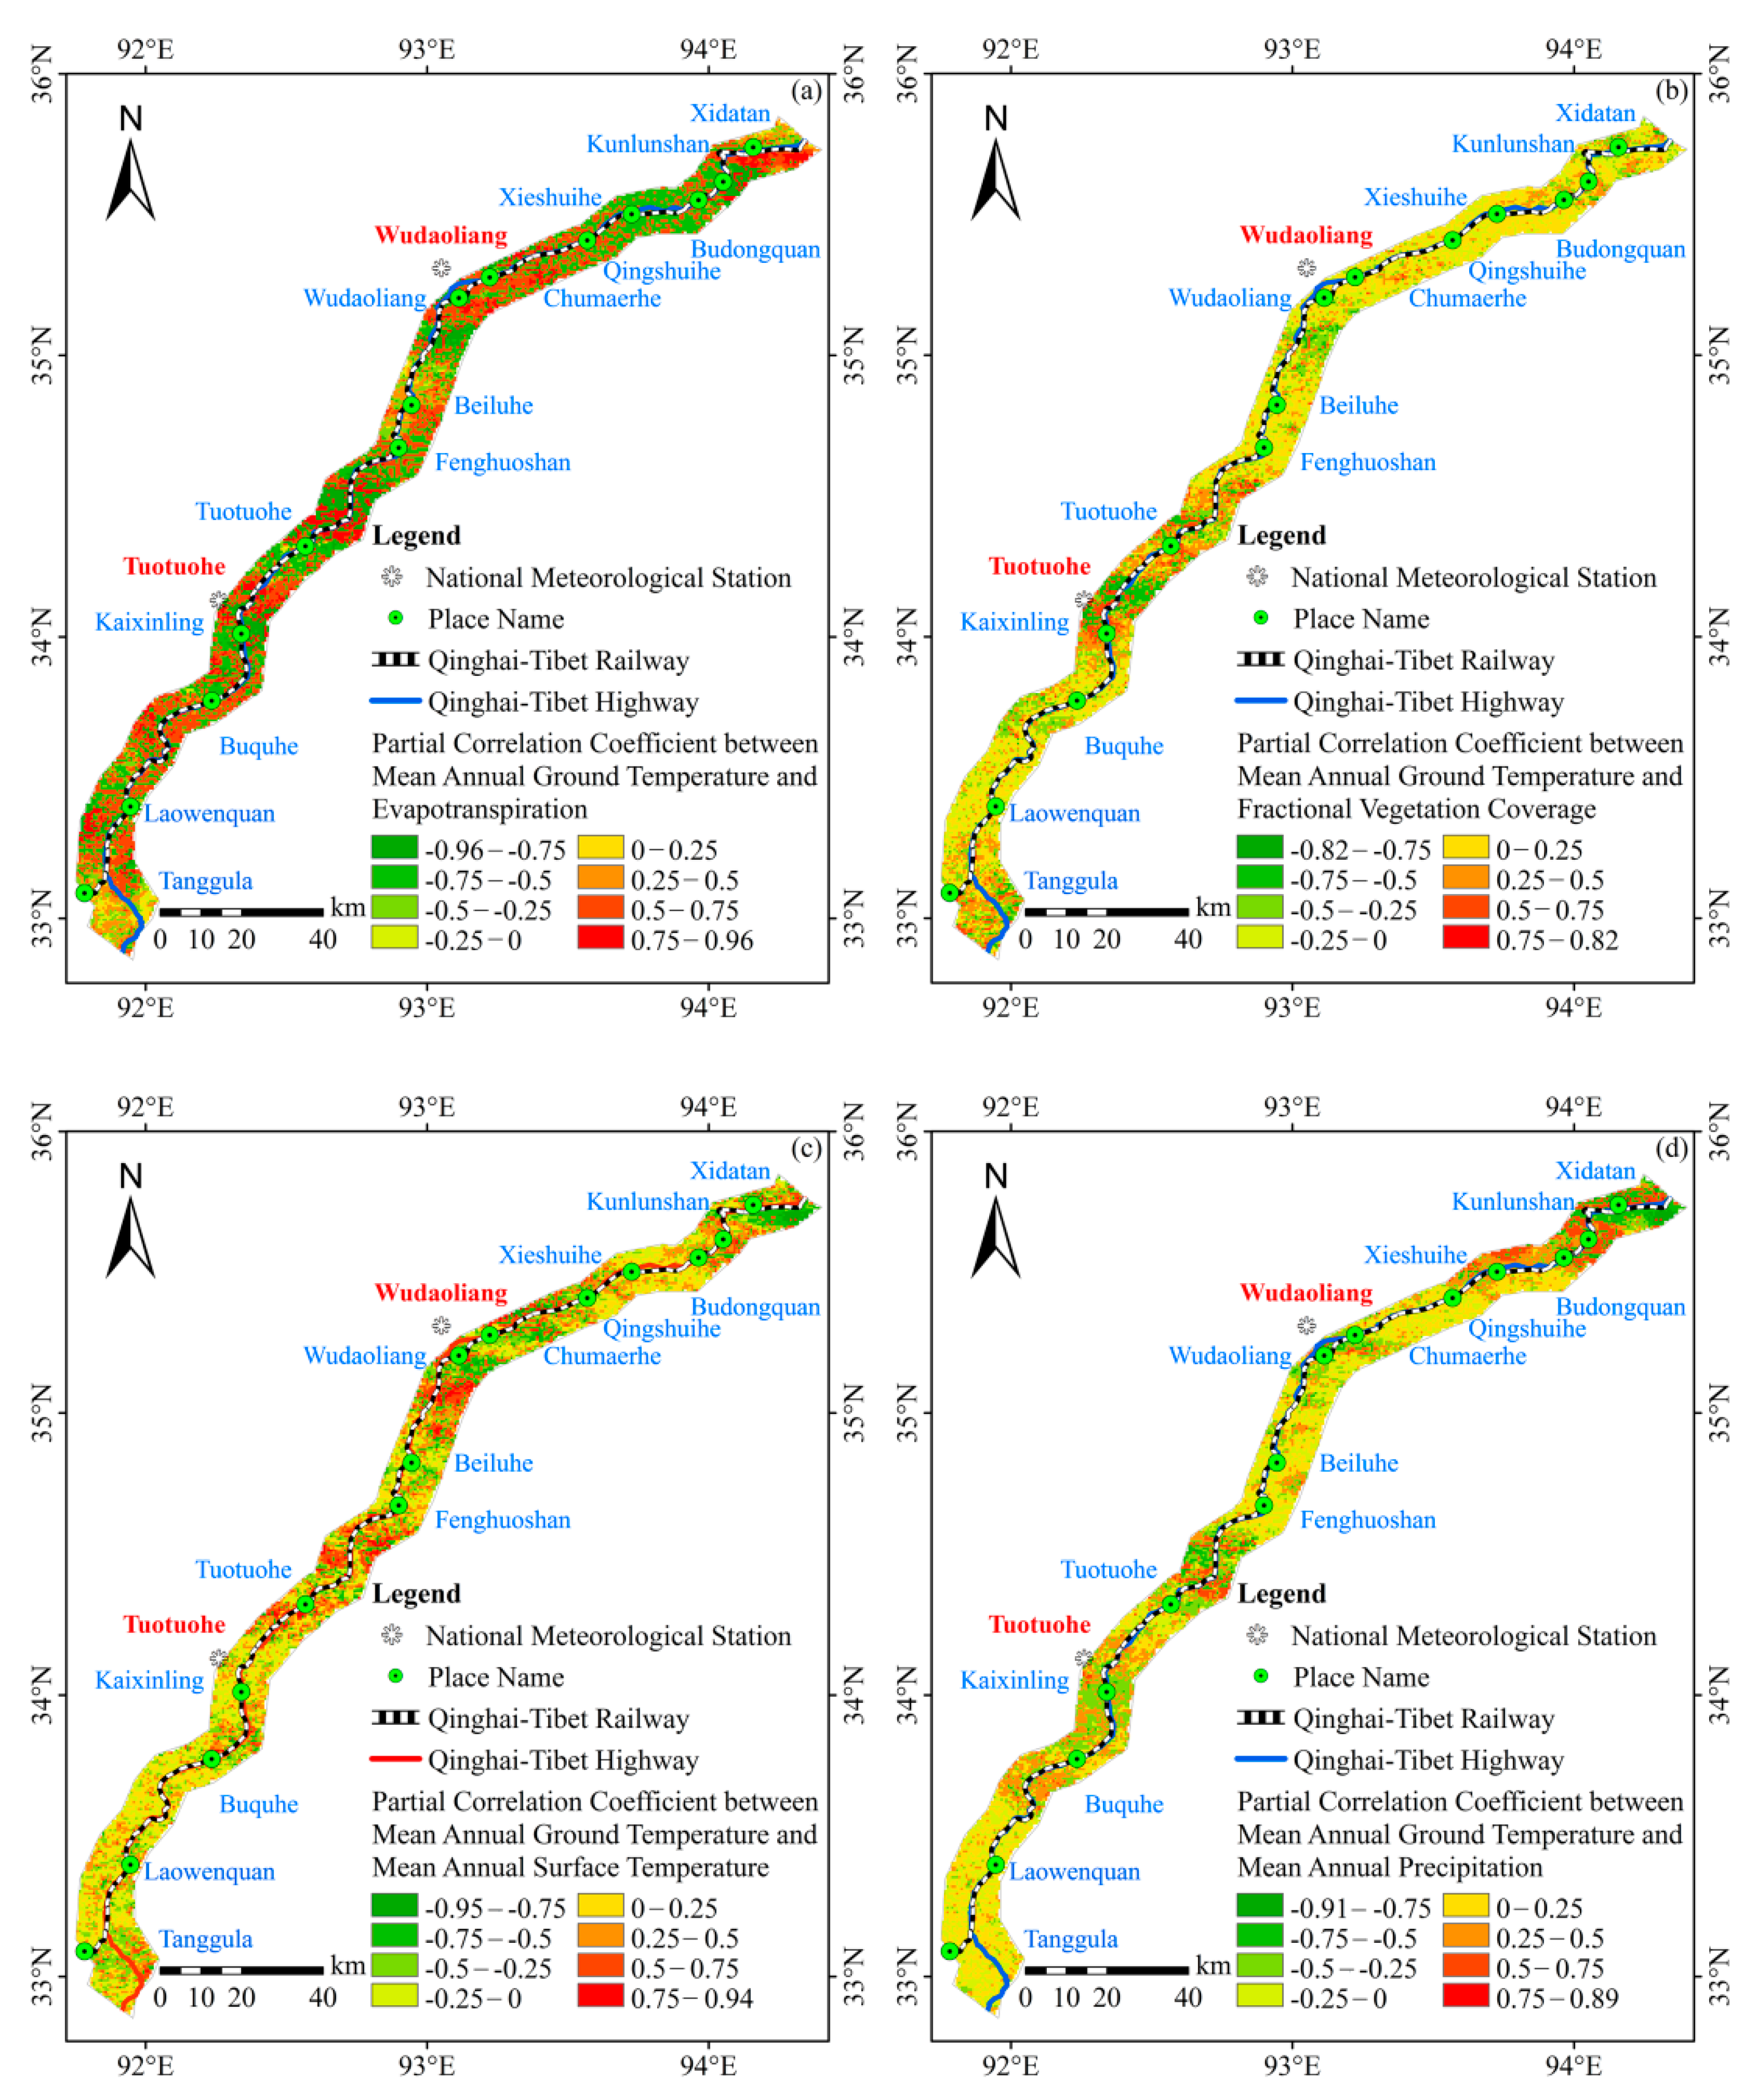
The correlation between the MAGT and ET, FVC, MAST, MAP, SM, SR and MAAT in the study area from 2003 to 2016 was analyzed. The spatial distribution characteristics are shown in Figure 15 and the spatial analysis results are shown in the Supplementary Materials (Table S12).
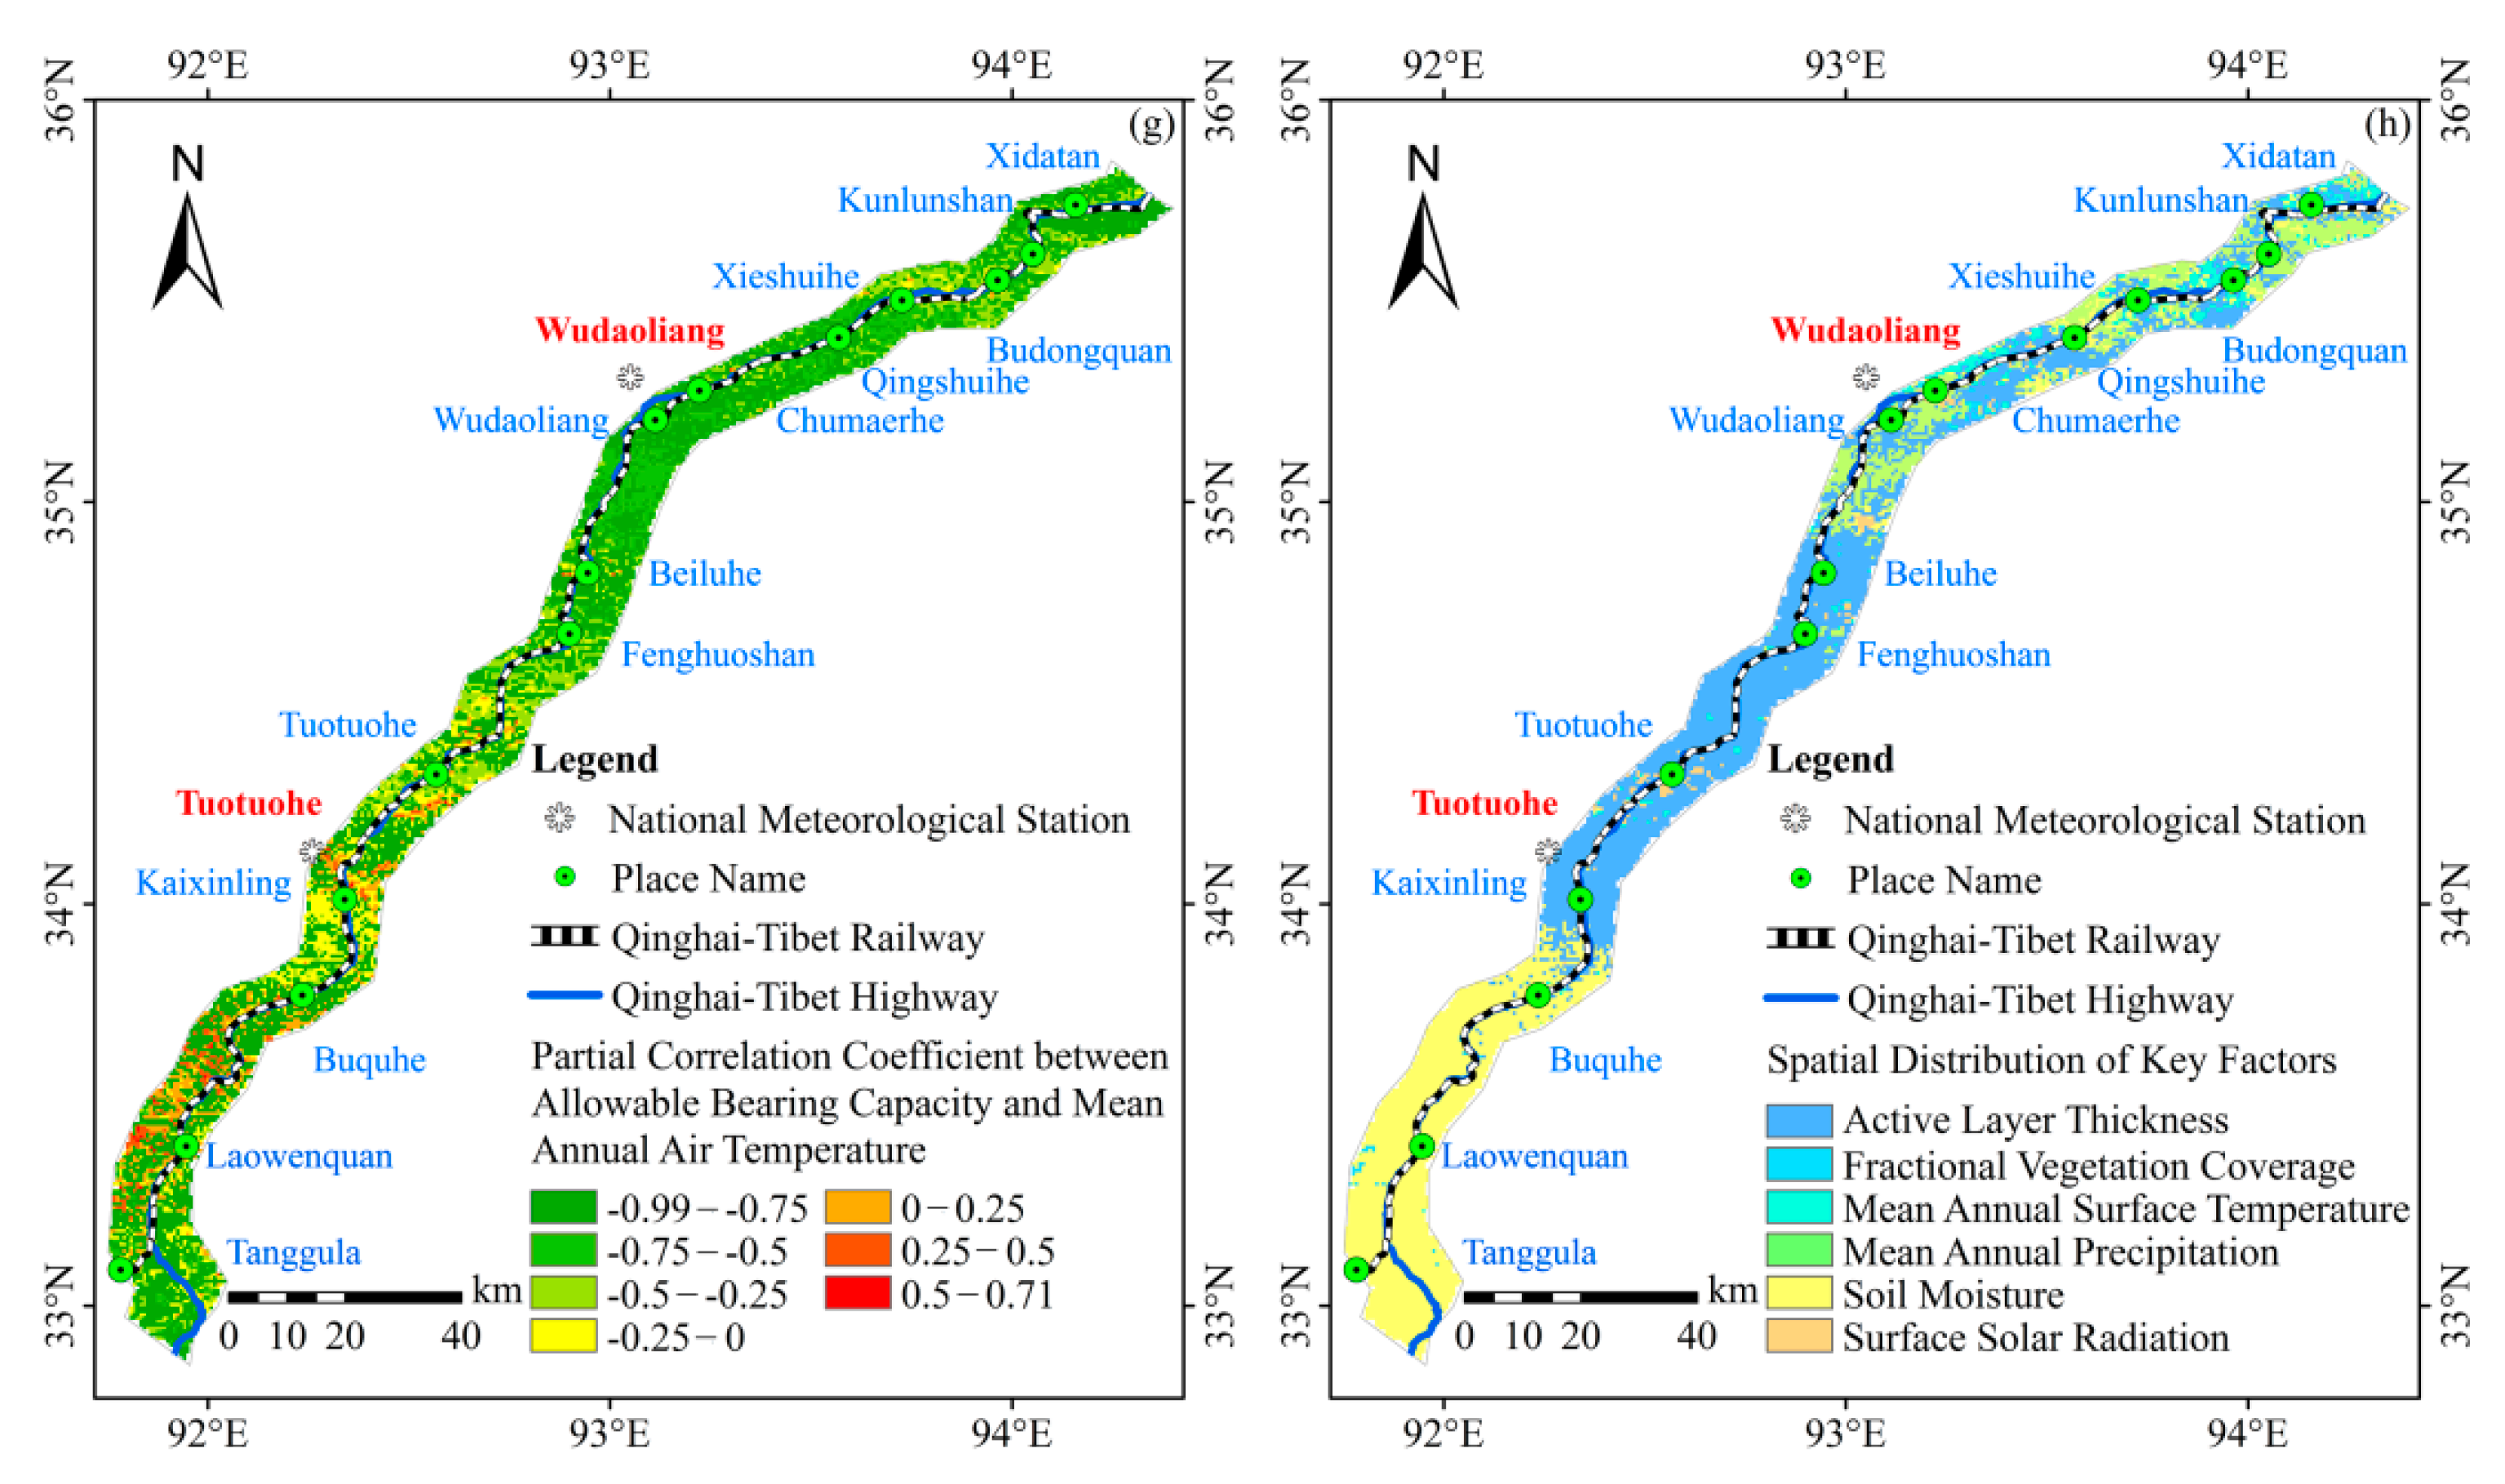
MAGT, a risk factor of permafrost environmental risk, was also affected by other risk factors to varying degrees. Therefore, the same method was used to select the main risk factors. Due to the high correlation between MAGT and MAAT, the influence of other factors on MAGT was analyzed after removing its influence. It can be seen, from Figure 15h, that, in the entire study area, ET, FVC, MAST, MAP, SM and SR affected 82.36%, 0.27%, 2.50%, 3.75%, 8.66% and 2.46% of the area, respectively. Therefore, the influence degree of each influencing factor on soil moisture in the study area was expressed as ET > SM > MAP > SR > MAST > FVC, indicating that MAAT and ET were the main influencing factors of MAGT in the study area from 2003 to 2016.

4.2.7. Driving Factor Analysis of MAST

The correlation between the MAST and ET, FVC, MAP, SM, SR and MAAT in the study area from 2003 to 2016 was analyzed. The spatial distribution characteristics are shown in Figure 16 and the spatial analysis results are shown in the Supplementary Materials (Table S13).
MAST, a risk factor of permafrost environmental risk, was also affected by other risk factors to varying degrees. Therefore, the same method was used to select the main risk factors. It can be seen, from Figure 16g, that, in the entire study area, ET, FVC, MAP, SM, SR and MAAT affected 4.42%, 5.35%, 53.76%, 4.68%, 6.56% and 25.24% of the area, respectively. Therefore, the influence degree of each influencing factor on fractional vegetation coverage in the study area was expressed as MAP > MAAT > SR > FVC > SM > ET, indicating that MAP and MAAT were the main influencing factors of MAST in the study area from 2003 to 2017.

4.2.8. Driving Factor Analysis of Thermokarst Lake

The lake area (>1 km2) in the study area in 2005, 2010 and 2015 was selected for a correlation analysis with ALT, ET, MAST, MAP, SM and MAAT at the corresponding time. The results are shown in Table 7. Lake area changes were positively correlated with ALT, ET, MAST and MAP and negatively correlated with SM and MAAT. The factors showing significant correlation were ALT, MAP and SM. According to the absolute value of the partial correlation coefficient, the influence degree of each influencing factor was as follows: MAP > ALT > SM > MAST > ET > MAST. It could be concluded that MAP, ALT, SM and MAST were the most important factors of lake area in the study area from 2003 to 2016.

5. Discussion

Under the influence of climate change and human activities, the engineering environment in the cold region is a complex, open and dynamic risk system and the system has multiple input and output variables. The exchanges of material and energy, constantly occurring over time in the atmosphere–infrastructure–permafrost system, are affected by many factors (Figure 2), so that the risk level of the system is always in a dynamic state, which not only increases the risk of the system, but also reduces the safety, stability and service performance of the project in the environment [101].
Traditional risk identification methods are mainly divided into the expert investigation method and decomposition analysis method [102,103]. Their applications are largely limited by the following points: (i) it is easy to miss potential risks in changing risk factors; (ii) the expert investigation method is too one-sided and the cost is high; (iii) the decomposition analysis method can only simply list the risk factor matrix; (iv) the traditional method only looks at the risk of the system from a static perspective, which cannot reflect the dynamic nature of risk factors, that is, it simply combines the risks of each subsystem to analyze the risk of the whole system [104]. The SD is centered on the feedback process of the system, focuses on determining the relationship between the influencing factors of the system from the overall perspective, pays attention to the overall change behavior of the system and then analyzes the causal relationships among various factors. Therefore, this method can find various hidden risk factors in practical applications. Furthermore, the process of engineering environmental risk in cold regions constantly changes and progresses. When the accumulated energy exceeds the bearing capacity of the system as the risk continues to evolve, it inevitably leads to the continuous occurrence of freeze–thaw disasters in cold regions, which, in turn, causes engineering safety accidents. Using system dynamics to establish a risk identification model with causal relationships not only can reflect the complexity and dynamics of cold region engineering environmental risk systems but can also analyze the conductivity, derivative, complexity and dynamics of various factors [105]. At the same time, the model analyzes and identifies various risk factors from a macro perspective. Combined with the analysis of the influence degree of risk factors by partial correlation analysis, the risk system at any spatial scale can be further modified and analyzed. The SD regards the engineering environment as a system and divides it into different subsystems for analysis and research from the perspective of the whole. The combination of experts’ experience would be more conducive to our understanding of the engineering environment and other things and the system in which it is located can be more finely divided into multiple subsystems for analysis. Therefore, the combination of experts’ experience and SD can be used for overall understanding and detailed analysis of the system on a larger scale.
For the assessment of disasters caused by permafrost degradation, this is mainly divided into the qualitative evaluation of the environmental characteristics of permafrost engineering, focusing on the Qinghai–Tibet Plateau, and the use of different types of disaster risk index models to evaluate the disaster susceptibility on a large spatial–temporal scale [106,107]. The qualitative evaluation is based on the distribution characteristics of geological characteristic parameters such as permafrost type, MAGT, ALT, MAAT and soil type in different regions. The quantitative evaluation mostly adopts eight evaluation models [18,32,33,38,39,40,41,42,43,44,45,46,47]. The main risk factors of permafrost degradation considered in quantitative assessments are volume of ice content, active layer thickness and mean annual ground temperature. On this basis, according to the characteristics of the permafrost environment in different regions and the needs of analysis, different risk factors are added for analysis. From the current research study, it was found that, in the current risk analysis of environment disasters, only the risk factors were statically identified based on the relevant literature and the interactions between the risk factors were ignored.
In this paper, the method of system dynamics was used to identify the engineering environmental risk in cold regions (Figure 2) and the influence degree of each risk factor was analyzed by means of the partial correlation coefficient (Figure 10f, Figure 11f, Figure 12f, Figure 13h, Figure 14h, Figure 15h and Figure 16g; Table 7). According to the established risk identification model, the five main transmission paths of the engineering environmental risk system were analyzed and obtained, with the starting point of each transmission path being the climate change factor. Therefore, it could be inferred that the climate factor is the root factor in the transmission process of engineering environmental risk factors. According to the regional analysis and partial correlation analysis, it was found that the climate change factors affected the distribution characteristics of other dynamic risk factors in different static risk factor regions and that the climate change factors had a greater impact on the interaction degree of the dynamic risk factors. In general, there are still some shortcomings in this paper. (i) In order to keep the same resolution of remote sensing image data of various influencing factors, spatial interpolation was used in the process of basic data preprocessing, which made the accuracy of the calculation results of the partial correlation analysis among influencing factors have a certain deviation. (ii) The time limit for selecting influencing factors was short; follow-up work could expand the selection period of influencing factors and improve the accuracy of the partial correlation analysis. (iii) This paper used an empirical model to obtain basic data of some influencing factors and the accuracy of empirical models is affected by many parameters; therefore, follow-up work should strengthen the research and acquisition processes of the original data of the influencing factors. (iv) The engineering environment risk identification model for cold regions established in this paper was only analyzed by taking the QTEC as an example. However, the regional geological environments of permafrost in the world is quite different. Therefore, the research scope should be expanded in follow-up work and the risk identification model should be further revised according to the characteristics of the engineering environments in different regions.

6. Conclusions

In this paper, we present a novel method for the identification of engineering environmental hazards in cold regions and an engineering environmental risk identification model to dynamically identify the risk factors of engineering environmental hazards in the cryosphere. We successfully studied the environmental hazards in the QTEC. The following conclusions were drawn.
(1) The established model could describe the causal feedback relationships among the inter-influencing subsystems in the risk system, identify the interaction relationships among different risk factors and potential risks and clarify the structure of the whole system. Moreover, the model not only could trace the root cause and intermediate factors of a certain risk, but could also analyze the direct and indirect consequences, as well as forming the transmission path of the risk. The model identified five types of parallel risk paths in the QTEC.
(2) The static risk factors (elevation, slope, aspect, RDLS and VIC) were divided into different regions according to different classification standards and the spatial distribution characteristics of the dynamic risk in different regions were analyzed. In the areas with elevation below 4200 m and above 6000 m, the climatic factors mainly affected the spatial characteristics of other risk factors. The influence of the climatic factors on other risk factors was not related to slope change, but the influence relationship was different in different slope areas. In the southeastern, western and northwestern regions, the climatic factors mainly affected the spatial distributions of other risk factors. In the plain and moderate-relief mountain regions, the climatic factors mainly affected the spatial changes of other risk factors. In the zones of talik, ice-poor permafrost and ice layer with soil, the climatic factors were the main reason.
(3) Climate warming leads to the degradation of permafrost, which has a great impact on the permafrost environment and ecological environment of the QTEC. In the permafrost environment, the MAAT had a strong correlation with ALT and MAGT and the influence degree was significant; in 25.24% and 53.76% of the regions, the changes in MAST were affected by MAAT and MAP, respectively. In the ecological environment, the changes in ET in 11.80% and 12.46% of the regions were affected by MAAT and MAP, the changes in FVC in 45.09% of the regions were affected by SR, the changes in SM in 45.67% of the regions were affected by MAP and the ecological environment factors in other regions affected each other.
(4) Climate change and human activities have a significant influence on the allowable bearing capacity of permafrost in the study area, which further affects the stability of infrastructures. The dynamic risk drivers for the allowable bearing capacity were MAAT (strong correlation), ALT (45.88%) and SM (32.76%).
(5) Climate warming leads to the melting of underground ice and then forms thermokarst lakes of different sizes on the surface, which induces a variety of thermal thawing disasters and affects the safety of infrastructures. The area change of thermokarst lakes in the Corridor was affected by MAP (0.533), ALT (0.492), SM (−0.467) and MAST (0.417) and was significantly correlated with the first three factors.
Based on the above research results, follow-up work should carry out relevant engineering environmental risk identification and analysis in the Qinghai Tibet Plateau, Northeast China and the Arctic on a large scale according to the accuracy of remote sensing data.
Supplementary Materials

The following supporting information can be downloaded at: https://www.mdpi.com/article/10.3390/rs14040908/s1, Table S1: Data Information, Table S2: Response relationship between elevation and risk factors, Table S3: Response relationship between slope and risk factors, Table S4: Response relationship between aspect and risk factors, Table S5: Response relationship between RDLS and risk factors, Table S6: Response relationship between VIC and risk factors, Table S7: Response relationship between ET and influencing factors, Table S8: Response relationship between FVC and influencing factors, Table S9: Response relationship between SM and influencing factors, Table S10: Response relationship between ABC and influencing factors, Table S11: Response relationship between ALT and influencing factors, Table S12: Response relationship between MAGT and influencing factors, Table S13: Response relationship between MAST and influencing factors.

Author Contributions

Conceptualization, T.Z. and W.Y.; data curation, Y.L. and L.C.; formal analysis, T.Z.; funding acquisition, Y.L. and L.C.; investigation, Y.L. and L.C.; methodology, T.Z.; project administration, W.Y., Y.L. and L.C.; resources, Y.L. and L.C.; software, T.Z.; visualization, T.Z.; writing—original draft, T.Z.; writing—review and editing, W.Y. All authors have read and agreed to the published version of the manuscript.

Funding

This work was supported by the National Natural Science Foundation of China (42001069), State Key Laboratory of Frozen Soil Engineering (SKLFSE-ZQ-202101) and the Foundation for Excellent Youth Scholars of NIEER, CAS (FEYS2019007).

Institutional Review Board Statement

“Not applicable” for studies not involving humans or animals.

Informed Consent Statement

“Not applicable” for studies not involving humans.

Data Availability Statement

The data used in this study are available at http://www.gscloud.cn/ (accessed date: 18 November 2021), https://ladsweb.modaps.eosdis.nasa.gov/ (accessed date: 18 November 2021) and http://data.tpdc.ac.cn/zh-hans/ (accessed date: 18 November 2021).

Acknowledgments

We thank the anonymous reviewers for their insightful and constructive comments on this manuscript. We also thank the editor and the associate editor for their invaluable help on our manuscript.

Conflicts of Interest

The authors declare that they have no known competing financial interests or personal relationships that could have appeared to influence the work reported in this paper.

References

  1. Feldmann, J.; Levermann, A. Collapse of the West Antarctic Ice Sheet after local destabilization of the Amundsen Basin. Proc. Natl. Acad. Sci. USA 2015, 112, 14191–14196. [Google Scholar] [CrossRef] [PubMed] [Green Version]
  2. Rignot, E.; Mouginot, J.; Scheuchl, B.; Broeke, M.V.D.; van Wessem, M.; Morlighem, M. Four decades of Antarctic Ice Sheet mass balance from 1979–2017. Proc. Natl. Acad. Sci. USA 2019, 116, 1095–1103. [Google Scholar] [CrossRef] [Green Version]
  3. Roe, G.H.; Baker, G.H.R.M.B.; Herla, F. Centennial glacier retreat as categorical evidence of regional climate change. Nat. Geosci. 2016, 10, 95–99. [Google Scholar] [CrossRef]
  4. Li, Y.J.; Ding, Y.J.; Shangguan, D.H.; Wang, R.-J. Regional differences in global glacier retreat from 1980 to to 2015. Adv. Clim. Chang. Res. 2019, 10, 203–213. [Google Scholar] [CrossRef]
  5. Guo, D.; Wang, H. CMIP5 permafrost degradation projection:A comparison among different regions. J. Geophys. Res. Atmos. 2016, 121, 4499–4517. [Google Scholar] [CrossRef]
  6. Biskaborn, B.K.; Smith, S.L.; Noetzli, J.; Matthes, H.; Vieira, G.; Streletskiy, D.A.; Schoeneich, P.; Romanovsky, V.E.; Lewkowicz, A.G.; Abramov, A.; et al. Permafrost is warming at a global scale. Nat. Commun. 2019, 10, 264. [Google Scholar] [CrossRef] [PubMed] [Green Version]
  7. Plaza, C.; Pegoraro, E.; Bracho, R.; Celis, G.; Crummer, K.G.; Hutchings, J.A.; Hicks Pries, C.E.; Mauritz, M.; Natali, S.M.; Salmon, V.G.; et al. Direct observation of permafrost degradation and Rapid Soil carbon loss in tundra. Nat. Geosci. 2019, 12, 627–631. [Google Scholar] [CrossRef]
  8. Chen, L.; Yu, W.B.; Han, F.L.; Lu, Y.; Zhang, T.Q. Effects of desertification on permafrost environment in Qinghai-Tibetan Plateau. J. Environ. Manag. 2020, 262, 110302. [Google Scholar] [CrossRef]
  9. Hori, M.; Sugiura, K.; Kobayashi, K.; Aoki, T.; Tanikawa, T.; Kuchiki, K.; Niwano, M.; Enomoto, H. A 38-year (1978–2015) Northern Hemisphere daily snow cover extent product derived using consistent objective criteria from satellite-borne optical sensors. Remote Sens. Environ. 2017, 191, 402–418. [Google Scholar] [CrossRef]
  10. Rizzi, J.; Nilsen, I.B.; Stagge, J.; Gisnås, K.; Tallaksen, L.M. Five decades of warming: Impacts on snow cover in Norway. Water Policy 2017, 49, 670–688. [Google Scholar] [CrossRef]
  11. Harris, C.; Arenson, L.; Christiansen, H.H.; Etzelmüller, B.; Frauenfelder, R.; Gruber, S.; Haeberli, W.; Hauck, C.; Hölzle, M.; Humlum, O.; et al. Permafrost and climate in Europe: Monitoring and modelling thermal, geomorphological and geotechnical responses. Earth-Sci. Rev. 2009, 92, 117–171. [Google Scholar] [CrossRef] [Green Version]
  12. Wang, S.J.; Xiao, C.D. Global cryospheric disaster at high risk areas: Impacts and trend. Chin. Sci. Bull. 2019, 64, 891–901. (In Chinese) [Google Scholar] [CrossRef]
  13. Ding, Y.J.; Mu, C.C.; Wu, T.H.; Hu, G.J.; Zou, D.F.; Wang, D.; Li, W.P.; Wu, X.D. Increasing cryospheric hazards in a warming climate. Earth-Sci. Rev. 2020, 213, 103500. [Google Scholar] [CrossRef]
  14. Westermann, S.; Østby, T.I.; Gisnås, K.; Schuler, T.V.; Etzelmüller, B. A ground temperature map of the North Atlantic permafrost region based on remote sensing and reanalysis data. Cryosphere 2015, 9, 1303–1319. [Google Scholar] [CrossRef] [Green Version]
  15. Wang, S.J.; Wen, J.H. Characteristics, influence of cryosphere disaster and prospect of discipline development. Bull. Chin. Acad. Sci. 2020, 35, 523–530. [Google Scholar]
  16. Peng, H.; Ma, W.; Mu, Y.H.; Jin, L.; Yuan, K. Degradation characteristics of permafrost under the effect of climate warming and engineering disturbance along the Qinghai–Tibet Highway. Nat. Hazards 2014, 75, 2589–2605. [Google Scholar] [CrossRef]
  17. Cheng, G.D.; Zhao, L.; Li, R.; Wu, X.D.; Sheng, Y.; Hu, G.J.; Zou, D.F.; Jin, H.J.; Li, X.; Wu, Q.B. Characteristic, changes and impacts of permafrost on Qinghai-Tibet Plateau. Chin. Sci. Bull. 2019, 64, 2783–2795. [Google Scholar] [CrossRef] [Green Version]
  18. Hjort, J.; Karjalainen, O.; Aalto, J.; Westermann, S.; Romanovsky, V.E.; Nelson, F.E.; Etzelmüller, B.; Luoto, M. Degrading permafrost puts Arctic infrastructure at risk by mid-century. Nat. Commun. 2018, 9, 1–9. [Google Scholar] [CrossRef]
  19. Yang, Y.T. Environment Analysis and Risk Assessment of Geological Hazard along Qinghai-Tibet Corridor; Chang’an University: Xi’an, China, 2012. [Google Scholar]
  20. Li, L.; Wang, Z.Y.; Xu, W.X.; Wang, Q.C. Response of growth of typical plateau meadow on Tibetan Plateau to climate change. J. Glaciol. Geocryol. 2011, 33, 1006–1013. [Google Scholar]
  21. Gao, Z.Y.; Lin, Z.J.; Niu, F.J.; Luo, J.; Liu, M.H.; Yin, G.A. Hydrochemistry and controlling mechanism of lakes in permafrost regions along the Qinghai-Tibet Engineering Corridor, China. Geomorphology 2017, 297, 159–169. [Google Scholar] [CrossRef]
  22. Wu, X.D.; Zhao, L.; Liu, G.M.; Xu, H.Y.; Zhang, X.L.; Ding, Y.J. Effects of permafrost thaw-subsidence on soil bacterial com-munities in the southern Qinghai-Tibetan Plateau. Appl. Soil Ecol. 2018, 128, 81–88. [Google Scholar] [CrossRef]
  23. Wu, Q.B.; Niu, F.J. Permafrost changes and engineering stability in Qinghai-Xizang Plateau. Chin. Sci. Bull. 2012, 58, 1079–1094. [Google Scholar] [CrossRef] [Green Version]
  24. Fritz, M.; Deshpande, B.N.; Bouchard, F.; Högström, E.; Malenfant-Lepage, J.; Morgenstern, A.; Nieuwendam, A.; Oliva, M.; Paquette, M.; Rudy, A.C.; et al. Brief Communication: Future avenues for permafrost science from the perspective of early career researchers. Cryosphere 2015, 9, 1715–1720. [Google Scholar] [CrossRef] [Green Version]
  25. Zhao, T.; Zhang, M.Y.; Lu, J.G.; Yan, Z.R. Correlation between the ground surface deformation and influential factors in permafrost regions. J. Harbin Inst. Technol. 2021, 53, 145–153. [Google Scholar]
  26. Jin, H.J.; Yu, Q.H.; Wang, S.L.; Lü, L.Z. Changes in permafrost environments along the Qinghai–Tibet engineering corridor induced by anthropogenic activities and climate warming. Cold Reg. Sci. Technol. 2008, 53, 317–333. [Google Scholar] [CrossRef]
  27. Jin, H.J.; Wei, Z.; Wang, S.L.; Yu, Q.H.; Lü, L.Z.; Wu, Q.B.; Ji, Y. Assessment of frozen-ground conditions for engineering geology along the Qinghai–Tibet highway and railway, China. Eng. Geol. 2008, 101, 96–109. [Google Scholar] [CrossRef]
  28. Lin, Z.J.; Niu, F.J.; Luo, J.; Lu, J.H.; Liu, H. Changes in permafrost environments caused by construction and maintenance of Qinghai-Tibet Highway. J. Cent. South Univ. 2011, 18, 1454–1464. [Google Scholar] [CrossRef]
  29. Luo, D.L.; Jin, H.J.; Lin, L.; He, R.X.; Yang, S.Z.; Chang, X.L. Degradation of permafrost and cold-environments on the inte-rior and eastern Qinghai Plateau. J. Glaciol. Geocryol. 2012, 34, 538–546. [Google Scholar]
  30. Zhang, Z.Q.; Wu, Q.B. Thermal hazards zonation and permafrost change over the Qinghai–Tibet Plateau. Nat. Hazards 2011, 61, 403–423. [Google Scholar] [CrossRef]
  31. Mu, Y.H.; Ma, W.; Niu, F.J.; Liu, G.; Zhang, Q.L. Study on geotechnical hazards to roadway engineering in permafrost regions. J. Disaster Prev. Mitig. Eng. 2014, 34, 259–267. [Google Scholar]
  32. Ruan, G.F.; Zhang, J.M.; Chai, M.T. Risk division of thaw settlement hazard along Qinghai-Tibet Engineering Corridor under climate change. J. Glaciol. Geocryol. 2014, 36, 811–817. [Google Scholar]
  33. Guo, D.L.; Sun, J.Q. Permafrost Thaw and Associated Settlement Hazard Onset Timing over the Qinghai-Tibet Engineering Corridor. Int. J. Disaster Risk Sci. 2015, 6, 347–358. [Google Scholar] [CrossRef] [Green Version]
  34. Ma, W.; Zhou, G.Q.; Niu, F.J.; Mu, Y.H. Progress and prospect of the basic research on the major permafrost projects in the Qinghai-Tibet Plateau. China Basic Sci. 2016, 18, 2, 9–19, 63–64. [Google Scholar]
  35. Ma, W.; Mu, Y.H.; Xie, S.B.; Mao, Y.C.; Chen, D. Thermal-mechanical influences and environmental effects of expressway construction on the Qinghai-Tibet permafrost engineering corridor. Adv. Earth Sci. 2017, 32, 459–464. [Google Scholar]
  36. Peng, H.; Dong, Y.H.; Shao, G.J.; Hu, Y.P.; Zeng, L.C.; Ma, W.W. Research on key points of exploration and treatment measures of thermal slip disaster in Qinghai-Tibet Project Corridor. J. Catastrophology 2019, 34 (Suppl. 1), 72–76. [Google Scholar]
  37. Li, Y.Q.; Han, L.M. Engineering geological characteristic and evaluation of permafrost ground along Qing-Tibet railway. J. Eng. Geol. 2008, 16, 245–249. [Google Scholar]
  38. Chen, J.; Feng, Z.L.; Sheng, Y.; Cao, Y.B.; Fang, J.H. Permafrost along Nation Highway 214 and its engineering geological condition evaluation. J. Glaciol. Geocryol. 2014, 36, 790–801. [Google Scholar]
  39. Cui, P.; Su, F.H.; Zou, Q.; Chen, N.S.; Chen, Y.L. Risk assessment and disaster reduction strategies for mountainous and me-teorological hazards in Tibetan Plateau. Chin. Sci. Bull. 2015, 60, 3067–3077. (In Chinese) [Google Scholar]
  40. Nelson, F.E.; Anisimov, O.; Shiklomanov, N.I. Subsidence risk from thawing permafrost. Nature 2001, 410, 889–890. [Google Scholar] [CrossRef] [PubMed]
  41. Zhang, Z.Q.; Wu, Q.B. Thermal hazards prediction on Qinghai-Tibet Plateau permafrost region. J. Jilin Univ. (Earth Sci. Ed.) 2012, 42, 454–461. [Google Scholar]
  42. Zhang, Z.Q.; Wu, Q.B.; Zhou, Z.Y. Risk assessment of freeze thawing disaster in permafrost zone. J. Nat. Disaster 2012, 21, 142–149. [Google Scholar]
  43. Daanen, R.P.; Ingeman-Nielsen, T.; Marchenko, S.S.; Romanovsky, V.E.; Foged, N.; Stendel, M.; Christensen, J.H.; Svendsen, K.H. Permafrost degradation risk zone assessment using simulation models. Cryosphere 2011, 5, 1043–1056. [Google Scholar] [CrossRef] [Green Version]
  44. Stendel, M.; Christensen, J.H.; Marchenko, S.; Daanen, R.; Romanovsky, V.E. High-resolution permafrost simulations in Western Greenland and an assessment of permafrost degradation risk. In Proceedings of the Tenth International Conference on Permafrost, Salekhard, Russia, 25–29 June 2012; Volume 1, p. 6. [Google Scholar]
  45. Hong, E.; Perkins, R.; Trainor, S. Thaw Settlement Hazard of Permafrost Related to Climate Warming in Alaska. ARCTIC 2014, 67, 93. [Google Scholar] [CrossRef] [Green Version]
  46. Xu, X.M.; Wu, Q.B. Impact of climate change on allowable bearing capacity on the Qinghai-Tibetan Plateau. Adv. Clim. Chang. Res. 2019, 10, 99–108. [Google Scholar] [CrossRef]
  47. Ni, J.; Wu, T.H.; Zhu, X.F.; Wu, X.D.; Pang, Q.Q.; Zou, D.F.; Chen, J.; Li, R.; Hu, G.J.; Du, Y.Z.; et al. Risk assessment of poten-tial thaw settlement hazard in the permafrost regions of Qinghai-Tibet Plateau. Sci. Total Environ. 2021, 776, 145855. [Google Scholar] [CrossRef] [PubMed]
  48. Nelson, F.E.; Anisimov, O.A.; Shiklomanov, N.I. Climate change and hazard zonation in the circum-Arctic permafrost regions. Nat. Hazards 2002, 26, 203–225. [Google Scholar] [CrossRef]
  49. Anisimov, O.; Reneva, S. Permafrost and Changing Climate: The Russian Perspective. Ambio 2006, 35, 169–175. [Google Scholar] [CrossRef]
  50. Chai, M.T.; Zhang, J.M.; Mu, Y.H.; Liu, G.; Zhou, G.Q. Probability model for subgrade hazards susceptibility of Qing-hai-Tibet Highway in permafrost regions. J. Chang’an Univ. (Nat. Sci. Ed.) 2017, 37, 76–83. [Google Scholar]
  51. Xu, G. Risk assessment on overseas EPC project based on system dynamics—Taking EPC project in Chadian Lanea oil-field as a case study. J. Saf. Sci. Technol. 2019, 15, 52–57. [Google Scholar]
  52. Cui, F.Q.; Liu, Z.Y.; Chen, J.B.; Peng, H.; Zhang, W.; Wang, W. Comparative study on measurement methods of permafrost thermal conductivity of Qinghai-Tibet engineering corridor. J. Xi’an Univ. Sci. Technol. 2020, 40, 887–893. [Google Scholar]
  53. Ma, W.; Su, Y.Q. Advances on seismic safety study of the permafrost sites along Qinghai-Tibet Project Corridor. J. Disaster Prev. Mitig. Eng. 2021, 41, 723–733. [Google Scholar]
  54. Luo, J.; Niu, F.J.; Lin, Z.J. Development of thawing hazards and thermal influence on permafrost along Qinghai-Tibet Engi-neering Corridor. J. Eng. Geol. 2014, 22, 326–333. [Google Scholar]
  55. Yu, W.B.; Yi, X.; Han, F.L.; Pei, W.S.; Chen, L. Study on the geometric parameters of elbow ventiduct embankment in per-mafrost regions along the Qinghai-Tibet Engineering Corridor. Cold Reg. Sci. Technol. 2021, 182, 103209. [Google Scholar] [CrossRef]
  56. Zhang, S.Z.; Niu, F.J.; Wang, J.C.; Dong, T.C. Evaluation of damage probability of railway embankments in permafrost re-gions in Qinghai–Tibet Plateau. Eng. Geol. 2021, 284, 106027. [Google Scholar] [CrossRef]
  57. Ran, Y.H.; Li, X. Frozen Soil Map of China (2000); National Tibetan Plateau Data Center: Beijing, China, 2018. [Google Scholar] [CrossRef]
  58. Peng, S.Z. 1-km Monthly Mean Temperature Dataset for China (1901–2017); National Tibetan Plateau Data Center: Beijing, China, 2019. [Google Scholar] [CrossRef]
  59. Peng, S.Z. 1-km Monthly Precipitation Dataset for China (1901–2017); National Tibetan Plateau Data Center: Beijing, China, 2020. [Google Scholar] [CrossRef]
  60. Feng, F.; Wang, K.C. High Spatial Resolution (10 km) Surface Solar Radiation Dataset with by Merging Sunshine Hours over China China (1983–2017); National Tibetan Plateau Data Center: Beijing, China, 2020. [Google Scholar] [CrossRef]
  61. Ma, N.; Szilagyi, J.; Zhang, Y.S.; Liu, W.B. Terrestrial Evapotranspiration Dataset across China (1982–2017); National Tibetan Plateau Data Center: Beijing, China, 2019. [Google Scholar] [CrossRef]
  62. Mao, K.B. SMC Dataset: Soil Moisture in China Dataset (2002–2018); National Tibetan Plateau Data Center: Beijing, China, 2021. [Google Scholar] [CrossRef]
  63. Shang, G.W.; Dai, Y.J. A China Soil Characteristics Dataset (2010); National Tibetan Plateau Data Center: Beijing, China, 2019. [Google Scholar] [CrossRef]
  64. Zhang, X.D.; Zhou, J.; Tang, W.B.; Ding, L.R.; Ma, J.; Zhang, X. Daily 1-km All-Weather Land Surface Temperature Dataset for the Chinese Landmass and Its Surrounding Areas (TRIMS LST; 2000–2020); National Tibetan Plateau Data Center: Beijing, China, 2021. [Google Scholar] [CrossRef]
  65. Yang, K.; He, J. China Meteorological Forcing Dataset (1979–2018); National Tibetan Plateau Data Center: Beijing, China, 2019. [Google Scholar] [CrossRef]
  66. Zhang, G.Q. China Lake Dataset (1960s–2020); National Tibetan Plateau Data Center: Beijing, China, 2019. [Google Scholar] [CrossRef]
  67. Li, J.Z. Classification of fundamental types of geomorphological form in China. Geogr. Res. 1987, 6, 32–39. [Google Scholar]
  68. Feng, Z.M.; Li, W.J.; Li, P.; Xiao, C.W. Relief degree of land surface and its geographical meanings in the Qinghai-Tibet Plateau, China. Acta Geogr. Sin. 2020, 75, 1359–1372. [Google Scholar]
  69. Su, X.; Wei, W.H.; Guo, W.Q.; Wang, S.Y.; Wang, G.Y.; Wu, W.J.; Xie, W.L. Analyzing the impact of relief amplitude to loess landslides based on SRTM DEM in Tianshui Prefecture. J. Glaciol. Geocryol. 2017, 39, 616–622. [Google Scholar]
  70. Gu, Z.J.; Zeng, Z.Y.; Shi, X.Z.; Zheng, W.; Zhang, Z.L.; Hu, Z.F. A model calculating vegetation fractional coverage from ETM+ imagery. Ecol. Environ. 2008, 17, 771–776. [Google Scholar]
  71. Liu, J.H.; Gao, J.X.; Wang, W.J. Variations of vegetation coverage and its relations to global climate changes on the Tibetan Plateau during 1981–2005. J. Mt. Res. 2013, 31, 234–242. [Google Scholar]
  72. Ma, Z.C.; Yu, H.B.; Cao, C.M.; Zhang, Q.F.; Hou, L.L.; Liu, Y.X. Spatiotemporal characteristics of fractional vegetation cov-erage and its influencing factors in China. Resour. Environ. Yangtze Basin 2020, 29, 1310–1321. [Google Scholar]
  73. Pan, Y.; Shi, P.; Zhu, W.Q.; Gu, X.H.; Fan, Y.D.; Li, J. Measurement of ecological capital of Chinese terrestrial ecosystem based on remote sensing. Sci. China Ser. D Earth Sci. 2005, 48, 786–796. [Google Scholar] [CrossRef]
  74. Xu, X.M.; Wu, Q.B.; Zhang, Z.Q. Responses of active layer thickness on the Qinghai-Tibet Plateau to climate change. J. Glaciol. Geocryol. 2017, 39, 1–8. [Google Scholar]
  75. Zhang, Z.Q.; Wu, Q.B. Predicting changes of active layer thickness on the Qinghai-Tibet Plateau as climate warming. J. Glaciol. Geocryol. 2012, 34, 505–511. [Google Scholar]
  76. Xu, X.M.; Zhang, Z.Q.; Wu, Q.B. Simulation of permafrost changes on the Qinghai–Tibet Plateau, China, over the past three decades. Int. J. Digit. Earth 2016, 10, 522–538. [Google Scholar] [CrossRef]
  77. Wu, Q.B.; Dong, X.F.; Liu, Y.C. Spatial Distribution Model of High Ice Content Frozen Soil along Qinghai-Tibetan Highway—A GIS-aided model. J. Glaciol. Geocryol. 2004, 26, 137–141. [Google Scholar]
  78. Li, B. Study of Vegetation’s Spatial and Temporal Distribution and Influencing Factors on the Tibetan Plateau; China University of Geosciences: Beijing, China, 2016. [Google Scholar]
  79. Zhao, M.Y.; Sun, C.Z.; Kang, L. Application of partial correlation coefficient to canopy interception impacting factor analysis. J. Southwest For. Univ. 2013, 33, 61–65. [Google Scholar]
  80. Wang, H.Y.; Yang, F.T.; Liu, L. Comparison and application of standardized regressive coefficient & partial correlation coefficient. J. Quant. Tech. Econ. 2006, 23, 150–155. [Google Scholar]
  81. Lu, J.H.; Niu, F.J.; Cheng, H.; Lin, Z.J.; Liu, H.; Luo, J. The permafrost distribution model and its change trend of Qing-hai-Tibet Engineering Corridor. J. Mt. Sci. 2013, 31, 226–233. [Google Scholar]
  82. Li, S. Spatio-Temporal Patterns and Comprehensive Clustering Analysis of Climatic Change Risk Sources in Qinghai-Tibet Plateau; Peking University: Beijing, China, 2011. [Google Scholar]
  83. Li, S.; Li, S.C. Comprehensive clustering analysis of climatic change risk sources in Qinghai-Tibet Plateau. Acta Sci. Nat. Univ. Pekin. 2012, 48, 648–655. [Google Scholar]
  84. Guo, Z.G.; Niu, F.J.; Zhan, H.; Wu, Q.B. Changes of grassland ecosystem due to degradation of permafrost frozen soil in the Qinghai-Tibet Plateau. Acta Geogr. Sin. 2007, 27, 3294–3301. [Google Scholar]
  85. Wang, J.; Bai, W.Q.; Tian, G.H. Spatiotemporal characteristics of landscape ecological risks on the Tibetan Plateau. Resour. Sci. 2020, 42, 1739–1749. [Google Scholar] [CrossRef]
  86. Li, Y.; Han, L.B.; Xu, G.Q. Research on stability of embankment in permafrost regions along Qinghai-Tibet Railway and its control. J. Glaciol. Geocryol. 2011, 33, 880–883. [Google Scholar]
  87. Burn, C.R. Tundra lakes and permafrost, Richards Island, western Arctic coast, Canada. Can. J. Earth Sci. 2002, 39, 1281–1298. [Google Scholar] [CrossRef]
  88. Burn, C.R. Lake-bottom thermal regimes, western Arctic coast, Canada. Permafr. Periglac. Processes 2005, 16, 355–367. [Google Scholar] [CrossRef]
  89. Karlsson, J.M.; Lyon, S.W.; Destouni, G. Thermokarst lake, hydrological flow and water balance indicators of permafrost change in Western Siberia. J. Hydrol. 2012, 464-465, 459–466. [Google Scholar] [CrossRef]
  90. Yang, Z.; Wen, Z.; Niu, F.J.; Wang, D.Y.; Yu, Q.H.; Zhang, M.L. Research on thermokarst lakes in permafrost regions: Present state and prospect. J. Glaciol. Geocryol. 2013, 35, 1519–1526. [Google Scholar]
  91. Gao, Z.Y. Hydrological Characteristics and Environmental Effects of Thermokarst Lakes in the Permafrost Region of the Qinghai-Tibet Plateau; Northwest Institute of Eco-Environment and Resources, Chinese Academy of Sciences: Lanzhou, China, 2018. [Google Scholar]
  92. Guo, L.; Yu, Q.H.; You, Y.H.; Wang, X.B.; Yuan, C.; Li, X.N. Evaluation on the influences of lakes on the thermal regimes of nearby tower foundations along the Qinghai-Tibet Power Transmission Line. Appl. Therm. Eng. 2016, 102, 829–840. [Google Scholar] [CrossRef]
  93. Ding, Z.K.; Gong, W.Y.; Li, S.H.; Wu, Z.Z. System Dynamics versus Agent-Based Modeling: A Review of Complexity Simu-lation in Construction Waste Management. Sustainability 2018, 10, 2484. [Google Scholar] [CrossRef] [Green Version]
  94. Sun, Y.H.; Liu, N.N.; Shang, J.X.; Zhang, J.Y. Sustainable utilization of water resources in China: A system dynamics model. J. Clean. Prod. 2017, 142, 613–625. [Google Scholar] [CrossRef]
  95. R Core Team. R: A Language and Environment for Statistical Computing; R Foundation for Statistical Computing: Vienna, Austria. Available online: https://www.R-project.org/ (accessed on 18 November 2021).
  96. Long, X.J.; Li, X.J. Mountain attitude classification indexes adjustment based on multi-source data in China. Sci. Geogr. Sin. 2017, 37, 1577–1584. [Google Scholar]
  97. Shen, Y.L. Spatio-Temporal Patterns of Evapotranspiration and Exploration of Its Influence Factors in Hengduan Mountain Area; Chengdu University of Technology: Chengdu, China, 2020. [Google Scholar]
  98. Luo, J. Thaw-Induced Slope Failures and Their Susceptibility Assessment in Qinghai-Tibet Engineering Corridor; Cold and Arid Regions Environmental and Engineering Research Institute, Chinese Academy of Sciences: Lanzhou, China, 2015. [Google Scholar]
  99. Han, H.J.; Gao, T.; Yi, H.; Yang, M.; Yan, X.J.; Ren, G.L.; Yang, L.J. Extraction of relief amplitude based on change point method: A case study on the Tibetan Plateau. Sci. Geogr. Sin. 2012, 32, 101–104. [Google Scholar]
  100. Mu, Y.H. Anlyses on Dynamic Variations of Embankment Thermal Regime and Deformation along the Qinghai-Tibet Railway in Permafrost Regions; Northwest Institute of Eco-Environment and Resources, Chinese Academy of Sciences: Lanzhou, China, 2012. [Google Scholar]
  101. Huang, Y.; Hu, S.; Yao, S.M. System dynamics analysis and safety risk of building tower crane. J. Saf. Environ. 2020, 20, 2060–2068. [Google Scholar]
  102. Di Bona, G.; Forcina, A.; Falcone, D.; Silvestri, L. Critical Risks Method (CRM): A New Safety Allocation Approach for a Critical Infrastructure. Sustainability 2020, 12, 4949. [Google Scholar] [CrossRef]
  103. Bona, G.D.; Forcina, A. Analytic critical flow method (ACFM): A reliability allocation method based on analytic hierarchy process. J. Fail. Anal. Prev. 2017, 17, 1149–1163. [Google Scholar] [CrossRef]
  104. Liu, Y. Risk Management Research on Commercial Vehicle Project Based on System Dynamics; Shanghai Jiaotong University: Shanghai, China, 2013. [Google Scholar]
  105. Wang, M.J.; Tang, X.Y.; Qiu, Q.; Tang, J.J. Research on the interaction mechanism of technological decision-making risk fac-tors in mega projects. J. Railw. Sci. Eng. 2021, 18, 1640–1649. [Google Scholar]
  106. Karjalainen, O.; Aalto, J.; Luoto, M.; Westermann, S.; Romanovsky, V.E.; Nelson, F.E.; Etzelmüller, B.; Hjort, J. Circumpolar permafrost maps and geohazard indices for near-future infrastructure risk assessments. Sci. Data 2019, 6, 190037. [Google Scholar] [CrossRef] [Green Version]
  107. Hjort, J.; Streletskiy, D.; Doré, G.; Wu, Q.; Bjella, K.; Luoto, M. Impacts of permafrost degradation on infrastructure. Nat. Rev. Earth Environ. 2022, 3, 24–38. [Google Scholar] [CrossRef]
Figure 1. (a) Circum-Arctic permafrost map. The data in this permafrost map was derived from National Snow and Ice Data Center (https://nsidc.org/data/GGD318/versions/2, accessed date: 15 January 2020). (b) Distribution of permafrost in China [57]. (c) Geographical location of the study area.
Remotesensing 14 00908 g001
Figure 2. Risk identification model.
Remotesensing 14 00908 g002
Figure 3. The causes’ tree of the ecological environmental risk.
Remotesensing 14 00908 g003
Figure 4. The uses’ tree of the surface temperature.
Remotesensing 14 00908 g004
Figure 5. Changes in risk factors considering elevation: (a) MAAT; (b) MAP; (c) SR; (d) ET; (e) FVC; (f) SM; (g) CC1; (h) CC2; (i) SC1; (j) SC2; (k) ABC; (l) ALT; (m) VIC; (n) MAGT; (o) MAST.
Remotesensing 14 00908 g005aRemotesensing 14 00908 g005b
Figure 6. Changes in risk factors considering slope: (a) MAAT; (b) MAP; (c) SR; (d) ET; (e) FVC; (f) SM; (g) CC1; (h) CC2; (i) SC1; (j) SC2; (k) ABC; (l) ALT; (m) VIC; (n) MAGT; (o) MAST.
Remotesensing 14 00908 g006aRemotesensing 14 00908 g006b
Figure 7. Changes in risk factors considering aspect: (a) MAAT; (b) MAP; (c) SR; (d) ET; (e) FVC; (f) SM; (g) CC1; (h) CC2; (i) SC1; (j) SC2; (k) ABC; (l) ALT; (m) VIC; (n) MAGT; (o) MAST.
Remotesensing 14 00908 g007aRemotesensing 14 00908 g007b
Figure 8. Changes in risk factors considering RDLS: (a) MAAT; (b) MAP; (c) SR; (d) ET; (e) FVC; (f) SM; (g) CC1; (h) CC2; (i) SC1; (j) SC2; (k) ABC; (l) ALT; (m) VIC; (n) MAGT; (o) MAST.
Remotesensing 14 00908 g008aRemotesensing 14 00908 g008b
Figure 9. The variation distribution of each risk factor considering VIC: (a) MAAT; (b) MAP; (c) SR; (d) ET; (e) FVC; (f) SM; (g) CC1; (h) CC2; (i) SC1; (j) SC2; (k) ABC; (l) ALT; (m) MAGT; (n) MAST.
Remotesensing 14 00908 g009aRemotesensing 14 00908 g009b
Figure 10. Spatial distribution of the partial correlation coefficient between ET and driving factors, and key factors affecting ET: (a) FVC; (b) MAP; (c) SM; (d) SR; (e) MAAT; (f) key factors.
Remotesensing 14 00908 g010
Figure 11. Spatial distribution of the partial correlation coefficient between FVC and driving factors, and key factors affecting FVC: (a) ET; (b) MAP; (c) SM; (d) SR; (e) MAAT; (f) key factors.
Remotesensing 14 00908 g011aRemotesensing 14 00908 g011b
Figure 12. Spatial distribution of the partial correlation coefficient between SM and driving factors, and key factors affecting SM: (a) ET; (b) FVC; (c) MAP; (d) SR; (e) MAAT; (f) key factors.
Remotesensing 14 00908 g012aRemotesensing 14 00908 g012b
Figure 13. Spatial distribution of the partial correlation coefficient between ABC and driving factors, and key factors affecting ABC: (a) ALT; (b) FVC; (c) MAST; (d) MAP; (e) SM; (f) SR; (g) MAAT; (h) key factors.
Remotesensing 14 00908 g013aRemotesensing 14 00908 g013b
Figure 14. Spatial distribution of the partial correlation coefficient between ALT and driving factors, and key factors affecting ALT: (a) ET; (b) FVC; (c) MAST; (d) MAP; (e) SM; (f) SR; (g) MAAT; (h) key factors.
Remotesensing 14 00908 g014aRemotesensing 14 00908 g014b
Figure 15. Spatial distribution of the partial correlation coefficient between MAGT and driving factors, and key factors affecting MAGT: (a) ET; (b) FVC; (c) MAST; (d) MAP; (e) SM; (f) SR; (g) MAAT; (h) key factors.
Remotesensing 14 00908 g015aRemotesensing 14 00908 g015b
Figure 16. Spatial distribution of the partial correlation coefficient between MAST and driving factors, and key factors affecting MAST: (a) ET; (b) FVC; (c) MAP; (d) SM; (e) SR; (f) MAAT; (g) key factors.
Remotesensing 14 00908 g016aRemotesensing 14 00908 g016b
Table 1. Initial identification of risk factors.
TypeFactor
Environmental risk of cold region engineeringregional geomorphological riskelevation, slope, aspect, relief degree of land surface (RDLS)
climate change riskmean annual air temperature (MAAT), mean annual precipitation (MAP), surface solar radiation (SR)
ecological environmental riskevapotranspiration (ET), fractional vegetation coverage (FVC), soil moisture (SM), clay content (CC; CC1 (0~30 cm), CC2 (30~100 cm)) and sand content (SC; SC1 (0~30 cm), SC2 (30~100 cm))
permafrost environmental riskallowable bearing capacity (ABC), active layer thickness (ALT), mean annual ground temperature (MAGT), mean annual surface temperature (MAST), volume ice content (VIC)
water environmental riskthermokarst lake
Table 2. Elevation classification.
LevelElevation Range/m
1<4200
24200~4400
34400~4600
44600~4800
54800~5000
65000~5200
75200~5400
85400~5600
95600~5800
105800~6000
11>6000
Table 3. Slope classification.
LevelSlope Range/°
10~3
23~6
36~10
410~15
5>15
Table 4. Aspect classification.
LevelAngle Range/°
north0~22.5°, 337.5~360°
northeast22.5~67.5°
east67.5~112..5°
southeast112.5~157.5°
south157.5~202.5°
southwest202.5~247.5°
west247.5~292.5°
northwest292.5~337.5°
Table 5. RDLS classification.
RDLS TypeElevation Difference Range/m
plain<30
platform30~70
hill70~200
low-relief mountain200~500
moderate-relief mountain500~1000
high-relief mountain1000~2500
highest-relief mountain>2500
Table 6. Classification of volume of ice content.
Permafrost Type Volume   Ice   Content / i v
talik i v = 0
ice-poor permafrost (IP) i v 10 %
icy permafrost (IC) 10 % < i v 20 %
ice-rich permafrost (IR) 20 % < i v 30 %
ice-saturated permafrost (IS) 30 % < i v 50 %
ice layer with soil (IL) i v > 50 %
Table 7. The partial correlation analysis between lake area and driving factors.
Controlling FactorsAnalytical FactorPartial Correlation CoefficientSignificance
ET, MAST, MAP, SM, MAATALT0.4920.033 *
ALT, MAST, MAP, SM, MAATET0.2200.365
ALT, ET, MAP, SM, MAATMAST0.4170.076
ALT, ET, MAST, SM, MAATMAP0.5330.019 *
ALT, ET, MAST, MAP, MAATSM−0.4670.044 *
ALT, ET, MAST, MAP, SMMAAT−0.0710.774
Note: * indicates significant at the 0.05 level (T two-side significance test).
Publisher’s Note: MDPI stays neutral with regard to jurisdictional claims in published maps and institutional affiliations.