Communication

Comprehensive Study on the Tropospheric Wet Delay and Horizontal Gradients during a Severe Weather Event

by
Victoria Graffigna
1,2,*,
Manuel Hernández-Pajares
3,
Francisco Azpilicueta
1,2 and
Mauricio Gende
1,2
1
Facultad de Ciencias Astronómicas y Geofísicas, Universidad Nacional de La Plata, La Plata 1900, Argentina
2
Consejo Nacional de Investigaciones Científicas y Técnicas (CONICET), La Plata 1900, Argentina
3
IonSAT, Universitat Politecnica de Catalunya (UPC), 08034 Barcelona, Spain
*
Author to whom correspondence should be addressed.
Remote Sens. 2022, 14(4), 888; https://doi.org/10.3390/rs14040888
Submission received: 31 December 2021 / Revised: 31 January 2022 / Accepted: 9 February 2022 / Published: 12 February 2022
(This article belongs to the Special Issue Marine Disaster Monitoring Using Satellites)

Abstract

:
GNSS meteorology is today one of the most growing technologies to monitor severe weather events. In this paper, we present the usage of 160 GPS reference stations over the period of 14 days to monitor and track Hurricane Harvey, which struck Texas in August 2017. We estimate the Zenith Wet Delay (ZWD) and the tropospheric gradients with 30 s interval using TOMION v2 software and carry out the processing in Precise Point Positioning (PPP) mode. We study the relationship of these parameters with atmospheric variables extracted from Tropical Rainfall Measuring Mission (TRMM) satellite mission and climate reanalysis model ERA5. This research finds that the ZWD shows patterns related to the rainfall rate and to the location of the hurricane. We also find that the tropospheric gradients are correlated with water vapor gradients before and after the hurricane, and with the wind and the pressure gradients only after the hurricane. This study also shows a new finding regarding the spectral distribution of the gradients, with a clear diurnal period present, which is also found on the ZWD itself. This kind of study approaches the GNSS meteorology to the increasing requirements of meteorologist in terms of monitoring severe weather events.

1. Introduction

Marine disasters have rapidly increased since 2000, and the ability of monitoring them today relies on the satellite methods available to track such disastrous phenomena. In this sense, GNSS (Global Navigation Satellite System) meteorology has become a very useful technique considering the remote sensing of the atmosphere in the last 20 years. Even with this technology, comprising receivers located on land, it certainly has been supporting weather forecasting for over 10 years. Monitoring water vapor is very important because this variable plays a key role on the generation and development of synoptic (few hundred to several thousand kilometers) and mesoscale (from a few kilometers to several hundred kilometers) systems, which can cause flooding and great loss. The water vapor fields are highly heterogeneous fields that vary rapidly, which has encouraged, among other improvements, the development and implementation of low cost, and with high temporal resolution technologies to track them. This is where GNSS extensive, all weather, and low cost operational foundation becomes of great importance. Mainly, compared with other available techniques, which have calibration problems, Global Positioning Systems (GPSs) have long-term stability.
Originally, GNSSs were developed for positioning, navigation, and timing but rapidly acquired the potential to be used as a sensor of the atmosphere. The possibility to compute water vapor (WV) from GPS measurements was first introduced 30 years ago [1], and, in the beginning, this feature was only viable in the post-processing mode since the accuracy needed from the Final Products was only achieved a decade later [2,3]. Already, at that time, it was mentioned that these measurements could be utilized in operational weather forecasting and in fundamental research into atmospheric storm systems, the hydrologic cycle, atmospheric chemistry, and global climate change.
Horizontal tropospheric gradients are a second order product, which has been considered as part of the standard routinely estimated geodetic products for at least 15 years. In recent years, these parameters and the Zenith Tropospheric Delay (ZTD) have been used to monitor and understand synoptic and mesoscale systems. Such is the case of Reference [4], where the authors were able to monitor a widespread, long-lived, straight-line wind convective system in Poland that occurred on 11 August 2017 using 278 GNSS reference stations by means of the ZTD and its gradients. Recently, Reference [5] studied hurricane Florence that struck the east coast of USA in 2018, contributing to hurricane monitoring and tracking using GPS-derived water vapor evolution.
Over the last two decades, other studies have pointed out that tropospheric products, i.e., the ZTD (or, similarly, the ZWD), and tropospheric gradients can be utilized by forecasters for nowcasting and severe weather monitoring, due to their natural relationship with water vapor and precipitation intensity [6,7]. The relationship between the water vapor and the occurrence of rain has been thoroughly addressed by several studies. In general, it can be said that the development of convective systems are associated with typical water vapor configuration characteristics (such as a dry/wet contrast), which can change rapidly over time. The initiation of local convection can be rapidly triggered by the presence of water vapor [8]. These convective systems can also be caused by the orography, where the water vapor is transferred between the mountains and the plains [9].
The interpretation of the gradients in terms of their distribution is that they generally point from each station to the azimuth of the local maxima of tropospheric (wet) delay correction, which usually corresponds to the increasing amount of water vapor in the troposphere [6]. However, local asymmetries in a water vapor distribution in the atmosphere have been identified throughout the analysis of tropospheric gradients. It has been identified before that the horizontal tropospheric gradients have the sensibility to detect rather small atmospheric structures related to small scale warm air structure [10].
Extreme weather phenomena, such as heavy precipitation, typhoons, or storms [11], have been thoroughly assessed before using the horizontal tropospheric gradients, and it was generally found that the tropospheric parameters can represent the patterns followed by extreme weather phenomena. The effect of topography on water vapor distribution has been recently studied [12]. Water vapor variation was found to be associated with convective rainfall through an index derived from the tropospheric gradients [13], suggesting that the GPS-derived indices of water vapor inhomogeneity reflect local variation in water vapor associated with atmospheric convection.
Validations of the horizontal tropospheric gradients have been performed in the recent past with gradients computed with data from ECMWF [14], which have 6-h resolution, not sufficient to resolve neither rapid changes in the pressure related to moving weather systems nor many of the short lived small-scale gradients associated with the variability in the water vapor. Therefore, in order to exploit fully the potential of high rate estimations, in this work, we chose to obtain the parameters with 30 s sampling. Moreover, we assess the correlation of the GPS-tropospheric gradients directly with atmospheric variables, instead of that with gradients of ZTDs derived from different sources (i.e., WVR, ECMWF, VLBI).
A severe weather event, Hurricane Harvey, that took place in Texas, in the USA, on 19–31 August 2017, will be the subject of study of this work. The system began as a low pressure system in northwestern Africa and traveled westwards, entering the Gulf of Mexico and bending north to hit the Yucatan peninsula, traveling north and rapidly intensifying while entering the bay near Houston on the 26th. Harvey intensified substantially in the final hours before its first landfall, strengthening into a Category 4 hurricane with maximum sustained winds around 209 km/h. Then, after making its first landfall at the northern end of San Jose Island about 6 km east of Rockport, it went back to the sea and back inland for a second landfall near the Texas–Louisiana boarder. This characteristic made this event particularly interesting in the development of hurricanes. The trajectory of the hurricane over those days that it affected the studied area is shown in Figure 1, where only the analysis points were taken from https://www.emc.ncep.noaa.gov/gc_wmb/vxt/HWRF (accessed on 21 December 2021).
In this work, we pursued and extended the research performed in Reference [15]. We proceeded with broadening the study area and the time window from 11 to 160 stations and from 9 to 14 days, adding processing days specially after the event. The new arrangement of stations can be seen in Figure 1. The aim of this work is to further understand the relationship of the tropospheric gradients with the atmospheric variables and to what extent they can be used to nowcast, or even forecast, of weather events. Moreover, recent research on the short term gradients has been pursued [16] to detect short-lived gradients, and it has been found that the weaker the constraint on the stochastic processes that tailors the variance on the horizontal tropospheric gradients, the better those estimates can be tracked. The choice of temporal resolution is a compromise between getting a high correlation and the possibility of detecting rapid changes in the gradient.
Previous studies demonstrated that the estimation of tropospheric gradients improves GNSS data processing mainly in terms of receiver position and ZTDs [17,18,19], but not many studies, up to now, compared them with Water Vapor Radiometer (WVR) or Numerical Weather Model (NWM) data. The standard validation of the gradients from GNSS are usually done against those derived from NWM, and, even though they are in good agreement with negligible biases, the former revealed a capability of providing more detailed structures in the atmosphere than the state-of-the- art NWMs are able to capture [6]. Tropospheric gradients have been found to represent local asymmetries in a water vapor distribution in the atmosphere. In some cases, the gradient maps derived from GNSS and NWM show discrepancies in terms of the magnitude of gradient values, while keeping consistency in directions. Usually, GNSS gradients tend to be significantly higher than NWM ones [20]. More detailed patterns were observed in GNSS maps, while they were smoother, or even missing, in NWM maps, if an asymmetry occurred in the troposphere. In this work, we pursued the use of NWM to detect patterns that can relate to the hurricane path.
This paper is organized as follows. In Section 2, we will describe all the three datasets used for this work, as well as briefly introduce the software used for the computation, TOMION v2 [15,21]. Section 3 presents the analysis on the ZWD and its correspondence with rain data, followed by a new finding on the spectral components of the tropospheric gradients; and, finally, the relationship of the tropospheric gradients with atmospheric variables is discussed. Section 4 closes this article, summarizing the agreement of GPS-derived tropospheric products with atmospheric fields.

2. Materials and Methods

Three data sources were selected for comparison within the same latitude and longitude range, and they correspond to the area affected by Hurricane Harvey for the period from 19 August 2017 to 3 September 2017: (1) Continuously Operating Reference Stations (CORS) observing Global Navigation Satellite System signals provide the data to estimate ZWD and the horizontal tropospheric gradients; (2) instruments aboard the joint (NASA and JAXA) spaceflight Tropical Rainfall Measuring Mission (TRMM) give precipitation estimates; and (3) meteorological data assimilated in the ECMWF’s Integrated Forecast System (IFS) produce ERA5 datasets for atmospheric pressure, wind, and water vapor.

2.1. ERA5 Data

ERA5 [22] is produced using a data assimilation system from the ECMWF’s Integrated Forecast System (IFS), covering the entire Earth on a 30-km grid and resolving the atmosphere in 137 height levels from the surface up to a height of 80 km. Atmospheric data are available on these levels, and they are also interpolated to 37 pressure, 16 potential temperature, and 1 potential vorticity level. Surface or single level data are also available, containing numerous 2D parameters, such as precipitation, temperature, top of atmosphere radiation, and vertical integrals, over the entire atmosphere. This last dataset was the one used for this study. The IFS is coupled to a soil model, the parameters of which are also designated as surface parameters, and an ocean wave model. ERA5 replaces the ERA-Interim reanalysis, which stopped being produced on 31 August 2019, and is available at the time from 1979, and will eventually be covering from January 1950. Quality-assured monthly updates of ERA5 are available with a 3-month delay, and preliminary daily updates of the dataset are also published with a 5-day delay. The ERA5 dataset contains an hourly high resolution realization, called reanalysis, and a reduced resolution ten member ensemble, referred to as ensemble, which was used for this research.
ERA5 is ECMWF’s latest comprehensive atmospheric reanalysis and improves on ERA-Interim in many ways. The horizontal resolution is about 30 km, compared with 78 km for ERA-Interim. ERA5 uses the same 137-level vertical resolution as ECMWF’s high-resolution operational assimilation, rather than the 60 levels of ERA-Interim. ERA5 also makes use of new analyses of sea-surface temperature and sea-ice concentration, variations in radiative forcing derived from different specifications, and various new and reprocessed observational data records. It provides hourly output fields and a more complete observational feedback archive than ERA-Interim. ERA5 has been used in the recent past to validate the horizontal tropospheric gradients retrieved from the dense GPS network [20], where 3-h resolution was used to avoid extensive data handling. In this work, we used ERA5 best resolution (1-h) in order to exploit its potential to resolve for rapidly changing features. In order to compare against our tropospheric estimates, we selected ERA5 atmospheric surface analysis data, in netCDF4 format, for the period from 19 August 2017 to 3 September 2017. The resolution of the selected data is 0.25 ° × 0.25 ° in the selected range of [26 ° , 34 ° ] and [−102 ° , −91 ° ] latitude and longitude, respectively. The variables collected from this vast dataset, in this case, were integrated water vapor, wind, and atmospheric pressure because they are the main atmospheric components that play an important role in hurricane events.

2.2. TRMM Data

The rain rate data were retrieved from the 3-hourly, 0.25 ° × 0.25 ° gridded precipitation data (3B42 v6) from the Tropical Rainfall Measuring Mission (TRMM) Multisatellite Precipitation Analysis [23]. This mission provides a calibration-based dataset where precipitation estimates from multiple satellites are combined, as long with gauge analysis where feasible. The data is made available both on post-processed and in real time, based on calibration of the combined instruments and on the microwave imager precipitation products, respectively. The mission covers from latitude 50 ° S to 50 ° N and from 1998 to the present. The data is provided in daily files in GRIB or netCDF format and covers land and ocean surface. We have made use of this additional dataset that includes only precipitation rate to compare them with our ZWD results in the area. We have selected the period from 19 August to 3 September 2017, compatible with our estimates and the start, evolution, and fading of Hurricane Harvey.

2.3. GPS Data

The RINEX data from 18 August 2017 to 3 September 2017 for 160 GPS stations within latitude and longitude [26 ° , 34 ° ] and [−102 ° , −91 ° ], respectively, were processed with TOMION v2 scientific software [24] for this study. The strategy used for this work was Precise Point Positioning (PPP) [25], where final CODE (Center for Orbit Determination in Europe) orbits and high-rate clocks corrections [26] were consistently used. A priori station positions are obtained from a two-day forward static run, performed with TOMION v2, taking the final solution for 18 August 2017. All the processing was performed with a resolution of 30 s. The parameter estimation has been done in one continuous run, which requires greater processing capabilities but avoids day-boundary discontinuities. This effort was done in order to prevent misinterpretation of possible peaks on horizontal gradients at 00 UTC. The strategy used for the observation model was the Ionospheric-free combination. The PPP implementation in TOMION v2 uses a Kalman Filter to estimate, in this case, the correction to the a priori position of the receiver in ECEF system, together with the receiver clock error, the ambiguities, the ZWD, and the horizontal tropospheric gradients.
The total tropospheric delay T induced by the troposphere on GPS signals can be modeled as:
T = m d ( ε ) Z H D + m w ( ε ) Z W D + m g ( ε ) [ G N c o s ( α ) + G E s i n ( α ) ] ,
where: the mapping function for the gradients m g was set according to Chen and Herring [17]; the Zenith Hydrostatic Delay (ZHD) was modeled following Saastamoinen [27]; the a priori Zenith Wet Delay (ZWD) was computed according to Askne and Nordius [28]; the dry and wet mapping functions, m d and m w , respectively, used for this processing have been the gridded Vienna Mapping Function (VMF1) [29]; ε and α are the elevation and azimuth of the observation; G N and G E are the north and east gradients, respectively. A detailed description of the tropospheric corrections implemented in TOMION v2 can be seen in Graffigna et al. [15], as well as the assessment on the tropospheric estimates and their accuracy. Process noise on the estimated ZWD and the tropospheric gradients were taken as 3.16 mm/ h and 0.0316 mm/ h , respectively. Elevation-dependent stochastic model was used to calculate the standard deviation σ of a single GPS observation, and the cutoff angle was chosen as 7 ° . The processing strategy is summarized in Table 1.

3. Results

Data from a weather model, a satellite mission, and 160 GPS sites were collected within the dates and locations of phenomena and were used to track and validate the signature of the extreme weather event on GPS data. In this section, we will show the results obtained regarding the comparison between the ZWD and the rain rate from the TRMM satellite mission, followed by a description of the periods found on the ZTD and gradients’ spectral analysis. Finally, we will study the correlation between the gradients and atmospheric variables from ERA5, namely the atmospheric pressure gradients, water vapor gradients, and wind field components.

3.1. Relationship between ZWD and Rain Rate

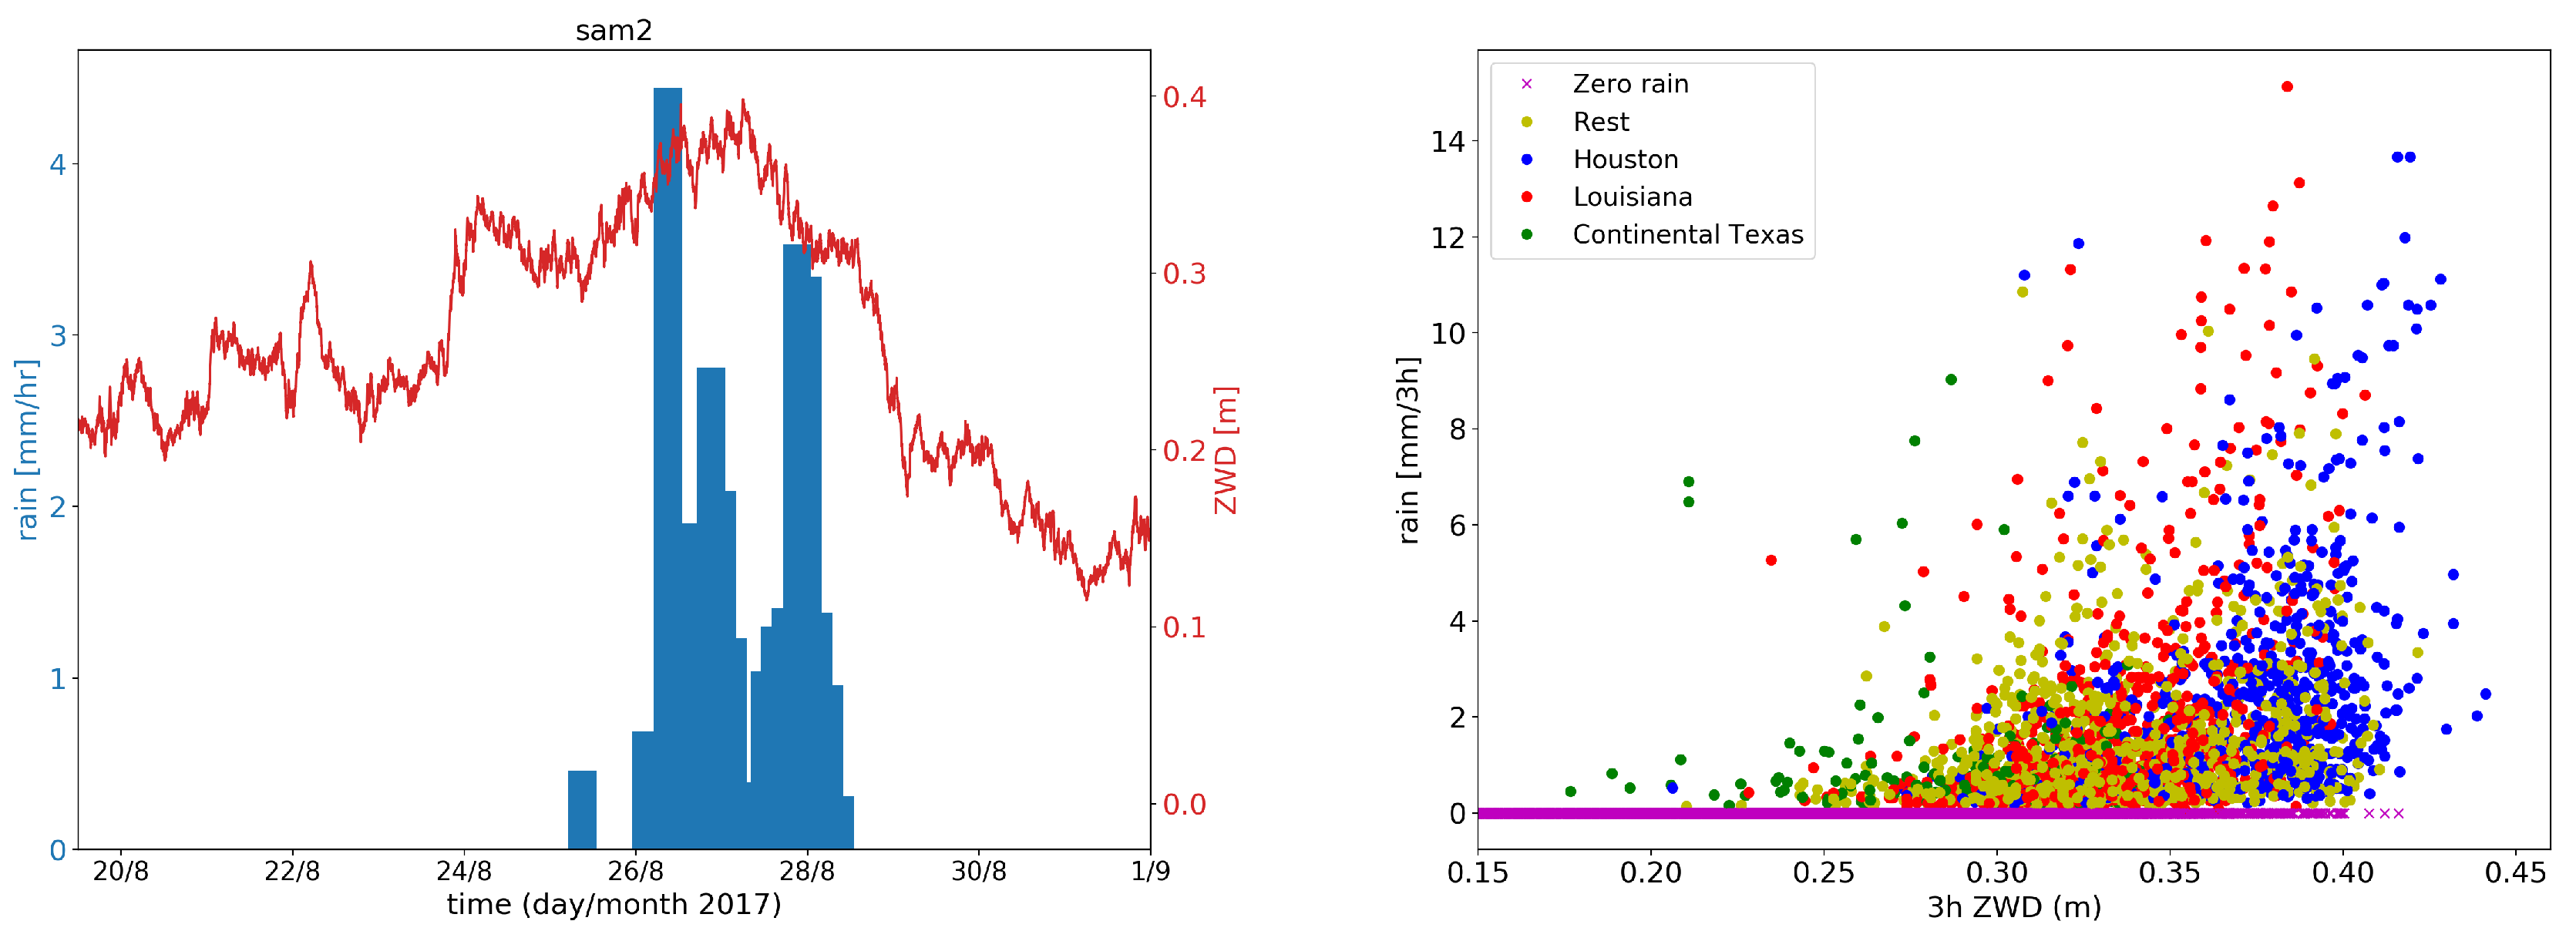
In this section, we will show the results obtained from the study of the ZWD and the rainfall rate from the multi-satellite TRMM mission. The resolution of the rainfall rate (called rain from here on) data is 3 h, while the ZWD is computed every 30 s. The left panel of Figure 2 shows both variables plotted for sam2 site for the whole studied period. The location of this site can be seen in Figure 1. Since the rain data is gridded, we have taken the corresponding value at the nearest grid point of the site coordinates. As it can be seen in the figure, the rain is registered when the greater values of the ZWD are obtained on the site. Even more revealing is the significant drop in the ZWD after the rainfall ends, reflecting the change in water vapor after it rains. This indeed indicates a positive relationship between the ZWD and heavy precipitation events. The right panel presents one-to-one values of 3 h-ZWD and rainfall rate for three different areas of concern: the Houston area, where the hurricane made its first landfall on the 26th, shown in blue; the Louisiana area, where the hurricane made its second landfall on the 30th, shown in red in the plot; the continental Texas area, shown in green; and the rest of the data in yellow. The three areas were chosen similarly to a previous study regarding Harvey’s stormwater weight [30], and they are represented in the left panel map of Figure 3. We have also represented in the right panel of Figure 2 all the values of the 3 h-ZWDs when the corresponding rainfall rate was detected as non-existent. These points are shown in magenta in the figure, and we can appreciate that the greatest values of the 3 h-ZWDs do not correspond to any non-existing rainfall data, meaning that all those 3 h-ZWDs values occurred when rainfall was detected. Furthermore, we can observe that, for the Houston area, the 3 h-ZWDs values are greater than those for the other areas, as well as that the Louisiana 3 h-ZWD values are greater than those for the continental Texas ones. With these results, we can conclude that the 3 h-ZWDs averages are accordingly related to different areas of impact of the hurricane. In addition, we can notice in this figure that greater values of the 3 h-ZWD also correspond to greater values from the rainfall rates, evidencing its capability to detect heavy rainfall.
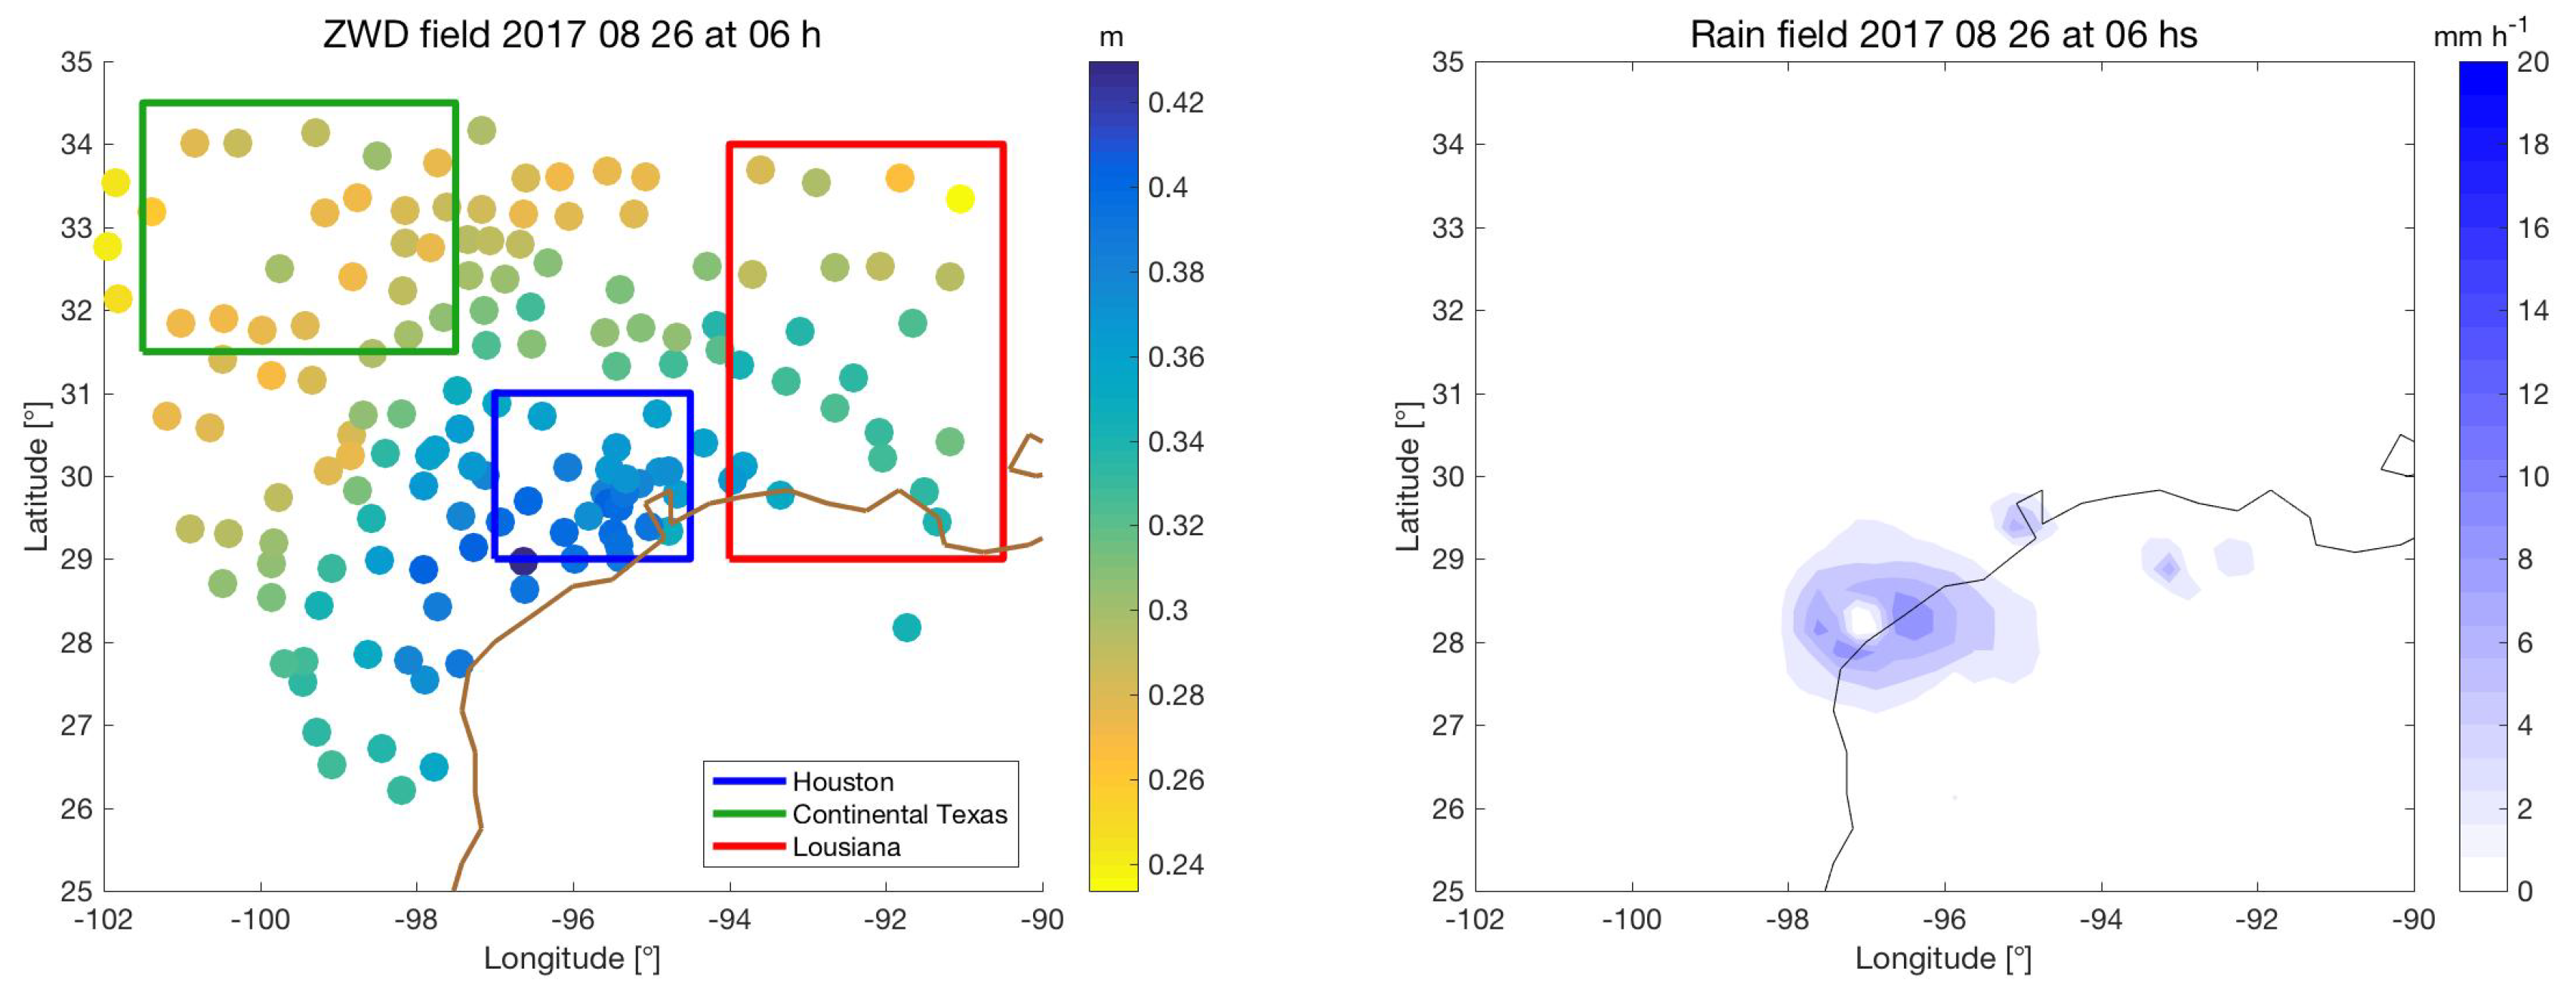
In Figure 3, we show the ZWD in the left panel and the rainfall in the right panel for 26 August 2017, 6 h UTC, which correspond to the landfall. The rain map, as can be seen, has large areas where there is no data, due to no rain being registered there; hence, the scale marks them in white. Since the ZWD is never zero, its scale is never empty, in any case. From this figure, we can confirm that the ZWD consistently shows greater values on the areas the rain was recorded. This result complements the temporal agreement of the two datasets shown before, as well as adding good spacial correlation.

3.2. Diurnal Cycle of the Tropospheric Delay and Horizontal Gradients

The horizontal tropospheric gradients are second order tropospheric products and have been included in geodetic GNSS processing for over 15 years now. These parameters contain atmospheric information, as shown in Reference [31], and physical signals often present periodic natural variability, which can be verified in their spectral representation. These variabilities are mainly related to the Earth’s motions, such as rotation and revolution around the Sun. Often, we will find the diurnal period on the ZTD [32], which is associated with the rotational motion of the Earth around its own axis. In this section, we aim to corroborate that this diurnal variation is actually present in our data and also that this characteristic is present in the gradients, which has not been shown in the literature yet, to our knowledge. This study, will support the robustness of the methodology, which is able to detect a characteristic on the variability of the estimates, even on the extreme case of a hurricane.
We also performed the spectral analysis of the time series obtained from UNR (University of Reno) [33] repository, both for the ZTD and its gradients. In this case, our interest is to check that both spectral analysis are coherent, and that they are represented by the same components. On one hand, differences are to be expected because, even with identical processing settings, results from different softwares are going to have discrepancies. In addition, we should mention that the resolution is 30 s and 5 min for TOMION and UNR products, respectively.
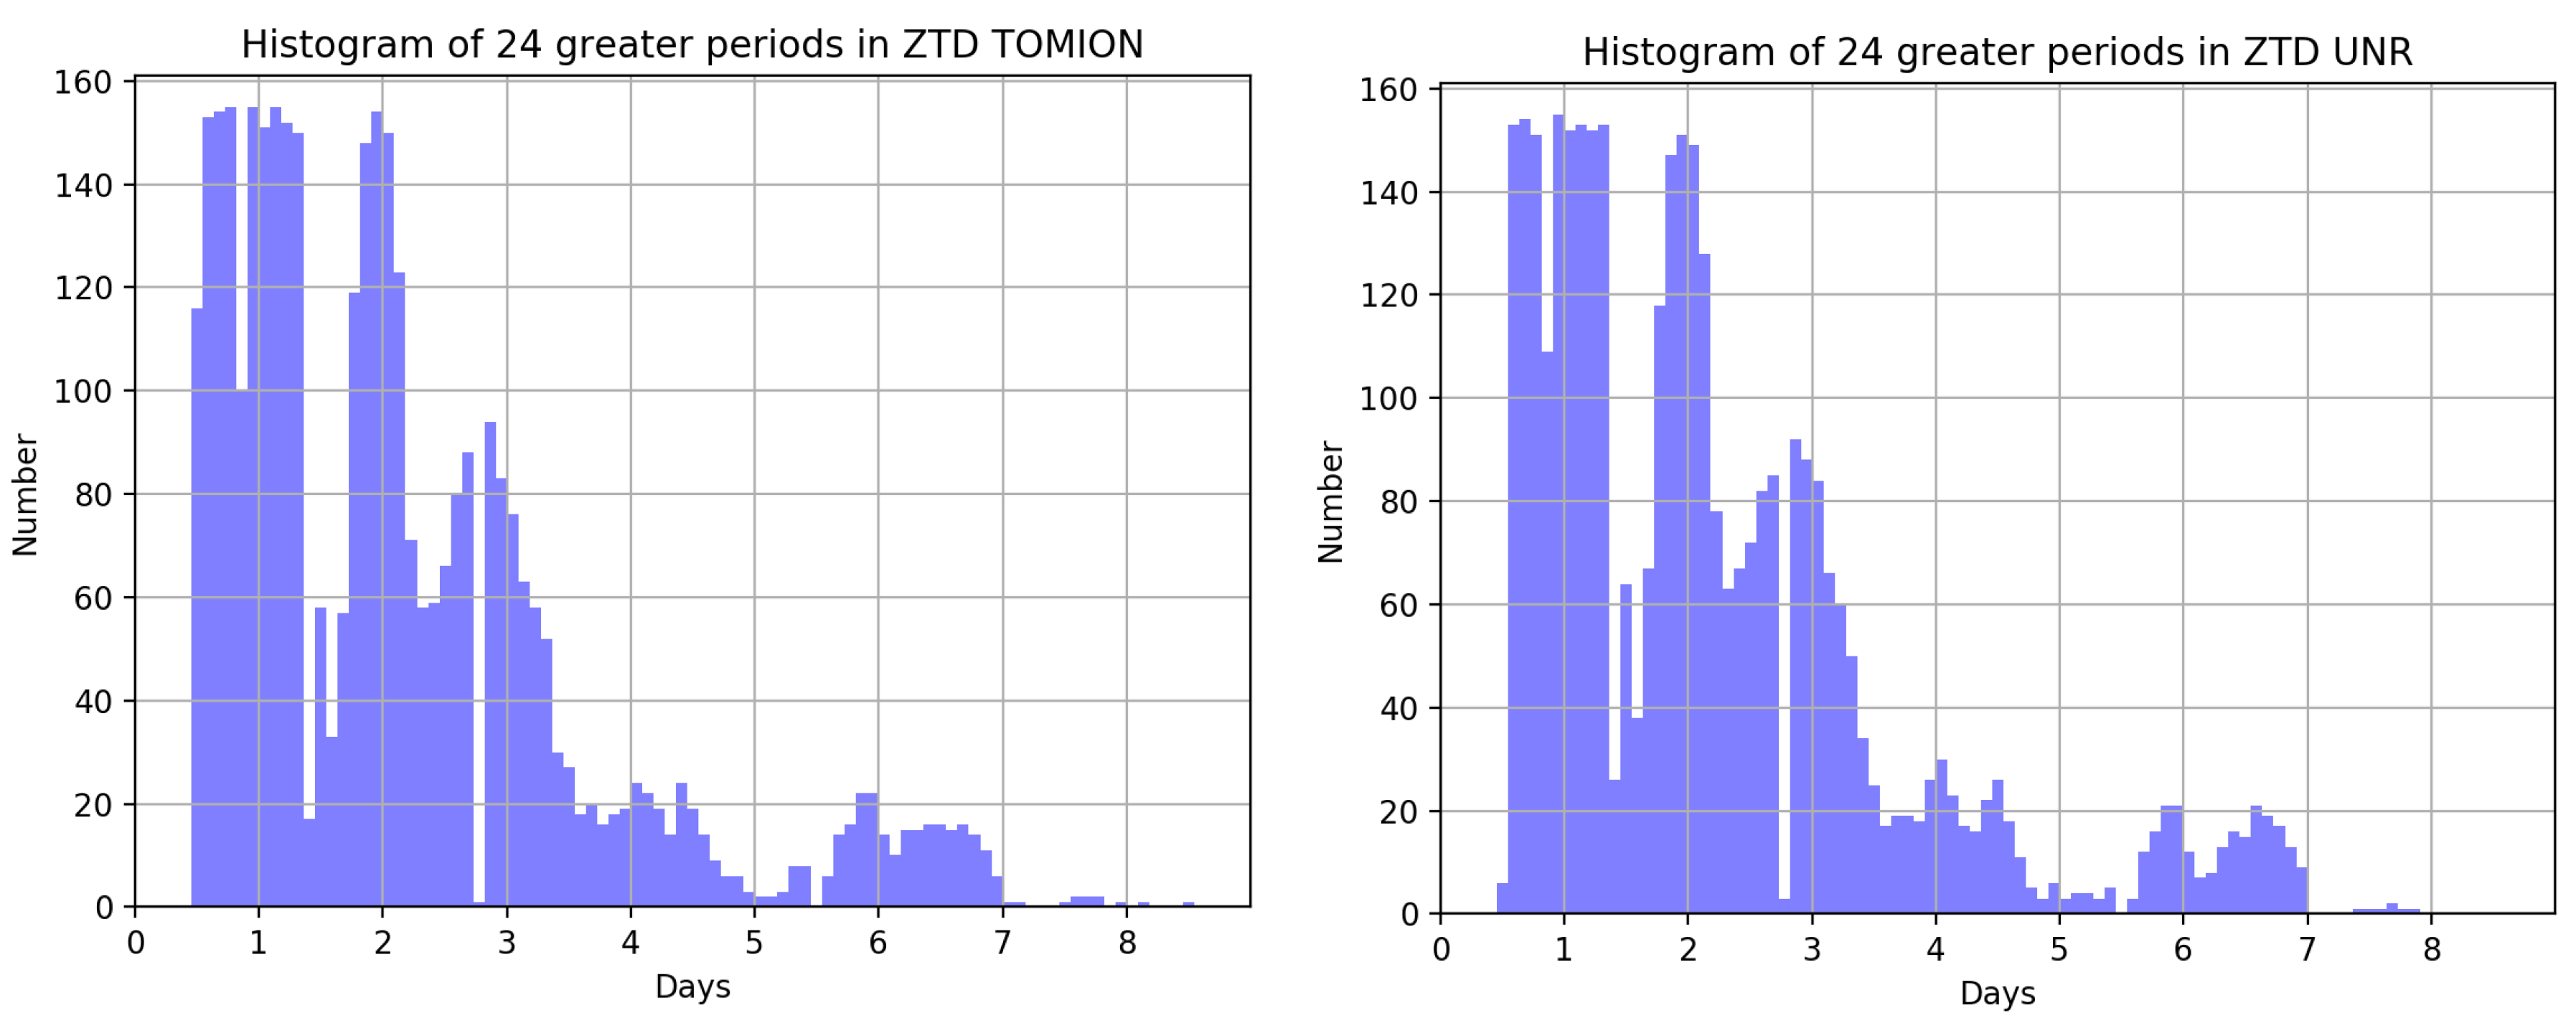
The frequencies present in the ZTD and gradients time series were identified by applying the Fast Fourier Transform (FFT) to the data. In the first place, we found, as it can be seen in Figure 4, where these periods are shown, that the diurnal cycle is indeed present in the data, both in the UNR and TOMION time series, together with the 2-, 3-day period, and with less intensity, in 6- and 7-day period. As mentioned before, the diurnal cycle is associated with the rotational motion of the Earth around its own axis, while the 2–3 and 6–7 period might be related to the duration of the storm. Longer time series and different scenarios should be analyzed to address this subject. Before applying the FFT, we previously corrected the batches of less than 10 epochs, i.e., 300 s, with the moving average of a 100 epochs window, and discarded those sites with 11 o more continuous missing data. Finally, we removed 5 stations from the list. After applying this filter, we performed the FFT to each single site and selected those periods in the spectral representation whose energy was higher, ignoring periods shorter than half a day and longer than 7 days, due to the length of the sample. Periods shorter than half a day are typically meaningless for atmospheric signals. Collecting the six greater periods in each individual spectrum, we displayed them in a distribution, i.e., a histogram, which is what is actually shown in Figure 4.
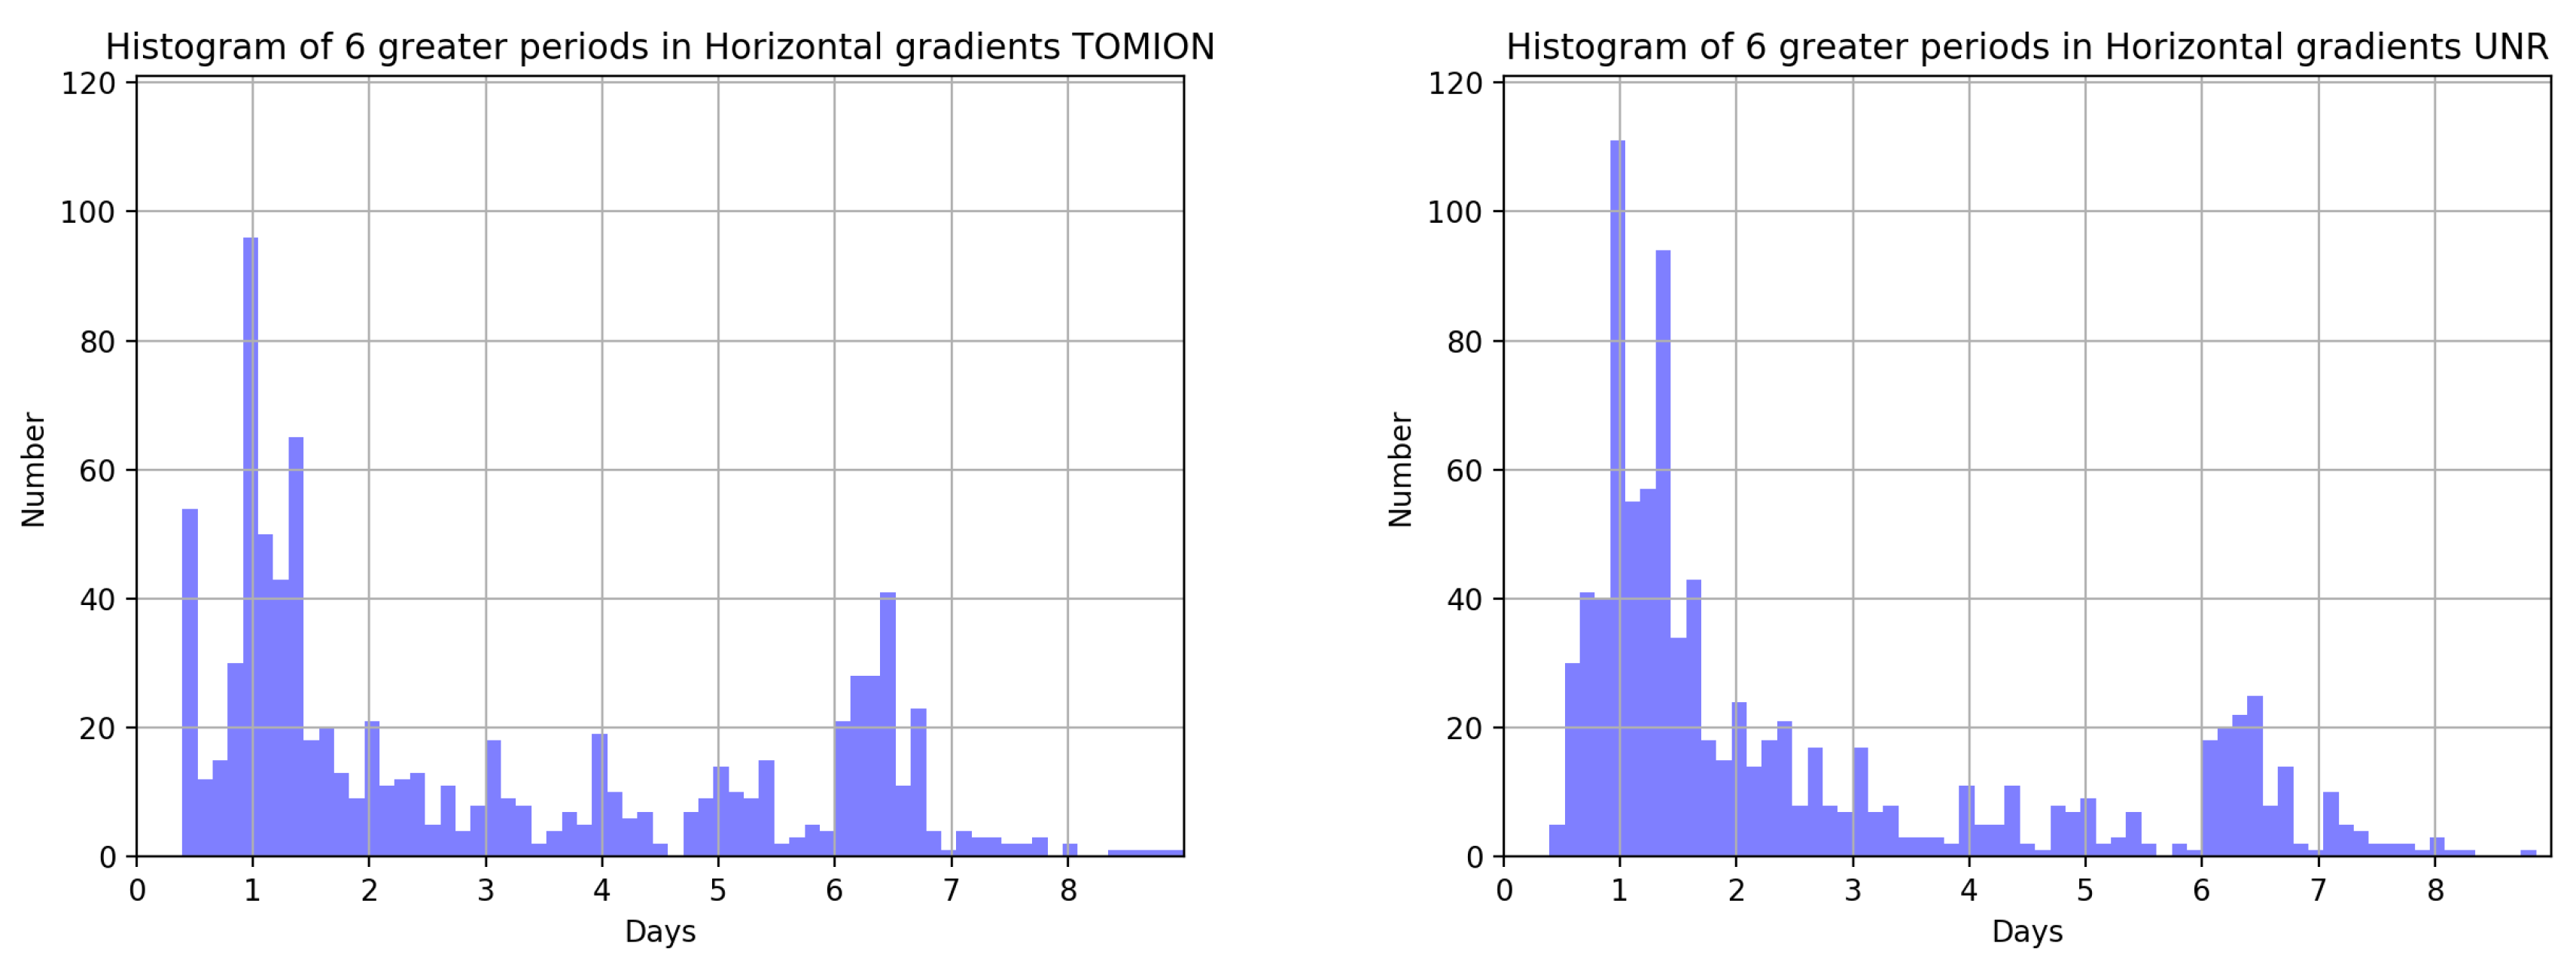
Applying a similar analysis for horizontal gradients, where the spectral analysis was performed on the horizontal gradient magnitude ( H O R = ( G N 2 + G E 2 ) 1 / 2 ), we present the histogram of the 6 periods with greater amplitude on the spectrum in Figure 5, for the UNR in the right, and TOMION products in the left, panel of the figure. As it can be seen, the diurnal period is present in both sources, as well as a potential 6.5-day period. This last one could be related to the duration of the storm on the area of around 6 to 7 days. More days and different time windows should be considered to confirm this.

3.3. Correlations with ERA5

In this section, we propose to study the temporal and spacial variability of the tropospheric gradients computed from GPS observations during Hurricane Harvey. The main goal of this part is to find a physical meaning to the gradients, if they had one, through the computations of the correlations with three atmospheric surface variables obtained from ERA5: atmospheric pressure, wind, and water vapor. The atmospheric pressure and the water vapor are scalar fields; hence, we computed their gradients in order to compare them with the tropospheric gradients. The correlations were performed with the east and north components, respectively. The wind, since it is already a vectorial field, we compared directly with the ZTD horizontal gradients vectors. In spite of this methodology being different from recent studies proposed by References [34,35,36], we prefer to perform direct comparisons with atmospheric variables, instead of computing gradients derived from the refractivity computed from NWM. Therefore, we compute the gradients of the water vapor field and the pressure field as:
f = f E , δ f N ,
where f is, namely, the field, and E and N are the east and north directions, respectively.
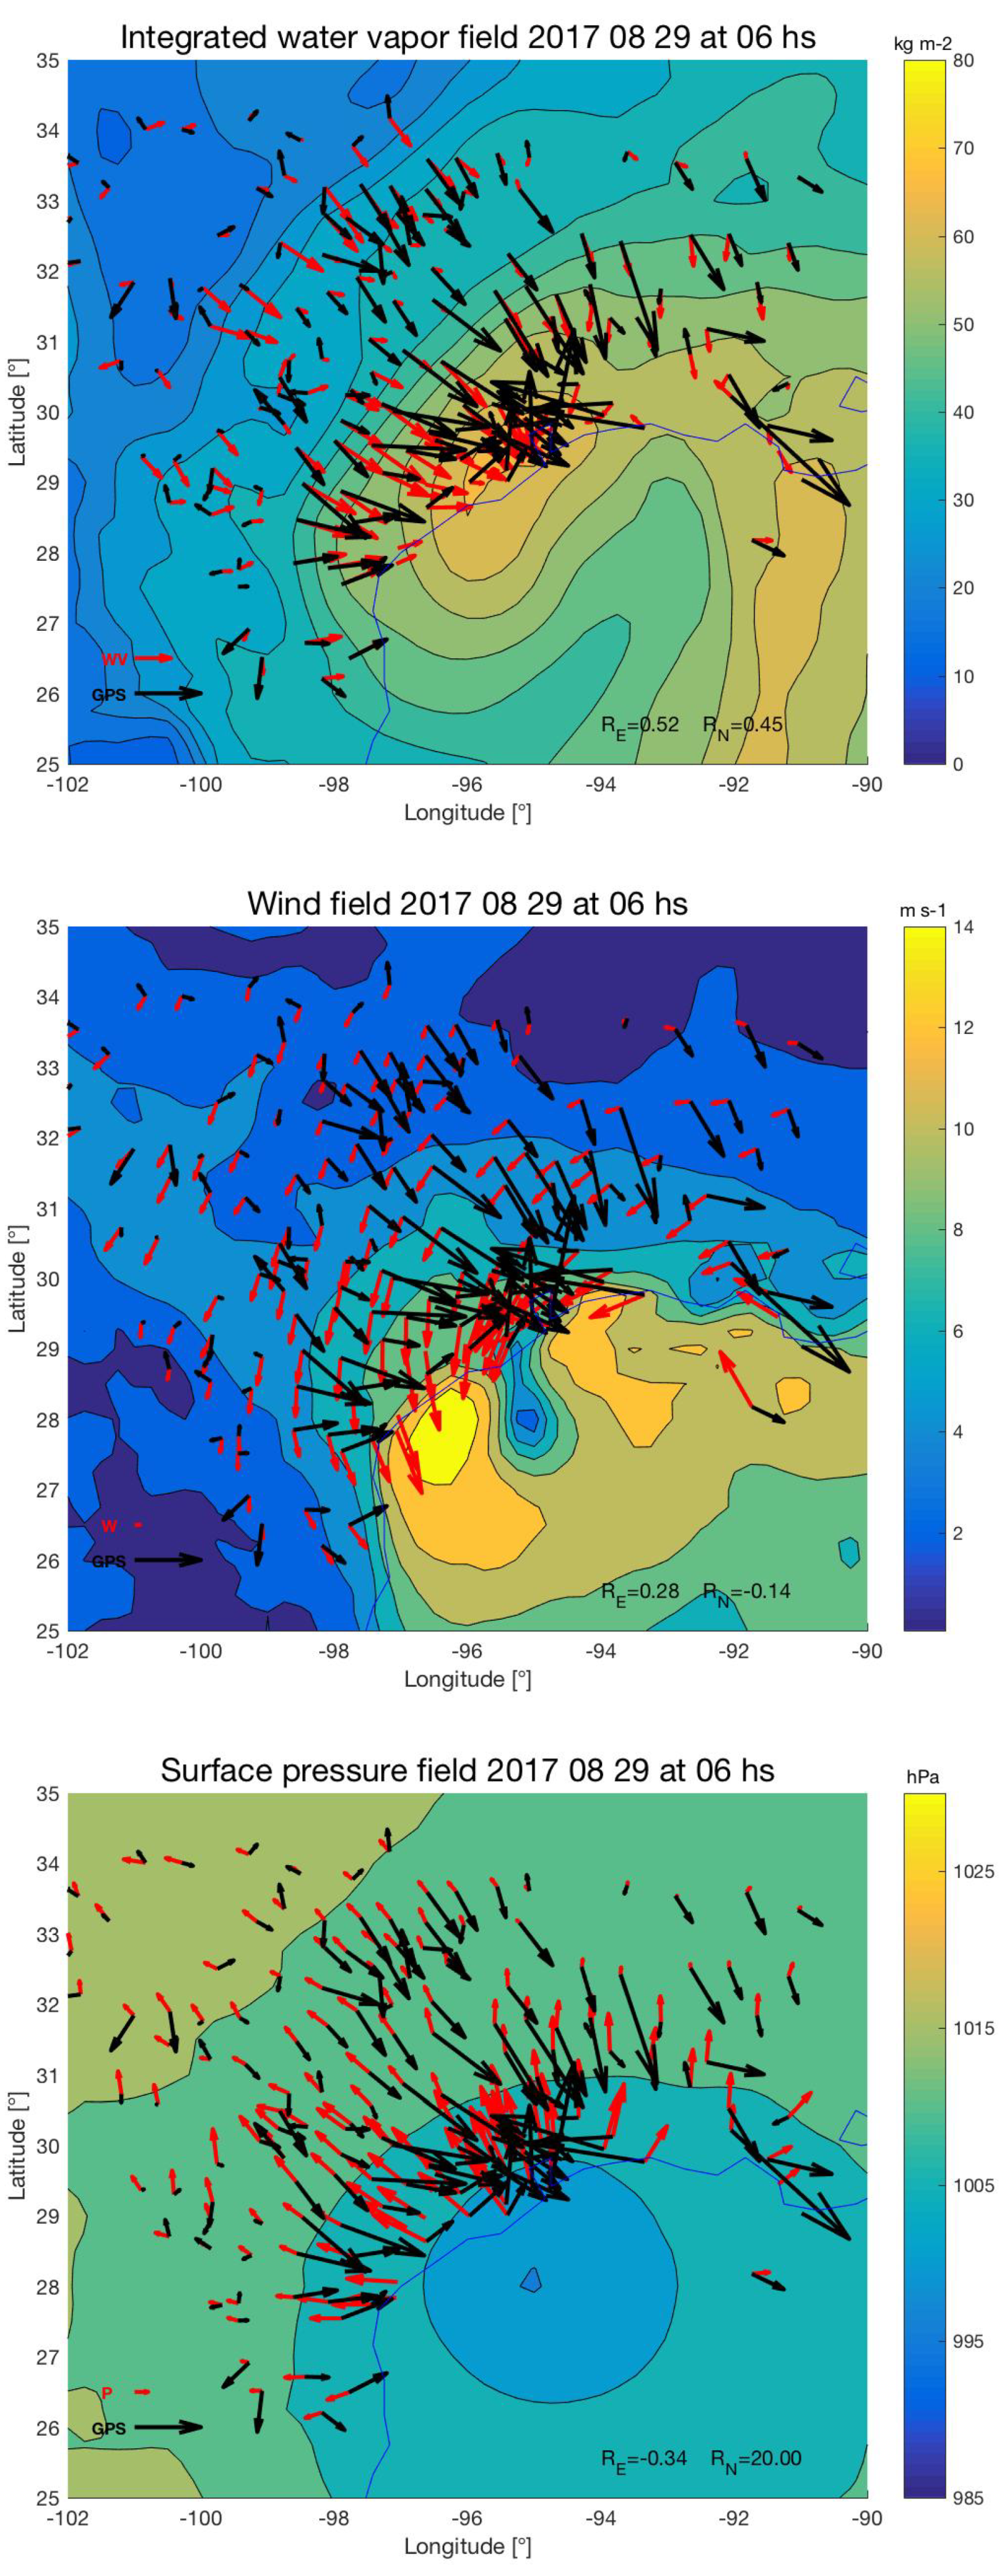
The temporal resolution of the ERA5 data is 1 h, and that of the TOMION v2 products is of 30 s; therefore, to be able to compare the variables mentioned above, we selected the tropospheric gradients, where the atmospheric products were available, i.e., every 1 h. The next three following figures will represent a temporal slice of each of the atmospheric values and the tropospheric gradients. In the top panel of Figure 6, we have plotted the water vapor gradient field in red arrows, and the tropospheric gradients in black. The scalar field in the background, in blue to yellow scale, is the water vapor scalar field from ERA5 at 6 h, on 29 August 2017. We can appreciate that, in the areas where the isolines are closer to each other and rather parallel, the tropospheric gradients and those of the water vapor are very similar, while, in the areas where the atmospheric activity is lower, the fields are less comparable to each other. Furthermore, greater tropospheric gradients are clearly more similar to greater water vapor, while smaller values are less comparable and show a different behavior.
The middle panel of Figure 6 represents the wind field from ERA5 and the tropospheric gradients, where the scalar field on the background corresponds to the magnitude of the horizontal wind computed as the square root of the sum of the squared components of the wind. The red arrows represent the wind field as a vectorial field, and the black arrows are the tropospheric gradients, which are the same ones as in the previous figure, since it is the same slice. We can see that the tropospheric gradients field are disposed rather orthogonally to the wind field, especially closer to the center of the cyclone, where the greater gradients of both fields occur.
Finally, the bottom panel of Figure 6 shows the atmospheric pressure field from ERA5, its gradients computed from Equation (2), and the tropospheric gradients with the same convention as the two previous figures. Here, we can appreciate that the tropospheric gradients are mostly arranged in the same direction but oppositely; hence, they are anti-correlated to the pressure gradients. We should note that the scale of the vectors is given at the bottom left of each figure, and the correlation of the fields for that given time frame, for the east and north component, is given on the bottom right of each figure.
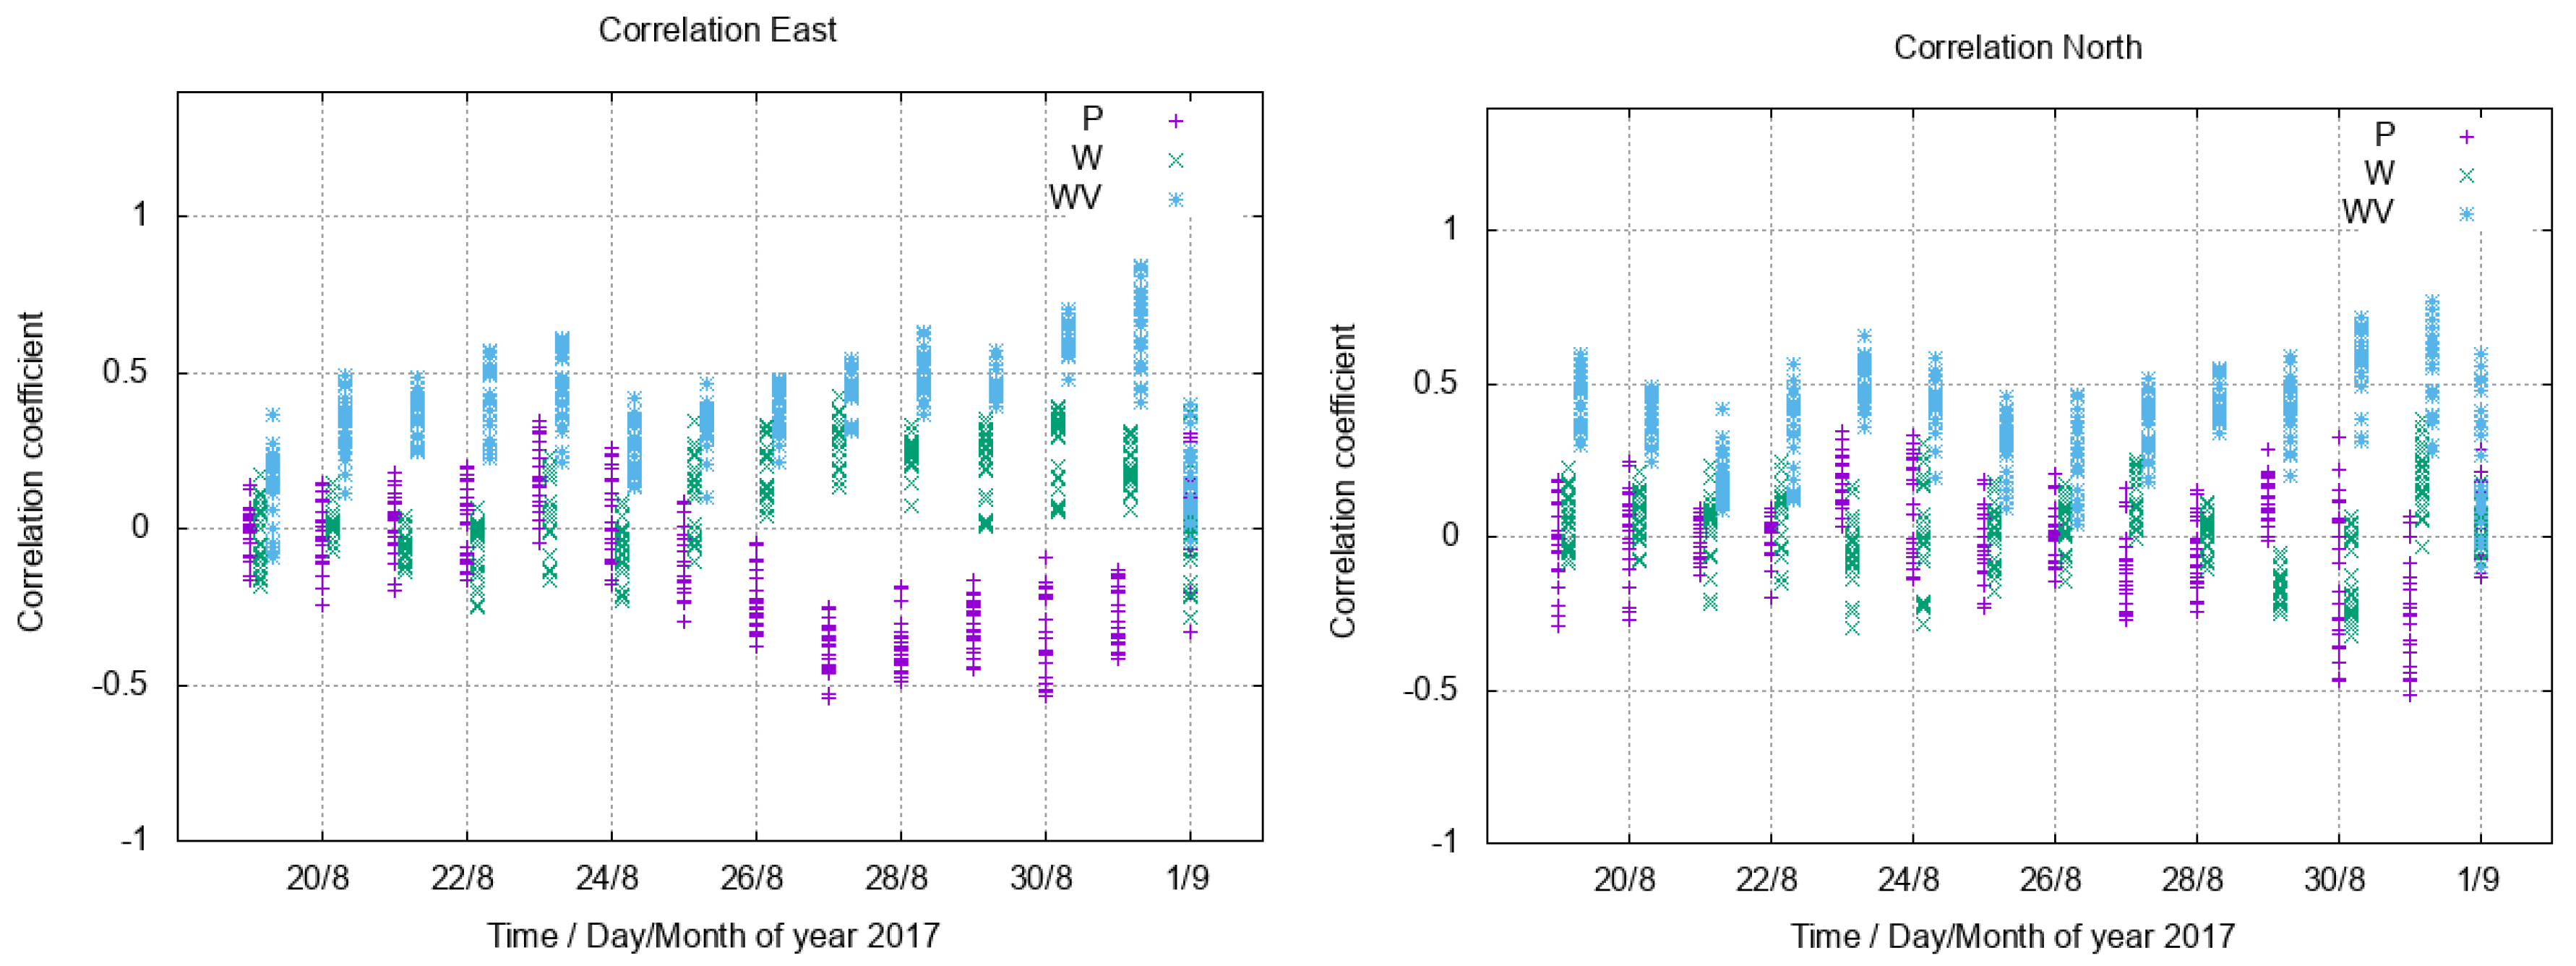
The quantitative results are shown in Figure 7, where P, WV, and V labels the correlations between the tropospheric tropospheric gradients and those of the atmospheric pressure and water vapor, and the wind components, respectively. On one side, we can point that, in general, tropospheric gradients present higher correlations with water vapor ones than with pressure ones or wind components. We represent each variable on the same abscissa for each day because of the periodicity found and studied in Section 3.2, for clarity of the plot. Each point in the figure represents the correlation between the fields of a frame, as in the previous 3 figures. The relationship with the pressure gradients is, rather, an anti-correlation, while, with the wind components, there seems to be no relationship at all. Moreover, we can appreciate that the correlations with the pressure are higher before the hurricane (landfall 26 August), while those with the wind are higher after the hurricane, and the correlations with the water vapor are higher before and after the hurricane, with a minimum on 22 August, clearly marking the approaching of the hurricane. These characteristics lead to the conclusion that the tropospheric gradients do track the signature of the hurricane, as well as showing a period of about 6 days which, again, reflects the passage of the storm and agrees with the spectral component found in Section 3.2.
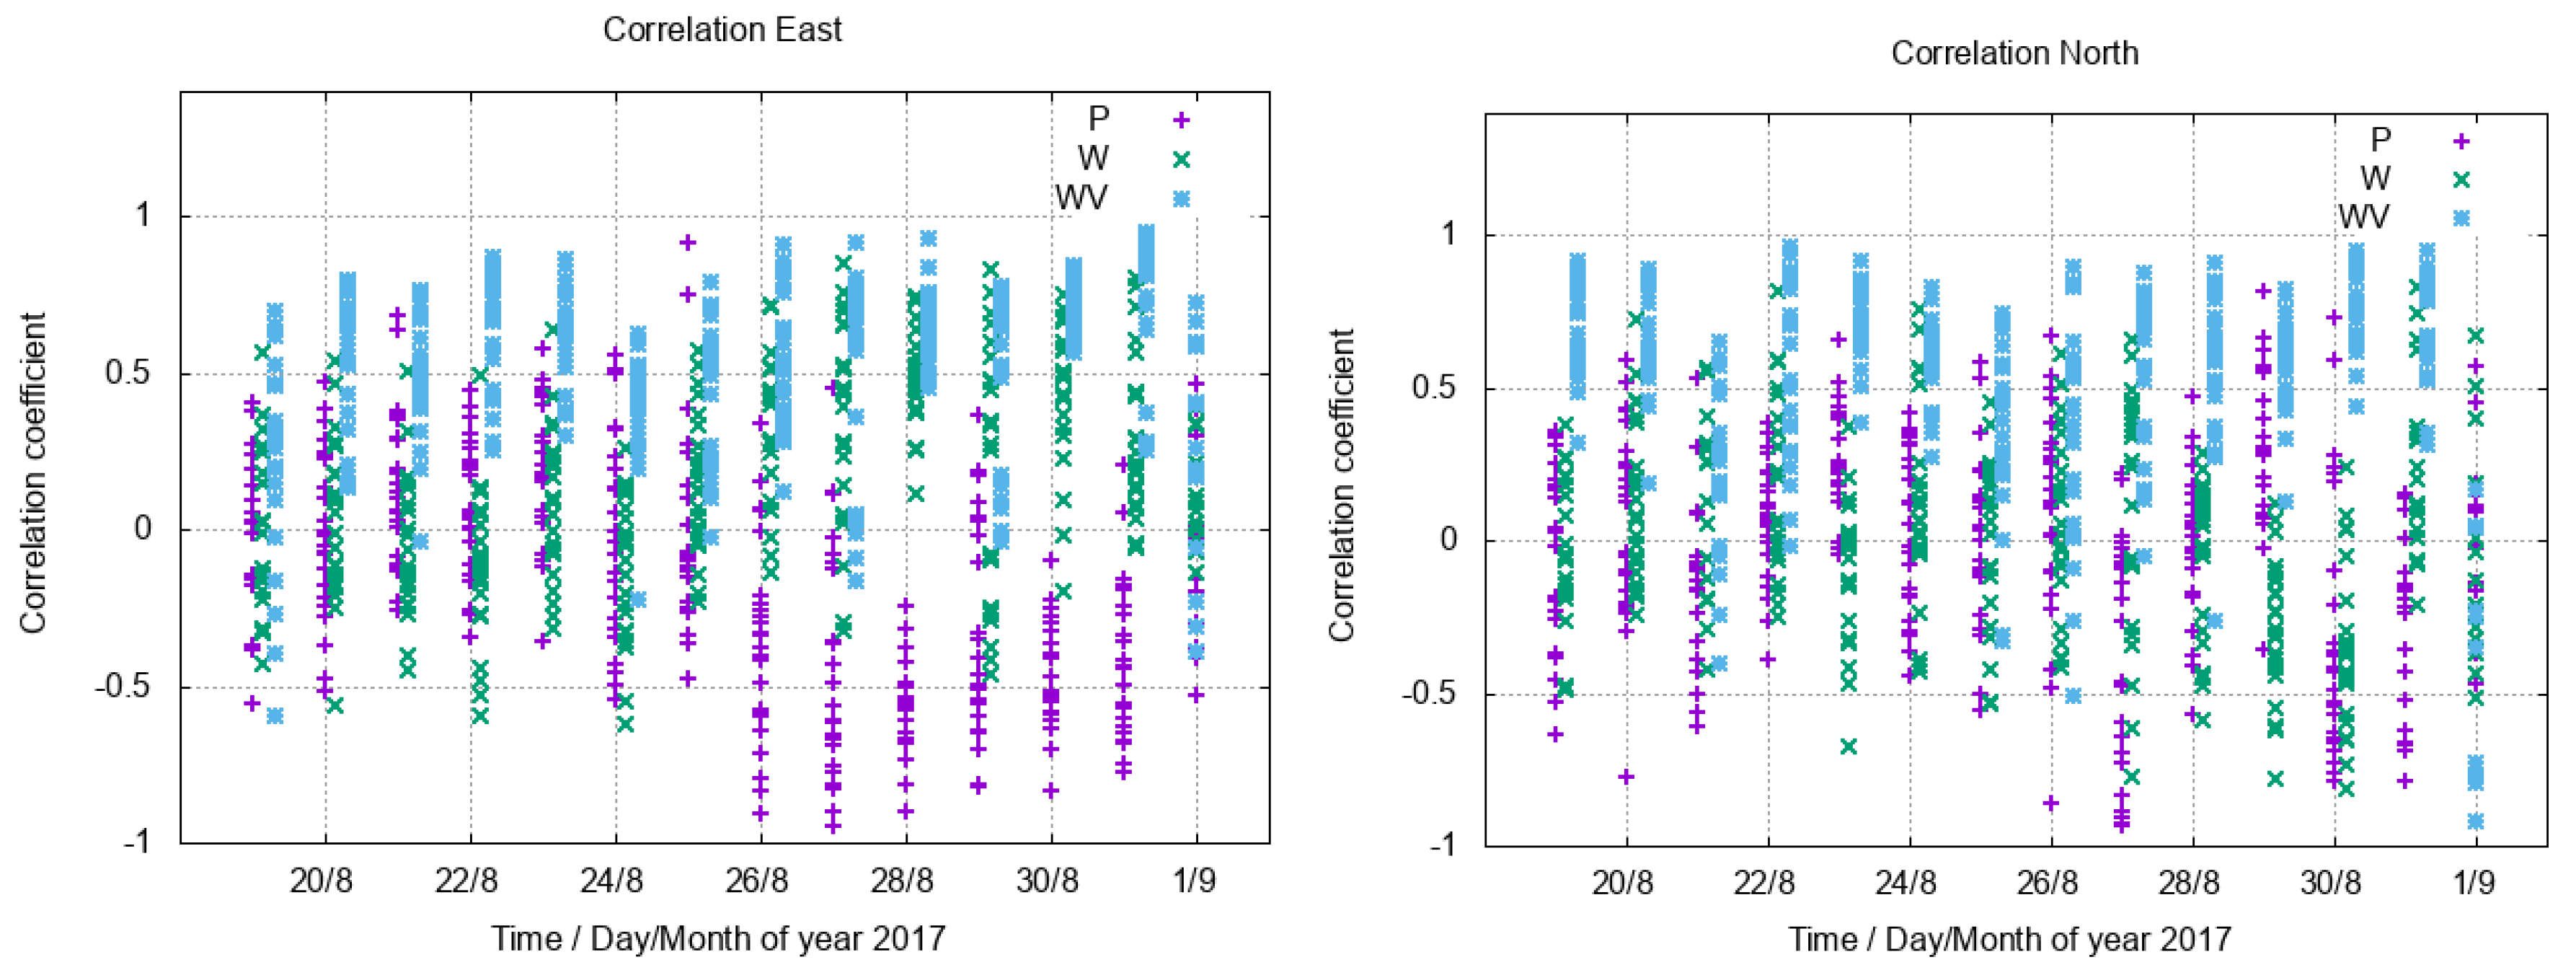
Figure 8 shows an analogous representation to Figure 7, but we now have selected only those tropospheric gradients that are greater than 2 mm. In this figure, then, we can see that the patterns described in the previous plots are appreciated here, as well. However, we can also notice that the correlations with the water vapor gradients are greater than before, hence evidencing that greater tropospheric gradients have more physical meaning than small ones. Furthermore, the tropospheric gradients are directly related to the water vapor ones during the extreme event, as they show a change in correlation before/after the landfall of the hurricane. Their relationship with the pressure gradients is such that, before the landfall, it is not as clear as after it, while, with the wind components, it is only evident after the landfall. The approaching of the hurricane to the study area, around 24 August is also noticeable in the correlation plots. Therefore, from these correlation curves, we can identify both the approaching, as well as the landfall, event.We can conclude that tropospheric gradients can be used to track the hurricane.
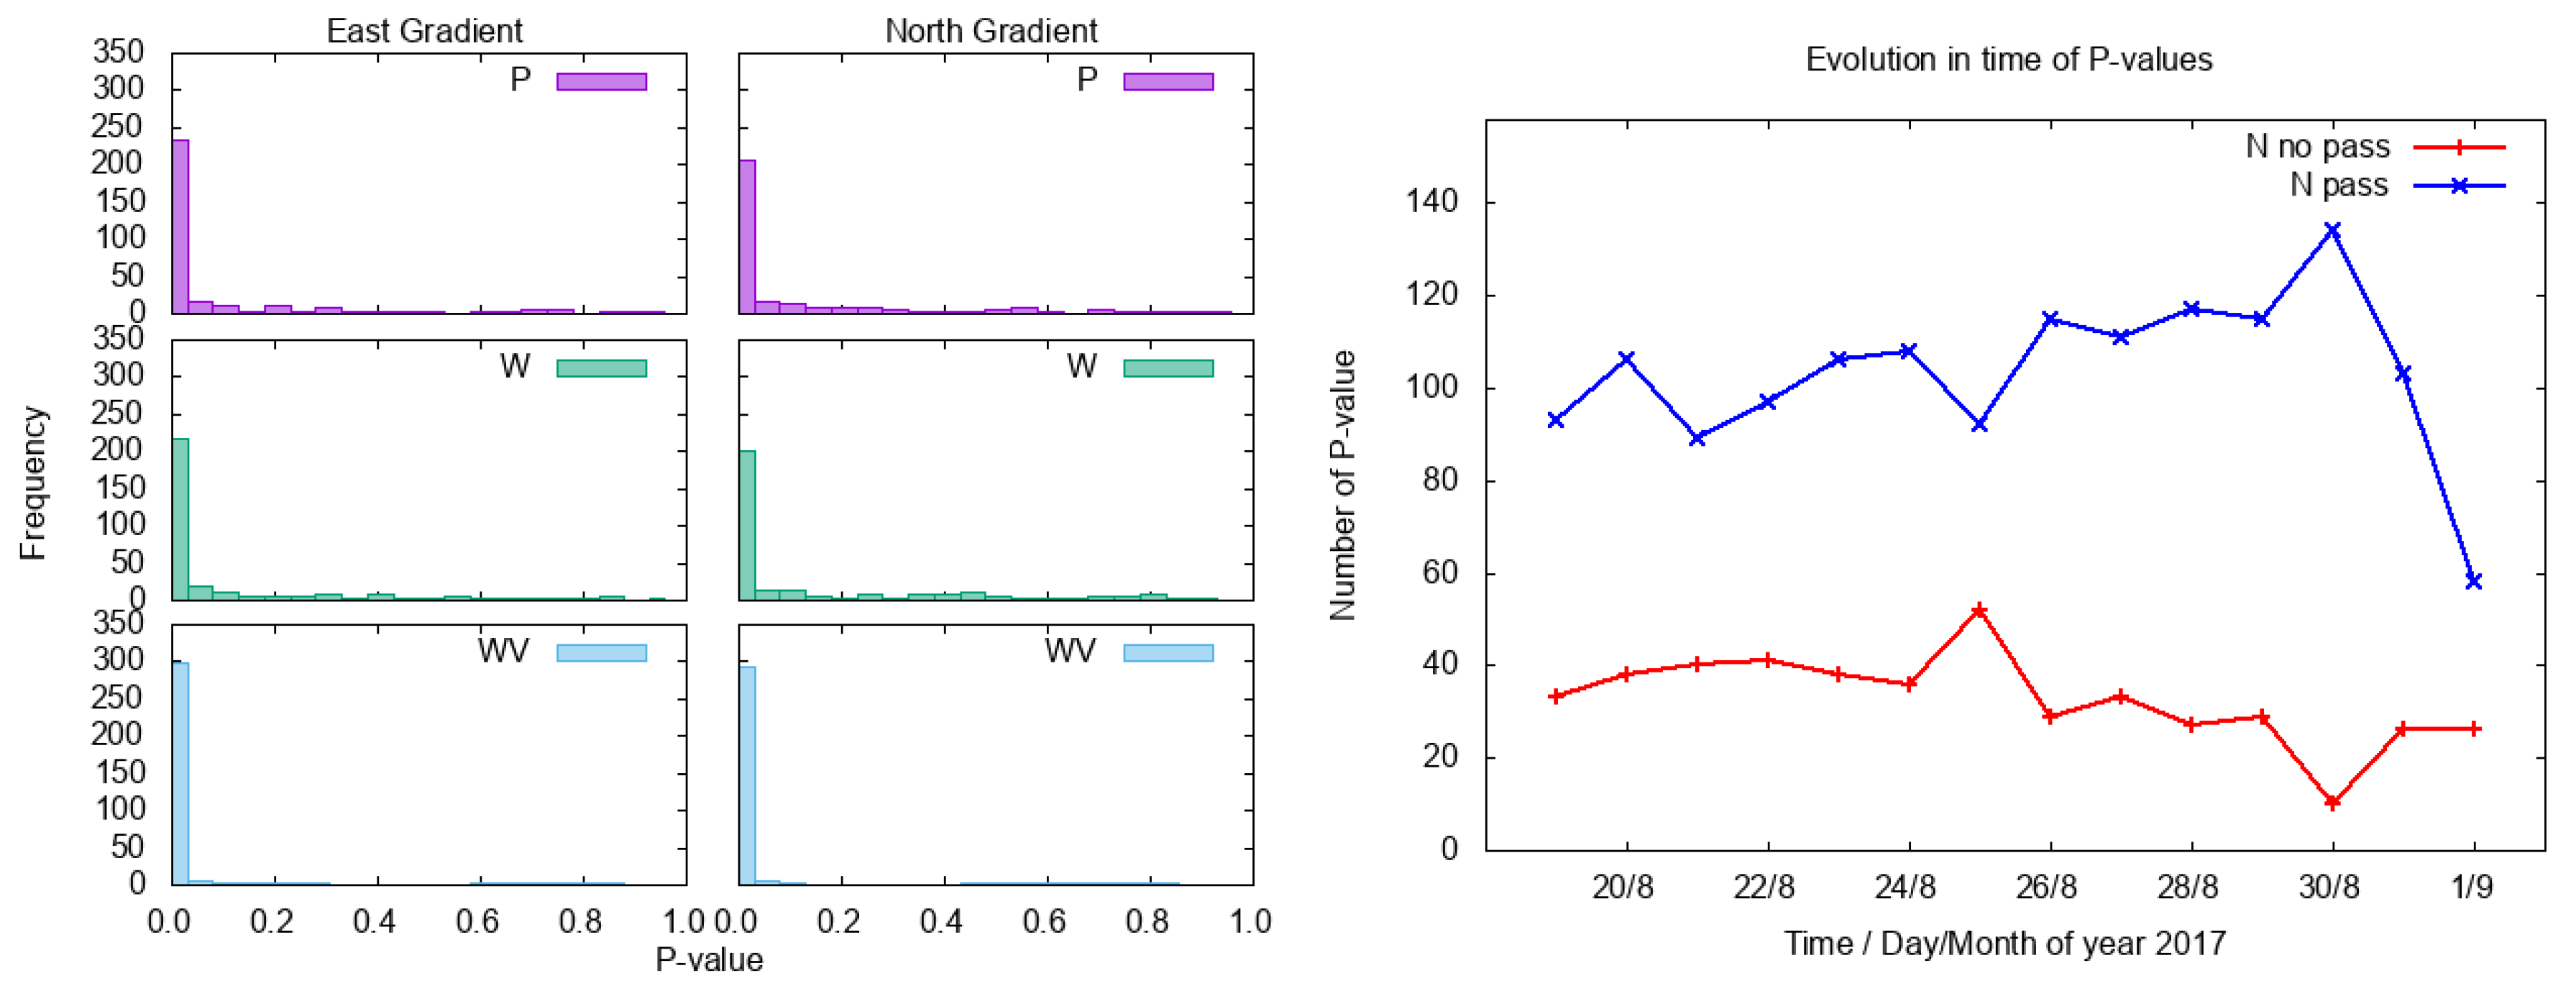
In Figure 9, we show a test performed on the correlations in order to study their level of significance. It is based on the probability to obtain every given measured Pearson correlation value under the available number of degrees of freedom (number of measurements minus two parameters estimated) under the null hypothesis, i.e., being both compared magnitudes uncorrelated. This is the so-called p-value test (see, for instance, pp. 630–633 in Reference [37]). Therefore, the corresponding p-value was computed for the three series of correlation coefficients (surface pressure, wind, and integrated water vapor), for both east and north components. On one hand, we can appreciate that the histograms show that most p-values are distributed in the first bin. At this point, we should mention that the bin width was set equal to the threshold of the test, which was chosen as the most often used value of 0.05. This feature is more significant in the integrated water vapor correlations than on the other series, confirming what was discussed before. In the right panel of Figure 9, we have plotted, for each day from 19 August to 1 September, the number of p-values that have values greater than the threshold in red, and those smaller than the threshold in blue. We can see that the correlations are significant, which means that the p-value test was passed, for the whole studied period. Moreover, the number of correlations that passed the test increased on those days after the landfall (26th), while those that did not pass decreased. These statistics are showing that the correlations found are significant and even more meaningful during the hurricane.

4. Conclusions

GNSS meteorology is one of the best complementary techniques, since it provides valuable information on tropospheric water vapor, to monitor and track synoptic and mesoscale systems due to its all-time, all-weather, low cost, and great extension operability. This methodology combined with the occurrence of a hurricane, then, offers a perfect scenario to both study the extreme weather event and exploit the information intrinsic to the estimated parameters, such as the ZTD and the tropospheric gradients.
With this work, we conclude, in the first place that, the tropospheric gradients and the tropospheric wet delay show a relationship with atmospheric variables throughout a 14-day study, where a hurricane struck the coast of Texas in August 2017. Hence, in this context, we selected three atmospheric variables: water vapor, pressure, and wind. All of them are provided by the ERA5 reanalysis surface data, and we chose them due to the nature of the storm and previous knowledge on the tropospheric gradients. We proceeded to compute the gradient field for the water vapor and the pressure, given their scalar nature, and we performed the correlations for each time frame and for each variable with the tropospheric gradients. We found that the horizontal tropospheric gradients are correlated with the water vapor gradients before and after the storm, while the correspondence with the wind components or the pressure gradients is higher after the hurricane landfall. This means that, on one hand, the tropospheric gradients are shown to have a physical meaning, and, on the other hand, that they clearly show the hurricane footprint.
In addition, we saw that the rain caused by the storm was also captured by the ZWD, showing a clear spatial and temporal correspondence between the rain and the ZWD. Finally, we were able to capture and describe patterns related to the extreme event, as well as general characteristics of the time series of the gradients and the ZTD. The temporal periodicity of the gradients and the ZTD show a clear diurnal period, as well as a potential 6/7-day component, that could be related to the duration of the storm. The diurnal period on the gradients is a novel contribution to the understanding of the horizontal tropospheric gradients beyond, and in spite of, an adverse scenario. In addition, in a comparison with the spectral components of ZTD and the gradients from UNR, we can see that the periodograms are very similar, showing the same peak frequencies, which evidences consistency of the data. However, larger data windows are needed for examining the tropospheric gradients’ temporal variability. This work contributes to the understanding of the physical meaning of the tropospheric gradients and to the monitoring of an extreme weather event.

Author Contributions

Conceptualization, V.G., M.G. and M.H.-P.; methodology, V.G.; software, V.G.; validation, V.G., M.H.-P. and F.A.; formal analysis, V.G.; investigation, V.G.; resources, V.G.; data curation, V.G.; writing—original draft preparation, V.G.; writing—review and editing, V.G.; visualization, V.G.; supervision, V.G.; project administration, V.G.; funding acquisition, M.H.-P. All authors have read and agreed to the published version of the manuscript.

Funding

This research received no external funding.

Institutional Review Board Statement

Not applicable.

Informed Consent Statement

Not applicable.

Conflicts of Interest

The authors declare no conflict of interest.

Abbreviations

The following abbreviations are used in this manuscript:
MDPIMultidisciplinary Digital Publishing Institute
DOAJDirectory of open access journals
TLAThree letter acronym
LDLinear dichroism

References

  1. Bevis, M.; Businger, S.; Herring, T.A.; Rocken, C.; Anthes, R.A.; Ware, R.H. GPS meteorology: Remote sensing of atmospheric water vapor using the Global Positioning System. J. Geophys. Res. Atmos. 1992, 97, 15787–15801. [Google Scholar] [CrossRef]
  2. Dick, G.; Gendt, G.; Reigber, C. First experience with near real-time water vapor estimation in a German GPS network. J. Atmos. Sol.-Terr. Phys. 2001, 63, 1295–1304. [Google Scholar] [CrossRef]
  3. Gendt, G.; Reigber, C.; Dick, G. Near real-time water vapor estimation in a German GPS network-first results from the ground program of the HGF GASP project. Phys. Chem. Earth Part A Solid Earth Geod. 2001, 26, 413–416. [Google Scholar] [CrossRef]
  4. Nykiel, G.; Figurski, M.; Baldysz, Z. Analysis of GNSS sensed precipitable water vapour and tropospheric gradients during the derecho event in Poland of 11th August 2017. J. Atmos. Sol.-Terr. Phys. 2019, 193, 105082. [Google Scholar] [CrossRef]
  5. Ejigu, Y.G.; Teferle, F.N.; Klos, A.; Bogusz, J.; Hunegnaw, A. Tracking Hurricanes Using GPS Atmospheric Precipitable Water Vapor Field. In International Association of Geodesy Symposia; Springer: Berlin/Heidelberg, Germany, 2020. [Google Scholar] [CrossRef]
  6. Dousa, J.; Dick, G.; Kačmařík, M.; Brožková, R.; Zus, F.; Brenot, H.; Stoycheva, A.; Möller, G.; Kaplon, J. Benchmark campaign and case study episode in central Europe for development and assessment of advanced GNSS tropospheric models and products. Atmos. Meas. Tech. 2016, 9, 2989–3008. [Google Scholar] [CrossRef] [Green Version]
  7. Guerova, G.; Jones, J.; Douša, J.; Dick, G.; Haan, S.D.; Pottiaux, E.; Bock, O.; Pacione, R.; Elgered, G.; Vedel, H.; et al. Review of the state of the art and future prospects of the ground-based GNSS meteorology in Europe. Atmos. Meas. Tech. 2016, 9, 5385–5406. [Google Scholar] [CrossRef] [Green Version]
  8. Van Baelen, J.; Reverdy, M.; Tridon, F.; Labbouz, L.; Dick, G.; Bender, M.; Hagen, M. On the relationship between water vapour field evolution and the life cycle of precipitation systems. Q. J. R. Meteorol. Soc. 2011, 137, 204–223. [Google Scholar] [CrossRef] [Green Version]
  9. Graham, E.; Koffi, E.N.; Mätzler, C. An observational study of air and water vapour convergence over the Bernese Alps, Switzerland, during summertime and the development of isolated thunderstorms. Meteorol. Z. 2012, 21, 561–574. [Google Scholar] [CrossRef]
  10. Elosegui, P.; Davis, J.; Gradinarsky, L.; Elgered, G.; Johansson, J.; Tahmoush, D.; Rius, A. Sensing atmospheric structure using small-scale space geodetic networks. Geophys. Res. Lett. 1999, 26, 2445–2448. [Google Scholar] [CrossRef] [Green Version]
  11. Zhang, K.; Manning, T.; Wu, S.; Rohm, W.; Silcock, D.; Choy, S. Capturing the signature of severe weather events in Australia using GPS measurements. IEEE J. Sel. Top. Appl. Earth Obs. Remote Sens. 2015, 8, 1839–1847. [Google Scholar] [CrossRef]
  12. Riccardi, U.; Tammaro, U.; Capuano, P. Tropospheric Delay in the Neapolitan and Vesuvius Areas (Italy) by Means of a Dense GPS Array: A Contribution for Weather Forecasting and Climate Monitoring. Atmosphere 2021, 12, 1225. [Google Scholar] [CrossRef]
  13. Shoji, Y. Retrieval of water vapor inhomogeneity using the Japanese nationwide GPS array and its potential for prediction of convective precipitation. J. Meteorol. Soc. Jpn. Ser. II 2013, 91, 43–62. [Google Scholar] [CrossRef] [Green Version]
  14. Elgered, G.; Tong, N.; Forkman, P.; Haas, R. On the information content in linear horizontal delay gradients estimated from space geodesy observations. Atmos. Meas. Tech. 2019, 12, 3805–3823. [Google Scholar] [CrossRef] [Green Version]
  15. Graffigna, V.; Hernández-Pajares, M.; Gende, M.; Azpilicueta, F.; Antico, P. Interpretation of the tropospheric gradients estimated with GPS during hurricane Harvey. Earth Space Sci. 2019, 6, 1348–1365. [Google Scholar] [CrossRef]
  16. Ning, T.; Elgered, G. High temporal resolution wet delay gradients estimated from multi-GNSS and microwave radiometer observations. Atmos. Meas. Tech. Discuss. 2021, 14, 5593–5605. [Google Scholar] [CrossRef]
  17. Chen, G.; Herring, T. Effects of atmospheric azimuthal asymmetry on the analysis of space geodetic data. J. Geophys. Res. Solid Earth 1997, 102, 20489–20502. [Google Scholar] [CrossRef]
  18. Bar-Sever, Y.E.; Kroger, P.M.; Borjesson, J.A. Estimating horizontal gradients of tropospheric path delay with a single GPS receiver. J. Geophys. Res. Solid Earth 1998, 103, 5019–5035. [Google Scholar] [CrossRef] [Green Version]
  19. Meindl, M.; Schaer, S.; Hugentobler, U.; Beutler, G. Tropospheric gradient estimation at CODE: Results from global solutions. J. Meteorol. Soc. Jpn. Ser. II 2004, 82, 331–338. [Google Scholar] [CrossRef] [Green Version]
  20. Kačmařík, M.; Douša, J.; Zus, F.; Václavovic, P.; Balidakis, K.; Dick, G.; Wickert, J. Sensitivity of GNSS tropospheric gradients to processing options. Ann. Geophys. Discuss. 2018, 2018, 1–19. [Google Scholar] [CrossRef] [Green Version]
  21. Olivares-Pulido, G.; Hernández-Pajares, M.; Lyu, H.; Gu, S.; García-Rigo, A.; Graffigna, V.; Tomaszewski, D.; Wielgosz, P.; Rapiński, J.; Krypiak-Gregorczyk, A.; et al. Ionospheric tomographic common clock model of undifferenced uncombined GNSS measurements. J. Geod. 2021, 95, 1–13. [Google Scholar] [CrossRef]
  22. Hersbach, H.; Bell, B.; Berrisford, P.; Hirahara, S.; Horányi, A.; Muñoz-Sabater, J.; Nicolas, J.; Peubey, C.; Radu, R.; Schepers, D.; et al. The ERA5 global reanalysis. Q. J. R. Meteorol. Soc. 2020, 146, 1999–2049. [Google Scholar] [CrossRef]
  23. Huffman, G.J.; Bolvin, D.T.; Nelkin, E.J.; Wolff, D.B.; Adler, R.F.; Gu, G.; Hong, Y.; Bowman, K.P.; Stocker, E.F. The TRMM multisatellite precipitation analysis (TMPA): Quasi-global, multiyear, combined-sensor precipitation estimates at fine scales. J. Hydrometeorol. 2007, 8, 38–55. [Google Scholar] [CrossRef]
  24. Graffigna, V. Validation of Real-Time Zenith Tropospheric Delay Estimation with TOMION Software within WAGNSS Networks. Master’s Thesis, Universitat Politècnica de Catalunya, Barcelona, Spain, 2017. [Google Scholar]
  25. Zumberge, J.; Heflin, M.; Jefferson, D.; Watkins, M.; Webb, F.H. Precise point positioning for the efficient and robust analysis of GPS data from large networks. J. Geophys. Res. Solid Earth 1997, 102, 5005–5017. [Google Scholar] [CrossRef] [Green Version]
  26. Dach, R.; Schaer, S.; Arnold, D.; Orliac, E.; Prange, L.; Susnik, A.; Villiger, A.; Jäggi, A. CODE Final Product Series for the IGS. 2016. Available online: https://boris.unibe.ch/75876/1/AIUB_AFTP.TXT (accessed on 21 December 2021).
  27. Saastamoinen, J. Atmospheric correction for the troposphere and stratosphere in radio ranging satellites. Use Artif. Satell. Geod. 1972, 15, 247–251. [Google Scholar]
  28. Askne, J.; Nordius, H. Estimation of tropospheric delay for microwaves from surface weather data. Radio Sci. 1987, 22, 379–386. [Google Scholar] [CrossRef]
  29. Böhm, J.; Schuh, H. Vienna mapping functions in VLBI analyses. Geophys. Res. Lett. 2004, 31, 277. [Google Scholar] [CrossRef]
  30. Milliner, C.; Materna, K.; Bürgmann, R.; Fu, Y.; Moore, A.W.; Bekaert, D.; Adhikari, S.; Argus, D.F. Tracking the weight of Hurricane Harvey’s stormwater using GPS data. Sci. Adv. 2018, 4, eaau2477. [Google Scholar] [CrossRef] [Green Version]
  31. Miyazaki, S.; Iwabuchi, T.; Heki, K.; Naito, I. An impact of estimating tropospheric delay gradients on precise positioning in the summer using the Japanese nationwide GPS array. J. Geophys. Res. Solid Earth 2003, 108, 4315. [Google Scholar] [CrossRef]
  32. Jin, S.; Luo, O.; Gleason, S. Characterization of diurnal cycles in ZTD from a decade of global GPS observations. J. Geod. 2009, 83, 537–545. [Google Scholar] [CrossRef]
  33. Blewitt, G.; Hammond, W.C.; Kreemer, C. Harnessing the GPS data explosion for interdisciplinary science. Eos 2018, 99, 485. [Google Scholar] [CrossRef]
  34. Tu, M.; Zhang, W.; Bai, J.; Wu, D.; Liang, H.; Lou, Y. Spatio-Temporal Variations of Precipitable Water Vapor and Horizontal Tropospheric Gradients from GPS during Typhoon Lekima. Remote Sens. 2021, 13, 4082. [Google Scholar] [CrossRef]
  35. Arief, S.; Heki, K. GNSS Meteorology for Disastrous Rainfalls in 2017–2019 Summer in SW Japan: A New Approach Utilizing Atmospheric Delay Gradients. Front. Earth Sci. 2020, 8, 182. [Google Scholar] [CrossRef]
  36. Zus, F.; Douša, J.; Kačmařík, M.; Václavovic, P.; Dick, G.; Wickert, J. Estimating the Impact of Global Navigation Satellite System Horizontal Delay Gradients in Variational Data Assimilation. Remote Sens. 2019, 11, 41. [Google Scholar] [CrossRef] [Green Version]
  37. Press, W.H.; Teukolsky, S.A.; Flannery, B.P.; Vetterling, W.T. Numerical Recipes in Fortran 77: Volume 1 of Fortran Numerical Recipes: The Art of Scientific Computing; Cambridge University Press: Cambridge, UK, 1992. [Google Scholar]
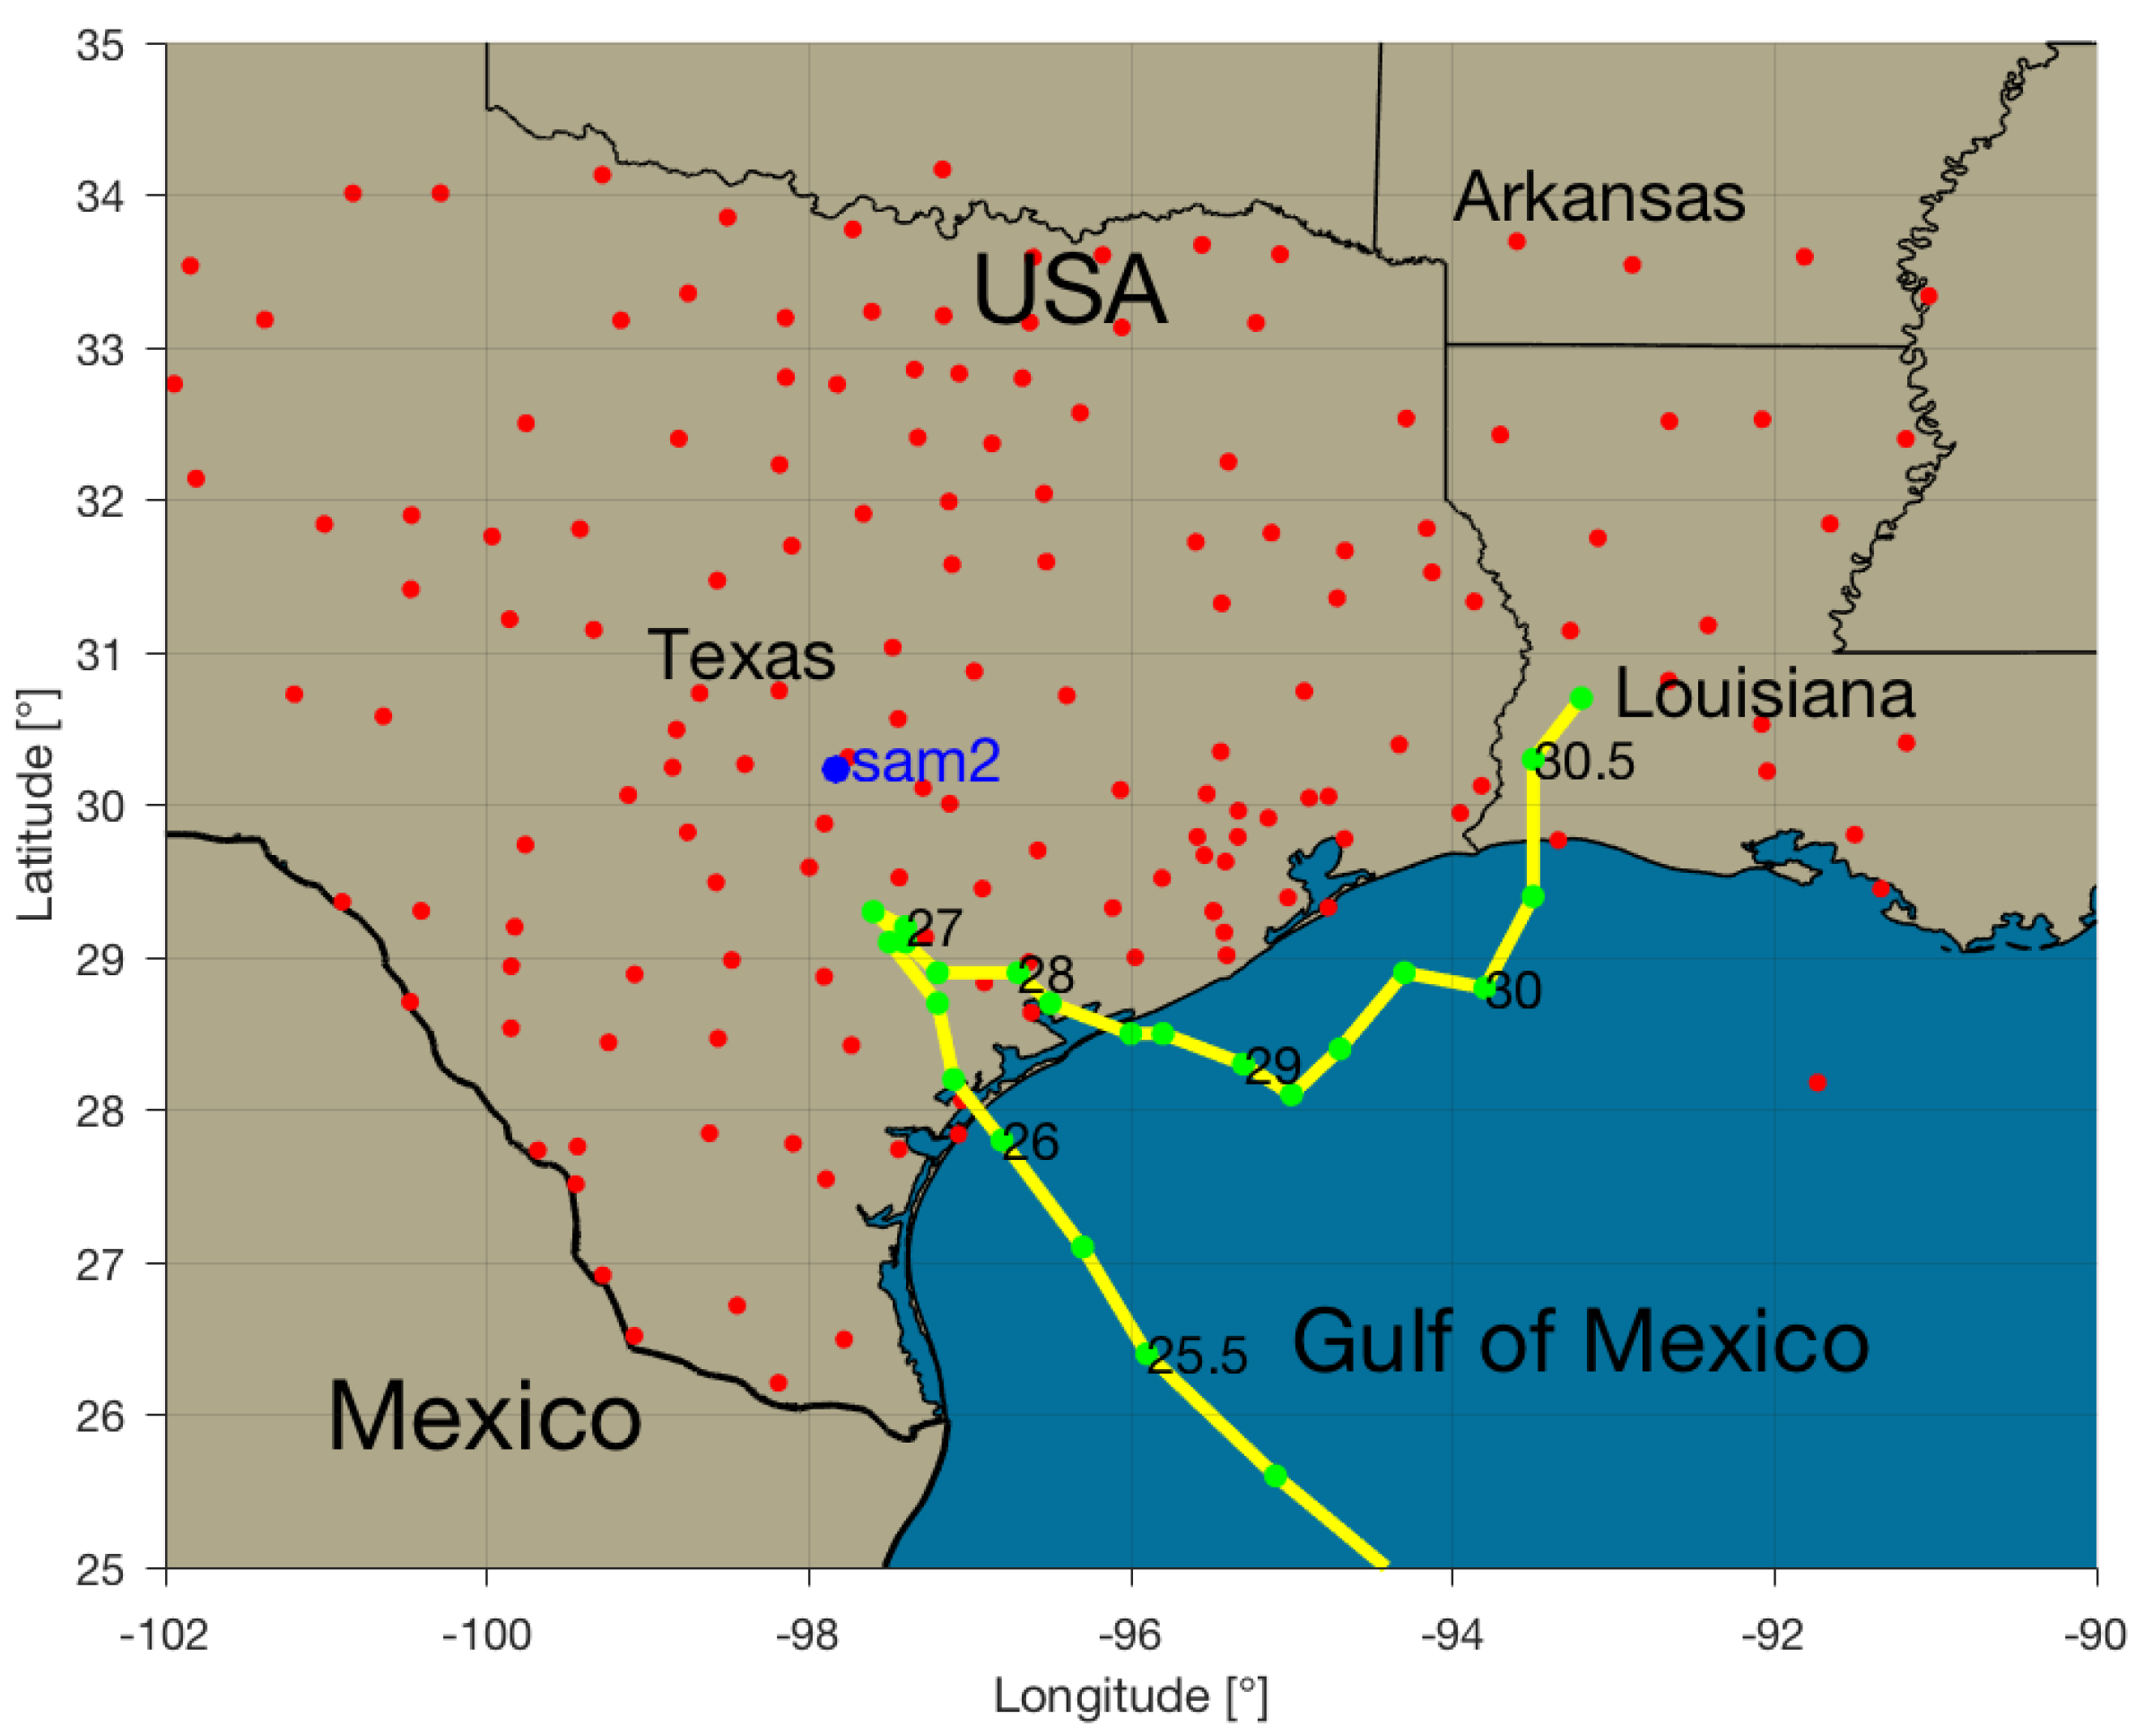
Figure 1. GNSS sites included in this research indicated in red dots. Most are located in the state of Texas, USA. In yellow is the track of the hurricane, with both its major landfalls, and in green is the eye’s position in the days of August with a resolution of 6 h. The track was downloaded from https://www.emc.ncep.noaa.gov/gc_wmb/vxt/HWRF (accessed on 21 December 2021).
Remotesensing 14 00888 g001
Figure 2. ZWD and TRMM rain data for sam2 (left). Correlation of rain and ZWD for the 3 selected areas (right).
Remotesensing 14 00888 g002
Figure 3. ZWD in m (left) and TRMM rain data in mm h 1 (right) for the study area on 26 August 2017, 6 h UTC, 3 h after landfall. In the left panel, we also have represented the three areas used for the analysis, shown in the right panel of Figure 2. The x- and y-axes are longitude and latitude in degrees for both panels, respectively.
Remotesensing 14 00888 g003
Figure 4. Periods found on the ZTD spectral representations of the individual sites for ZTD-TOMION (left) and ZTD-UNR (right).
Remotesensing 14 00888 g004
Figure 5. Periods for gradients TOMION (left) and UNR (right).
Remotesensing 14 00888 g005
Figure 6. Integrated water vapor gradient field (top—red), wind field (middle—red), surface pressure gradient field (bottom—red), and tropospheric gradients (all panels—black). Blue to yellow scale corresponds to the pressure field. Legend at the bottom left corner represents the scale for unitary vector of the corresponding field. Annotations on the bottom right corner are the correlations between the east and north fields, R E and R N , for 29 August at 6 h.
Remotesensing 14 00888 g006
Figure 7. Correlations between the pressure gradients (P), east and north wind component (W) and water vapor gradients (WV), and east and north tropospheric gradient components, respectively.
Remotesensing 14 00888 g007
Figure 8. Correlations between the pressure gradients (P), east and north wind component (W) and water vapor gradients (WV), and east and north tropospheric gradient components greater than 2 mm, respectively.
Remotesensing 14 00888 g008
Figure 9. (Left panel): p-values for the correlations between the pressure gradients (top—P), east and north wind component (middle—W) and water vapor gradients (bottom—WV), and for the east and north tropospheric gradient components greater than 2 mm, respectively. (Right panel): number of p-values for each day that are greater than 0.05 (red) and smaller than 0.05 (blue).
Remotesensing 14 00888 g009
Table 1. Summary of processing strategy.
ItemDescription
Sampling rate30 s
ObservablesGPS L 1 , L 2 , C 1 , P 1 , P 2
StrategyIonospheric-free combination
Troposphere delay modelingVMF1
Receiver clockwhite noise
A priori sigma of observations σ P c = 1.25 m y σ L c = 0.5 m.
Satellite orbits and clocksCODE high rate
Elevation weighting e ε S (S: Elevation weighting scale factor)
Elevation cutoff angle7 °
Publisher’s Note: MDPI stays neutral with regard to jurisdictional claims in published maps and institutional affiliations.