Article

Assessing the Wall-to-Wall Spatial and Qualitative Dynamics of the Brazilian Pasturelands 2010–2018, Based on the Analysis of the Landsat Data Archive

by
Claudinei Oliveira dos Santos
1,*,
Vinícius Vieira Mesquita
1,
Leandro Leal Parente
1,
Alexandre de Siqueira Pinto
2 and
Laerte Guimaraes Ferreira, Jr.
1
1
Image Processing and GIS Laboratory (LAPIG), Federal University of Goiás (UFG), Goiania 74001-970, GO, Brazil
2
Ecology Department, Federal University of Sergipe, São Cristóvão 49100-000, SE, Brazil
*
Author to whom correspondence should be addressed.
Remote Sens. 2022, 14(4), 1024; https://doi.org/10.3390/rs14041024
Submission received: 4 January 2022 / Revised: 9 February 2022 / Accepted: 14 February 2022 / Published: 20 February 2022
(This article belongs to the Special Issue State-of-the-Art Remote Sensing in South America)

Abstract

:
Brazilian livestock is predominantly extensive, with approximately 90% of the production being sustained on pasture, which occupies around 20% of the territory. It is estimated that more than half of Brazilian pastures have some level of degradation. In this study, we mapped and evaluated the spatiotemporal dynamics of pasture quality in Brazil, between 2010 and 2018, considering three classes of degradation: Absent (D0), Intermediate (D1), and Severe (D2). There was no variation in the total area occupied by pastures in the evaluated period, in spite of the accentuated spatial dynamics. The percentage of non-degraded pastures increased by ~12%, due to the recovery of degraded areas and the emergence of new pasture areas. However, about 44 Mha of the pasture area is currently severely degraded. The dynamics in pasture quality were not homogeneous in property size classes. We observed that in the approximately 2.68 million properties with livestock activity, the proportion with quality gains was twice as low in small properties compared with large ones, and the proportion with losses was three times greater, showing an increase in inequality between properties with more and fewer resources (large and small properties, respectively). The areas occupied by pastures in Brazil present a unique opportunity to increase livestock production and make areas available for agriculture, without the need for new deforestation in the coming decades.

1. Introduction

Brazil has the second largest cattle herd in the world, being the second largest producer and the largest exporter of meat [1,2,3]. However, its livestock is not very productive, requiring a herd larger than the European Union and the United States combined, to produce approximately half of the beef achieved by both [1,3]. One of the reasons for its low productivity is that the Brazilian livestock is predominantly extensive, with more than 90% of the herd being sustained on pasture [4]. For this reason, pastures occupy a large territorial extension, approximately 20% of the country’s territory [5]. In recent decades, there has been a marked growth in the livestock activity and, consequently, a great expansion in areas occupied by pastures [5,6,7,8]. The expansion of the area occupied by pastures and deforestation are strongly correlated, since forage cultivation is usually the first use in areas of conversion of native vegetation [5,9,10,11]. Likewise, the process of loss of productivity at levels that make the rancher abandon its land and look for places to install new pastures needs to be understood so that more efficient management practices can be introduced.
Pasture degradation is one of the main causes of productivity loss in the Brazilian livestock system, and a challenge faced by the sector for decades [12,13]. The process of degradation of pastures can take place over several years and is characterized by a decrease in the supply of food for the livestock and, consequently, reduction in the carrying capacity [14]. There are several factors that can lead to pasture degradation, most of which are linked to inadequate management practices, including the choice of forage, cattle stocking and fertilization, among others [4,15]. On the other hand, proper management can recover areas with low productivity and increase livestock production, thus contributing to a reduction in deforestation and, consequently, in GHG emissions (greenhouse gases) related to the sector [16,17,18,19,20].
In this context, initiatives have emerged that encourage the recovery of degraded pastures and the adoption of management strategies that promote gains in productivity and sustainability, reducing environmental impacts [21,22,23]. A highlight in this regard is the ABC Plan (the Low-Carbon Agriculture Plan, implemented by the Ministry of Agriculture, Livestock and Food Supply), a government initiative approved in 2011, which was developed in order to achieve the international commitments assumed by Brazil related to the reduction in GHG emissions [24]. As part of this plan, the Degraded Pasture Recovery (RPD) program was created, with the goal of promoting the recovery of 15 Mha of degraded pastures across the country by the year 2020, which represents more than 8% of the Brazilian pastures [24,25]. Therefore, the mapping and analysis of pasture quality at a national scale is essential both to assess the effectiveness of initiatives such as the ABC Plan, as to support future actions that seek to promote a more efficient use of areas occupied by pastures in Brazil.
Orbital remote sensing has been of fundamental importance in initiatives for mapping pastures, since the increase in image availability, combined with the advancement of analysis techniques and computational capacity, has enabled a better assessment of changes in land use and coverage at an unprecedented spatiotemporal scale [26]. In addition to monitoring the dynamics of the areas covered by pastures, it is also possible to use remote sensing for qualitative assessments. In this context, studies aimed at mapping and monitoring the quality of pastures through remote sensing have been conducted in various regions of the world [27,28,29]. Most of these studies used moderate spatial resolution data (MODIS) [30,31,32]. More recently, high spatial resolution data have been used in pasture quality assessments and biomass estimates [33,34,35]. Among the products most used for these qualitative analyzes is the NDVI (normalized difference vegetation index), considered a “proxy” of vegetative vigor and forage productivity [36]. In Brazil, several initiatives aiming to assess the quality of pastures using satellite data have been conducted at regional scales [37] or covering biomes [32], and in some cases for the entire national territory [30,31]. However, there is still no mapping of the quality of the Brazilian pastures at high spatial resolution (e.g., Landsat-based mapping), enabling the understanding of the dynamic patterns of this land use at both the national and property scales.
The identification of degraded pastures in Brazil is essential to support public policies related to their recovery, and given the dimensions of the Brazilian livestock, is of global importance. In this context, the objectives in this study were: (a) to present an analytical approach for mapping and monitoring the quality of pastures in Brazil; (b) characterize the dynamics and spatial pattern of the state of degradation of the Brazilian pastures in 2010 and 2018 (the period comprising the first phase of the ABC Plan); (c) evaluate the relationship between resources received by rural properties (private agricultural land of any size) under the ABC Plan and the increase in the quality of pastures.

2. Materials and Methods

2.1. Pasture Quality Classification

The classification of land cover in pasture was obtained from a study that mapped and analyzed the dynamics of pasture areas in Brazil from 1985 to 2017 [5]. In the classification, the authors used the entire collection of satellite data corresponding to the mapped period, and used the random forest classifier, a machine learning algorithm. The maps of this time series were extended by the authors until the year 2019 and were made available via the Digital Atlas of the Brazilian Pastures platform [38]. For the analyses in this study, we used the pasture classification maps related to the years 2010 and 2018, covering the first phase of GHG mitigation strategies under the ABC Plan.
The quality of Brazilian pastures was estimated based on the classification initially proposed to investigate degraded pastures in Tibet [27]. Subsequently, adjustments were made to this method in three studies in Brazil that evaluated: (1) the state of degradation of pastures in three watersheds in the state of São Paulo [37]; (2) the characterization of the annual dynamics of pastures in a watershed in Minas Gerais [19]; and (3) the dynamics of pasture quality in rural settlements in Goiás [39].
The classification of the quality of pastures throughout the Brazilian territory used in this work consisted of three sequential steps: (1) pre-processing of data indicating the state of degradation of pastures, so that they were comparable between the years analyzed. At this stage the noisy data were removed, the availability of data equalized, the spectral difference between the sensors corrected and the data normalized by homogeneous regions; (2) stratification of the images of each year analyzed into pasture degradation classes. At this stage, the pasture area in each degradation class was identified; later, the classified maps were compared with analyze the dynamics of the classes between the years considered; (3) calculation of the Pasture Degradation Index by property (PDI) from pasture area by degradation class.

2.2. Pre-Processing

The classification of pasture status was based on the NDVI values—normalized difference vegetation index—from the Landsat satellites [40]. The NDVI, which varies between −1 and 1, is positively correlated with the vegetation vigor (Equation (1)). Therefore, it has been used to assess the state of degradation and for biomass estimates of pastures [32,41,42]. At the beginning and end of the period analyzed (i.e., the years 2010 and 2018), data from the Landsat 5 and Landsat 8 satellites, respectively, were used. Landsat 5, equipped with the thematic mapper (TM) sensor, was launched in 1984 and was in operation until early 2013, and Landsat 8, equipped with the operational land imager (OLI) sensor and launched in 2013, is currently in operation. Launched into space with a difference of 29 years, these 2 satellite systems show significant differences, with Landsat 8 presenting greater image availability and finer spectral resolution.
NDVI = NIR RED NIR + RED
where NDVI is the normalized difference vegetation index; NIR is the reflectance of electromagnetic radiation in the near infrared spectrum; and RED is the reflectance of electromagnetic radiation in the red portion of the spectrum.
To classify pasture areas at the beginning and end of the analyzed period, we used median NDVI images. In the median calculation, all images available in a 24-month time window were used—necessary to contemplate a complete climatic year—comprising the 2nd semester of the previous year, the year of interest and the 1st semester of the subsequent year (i.e., from July 2009 to June 2011 and from July 2017 to June 2019). In order for the median images to be equivalent and comparable in spatial and temporal dimensions, the differences in image availability and spectral resolution between the 2 satellites were spectrally corrected (i.e., Landsat 5 and Landsat 8), the areas covered by clouds, shadows and noise were removed, and only scenes with less than 80% of cloud and shadow coverage were used.

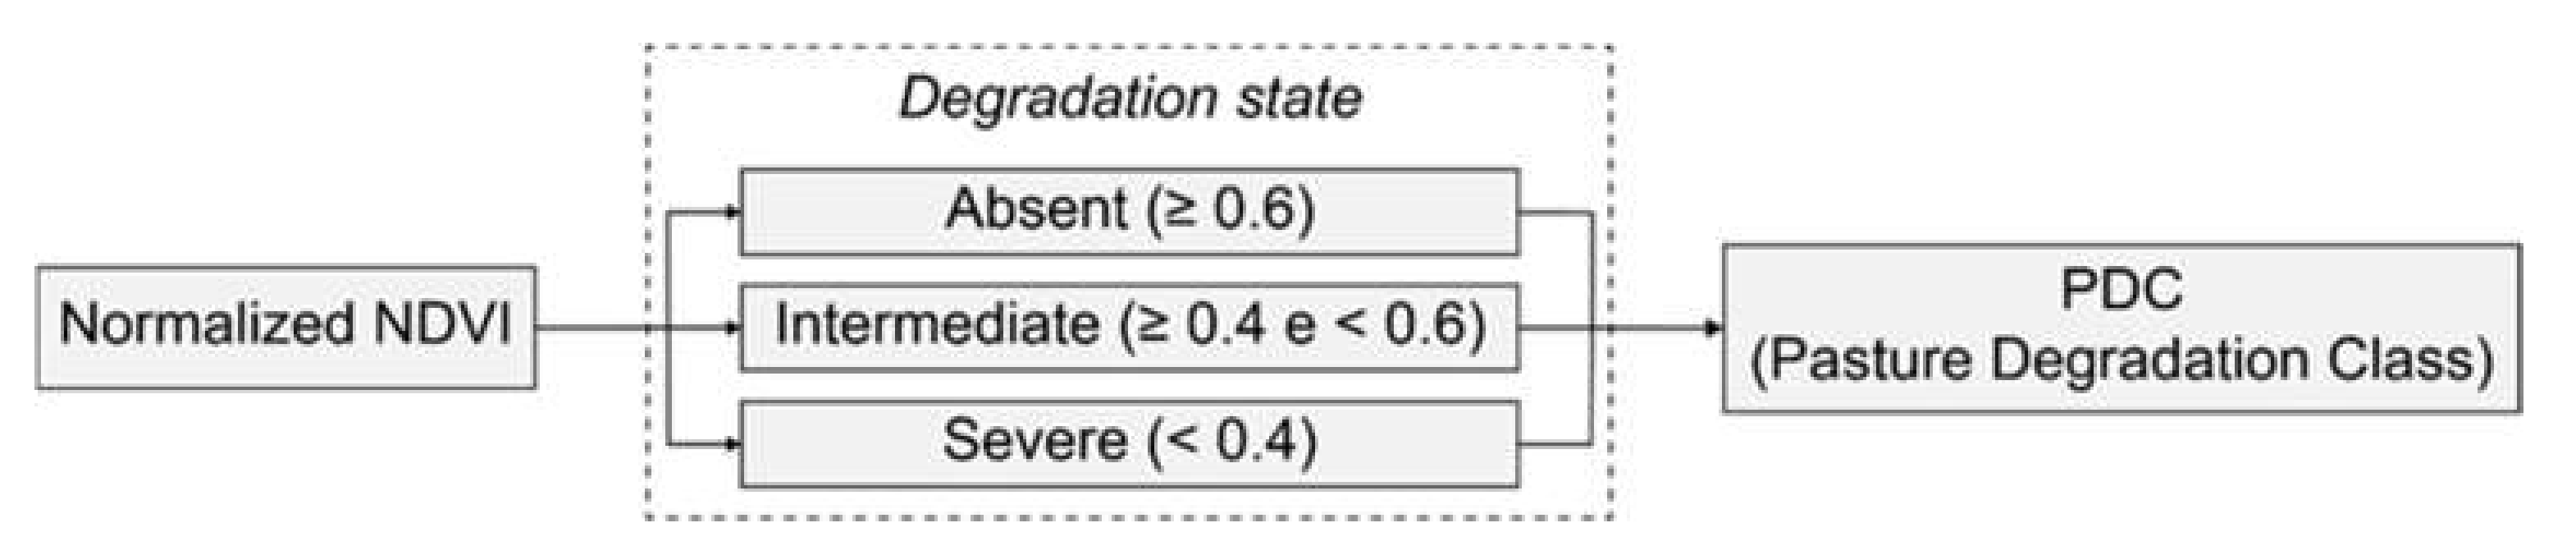
2.3. Pasture Degradation Classes

The median NDVI images were normalized by biomes in order to reduce the expected differences in the values of this parameter in response to edaphoclimatic conditions, making the index equivalent between different biomes (Equation (2)), as follows:
NDVInorm = NDVI NDVImin NNDVImax NDVImin
where NDVInorm is the normalized NDVI for each biome, ranging from 0 to 1; NDVImin is the average of 1% of the lowest values of all NDVI data in the unit of analysis (i.e., biome); and the NDVImax is the average of 1% of the highest values in this same unit of analysis, considering the combined periods (i.e., from July 2009 to June 2011 and from July 2017 to June 2019).
The resulting NDVInorm images were stratified into pasture degradation state classes. Andrade et al. [37] evaluated 4 classes of pasture degradation status—Absent [>0.6], Mild [>0.5 and ≤0.6], Moderate [>0.4 and ≤0.5] and Severe [≤0.4]—and concluded that the method is effective in identifying the Absent and Severe classes; however, it does not perform as well in distinguishing the Mild and Moderate classes from each other. Therefore, we grouped the Mild and Moderate classes in order to work with only the remaining three degradation state classes (Absent [>0.6], Intermediate [>0.4 and ≤0.6] and Severe [≤0.4]) (Figure 1). Degradation classes, henceforth, are referred to by the abbreviations D0 (Absent), D1 (Intermediate) and D3 (Severe), and areas not mapped in a given year are referred to as NP (not pasture).

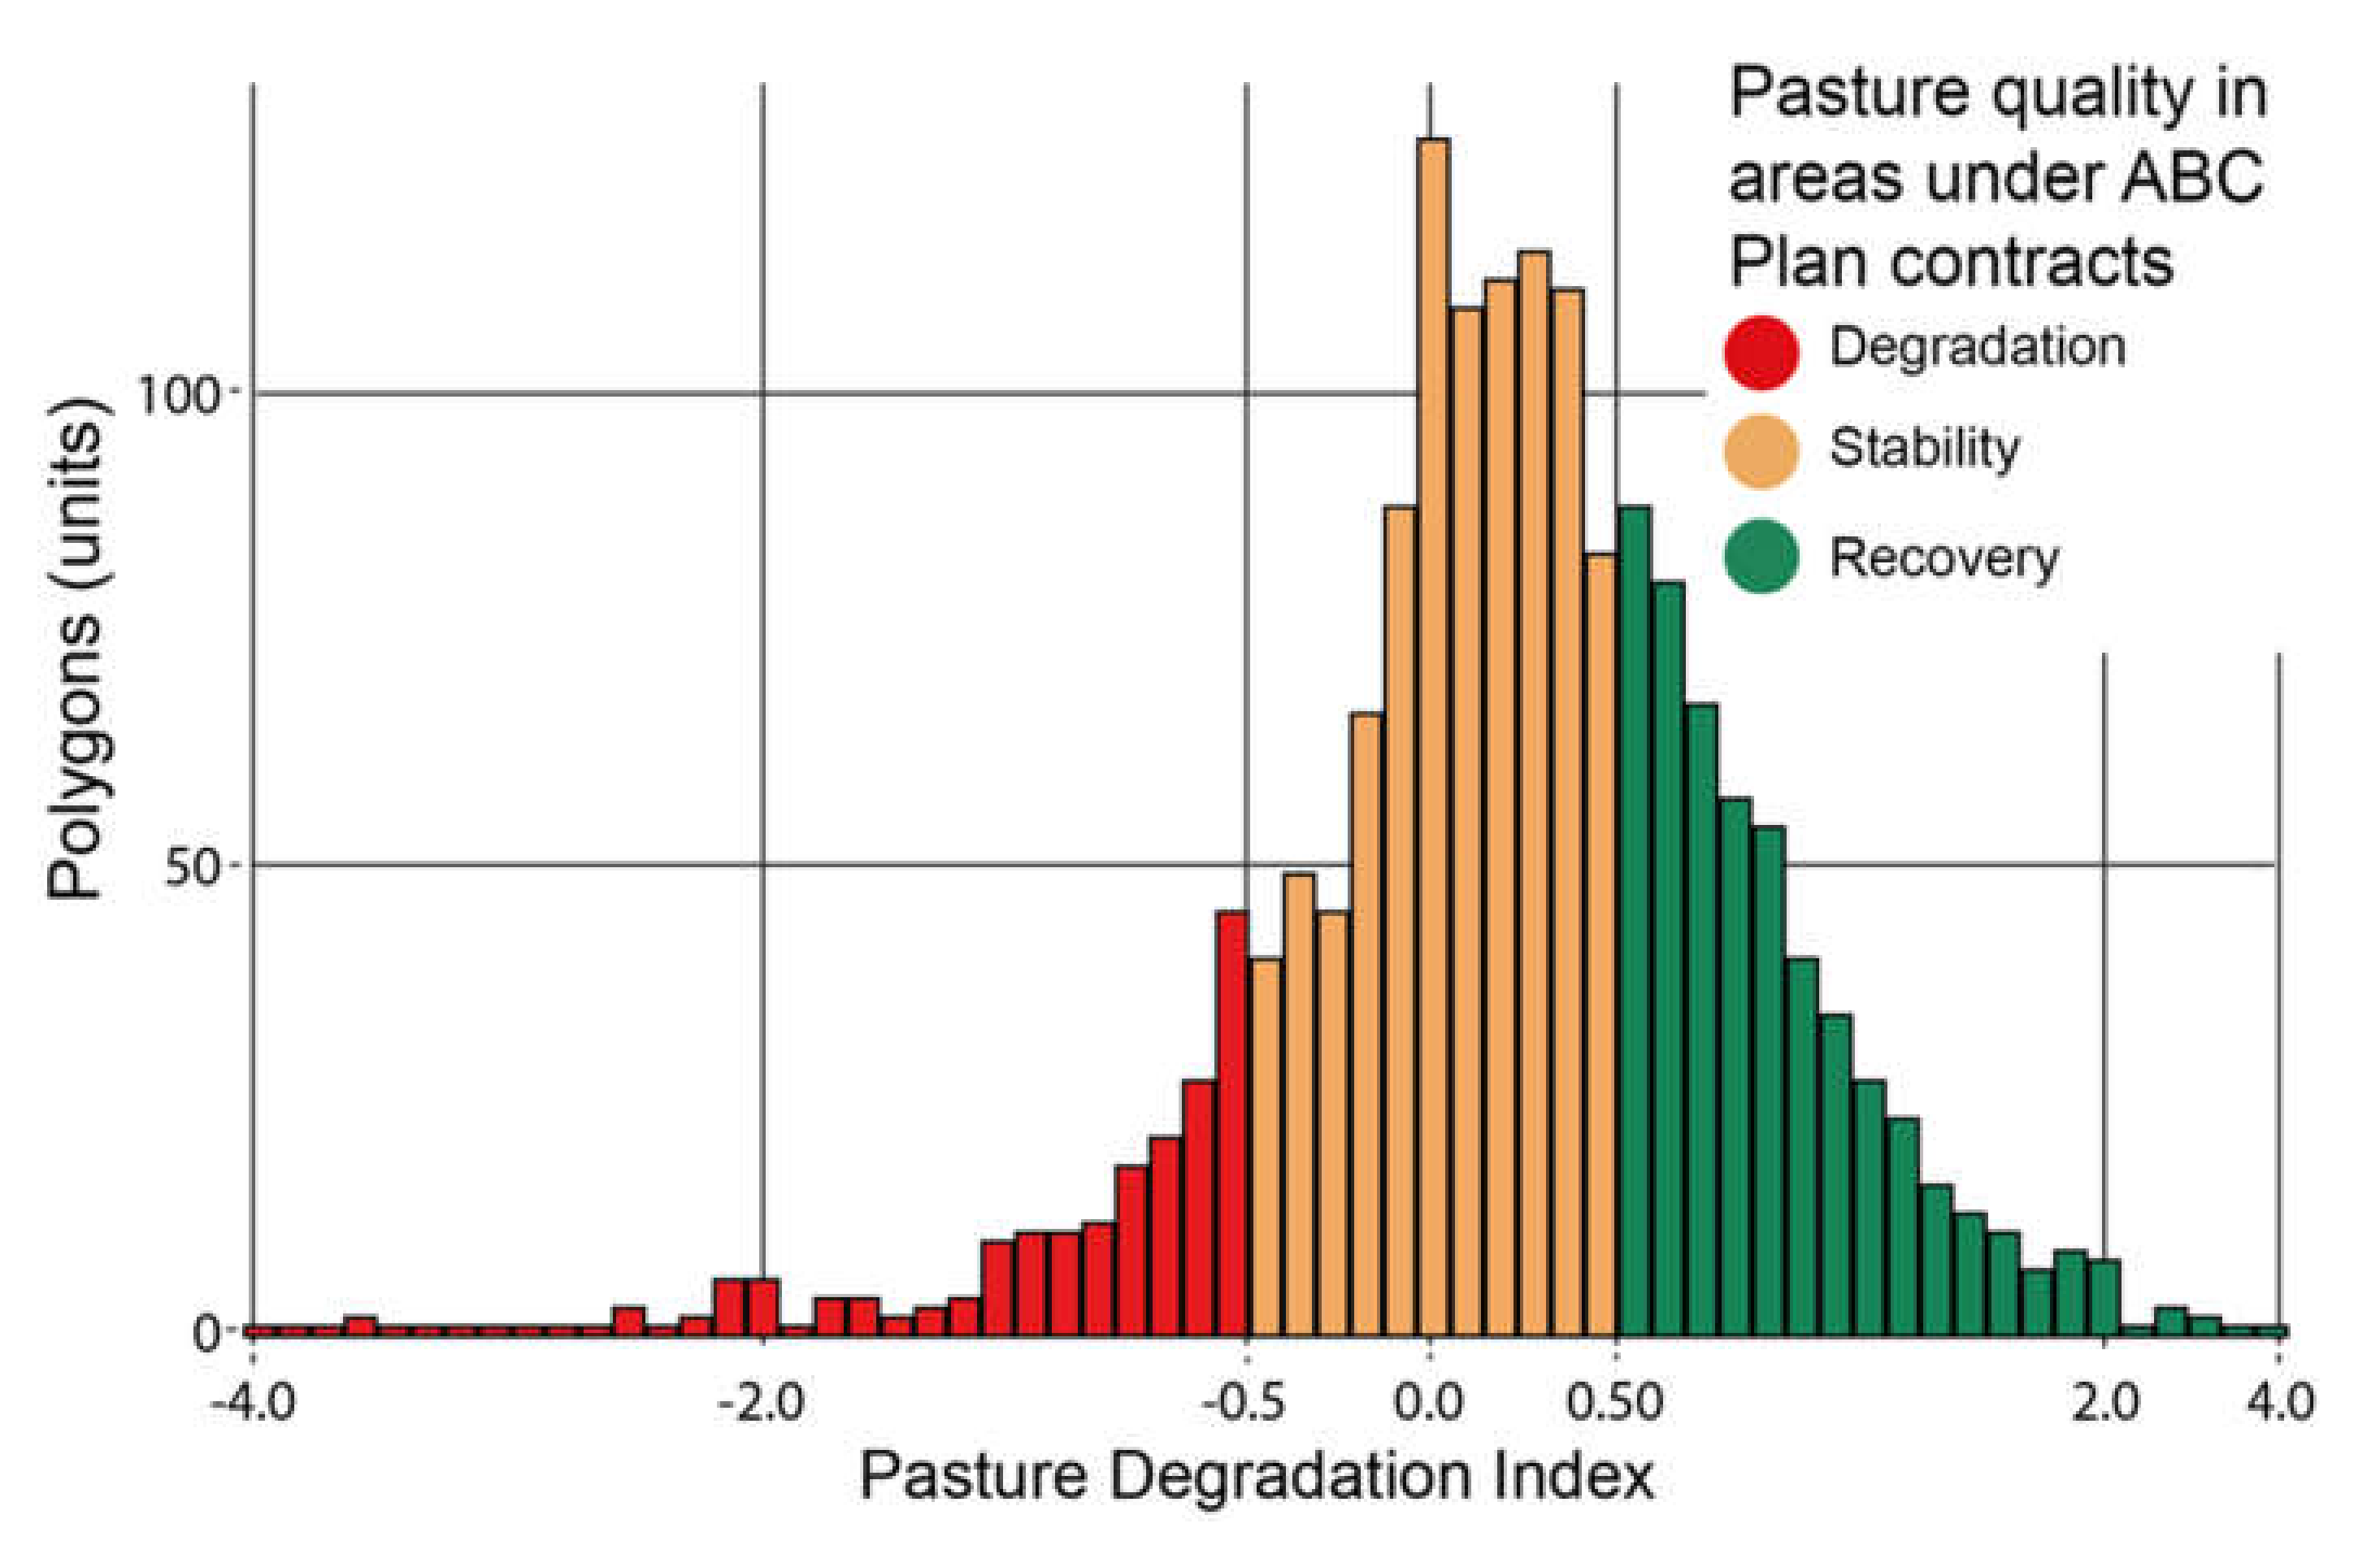
2.4. Pasture Degradation Index by Property (PDI)

The Pasture Degradation Index by property (PDI) was used to assess the dynamics of pasture quality in the Brazilian rural properties. More specifically, the gain, loss or stability were assessed in terms of the state of degradation of small, medium and large rural properties. Likewise, the PDI was also calculated in areas under contract of the ABC Plan for the recovery of degraded pastures (RDP), in the years 2016 and 2017. It is expected that in these polygons (i.e., areas of interest) the quality of pastures would have increased, resulting in a reduced PDI value.
The PDI was calculated for each rural property with a minimum pasture area of one hectare and occupying more than 10% of the property. This criterion was used to analyze only properties with effective livestock activity. The property boundaries were obtained from the CAR (Rural Environmental Registry) database of the Brazilian forestry service, which, in the period of analysis, consisted of 5.5 million rural properties. To calculate the PDI, we considered the four classes of degradation state as proposed by Andrade et al. [37]. The PDI varies between 1.0 and 4.0 and was calculated according to Equation (3), as follows:
PDI = i = 1 n Pi *   Ai A
where PDI is the Pasture Degradation Index; Pi—the weight assigned to the degradation state class i; Ai—the pasture area in the degradation state class i; and A—the total pasture area in the unit of analysis.
Following the provisions of the legislation governing the agrarian reform in Brazil (Law No. 8629), we distributed the rural properties into three size groups according to the number of fiscal modules: Small—up to four fiscal modules; Medium—between four and fifteen fiscal modules; Large—over fifteen fiscal modules. The differences in the PDI values of each property by group, between the years 2010 and 2018, were distributed into 3 classes, in order to assess the dynamics of pasture quality over time in 3 categories: Stable—PDI differences between 0.0 and 0.5; Increased—PDI differences greater than −0.5; Reduced—PDI differences greater than +0.5.

2.5. Evaluation of Pasture Recovery Efficiency through ABC Plan Resources

To assess the efficiency of the RDP program in Brazil, 1693 polygons that had contracts with the Central Bank under the ABC plan were analyzed. These contracts were established during 2016 and 2017 and covered all Brazilian regions, with the highest percentage of contracts in the mid-west (36.6%), followed by the north (26.1%), and the southeast, northeast and south regions, with, respectively, 24.6%, 8.6% and 4.1 % of total contracts. With the exception of the northeast, the percentage of contracts per region was proportional to the area of pastures; that is, regions with a greater proportion of pastures had a greater proportion of contracts.
The PDI values of each polygon were compared between the years 2010 and 2018, in order to identify whether there was improvement, deterioration or stability in the condition of the pastures. For this, we grouped the polygons according to the same criteria used to evaluate rural properties and we considered that the use of resources was effective when quality gains were detected.

2.6. Accuracy Analysis

An accuracy analysis of the pasture degradation classes was conducted to assess the quality of the results. The analysis was restricted to the Cerrado biome, due to limitations of collecting information in all the Brazilian biomes. The prioritization of this biome was strategic, as it concentrates 1/3 of the Brazilian pastures (~32.8%) and 1/3 of the cattle herd (~34.0%). In an experiment conducted in the biome between April 2019 and January 2020, we evaluated the condition of pastures at 53 points, in 4 moments, according to the climatic seasonality (January—rain peak; April—rain–dry transition; July—drought peak; October—dry–rain transition). At each point, based on the evaluation of seven parameters indicating the condition of the pasture (height, density, soil cover, homogeneity, availability of green leaf, leaf/stem ratio and age of tillers), we classified the pasture according to the three degradation classes—Absent, Intermediate or Severe. From these points, we generated a confusion matrix and calculated the overall accuracy of each pasture condition class [43].
For a detailed description of the data and analysis strategies considered in this work, refer to Supplementary Materials (Figure S1) [44].

3. Results

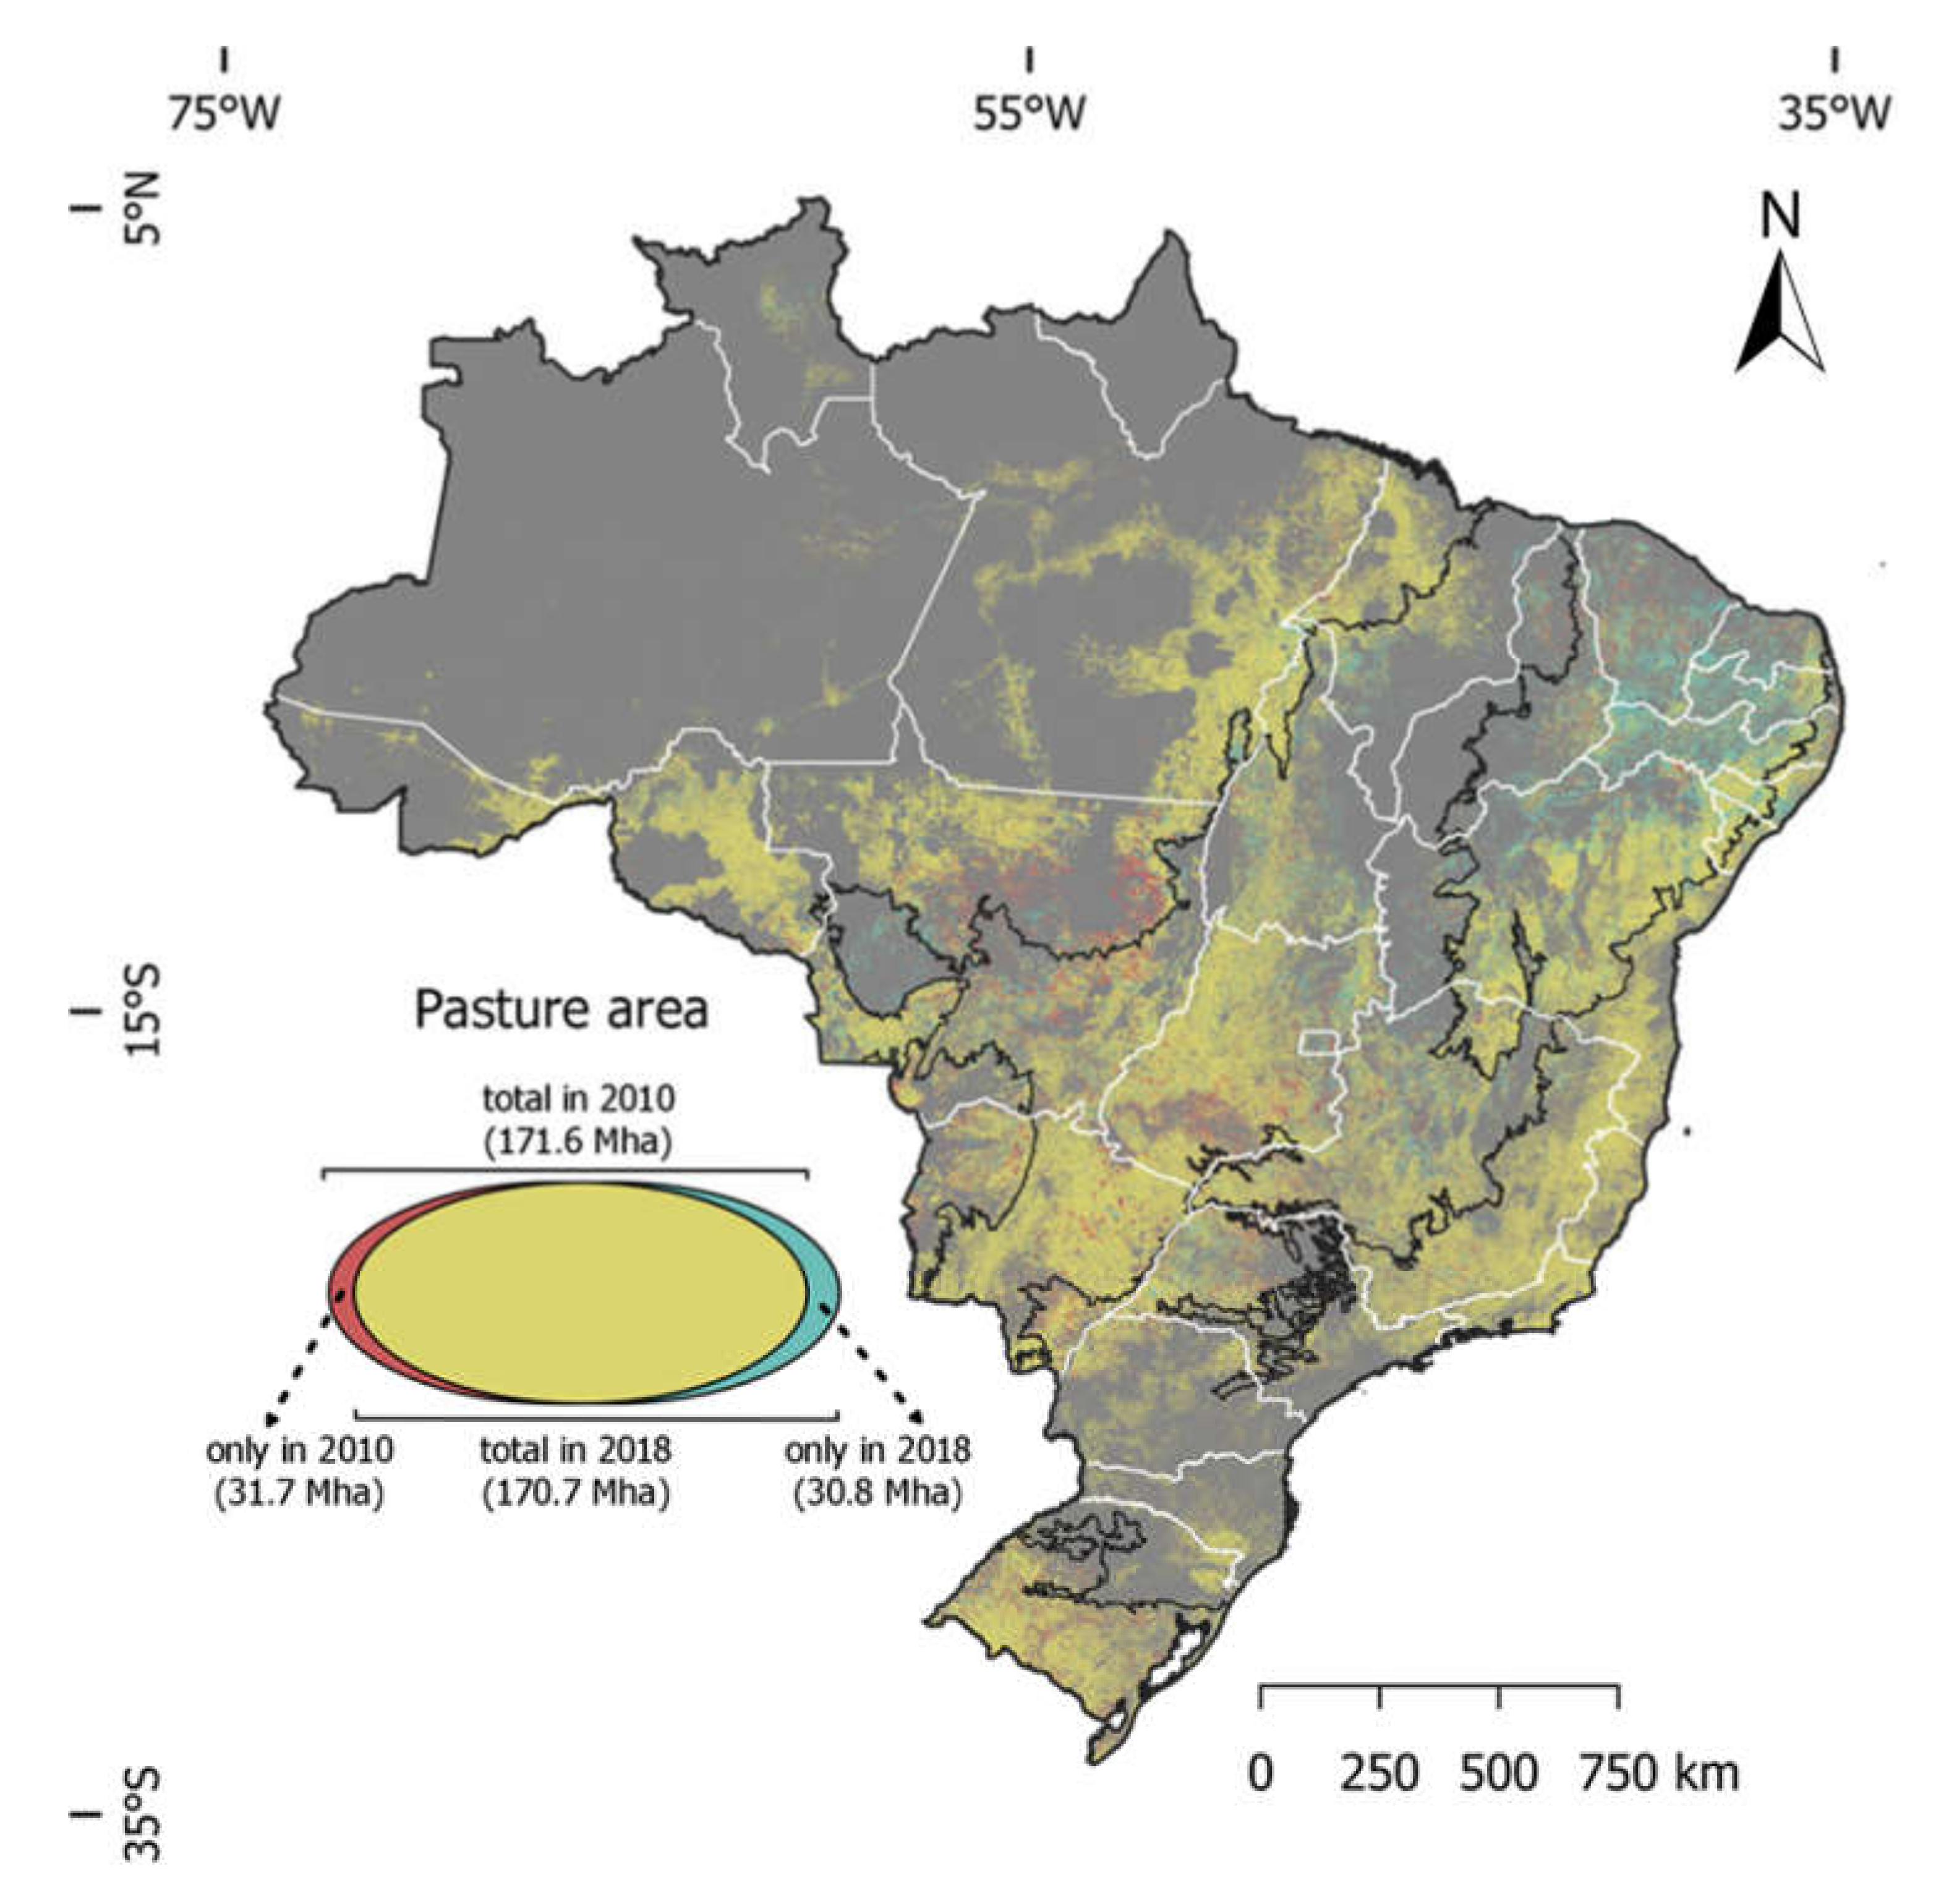
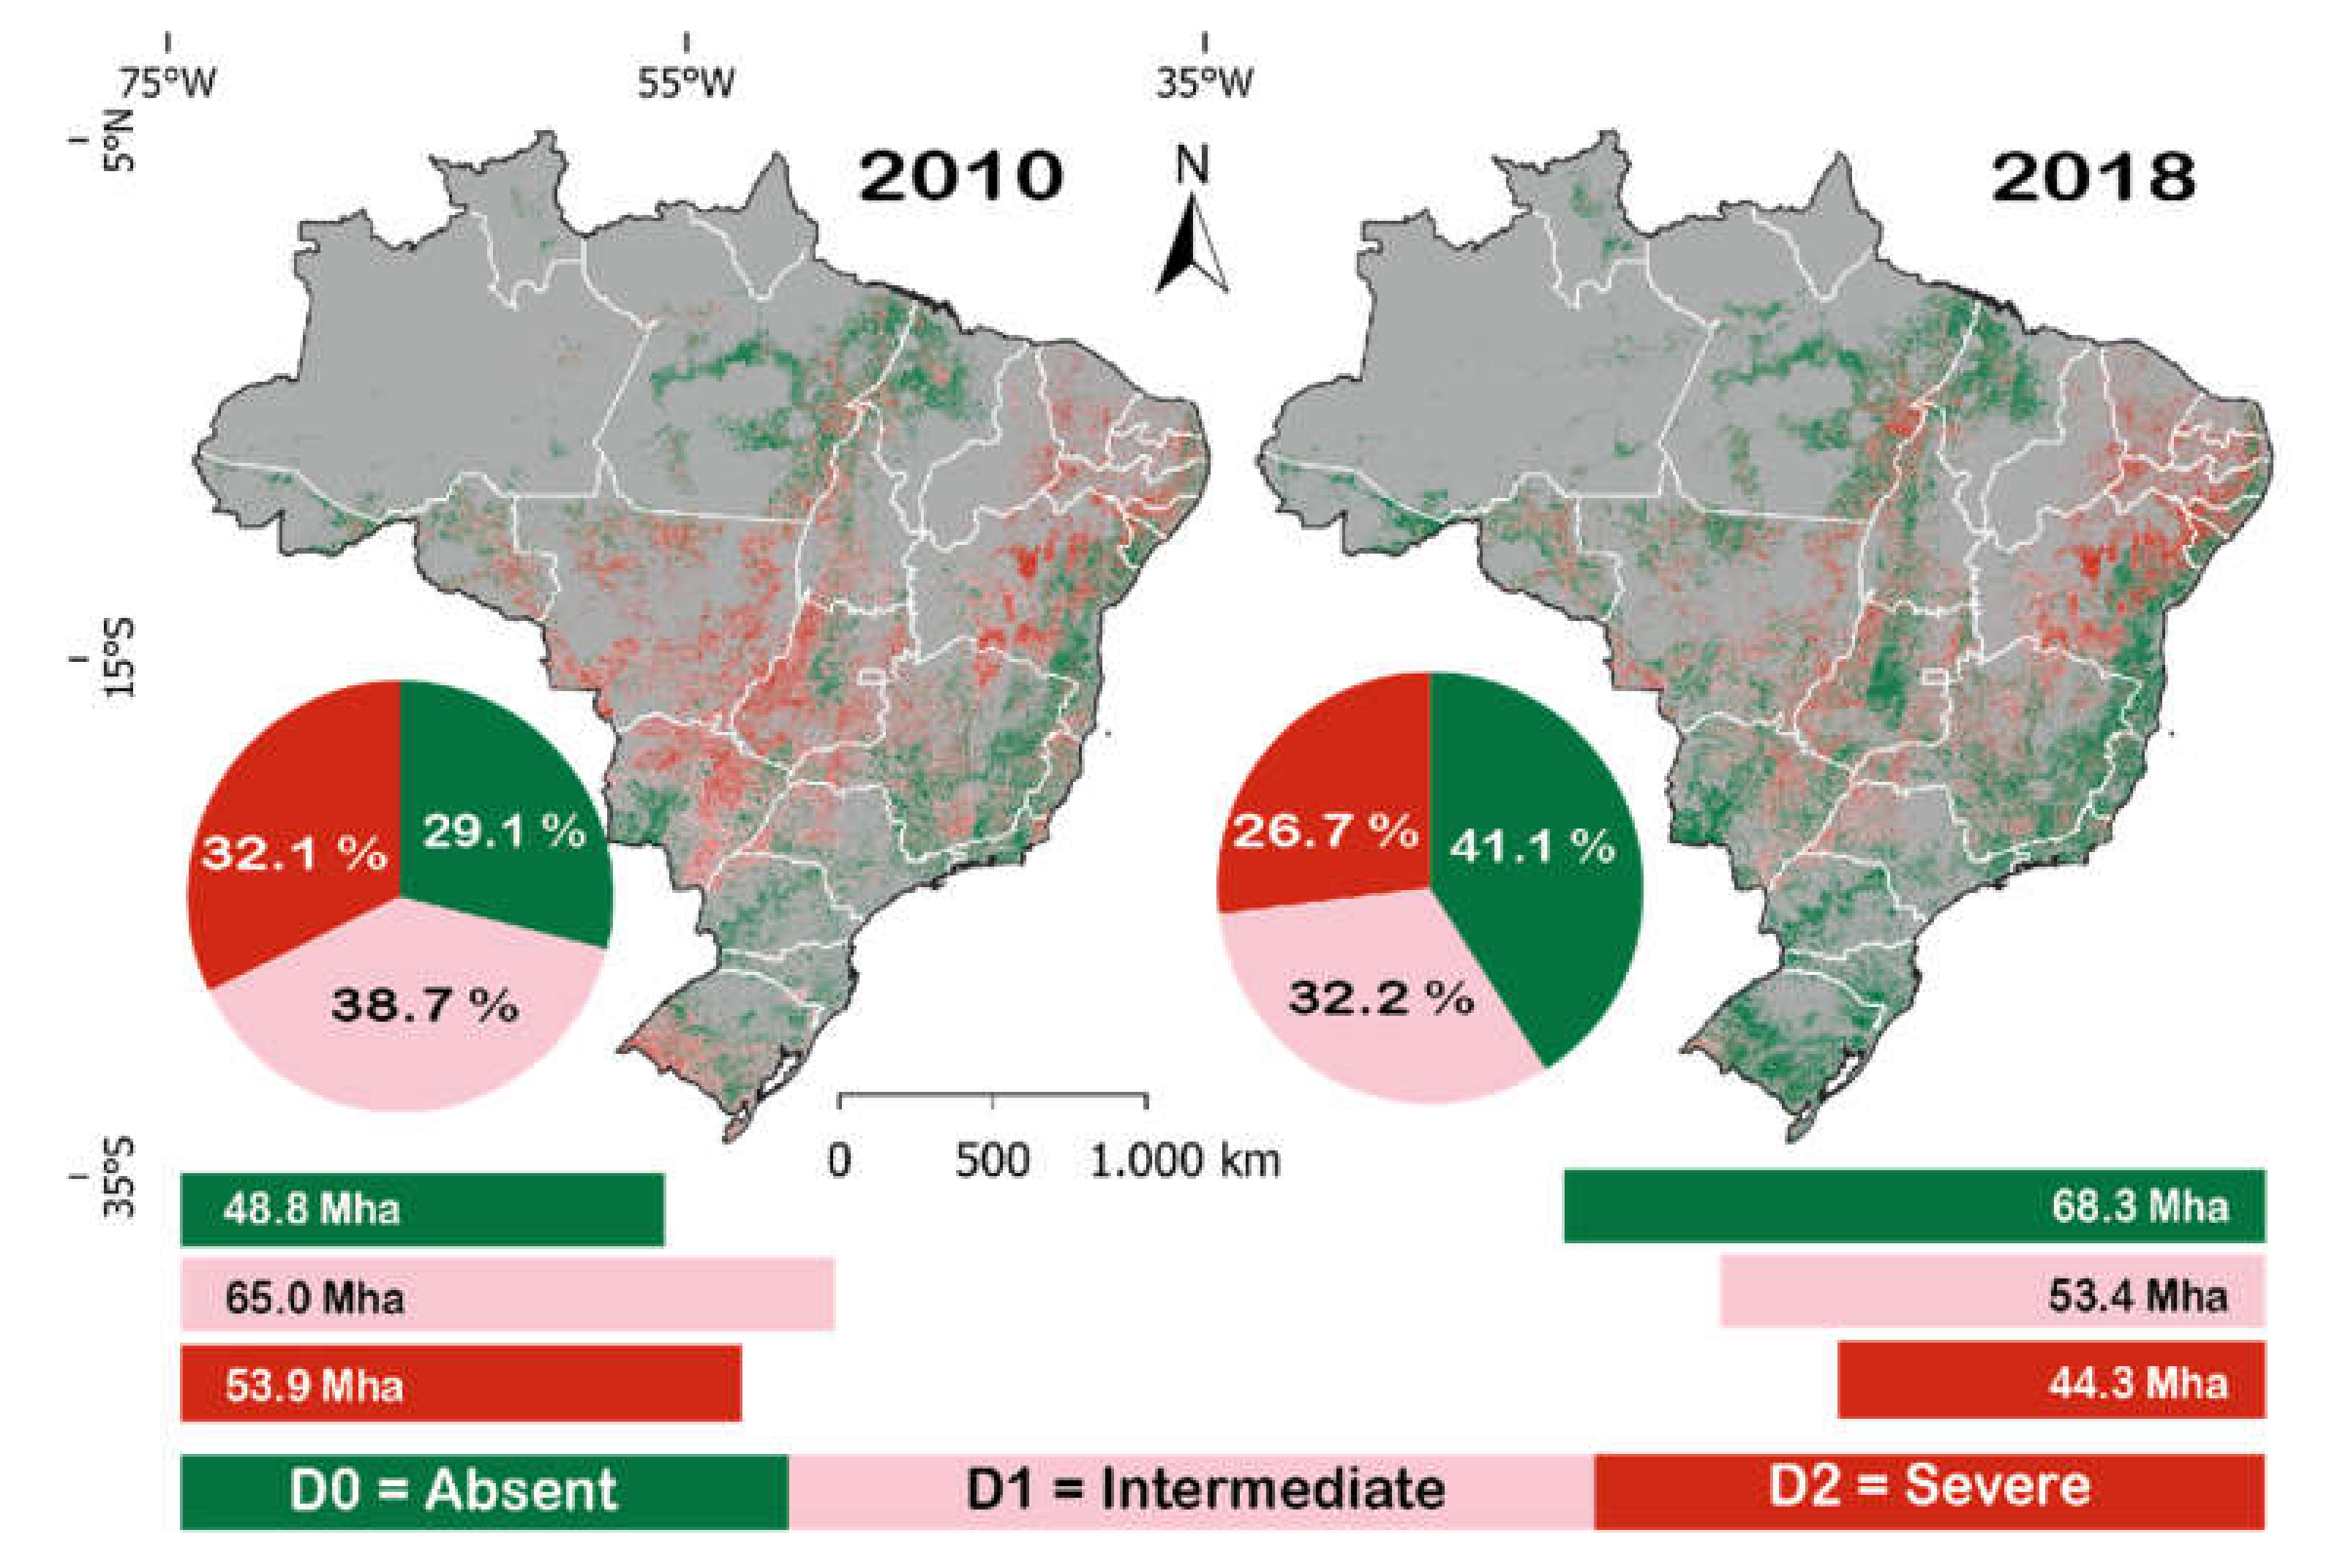
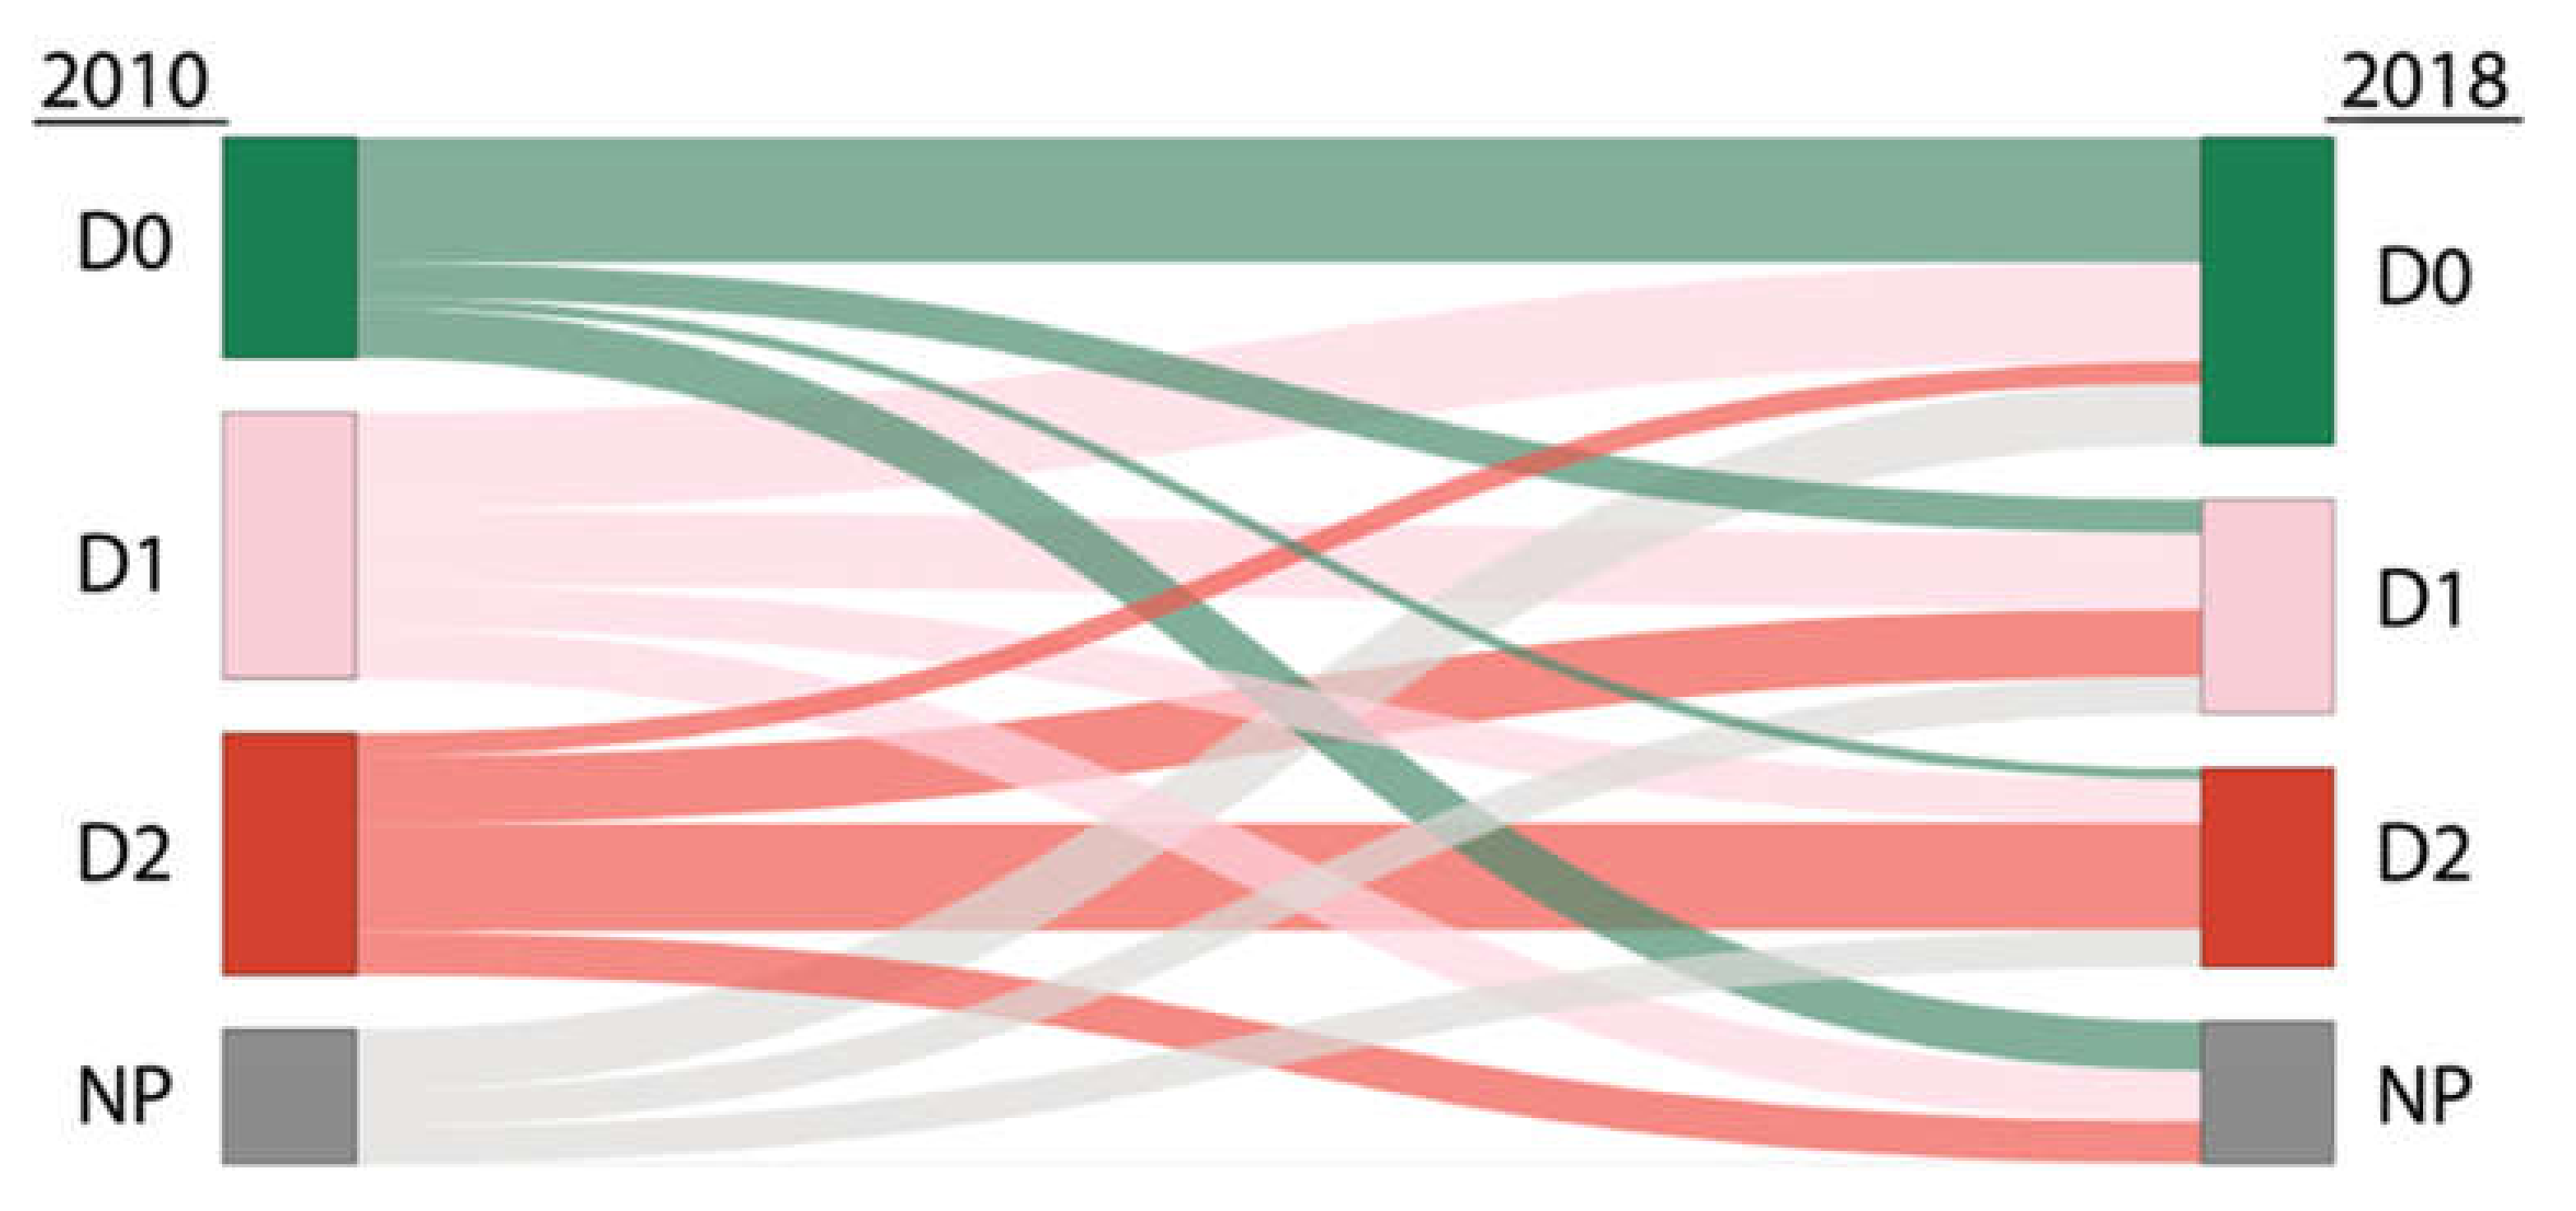
3.1. Spatiotemporal Dynamics of Pasture Quality in Brazil

The estimate of areas covered by pasture in 2010 and 2018 resulted in similar values, totaling ~171.6 Mha and 170.7 Mha, respectively, i.e., there was a reduction of 0.9 Mha in the area classified as pasture in the period considered in this study (Figure 2). On the other hand, a surface equivalent to 31.7 Mha was no longer classified as pasture in 2018, that is, it was converted to other uses or covers, while ~30.8 Mha of new incorporated pasture was identified in that same year.
The breakdown of pasture areas into classes allowed us to realize that, despite the small variation in total pasture coverage between 2010 and 2018, there was a substantial change between the degradation state classes. In 2010, the area classified as Absent degradation (D0) corresponded to 29.1% of pastures, while 38.8% was classified as Intermediate (D1) and 32.1% as Severe (D2) (Figure 3). However, the proportions of D0, D1 and D2 at the end of the period evaluated were, respectively, 41.1%, 32.2% and 26.7%. That is, we observed an increase in the area occupied by pastures with better quality, as there was an increase in 2018 in D0 (from 48.8 to 68.3 Mha), and a reduction in D1 (from 65.0 to 53.4 Mha) and in D2 (from 53.9 to 44.3 Mha).
The smallest error of omission was observed for the severe degradation class (78% of producer accuracy), followed by the absent class (65% of producer accuracy), with an overall accuracy of 58% (Table 1). A clear distinction between these two classes (D0 and D2) is essential, as they include the areas that need to be kept productive and the areas that need to be restored. The intermediate class had a lower accuracy (69% user accuracy and 46% producer accuracy), as it is a more dynamic class, and, apparently, a temporary condition of the pasture. Pastures in this class will advance to severe degradation (e.g., in areas of speculation or land grabbing) or return to the non-degraded class (e.g., in areas with traditional management, where pasture is used until the loss of productivity, being then reformed, in a recurring process).
The temporal dynamics of each degradation class contributed to verifying precisely the changes between pasture quality states over time (Figure 4). Almost half of the area classified as D0 in 2010 (42.9%) changed its degradation class in 2018. We observed that 15.8% went to D1 and 4.9% went to D2, indicating a loss of quality in both cases. Another 22.3% were classified as NP. On the other hand, the increase in area and percentage observed in the D0 class in 2018 was due to the improvement in quality in areas coming from D1 (31.9%) and D2 (7.3%), but also due to the change in land use, as 19.9% came from NP.
A marked dynamic was observed in D1, as 58.1% of the area of this class in 2018 came from changes in other classes, mainly with the gain in quality in class D2 pastures (28.5%), followed by newly converted areas (15.2%). The areas that had a loss of quality (from D0) contributed 14.4%. Approximately 54.5% of the area classified as D2 in 2018 already belonged to this class in 2010; that is, there was the maintenance of a considerable area of pasture in a state of severe degradation (24.1 Mha) over time. About 9.6 Mha in this class were areas that lost quality, and 8.2 Mha were areas not mapped in 2018. The areas that were no longer mapped as pastures in the evaluated period were predominantly areas classified as low productivity in 2010, mainly class D1 (35.3%), followed by class D2 (30.3%). Non-degraded areas that were no longer mapped as pastures totaled 34.4% (D0).

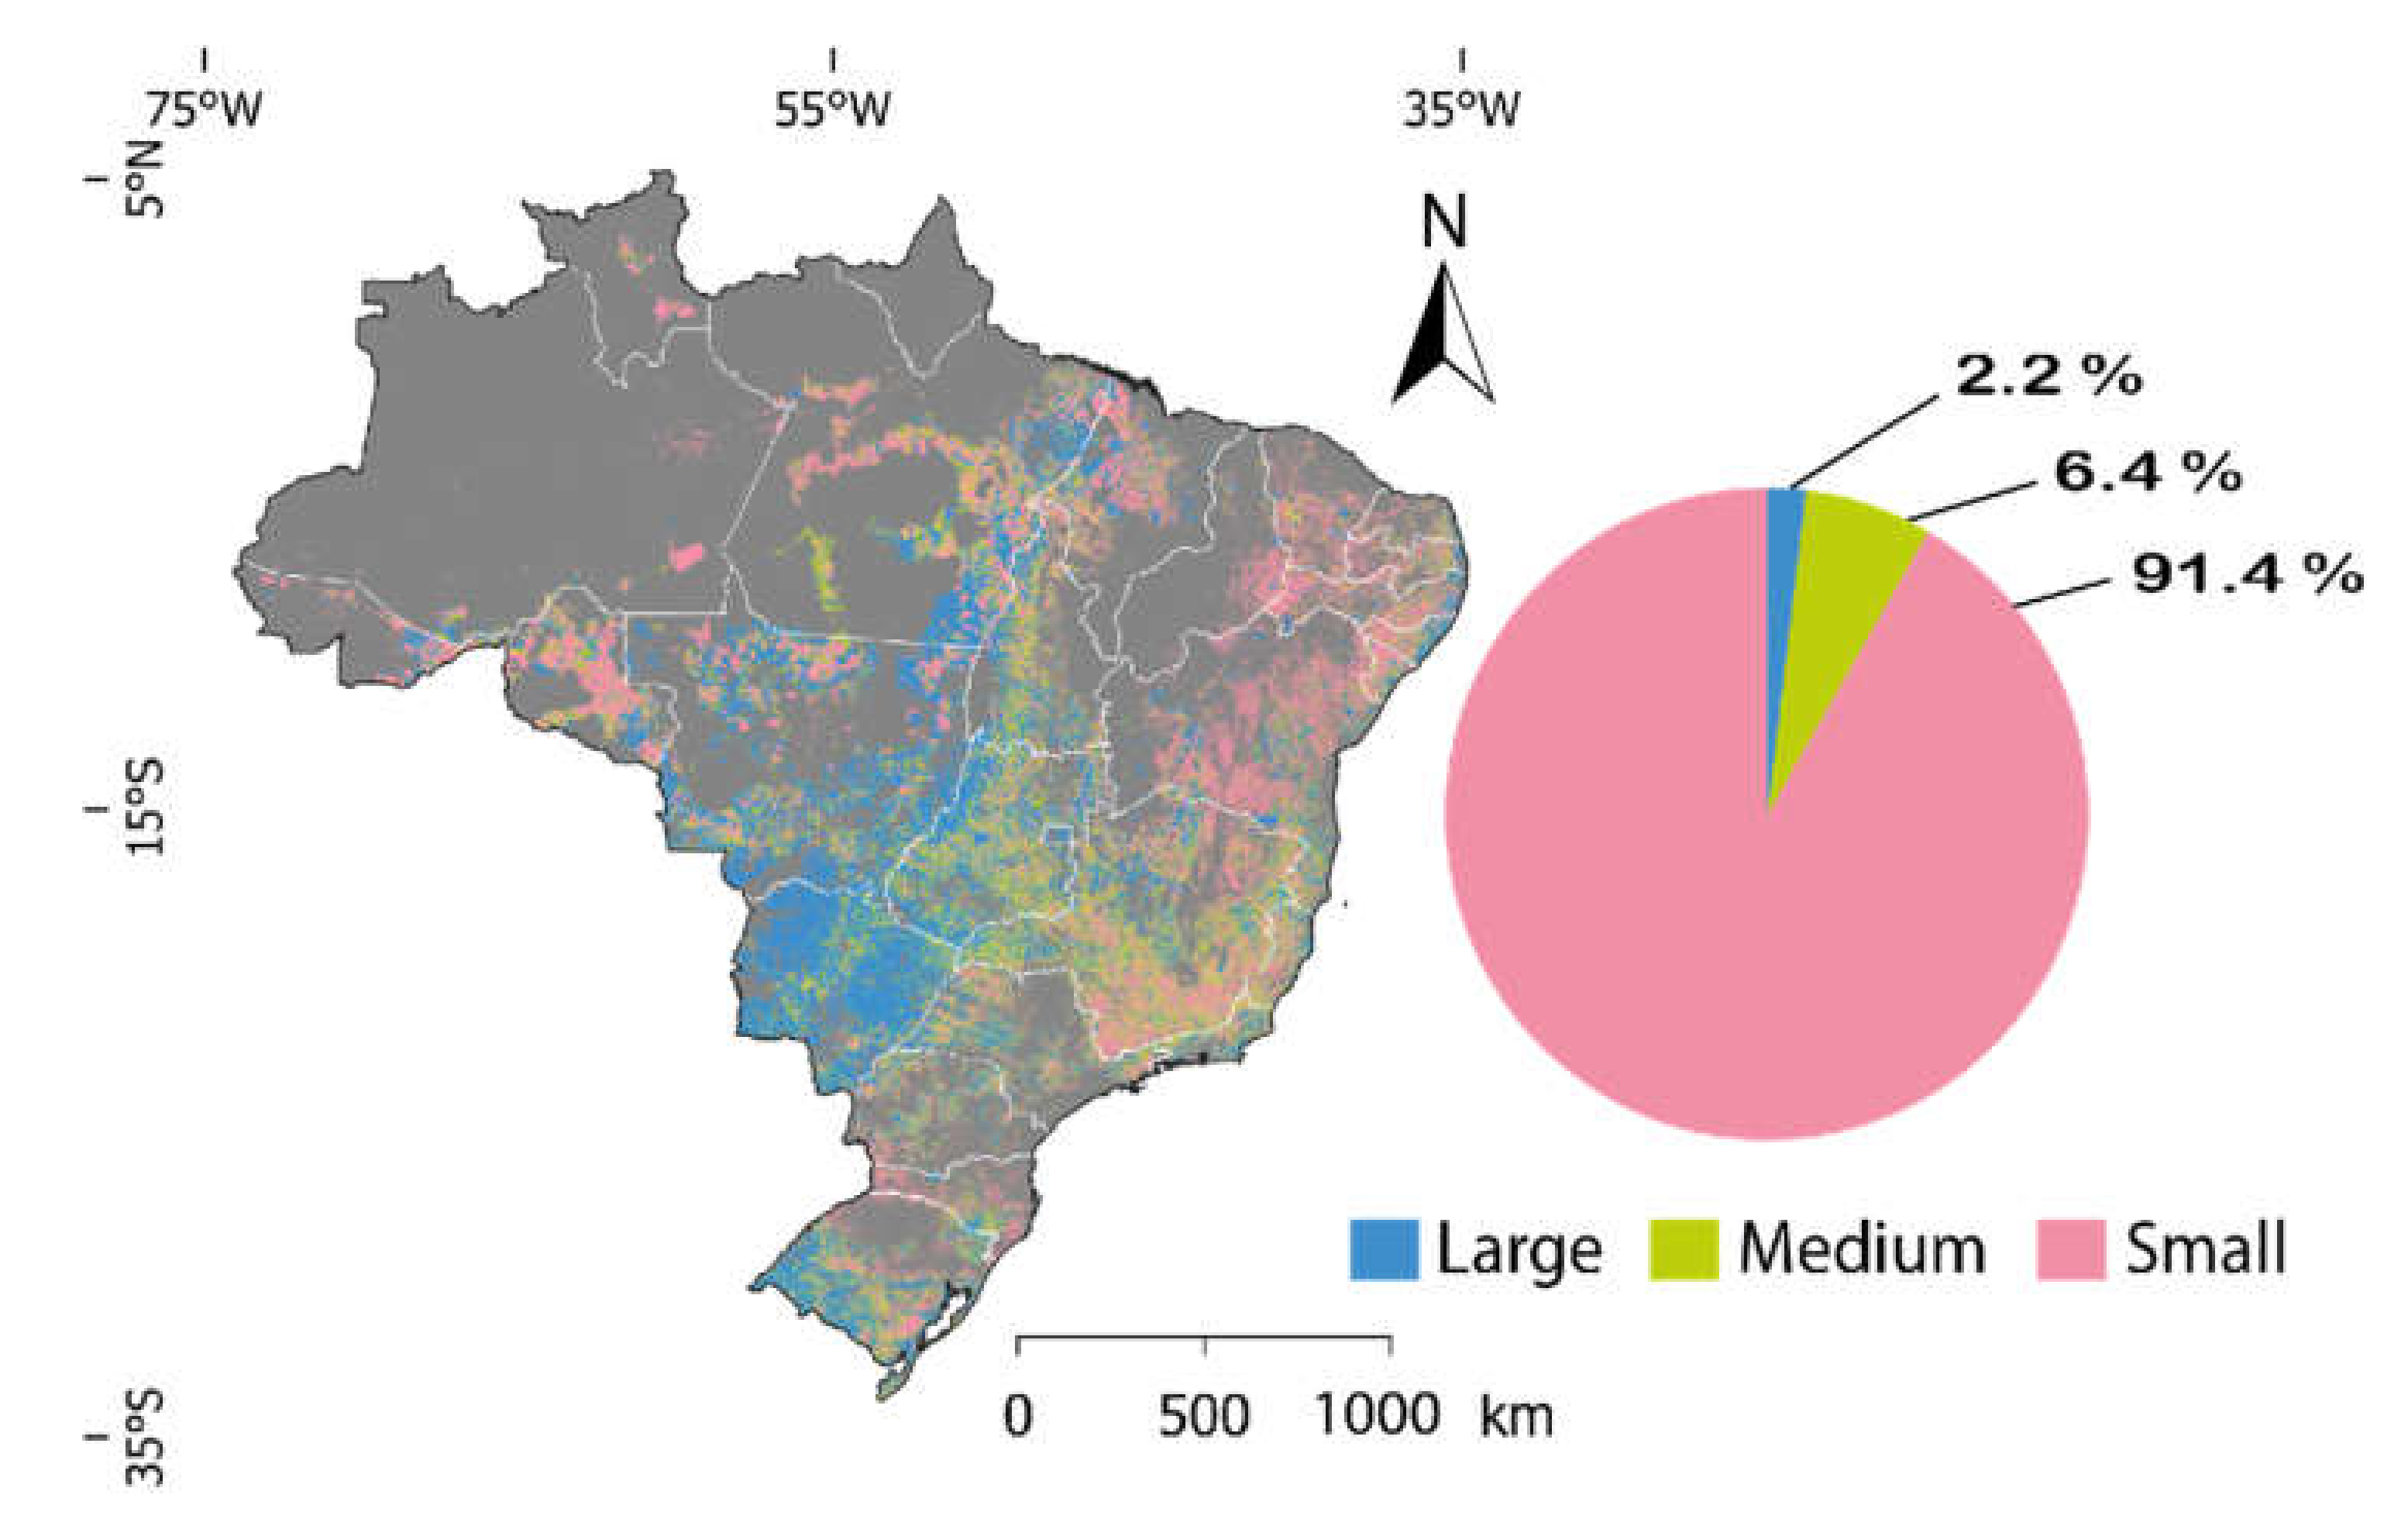
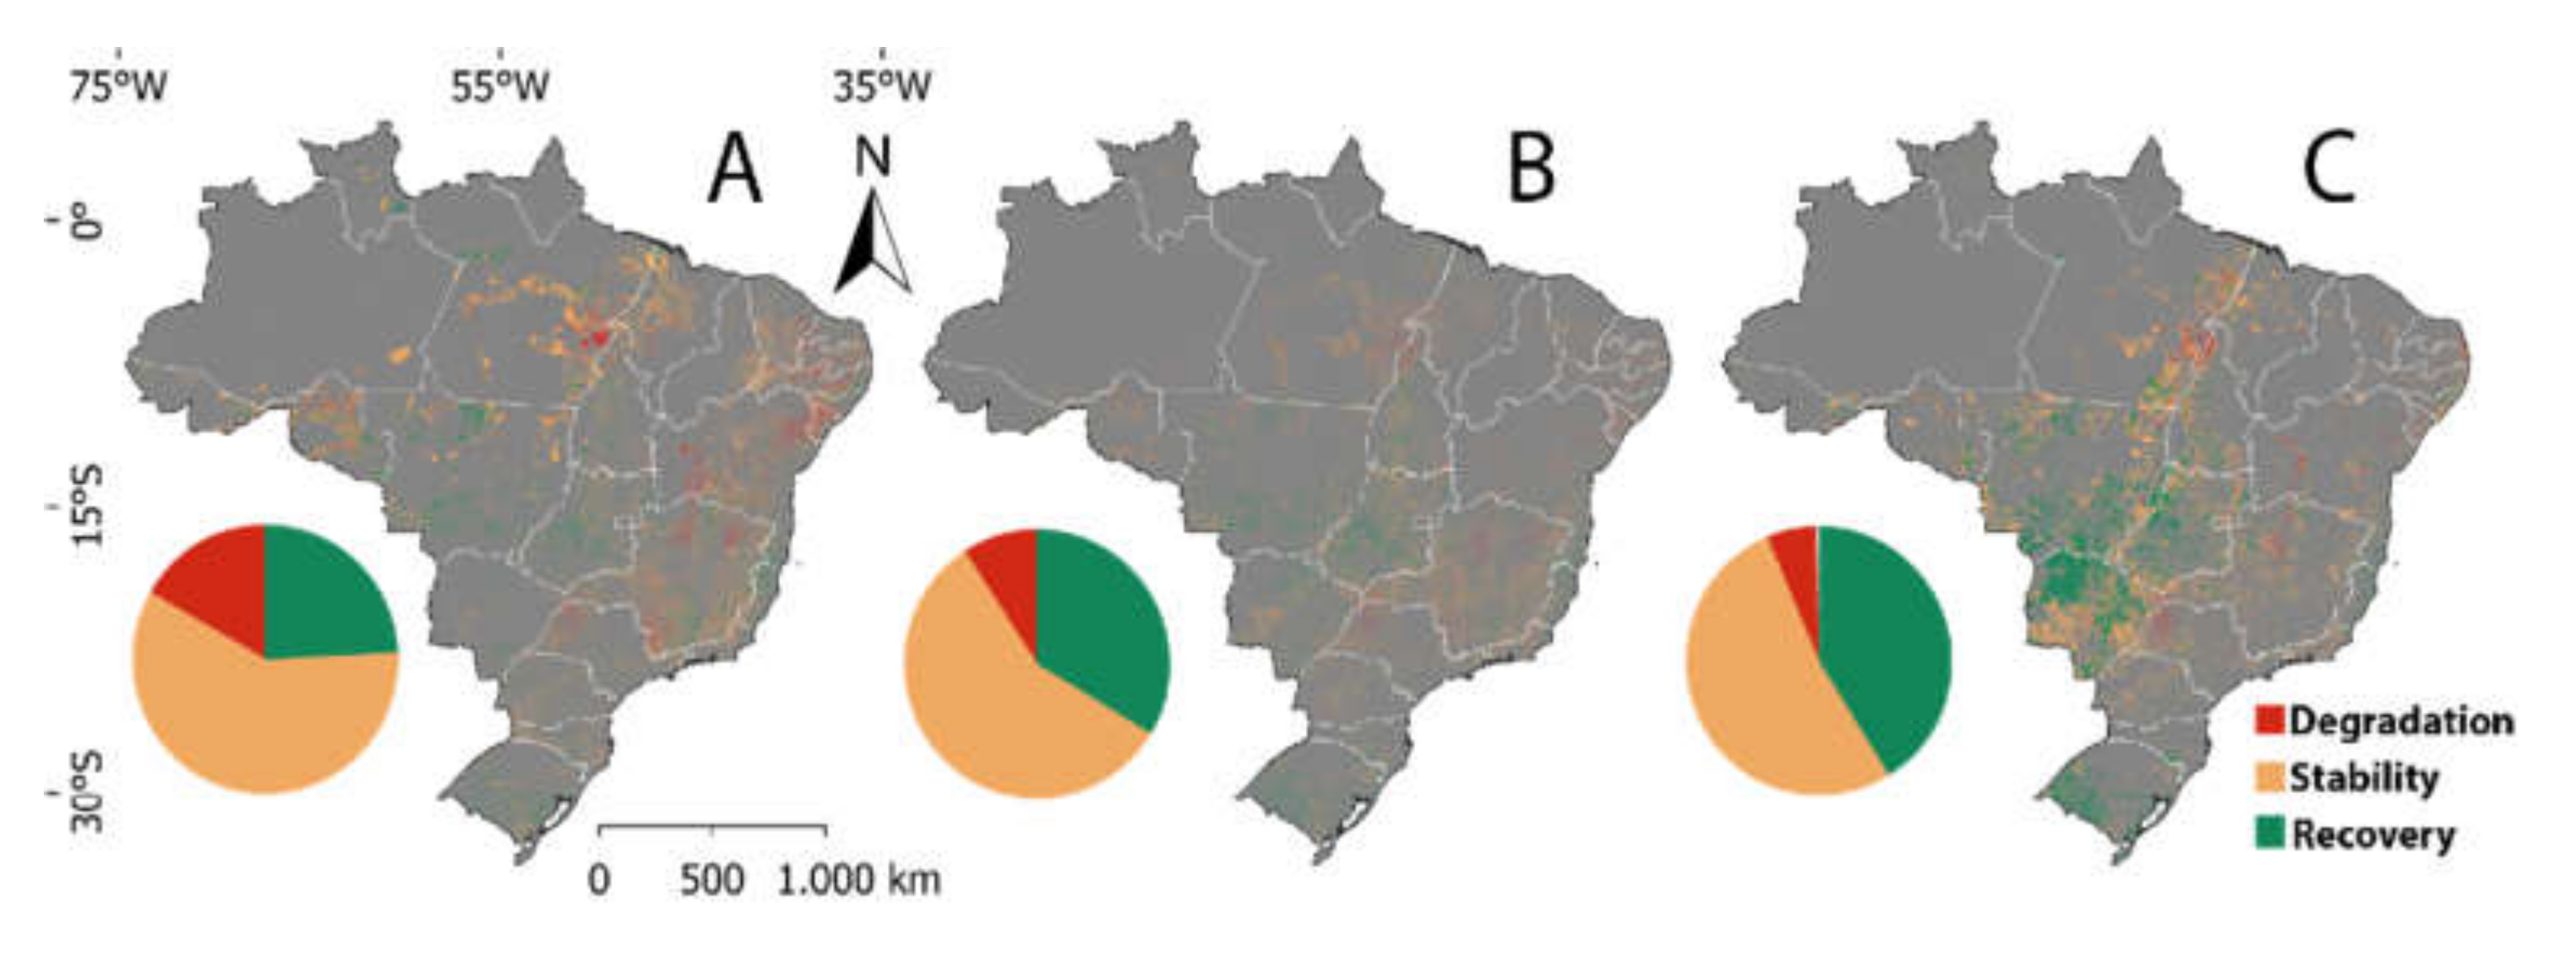
3.2. Factors Related to Variation in Pasture Quality by Rural Property

Pasture represents an important land use in Brazil, since almost half (49.1%) of the approximately 5.5 million properties available in the CAR base have livestock among their economic activities, considering the inclusion criteria for analysis of the PDI. The vast majority of the rural properties in Brazil are comprised of small units (91.4%), followed by medium (6.4%) and large units (2.2%) (Figure 5). When evaluating the evolution of the quality of pastures by rural property between 2010 and 2018, regardless of the size of the property, it was possible to observe that about 60% were classified as Stable (Table 2). In this same period, there was an increase in quality in a quarter of the properties (25.3%) and a reduction in 15.8% (Table 2). We noticed that the quality dynamics of pastures was affected by the size of the property, as small units presented a reduction in quality 2 times as high as compared with medium-sized ones, and almost 3 times greater than in large ones (16.6%, 8.9 % and 6.2%, respectively) (Table 2). Considering the gain in quality over time, the large properties showed a 2-fold increase compared with the small ones (41.2% and 24.3%, respectively).
Changes in the quality of pastures on properties are not evenly distributed in the country, with a predominance of increase in quality in the south and central west regions (Figure 6). The class of medium properties showed the least evidence of heterogeneity in spatial distribution (Figure 6B), with the three levels of pasture condition being observed in the different regions. On the other hand, the class of small properties presented a predominance of loss in pasture quality in the states of Maranhão, Minas Gerais and Bahia, and in the limits between the states of Tocantins and Pará (Figure 6A). Additionally, in large properties, which are predominant in regions with agricultural frontiers and regions with a more recent history of land use, there was an increase in the quality of pastures, especially in the states of the central west region (Goiás, Mato Grosso and Mato Grosso do Sul) (Figure 6C).
An important question about the management of public resources applied to land use is related to its effectiveness, that is, whether properties that receive financial resources are able to increase their production. We observed that approximately 56% of the polygons with pastures that received funds from the ABC Plan showed no change in the quality of pastures, while in another 12% there was a reduction in quality (Figure 7). Therefore, in approximately 1/3 of the polygons (32%), pastures were recovered in the period evaluated.

4. Discussion

4.1. Spatial and Quality Dynamics of Pastures in Brazil

The ~0.9 Mha reduction in the total area occupied by pasture between 2010 and 2018 is within the confidence interval of the mapping (±2.5%), as reported by Parente et al. [5]; therefore, there was no significant variation in the area occupied by pastures in Brazil in this period of time. However, the temporal analysis of variations in the absolute values of area hides an intense spatial dynamic, as regions classified as pasture only in 2018 had a similar territorial extension to those that were no longer classified as such in that same year—i.e., there were gains and losses of pasture areas in equivalent amounts (around 31 Mha). As this is a considerable change in territorial terms, equivalent to the extension of countries such as Germany or Italy, understanding the spatial dynamics of pastures in the country requires an assessment of the factors that are contributing to the retraction and expansion of this land use class. As they are two antagonistic processes, and due to the magnitude of variation in area, they can only coexist if they occur in different regions.
The retraction in pasture areas occurred mainly in the central west and southeast regions of the country, while the expansion was detected predominantly in the north region. Such spatial dynamics is intrinsically linked to the processes of land use and occupation prevalent in the country [9,45,46]. The pasture retraction areas were occupied by agriculture (i.e., soy, corn, cotton and sugarcane), predominantly in the Cerrado and Atlantic Forest biomes. On the other hand, the expansion took place in areas of conversion of native vegetation, mainly in the Amazon biome [26].
The current dynamics of land use and occupation have contributed to the maintenance of livestock production, as the increase in non-degraded pastures in 2018 has part of its composition coming from areas that were not previously classified as pastures. This process is due to the fact that pasture retraction occurs in predominantly degraded areas (D1 + D2), and newly converted areas are predominantly non-degraded (D0), since newly formed pastures tend to have high productivity in the first years of use, due to the high availability of nutrients, resulting from the process of conversion of native vegetation [12]. However, this dynamic is not environmentally sustainable, since expansion comes at the cost of deforestation [47]. The good news is that changes in the livestock production system seem to be underway, since the aforementioned dynamic would explain the maintenance of production, but would not be enough to explain the support for the growth of the cattle herd, indicating an efficiency gain. In this context, the reduction in the proportion of pastures with some level of degradation (D1 + D2) between 2010 and 2018 (from 71% to 58%), and the consequent increase in the non-degraded pasture area (D0), observed in the present study, shows an improvement in the quality of pastures and corroborates the increase in the efficiency of the livestock activity.
During this period, there was an addition of ~5.5 million animals to the Brazilian cattle herd, equivalent to an annual increase rate of 0.7 million animals [2]. This increase was observed in a period in which there was no change in the total area occupied by pastures, indicating an improvement and increase in the support capacity in the livestock sector. Analyzing data from the bovine herd and pasture areas (see LAPIG 2021 [38]), we identified that between 1985 and 2018, the bovine stocking increased from 0.8 to 0.92 AU/ha (animal unit per hectare). Without this average increase of 0.12 AU/ha, an additional 15 Mha would be necessary to the livestock system to support the cattle herd accounted for in 2018. Although cattle stocking remains low, on average, and pastures are still not very productive [31], our results suggest that changes in pasture management and rehabilitation of degraded areas are possibly underway.
Spatially, the reduction in degraded areas was observed in the mid-west, southeast and south regions, where areas of consolidated use, with a higher opportunity cost, predominate [4]. This process is possibly driven by land appreciation, which can lead to investments to increase livestock productivity in areas that remain in this land use class. Increased profitability can lead to greater availability of resources for investments, resulting in a positive cycle of pasture improvement [11]. Better management and, consequently, a higher proportion of non-degraded pastures, does not always indicate a change in the owner’s behavior or perception in relation to livestock, but rather a social dynamic in which owners who choose extensive livestock activities tend to migrate to frontier regions, where, with a lower land price, larger areas can be acquired, and continue to practice extensive cattle raising. The areas they occupied tend to be acquired by actors with greater capital and therefore with the necessary means to maintain intensive livestock farming, often bringing experiences and concepts from other sectors, resulting in professional administration for the livestock activity [48]. Thus, it is expected that the proportion of areas with better quality pastures will increase in regions of consolidated use, as observed in this study.
Despite the aforementioned gain in efficiency, we observed an extensive area of pastures (44.3 Mha) classified as having severe degradation (D2) in 2018. Just over half of this area had already been classified as D2 in 2010, showing that low productivity is persisting over time. The cost of recovering the area increases in advanced stages of degradation, and this factor certainly contributed to the permanence of areas in this class, and a lower proportion of recovery compared with the recovery of pastures with intermediate degradation [4]. The greatest dynamic in the intermediate degradation class is probably related to the traditional management of extensive livestock in Brazil, in which the pasture degradation process is common, due to the poorly technified management, with absence of soil correction and fertilization process for maintenance of forage productivity [13,49]. In a first phase, there is an intermediate degradation (D1), which, in the absence of a management intervention to recover productivity, advances to severe degradation (D2) [4]. Thus, intermediate degradation appears to be a transitory condition in the Brazilian livestock with lower accuracy of the method, which generally follows one of three paths: (a) the largest proportion is recovered, as observed in this study, and if there are no changes in management, it will possibly return to this class in a few years and it will be reformed again, in a vicious cycle; (b) a smaller proportion may progress to severe degradation due to the absence of intervention; (c) part of the area leaves the livestock system, possibly through conversion to other uses or coverage.

4.2. Relationship between the Size of the Rural Property and the Contribution of Resources from the ABC Plan with the Quality of Pastures

As pointed out by [46], most rural properties in Brazil are small. Additionally, pasture quality is strongly related to productivity, which in turn enables an increase in the economic return, due to improved management (technification and intensification). For this, the owner needs both technical assistance and financial resources [50]. However, the small producer usually has less equity, low access to credit lines from financial institutions, and they also lack technical assistance to intensify their productivity [51,52]. Therefore, the greater proportion of quality loss observed in the present work in small farms illustrates this reality. At the other extreme, the higher proportion of gain in quality observed in large properties possibly reflects greater access to the financial resources needed to improve livestock activity, while at the same time evidencing an increase in socioeconomic inequality in the livestock sector.
The properties with gains in pasture quality are located mainly in the mid-west region of Brazil, where there were initiatives to recover degraded pastures such as the Novo Campo program, started in 2012, in the north of Mato Grosso [23]. In 2009, after a period of high deforestation rates, more than 20 municipalities in Mato Grosso, which did not meet the deforestation reduction targets, were included in the Ministry of the Environment’s (MMA) blacklist, which implied a reduction in revenues and restricted access to credits [53]. In this context, initiatives such as the Novo Campo program have contributed to improving the quality of pastures in this region [54]. Between 2016 and 2017, this was the region with the highest proportion of contracts for the recovery of degraded pastures under the RDP program, which may also have contributed to the results observed in this study.
The proportion of cases in which there was a gain in pasture quality in areas under contracts of the RDP program was higher than the quality gain observed for properties in general (32% and 25%, respectively), showing a positive effect of the program on the quality of pastures. On the other hand, more than half (56%) of the polygons under contracts did not show quality gains, indicating that this positive effect is still low, since 100% of the contract areas are expected to have their pastures improved. It is noteworthy that the short period between signing the contract and the year evaluated in this study may not have been enough for changes in the quality class to be detected by the tool used, indicating that pastures are still in the initial stage of recovery in many of the polygons.
The results obtained in this work reinforce the assertions of several studies focused on the dynamics of land use and occupation in Brazil, which analyzed the role played by the country in food production and global food security and indicate that the current model of livestock production is unsustainable [12,17,26,55]. In the northern region of Brazil, the main agricultural frontier in the country and also in the world, there is still an intense process of converting vegetation into cultivated areas (agriculture or livestock). These anthropic actions affect the climate, biodiversity and ecosystem services in the country. Therefore, a new production model that prioritizes the intensification of livestock in already open areas can promote increased production and the release of land for grain production, sufficient to meet the demands of the coming decades, without the need to convert new areas of remnants of native vegetation [55,56]. The improvement in the quality of pastures observed in this study may indicate a step in this direction, but all the results indicate that there is still a long way to go towards more sustainable and more productive cattle raising.

5. Conclusions

In this study, we analyzed the dynamics of degradation of the Brazilian pastures between the years 2010 and 2018. During this period there was an increase in the quality and support capacity of pastures in the country. We observed that there were no changes in the total area occupied by pastures, while the percentage of non-degraded areas and the cattle herd increased, indicating that there were gains in productivity. The improvement in the quality of pastures, together with the increase observed in the cattle herd, indicate that the gain in productivity was due to intensification, i.e., a vertical increase in livestock production.
The increase in the area of non-degraded pastures occurred due to two factors: (a) retraction of pastures with intermediate or severe degradation in the central south of the country, and conversion of areas of native vegetation to pastures in the northern region; (b) recovery of degraded pastures, which was 2.7 times larger than the area that lost quality in this period. Between 2010 and 2018, about 26.8 Mha were no longer classified as degraded, and in the same period, about 10.1 Mha were classified as degraded.
About 60% of rural properties with livestock activity showed no changes in the Pasture Degradation Index (PDI). On the other hand, the proportion of properties with gains in quality was higher than that of properties with a loss of quality, indicating that, on average, the degradation of pastures on rural properties is decreasing. However, this change is not homogeneous across size classes. The proportion of small properties that gained quality is about twice as small as that of large properties, while the proportion with loss of quality was about three times greater. The increase in inequality between these classes may be associated with greater availability of financial and technological resources used in the livestock activity in large properties. One third of the areas with ABC Plan contracts showed quality gains. However, the results were not sufficient to draw conclusions about the plan’s effectiveness, indicating that further long-term studies are required.

Supplementary Materials

The following supporting information can be downloaded at: www.mdpi.com/article/10.3390/rs14041024/s1, Figure S1: Spatial distribution of pasture areas in Brazil (i.e., any occurrence of pasture in 2010 and/or 2018), Figure S2: Differences in NDVI time-series values based on Landsat 5 (TM) and Landsat 8 (OLI) data, with emphasis on the spectral correction applied to Landsat 5 data, Figure S3: Landsat 5 and 8 bands responsivity curves (a) and spectral regression between Landsat 8 and 5 NDVI values (b), Figure S4: Availability of quality observations (i.e., screened for clouds and/or cloud shadows) from the Landsat 5 (July 2009 to June 2011) and Landsat 8 (July 2017 to June 2019) Data Archives, Figure S5: Criteria used to calculate average NDVI images from Landsat 5 and 8 satellites (i.e., 2010 and 2018), compatible and comparable to each other, Figure S6: Median NDVI images corresponding to pasture areas in 2010 and 2018, Figure S7: Stratification of NDVInorm (normalized NDVI) into four degradation classes (PDC), Figure S8: Analysis approach for calculating the PDI-Pasture Degradation Index, for regions of interest—e.g., rural properties, municipalities and states. In the example, a rural property in the municipality of Pedra Preta MT, Figure S9: Field samples for the accuracy analysis of the pasture quality mapping, 6 50 km × 50 km cells were sampled (A), and in each cell 9 Landsat pixels with 30 m resolution (B) were sampled, Table S1: Minimum and maximum median NDVI values for each unit of analysis (biome), Script S1: Python script to normalize the median NDVI images considering the Brazilian biomes as units of analysis, Script S2: Script in R for calculating the NDVI areas, normalized according to degradation classes.

Author Contributions

C.O.d.S., L.G.F.J. and L.L.P. conceived the idea and the methodological approach of the study; C.O.d.S. and V.V.M. processed the data and, together with L.G.F.J., analyzed the results. A.d.S.P. participated in the writing-original-draft and- writing-review & editing. All the authors contributed to the discussions and writing or revision of the manuscript. L.G.F.J. was responsible for the funding acquisition. All authors have read and agreed to the published version of the manuscript.

Funding

This research received no external funding.

Informed Consent Statement

Informed consent was obtained from all subjects involved in the study.

Data Availability Statement

Not applicable.

Acknowledgments

This work, part of the MapBiomas initiative (http://mapbiomas.org, accessed: 17 December 2021), was supported by the Gordon and Betty Moore Foundation (GBMF), The Nature Conservancy (TNC), the Goiás State Research Foundation (FAPEG), the Coordination for the Improvement of Higher Education Personnel (CAPES) and the Brazilian Research Council (CNPq).

Conflicts of Interest

The authors declare no conflict of interest.

References

  1. ABIEC. Perfil da Pecuária no Brasil; Associação Brasileira das Indústrias Exportadoras de Carnes: Lima, Brazil, 2020. [Google Scholar]
  2. IBGE. Pesquisa Pecuária Municipal. 2020. Available online: Sidra.ibge.gov.br/pesquisa/ppm/quadros/brasil/2019 (accessed on 19 December 2020).
  3. USDA. Livestock and Products Annual, Brazil 2020; USDA: Washington, DC, USA, 2020; p. 17. [Google Scholar]
  4. Dias Filho, M.B. Degradação de Pastagens: Processos, Causas e Estratégias de Recuperação. MBDF 2011, 4, 204. [Google Scholar]
  5. Parente, L.; Mesquita, V.; Miziara, F.; Baumann, L.; Ferreira, L. Assessing the pasturelands and livestock dynamics in Brazil, from 1985 to 2017: A novel approach based on high spatial resolution imagery and Google Earth Engine cloud computing. Remote Sens. Environ. 2019, 232, 111301. [Google Scholar] [CrossRef]
  6. Vieira-Filho, J.E.R.; Fishlow, A. Agricultura e Indústria no Brasil: Inovação e Competitividade; Columbia University Press: New York, NY, USA, 2017; p. 305. [Google Scholar]
  7. Parente, L.; Ferreira, L. Assessing the spatial and occupation dynamics of the Brazilian pasturelands based on the automated classification of MODIS images from 2000 to 2016. Remote Sens. 2018, 10, 606. [Google Scholar] [CrossRef] [Green Version]
  8. Zalles, V.; Hansen, M.C.; Potapov, P.V.; Parker, D.; Stehman, S.V.; Pickens, A.H.; Parente, L.L.; Ferreira, L.G.; Song, X.; Hernandez-Serna, A.; et al. Rapid expansion of human impact on natural land in South America since 1985. Sci. Adv. 2021, 7, eabg1620. [Google Scholar] [CrossRef] [PubMed]
  9. Barona, E.; Ramankutty, N.; Hyman, G.; Coomes, O.T. The role of pasture and soybean in deforestation of the Brazilian Amazon. Environ. Res. Lett. 2010, 5, 024002. [Google Scholar] [CrossRef]
  10. Cardille, J.A.; Foley, J.A. Agricultural land-use change in Brazilian Amazônia between 1980 and 1995: Evidence from integrated satellite and census data. Remote Sens. Environ. 2003, 87, 551–562. [Google Scholar] [CrossRef]
  11. Stabile, M.C.C.; Guimarães, A.L.; Silva, D.S.; Ribeiro, V.; Macedo, M.N.; Coe, M.T.; Pinto, E.; Moutinho, P.; Alencar, A. Solving Brazil’s land use puzzle: Increasing production and slowing Amazon deforestation. Land Use Policy 2020, 91, 104362. [Google Scholar] [CrossRef]
  12. Oliveira, O.C.; Oliveira, I.P.; Alves, B.J.R.; Urquiaga, S.; Boddey, R.M. Chemical and biological indicators of decline/degradation of Brachiaria pastures in the Brazilian Cerrado. Agric. Ecosyst. Environ. 2004, 103, 289–300. [Google Scholar] [CrossRef]
  13. Volpe, E.; Marchetti, M.E.; Macedo, M.C.M.; Rosa, E.J. Renovação de pastagem degradada com calagem, adubação e leguminosa consorciada em neossolo Quartzarênico. Acta Sci. Agron. 2008, 30, 131–138. [Google Scholar] [CrossRef]
  14. Dias Filho, M.B. Diagnóstico das Pastagens no Brasil; Empresa Brasileira de Pesquisa Agropecuária: Brasilia, Brazil, 2014; p. 36. [Google Scholar]
  15. Lahsen, M.; Bustamante, M.M.C.; Dalla-Nora, E.L. Undervaluing and Overexploiting the Brazilian Cerrado at Our Peril. Environ. Sci. Policy Sustain. Dev. 2016, 58, 4–15. [Google Scholar] [CrossRef] [Green Version]
  16. Braz, S.P.; Urquiaga, S.; Alves, B.J.R.; Jantalia, C.P.; Guimarães, A.P.; dos Santos, C.A.; dos Santos, S.C.; Machado Pinheiro, É.F.; Boddey, R.M. Soil Carbon Stocks under Productive and Brachiaria Degraded Pastures in the Brazilian Cerrado. Soil Sci. Soc. Am. 2013, 77, 914–928. [Google Scholar] [CrossRef]
  17. Bustamante, M.M.C.; Nobre, C.A.; Smeraldi, R.; Aguiar, A.P.D.; Barioni, L.G.; Ferreira, L.G.; Longo, K.; May, P.; Pinto, A.S.; Ometto, J.P.H.B. Estimating greenhouse gas emissions from cattle raising in Brazil. Clim. Change 2012, 115, 559–577. [Google Scholar] [CrossRef]
  18. FAO. Five Practical Actions Towards Low-Carbon Livestock; FAO: Rome, Italy, 2019. [Google Scholar]
  19. Pereira, L.F.; Ferreira, C.F.C.; Guimarães, R.M.F. Manejo, Qualidade E Dinâmica Da Degradação De Pastagens Na Mata Atlântica De Minas Gerais—Brasil. Nativa 2018, 6, 370. [Google Scholar] [CrossRef]
  20. West, P.C.; Gerber, J.S.; Engstrom, P.M.; Mueller, N.D.; Brauman, K.A.; Carlson, K.M.; Cassidy, E.S.; Johnston, M.; MacDonald, G.K.; Ray, D.K.; et al. Leverage points for improving global food security and the environment. Science 2014, 80, 325–328. [Google Scholar] [CrossRef] [PubMed] [Green Version]
  21. Alves-Pinto, H.N.; Newton, P.; Guedes Pinto, L.F. Reducing deforestation and enhancing sustainability in commodity supply chains: Interactions between governance interventions and cattle certification in Brazil. Trop. Conserv. Sci. 2015, 8, 1053–1079. [Google Scholar] [CrossRef] [Green Version]
  22. Embrapa. GeoDegrade. 2012. Available online: www.geodegrade.cnpm.embrapa.br/apresentacao (accessed on 10 January 2021).
  23. ICV. Programa Novo Campo. 2021. Available online: www.icv.org.br/projeto_especial/programa-novo-campo/ (accessed on 10 January 2021).
  24. MAPA. Plano Setorial de Mitigação e Adaptação às Mudanças Climáticas para Consolidação da Economia de Baixa Emissão de Carbono na Agricultura—PLANO ABC. Rev. Bras. De Geogr. Física 2012, 4, 1266–1274. [Google Scholar]
  25. Latawiec, A.E.; Strassburg, B.B.N.; Valentim, J.F.; Ramos, F.; Alves-Pinto, H.N. Intensification of cattle ranching production systems: Socioeconomic and environmental synergies and risks in Brazil. Animal 2014, 8, 1255–1263. [Google Scholar] [CrossRef] [Green Version]
  26. Souza, C.M.; Shimbo, J.Z.; Rosa, M.R.; Parente, L.L.; Alencar, A.A.; Rudorff, B.F.T.; Hasenack, H.; Matsumoto, M.; Ferreira, L.G.; Souza-Filho, P.W.M.; et al. Reconstructing three decades of land use and land cover changes in brazilian biomes with landsat archive and earth engine. Remote Sens. 2020, 12, 2735. [Google Scholar] [CrossRef]
  27. Gao, Q.; Li, Y.; Wan, Y.; Lin, E.; Xiong, W.; Jiangcun, W.; Wang, B.; Li, W. Grassland degradation in Northern Tibet based on remote sensing data. J. Geogr. Sci. 2006, 16, 165–173. [Google Scholar] [CrossRef]
  28. Olexa, E.M.; Lawrence, R.L. Performance and effects of land cover type on synthetic surface reflectance data and NDVI estimates for assessment and monitoring of semi-arid rangeland. Int. J. Appl. Earth Obs. Geoinf. 2014, 30, 30–41. [Google Scholar] [CrossRef]
  29. Reinermann, S.; Asam, S.; Kuenzer, C. Remote sensing of grassland production and management—A review. Remote Sens. 2020, 12, 1949. [Google Scholar] [CrossRef]
  30. Aguiar, D.A.; Mello, M.P.; Nogueira, S.F.; Gonçalves, F.G.; Adami, M.; Rudorff, B.F.T. MODIS Time Series to Detect Anthropogenic Interventions and Degradation Processes in Tropical Pasture. Remote Sens. 2017, 9, 73. [Google Scholar] [CrossRef] [Green Version]
  31. Arantes, A.E.; Couto, V.R.M.; Sano, E.E.; Ferreira, L.G. Livestock intensification potential in Brazil based on agricultural census and satellite data analysis. Pesqui. Agropecuária Bras. 2018, 53, 1053–1060. [Google Scholar] [CrossRef] [Green Version]
  32. Pereira, O.J.R.; Ferreira, L.G.; Pinto, F.; Baumgarten, L. Assessing pasture degradation in the Brazilian Cerrado based on the analysis of MODIS NDVI time-series. Remote Sens. 2018, 10, 1761. [Google Scholar] [CrossRef] [Green Version]
  33. Brito, J.L.S.; Arantes, A.E.; Ferreira, L.G.; Sano, E.E. MODIS estimates of pasture productivity in the Cerrado based on ground and Landsat-8 data extrapolations. J. Appl. Remote Sens. 2018, 12, 1. [Google Scholar] [CrossRef]
  34. Chen, Y.; Guerschman, J.; Shendryk, Y.; Henry, D.; Harrison, M.T. Estimating Pasture Biomass Using Sentinel-2 Imagery and Machine Learning. Remote Sens. 2021, 13, 603. [Google Scholar] [CrossRef]
  35. Dos Reis, A.A.; Werner, J.P.S.; Silva, B.C.; Figueiredo, G.K.D.A.; Antunes, J.F.G.; Esquerdo, J.C.D.M.; Coutinho, A.C.; Lamparelli, R.A.C.; Rocha, J.V.; Magalhães, P.S.G. Monitoring Pasture Aboveground Biomass and Canopy Height in an Integrated Crop–Livestock System Using Textural Information from PlanetScope Imagery. Remote Sens. 2020, 12, 2534. [Google Scholar] [CrossRef]
  36. Arantes, A.E.; Ferreira, L.G.; Coe, M.T. The seasonal carbon and water balances of the Cerrado environment of Brazil: Past, present, and future influences of land cover and land use. ISPRS J. Photogramm. Remote Sens. 2016, 117, 66–78. [Google Scholar] [CrossRef]
  37. Andrade, R.G.; Aparecida, C.; Rodrigues, G.; Del, I.; Sanches, A.; Enrique, F.; Quartaroli, C.F. Uso de técnicas de sensoriamento remoto na detecção de processos de degradação de pastagens. Eng. Agric. 2013, 21, 234–243. [Google Scholar]
  38. LAPIG. Atlas Digital das Pastagens Brasileiras. 2020. Available online: http://atlasdaspastagens.ufg.br/ (accessed on 19 December 2020).
  39. Gosch, M.S.; Parente, L.L.; Ferreira, N.C.; Oliveira, A.R.O.; Ferreira, L.G. Pastagens degradadas, uma herança dos imóveis rurais desapropriados para os assentamentos rurais do Cerrado goiano. Rev. Campo Territ. 2020, 15, 202–229. [Google Scholar] [CrossRef]
  40. Rouse, W.; Haas, R.H.; Deering, D.W. Monitoring Vegetation Systems in the Great Plains with ERTS, NASA SP-351; NASA: Washington, DC, USA, 1973; Volume 1. [Google Scholar]
  41. Eckert, S.; Hüsler, F.; Liniger, H.; Hodel, E. Trend analysis of MODIS NDVI time series for detecting land degradation and regeneration in Mongolia. J. Arid Environ. 2015, 113, 16–28. [Google Scholar] [CrossRef]
  42. Gargiulo, J.; Clark, C.; Lyons, N.; de Veyrac, G.; Beale, P.; Garcia, S. Spatial and temporal pasture biomass estimation integrating electronic plate meter, planet cubesats and sentinel-2 satellite data. Remote Sens. 2020, 12, 3222. [Google Scholar] [CrossRef]
  43. Olofsson, P.; Foody, G.M.; Herold, M.; Stehman, S.V.; Woodcock, C.E.; Wulder, M.A. Good practices for estimating area and assessing accuracy of land change. Remote Sens. Environ. 2014, 148, 42–57. [Google Scholar] [CrossRef]
  44. Gorelick, N.; Hancher, M.; Dixon, M.; Ilyushchenko, S.; Thau, D.; Moore, R. Google Earth Engine: Planetary-scale geospatial analysis for everyone. Remote Sens. Environ. 2017, 202, 18–27. [Google Scholar] [CrossRef]
  45. Davidson, E.A.; de Araújo, A.C.; Artaxo, P.; Balch, J.K.; Brown, I.F.; Bustamante, M.M.C.; Coe, M.T.; DeFries, R.S.; Keller, M.; Longo, M.; et al. The Amazon basin in transition. Nature 2012, 481, 321–328. [Google Scholar] [CrossRef]
  46. Sparovek, G.; Reydon, B.P.; Guedes Pinto, L.F.; Faria, V.; de Freitas, F.L.M.; Azevedo-Ramos, C.; Gardner, T.; Hamamura, C.; Rajão, R.; Cerignoni, F.; et al. Who owns Brazilian lands? Land Use Policy 2019, 87, 104062. [Google Scholar] [CrossRef]
  47. Parente, L.; Nogueira, S.; Baumann, L.; Almeida, C.; Maurano, L.; Affonso, A.G.; Ferreira, L. Quality assessment of the PRODES Cerrado deforestation data. Remote Sens. Appl. Soc. Environ. 2021, 21, 100444. [Google Scholar] [CrossRef]
  48. Oliveira, E.R.; Couto, V.R.M. Productive and Economic Viability of Raising Beef Cattle in the Savanna of the Brazilian State of Goiás. Rev. Econ. Sociol. Rural 2018, 56, 395–410. [Google Scholar] [CrossRef] [Green Version]
  49. Martha-Júnior, G.B.; Vilela, L. Pastagens no Cerrado: Baixa Produtividade pelo Pastagens no Cerrado; Empresa Brasileira de Pesquisa Agropecuária: Brasilia, Brazil, 2002; p. 30. [Google Scholar]
  50. Garrett, R.D.; Koh, I.; Lambin, E.F.; le Polain de Waroux, Y.; Kastens, J.H.; Brown, J.C. Intensification in agriculture-forest frontiers: Land use responses to development and conservation policies in Brazil. Glob. Environ. Chang. 2018, 53, 233–243. [Google Scholar] [CrossRef]
  51. Alencar, A.; Pereira, C.; Castro, I.; Cardoso, A.; Souza, L.; Costa, R.; Bentes, A.J.; Stella, O.; Azevedo, A.; Gomes, J.; et al. Desmatamento nos Assentamentos da Amazônia: Histórico, Tendências e Oportunidades; IPAM: Brasilia, Brazil, 2016; p. 93. [Google Scholar]
  52. Castro, C.N.; Pereira, C.N. Agricultura familiar, assistência técnica e extensão rural e a política nacional de Ater. Inst. Pesqui. Econômica Apl. 2017, 1, 48. [Google Scholar]
  53. Nepstad, D.; McGrath, D.; Stickler, C.; Alencar, A.; Azevedo, A.; Swette, B.; Bezerra, T.; DiGiano, M.; Shimada, J.; Motta, R.S.; et al. Slowing Amazon deforestation through public policy and interventions in beef and soy supply chains. Science 2014, 344, 1118–1123. [Google Scholar] [CrossRef] [PubMed]
  54. Latawiec, A.E.; Strassburg, B.B.N.; Silva, D.; Alves-Pinto, H.N.; Feltran-Barbieri, R.; Castro, A.; Iribarrem, A.; Rangel, M.C.; Kalif, K.A.B.; Gardner, T.; et al. Improving land management in Brazil: A perspective from producers. Agric. Ecosyst. Environ. 2017, 240, 276–286. [Google Scholar] [CrossRef]
  55. Strassburg, B.B.N.; Latawiec, A.E.; Barioni, L.G.; Nobre, C.A.; Silva, V.P.; Valentim, J.F.; Vianna, M.; Assad, E.D. When enough should be enough: Improving the use of current agricultural lands could meet production demands and spare natural habitats in Brazil. Glob. Environ. Chang. 2014, 28, 84–97. [Google Scholar] [CrossRef] [Green Version]
  56. Lambin, E.F.; Gibbs, H.K.; Ferreira, L.; Grau, R.; Mayaux, P.; Meyfroidt, P.; Morton, D.C.; Rudel, T.K.; Gasparri, I.; Munger, J. Estimating the world’s potentially available cropland using a bottom-up approach. Glob. Environ. Chang. 2013, 23, 892–901. [Google Scholar] [CrossRef]
Figure 1. Flowchart depicting the stratification of the NDVInorm (normalized NDVI) into three classes of degradation state (i.e., Absent, Intermediate and Severe).
Remotesensing 14 01024 g001
Figure 2. Areas occupied by pastures in Brazil in 2010 and 2018 (http://atlasdaspastagens.ufg.br/ accessed on 17 December 2021) (31.7 Mha (million hectares) mapped only in 2010; 139.9 Mha mapped in 2010 and 2018; 30.8 Mha mapped only in 2018).
Remotesensing 14 01024 g002
Figure 3. Pasture area in Brazil, according to 3 classes of degradation state (D0—Absent; D1—Intermediate; D2—Severe), for the years 2010 and 2018.
Remotesensing 14 01024 g003
Figure 4. Dynamics of pasture degradation in Brazil between 2010 and 2018. Degradation classes: D0—Absent; D1—Intermediate; D2—Severe. NP—area not mapped as pasture.
Remotesensing 14 01024 g004
Figure 5. Spatial distribution of Brazilian rural properties by size class (Small, Medium and Large), according to the limits available in the CAR—the Rural Environmental Registry.
Remotesensing 14 01024 g005
Figure 6. Spatial distribution of the dynamics in pasture quality in Brazilian rural properties between 2010 and 2018 ((A)—Small properties; (B)—Medium properties; (C)—Large properties).
Remotesensing 14 01024 g006
Figure 7. Distribution of polygons with ABC Plan financing contracts for the recovery of degraded pastures, in the period from 2016 to 2017, classified as loss (Degradation), gain (Recovery) or Stability in the quality of pastures.
Remotesensing 14 01024 g007
Table 1. Accuracy analysis of pasture quality mapping in 2018, based on 53 points evaluated in the field, in the Cerrado biome.
AbsentIntermediateSevereUA 2
Absent138159%
Intermediate411169%
Severe35747%
PA 165%46%78%
1 producer accuracy; 2 user accuracy.
Table 2. Distribution of the number of Brazilian rural properties regarding the dynamics of pasture quality in the period between 2010 and 2018.
QualityNumber of Rural Properties
SmallMediumLargeTotal
Stable1,451,311 (59.2%)97,200 (57.3%)31,589 (52.7%)1,580,100 (58.9%)
Increase595,445 (24.3%)57,452 (33.9%)24,696 (41.2%)677,593 (25.3%)
Reduction406,192 (16.6%)15,027 (8.9%)3711 (6.2%)424,930 (15.8%)
Total2,452,948(100%)169,679(100%)59,996(100%)2,682,623(100%)
Publisher’s Note: MDPI stays neutral with regard to jurisdictional claims in published maps and institutional affiliations.

