Article

Sensitivity of Green-Up Date to Meteorological Indicators in Hulun Buir Grasslands of China

1
State Key Laboratory of Remote Sensing Science, Faculty of Geographical Science, Beijing Normal University, Beijing 100875, China
2
Beijing Key Laboratory for Remote Sensing of Environment and Digital Cities, Faculty of Geographical Science, Beijing Normal University, Beijing 100875, China
3
School of Grassland Science, Beijing Forestry University, Beijing 100083, China
4
Academy of Agricultural Planning and Engineering, Ministry of Agriculture and Rural Affairs, Beijing 100125, China
5
Key Laboratory of Agri-Informatics, Ministry of Agriculture and Rural Affairs, Institute of Agricultural Resources and Regional Planning, Chinese Academy of Agricultural Sciences, Beijing 100081, China
6
Region Ecological Environment Publicity and Education Center, Inner Mongolia Department of Ecology and Environment, Hohhot 010011, China
7
Academy of Inventory and Planning, National Forestry and Grassland Administration, Beijing 100714, China
*
Author to whom correspondence should be addressed.
Remote Sens. 2022, 14(3), 670; https://doi.org/10.3390/rs14030670
Submission received: 8 December 2021 / Revised: 25 January 2022 / Accepted: 28 January 2022 / Published: 30 January 2022
(This article belongs to the Section Remote Sensing in Agriculture and Vegetation)

Abstract

:
Temperature and precipitation are considered to be the most important indicators affecting the green-up date. Sensitivity of the green-up date to temperature and precipitation is considered to be one of the key indicators to characterize the response of terrestrial ecosystems to climate change. We selected the main grassland types for analysis, including temperate steppe, temperate meadow steppe, upland meadow, and lowland meadow. This study investigates the variation in key meteorological indicators (daily maximum temperature (Tmax), daily minimum temperature (Tmin), and precipitation) between 2001 and 2018. We then examined the partial correlation and sensitivity of green-up date (GUD) to Tmax, Tmin, and precipitation. Our analysis indicated that the average GUD across the whole area was DOY 113. The mean GUD trend was −3.1 days/decade and the 25% region advanced significantly. Tmax and Tmin mainly showed a decreasing trend in winter (p > 0.05). In spring, Tmax mainly showed an increasing trend (p > 0.05) and Tmin a decreasing trend (p > 0.05). Precipitation showed no significant (p > 0.05) change trend and the trend range was ±10 mm/decade. For temperate steppe, the increase in Tmin in March promotes green-up (27.3%, the proportion of significant pixels), with a sensitivity of −0.17 days/°C. In addition, precipitation in April also promotes green-up (21.7%), with a sensitivity of −0.32 days/mm. The GUDs of temperate meadow steppe (73.9%), lowland meadow (65.9%), and upland meadow (22.1%) were mainly affected by Tmin in March, with sensitivities of −0.15 days/°C, −0.13 days/°C, and −0.14 days/°C, respectively. The results of this study reveal the response of vegetation to climate warming and contribute to improving the prediction of ecological changes as temperatures increase in the future.

Graphical Abstract

1. Introduction

Global temperatures continue to warm as a component of climate change, which affects many ecological patterns [1]. Phenology is the study of the development of plant and animal behavior throughout the year [2]. Myneni [3] found that in the context of global warming, plant phenology has undergone profound changes and has become a sensitive indicator of global change [4]. Climate change alters the time of phenological events [5,6], which may disrupt seasonal interactions between species, thereby affecting biodiversity and ecosystem primary production [7,8]. To quantify the response of green-up date (GUD) to climate change, it is increasingly important to pay attention to the interannual variation of GUD relative to the temperature/precipitation change per unit, which is called the temperature/precipitation sensitivity (days/°C or days/mm, respectively) [9,10,11]. From 1956 to 2006, the daily minimum temperature (Tmin) of the global land surface increased faster than that of the daily maximum temperature (Tmax). Such asymmetric warming patterns may result in important biological trends, especially in basic ecosystem metabolic processes, such as photosynthesis and respiration, which are sensitive to temperature changes [12]. Therefore, nighttime warming may have a greater effect on respiration than diurnal warming on photosynthesis. Most importantly, sensitivity is considered to be one of the key indicators to characterize the response of terrestrial ecosystems to climate change, and understanding the sensitivity of GUD to temperature can greatly improve our ability to predict ecological changes as temperatures increase in the future [13,14].
Temperature is considered to be a convenient descriptor of temperate and cold zone vegetation distribution [15]. Several studies have shown that climate warming in recent decades has caused spatio-temporal changes in GUD, with the magnitude varying regionally and globally [3,5,16,17,18,19,20,21,22]. Tmax and Tmin have different changes and different effects on phenology [23,24,25]. A recent study found that an increase in Tmax had a greater effect on GUD than an increase in Tmin in central Europe. In the past few decades, Tmin has increased faster than Tmax during the day in most parts of the world, leading to a reduction in diurnal thermal amplitude [1]. Tmax is more relevant than Tmin for leaf development because photosynthesis only occurs in the daytime and plays a greater role in plant carbon fixation and plant green-up [26].
Researchers have found that ground-based observations [9,10,11,27], remote sensing data [28,29], or flux data [30] show great variability in temperature sensitivity in the grassland types of different regions. In eastern Canada, a warming experiment on Picea mariana at 20 different locations showed that both daytime and nighttime warming promoted bud growth, with daytime warming being more conducive to germination than nighttime warming [31]. In the Qinghai-Tibet Plateau, the increase in Tmin can significantly (p < 0.05) advance vegetation green-up at both species and regional scales. However, Tmax had no significant effect on GUD (p > 0.1) [32]. Compared with the cold Tibetan Plateau, China’s temperate grasslands regions are warmer and drier, with a predominantly arid and semi-arid climate. To understand the mechanisms by which temperature influences vegetation greening, it is important to study the separate effects of daytime and nighttime warming on vegetation GUD in temperate grasslands in China. A study had studied the asymmetric effects of daytime and nighttime warming on spring phenology in the temperate grasslands of China based AVHRR NDVI [24]. Therefore, it is necessary to use higher spatial resolution remote sensing data for high precision research.
Hulun Buir is a grassland system with the highest latitude in China. The grasslands in the southwest are semi-arid. The temperate meadow steppe (TMS) area is distributed on the west side of the Great Khingan Mountains and is the most common type of TMS area in China. The spatial heterogeneity of the hydroclimatic conditions determines the vegetation distribution in the Hulun Buir grassland. In arid/semi-arid areas, water is critical for plant growth, because soil moisture is usually not optimal.
It is often observed that vegetation activity at high elevations is mainly influenced by temperature changes, whereas plant growth at low elevations is often limited by water stress [33]. This view needs to be further examined in the Hulun Buir grassland. In addition, snowmelt in some high-altitude ecological areas in spring, such as in the Qinghai-Tibet Plateau, and often provides important supplementary water resources, thus influencing the spring vegetation development [34]. Winter precipitation plays an important role in regulating the spring vegetation phenology of water-deficient biomes in temperate steppe (TS) and temperate desert of China [35]. In arid and semi-arid areas of northeast China, the dates of phenological events are most significantly correlated with precipitation in the previous 2–4 months [36]. The GUD of the frozen soil in Inner Mongolia is mainly dominated by early autumn and winter precipitation, and the frozen soil plays an important role in storing the available water for subsequent vegetation green-up [37]. In the Hulun Buir TS and TMS regions, the annual average temperature is lower, with more than half of the regional annual average temperatures below 0 °C [38]. Usually, the soil surface is covered with snow in winter and the spring temperature increases lead to the spring snowmelt, which may have positive effects on GUD, but for which additional research is necessary.
Our present research focuses on the Hulun Buir grassland for two main reasons. First, this grassland is distributed in the extreme northeast portion of China across humid, sub-humid, and semi-arid areas. Second, Hulun Buir is the most representative area of TMS in China. Our study has three main aims: (1) describe the variation in Tmax, Tmin, and precipitation in winter and spring; (2) quantify the partial correlation between GUD and Tmax, Tmin, and precipitation; and (3) determine the sensitivity of different grassland type GUD to Tmax, Tmin, and precipitation.

2. Materials and Methods

2.1. Study Area

The Hulun Buir Grassland is located at the middle latitudes of Eurasia, distributed in the northern temperate zone and a small part of the cold temperate zone—the highest latitude grassland area in China. Hulun Buir is distributed in the northeast of Inner Mongolia, forming the most concentrated TMS in China. Yet, it is also a typical grassland area, where a variety of meadow steppe ecosystems are found (Figure 1). It is an important part of the steppe sub-region of central Asia in the Steppe region of Eurasia, with rich grassland types. Precipitation gradually decreases from east to west, and the gradients in vegetation biomass are obvious. From east to west, the grassland shifts from a typical semi-arid climate through the meadow steppe, and the ecological geographical gradient changes from east to west with the dryness of the climate. Detailed information on the vegetation, topography, and climate are given in Guo et al. [38]. Based on an analysis of the entire study area, we selected TS, TMS, lowland meadow (LM), and upland meadow (UM) for a more detailed analysis.

2.2. Determination of Vegetation Green-Up Date

Remote sensing data were derived from Moderate Resolution Imaging Spectroradiometer (MODIS) MOD09A1 data (2001–2018) of the National Aeronautics and Space Administration (NASA) https://modis.gsfc.nasa.gov/ (18 September 2019). The MOD09A1 dataset was produced at a spatial resolution of 500 m and a temporal resolution of 8 days. Annual vegetation GUD on Hulun Buir grassland was determined from the normalized difference phenology index (NDPI). The NDPI was developed to minimize the effects of snowmelt [39]. NDPI is a sensitive indicator of vegetation growth and is thus widely used to derive GUD [38,39].
NDPI = ρ N I R 0.74 × ρ r e d + 0.26 × ρ S W I R ρ N I R + 0.74 × ρ r e d + 0.26 × ρ S W I R
where ρ N I R ,   ρ r e d ,   ρ S W I R represents the reflectance of the near-infrared band, red band, and shortwave-infrared, respectively.
For processing, the NDPI time series were filtered with a double logistic function, as described in Guo et al. [38]. After that, we determined GUD from the pre-processed MODIS NDPI using the median method. The median method was used to monitor the annual green-up date. The formula used is given below:
NDPImid = (NDPImax + NDPImin) × 50%,
where NDPImid represents the NDPI of the green-up date, NDPImax represents the maximum NDPI throughout the growing season, and NDPImin represents the minimum of the NDPI increase phase.

2.3. Calculation of the Key Meteorological Indicators

The meteorological data (2000–2018) used in this study included temperature, precipitation, and insolation data downloaded from the China Meteorological Forcing Dataset [40], with a spatial resolution of 0.1° and a temporal resolution of 3 h. Meteorological data were resampled from 0.1° to 500 m using the bilinear interpolation method in Envi5.3 software (Exelis Visual Information Solutions, Broomfield, United States). The advantages are that the method is simple and the processing speed fast.
Tmax, Tmin, precipitation, and insolation were chosen for the key meteorological indicators. In this study, we used temperature data with a resolution of 3 h for calculations of the daily maximum temperature and daily minimum temperature. Then, Tmax was calculated by the mean of the daily maximum temperature in one month or one season, and Tmin was calculated by the mean of the daily minimum temperature in one month or one season. Precipitation was calculated by the sum of the precipitation in one month or one season, and insolation was represented by the mean of the downward shortwave radiation in one month or one season. According to the local climate of Hulun Buir, we chose spring (March, April, and May) and winter (January, February, and December of last year) for this study.

2.4. Trend Analysis Method

The Mann–Kendall [41,42] method was used to examine the trends in the green-up date and meteorological indicators. Since the Mann–Kendall method is a nonparametric test for monotonic trends, it does not assume a specific distribution for the data and is insensitive to outliers. The Mann–Kendall method was a climate diagnosis and prediction technology. It could determine whether there was a mutation in the time series, and if there was, the time of the mutation can be determined. The Theil–Sen method is a nonparametric statistical method for the significance test of the trend [43]. It is a method for robust linear regression that chooses the median slope among all lines through pairs of two-dimensional sample points. Combining the two is an excellent method for time series trend analysis, which has been widely used in climate and hydrological trend research in recent years [44,45,46].

2.5. Partial Correlation

A partial correlation method was used to investigate the influence of Tmax, Tmin, and precipitation on the interannual variation of GUD. A partial correlation analysis refers to the process when two variables are related to the third variable at the same time, the influence of the third variable is removed, the correlation degree between the other two variables is analyzed, and the determination index is the value of the partial correlation coefficient. This method has been successfully applied to eliminate the covariate effect between multiple influencing factors [38,47,48]. Suppose there are variables x 1 , x 2 ,…, x n (n > 2), then the partial correlation coefficients of any two variables x i and x j can be calculated as follows:
r i j · l 1 l 2 l g = r i j · l 1 l 2 l g 1 r i l g · l 1 l 2 l g 1 r j l g · l 1 l 2 l g 1   ( 1 r i l g · l 1 l 2 l g 1 2 )   ( 1 r j l g · l 1 l 2 l g 1 2 )    
where l 1 , l 2 ,…, l g represents variables other than x i and x j , r i j · l 1 l 2 l g indicates the partial correlation coefficient between x i and x j when controlling variables l 1 , l 2 ,…, l g .   r i j · l 1 l 2 l g 1 indicates the partial correlation coefficient between x i and x j when controlling variables l 1 , l 2 ,..., l g 1 .   r i l g · l 1 l 2 l g 1 indicates the partial correlation coefficient between x i and l g when controlling variables l 1 , l 2 ,…, l g 1 . r j l g · l 1 l 2 l g 1 indicates the partial correlation coefficient between x j and l g when controlling variables l 1 , l2,…, l g 1 .

2.6. Sensitivity Analysis

The sensitivity of vegetation GUD to temperature or precipitation is defined as the slope of a linear regression model of temperature or precipitation to GUD over a certain period, which describes the change in the GUD date per unit change of temperature and precipitation [49]. Sensitivity is an important parameter to measure the response of GUD to future climate change. The sensitivity calculation formula is as follows:
Y = aX + b
where Y is the GUD of vegetation, X is a meteorological factor (daily maximum temperature, daily minimum temperature, and precipitation in winter, spring, or one month), b is a constant, and a is the sensitivity of GUD to meteorological indicators.
This study calculated the sensitivity of vegetation GUD to meteorological indicators from 2001 to 2018, including the daily maximum temperature, daily minimum temperature, and precipitation, and analyzed different grassland types and periods to better understand the response of vegetation to climate change.

2.7. Flow Chart

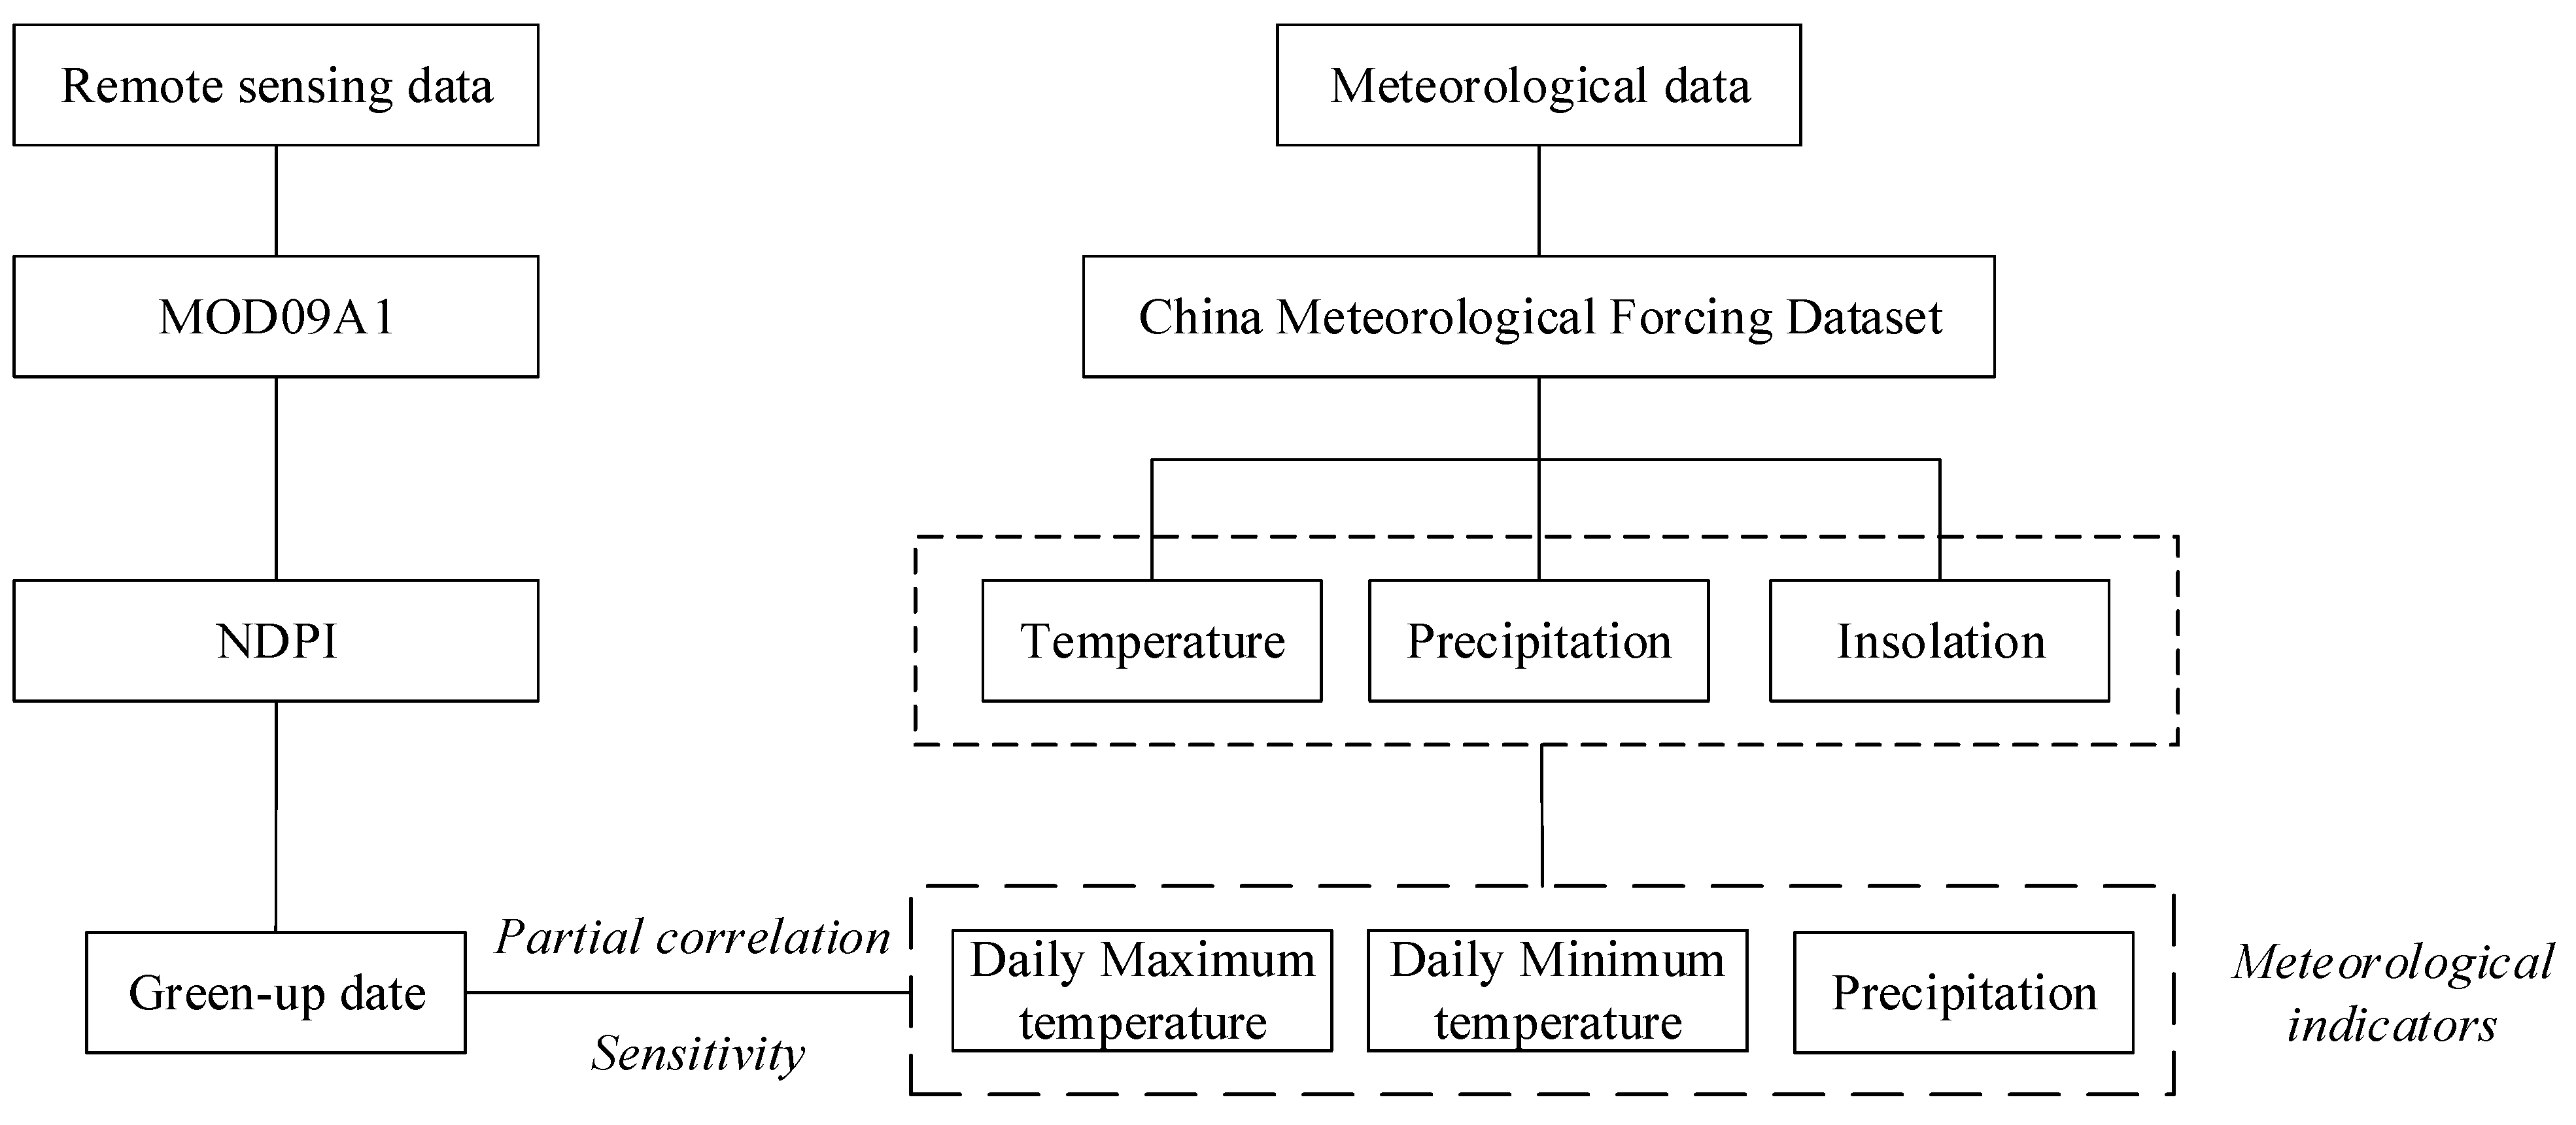
A flow chart of the key indicators computation and statistical analysis is displayed in Figure 2. GUD was extracted based on the NDPI calculated from the remote sensing data (MOD09A1) by the median method. Meteorological indicators were calculated from the temperature, precipitation, and insolation. A partial correlation analysis was used to investigate the relationship between GUD and Tmax, Tmin, and precipitation at the season or month scale. A sensitivity analysis was used to investigate the sensitivity of GUD to the meteorological indicators.

3. Results

3.1. Spatial and Temporal Patterns of GUD

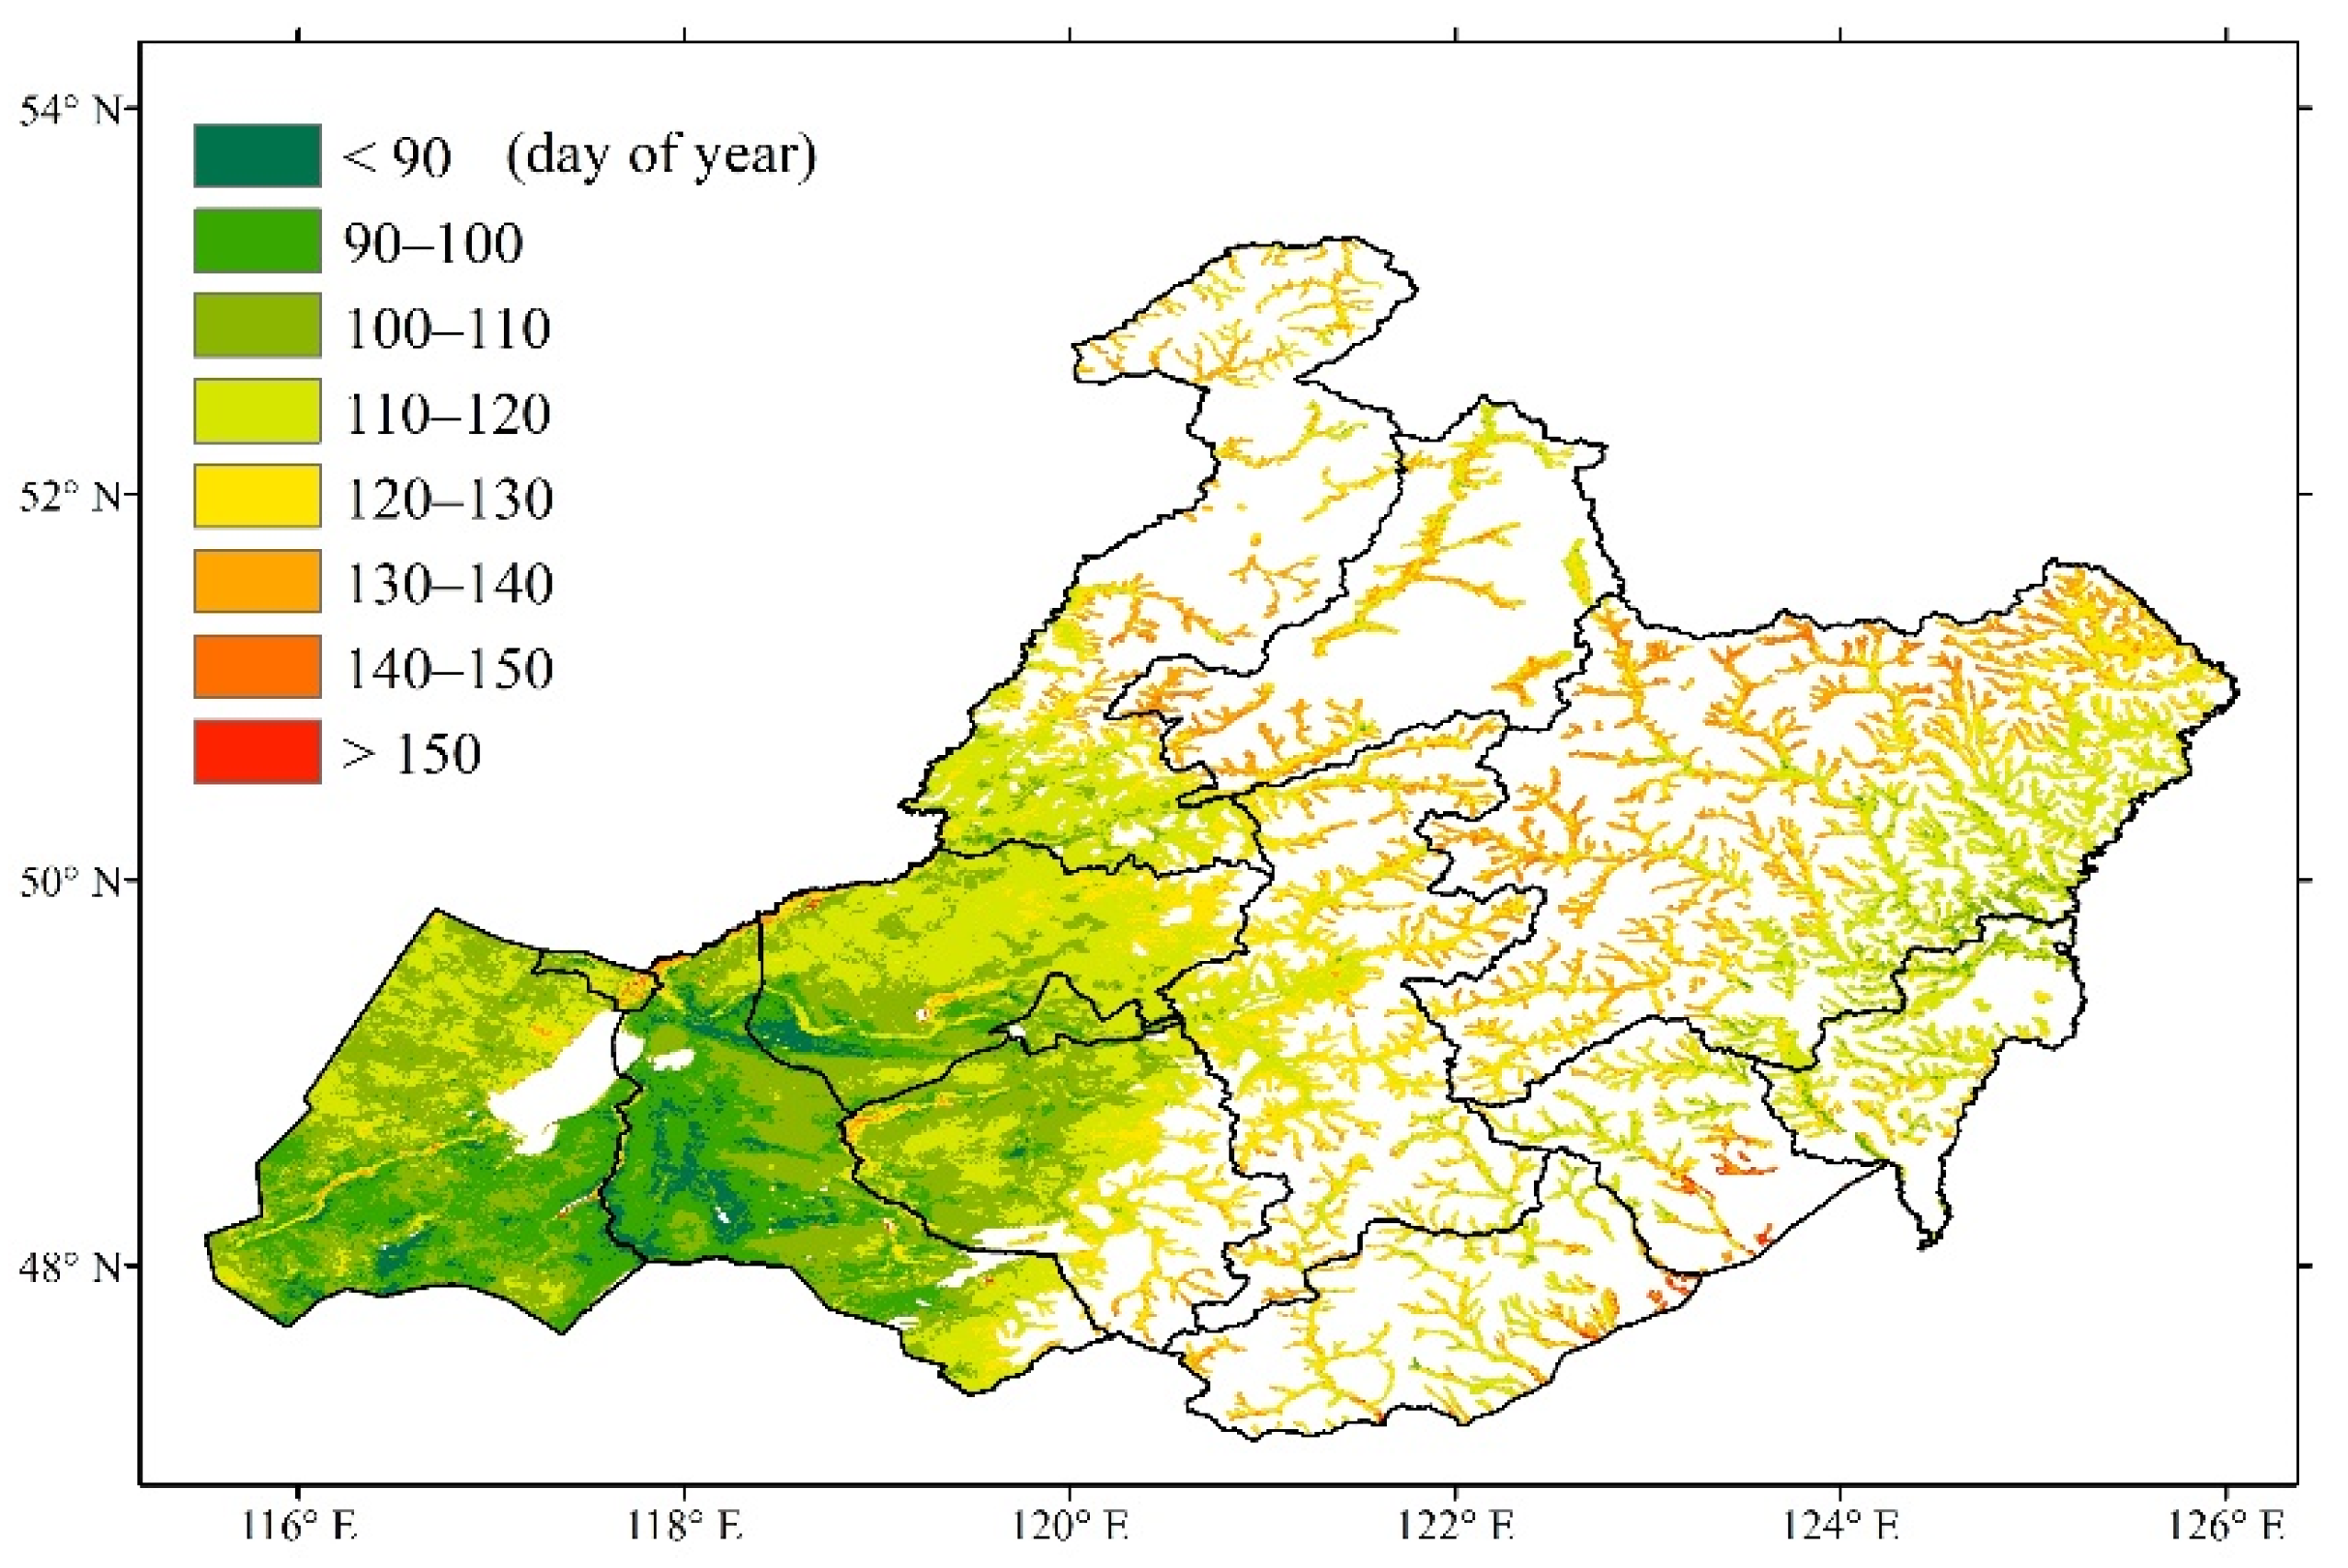
The multiyear mean remote sensing green-up dates (Figure 3) ranged from DOY (day of year) 90 in warm and dry areas to DOY 150 in cold and wet areas across the Hulun Buir grassland; the analysis also revealed spatial variations that were delayed from the west and east to the central region. The mean GUD across the whole area was DOY 113.1. The mean standard deviation across the whole area was 9.9 days. The temperate steppe had the earliest green-up date (DOY 104 ± 8.2; mean ± standard deviation), followed by the temperate meadow steppe (DOY 114 ± 7.1), lowland meadow (DOY 120 ± 12.4), and upland meadow (DOY 119 ± 5.4).
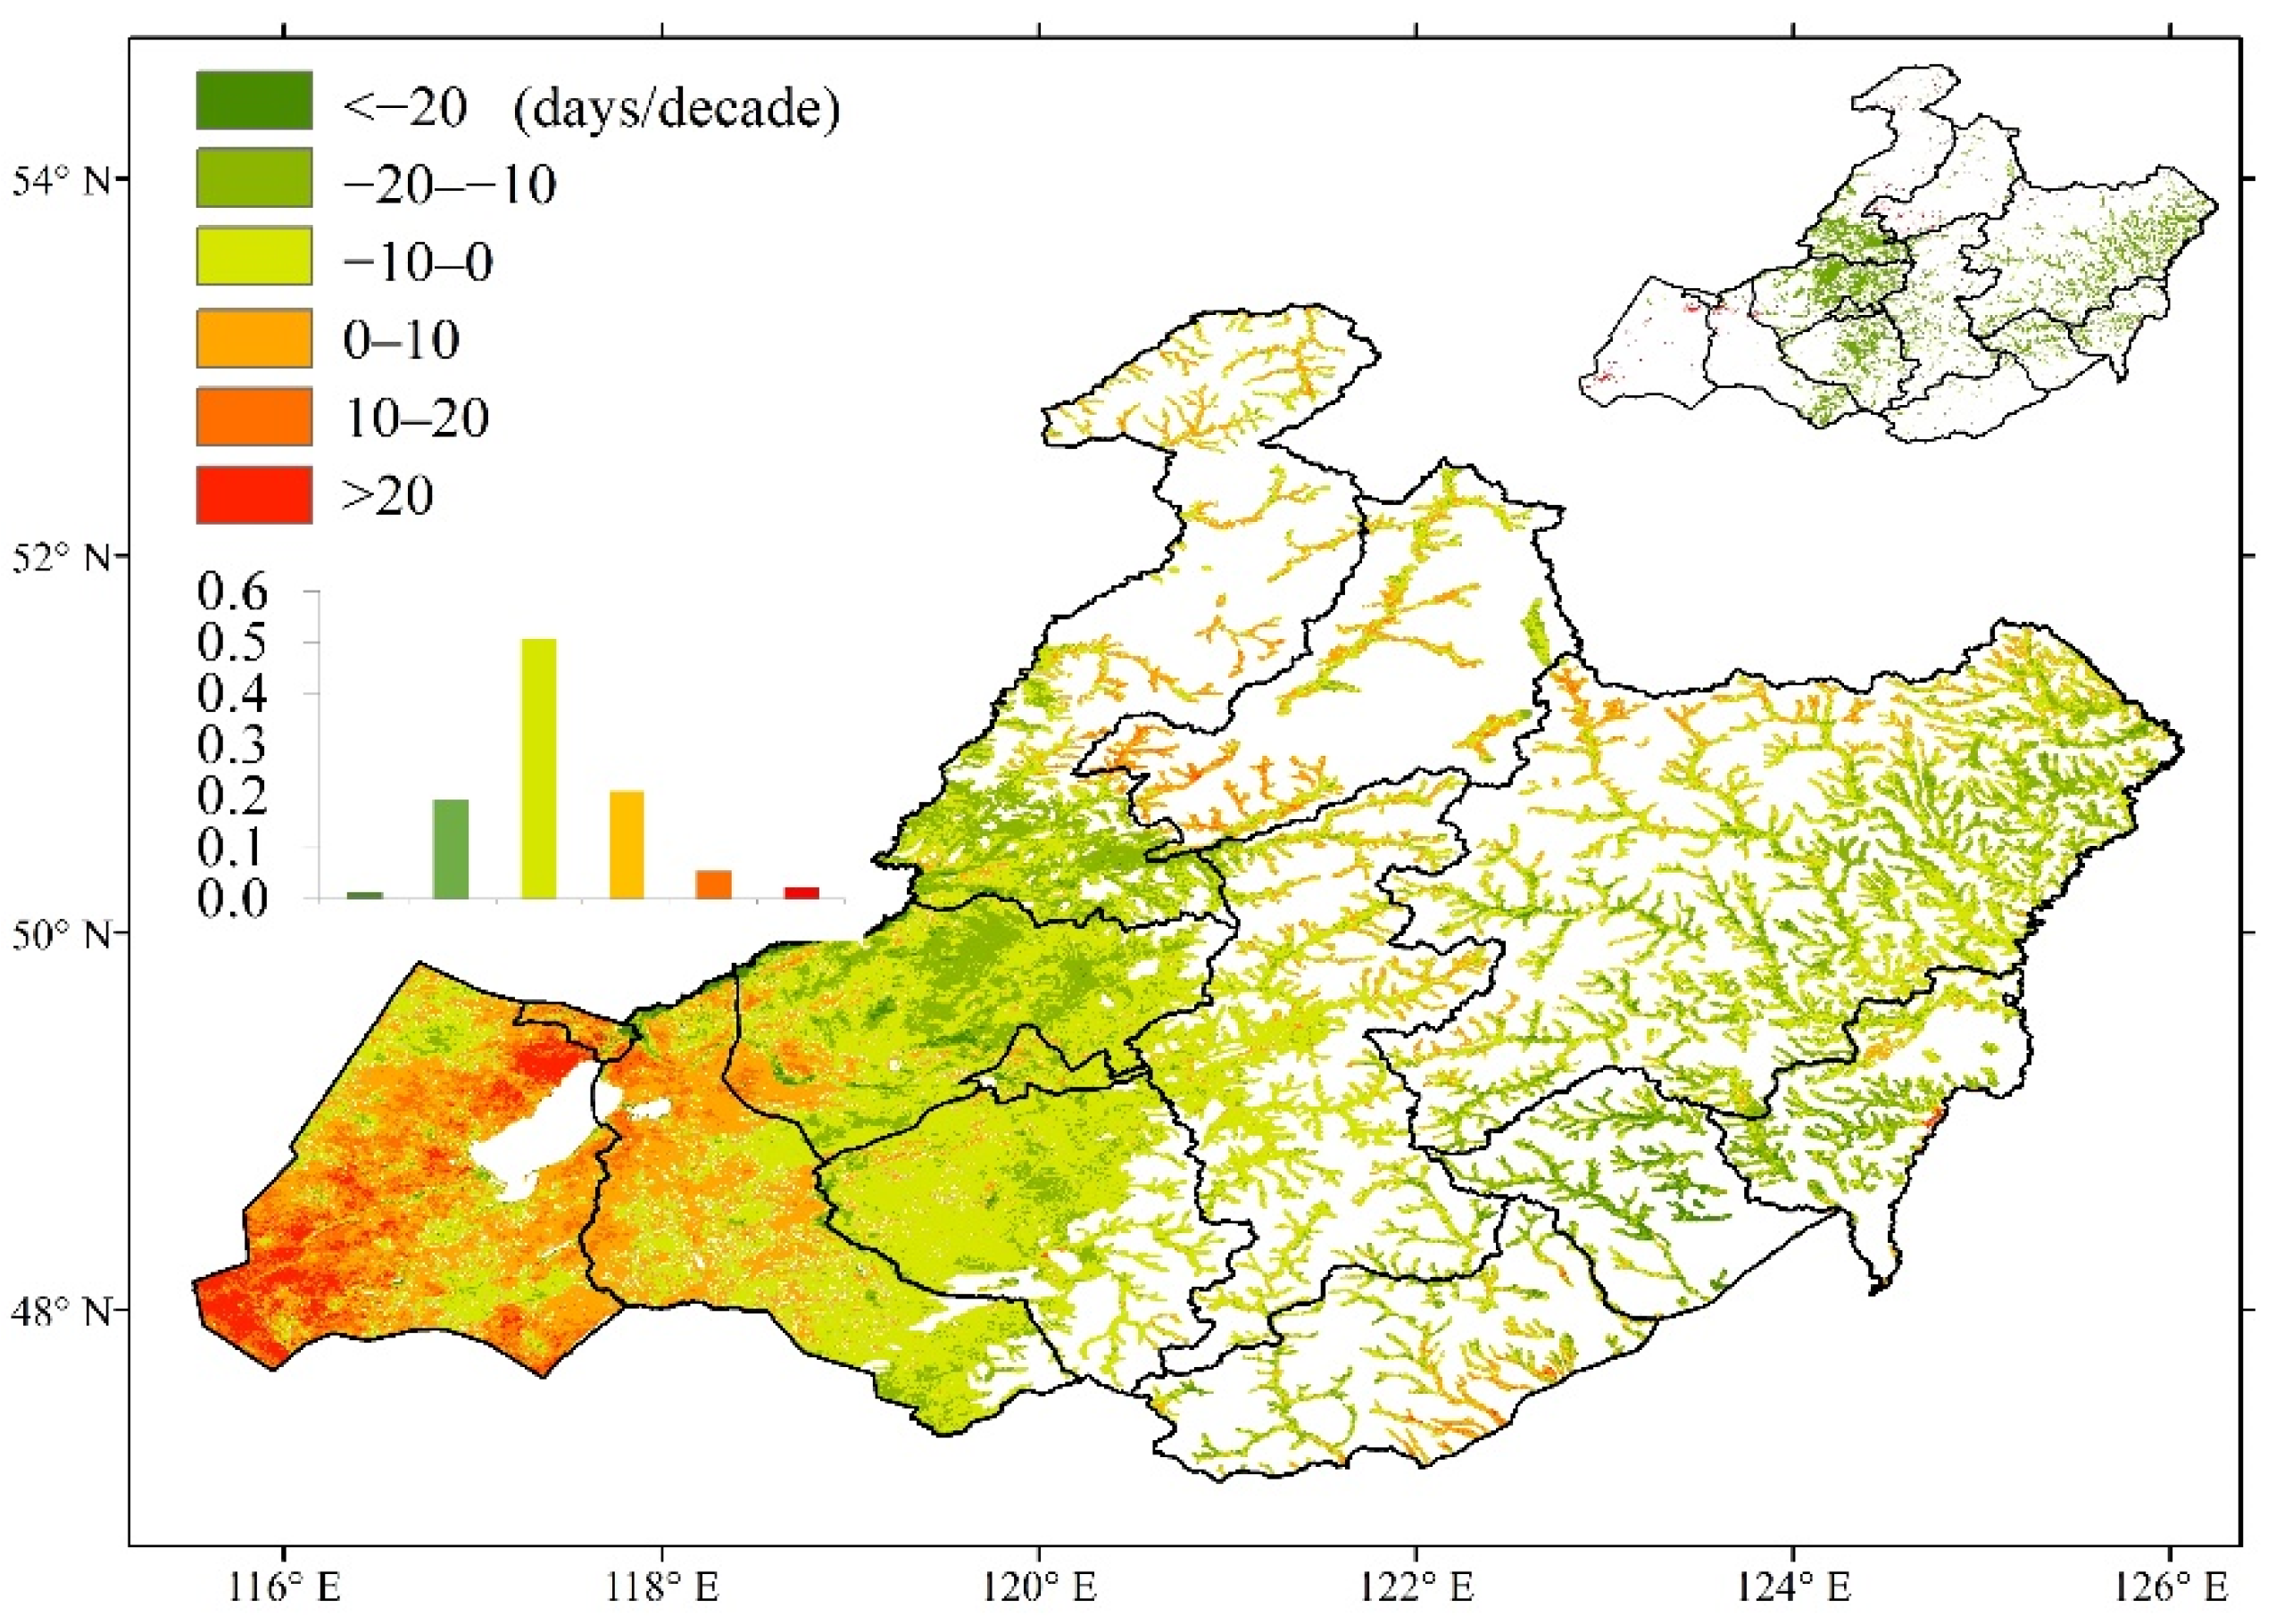
The trends in green-up dates decreased from the west and east to the central region (Figure 4) and ranged from −20 days/decade to 20 days/decade. The mean trend overall was −3.1 days/decade. However, only 0.01% of the pixels exhibited significant (p < 0.05) positive changes, and where mainly distributed in the northwestern temperate steppe; 25.0% of pixels exhibited significant (p < 0.05) negative changes, and where mainly distributed in the temperate meadow steppe and northeast lowland meadow. The areas with large delayed trends were primarily concentrated in the temperate steppe, whereas the areas with large advanced trends were primarily concentrated in the lowland meadow areas.

3.2. Spatial and Temporal Patterns of Meteorological Indicators

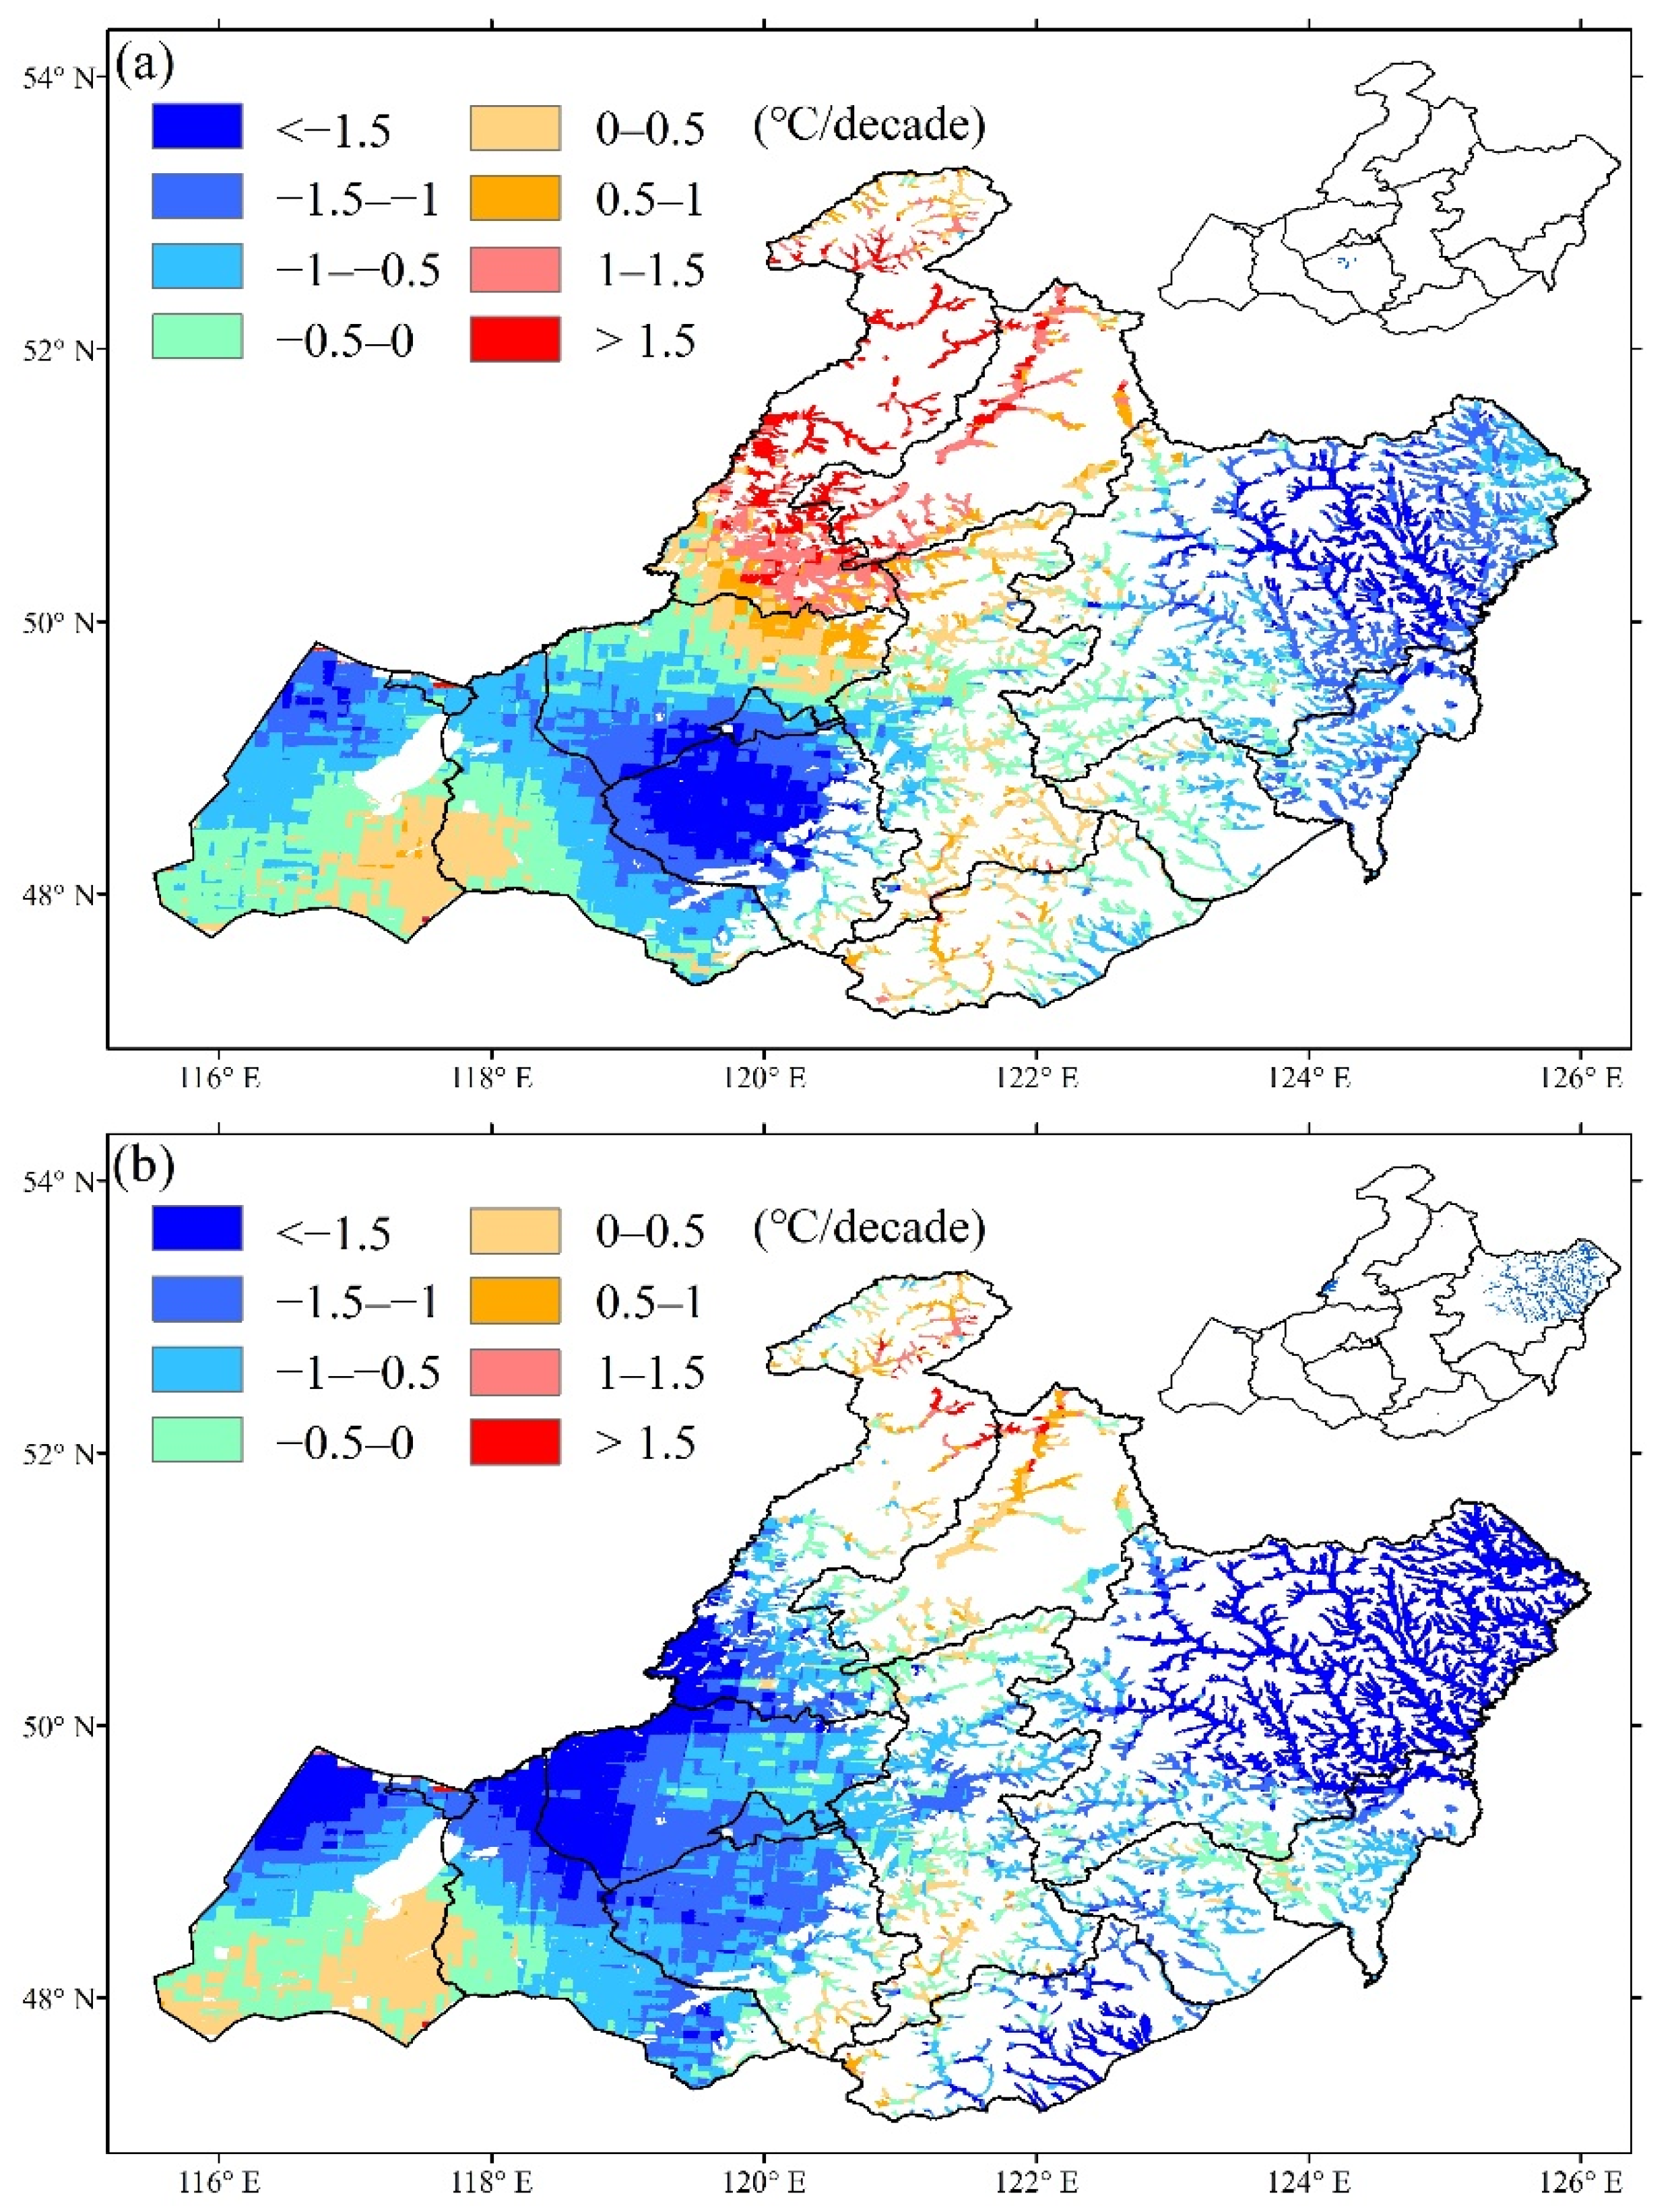
To further study the variation in air temperature, Tmax and Tmin were calculated, and the variation in air temperature in winter and spring was analyzed. The trend analysis was conducted using the winter temperatures from 2001 to 2018, and the results are shown in Figure 5. On the whole, the variation trend in Tmax and Tmin is consistent in most regions, and the area with a significant decreasing trend accounted for 0.4% pixels and 10.4% pixels of the area, respectively. The average trend in Tmax was −0.46 °C/decade, while the average trend in Tmin was −1.06 °C/decade. The decline in Tmin was higher than that of Tmax.
The spring temperature variation trend is shown in Figure 6. The variation trends in Tmax and Tmin are not significant in most regions. Tmax mainly shows an increasing trend, accounting for 99.5% of the area, while Tmin also shows an increasing trend, accounting for 54.9% of the area. The area with a significant decreasing trend of Tmin accounted for 4.3% pixels and the area with a significant increasing trend of Tmax accounted for 2.8% pixels. The average trend in Tmax was 0.93 °C/decade, while the average trend of Tmin was 0.13 °C/decade. In spring, the increase of Tmax was higher than that of Tmin.
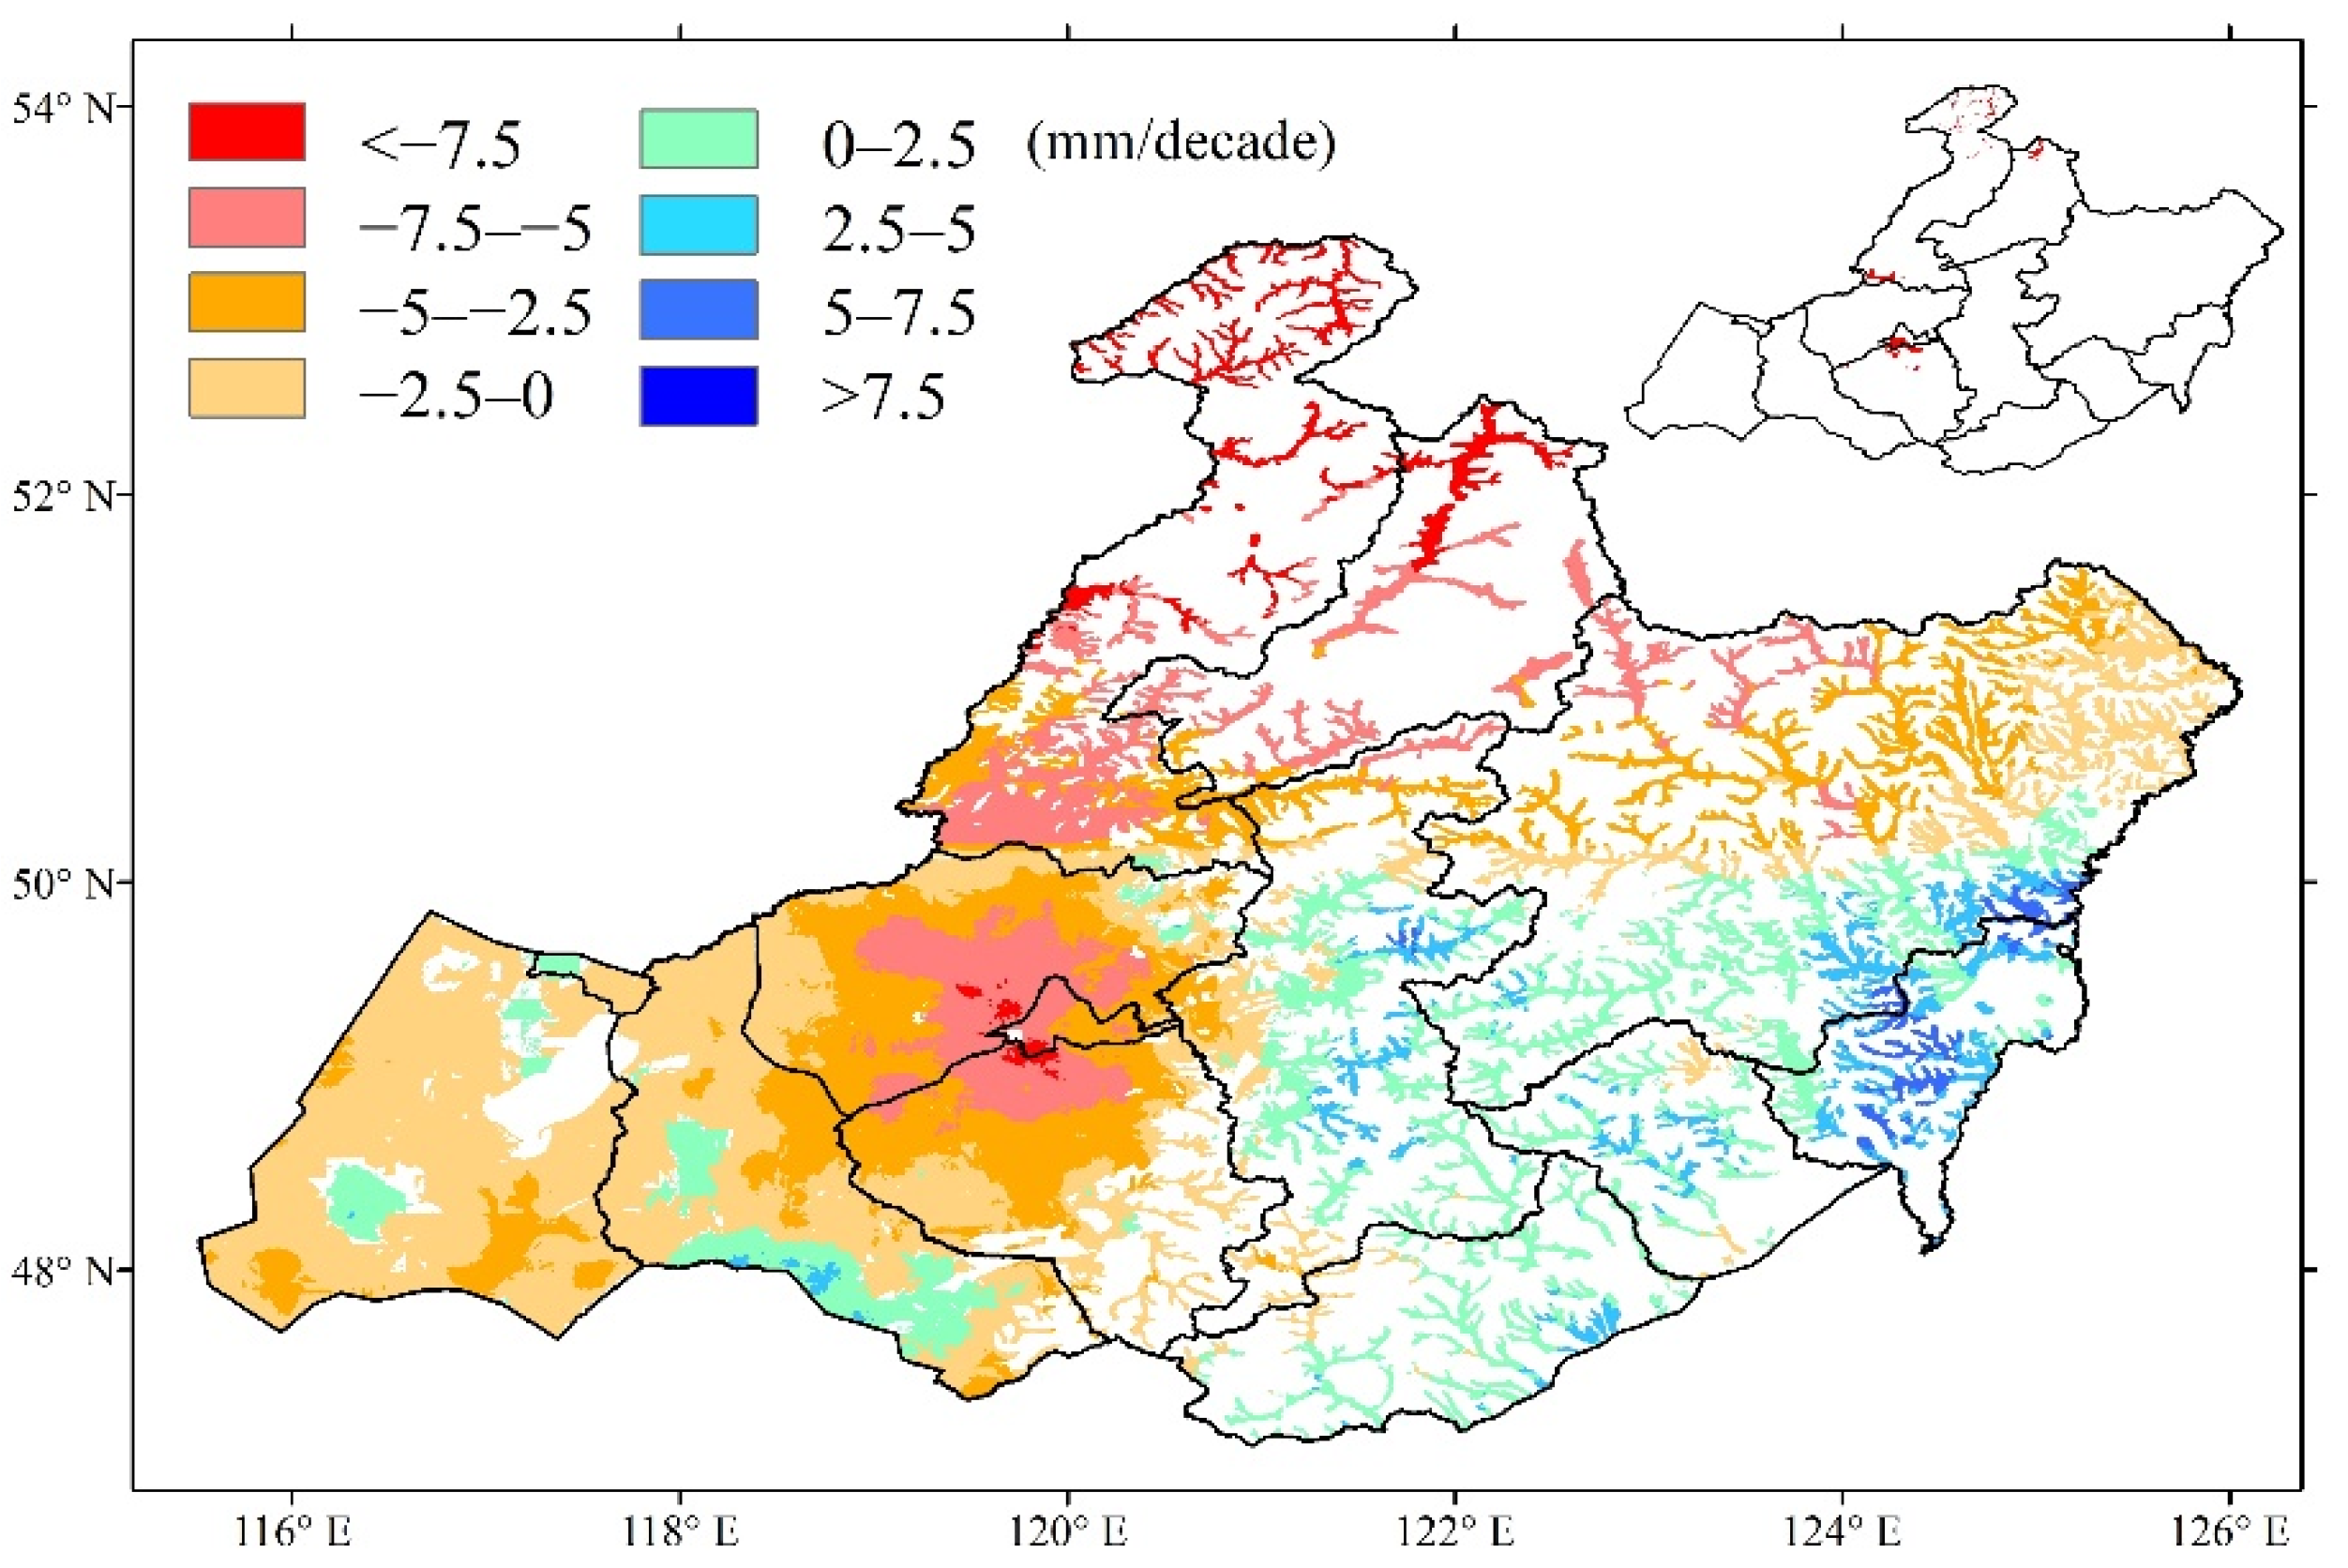
The winter precipitation variation trend is shown in Figure 7. From the perspective of the whole Hulun Buir grassland, there are many regions with small fluctuations in winter precipitation, with an average variation trend of −1.9 mm/decade, and 2.6% pixels with a significant variation trend. Increasing trends accounted for 21.9% of the whole region, but no area with a significant variation trend.
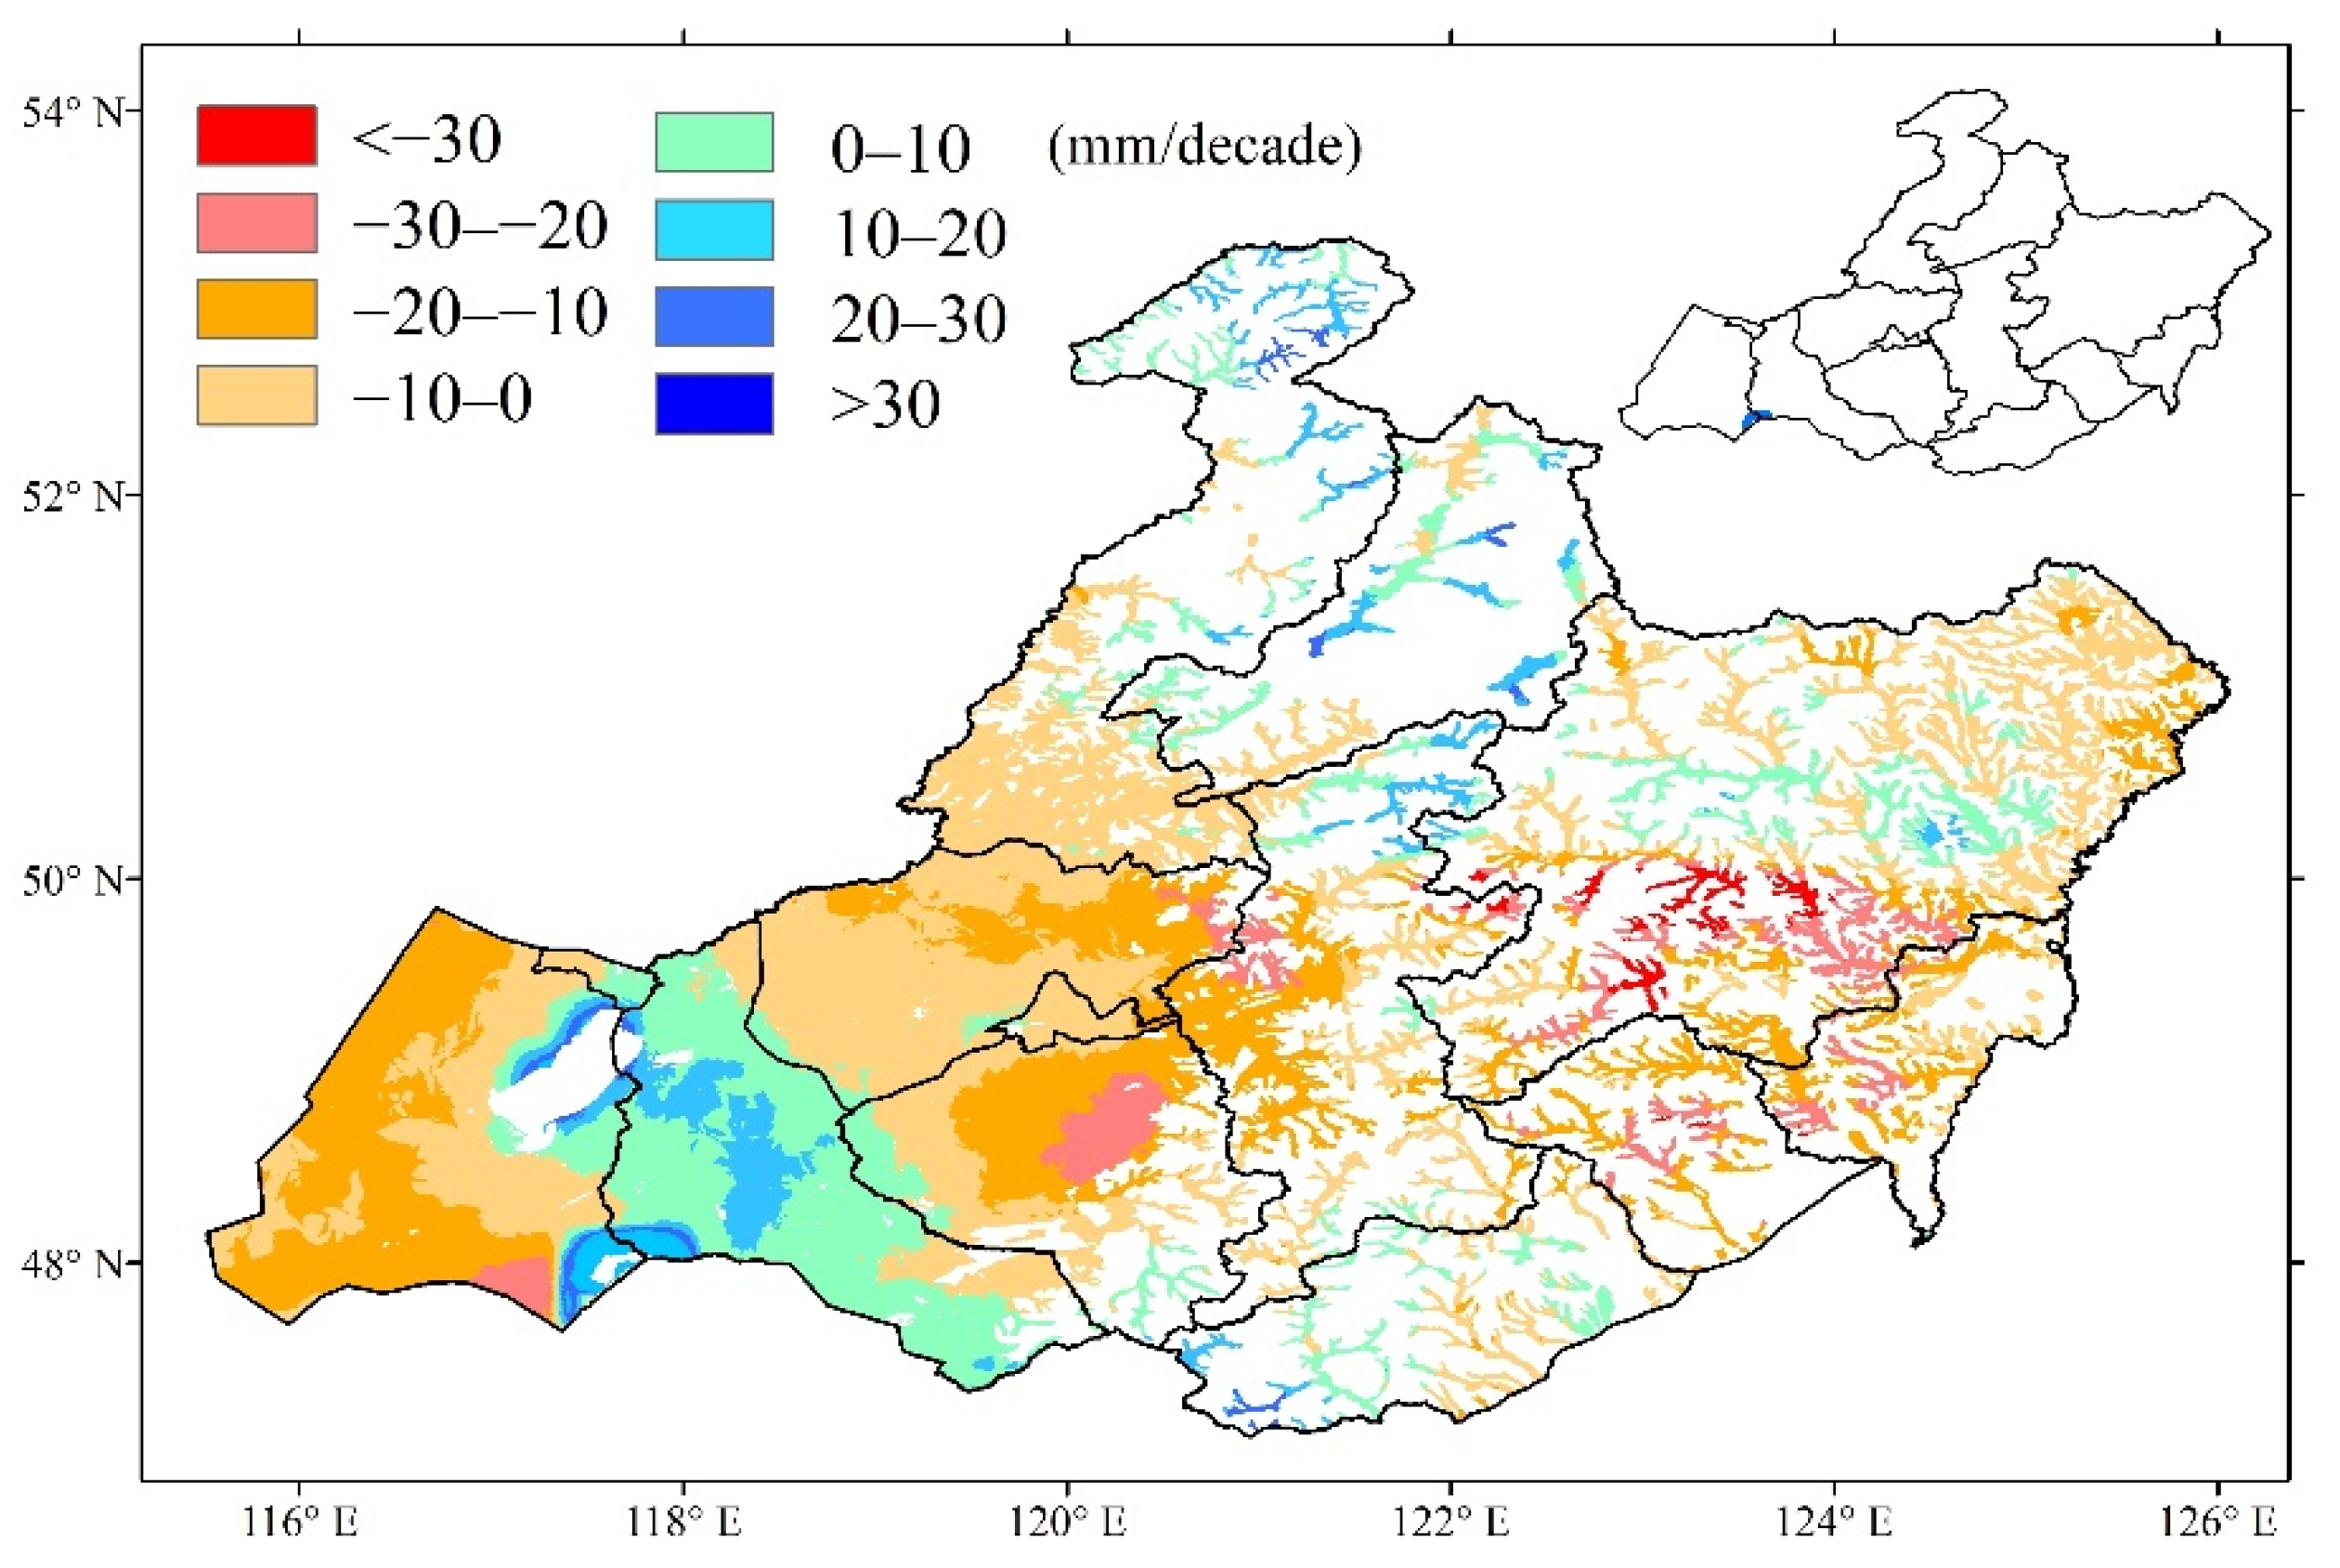
The spring precipitation variation trend is shown in Figure 8. From the perspective of the whole study area, there were many regions with small fluctuations in spring precipitation, with an average trend of −4.8 mm/decade, but only 0.5% pixels with a significant increase (p < 0.05). The increasing trend accounts for 26.3% area, and 61.5% have a trend in spring precipitation of ±10 mm/decade, which has a small fluctuation range.

3.3. Partial Correlation Analysis between Green-Up Date and Meteorological Indicators

3.3.1. Partial Correlation Analysis in Winter

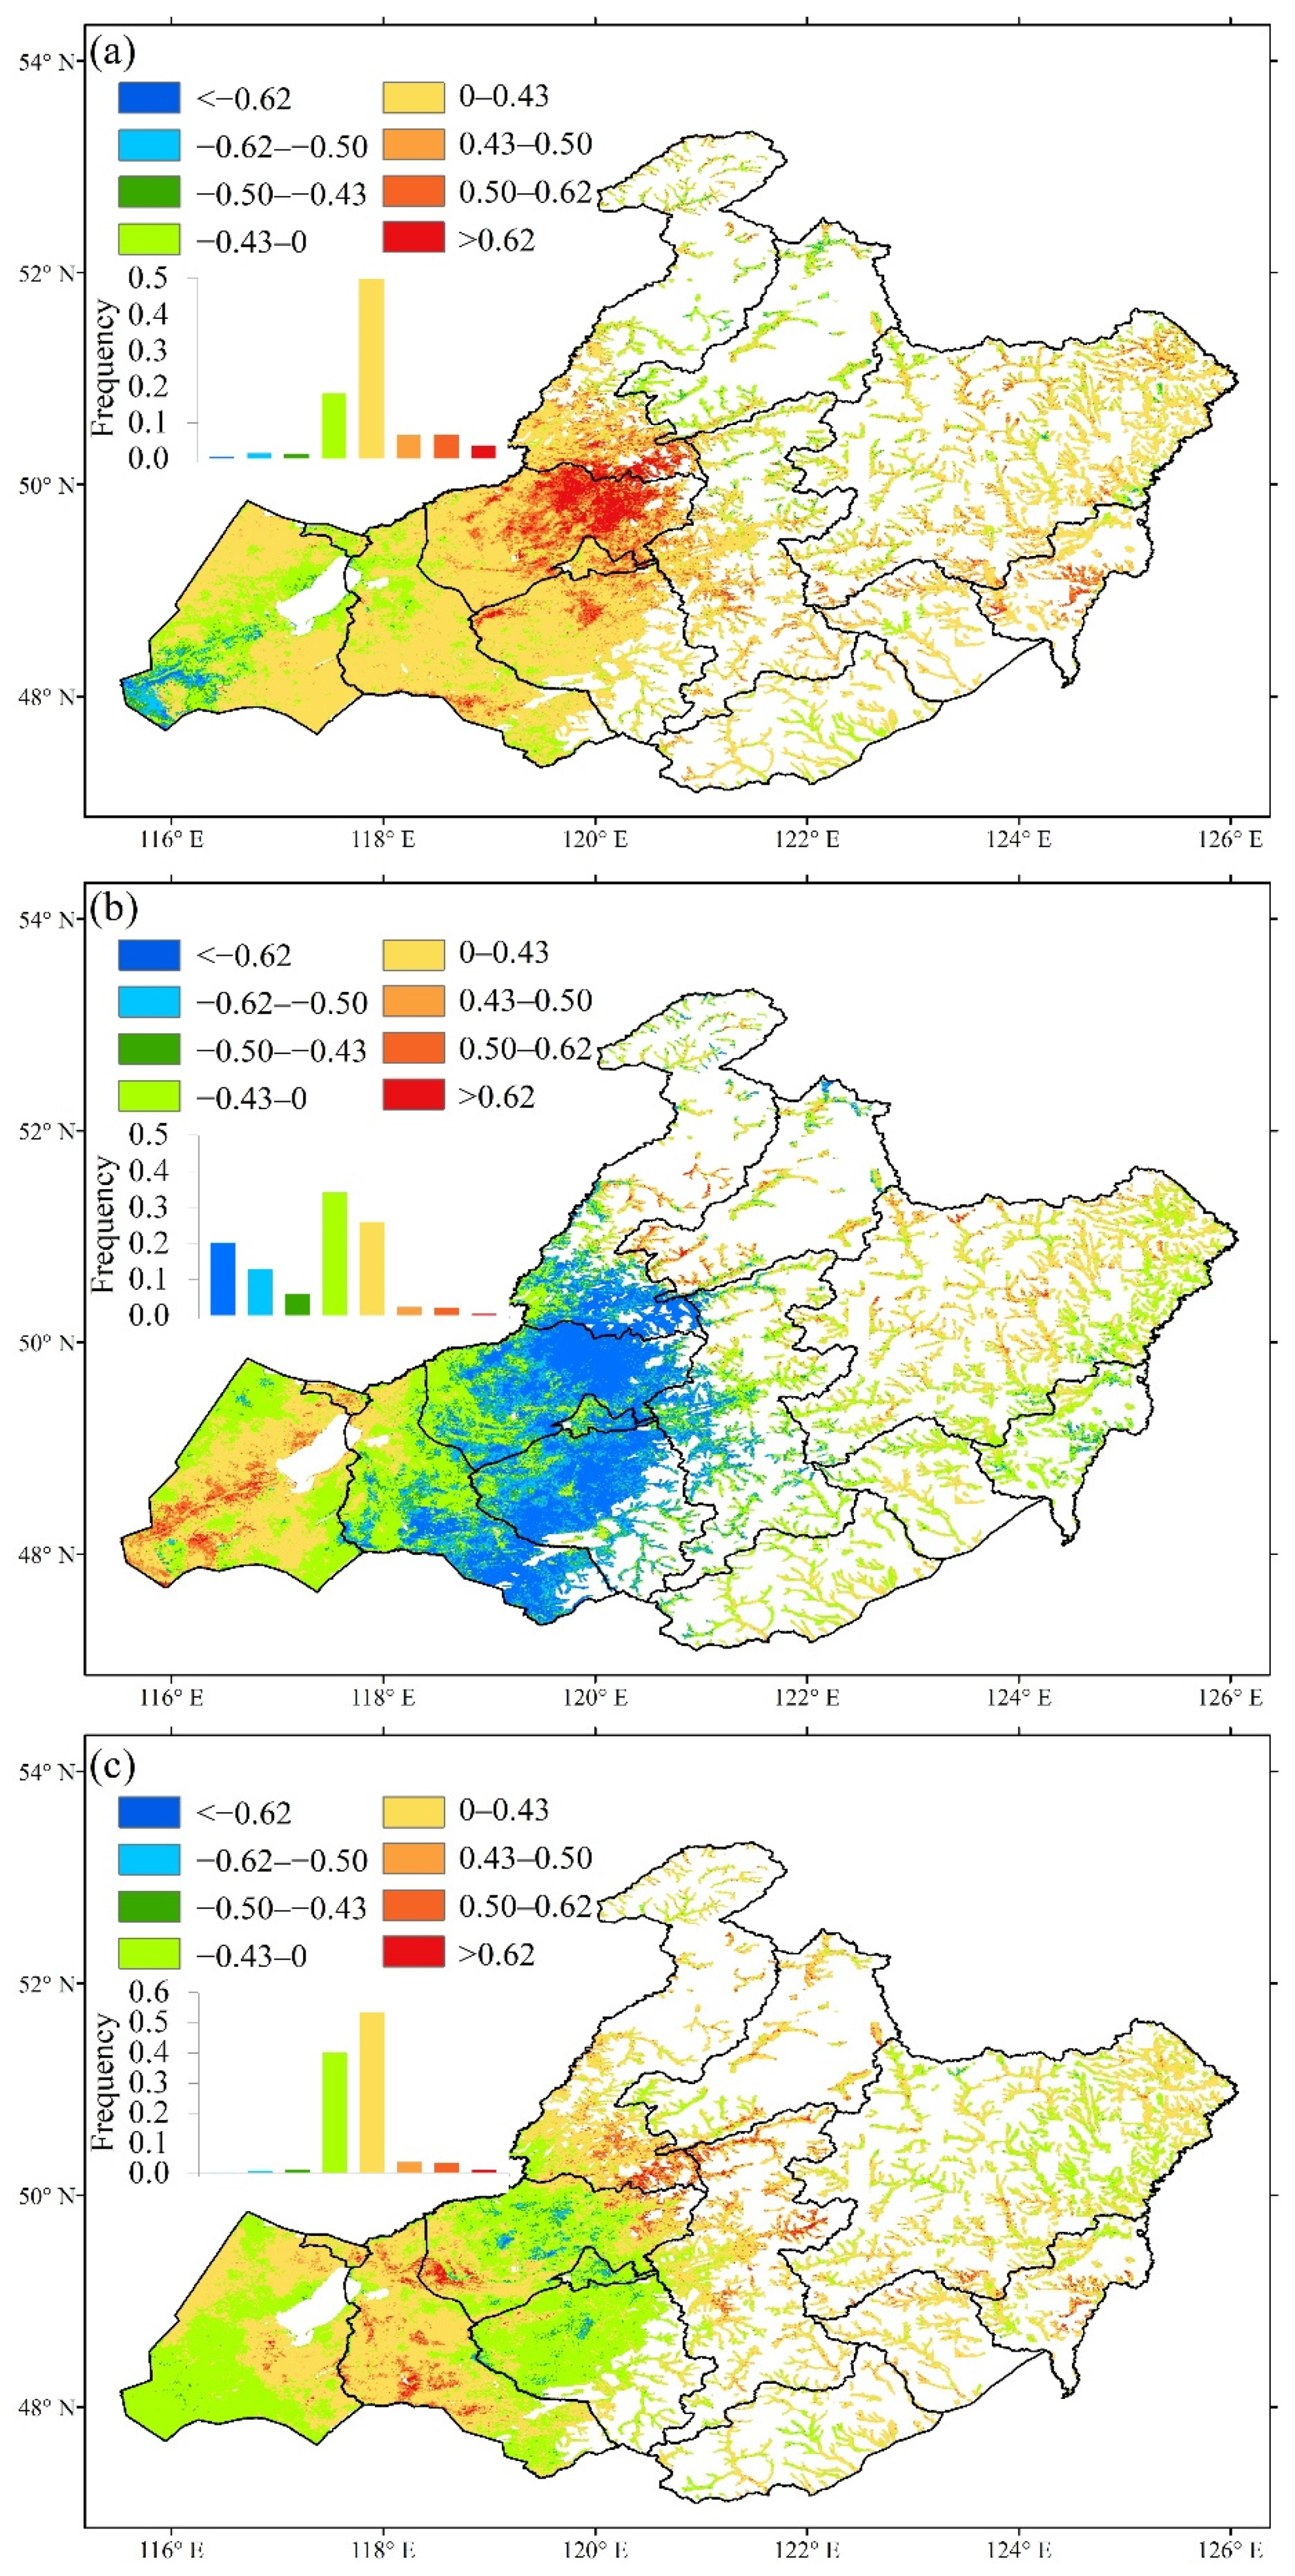
Partial correlation analysis was conducted for vegetation GUD to Tmax, Tmin, and precipitation in winter (Table 1). Across the entire region, 63.2% of pixels showed a negative partial correlation between GUD and Tmax in winter (Figure 9a), of which 13.7% of the pixel partial correlation coefficients were less than −0.50 (0.50 corresponds to p = 0.05). Furthermore, only 3.3% of the pixel partial correlation coefficients were greater than 0.50. In total, 57.6% of pixels showed a positive partial correlation between GUD and Tmin in winter (Figure 9b), of which 7.2% of the pixel partial correlation coefficients were greater than 0.50. Only 1.6% of the pixel partial correlation coefficients were greater than 0.62. Compared with Tmax and Tmin, precipitation had less influence on GUD (Figure 9c). A total of 4.1% of the pixel partial correlation coefficients were greater than 0.50.
In TMS, UM, and LM, Tmax in winter was negatively correlated with GUD, and the significant correlation pixels proportions were 33.9%, 46.6%, and 13.3%, respectively. Tmin in winter was positively correlated with GUD, and the significant correlation pixels proportions were 13.8%, 19.2%, and 9.2%, respectively. In TS there was little correlation between temperature/precipitation and GUD.

3.3.2. Partial Correlation Analysis in Spring

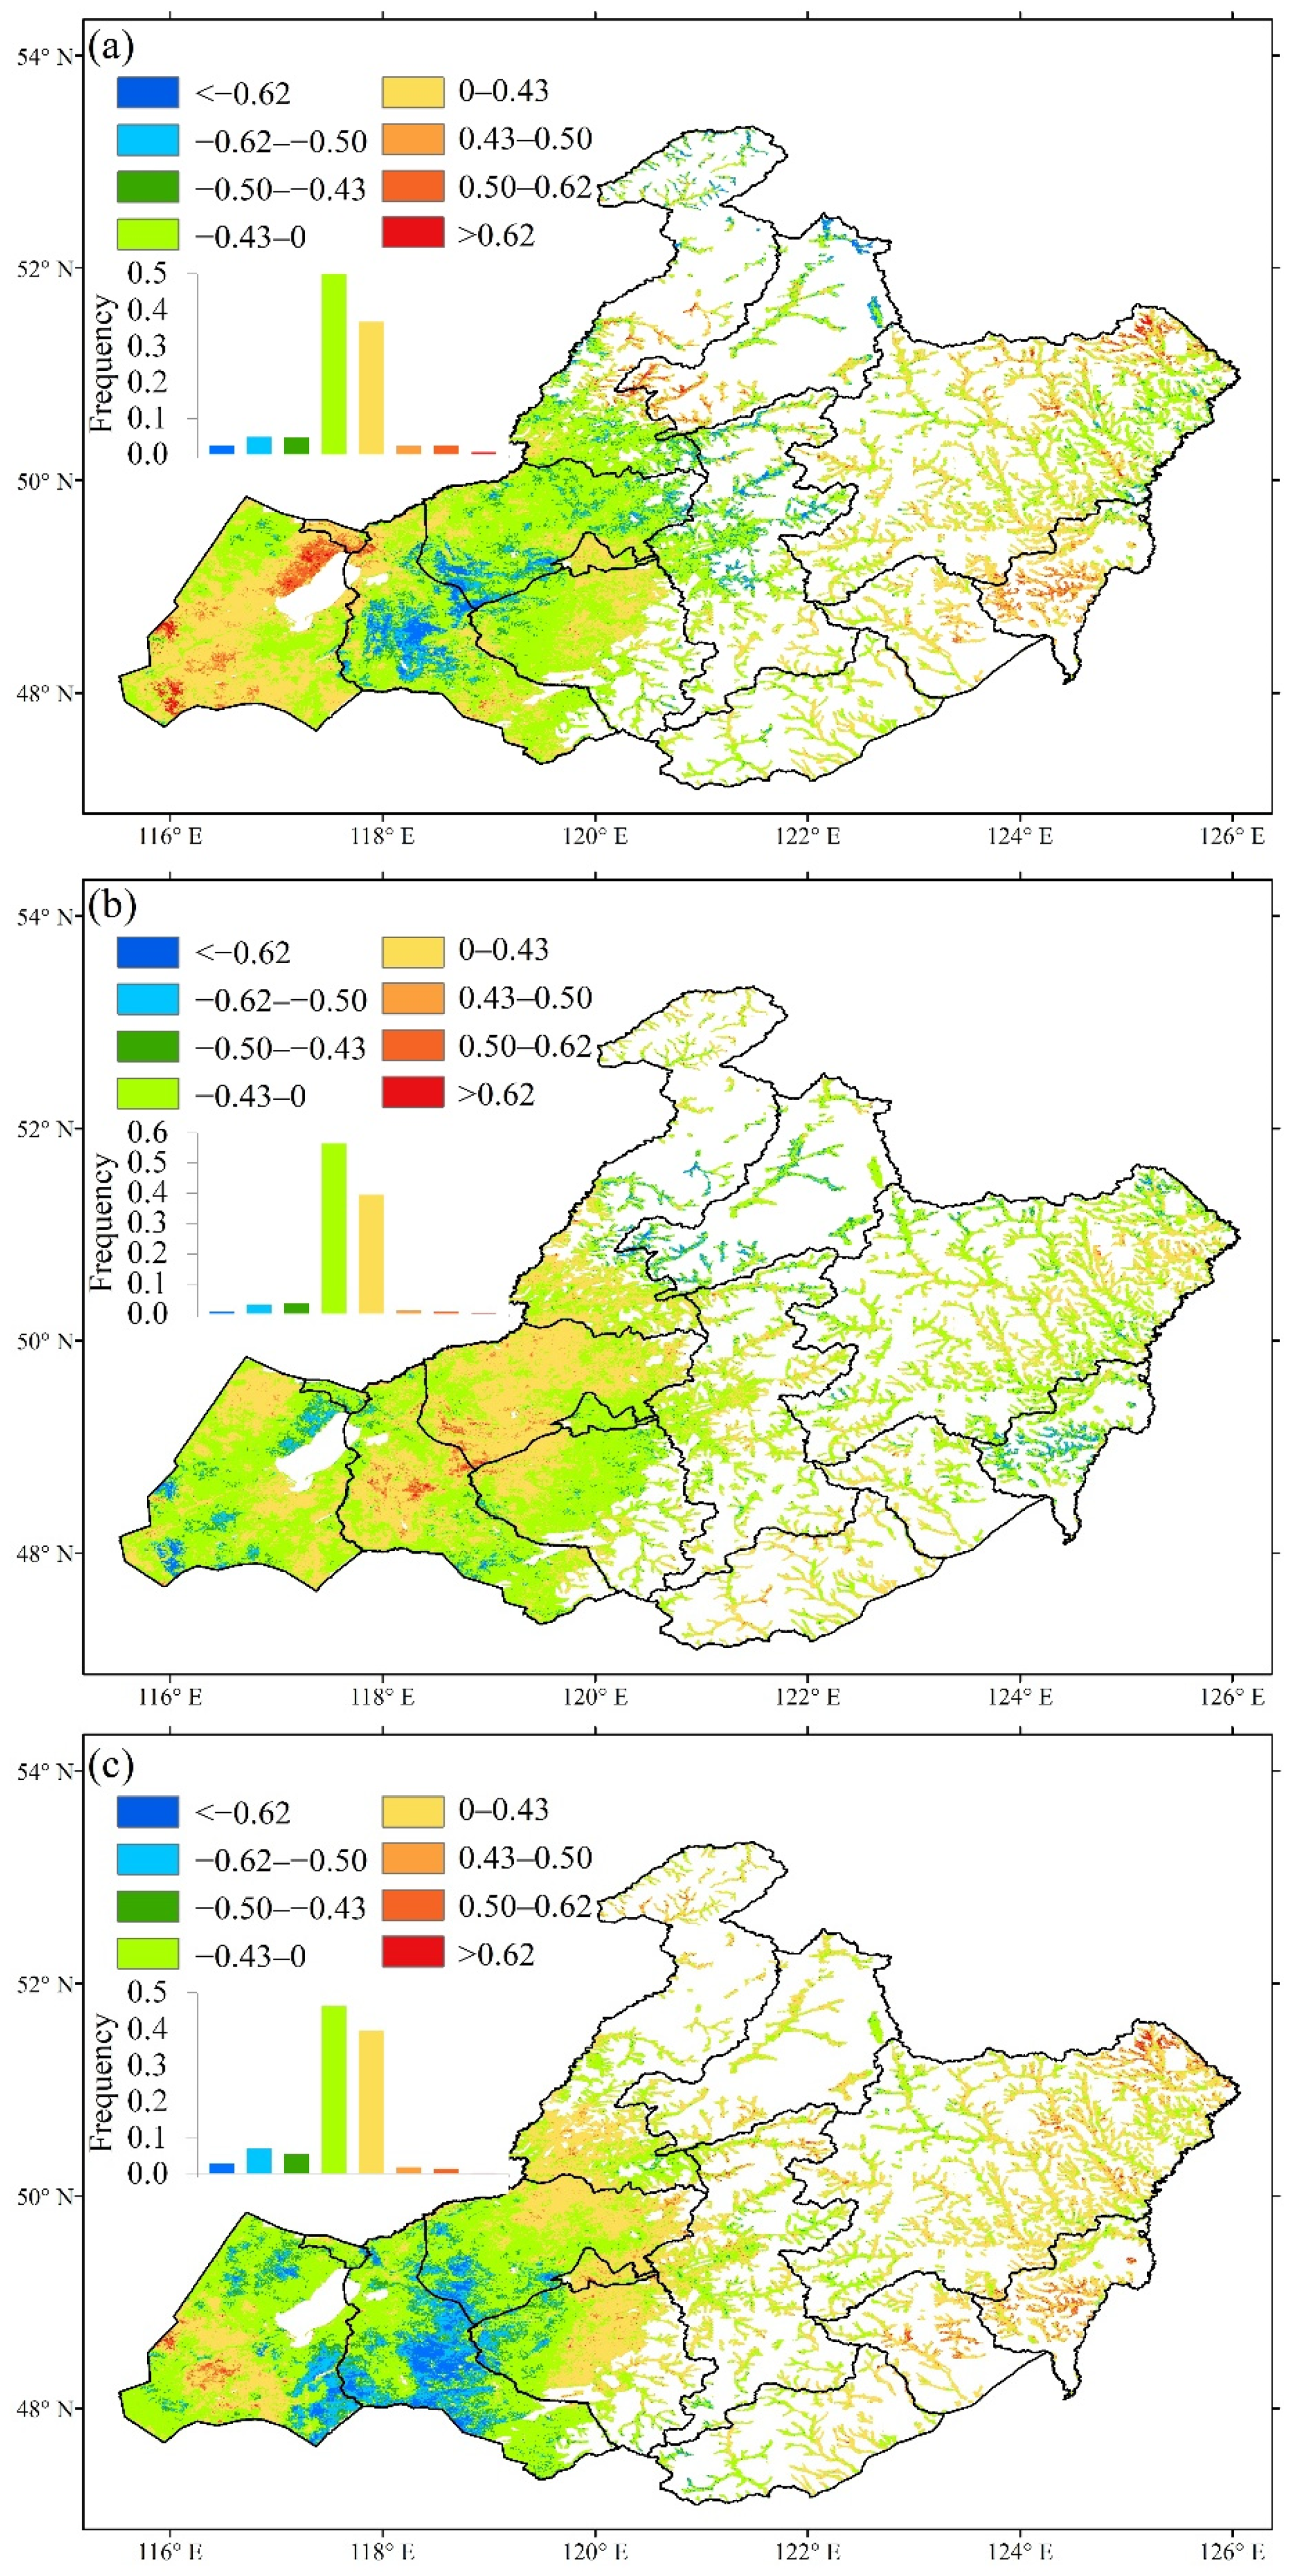
Partial correlation analysis was conducted for vegetation GUD to Tmax, Tmin, and precipitation in spring (Table 2). Across the entire region, 61.3% of pixels showed a negative partial correlation between GUD and Tmax in spring (Figure 10a), of which 7.5% of the pixel partial correlation coefficients were less than −0.50. Only 3.1% of the pixel partial correlation coefficients were greater than 0.50; 57.0% of pixels showed a negative partial correlation between GUD and Tmin in spring (Figure 10b), of which 4.2% of the pixel partial correlation coefficients were less than −0.50. Only 2.1% of the pixel partial correlation coefficients were greater than 0.50; 59.0% of pixels showed a negative partial correlation between GUD and precipitation in spring (Figure 10c), of which 8.3% of the pixel partial correlation coefficients were less than −0.50.
In TS, 18.3% of pixels showed a negative partial correlation between GUD and precipitation in spring. GUD in TS was mainly influenced by precipitation in spring. In TMS, UM, and LM, Tmax had a greater influence on GUD than Tmin and precipitation, and the pixels proportions of GUD and Tmax were 14%, 26.2%, and 9.6%, respectively.
Since the GUD happens in the spring, we suggest 1 month (March, April, or May) in spring is needed for a more fine-scale analysis.

3.3.3. Partial Correlation Analysis in March

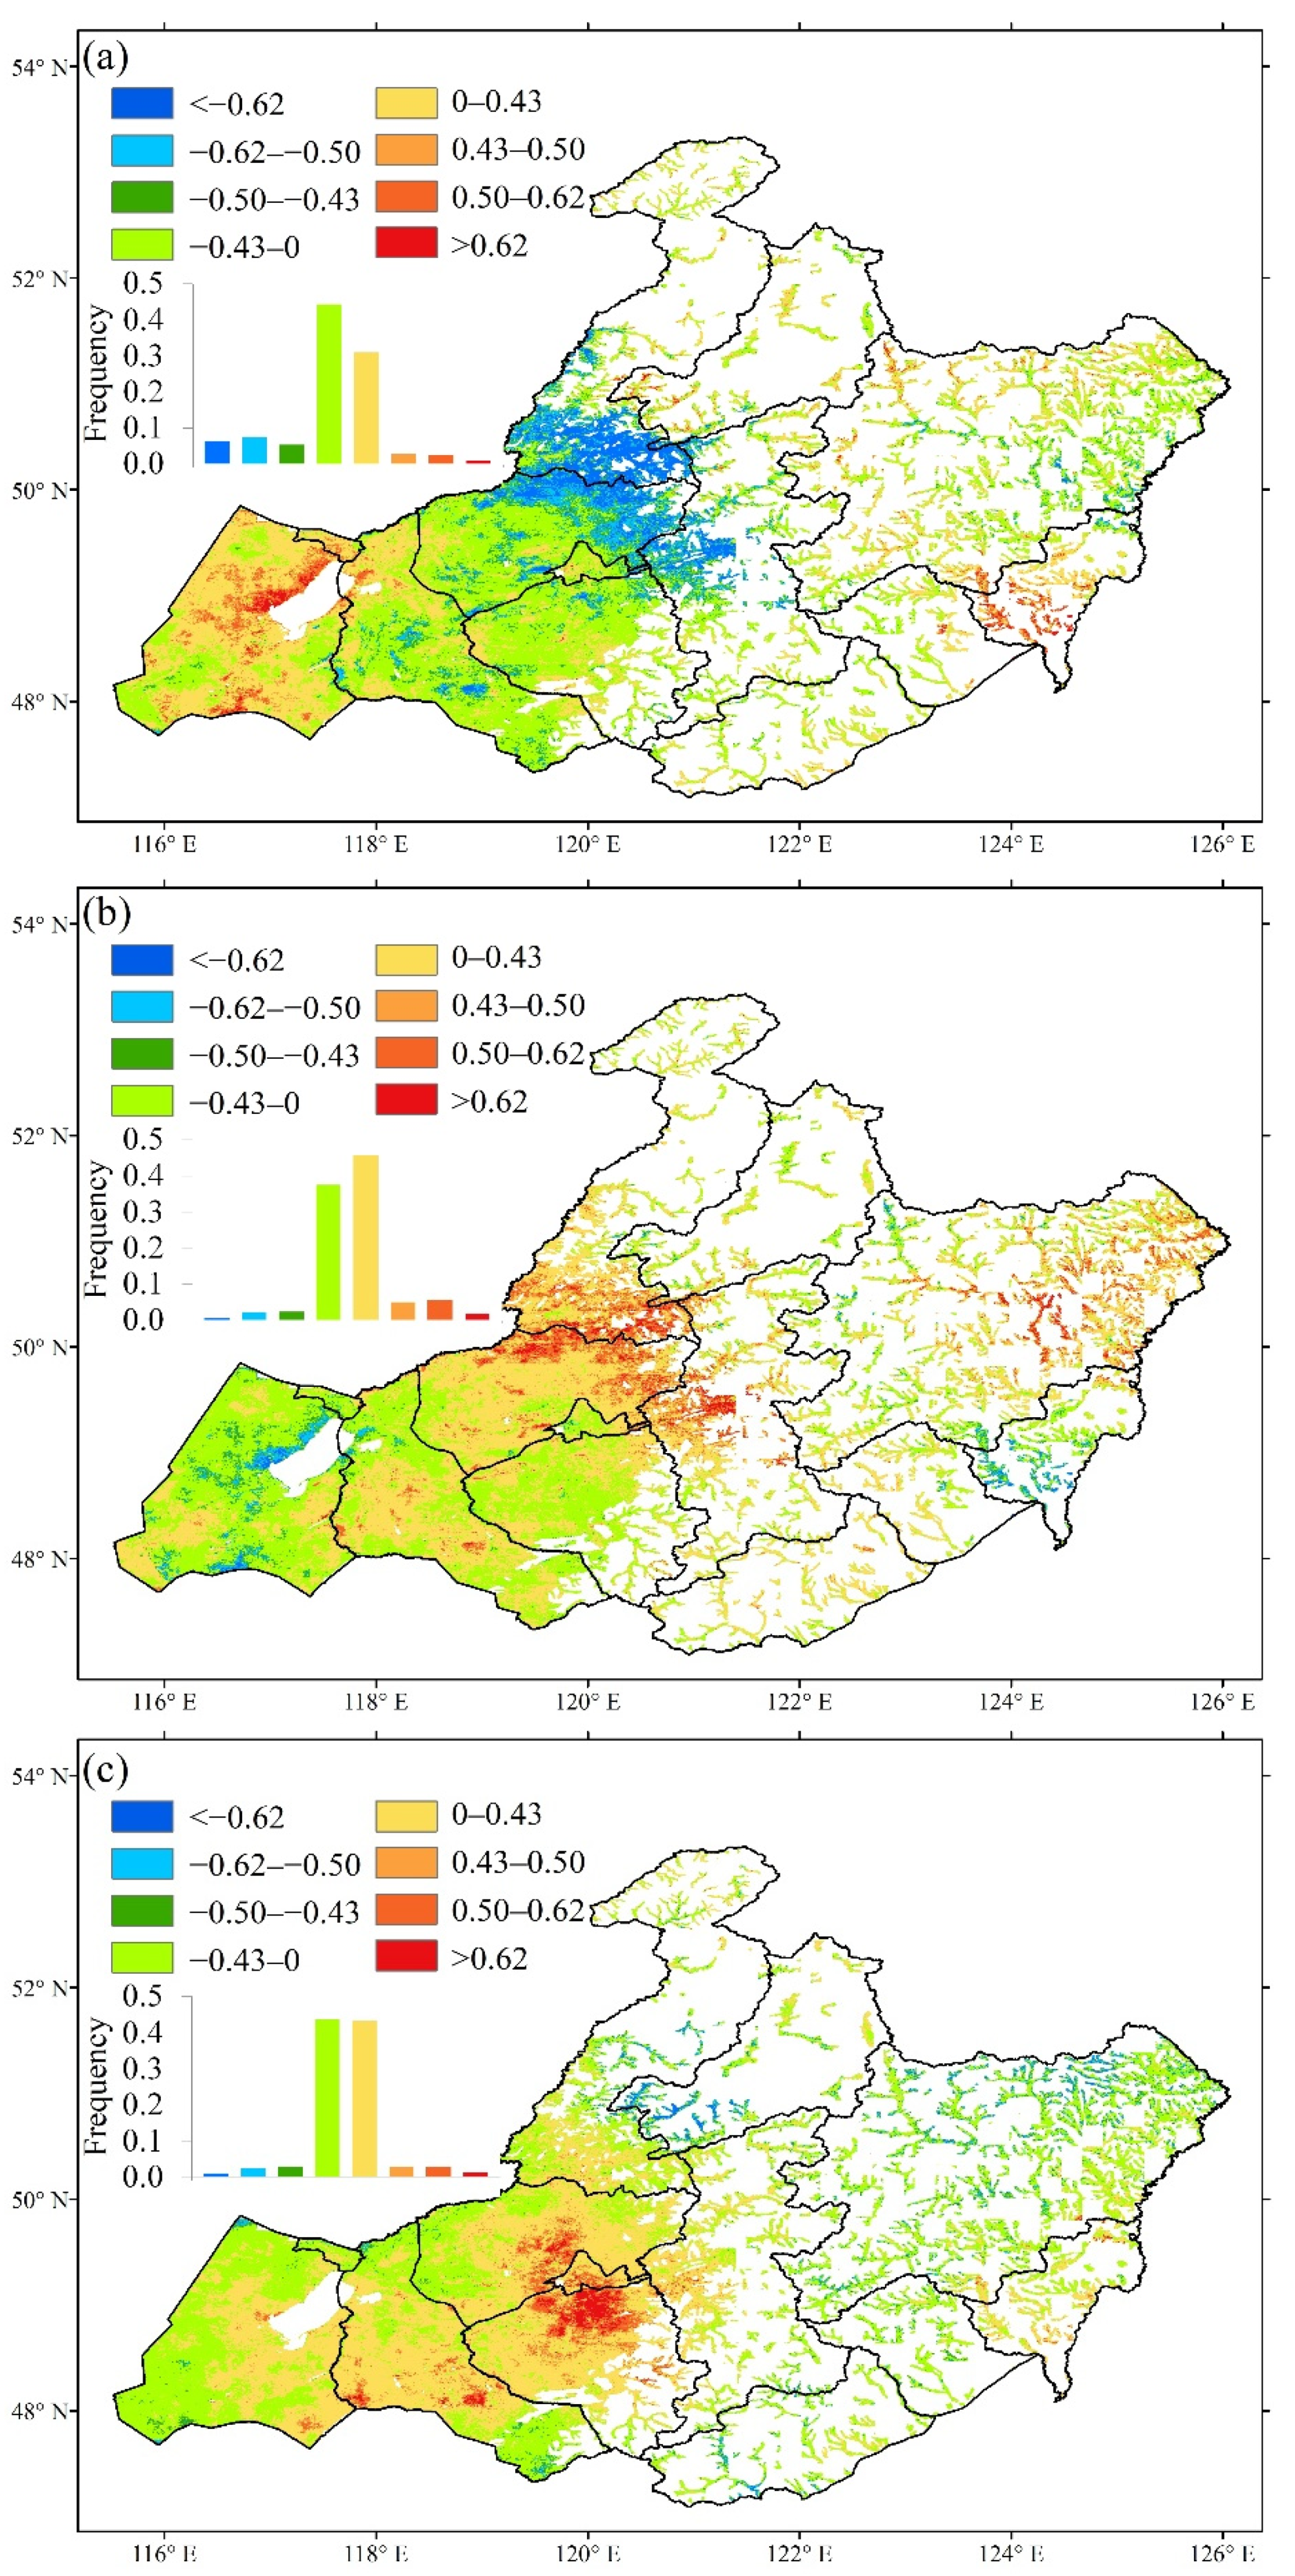
Partial correlation analysis was conducted for vegetation GUD to Tmax, Tmin, and precipitation in May (Table 3). Across the entire region, 79.3% of pixels showed a positive partial correlation between GUD and Tmax in March (Figure 11a), of which 10.0% of the pixel partial correlation coefficients were greater than 0.50. Only 1.9% of the pixel partial correlation coefficients were less than −0.50. A total of 70.3% of pixels showed a negative partial correlation between GUD and Tmin in March (Figure 11b), of which 31.9% of the pixel partial correlation coefficients were less than −0.50, and 2.5% of the pixel partial correlation coefficients were greater than 0.50. The pixels (59.3%) showed a positive partial correlation between GUD and precipitation in spring (Figure 11c), of which 4.4% of the pixel partial correlation coefficients were greater than 0.50 and 0.9% of the pixel partial correlation coefficients were less than −0.50. Increasing Tmin in March can make vegetation greening faster, which was distributed in the central and Midwest region.
In TMS and UM, Tmax had a greater influence on GUD than that in TS and LM. The significant positive pixels proportion of GUD and Tmax were 25.3% and 26.2% in TMS and UM. In TS, TMS, UM, and LM, Tmin had a great influence on GUD, with significant positive pixels proportions of 27.3%, 73.95, 65.9%, and 22.1%, respectively. Precipitation had influence only in UM, with a significant positive pixels proportion of 9.1%.

3.3.4. Partial Correlation Analysis in April

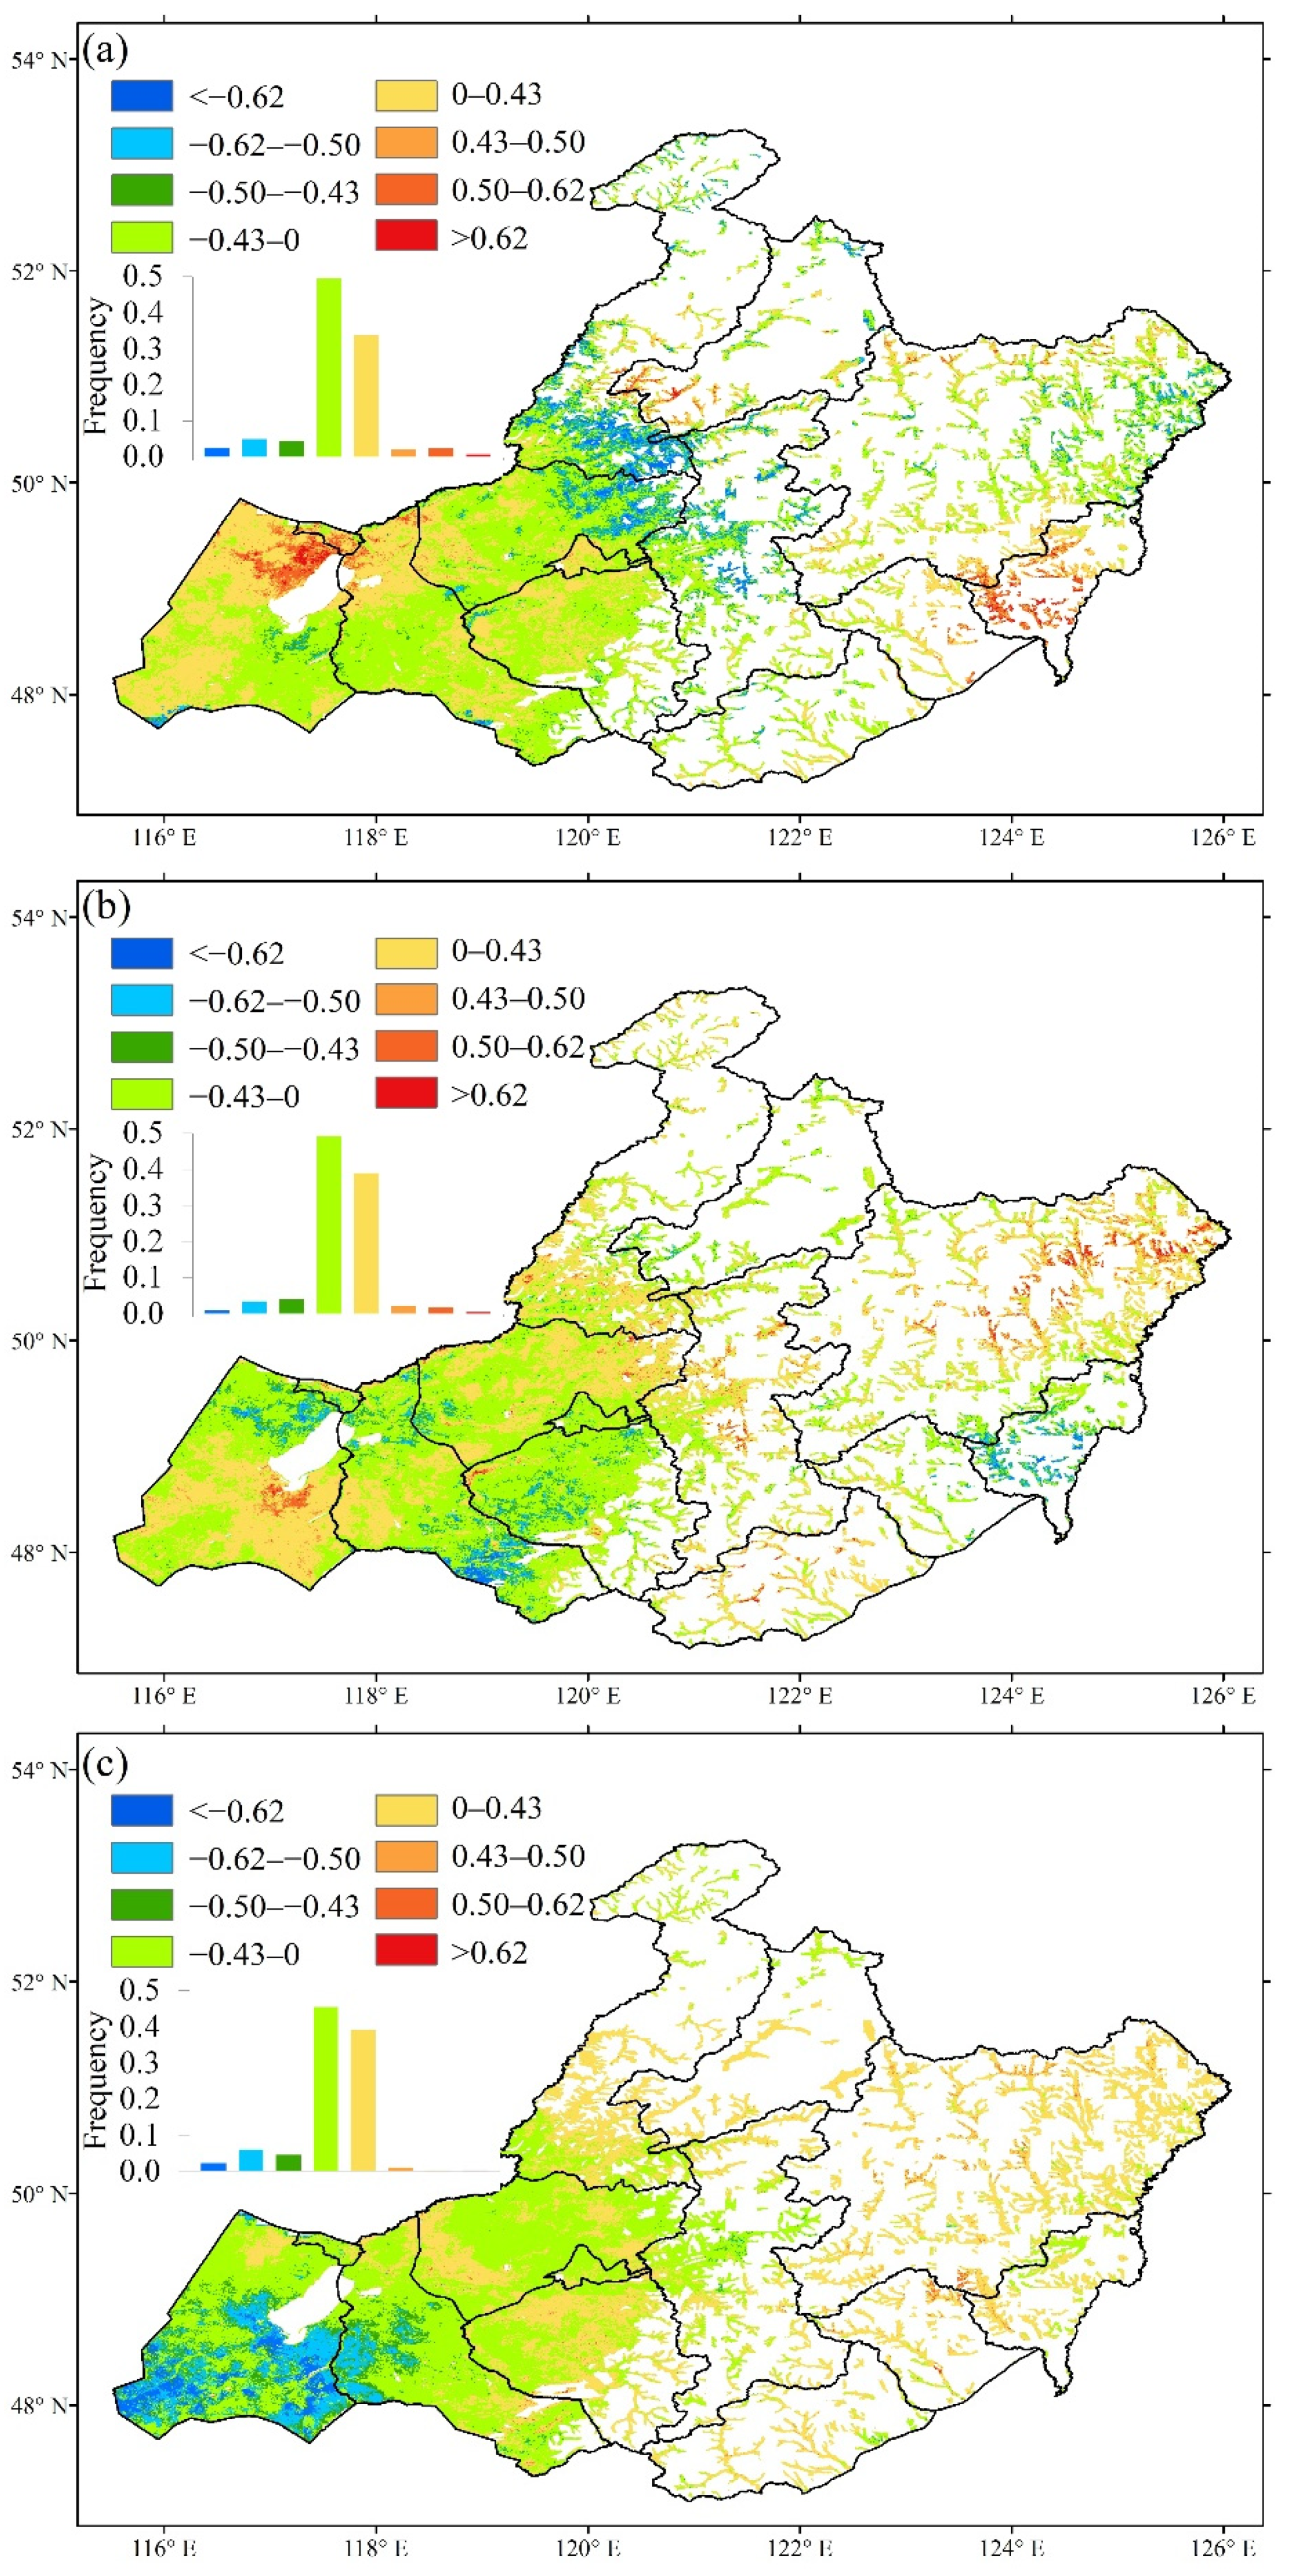
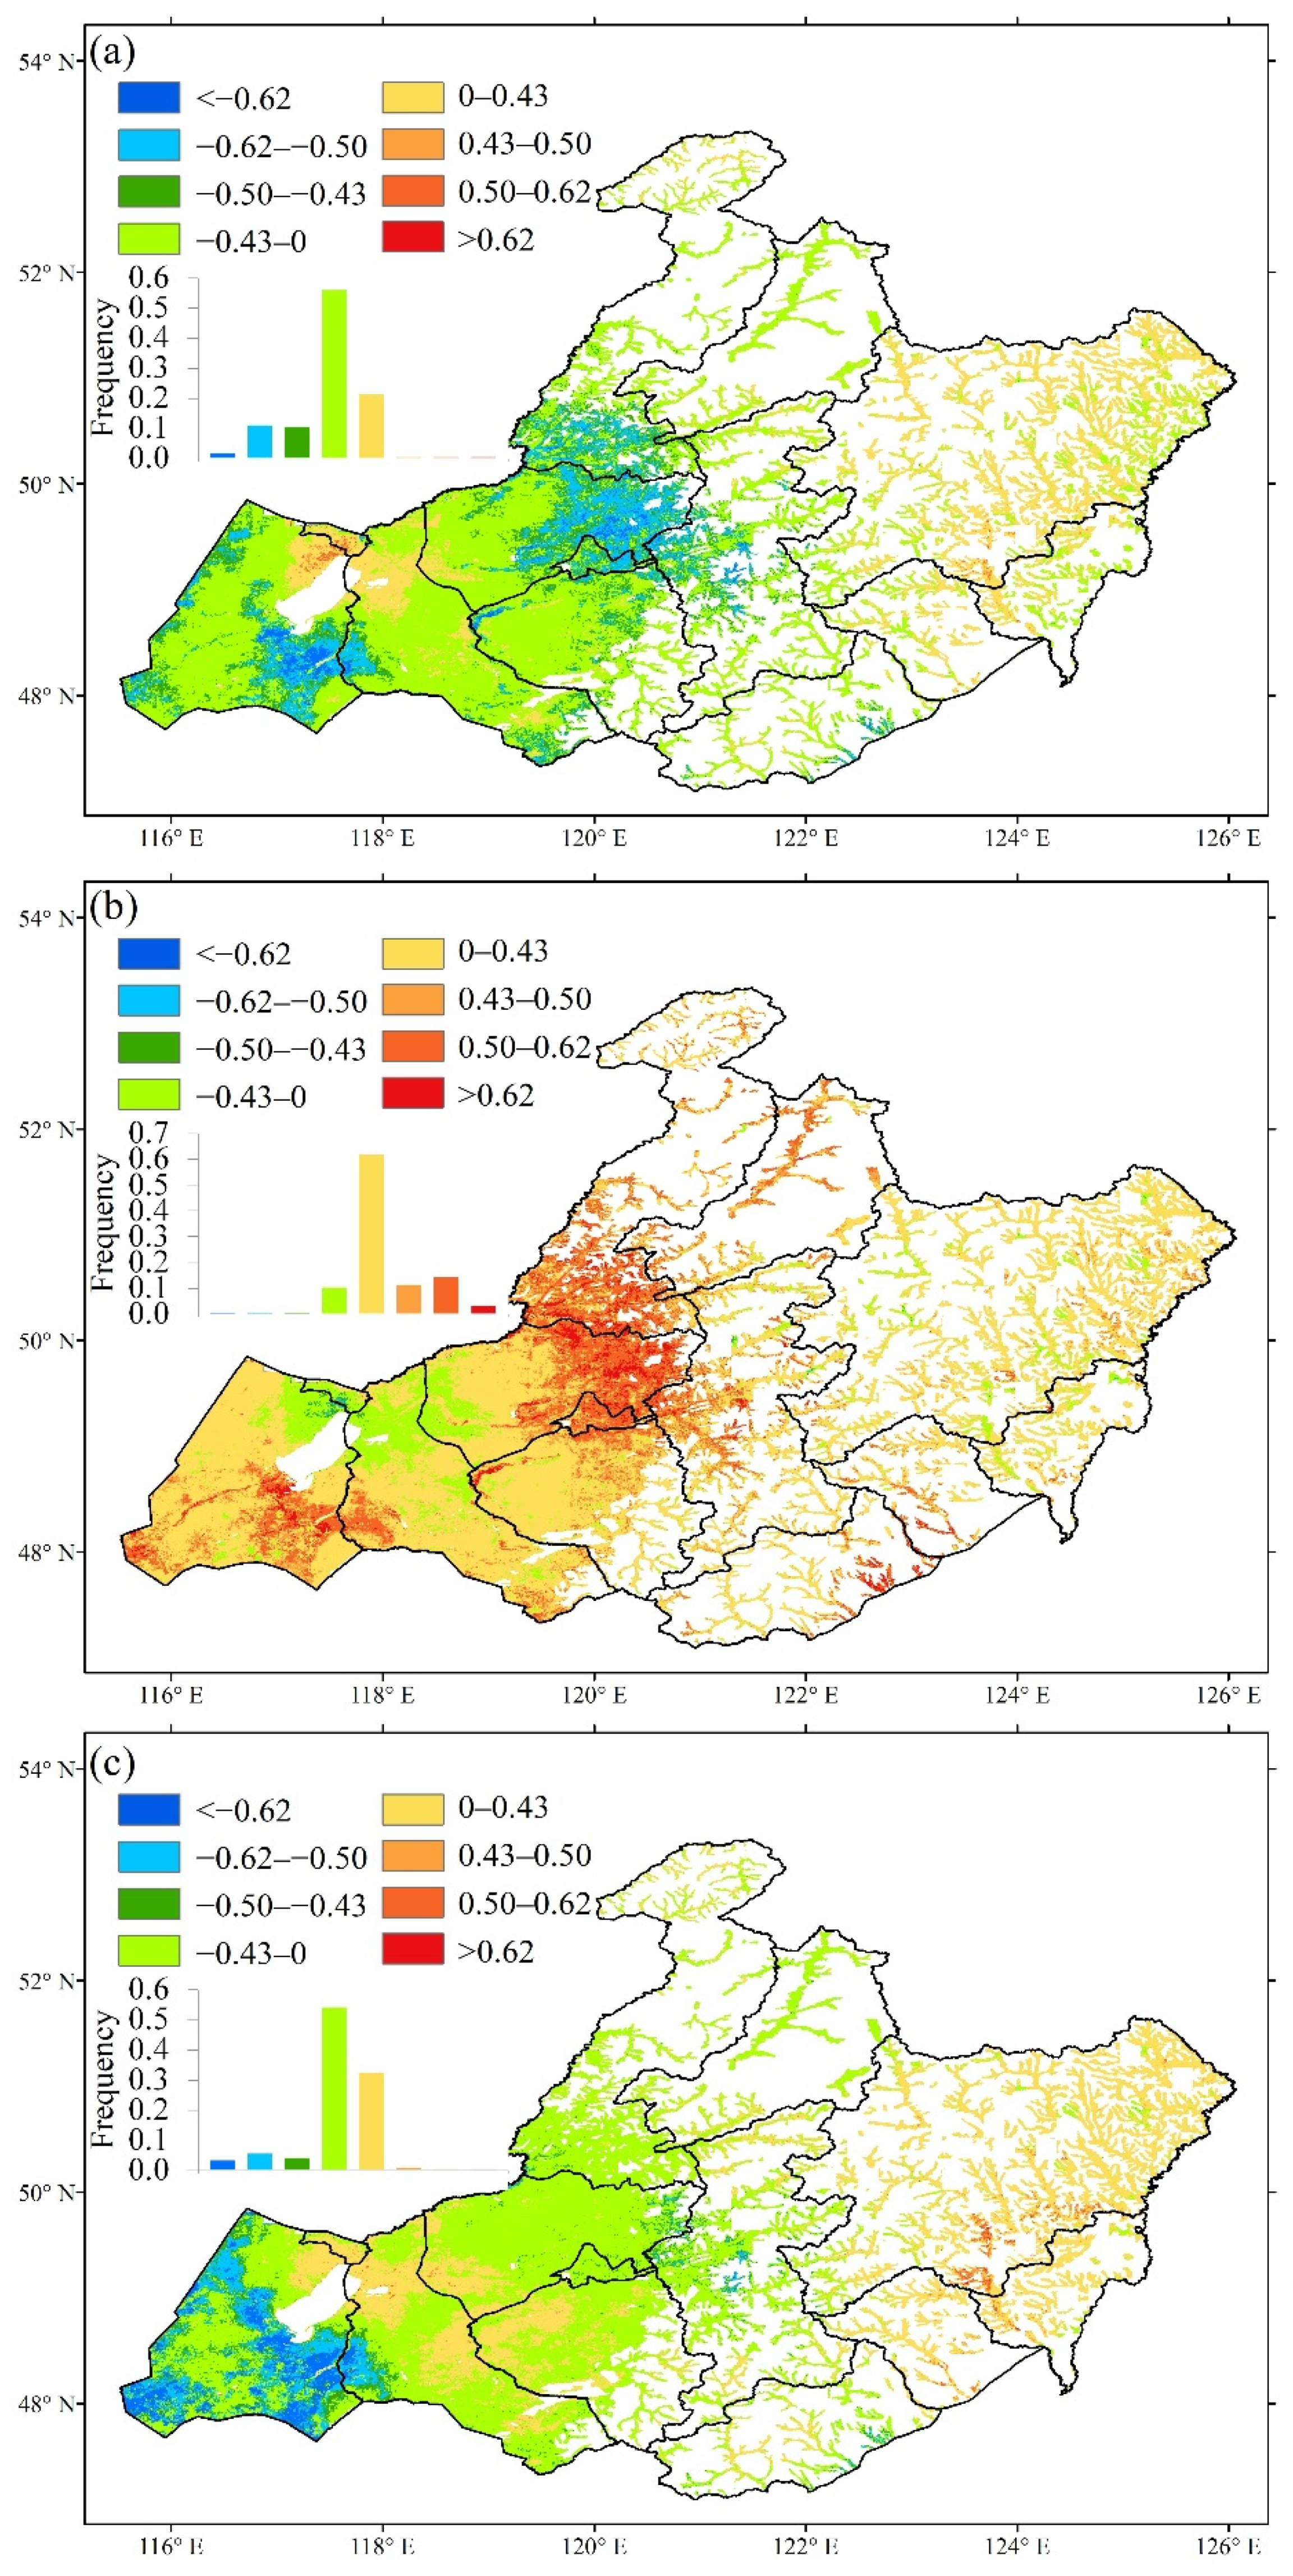
Partial correlation analysis was conducted for vegetation GUD to Tmax, Tmin, and precipitation in April (Table 4). There was mainly a negative correlation between GUD and the meteorological indicators in April. Across the entire region, 59.8% of pixels showed a negative partial correlation between GUD and Tmax in April (Figure 12a), of which 7.2% of the pixels partial correlation coefficients were less than −0.50. A total of 3.0% of the pixels partial correlation coefficients were greater than 0.50. The pixels (60.7%) showed a negative partial correlation between GUD and Tmin in April (Figure 12b), of which 3.6% of the pixel partial correlation coefficients were less than −0.50, and less than 1% of the pixel partial correlation coefficients were greater than 0.50. The pixels (58.6%) showed a negative partial correlation between GUD and precipitation in April (Figure 12c), of which 9.4% of the pixel partial correlation coefficients were less than −0.50 and less than 1% of the pixel partial correlation coefficients were greater than 0.50.
In TS, Tmax and precipitation in April were negatively correlated with GUD, and the significant correlation area was 9.1% and 21.7%, respectively. In TMS, there was little correlation between the meteorological indicators and GUD in April. For UM and LM, Tmax in April were negatively correlated with GUD, and the significant correlation area was 11.7% and 6.5%. Precipitation had a greater influence on TS than that on TMS, UM, and LM. Vegetation in New Barag Right Banner and New Barag Left Banner, which are in semi-arid areas, mostly green-up in April. Precipitation in April can significantly advance GUD.

3.3.5. Partial Correlation Analysis in May

Partial correlation analysis was conducted for vegetation GUD to Tmax, Tmin, and precipitation in May (Table 5). Across the entire region, 78.5% of pixels showed a negative partial correlation between GUD and Tmax in May (Figure 13a), of which 12.3% of the pixel partial correlation coefficients were less than −0.50. Less than 1.0% of the pixel partial correlation coefficients were greater than 0.50. The pixels (89.8%) showed a positive partial correlation between GUD and Tmin in May (Figure 13b), of which 17.1% of the pixel partial correlation coefficients were greater than 0.50 and less than 1% of the pixel partial correlation coefficients were less than −0.50. The pixels (66.5%) showed a negative partial correlation between GUD and precipitation in May (Figure 13c), of which 8.6% of the pixel partial correlation coefficients were less than −0.50 and 0.4% of the pixel partial correlation coefficients were greater than 0.50.
In TMS, UM, and LM, Tmax and Tmin had the opposite effect to GUD. The pixels proportion of the partial correlation between GUD and Tmin was slightly more than that between GUD and Tmax. The increased Tmin can delay vegetation GUD in all types while the increased Tmax can advance vegetation GUD. Precipitation had an influence on GUD only in TS, and the significant negative correlation pixels proportion was 19.4%.

3.4. Sensitivity Analysis of Green-Up Date to Meteorological Indicators

We calculated the average sensitivity of the significant positive and significant negative correlations between the GUD and meteorological indicators. We only pay attention to the areas where the proportion of significant partial pixels is more than 5% for sensitivity average calculation, which is marked in bold font in the tables.

3.4.1. Sensitivity Analysis of TS

Sensitivity analysis was conducted for vegetation GUD of TS to Tmax, Tmin, and precipitation in winter and spring (Table 6). In the TS region, Tmax, Tmin, and precipitation in winter have little influence on GUD, while Tmin and precipitation in spring have great influence. In spring, the sensitivity of GUD to Tmin was −0.06 days/°C (GUD advanced 0.06 days when temperature increase 1 °C), and the sensitivity of GUD to precipitation was −0.41 days/mm (GUD advanced 0.41 days when precipitation increase 1 mm), mainly distributed across the area with the highest temperature and lowest precipitation. The GUD of this area was the earliest GUD in the study area.
Sensitivity analysis was conducted for vegetation GUD of TS to Tmax, Tmin, and precipitation in March, April, and May (Table 7). In the TS region, Tmin in March had the greatest influence on GUD. The sensitivity of GUD to Tmin in March was −0.17 days/°C while this temperature sensitivity was also largest. Precipitation in both April and May had a great influence on GUD. The sensitivity of GUD to precipitation in April was −0.32 days/mm, which is greater than the sensitivity in May.

3.4.2. Sensitivity Analysis of TMS

Sensitivity analysis was conducted for vegetation GUD of TMS to Tmax, Tmin, and precipitation in winter and spring (Table 8). Whether in winter or in spring, Tmax have great influence in the northern TMS region, and the sensitivity of GUD to Tmax was −0.11 days/°C and −0.12 days/°C, respectively. Compared with the Tmax, Tmin has less influence and the sensitivity of GUD to Tmin was far less than the sensitivity of GUD to Tmax. Precipitation in winter and spring have little influence on GUD.
Sensitivity analysis was conducted for vegetation GUD of TMS to Tmax, Tmin, and precipitation in March, April, and May (Table 9). In the TMS region, except in April, Tmax or Tmin in March and May had influence on GUD. Tmin in March had greatest influence on GUD. The sensitivity of GUD to Tmin in March was −0.15 days/°C while this temperature sensitivity was also the largest. The sensitivity of GUD to Tmin in May was 0.03 days/°C (GUD delayed 0.03 days when temperature increase 1 °C), which had the opposite impact on GUD. Precipitation had little influence on GUD.

3.4.3. Sensitivity Analysis of UM

Sensitivity analysis was conducted for vegetation GUD of UM to Tmax, Tmin, and precipitation in winter and spring (Table 10). Similar to TMS, whether in winter or in spring, Tmax have great influence in UM region, and the sensitivity of GUD to Tmax was −0.10 days/°C and −0.14 days/°C, respectively. Compared with the Tmax, Tmin has less influence and the sensitivity of GUD to Tmin was far less than the sensitivity of GUD to Tmax. Precipitation in winter and spring have little influence on GUD.
Sensitivity analysis was conducted for vegetation GUD of UM to Tmax, Tmin, and precipitation in March, April, and May (Table 11). In the UM region, except for Tmin in April, Tmax or Tmin in March, April and May had an influence on the GUD. Tmin had much more influence on GUD in March and May. In March, the sensitivity of GUD to Tmin (−0.13 days/°C) was far more than the sensitivity of GUD to Tmax (0.02 days/°C). However, in May, the sensitivity of GUD to Tmin (−0.02 days/°C) was nearly the same as the sensitivity of GUD to Tmax (0.02 days/°C). Precipitation has less influence on GUD than temperature. In this grassland type, the sensitivity of GUD in March was the greatest one.

3.4.4. Sensitivity Analysis of LM

Sensitivity analysis was conducted for vegetation GUD of LM to Tmax, Tmin, and precipitation in winter and spring (Table 12). Similar to TMS and UM, whether in winter or in spring, Tmax have a great influence on the UM region, and the sensitivity of GUD to Tmax was −0.09 days/°C and −0.10 days/°C, respectively. Compared with the Tmax, Tmin have less influence in winter and the sensitivity of GUD to Tmin was 0.04 days/°C (GUD delayed 0.04 days when temperature increase 1 °C). Precipitation in spring have a great influence on GUD, and the sensitivity of GUD to precipitation was −0.20 days/mm, which was mainly distributed in the southwestern study area.
Sensitivity analysis was conducted for vegetation GUD of LM to Tmax, Tmin, and precipitation in March, April, and May (Table 13). In the UM region, only Tmin in March and May had much more influence on GUD. Tmin in March had more influence on GUD than that in May. In March, the sensitivity of GUD to Tmin (−0.14 days/°C) was far more than the sensitivity of GUD to Tmin (0.02 days/°C) in May. Unlike the whole spring, precipitation has little influence on GUD in March, April, and May.

4. Discussion

4.1. Comparisons with Previous Studies

The mean GUD across the Hulun Buir area was DOY 113.1; this result was similar to the study in the temperate grasslands of China [24] and the study in Hulun Buir grassland area [38]. The mean GUD trend overall was −3.1 days/decade from 2001–2018. The study in the temperate grasslands of China showed that the GUD significantly advanced at a rate of 1.84 days/decade from 1982 to 2015 [24,47]. Our GUD trend results have the same advanced trend, and the strength of the advance is slightly higher. Global warming is causing temperatures to rise, and we found large differences in the extent of the Tmax and Tmin changes; however, these changes are not significant.
The research results of Peng et al. [50] pointed out that the Tmin of the growing season in the whole temperate arid region on Northern Hemisphere was positively correlated with NDVI. TS in Hulun Buir is semi-arid and the driest area in the whole region. Tmin in March promoted green-up, which is consistent with the Peng et al. [50] study. Shen et al. pointed out that precipitation in spring have a strong impact on the GUD in temperate grasslands. Our results show in TS, that the GUD has the greatest sensitivity to precipitation.
Peng et al. [50] also showed that in the past three decades, the higher Tmax in spring were significantly positively correlated with NDVI. In Hulun Buir, GUD of TMS, LM, and UM was significantly negatively correlated with Tmax in spring, and most of the areas were distributed in the northern part of the region higher than 50° N (which was in the sub-humid and humid region). The increase in Tmax can promote the growth of vegetation and advance GUD.

4.2. Results in Terms of Plant Physiology

Plant species may respond differently to warming and soil water supply, depending on their morphological, physiological, and lifecycle characteristics [51,52,53]. In arid and semi-arid ecosystems, warming causes water stress in shallow soils, which reduces shallow-root plant growth and development, allowing plants to make more efficient use of topsoil water [54].
Nocturnal warming may also affect the photosynthetic activity of vegetation through different mechanisms. First, nighttime warming can be achieved by increasing carbohydrate consumption in leaves at night [55,56], stimulating photosynthesis in plants [55]. Second, nighttime also negatively affects plant photosynthesis by increasing autotrophic respiration [50], but nighttime conditions do not affect photosynthesis itself. Field warming experiments in arid temperate grassland regions of China showed that nocturnal warming increased plant photosynthesis by about 20% [56]. Global warming promotes vegetation photosynthesis and shifts in phenology during spring in the Northern Hemisphere [3,57,58].

4.3. Factors Affecting the Spatial Variation of Sensitivity

From the perspective of geographical location and meteorological conditions, the semi-arid areas in southwest China, including the north of New Barag Left Banner and the west of Chen Barag Banner, have relatively high temperatures and low precipitation. The increase in Tmin can significantly advance GUD, whereas Tmax plays the opposite role. In the central and eastern regions, Tmax showed a negative correlation with GUD, and a significant correlation was mainly distributed in the northernmost region, where the temperature was lower and the precipitation was less. The increase in Tmax was beneficial to the GUD.
The temperature is highest and the precipitation lowest in New Barag Right Banner. The proportion of partial correlation between the spring precipitation and GUD is significantly higher than that of Tmax and Tmin, and GUD is greatly affected by spring precipitation. Similarly, in the northwest of New Barag Left Banner and the west of Chen Barag Banner, there was a significant negative correlation between GUD and Tmin, but a significant positive correlation between GUD and Tmax. The increase in Tmax inhibited vegetation growth, while the increase in Tmin was beneficial to GUD. This was consistent with the study of Peng et al. [50] that NDVI was significantly positively correlated with Tmin in the Northern Hemisphere where most of the studied regions were arid and semi-arid. The increase in Tmin could improve the biomass in arid temperate grassland areas of China. The northern region is in the sub-humid region with lower temperatures and relatively more precipitation. Tmax plays a role in promoting vegetation green-up, while Tmin does the opposite, which is consistent with the study of Piao et al. [26]. Photosynthesis of plants occurs in the daytime and is directly affected by Tmax.

5. Conclusions

In the present study, remote sensing and meteorological data were used to investigate the sensitivity of GUD to meteorological indicators in the Hulun Buir grasslands of China during the winter and spring warming periods between 2001 and 2018. Our analysis indicated that the average GUD across the whole area was DOY 113. The mean GUD trend was −3.1 days/decade and the 25% region advanced significantly. Tmax and Tmin tended to decrease during winter over the period studied (p > 0.05). In spring, Tmax mainly has an increasing trend (p > 0.05) and Tmin also has an increasing trend (p > 0.05). Precipitation mainly shows no significant (p > 0.05) change trend and the trend range was ±10 mm/decade. In TS, GUD has the greatest sensitivity to spring precipitation and April precipitation. In TMS, UM, and LM, the GUDs have the greatest sensitivity to Tmin in March and precipitation has little impact on GUD.

Author Contributions

Conceptualization, J.G. and X.Y.; software, J.G. and M.Z.; formal analysis, J.G., F.C. and A.C.; data curation, J.G., X.X. and D.Y.; writing—original draft preparation, J.G.; writing—review and editing, J.G., X.Y., W.J., P.Y., L.J. and B.X.; funding acquisition, X.Y. All authors have read and agreed to the published version of the manuscript.

Funding

This study was supported by the Inner Mongolia Science and Technology Major Project (2021ZD0011-04), the National Natural Science Foundation of China (41571105) and the National Key Research and Development Program of China (2017YFC0506504).

Data Availability Statement

Not applicable.

Conflicts of Interest

The authors declare no conflict of interest. The funders had no role in the design of the study; in the collection, analyses, or interpretation of data; in the writing of the manuscript; or in the decision to publish the results.

Abbreviations

GUDgreen-up date
Tmaxdaily maximum temperature
Tmindaily minimum temperature
TStemperate steppe
TMStemperate meadow steppe
UMupland meadow
LMlowland meadow
MODIS Moderate Resolution Imaging Spectroradiometer
NASANational Aeronautics and Space Administration
NDPInormalized difference phenology index
DOYday of year

References

  1. IPCC. Climate Change 2013: The Physical Science Basis. Contribution of Working Group I to the Fifth Assessment Report of the Intergovernmental Panel on Climate Change; Stocker, T.F., Qin, D., Plattner, G.-K., Tignor, M., Allen, S.K., Boschung, J., Nauels, A., Xia, Y., Bex, V., Midgley, P.M., Eds.; Cambridge University Press: Cambridge, UK, 2013; p. 188. [Google Scholar]
  2. Lieth, H. Purposes of a Phenology Book; Springer: Berlin/Heidelberg, Germany, 1974. [Google Scholar] [CrossRef]
  3. Myneni, R.B.; Keeling, C.D.; Tucker, C.J.; Asrar, G.; Nemani, R.R. Increased plant growth in the northern high latitudes from 1981 to 1991. Nature 1997, 386, 698–702. [Google Scholar] [CrossRef]
  4. Sparks, T.H.; Menzel, A. Observed changes in seasons: An overview. Int. J. Climatol. 2002, 22, 1715–1725. [Google Scholar] [CrossRef]
  5. Thackeray, S.J.; Henrys, P.A.; Hemming, D.; Bell, J.R.; Botham, M.S.; Burthe, S.; Helaouet, P.; Johns, D.G.; Jones, I.D.; Leech, D.I.; et al. Phenological sensitivity to climate across taxa and trophic levels. Nature 2016, 535, 241–245. [Google Scholar] [CrossRef] [PubMed] [Green Version]
  6. Yang, L.H.; Rudolf, V.H. Phenology, ontogeny and the effects of climate change on the timing of species interactions. Ecol. Lett. 2010, 13, 1–10. [Google Scholar] [CrossRef]
  7. Kharouba, H.M.; Ehrlen, J.; Gelman, A.; Bolmgren, K.; Allen, J.M.; Travers, S.E.; Wolkovich, E.M. Global shifts in the phenological synchrony of species interactions over recent decades. Proc. Natl. Acad. Sci. USA 2018, 115, 5211–5216. [Google Scholar] [CrossRef] [Green Version]
  8. Renner, S.S.; Zohner, C.M. Climate Change and Phenological Mismatch in Trophic Interactions Among Plants, Insects, and Vertebrates. Annu. Rev. Ecol. Evol. Syst. 2018, 49, 165–182. [Google Scholar] [CrossRef]
  9. Wolkovich, E.M.; Cook, B.I.; Allen, J.M.; Crimmins, T.M.; Betancourt, J.L.; Travers, S.E.; Pau, S.; Regetz, J.; Davies, T.J.; Kraft, N.J.; et al. Warming experiments underpredict plant phenological responses to climate change. Nature 2012, 485, 494–497. [Google Scholar] [CrossRef]
  10. Menzel, A.; Sparks, T.H.; Estrella, N.; Koch, E.; Aasa, A.; Ahas, R.; Alm-Kubler, K.; Bissolli, P.; Braslavska, O.; Briede, A.; et al. European phenological response to climate change matches the warming pattern. Glob. Chang. Biol. 2006, 12, 1969–1976. [Google Scholar] [CrossRef]
  11. Lapenis, A.; Henry, H.; Vuille, M.; Mower, J. Climatic factors controlling plant sensitivity to warming. Clim. Chang. 2014, 122, 723–734. [Google Scholar] [CrossRef]
  12. Still, C. As different as night and day. Nature 2013, 501, 39–40. [Google Scholar] [CrossRef]
  13. Diez, J.M.; Ibanez, I.; Miller-Rushing, A.J.; Mazer, S.J.; Crimmins, T.M.; Crimmins, M.A.; Bertelsen, C.D.; Inouye, D.W. Forecasting phenology: From species variability to community patterns. Ecol. Lett. 2012, 15, 545–553. [Google Scholar] [CrossRef] [PubMed] [Green Version]
  14. Pau, S.; Wolkovich, E.M.; Cook, B.I.; Davies, T.J.; Kraft, N.J.B.; Bolmgren, K.; Betancourt, J.L.; Cleland, E.E. Predicting phenology by integrating ecology, evolution and climate science. Glob. Chang. Biol. 2011, 17, 3633–3643. [Google Scholar] [CrossRef]
  15. Zhang, X.Y.; Friedl, M.A.; Schaaf, C.B.; Strahler, A.H. Climate controls on vegetation phenological patterns in northern mid- and high latitudes inferred from MODIS data. Glob. Chang. Biol. 2004, 10, 1133–1145. [Google Scholar] [CrossRef]
  16. Cleland, E.E.; Chiariello, N.R.; Loarie, S.R.; Mooney, H.A.; Field, C.B. Diverse responses of phenology to global changes in a grassland ecosystem. Proc. Natl. Acad. Sci. USA 2006, 103, 13740–13744. [Google Scholar] [CrossRef] [PubMed] [Green Version]
  17. Penuelas, J.; Rutishauser, T.; Filella, I. Ecology. Phenology feedbacks on climate change. Science 2009, 324, 887–888. [Google Scholar] [CrossRef] [PubMed] [Green Version]
  18. Parmesan, C.; Yohe, G. A globally coherent fingerprint of climate change impacts across natural systems. Nature 2003, 421, 37–42. [Google Scholar] [CrossRef]
  19. Gonsamo, A.; Chen, J.M.; D’Odorico, P. Deriving land surface phenology indicators from CO2 eddy covariance measurements. Ecol. Indic. 2013, 29, 203–207. [Google Scholar] [CrossRef]
  20. Zheng, Z.T.; Zhu, W.Q.; Chen, G.S.; Jiang, N.; Fan, D.Q.; Zhang, D.H. Continuous but diverse advancement of spring-summer phenology in response to climate warming across the Qinghai-Tibetan Plateau. Agric. For. Meteorol. 2016, 223, 194–202. [Google Scholar] [CrossRef]
  21. Ji, L.; Peters, A.J. A spatial regression procedure for evaluating the relationship between AVHRR-NDVI and climate in the northern Great Plains. Int. J. Remote Sens. 2004, 25, 297–311. [Google Scholar] [CrossRef]
  22. Xu, X.; Riley, W.J.; Koven, C.D.; Jia, G. Observed and Simulated Sensitivities of Spring Greenup to Preseason Climate in Northern Temperate and Boreal Regions. J. Geophys. Res. Biogeosci. 2018, 123, 60–78. [Google Scholar] [CrossRef] [Green Version]
  23. Fu, Y.H.; Liu, Y.; De Boeck, H.J.; Menzel, A.; Nijs, I.; Peaucelle, M.; Penuelas, J.; Piao, S.; Janssens, I.A. Three times greater weight of daytime than of night-time temperature on leaf unfolding phenology in temperate trees. New Phytol. 2016, 212, 590–597. [Google Scholar] [CrossRef] [PubMed] [Green Version]
  24. Shen, X.; Liu, B.; Henderson, M.; Wang, L.; Wu, Z.; Wu, H.; Jiang, M.; Lu, X. Asymmetric effects of daytime and nighttime warming on spring phenology in the temperate grasslands of China. Agric. For. Meteorol. 2018, 259, 240–249. [Google Scholar] [CrossRef]
  25. Meng, L.; Zhou, Y.Y.; Li, X.; Asrar, G.R.; Mao, J.F.; Wanamaker, A.D.; Wang, Y.Q. Divergent responses of spring phenology to daytime and nighttime warming. Agric. For. Meteorol. 2020, 281, 107832. [Google Scholar] [CrossRef]
  26. Piao, S.; Tan, J.; Chen, A.; Fu, Y.H.; Ciais, P.; Liu, Q.; Janssens, I.A.; Vicca, S.; Zeng, Z.; Jeong, S.J.; et al. Leaf onset in the northern hemisphere triggered by daytime temperature. Nat. Commun. 2015, 6, 6911. [Google Scholar] [CrossRef] [Green Version]
  27. Vitasse, Y.; Delzon, S.; Dufrêne, E.; Pontailler, J.-Y.; Louvet, J.-M.; Kremer, A.; Michalet, R. Leaf phenology sensitivity to temperature in European trees: Do within-species populations exhibit similar responses? Agric. For. Meteorol. 2009, 149, 735–744. [Google Scholar] [CrossRef]
  28. Shen, M.; Tang, Y.; Chen, J.; Yang, X.; Wang, C.; Cui, X.; Yang, Y.; Han, L.; Li, L.; Du, J.; et al. Earlier-season vegetation has greater temperature sensitivity of spring phenology in northern hemisphere. PLoS ONE 2014, 9, e88178. [Google Scholar] [CrossRef]
  29. Cong, N.; Wang, T.; Nan, H.; Ma, Y.; Wang, X.; Myneni, R.B.; Piao, S. Changes in satellite-derived spring vegetation green-up date and its linkage to climate in China from 1982 to 2010: A multimethod analysis. Glob. Chang. Biol. 2013, 19, 881–891. [Google Scholar] [CrossRef]
  30. Wu, C.Y.; Gonsamo, A.; Chen, J.M.; Kurz, W.A.; Price, D.T.; Lafleur, P.M.; Jassal, R.S.; Dragoni, D.; Bohrer, G.; Gough, C.M.; et al. Interannual and spatial impacts of phenological transitions, growing season length, and spring and autumn temperatures on carbon sequestration: A North America flux data synthesis. Glob. Planet Chang. 2012, 92–93, 179–190. [Google Scholar] [CrossRef] [Green Version]
  31. Rossi, S.; Isabel, N. Bud break responds more strongly to daytime than night-time temperature under asymmetric experimental warming. Glob. Chang. Biol. 2017, 23, 446–454. [Google Scholar] [CrossRef]
  32. Shen, M.G.; Piao, S.L.; Chen, X.Q.; An, S.; Fu, Y.S.H.; Wang, S.P.; Cong, N.; Janssens, I.A. Strong impacts of daily minimum temperature on the green-up date and summer greenness of the Tibetan Plateau. Glob. Chang. Biol. 2016, 22, 3057–3066. [Google Scholar] [CrossRef]
  33. Crimmins, T.M.; Crimmins, M.A.; David Bertelsen, C. Complex responses to climate drivers in onset of spring flowering across a semi-arid elevation gradient. J. Ecol. 2010, 98, 1042–1051. [Google Scholar] [CrossRef]
  34. Julitta, T.; Cremonese, E.; Migliavacca, M.; Colombo, R.; Galvagno, M.; Siniscalco, C.; Rossini, M.; Fava, F.; Cogliati, S.; Morra di Cella, U.; et al. Using digital camera images to analyse snowmelt and phenology of a subalpine grassland. Agric. For. Meteorol. 2014, 198–199, 116–125. [Google Scholar] [CrossRef]
  35. Wu, X.; Liu, H. Consistent shifts in spring vegetation green-up date across temperate biomes in China, 1982–2006. Glob. Chang. Biol. 2013, 19, 870–880. [Google Scholar] [CrossRef] [PubMed]
  36. Tao, F.; Yokozawa, M.; Zhang, Z.; Hayashi, Y.; Ishigooka, Y. Land surface phenology dynamics and climate variations in the North East China Transect (NECT), 1982–2000. Int. J. Remote Sens. 2008, 29, 5461–5478. [Google Scholar] [CrossRef]
  37. Sun, Z.; Wang, Q.; Xiao, Q.; Batkhishig, O.; Watanabe, M. Diverse Responses of Remotely Sensed Grassland Phenology to Interannual Climate Variability over Frozen Ground Regions in Mongolia. Remote Sens. 2014, 7, 360–377. [Google Scholar] [CrossRef] [Green Version]
  38. Guo, J.; Yang, X.; Chen, F.; Niu, J.; Luo, S.; Zhang, M.; Jin, Y.; Shen, G.; Chen, A.; Xing, X.; et al. Examining Relationships between Heat Requirement of Remotely Sensed Green-Up Date and Meteorological Indicators in the Hulun Buir Grassland. Remote Sens. 2021, 13, 1044. [Google Scholar] [CrossRef]
  39. Wang, C.; Chen, J.; Wu, J.; Tang, Y.H.; Shi, P.J.; Black, T.A.; Zhu, K. A snow-free vegetation index for improved monitoring of vegetation spring green-up date in deciduous ecosystems. Remote Sens. Environ. 2017, 196, 1–12. [Google Scholar] [CrossRef]
  40. He, J.; Yang, K.; Tang, W.; Lu, H.; Qin, J.; Chen, Y.; Li, X. The first high-resolution meteorological forcing dataset for land process studies over China. Sci. Data 2020, 7, 25. [Google Scholar] [CrossRef] [Green Version]
  41. Mann, H.B. Nonparametric tests against trend. Econometrica 1945, 45, 245–259. [Google Scholar] [CrossRef]
  42. Kendall, M.G. Rank Correlation Methods; Griffin: London, UK, 1948. [Google Scholar] [CrossRef]
  43. Sen, P.K. Estimates of the Regression Coefficient Based on Kendall’s Tau. J. Am. Stat. Assoc. 1968, 63, 1379–1389. [Google Scholar] [CrossRef]
  44. Zhang, D.; Geng, X.; Chen, W.; Fang, L.; Yao, R.; Wang, X.; Zhou, X. Inconsistency of Global Vegetation Dynamics Driven by Climate Change: Evidences from Spatial Regression. Remote Sens. 2021, 13, 3442. [Google Scholar] [CrossRef]
  45. Nouri, M.; Homaee, M. Spatiotemporal changes of snow metrics in mountainous data-scarce areas using reanalyses. J. Hydrol. 2021, 603, 126858. [Google Scholar] [CrossRef]
  46. Ruan, Y.; Zhang, X.; Xin, Q.; Qiu, Y.; Sun, Y. Prediction and Analysis of Lake Ice Phenology Dynamics Under Future Climate Scenarios Across the Inner Tibetan Plateau. J. Geophys. Res. Atmos. 2020, 125, e2020JD033082. [Google Scholar] [CrossRef]
  47. Fu, Y.H.; Zhou, X.; Li, X.; Zhang, Y.; Geng, X.; Hao, F.; Zhang, X.; Hanninen, H.; Guo, Y.; De Boeck, H.J.; et al. Decreasing control of precipitation on grassland spring phenology in temperate China. Glob. Ecol. Biogeogr. 2020, 30, 490–499. [Google Scholar] [CrossRef]
  48. Fu, Y.H.; Piao, S.; Vitasse, Y.; Zhao, H.; De Boeck, H.J.; Liu, Q.; Yang, H.; Weber, U.; Hanninen, H.; Janssens, I.A. Increased heat requirement for leaf flushing in temperate woody species over 1980-2012: Effects of chilling, precipitation and insolation. Glob. Chang. Biol. 2015, 21, 2687–2697. [Google Scholar] [CrossRef]
  49. Shen, M.; Cong, N.; Cao, R. Temperature sensitivity as an explanation of the latitudinal pattern of green-up date trend in Northern Hemisphere vegetation during 1982-2008. Int. J. Climatol. 2015, 35, 3707–3712. [Google Scholar] [CrossRef]
  50. Peng, S.; Piao, S.; Ciais, P.; Myneni, R.B.; Chen, A.; Chevallier, F.; Dolman, A.J.; Janssens, I.A.; Penuelas, J.; Zhang, G.; et al. Asymmetric effects of daytime and night-time warming on Northern Hemisphere vegetation. Nature 2013, 501, 88–92. [Google Scholar] [CrossRef]
  51. Price, M.V.; Waser, N.M. Effects of experimental warming on plant reproductive phenology in a subalpine meadow. Ecology 1998, 79, 1261–1271. [Google Scholar] [CrossRef]
  52. Dunne, J.A.; Harte, J.; Taylor, K.J. Subalpine meadow flowering phenology responses to climate change: Integrating experimental and gradient methods. Ecol. Monogr. 2003, 73, 69–86. [Google Scholar] [CrossRef]
  53. Root, T.L.; Price, J.T.; Hall, K.R.; Schneider, S.H.; Rosenzweig, C.; Pounds, J.A. Fingerprints of global warming on wild animals and plants. Nature 2003, 421, 57–60. [Google Scholar] [CrossRef]
  54. Williams, A.P.; Allen, C.D.; Macalady, A.K.; Griffin, D.; Woodhouse, C.A.; Meko, D.M.; Swetnam, T.W.; Rauscher, S.A.; Seager, R.; Grissino-Mayer, H.D.; et al. Temperature as a potent driver of regional forest drought stress and tree mortality. Nat. Clim. Chang. 2013, 3, 292–297. [Google Scholar] [CrossRef]
  55. Beier, C.; Emmett, B.; Gundersen, P.; Tietema, A.; Penuelas, J.; Estiarte, M.; Gordon, C.; Gorissen, A.; Llorens, L.; Roda, F.; et al. Novel approaches to study climate change effects on terrestrial ecosystems in the field: Drought and passive nighttime warming. Ecosystems 2004, 7, 583–597. [Google Scholar] [CrossRef]
  56. Wan, S.; Xia, J.; Liu, W.; Niu, S. Photosynthetic overcompensation under nocturnal warming enhances grassland carbon sequestration. Ecology 2009, 90, 2700–2710. [Google Scholar] [CrossRef] [PubMed] [Green Version]
  57. Piao, S.L.; Friedlingstein, P.; Ciais, P.; Viovy, N.; Demarty, J. Growing season extension and its impact on terrestrial carbon cycle in the Northern Hemisphere over the past 2 decades. Glob. Biogeochem. Cycles 2007, 21, GB3018. [Google Scholar] [CrossRef]
  58. Tucker, C.J.; Slayback, D.A.; Pinzon, J.E.; Los, S.O.; Myneni, R.B.; Taylor, M.G. Higher northern latitude normalized difference vegetation index and growing season trends from 1982 to 1999. Int. J. Biometeorol. 2001, 45, 184–190. [Google Scholar] [CrossRef] [PubMed]
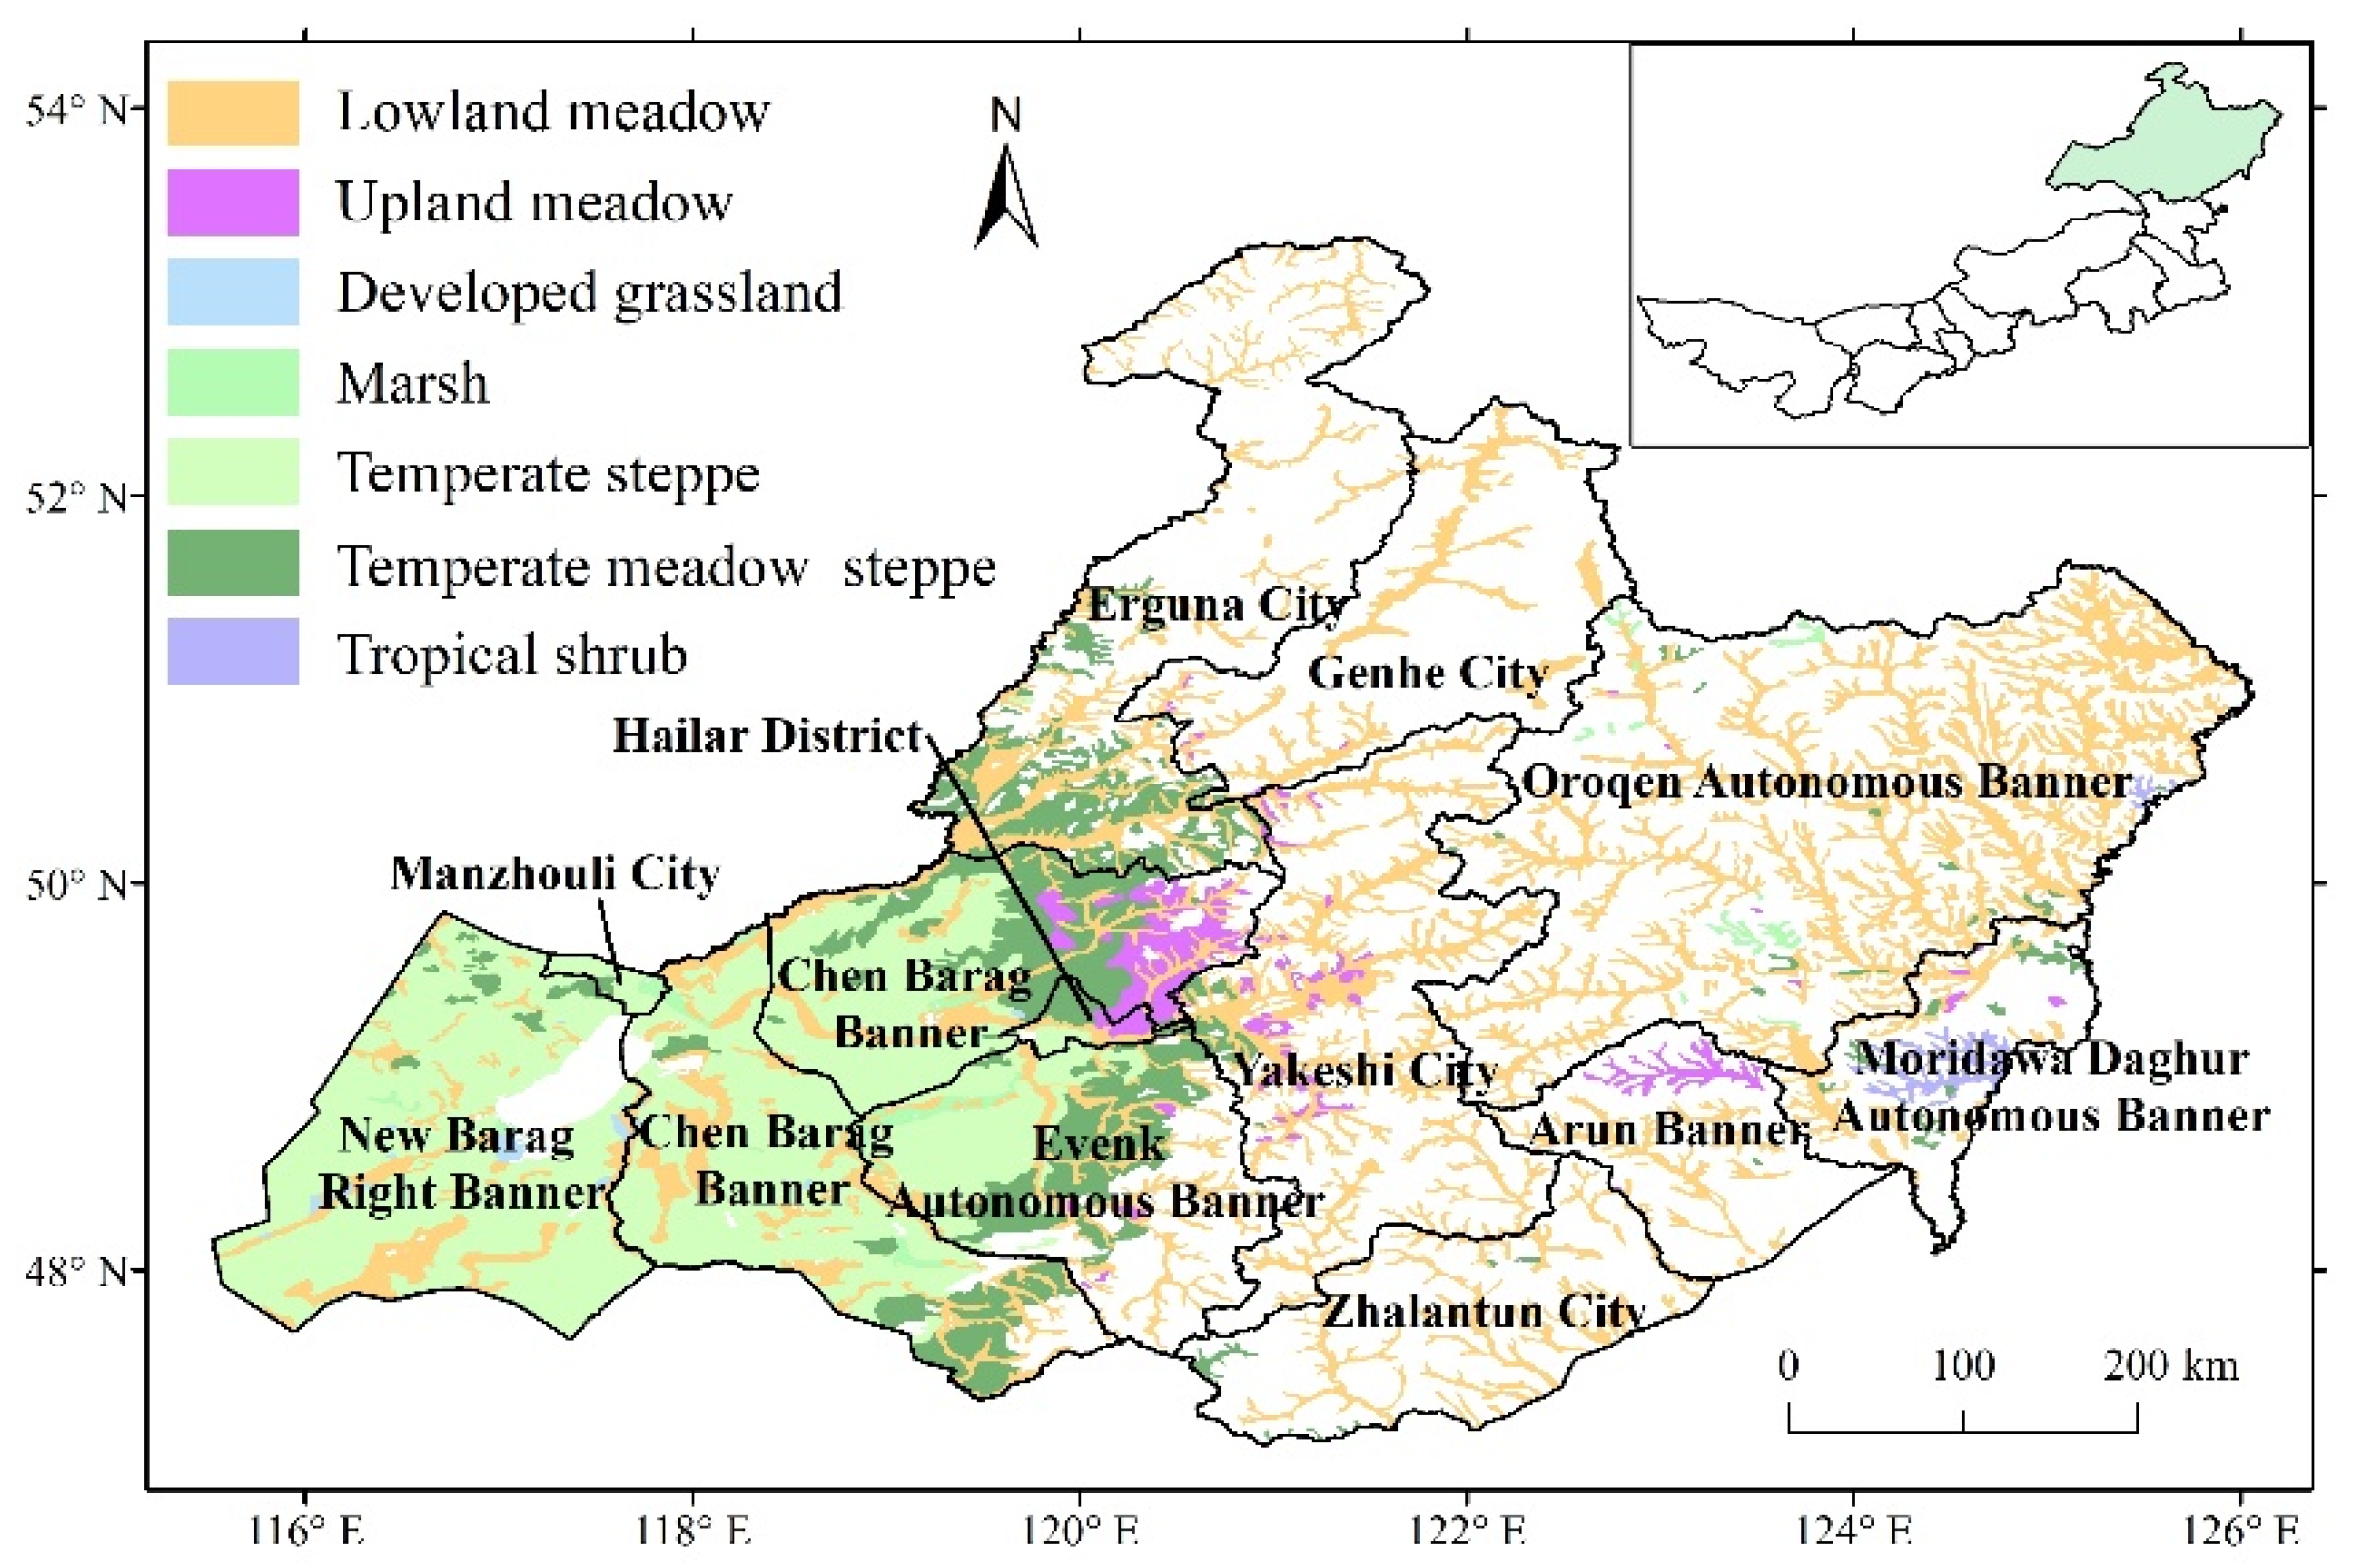
Figure 1. Administrative divisions and grassland classifications in Hulun Buir [38]. In this figure, the county boundaries were used to divide the different districts. The name of each administrative district is given in bold. The blank areas represent non-grassland areas.
Remotesensing 14 00670 g001
Figure 2. Flow chart of the key indicator computations and statistical analysis.
Remotesensing 14 00670 g002
Figure 3. Mean GUD between 2001 and 2018.
Remotesensing 14 00670 g003
Figure 4. Spatial pattern of the temporal trends in green-up dates (in days per decade) between 2001 and 2018. The inset shown at the top-right of the figure indicates pixels with a significant (p < 0.05) increase (red) or decrease (green). The middle-left inset shows the frequency distribution of the trends corresponding to the values indicated by the map legend.
Remotesensing 14 00670 g004
Figure 5. Spatial pattern of the temporal trends in winter daily maximum temperature (a) and winter daily minimum temperature (b) between 2001 and 2018. The top-right insets indicate pixels with a significant (p < 0.05) increase (red) or decrease (blue).
Remotesensing 14 00670 g005
Figure 6. Spatial pattern of the temporal trends in spring daily maximum temperature (a) and spring daily minimum temperature (b) between 2001 and 2018. The top-right insets indicate pixels with a significant (p < 0.05) increase (red) or decrease (blue).
Remotesensing 14 00670 g006
Figure 7. Spatial pattern of the temporal trends in total winter precipitation between 2001 and 2018. The top-right insets indicate pixels with a significant (p < 0.05) increase (blue) or decrease (red).
Remotesensing 14 00670 g007
Figure 8. Spatial pattern of the temporal trends in total spring precipitation between 2001 and 2018. The top-right insets indicate pixels with a significant (p < 0.05) increase (blue) or decrease (red).
Remotesensing 14 00670 g008
Figure 9. Spatial patterns of the interannual partial correlations between green-up date and daily maximum temperature (a), daily minimum temperature (b), and precipitation (c) in winter. Partial correlation coefficient values of ±0.62, ±0.50, and ±0.43 correspond to significance at p = 0.01, p = 0.05, and p = 0.10, respectively. The middle-left insets show the frequency distributions of trends corresponding to the values indicated by the map legends.
Remotesensing 14 00670 g009
Figure 10. Spatial patterns of the interannual partial correlations between green-up date and daily maximum temperature (a), daily minimum temperature (b), and precipitation (c) in spring. Partial correlation coefficient values of ±0.62, ±0.50, and ±0.43 correspond to significance at p = 0.01, p = 0.05, and p = 0.10, respectively. The middle-left insets show the frequency distributions of the trends corresponding to the values indicated by the map legends.
Remotesensing 14 00670 g010
Figure 11. Spatial patterns of the interannual partial correlations between green-up date and daily maximum temperature (a), daily minimum temperature (b), and precipitation (c) in March. Partial correlation coefficient values of ±0.62, ±0.50, and ±0.43 correspond to significance at p = 0.01, p = 0.05, and p = 0.10, respectively. The middle-left insets show the frequency distributions of the trends corresponding to the values indicated by the map legends.
Remotesensing 14 00670 g011
Figure 12. Spatial patterns of the interannual partial correlations between green-up date and daily maximum temperature (a), daily minimum temperature (b), and precipitation (c) in April. Partial correlation coefficient values of ±0.62, ±0.50, and ±0.43 correspond to significance at p = 0.01, p = 0.05, and p = 0.10, respectively. The middle-left insets show the frequency distributions of trends corresponding to the values indicated by the map legends.
Remotesensing 14 00670 g012
Figure 13. Spatial patterns of the interannual partial correlations between green-up date and daily maximum temperature (a), daily minimum temperature (b), and precipitation (c) in May. Partial correlation coefficient values of ±0.62, ±0.50, and ±0.43 correspond to significance at p = 0.01, p = 0.05, and p = 0.10, respectively. The middle-left insets show the frequency distributions of trends corresponding to the values indicated by the map legends.
Remotesensing 14 00670 g013
Table 1. The pixels proportion of the partial correlation in winter (%).
Partial Correlation
in Winter
Significant
Negative (p < 0.05)
Significant
Positive (p < 0.05)
Non-Significant
Negative (p > 0.05)
Non-Significant
Positive (p > 0.05)
GUD and TmaxTS4.54.64941.9
TMS33.91.151.313.7
UM46.60.340.712.4
LM13.32.950.433.4
study area13.73.349.533.5
GUD and TminTS3.51.551.443.6
TMS0.913.828.656.7
UM0.319.21664.5
LM2.39.235.153.4
study area2.67.239.850.4
GUD and precipitation TS0.34.938.456.4
TMS1.39.233.356.2
UM1.72.429.466.5
LM72.257.833
study area3.64.146.346
Table 2. The pixels proportion of the partial correlation in spring (%).
Partial Correlation
in Spring
Significant
Negative (p < 0.05)
Significant
Positive (p < 0.05)
Non-Significant
Negative (p > 0.05)
Non-Significant
Positive (p > 0.05)
GUD and TmaxTS0.83.45045.8
TMS141.560.623.9
UM26.20.953.719.2
LM9.6355.432
study area7.53.153.735.7
GUD and TminTS50.661.932.5
TMS50.56034.5
UM0.82.345.351.6
LM3.13.744.548.7
study area4.22.152.840.9
GUD and precipitation TS18.30.166.615
TMS0.20.257.242.4
UM0.3159.739
LM3.10.536.659.8
study area8.30.350.740.7
Table 3. The pixels proportion of the partial correlation in March (%).
Partial Correlation
in March
Significant
Negative (p < 0.05)
Significant
Positive (p < 0.05)
Non-Significant
Negative (p > 0.05)
Non-Significant
Positive (p > 0.05)
GUD and TmaxTS3.23.721.371.8
TMS0.125.3866.6
UM0.333.14.362.3
LM1.58.221.169.2
study area1.91018.969.2
GUD and TminTS27.33.14128.6
TMS73.90.320.85
UM65.90.227.66.3
LM22.12.941.233.9
study area31.92.538.427.2
GUD and precipitation TS0.83.446.549.3
TMS1.94.552.241.4
UM1.19.128.561.3
LM0.64.632.562.2
study area0.94.439.854.9
Table 4. The pixels proportion of the partial correlation in April (%).
Partial Correlation
in April
Significant
Negative (p < 0.05)
Significant
Positive (p < 0.05)
Non-Significant
Negative (p > 0.05)
Non-Significant
Positive (p > 0.05)
GUD and TmaxTS9.13.750.436.8
TMS4.10.868.127
UM11.70.865.422
LM6.535040.5
study area7.2352.637.2
GUD and TminTS3.51.25342.3
TMS1.60.159.838.5
UM1.50.359.438.8
LM3.90.659.136.4
study area3.60.757.138.6
GUD and precipitation TS21.70.861.915.6
TMS2.10.749.347.9
UM0.21.635.762.4
LM3.32.341.652.8
study area0.41.749.239.7
Table 5. The pixels proportion of the partial correlation in May (%).
Partial Correlation
in May
Significant
Negative (p < 0.05)
Significant
Positive (p < 0.05)
Non-Significant
Negative (p > 0.05)
Non-Significant
Positive (p > 0.05)
GUD and TmaxTS11.10.377.611
TMS22.30.170.17.5
UM44.5044.411.1
LM8.20.159.632.2
study area12.30.266.221.3
GUD and TminTS0.29.316.274.3
TMS0.132.75.561.7
UM051.81.746.5
LM016.275.816.2
study area0.117.110.272.6
GUD and precipitation TS19.40.157.922.6
TMS0.60.28415.2
UM2.20.277.120.5
LM3.60.751.144.5
study area8.60.457.933.1
Table 6. Sensitivity of the GUD to meteorological indicators of TS in winter and spring.
Sensitivity of GUD to
Meteorological Indicators 1
Significant Negative (p < 0.05)Significant Positive (p < 0.05)
winterGUD to Tmax−0.090.02
GUD to Tmin−0.010.00
GUD to precipitation−0.110.36
springGUD to Tmax−0.070.02
GUD to Tmin−0.060.02
GUD to precipitation−0.410.51
1 The unit is days/°C (sensitivity of GUD to Tmax or Tmin) or days/mm (sensitivity of GUD to precipitation).
Table 7. Sensitivity of GUD to meteorological indicators of TS in March, April and May.
Sensitivity of GUD to
Meteorological Indicators 1
Significant Negative (p < 0.05)Significant Positive (p < 0.05)
March GUD to Tmax−0.090.01
GUD to Tmin−0.170.03
GUD to precipitation−0.070.20
AprilGUD to Tmax−0.090.02
GUD to Tmin−0.020.00
GUD to precipitation−0.320.11
MayGUD to Tmax−0.010.01
GUD to Tmin−0.010.02
GUD to precipitation−0.170.18
1 The unit is days/°C (sensitivity of GUD to Tmax or Tmin) or days/mm (sensitivity of GUD to precipitation).
Table 8. Sensitivity of the GUD to meteorological indicators of TMS in winter and spring.
Sensitivity of GUD to
Meteorological Indicators 1
Significant Negative (p < 0.05)Significant Positive (p < 0.05)
WinterGUD to Tmax−0.110.04
GUD to Tmin−0.010.00
GUD to precipitation−0.280.35
SpringGUD to Tmax−0.120.02
GUD to Tmin−0.08−0.02
GUD to precipitation−0.110.72
1 The unit is days/°C (sensitivity of GUD to Tmax or Tmin) or days/mm (sensitivity of GUD to precipitation).
Table 9. Sensitivity of the GUD to meteorological indicators of TMS in March, April, and May.
Sensitivity of GUD to
Meteorological Indicators 1
Significant Negative (p < 0.05)Significant Positive (p < 0.05)
March GUD to Tmax−0.37−0.03
GUD to Tmin−0.150.09
GUD to precipitation−0.040.30
AprilGUD to Tmax−0.180.02
GUD to Tmin−0.07−0.02
GUD to precipitation−0.240.66
MayGUD to Tmax−0.010.01
GUD to Tmin−0.010.03
GUD to precipitation−0.14−0.10
1 The unit is days/°C (sensitivity of GUD to Tmax or Tmin) or days/mm (sensitivity of GUD to precipitation).
Table 10. Sensitivity of the GUD to meteorological indicators of UM in winter and spring.
Sensitivity of GUD to
Meteorological Indicators 1
Significant Negative (p < 0.05)Significant Positive (p < 0.05)
winterGUD to Tmax−0.100.03
GUD to Tmin−0.040.00
GUD to precipitation−0.340.39
springGUD to Tmax−0.140.03
GUD to Tmin−0.040.00
GUD to precipitation-1.00
1 The unit is days/°C (sensitivity of GUD to Tmax or Tmin) or days/mm (sensitivity of GUD to precipitation).
Table 11. Sensitivity of the GUD to meteorological indicators of UM in March, April, and May.
Sensitivity of GUD to
Meteorological Indicators 1
Significant Negative (p < 0.05)Significant Positive (p < 0.05)
March GUD to Tmax−0.210.02
GUD to Tmin−0.130.10
GUD to precipitation−0.050.35
AprilGUD to Tmax−0.220.02
GUD to Tmin−0.040.01
GUD to precipitation−0.171.03
MayGUD to Tmax−0.020.02
GUD to Tmin-0.03
GUD to precipitation−0.020.36
1 The unit is days/°C (Sensitivity of GUD to Tmax or Tmin) or days/mm (Sensitivity of GUD to precipitation).
Table 12. Sensitivity of the GUD to meteorological indicators of LM in winter and spring.
Sensitivity of GUD to
Meteorological Indicators 1
Significant Negative (p < 0.05)Significant Positive (p < 0.05)
winterGUD to Tmax−0.090.04
GUD to Tmin−0.020.04
GUD to precipitation−0.400.33
springGUD to Tmax−0.100.03
GUD to Tmin−0.040.02
GUD to precipitation−0.200.40
1 The unit is days/°C (sensitivity of GUD to Tmax or Tmin) or days/mm (sensitivity of GUD to precipitation).
Table 13. Sensitivity of GUD to meteorological indicators of LM in March, April, and May.
Sensitivity of GUD to
Meteorological Indicators 1
Significant Negative (p < 0.05)Significant Positive (p < 0.05)
March GUD to Tmax−0.200.09
GUD to Tmin−0.140.09
GUD to precipitation−0.100.34
AprilGUD to Tmax−0.160.04
GUD to Tmin−0.050.02
GUD to precipitation−0.230.56
MayGUD to Tmax−0.020.02
GUD to Tmin−0.020.02
GUD to precipitation−0.080.28
1 The unit is days/°C (sensitivity of GUD to Tmax or Tmin) or days/mm (sensitivity of GUD to precipitation).
Publisher’s Note: MDPI stays neutral with regard to jurisdictional claims in published maps and institutional affiliations.