Technical Note

Estimating the Clear-Sky Longwave Downward Radiation in the Arctic from FengYun-3D MERSI-2 Data

1
Beijing Key Laboratory of Precision Forestry, Beijing Forestry University, Beijing 100083, China
2
Beijing Engineering Research Center of Industrial Spectrum Imaging, School of Automation and Electrical Engineering, University of Science and Technology Beijing, Beijing 100083, China
*
Author to whom correspondence should be addressed.
Remote Sens. 2022, 14(3), 606; https://doi.org/10.3390/rs14030606
Submission received: 3 December 2021 / Revised: 23 January 2022 / Accepted: 23 January 2022 / Published: 27 January 2022

Abstract

:
Surface longwave downward radiation (LWDR) plays a key role in determining the Arctic surface energy budget, especially in insolation-absent boreal winter. A reliable LWDR product is essential for understanding the intrinsic physical mechanisms of the rapid changes in the Arctic climate. The Medium-Resolution Spectral Imager (MERSI-2), a major payload of the Chinese second-generation polar-orbiting meteorological satellite, FengYun-3D (FY-3D), was designed similar to the NASA Moderate-Resolution Imaging Spectroradiometer (MODIS) in terms of the spectral bands. Although significant progress has been made in estimating clear-sky LWDR from MODIS observations using a variety of methods, few studies have focused on the retrieval of clear-sky LWDR from FY-3D MERSI-2 observations. In this study, we propose an advanced method to directly estimate the clear-sky LWDR in the Arctic from the FY-3D MERSI-2 thermal infrared (TIR) top-of-atmosphere (TOA) radiances and auxiliary information using the extremely randomized trees (ERT) machine learning algorithm. The retrieval accuracy of RMSE and bias, validated with the Baseline Surface Radiation Network (BSRN) in situ measurements, are 14.14 W/m2 and 4.36 W/m2, respectively, which is comparable and even better than previous studies. The scale effect in retrieval accuracy evaluation was further analyzed and showed that the validating window size could significantly influence the retrieval accuracy of the MERSI-2 clear-sky LWDR dataset. After aggregating to a spatial resolution of 9 km, the RMSE and bias of MERSI-2 retrievals can be reduced to 9.43 W/m2 and −0.14 W/m2, respectively. The retrieval accuracy of MERSI-2 clear-sky LWDR at the CERES SSF FOV spatial scale (approximately 20 km) can be further reduced to 8.64 W/m2, which is much higher than the reported accuracy of the CERES SSF products. This study demonstrates the feasibility of producing LWDR datasets from Chinese FY-3D MERSI-2 observations using machine learning methods.

1. Introduction

The surface longwave downward radiation (LWDR), which is closely related to the atmospheric greenhouse effect, is an important component for determining the Earth’s surface energy budget [1]. In the insolation absent boreal winter, the LWDR emitted from the warmer and wetter atmosphere gases and clouds contributes most incoming energy to the Arctic surface [2]. Although whether this results from either the enhanced greenhouse effect of increased water vapor and clouds [3,4] or the lapse-rate feedback of the Arctic boundary temperature inversion [5,6] is still under debate, increased LWDR was suggested to play a key role in driving Arctic wintertime warming and spring sea-ice initial melting [2,3,4,7] in recent decades. Thus, a reliable and realistic LWDR product is essential for studying and understanding the intrinsic physical mechanisms of the rapid changes in the Arctic climate in recent years.
In recent decades, significant effort has been devoted to developing enhanced satellite-based retrieval algorithms and modeling parameterization schemes for producing gridded LWDR products [8,9,10]. A series of long-term LWDR products have been generated and released to the community. Satellite-based LWDR retrieval methods are usually grouped into three categories [8,11,12]: profile-based schemes that calculate LWDR with radiative transfer models (RTMs) and satellite-estimated atmospheric meteorological profiles [12,13,14], parameterization schemes that estimate LWDR with satellite-retrieved near-surface meteorological parameters [15], and hybrid schemes that calculate LWDR with a statistical model built with RTM-simulated LWDR and satellite-observed Top of Atmosphere (TOA) radiances under different view angles and elevations [16,17]. To overcome the obvious limitation of the profile-based method (i.e., the high dependence and low accessibility of meteorological profiles) and parameterization method (i.e., the general applicability issue of the parameterization scheme built on local parameters) in estimating LWDR [8,18], hybrid methods have been proposed and constantly developed in recent years. To date, a series of generalized hybrid schemes have been developed and adopted for deriving LWDR from different satellite observations and have achieved outstanding results [11,12,14,19,20,21]. One of the key factors affecting the performance of the hybrid method is the amount and representation of the training database for building the LWDR-estimating model. There are two ways to prepare the training database for building the hybrid model. Earlier studies mainly generated the LWDR database with radiative transfer model simulations taking the atmospheric profiles as inputs [16,17]. Several recent studies have directly collected in situ measured datasets from flux networks to build LWDR databases [19,21]. However, in the ground stations sparsely distributed Arctic (especially over the ocean surface), there are very limited in situ measurements to be collected and used to build the statistical retrieval model, and the retrieval accuracy of LWDR could be low in this region.
Feng Yun 3D (FY-3D) is the fourth satellite of the second-generation Chinese polar-orbiting meteorological satellite series, which was launched in November 2017 [22]. The second-generation Medium-Resolution Spectral Imager (MERSI-2) is one of the major payloads onboard the FY-3D satellite and is designed to monitor the Earth’s surface, atmosphere, and other environmental parameters. MERSI-2 has a spectral band design similar to that of NASA’s MODIS payload. Although many outstanding studies have been performed to estimate clear-sky LWDR using MODIS observations [11,12,13,16,21], very limited attention has been given to retrieving clear-sky LWDR from FY-3D MERSI-2 observations.
Machine learning (ML) techniques have been widely used in environmental remote sensing studies due to their strong ability to address complex nonlinear statistical problems [19,21,23,24,25,26]. Clear-sky LWDR is highly dependent on the vertical distribution of atmospheric temperature and water vapor with typical nonlinear characteristics, and many satellite-based estimation methods have been designed as nonlinear schemes [10,12,17,27]. Several recent studies have suggested that ML algorithms achieve much better results than traditional methods in estimating LWDR [12,13,14,21]. In this study, we introduced three state-of-the-art ensemble ML algorithms, including random forests (RF), extremely randomized trees (ERT), and categorical boosting (CatBoost), for selecting the optimal ML model and estimating clear-sky LWDR in the Arctic from FY-3D MERSI-2 data. Although the three ML models were all reported to perform well in retrieving land surface parameters from satellite observations [12,19,25,26,28,29], it is still unclear which model is better suited to estimate the clear-sky LWDR with FY-3D MERSI observations in the Arctic.
In this study, we achieved two major objectives. The performances of three alternative ML algorithms in estimating clear-sky LWDR from MERSI-2 observations were compared. The ERT machine learning algorithm was found to be more suitable than the other two ML algorithms. Using the ERT algorithm, we proposed an advanced method for directly estimating the clear-sky LWDR from the FY-3D MERSI-2 observations in the ground-observation scarce Arctic.

2. Materials and Methods

Our objective is to estimate the clear-sky LWDR in the Arctic from FY-3D MERSI-2 observations using ML techniques. To achieve this goal, we designed a framework composed of several major steps to promote the study process (Figure 1). In the first step, a paired training sample database was generated based on strict spatiotemporal matching between calibrated clear-sky SSF FOV LWDR and MERSI-2 observations. Then, the three alternative tree-based ensemble ML algorithms were trained and evaluated in the training accuracies to choose the optimal model for estimating the instantaneous clear-sky LWDR in the Arctic. Finally, the optimal ML model was selected and applied to retrieve the clear-sky LWDR from the MERSI-2 TOA radiances and other ancillary parameters, and the produced clear-sky LWDR was validated with BSRN in situ measurements.

2.1. Data

2.1.1. FY-3D MERSI-2 Data

The MERSI-2 payload was designed similarly to the NASA MODIS in terms of the spectral bands (Table 1). There are 6 TIR bands on MERSI-2 with spectral coverage from 3.8 to 12.0 μm, including 2 longwave infrared bands (bands 22–23) for monitoring atmospheric water vapor and 4 short/longwave bands (bands 20–21 and 24–25) for detecting surface and cloud temperature sensing [22]. The FY-3D MERSI-2 geolocation product, level 1 calibrated TOA radiance product with a 1-km spatial resolution and level 2 cloud mask product were collected and used to estimate the instantaneous LWDR in the Arctic. The six TIR bands were extracted from the original level 1 TOA radiance product. The geolocation product was used to obtain the latitude, longitude, sensor zenith angle (SZA), and sensor azimuth angle (SAA) of each 1-km grid. The MERSI-2 level 2 cloud mask product was used to detect the cloud confidence flag at each pixel.

2.1.2. CERES Single Scanner Footprint (SSF) Product

The Clouds and the Earth’s Radiant Energy System (CERES) Single Scanner Footprint (SSF) product, Edition-4A, was collected, calibrated, and used as the reference data in this study. The CERES project developed three Langley parameterized longwave algorithms (LPLA), namely, LW Models A, B, and C, for deriving the LWDR product [30]. The released CERES SSF FOV LWDR product was derived with the LW Model B algorithm, which was developed from an accurate narrowband radiative transfer model using an extensive meteorological database of satellite and in situ measurements, to provide the capability of rapidly computing the downward, upward, and net LW radiative fluxes at the Earth’s surface for both clear- and cloudy-sky conditions [27]. LW Model B first calculates the LWDR under clear- and cloudy-sky conditions separately and then estimates the all-sky LWDR by combining the clear- and cloudy-sky results with the cloud fraction [27]. This demonstrates that a given pixel with a close LWDR value under clear-sky and all-sky conditions is highly likely to be cloud-free. The clear-sky SSF FOV LWDR was filtered as the difference of clear-sky and all-sky estimated LWDR lower than 1 W/m2.

2.1.3. BSRN In Situ Measurements

The Baseline Surface Radiation Network (BSRN) was established by the Global Energy and Water Exchanges (GEWEX) project of the World Climate Research Programme (WCRP) to provide accurate ground-based measurements of shortwave and longwave radiation for evaluating satellite retrieved and model-simulated fluxes and for detecting long-term variations in these radiation fluxes at the Earth’s surface [31]. The BSRN project currently has approximately 76 stations, covering the Earth’s surface from 90°S to 82.5°N. In this study, we first used seven sites located north of 60°N to validate and calibrate the CERES SSF FOV LWDR reference products in the Arctic and then used the observations at Ny-Alesund to validate the estimated FY-3D MERSI-2 clear-sky LWDR data. The distribution of the 7 BSRN sites is shown in Figure 2d. Detailed information on these sites in the Arctic is shown in Table 2.

2.2. Method

2.2.1. Training Database Generation

Sufficient training samples are a very important prerequisite to guarantee the effectiveness of machine learning techniques. However, since the FY-3D satellite was launched in November 2017, very limited BSRN in situ observations could be used directly as reference data to train the ML models. Therefore, we used the BSRN site observation calibrated CERES SSF FOV clear-sky LWDR as the reference data in this study. The paired training samples were prepared based on a rigorous spatiotemporal matching process between the calibrated CERES SSF clear-sky LWDR and the FY-3D MERSI-2 TOA radiance. The matched MERSI-2 TOA pixel-level radiances among a 20 × 20 km CERES FOV were aggregated to ensure that the two different variables were spatially consistent with each other. To ensure the representativeness of the samples, we collected the data every ten days from June 2019 to May 2020 of both products to generate the training database. There were 103,189 samples, with 29,537 from Terra and 73,652 from Aqua, paired and selected into the training database. All training samples were randomly divided into two groups, one with 80% training samples and another with 20% validation samples.

2.2.2. Machine Learning Algorithms for Clear-Sky LWDR Estimation

With the paired training database, the three alternative ML models were trained and evaluated in the clear-sky LWDR estimation accuracy. The RF algorithm, which is insensitive to outliers and multicollinearity problems, has been demonstrated to have good performance in estimating clear-sky LWDR [12,19]. The ERT algorithm is different from the RF in two main aspects: (1) using all training samples instead of the bootstrap replica to grow the trees and (2) splitting nodes randomly instead of computing the locally optimal cut-points [32]. Until now, the ERT algorithm has been successfully applied in estimating aboveground biomass prediction [26], vegetation phenology prediction [29], and terrestrial latent heat flux estimation [25], but its performance in retrieving LWDR has not yet been explored. The CatBoost algorithm belongs to boosting ensemble algorithms; it gives more attention to the samples with higher prediction errors and increases their weights in the next iteration and therefore improves the prediction accuracy by decreasing bias. The CatBoost algorithm is an upgraded boosting model from an improvement of the gradient-boosting decision tree (GBRT) algorithm [26]. It performs well in solving heterogeneous features, noisy data, and prediction shift problems [28]. In this step, we evaluated the performances of the three algorithms in estimating clear-sky LWDR from satellite observations.

2.2.3. Accuracy Assessment

To evaluate the performance of the proposed models and validate the FY-3D MERSI-2 clear-sky LWDR products, four statistical metrics, the coefficient of determination (R2), root mean square difference (RMSE), mean absolute error (MAE), and Bias, were calculated with the following formulas:
R 2 ( y , y ^ ) = 1 i = 1 N ( y i y ^ i ) 2 i = 1 N ( y i y ¯ ) 2
RMSE ( y , y ^ ) = i = 1 N ( y i y ^ i ) 2 N
MAE ( y , y ^ ) = i = 1 N | y i y ^ i | N
Bias ( y , y ^ ) = i = 1 N ( y ^ i y i ) N
where y is the reference clear-sky LWDR, y ¯ is the mean value of the reference LWDR, y ^ is the predicted clear-sky LWDR, and N is the number of test samples.

3. Results

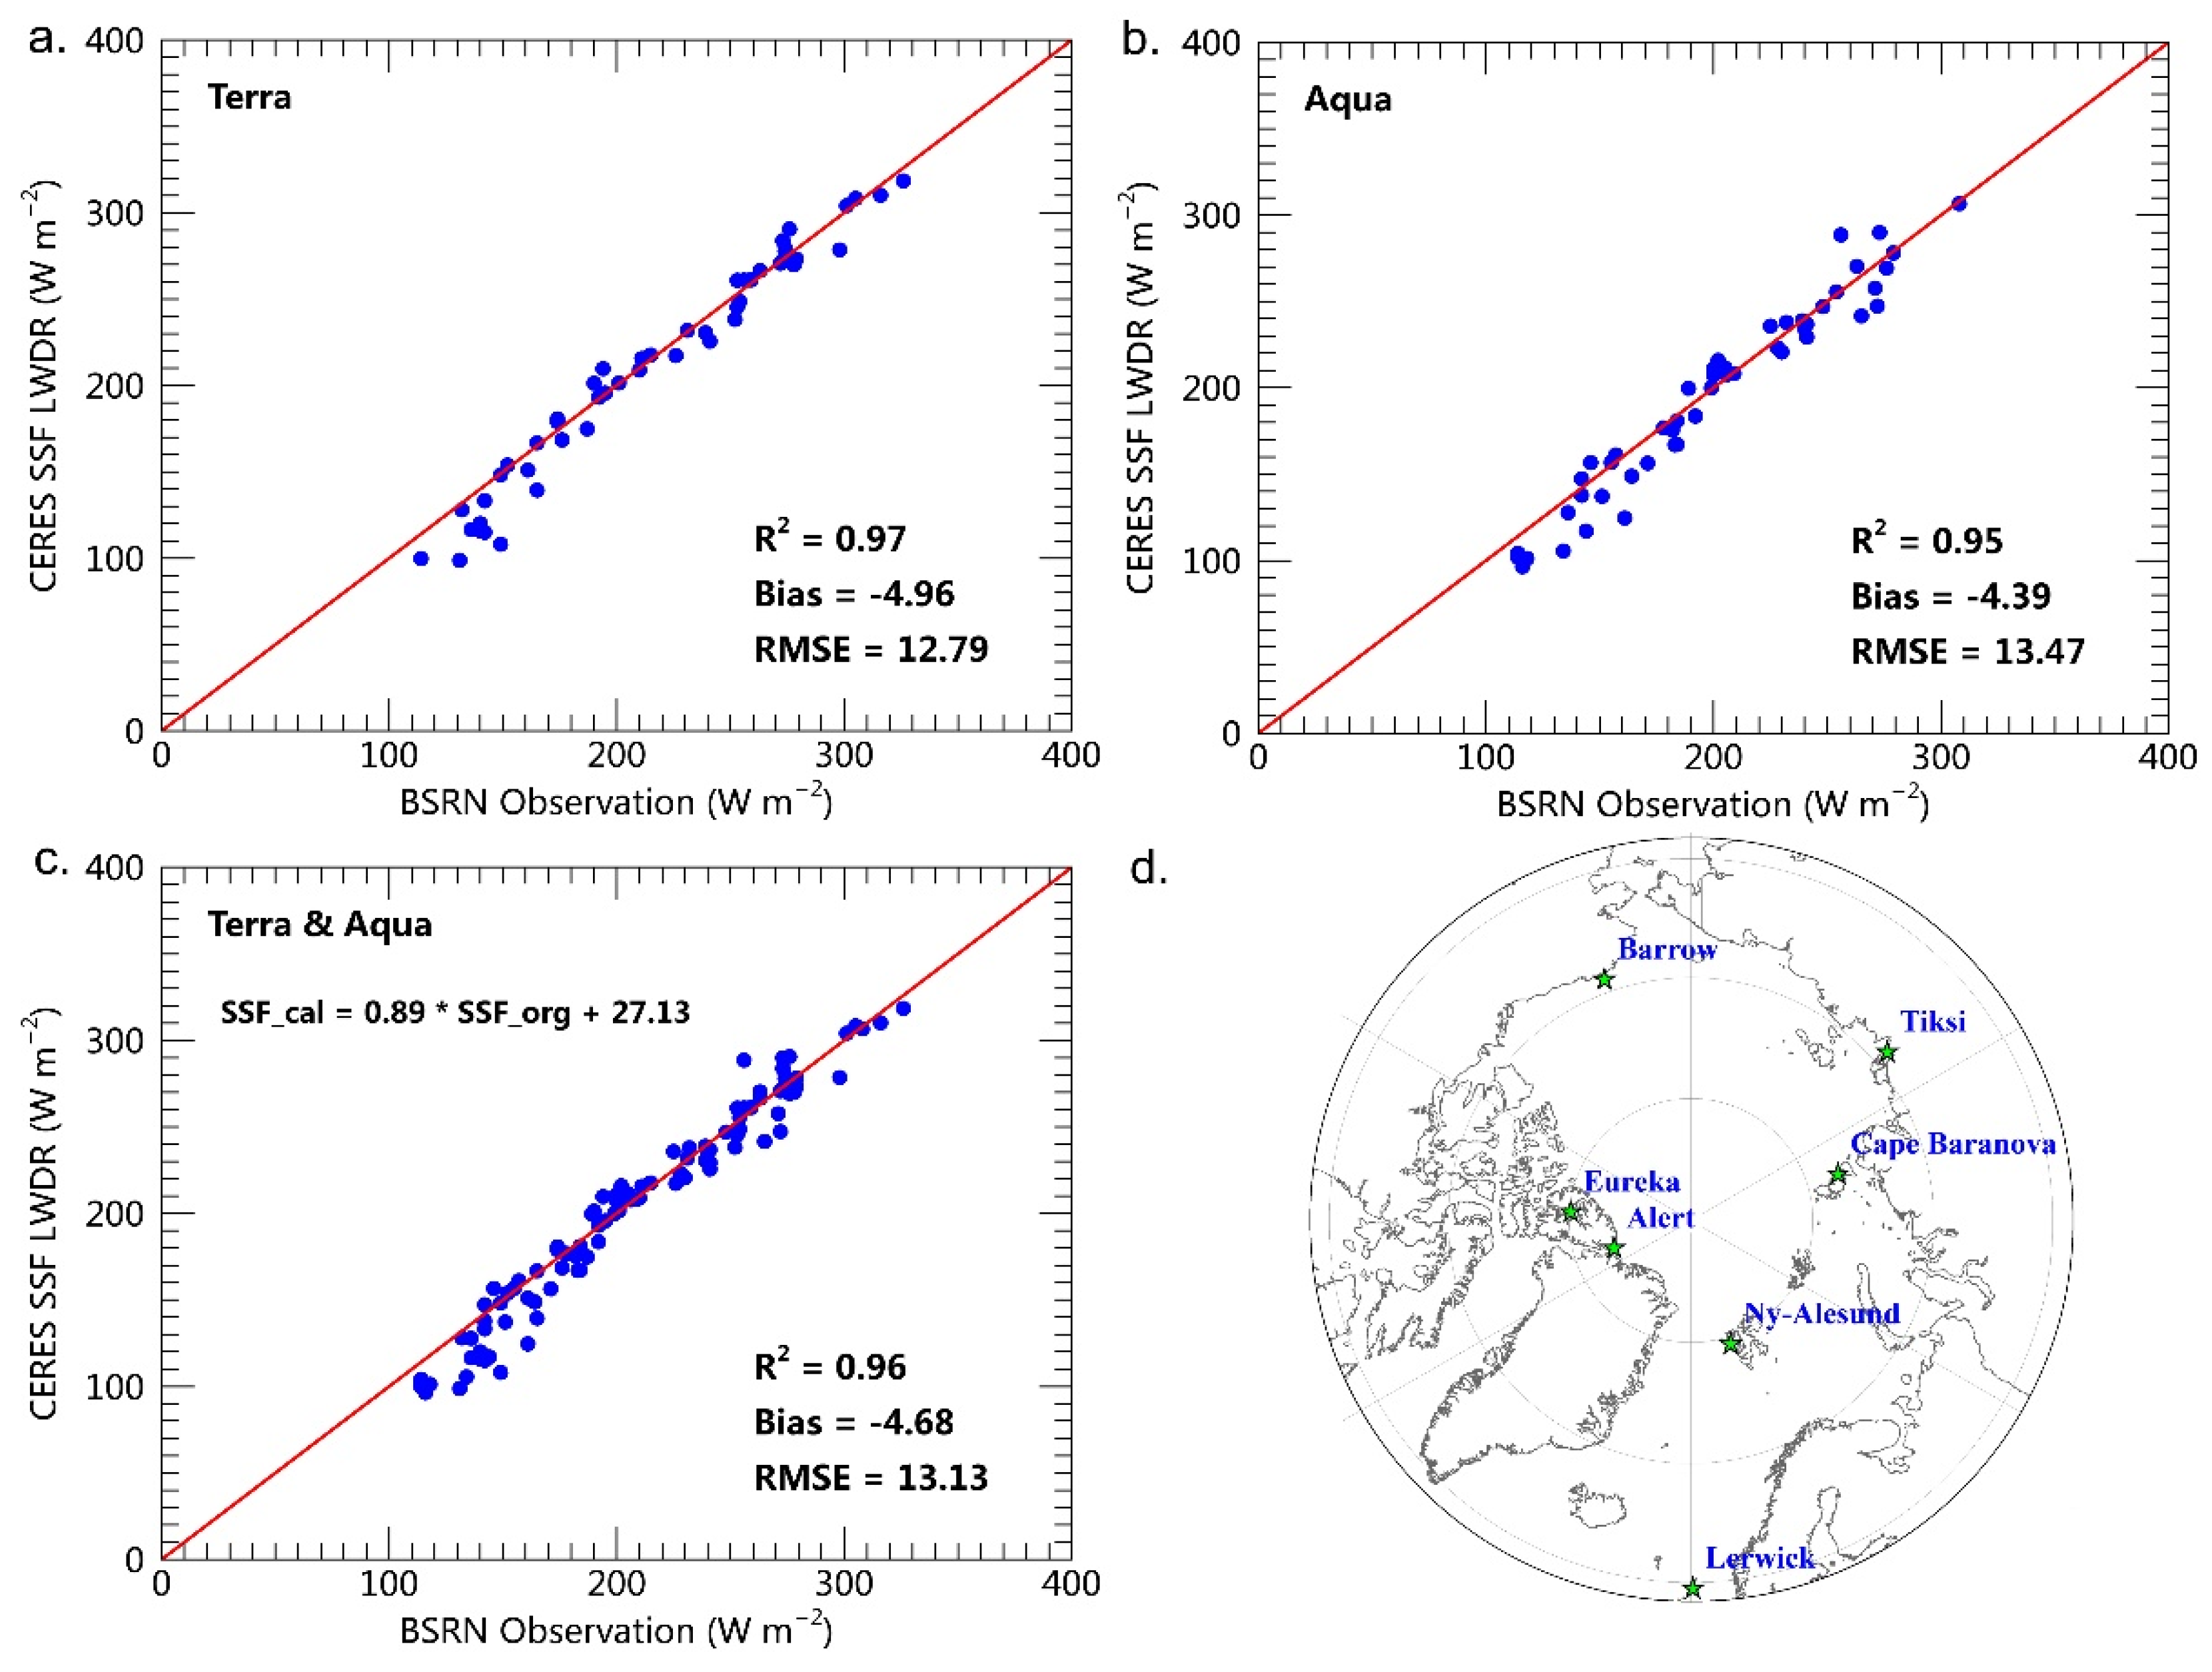
3.1. CERES SSF Calibrationion

To clarify the accuracy of the clear-sky CERES SSF FOV LWDR product in the Arctic, we first validated the product using ground measurements from 7 BSRN sites located north of 60°N (Figure 1). The evaluation results are shown in Figure 2 by scattering the spatiotemporally matched gridded SSF LWDR products and ground measurements.
It shows that the CERES SSF FOV instantaneous clear-sky LWDR products are consistent with the ground measurements in the Arctic. The overall validation metrics of R-square, RMSE, and bias of the CERES SSF FOV clear-sky LWDR data are 0.96, 13.13 W/m2, and −4.68 W/m2 (Figure 3), respectively, with 0.97, 12.79 W/m2, and −4.96 W/m2 for Terra and 0.95, 13.47 W/m2, and −4.39 W/m2 for Aqua (Figure 2), respectively. These validating metrics are very similar to the product accuracy reports in the polar regions from the science team [30]. With the paired validation samples of SSF observations and BSRN ground measurements, the calibration model of the SSF clear-sky LWDR product was also built in the Arctic and is shown in Figure 3. The original CERES SSF FOV clear-sky LWDR data were calibrated before being used as the reference data to train the ML models for estimating the FY-3D MERSI-2 clear-sky LWDR in the Arctic.

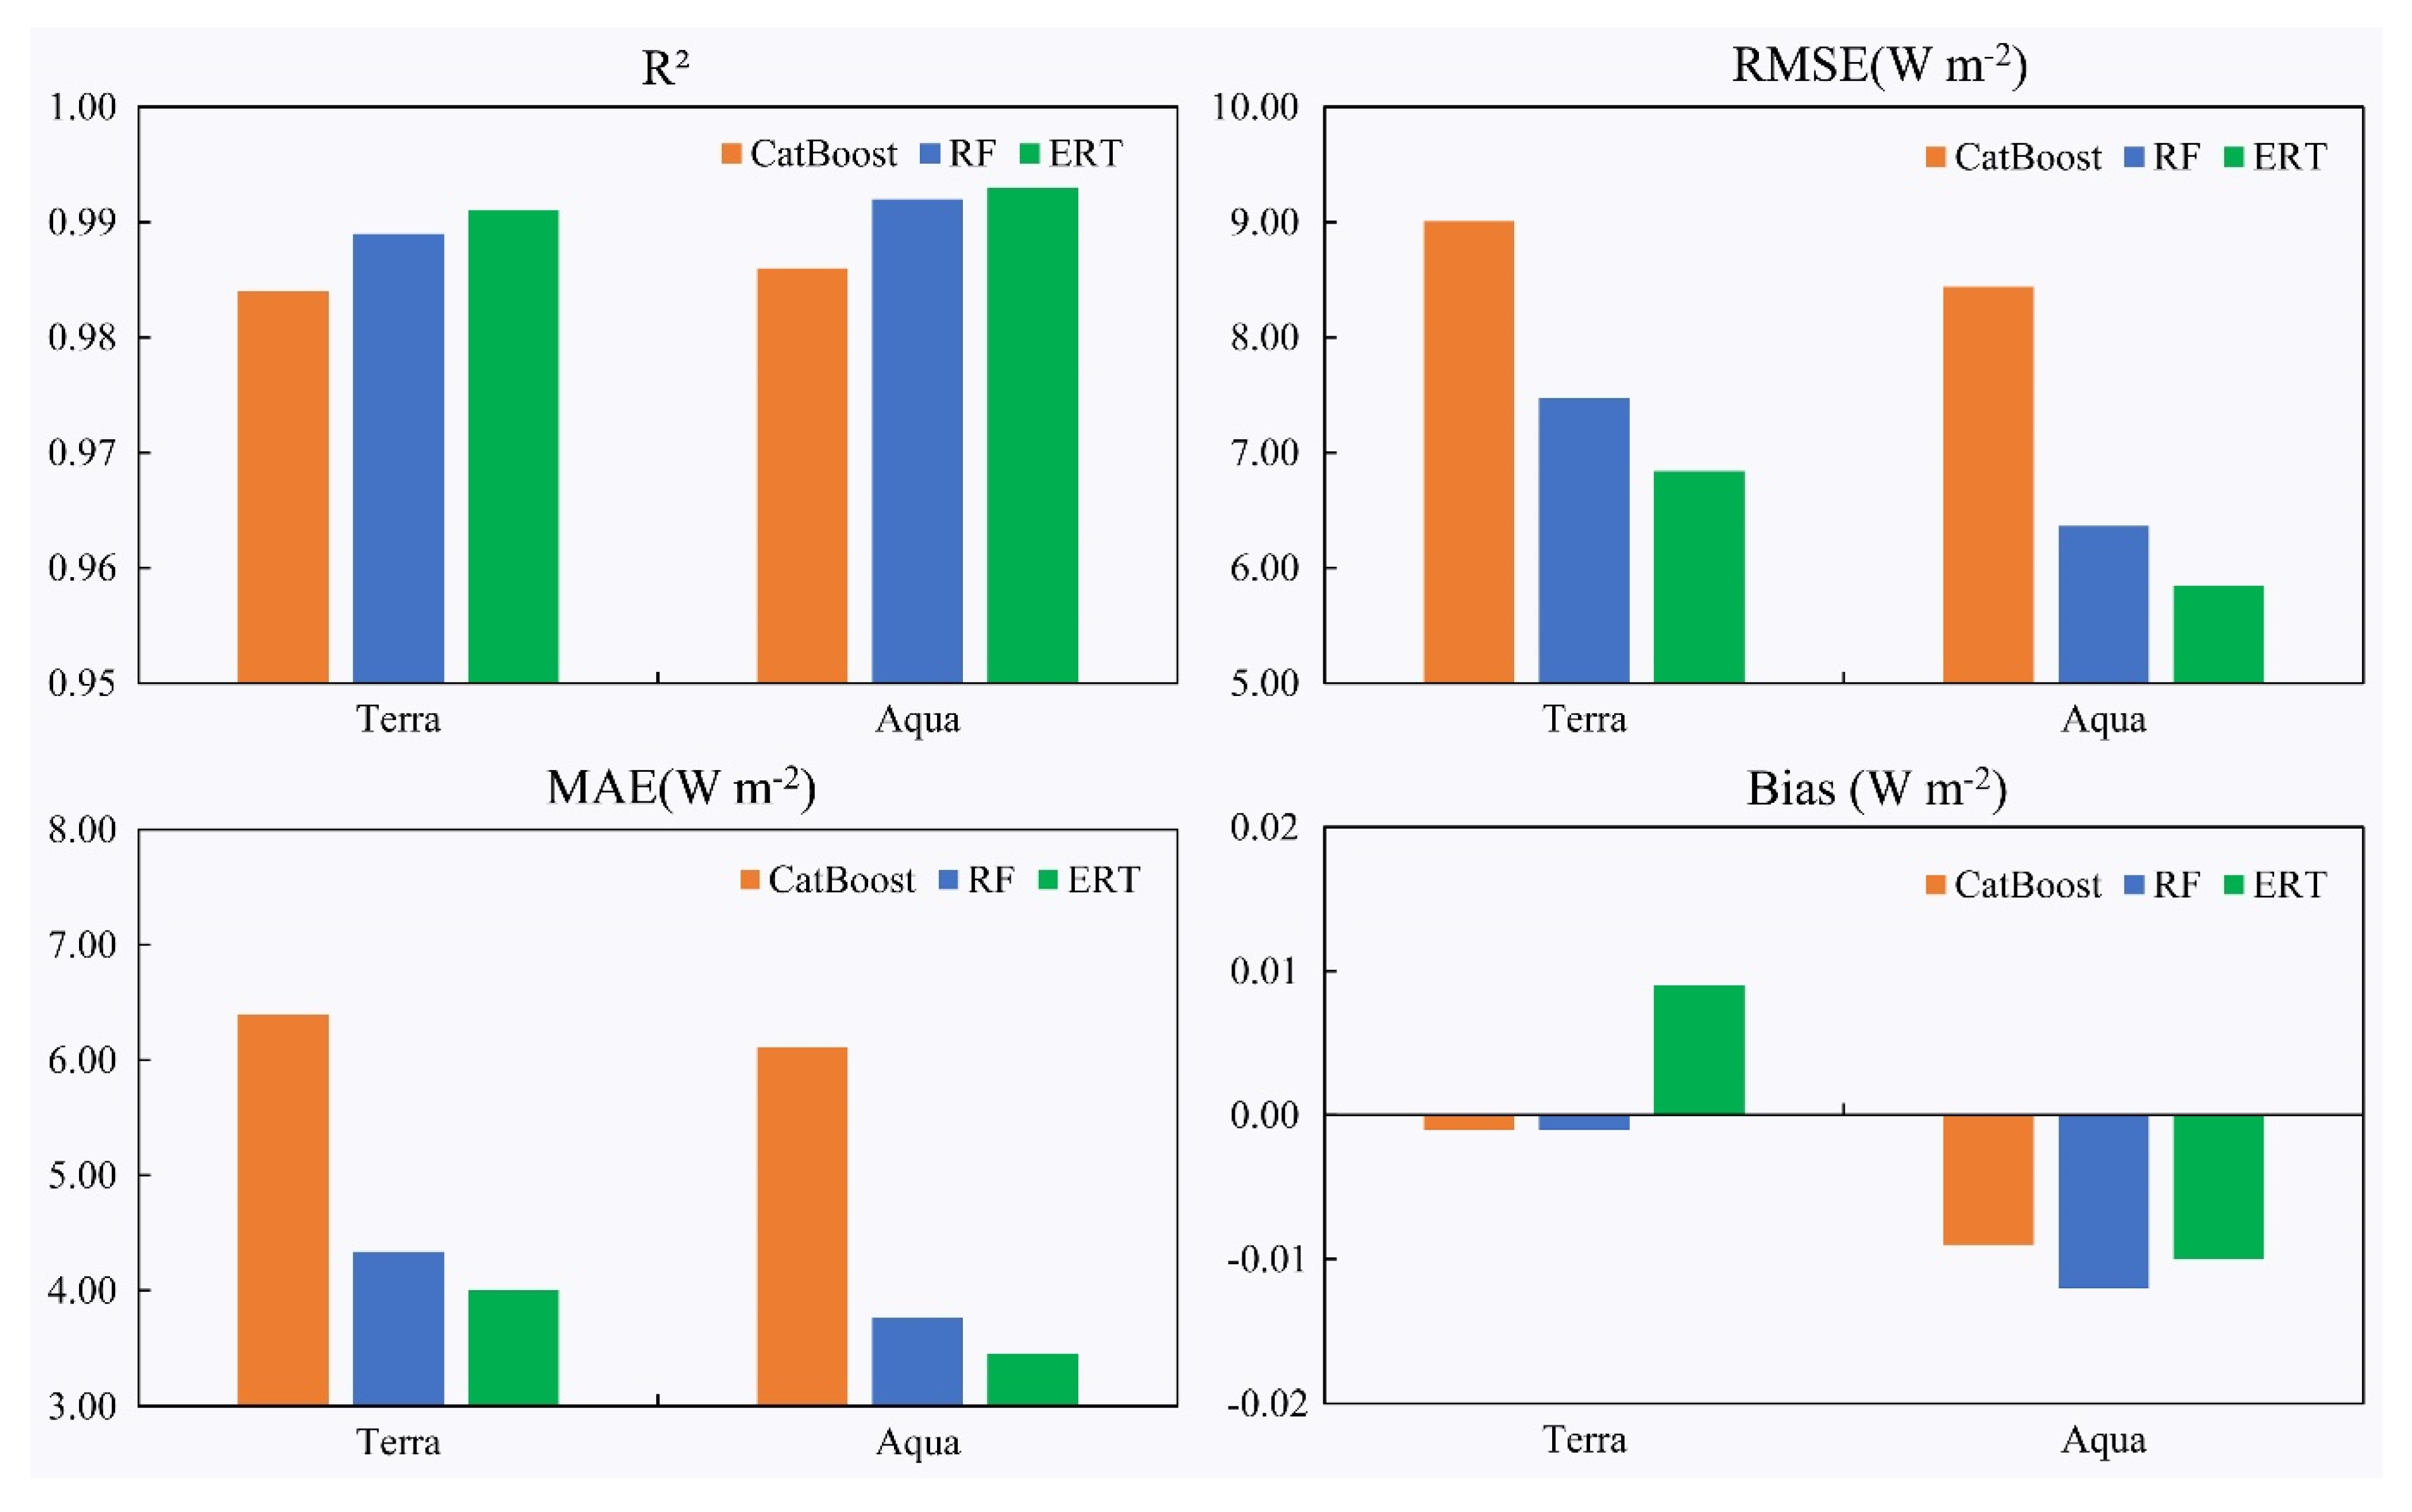
3.2. Comparison of ML Algorithms

To choose the optimal algorithm for estimating the clear-sky LWDR with MERSI-2 observations, the three alternative ML models were trained and evaluated with the paired training database. The evaluation results in terms of R2, RMSE, MAE, and bias of the three ML models are shown in Figure 3 and Table 3.
By comparing the performances of three ML algorithms for estimating clear-sky LWDR with MERSI-2 observations, we found that the ERT algorithm outperformed the RF and CatBoost algorithms and had the best accuracy in terms of RMSE and MAE (Figure 3). The results (Figure 3 and Table 3) showed that the ERT model trained with Terra and Aqua data had an accuracy with R2 values of 0.99 and 0.99, RMSE values of 6.84 W/m2 and 5.85 W/m2, and MAE values of 4.00 W/m2 and 3.45 W/m2, respectively, while the CatBoost algorithm had an accuracy with an R2 value of 0.98, an RMSE value of 9.01 W/m2, and an MAE value of 6.40 W/m2 with Terra data and an R2 value of 0.99, an RMSE value of 8.44 W/m2, and an MAE value of 6.11 W/m2 with Aqua data. However, the CatBoost algorithm provided the lowest biased estimation, and the bias of estimated LWDR based on Terra and Aqua training samples was −0.001 W/m2 and −0.009 W/m2, respectively. For the ERT algorithm, the results suggested an overall overestimation of LWDR based on Terra data and an underestimation of LWDR based on Aqua data.

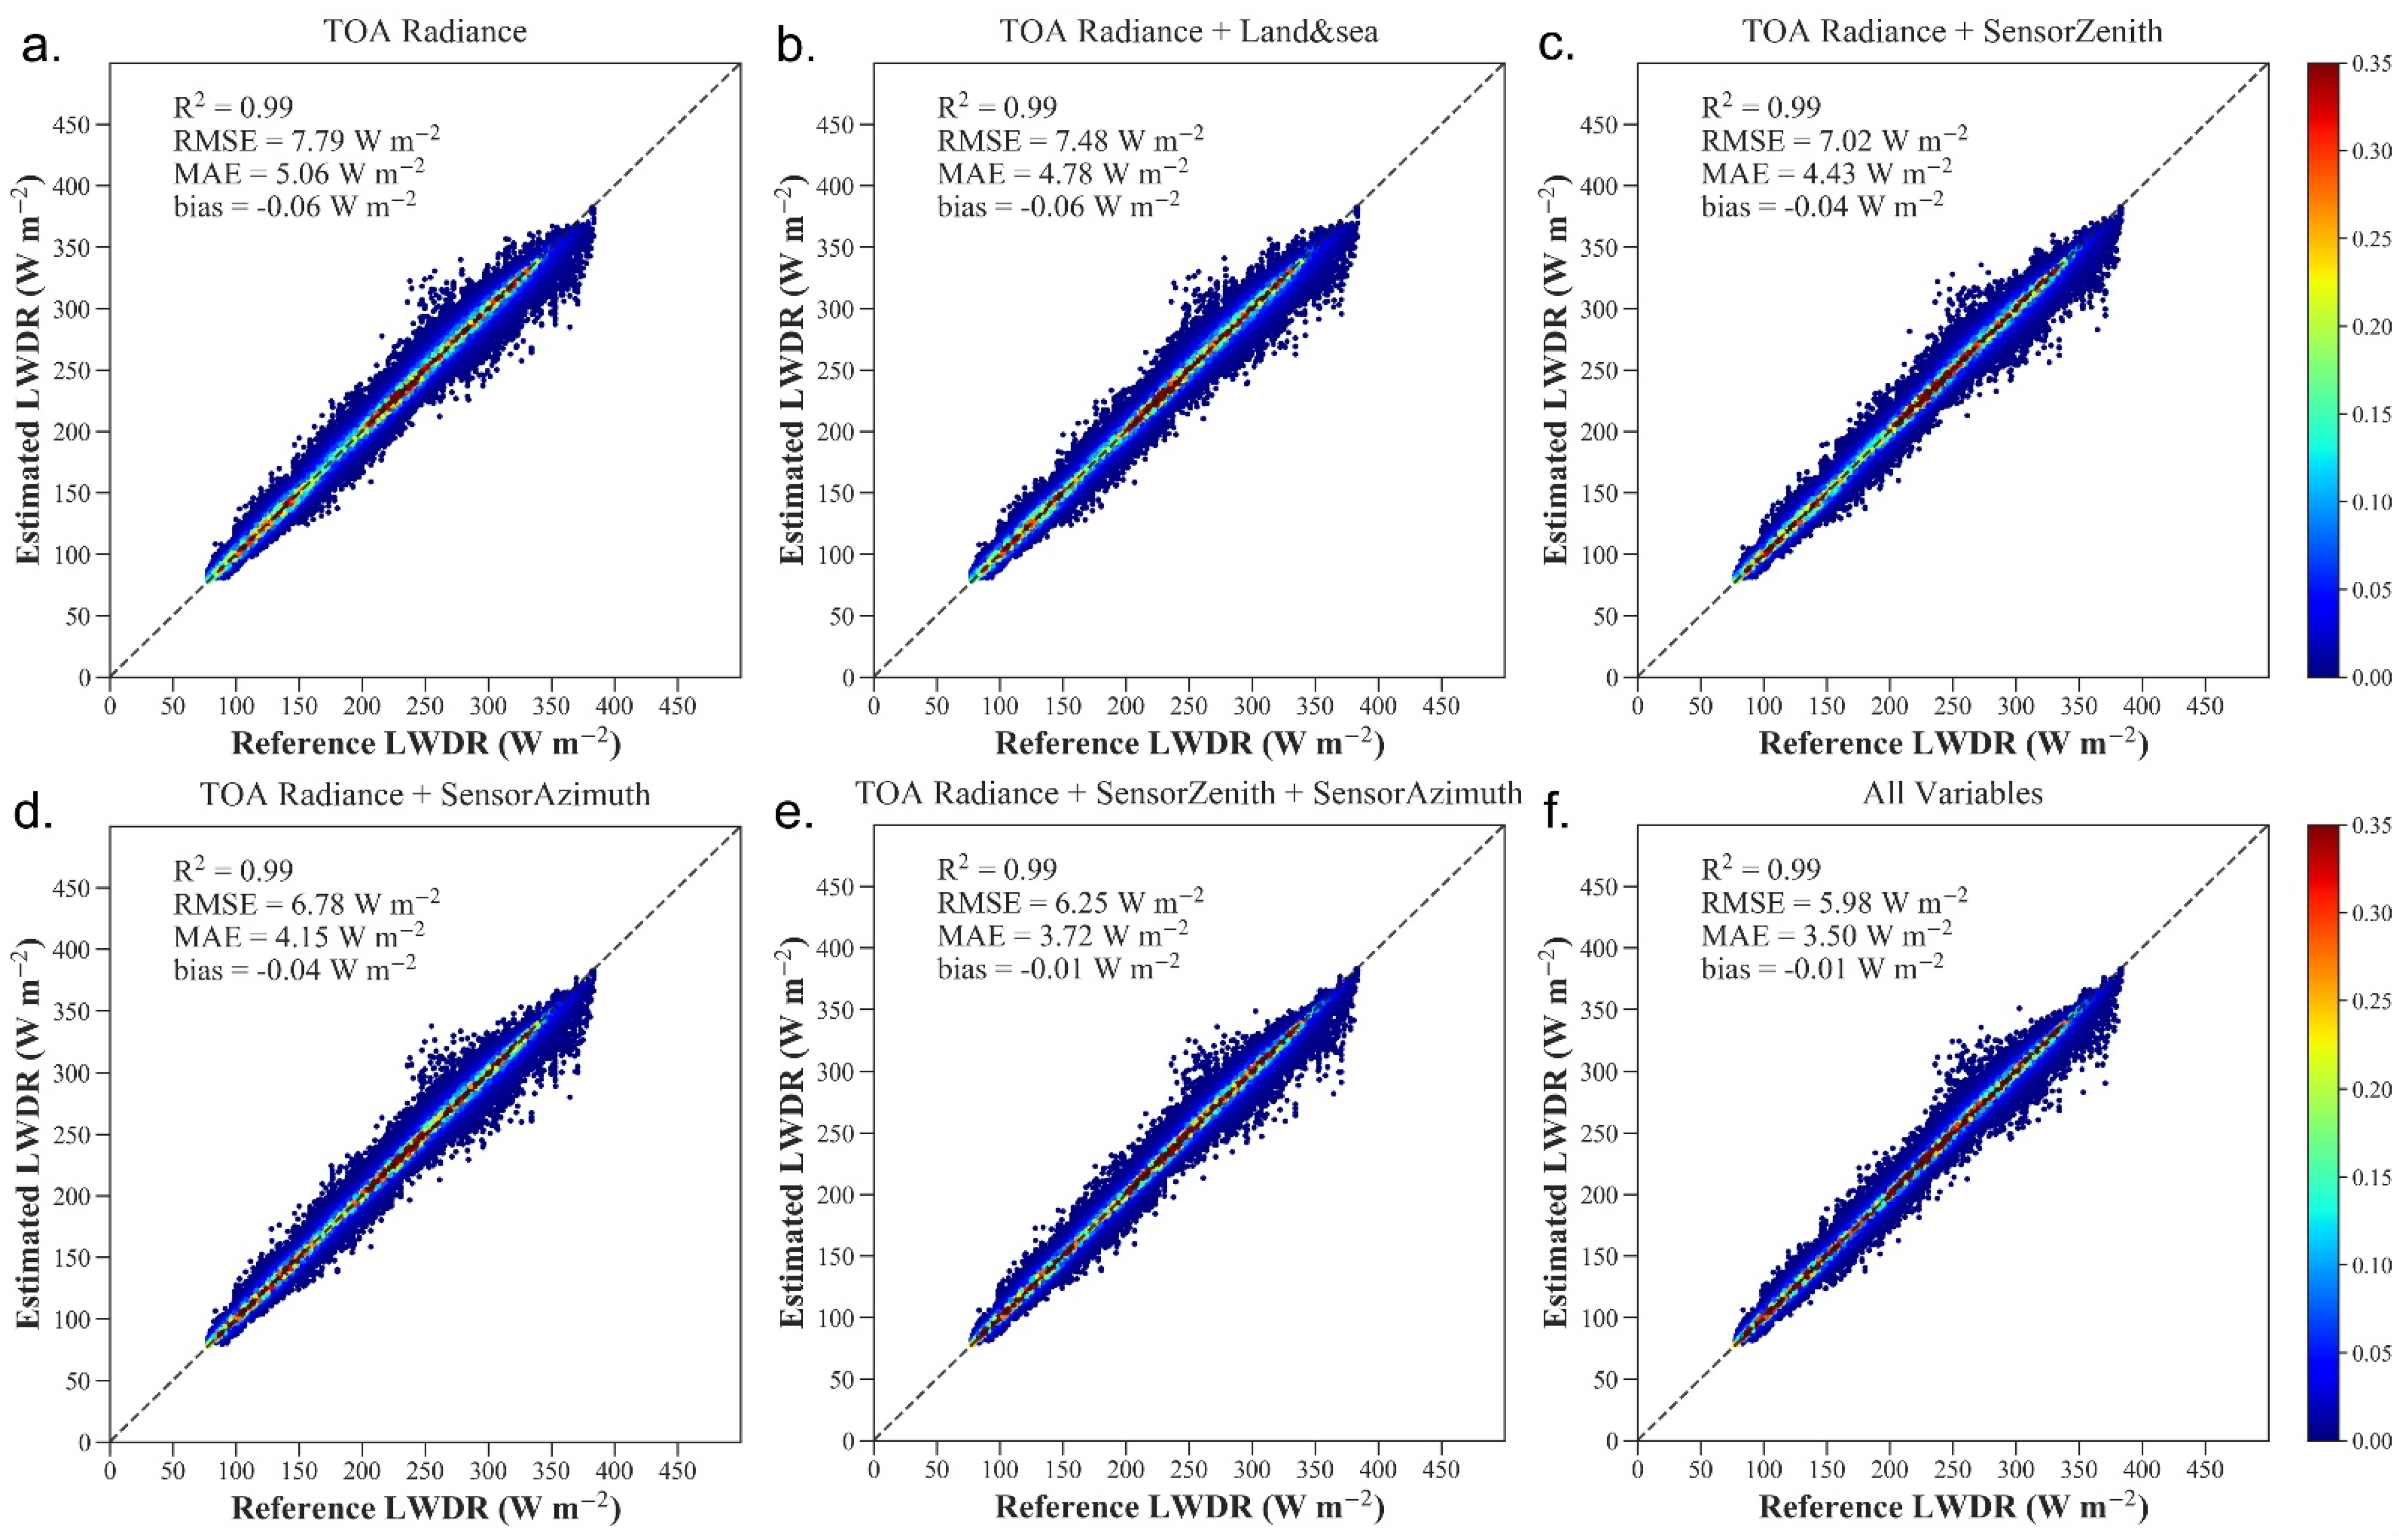
3.3. Sensitivity Analysis of Model Inputs

To determine the optimal combination of model inputs, we further analyzed the influences of different parameters on the ERT model prediction accuracy. For each model training combination scheme of the TOA radiance and other auxiliary variables, such as SZA, SAA, and land and sea, we calculated the ensemble mean of 50 running results and analyzed the contribution of different variables to the prediction accuracy of clear-sky LWDR. Figure 4 shows the evaluation of the overall prediction accuracies under different combination schemes of model inputs with all reserved samples from both Terra and Aqua. The evaluation results under different model input schemes with samples only from Terra and Aqua are shown in Table 4.
The results (Figure 4 and Table 4) indicate that all six model training schemes could achieve high estimation accuracies of clear-sky LWDR in the Arctic. The most accurate estimation results were obtained under the model input scheme with all variables, including the TOA radiance, SZA, SAA, and land and sea cover type. With only the MERSI-2 TOA radiance as model inputs, the overall estimation accuracies in terms of R2, RMSE, MAE, and bias values are 0.99, 7.79 W/m2, 5.06 W/m2, and −0.06 W/m2, respectively (Figure 4a). With the introduction of these auxiliary variables, the prediction accuracy of the ERT-based model was steadily improved. This illustrated the importance of both the TOA radiance and these auxiliary variables in estimating clear-sky LWDR [33]. This shows that auxiliary information could help improve the ERT model retrieval accuracy by approximately 1.8 W/m2 in RMSE, with approximately 1.5 W/m2 from sensor view geometries (SZA and SAA) and 0.3 W/m2 from the land and sea cover type. The final model prediction accuracy with all variables as model inputs in terms of R2, RMSE, MAE, and bias values are 0.99, 5.98 W/m2, 3.50 W/m2, and −0.01 W/m2, respectively (Figure 4f).
Although there are slight differences, the model prediction accuracies with only Terra or Aqua samples (Table 4) show similar changes to the overall training results under different combination schemes of input variables. The introduction of sensor view geometries could significantly improve the prediction ability (approximately 1.3–1.8 W/m2 in RMSE) of the ERT model. The land and sea cover variable had relatively small but nonnegligible effects (approximately 0.2–0.3 W/m2 in RMSE) on model prediction performance.
When Terra samples were used as the training data, the optimal model had an accuracy with an R2 value of 0.99, RMSE value of 6.84 W/m2, MAE value of 4.00 W/m2, and bias of 0.01 W/m2. The model prediction accuracies with paired samples from CERES SSF FOV Aqua products are relatively higher (approximately 1 W/m2 in RMSE) than those from CERES SSF FOV Aqua products.

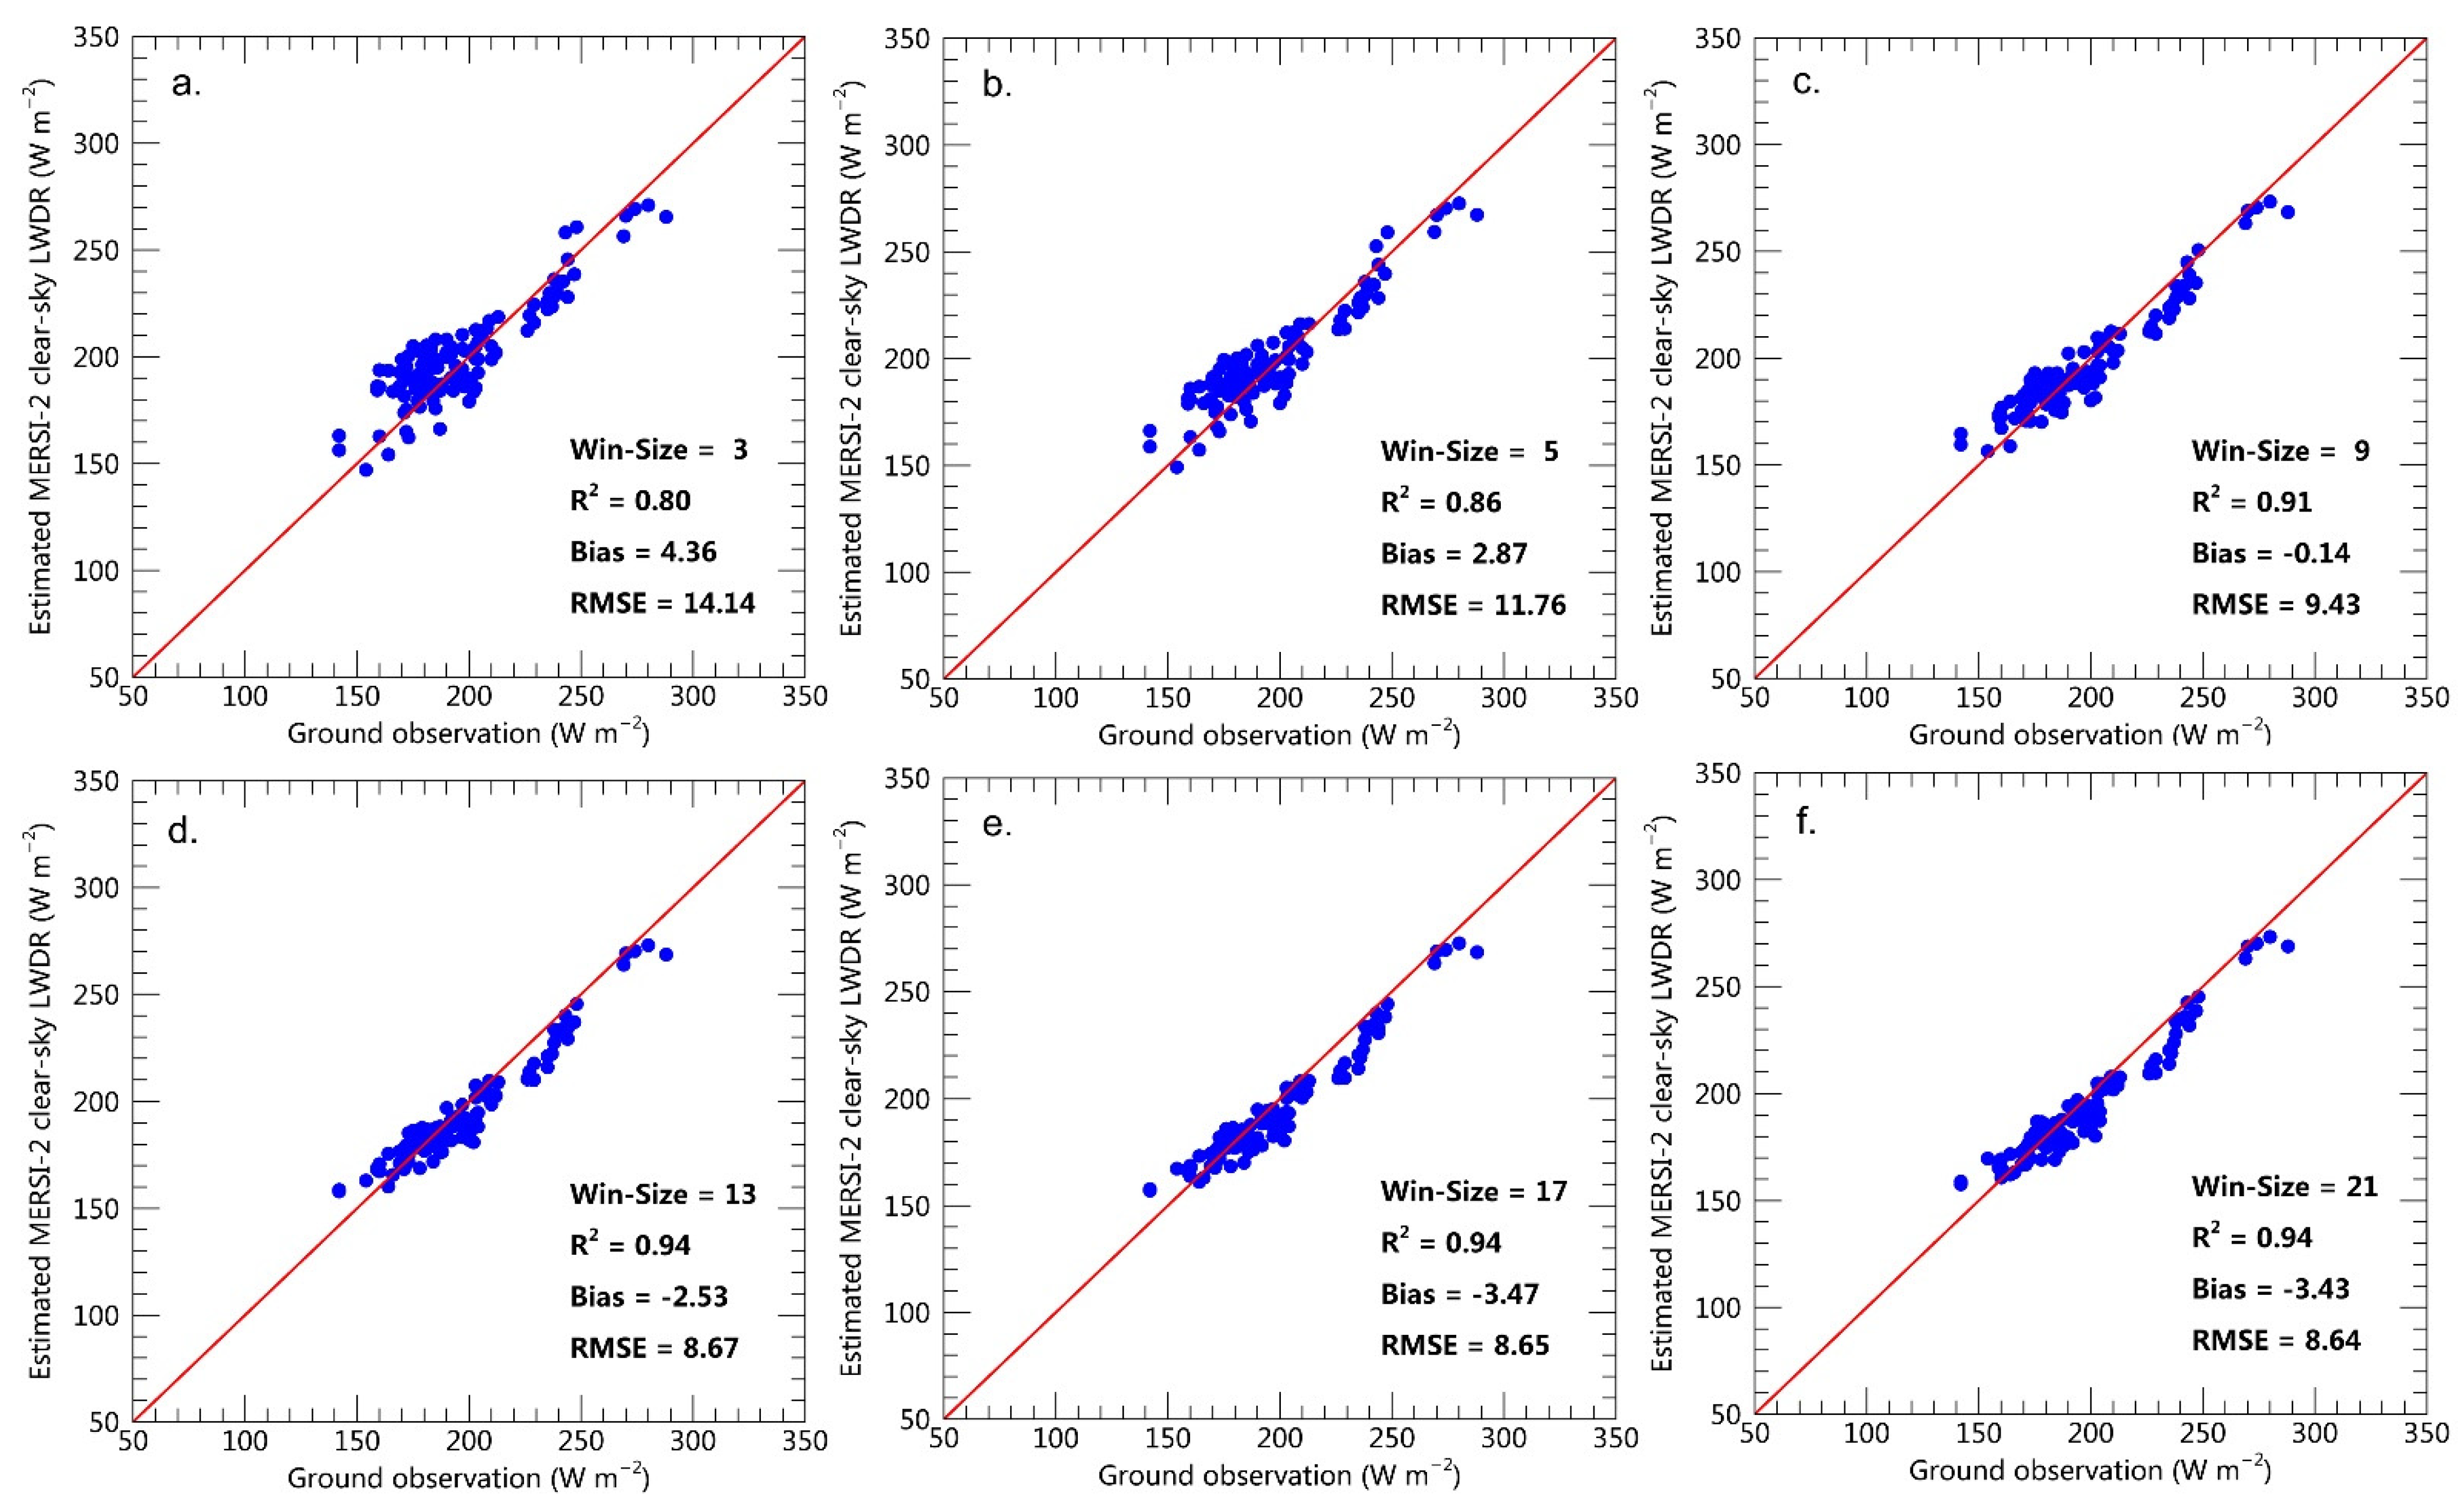
3.4. Validation of the Clear-Sky LWDR Retrievals

We produced the FY-3D MERSI-2 clear-sky instantaneous LWDR in the Arctic from June 2019 to June 2021 with the ERT model-based clear-sky estimating method. The retrieved clear-sky LWDR datasets were further validated with the BSRN ground measurements. A total of 111 ground-measured and MESI-2-estimated instantaneous LWDR samples were spatiotemporally matched and filtered under pure clear-sky conditions. The validation work was performed at a series of window sizes from 3 km to 21 km (Figure 5, Table 5).
The validation results show that the retrieved FY-3D MERSI-2 clear-sky LWDR using the ERT ML algorithm agrees well with ground observations, which demonstrates the great potential of the FY-3D MERSI-2 observations in directly estimating surface longwave radiation using ML methods. The validation accuracy of MERSI-2-retrieved clear-sky LWDR in terms of RMSE and bias is 14.14 W/m2 and 4.36 W/m2, respectively, at the 3-km neighborhood window (Figure 5a and Table 5), which is similar to the reported results of the CERES SSF FOV products in the polar region [30]. It also shows that the validation accuracy of the retrieved MERSI-2 clear-sky LWDR changes significantly as the validation window size increases. Both the RMSEs and biases decrease rapidly with increasing validation window sizes. The highest validation accuracy is 9.43 W/m2 in RMSE and −0.14 W/m2 in bias when the validation window reaches the 9 × 9 km size. When the validation window reaches the CERES FOV spatial scale (20 km), the validation accuracy of RMSE and the bias of the retrieved MERSI-2 clear-sky LWDR are 8.64 W/m2 and −3.43 W/m2, respectively, which are much lower than the validation accuracies of the CERES SSF FOV clear-sky LWDR products either calculated in this study (Figure 2c) or reported by previous studies [30].

4. Discussion

The constantly increasing LWDR was suggested to play a key role in driving Arctic wintertime warming and spring initial sea ice melting. A reliable LWDR product is essential for understanding the intrinsic physical mechanisms of the rapid changes in the Arctic climate. Many outstanding studies have been performed to estimate clear-sky LWDR with the MODIS observations. The FY-3D MERSI-2 payload was designed to be similar to the NASA MODIS in terms of spectral bands. However, very limited attention has been given to retrieving clear-sky LWDR from FY-3D MERSI-2 observations.
The target of this study is to develop an effective scheme for estimating clear-sky LWDR with Chinese FY-3D MERSI-2 TIR observations in the Arctic, where ground observations are scarce. Given the typical nonlinear dependency of clear-sky LWDR on the atmospheric temperature and water vapor profile [10,12,17,27], ML algorithms have great potential for retrieving clear-sky LWDR using atmospheric water vapor and temperature-sensitive TIR bands. Our study shows that all three ML algorithms work well in retrieving clear-sky LWDR directly from satellite-observed TOA radiances, and the ERT algorithm outperforms the other two models in terms of the training accuracy evaluation. These findings demonstrate that ML algorithms have great potential in directly retrieving the LWDR from satellite observed thermal infrared TOA radiances.
We also analyzed the sensitivity of the ML model training accuracy to the combination of TOA radiances with other auxiliary parameters and found that both the SZA and SAA have significant influences on the training accuracy of ML models. The introduction of both SZA and SAA could help to reduce the training accuracy of RMSE by approximately 1.4–1.8 W/m2. These findings highlight the necessity of integrating view geometries into the operational LWDR-estimating system.
The validation results show that the retrieval accuracy of the proposed hybrid method in this study is comparable to and even better than the recently published methods based on the NASA MODIS observations [11,12,13,16,21]. Although the MERSI-2 payload was designed similarly to the MODIS in terms of some key spectral bands, the MODIS payload have more TIR bands on sensing the surface temperature and the atmospheric water vapor. Therefore, a comparable (or even higher) retrieval accuracy could be expected by applying this method on the MODIS observations. The estimation accuracy of the MERSI-2 clear-sky LWDR at the CERES SSF FOV (20-km) spatial scale is validated to be much higher than that of the CERES SSF Edition-4A product. However, since only the Ny-Alesund station was continually working after the FY-3D observation data were available in April 2019, the 111 validation samples were all collected from the Ny-Alesund ground observations from June 2019 to June 2021. To confirm the validation accuracy of the FY-3D MERSI-2 clear-sky LWDR, more LWDR ground measurements are needed to perform further validation work.

5. Conclusions

In this study, we proposed a direct-estimation method to retrieve the clear-sky LWDR in the Arctic from the FY-3D MERSI-2 TIR TOA radiances and auxiliary information using the ERT machine learning algorithm. Given the scarcity of ground observations in the Arctic, the calibrated CERES SSF FOV clear-sky LWDR products were used as references to train and evaluate the ML models. With the MERSI-2 TOA radiance, SZA and SAA, and land and sea cover type as inputs, the ERT model achieved better training accuracy than the other two models and was applied to retrieve the clear-sky LWDR with MERSI-2 observations in the Arctic. The retrieved MERSI-2 clear-sky LWDR was further validated using BSRN in situ measurements. The MERSI-2 retrieval accuracy in terms of RMSE and bias is 14.14 W/m2 and 4.36 W/m2, respectively, which is comparable and even better than previous studies. The scale effect in evaluating the accuracy of the MERSI-2 clear-sky LWDR was also analyzed, and we found that the validating window size could significantly influence the retrieval accuracy of the MERSI-2 LWDR dataset. After aggregating to a spatial resolution of 9 km, the validation accuracy of RMSE and bias of the MERSI-2 retrievals can be reduced to 9.43 W/m2 and −0.14 W/m2, respectively. At the CERES SSF FOV spatial scale (approximately 20 km), the retrieval accuracy of MERSI-2 clear-sky LWDR can be further reduced to 8.64 W/m2. This is much higher than the reported accuracy of the CERES SSF products. This study demonstrates the feasibility of producing LWDR datasets from Chinese FY-3D MERSI-2 observations.

Author Contributions

Y.C. and Y.Z. designed the study; Y.C. led the data analysis and wrote the manuscript; M.L. and Y.Z. contributed to the data collection and date processing. All authors contributed to manuscript preparing. All authors have read and agreed to the published version of the manuscript.

Funding

This research was funded by the National Key Research and Development Program of China, grant number 2018YFC1407103 and the National Natural Science Foundation of China, grant number 41701471.

Acknowledgments

The original FY-3D MERSI-2 data was downloaded freely from http://satellite.nsmc.org.cn/PortalSite/Data/FileShow.aspx (accessed on 31 August 2021). The CERES SSF product can be collected freely from https://ceres.larc.nasa.gov/ (accessed on 30 June 2021). The BSRN ground observation data can be collected from https://bsrn.awi.de/ (accessed on 15 May 2021).

Conflicts of Interest

The authors declare no conflict of interest.

References

  1. Trenberth, K.E.; Fasullo, J.T.; Kiehl, J.T. Earth’s global energy budget. Bull. Am. Meteorol. Soc. 2009, 90, 311–324. [Google Scholar] [CrossRef]
  2. Burt, M.A.; Randall, D.A.; Branson, M.D. Dark Warming. J. Clim. 2015, 29, 705–719. [Google Scholar] [CrossRef]
  3. Cao, Y.; Liang, S.; Chen, X.; He, T.; Wang, D.; Cheng, X. Enhanced wintertime greenhouse effect reinforcing Arctic amplification and initial sea-ice melting. Sci. Rep. 2017, 7, 8462. [Google Scholar] [CrossRef] [PubMed] [Green Version]
  4. Park, H.-S.; Lee, S.; Kosaka, Y.; Son, S.-W.; Kim, S.-W. The Impact of Arctic Winter Infrared Radiation on Early Summer Sea Ice. J. Clim. 2015, 28, 6281–6296. [Google Scholar] [CrossRef]
  5. Bintanja, R.; Graversen, R.G.; Hazeleger, W. Arctic winter warming amplified by the thermal inversion and consequent low infrared cooling to space. Nat. Geosci. 2011, 4, 758–761. [Google Scholar] [CrossRef]
  6. Pithan, F.; Mauritsen, T. Arctic amplification dominated by temperature feedbacks in contemporary cliamte models. Nat. Geosci. 2014, 7, 181–184. [Google Scholar] [CrossRef]
  7. Kapsch, M.-L.; Graversen, R.G.; Tjernström, M. Springtime atmospheric energy transport and the control of Arctic summer sea-ice extent. Nat. Clim. Chang. 2013, 3, 744–748. [Google Scholar] [CrossRef]
  8. Liang, S.; Wang, D.; He, T.; Yu, Y. Remote sensing of earth’s energy budget: Synthesis and review. Int. J. Digit. Earth 2019, 12, 737–780. [Google Scholar] [CrossRef] [Green Version]
  9. Ma, Q.; Wang, K.; Wild, M. Evaluations of atmospheric downward longwave radiation from 44 coupled general circulation models of CMIP5. J. Geophys. Res. Atmos. 2014, 119, 4486–4497. [Google Scholar] [CrossRef]
  10. Wang, K.; Dickinson, R.E. Global atmospheric downward longwave radiation at the surface from ground-based observations, satellite retrievals, and reanalyses. Rev. Geophys. 2013, 51, 150–185. [Google Scholar] [CrossRef]
  11. Cheng, J.; Liang, S.; Wang, W.; Guo, Y. An efficient hybrid method for estimating clear—Sky surface downward longwave radiation from MODIS data. J. Geophys. Res. Atmos. 2016, 122, 2616–2630. [Google Scholar] [CrossRef]
  12. Zhou, W.; Shi, J.C.; Wang, T.X.; Peng, B.; Husi, L.; Yu, Y.C.; Zhao, R. New Methods for Deriving Clear-Sky Surface Longwave Downward Radiation Based on Remotely Sensed Data and Ground Measurements. Earth Space Sci. 2019, 6, 2071–2086. [Google Scholar] [CrossRef] [Green Version]
  13. Wang, T.; Yan, G.; Chen, L. Consistent retrieval methods to estimate land surface shortwave and longwave radiative flux components under clear-sky conditions. Remote Sens. Environ. 2012, 124, 61–71. [Google Scholar] [CrossRef]
  14. Wang, T.; Shi, J.; Ma, Y.; Letu, H.; Li, X. All-sky longwave downward radiation from satellite measurements: General parameterizations based on LST, column water vapor and cloud top temperature. ISPRS J. Photogramm. Remote Sens. 2020, 161, 52–60. [Google Scholar] [CrossRef]
  15. Carmona, F.; Rivas, R.; Caselles, V. Estimation of daytime downward longwave radiation under clear and cloudy skies conditions over a sub-humid region. Theor. Appl. Climatol. 2013, 115, 281–295. [Google Scholar] [CrossRef]
  16. Wang, W.; Liang, S. Estimation of high-spatial resolution clear-sky longwave downward and net radiation over land surfaces from MODIS data. Remote Sens. Environ. 2009, 113, 745–754. [Google Scholar] [CrossRef]
  17. Wang, W.; Liang, S. A Method for Estimating Clear-Sky Instantaneous Land-Surface Longwave Radiation With GOES Sounder and GOES-R ABI Data. IEEE Geosci. Remote Sens. Lett. 2010, 7, 708–712. [Google Scholar] [CrossRef]
  18. Cheng, J.; Liang, S.; Wang, W. Surface Downward Longwave Radiation. Compr. Remote Sens. 2018, 5, 196–216. [Google Scholar]
  19. Feng, C.; Zhang, X.; Wei, Y.; Zhang, W.; Hou, N.; Xu, J.; Jia, K.; Yao, Y.; Xie, X.; Jiang, B.; et al. Estimating Surface Downward Longwave Radiation Using Machine Learning Methods. Atmosphere 2020, 11, 1147. [Google Scholar] [CrossRef]
  20. Yang, F.; Cheng, J. A framework for estimating cloudy sky surface downward longwave radiation from the derived active and passive cloud property parameters. Remote Sens. Environ. 2020, 248, 111972. [Google Scholar] [CrossRef]
  21. Zhou, W.; Shi, J.; Wang, T.; Peng, B.; Zhao, R.; Yu, Y. Clear-Sky Longwave Downward Radiation Estimation by Integrating MODIS Data and Ground-Based Measurements. IEEE J. Sel. Top. Appl. Earth Obs. Remote Sens. 2019, 12, 450–459. [Google Scholar] [CrossRef]
  22. Tang, K.; Zhu, H.; Ni, P.; Li, R.; Fan, C. Retrieving Land Surface Temperature From Chinese FY-3D MERSI-2 Data Using an Operational Split Window Algorithm. IEEE J. Sel. Top. Appl. Earth Obs. Remote Sens. 2021, 14, 6639–6651. [Google Scholar] [CrossRef]
  23. Belgiu, M.; Drăguţ, L. Random forest in remote sensing: A review of applications and future directions. ISPRS J. Photogramm. Remote Sens. 2016, 114, 24–31. [Google Scholar] [CrossRef]
  24. Carter, C.; Liang, S. Evaluation of ten machine learning methods for estimating terrestrial evapotranspiration from remote sensing. Int. J. Appl. Earth Obs. Geoinf. 2019, 78, 86–92. [Google Scholar] [CrossRef]
  25. Wang, L.; Zhang, Y.; Yao, Y.; Xiao, Z.; Shang, K.; Guo, X.; Yang, J.; Xue, S.; Wang, J. GBRT-Based Estimation of Terrestrial Latent Heat Flux in the Haihe River Basin from Satellite and Reanalysis Datasets. Remote Sens. 2021, 13, 1054. [Google Scholar] [CrossRef]
  26. Zhang, Y.; Ma, J.; Liang, S.; Li, X.; Li, M. An Evaluation of Eight Machine Learning Regression Algorithms for Forest Aboveground Biomass Estimation from Multiple Satellite Data Products. Remote Sens. 2020, 12, 4015. [Google Scholar] [CrossRef]
  27. Kratz, D.P.; Gupta, S.K.; Wilber, A.C.; Sothcott, V.E. Validation of the CERES Edition 2B Surface-Only Flux Algorithms. J. Appl. Meteorol. Climatol. 2010, 49, 164–180. [Google Scholar] [CrossRef]
  28. Luo, M.; Wang, Y.; Xie, Y.; Zhou, L.; Qiao, J.; Qiu, S.; Sun, Y. Combination of Feature Selection and CatBoost for Prediction: The First Application to the Estimation of Aboveground Biomass. Forests 2021, 12, 216. [Google Scholar] [CrossRef]
  29. Azpiroz, I.; Oses, N.; Quartulli, M.; Olaizola, I.G.; Guidotti, D.; Marchi, S. Comparison of Climate Reanalysis and Remote-Sensing Data for Predicting Olive Phenology through Machine-Learning Methods. Remote Sens. 2021, 13, 1224. [Google Scholar] [CrossRef]
  30. Kratz, D.P.; Gupta, S.K.; Wilber, A.C.; Sothcott, V.E. Validation of the CERES Edition-4A Surface-Only Flux Algorithms. J. Appl. Meteorol. Climatol. 2020, 59, 281–295. [Google Scholar] [CrossRef]
  31. Ohmura, A.; Dutton, E.G.; Forgan, B.; Fröhlich, C.; Gilgen, H.; Hegner, H.; Heimo, A.; König-Langlo, G.; McArthur, B.; Müller, G.; et al. Baseline Surface Radiation Network (BSRN_WCRP): New Precision Radiometry for Climate Research. Bull. Am. Meteorol. Soc. 1998, 79, 2115–2136. [Google Scholar] [CrossRef] [Green Version]
  32. Geurts, P.; Ernst, D.; Wehenkel, L. Extremely randomized trees. Mach. Learn. 2006, 63, 3–42. [Google Scholar] [CrossRef] [Green Version]
  33. Liang, S.; Wang, K.; Zhang, X.; Wild, M. Review on Estimation of Land Surface Radiation and Energy Budgets From Ground Measurement, Remote Sensing and Model Simulations. IEEE J. Sel. Top. Appl. Earth Obs. Remote Sens. 2010, 3, 225–240. [Google Scholar] [CrossRef]
Figure 1. Flowchart of this study for estimating clear-sky LWDR from FY-3D MERSI-2 data using ML techniques.
Remotesensing 14 00606 g001
Figure 2. Validation of the CERES SSF FOV clear-sky LWDR products using the BSRN ground measurements at the 7 BSRN sites in the Arctic. (ac) are the validation results for the clear-sky LWDR of the Terra, Aqua, and both payloads, respectively. (d) shows the locations of all 7 BSRN sites in the Arctic.
Remotesensing 14 00606 g002
Figure 3. Comparison of the training accuracy metrics of the three ML algorithms using both Terra and Aqua samples.
Remotesensing 14 00606 g003
Figure 4. Evaluation of the ERT model prediction accuracy under different combination schemes of input variables. (af) indicates the specific scheme of input variables. The evaluation work was performed with the 20% reserved paired samples.
Remotesensing 14 00606 g004
Figure 5. Correlations of the FY-3D MERSI-2 clear-sky instantaneous LWDR integrated at different window sizes to the BSRN ground measurements. (af) shows the validating results of the FY-3D MERSI-2 clear-sky LWDR at different window sizes (3 km, 5 km, 9 km, 13 km, 17 km, and 21 km, respectively). The red line is the 1:1 line.
Remotesensing 14 00606 g005
Table 1. Intercomparison of the TIR bands between the MERSI-2 and MODIS payload.
MERSI-2MODIS
Band No.Central Wavelength (μm)Primary PurposeBand No.Central Wavelength (μm)Primary Purpose
203.80surface, cloud temperature203.75surface, cloud temperature
214.05234.05
227.20atmospheric water vapor287.325atmospheric water vapor
238.55298.55
2410.80surface temperature3111.03surface temperature
2512.03212.02
Table 2. A brief summary of the information of the 7 BSRN sites located in the Arctic.
Site NameLableElevation (m)Time CoverageLand Cover
AlertALE127August 2004–June 2014tundra
BarrowBAR8January 1992–August 2017grass
Cape BaranovaCAP-/-January 2016–December 2016tundra
EurekaEUR85September 2007–December 2011tundra
LerwickLER80January 2001–July 2017grass
Ny-AlesundNYA11July 1992–Currenttundra
TiksiTIK48June 2010–March 2018tundra
Table 3. Comparison of the training accuracy of the three ML algorithms using both Terra and Aqua samples. Different from other metrics, we retained three significant digits after the decimal point for the bias because the values are too small. The units of the RMSE, MAE, and bias metrics are W/m2.
ML ModelTerraAqua
R2RMSEMAEBiasR2RMSEMAEBias
RF0.997.484.34−0.0010.996.363.78−0.012
ERT0.996.844.000.0090.995.853.45−0.010
CatBoost0.989.016.40−0.0010.998.446.11−0.009
Table 4. Comparison of the ERT model training accuracies with samples from Terra and Aqua on different combination schemes of input variables. The units of RMSE, MAE, and bias metrics are W/m2.
Model InputsTerraAqua
R2RMSEMAEBiasR2RMSEMAEBias
TOA radiance0.988.855.67−0.050.997.474.88−0.03
TOA radiance, Land&sea0.998.635.49−0.030.997.144.59−0.05
TOA radiance, SZA0.997.864.86−0.030.996.824.32−0.01
TOA radiance, SAA0.997.864.77−0.040.996.574.05−0.02
TOA radiance, SZA, SAA0.997.074.17−0.030.996.133.680.01
All0.996.844.00−0.010.995.853.45−0.01
Table 5. Validation accuracies of the MERSI-2 clear-sky LWDR at different neighborhood window sizes with BSRN ground observations. The units of RMSE and bias metrics are W/m2.
Window Size (N × N km)
3579111315171921
R20.800.860.890.910.930.940.940.940.940.94
RMSE14.1411.7610.399.438.878.678.628.658.658.64
Bias4.362.871.34−0.14−1.49−2.53−3.17−3.47−3.48−3.43
Publisher’s Note: MDPI stays neutral with regard to jurisdictional claims in published maps and institutional affiliations.

