Article

Decoupling Relationship between Urbanization and Carbon Sequestration in the Pearl River Delta from 2000 to 2020

1
Key Laboratory for Urban Habitat Environmental Science and Technology, School of Urban Planning and Design, Peking University, Shenzhen 518055, China
2
Laboratory for Earth Surface Processes, Ministry of Education, College of Urban and Environmental Sciences, Peking University, Beijing 100871, China
*
Author to whom correspondence should be addressed.
Remote Sens. 2022, 14(3), 526; https://doi.org/10.3390/rs14030526
Submission received: 4 January 2022 / Revised: 16 January 2022 / Accepted: 18 January 2022 / Published: 22 January 2022
(This article belongs to the Section Urban Remote Sensing)

Abstract

:
Rapid urbanization has a significant impact on the ecological environment. Net primary productivity (NPP) can effectively reflect the growth of urban vegetation and the carbon sequestration capacity of an ecosystem. Taking the rapidly growing Pearl River Delta (PRD) as our study area, the relative contributions of human activities and climate change to NPP were analyzed using an improved two-step method based on residual trend analysis. The decoupling index was used to compare the coordinated development of socioeconomic factors and the NPP in different time periods. This study lays the foundation for formulating comprehensive and reasonable urban low-carbon development measures. The results showed that (1) NPP decreased significantly before 2010, but by 2019, NPP in most regions of the PRD showed a slight increase. The NPP of new urban land was better than that of original urban land. (2) The negative contribution of climatic factors to NPP was clearer than that of human activities, and human activities contributed positively to NPP outside urban land. (3) The decoupling status of socioeconomic factors and NPP is improving, and the degree of decoupling in 2010–2019 was higher than that in 2000–2010. In conclusion, as the first forest urban agglomeration in China, the PRD has shown a good implementation of carbon sequestration policies, which can provide a reference for the coordinated development of urbanization and carbon sequestration.

1. Introduction

Net primary productivity (NPP) represents the amount of CO2 net absorbed by green plants and is derived from CO2 absorbed by photosynthesis minus CO2 released by respiration. NPP can directly reflect the carbon sequestration capacity of terrestrial ecosystems. It not only is an important part of the global carbon cycle, but also has an important role in maintaining climate stability [1,2]. Climatic factors and human activities are important drivers of change in NPP [3,4,5,6], and urban expansion is the main driving force of change in NPP [7,8,9]. Although positive changes in precipitation, solar radiation, and temperature are favorable for increasing NPP [5,10], expansion of construction land and a sharp increase in population density in metropolises may offset the positive effects of climate change on NPP [5,11]. Therefore, to assist governments and planners in exploring new low-carbon sustainable urban development strategies to realize the progress of the social economy and ecological civilization, a quantification of the coupling relationship between urban development and NPP as well as the temporal and spatial changes is urgently needed.
In the process of urban expansion, human activities perform an important role in controlling changes in NPP by changing the biogeochemical cycle and photosynthetic productivity potential of the ecosystem [12,13,14,15]. Human activities, such as overgrazing and land reclamation, occupy ecological space [8,16,17,18], and changes in land cover type, such as the conversion of greenbelt forest to construction land, directly lead to the deterioration of NPP [19,20,21]. However, ecological protection measures, such as carbon sequestration, afforestation, and conversion of farmland to forest, increase vegetation coverage, contribute to increasing NPP, and enhance the ability of an ecosystem to resist disturbance [22,23,24]. In the early stage of reform and opening up, China’s awareness of ecological protection was low, and urban expansion depended on reduced vegetation coverage, leading to the continuous deterioration of NPP. This was likely to change the structure, function, and services of the ecosystem, resulting in serious ecological degradation and long-term economic losses. After 2000, the concept of “ecological civilization construction” has been put forward with the basic tenet of harmonious coexistence, virtuous cycle, all-round development, and sustainable prosperity between man and nature, man and man, man and society. The popularization of concepts such as “ecological civilization construction” “carbon neutrality” and “low-carbon city” promoted the setting and implementation of ecology-related measures, which enabled the recovery of local ecosystems and provided a foundation for improving NPP.
Many studies have used multiple methods to determine NPP trends and their drivers [25,26]. The combined Theil–Sen slope trend analysis and Mann–Kendall test (SEN+MK) are widely used to detect the trend of spatial variation in NPP. They can eliminate the noise of original data and are very robust [27,28]. To separate the effects of climate and human activities on vegetation, the residual trend method (RESTREND) is widely used to quantify the impact of human activities on vegetation using the remnants of multiple regressions between climatic factors and NPP [29,30,31]. Existing studies based on RESREND have separated vegetation that is only affected by climate change from other vegetation to analyze the relative contributions of climate change and human activities to vegetation more accurately. However, these studies have only analyzed the changes and driving factors of NPP from an ecological perspective [10], whereas here, we improved a proposed two-step method to highlight the impact of urban expansion on NPP.
In addition to analyzing the changing trend of NPP and its driving factors, it is necessary to study the correlation between NPP and socioeconomic factors during rapid urbanization [8,32]. This will not only improve our understanding of human disturbance to ecosystems, but also motivate relevant institutions to take appropriate measures to reduce the impact of urban development on carbon sequestration services. Most studies on NPP and urban expansion are based on urban land area and analyze the impact of urban expansion on NPP [12,33,34], and few studies have combined NPP with urban development by introducing social and economic factors. However, China’s urban expansion in recent years has usually been accompanied by rapid social and economic development, and factors such as gross domestic product (GDP) and population can better reflect regional development than urban area [35,36]. Therefore, this study used multiple socioeconomic factors to compare the coordinated development of socioeconomic and carbon sequestration services in different periods of urbanization using the decoupling index.
The Pearl River Delta (PRD) is an urban megacity region and has the strongest economic development power since the reform and opening up of China. Its dense population and rapid urban expansion pose a significant threat to the ecosystem [37,38]. However, as China’s first “national forest urban agglomeration construction demonstration area,” the PRD attaches great importance to the concept of carbon neutrality. Here, the PRD urban agglomeration was chosen as the research subject, and it is expected that the results of this study will support the policy objective of the Pearl River Delta National Forest Urban Agglomeration Construction Plan. The aims of this study were to (1) analyze the difference in the impact of urban expansion on NPP within and outside the city, (2) quantify the impact of human activities and climatic factors on NPP, and (3) explore the coordinated development of the social economy and carbon sequestration services.

2. Materials and Methods
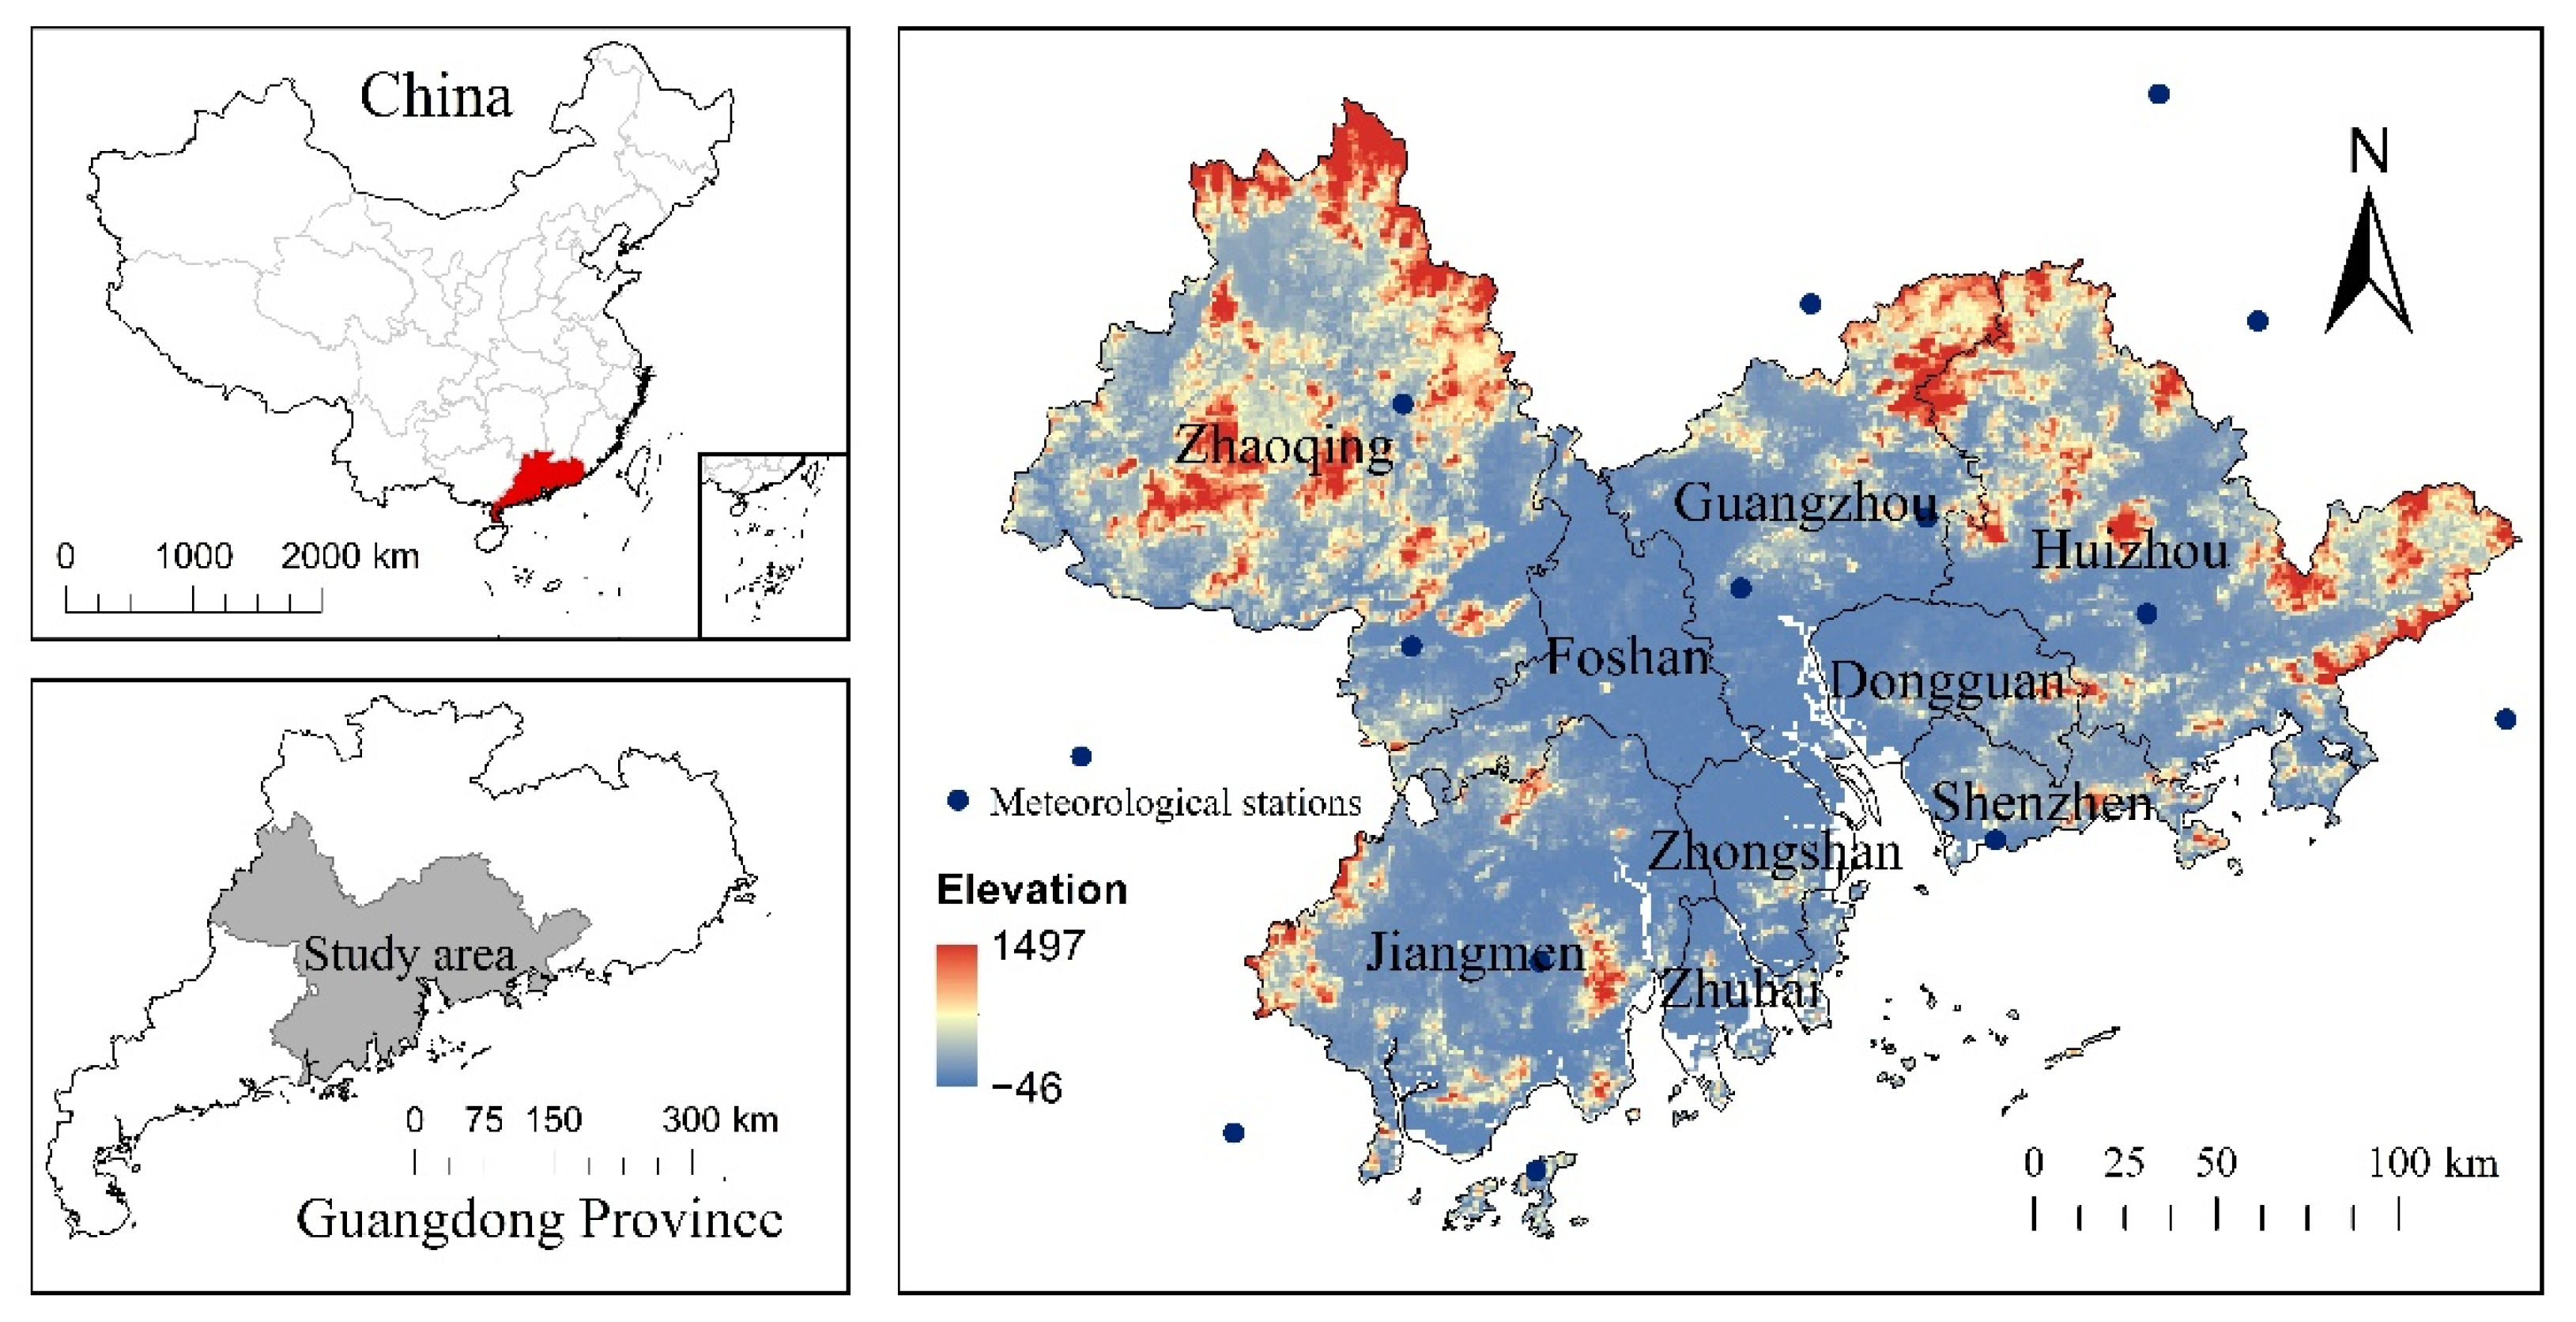
2.1. Study Area

The PRD (112°45′–113°50′ E, 21°31′–23°10′ N) is located in the south-central part of Guangdong Province and the lower reaches of the Pearl River. It is adjacent to Hong Kong and Macao and faces Southeast Asia across the sea (Figure 1). The PRD has convenient land and sea transportation and a basin area of 450,000 km2. It consists of nine prefecture-level cities, namely, Guangzhou, Shenzhen, Zhongshan, Zhuhai, Dongguan, Zhaoqing, Foshan, Huizhou, and Jiangmen.
Most of the PRD region is located in the south of the Tropic of Cancer and has a south subtropical and subtropical ocean monsoon climate with abundant rainfall, adequate heat, and rainy and hot seasons. The average annual temperature is 21.4–22.4 °C, and the average annual rainfall is 1600–2300 mm. Since the approval of the PRD as a national forest city cluster construction demonstration area in 2016, it has achieved 34,000 ha of carbon sequestration afforestation, 46,000 ha of forest transformation, 26 wetland nature reserves, and 127 wetland parks. Therefore, it is a forest city cluster integrating the forest and the city that is eco-friendly and livable and allows the coexistence of humans and nature.

2.2. Available Data

The data sources of this study are as follows:
(1) NPP from 2000 to 2020 was derived from raster data from NASA (National Aeronautics and Space Administration) with a spatial resolution of 500 m.
(2) Land use grid data of the PRD in 2000, 2010, and 2020 were derived from GlobalLand30 with a spatial resolution of 30 m [39].
(3) Population density raster data and GDP raster data for 2000, 2010, and 2015 were derived from the Resource and Environment Science and Data Center with a spatial resolution of 1 km. Population density and GDP show stable growth under normal circumstances, and therefore, the population density and GDP data for 2020 were obtained by linear fitting based on population data and GDP data for 2010 and 2015, respectively.
(4) Nighttime light (NTL) raster data for 1992–2018 were derived from Nature journal data provided by the open-source platform [40]. The spatial resolution of these data was 500 m and was calibrated to eliminate the differences between the Defense Meteorological Satellite Program (DMSP) (1992–2013) and Visible Infrared Imaging Radiometer Suite (VIIRS) (2012–2018) data to generate a complete and consistent NTL dataset on a global scale [40].
(5) Monthly mean precipitation, sunshine duration, and temperature data from 26 meteorological stations in Guangdong Province from 2000 to 2020 were obtained from the National Meteorological Science Data Center. The annual mean of the original data was taken to obtain the annual mean meteorological data for each station, and was then imported into ArcGIS 10.6 for Kriging interpolation to obtain the grid data for annual mean precipitation, sunshine duration, and temperature of Guangdong Province, with a resolution of 500 m.

2.3. Methodology

2.3.1. Theil–Sen Median Trend Analysis and Mann–Kendall Trend Test

The Theil–Sen trend analysis method and Mann–Kendall test method are widely used in NPP time series analysis and can explain the long-term trend of change in vegetation NPP [41,42,43].
The Theil–Sen median trend analysis was used to quantify the change trend. The median of the sample data was calculated to represent the change in NPP per unit time, and the formula is as follows:
S N P P = m e d i a n [ N P P j N P P i j i ] ,   i < j ,
where S N P P is the Theil–Sen median trend and N P P i and N P P j are the NPP values of pixels in year i and year j, respectively. This method calculates the median slope of n (n − 1)/2 data combinations. When S N P P > 0 , NPP shows an upward trend. Otherwise, it shows a downward trend.
The Mann–Kendall test is used to evaluate the significance of the NPP trend, and the formula is as follows:
S = j = 1 n 1 i = j + 1 n s g n ( N P P j N P P i )
s g n ( N P P j N P P i ) = { 1 ,   N P P j N P P i > 0   0 ,   N P P j N P P i = 0 1 ,   N P P j N P P i < 0
Z c = { S 1 v a r ( S ) ,   S > 0 0 ,   S < 0 S 1 v a r ( S ) ,   S < 0
v a r ( S ) = n ( n 1 ) ( 2 n + 5 ) 18
where s g n is a sign function. The trend test method is the null hypothesis. Under a given significance level alpha, when | Z c | > Z 1 α / 2 , refuse the null hypothesis. Z 1 α / 2 is the standard normal variance. | Z c | is 1.28, 1.64, and 2.32, determined by confidence levels of 90%, 95%, and 99% of the significance test.

2.3.2. Contributions of Climatic Factors and Human Activities to NPP

Commonly used methods directly regard the residual difference between NPP and climatic factors in the entire study area as the contribution of human activities to NPP [41], which may overestimate the contribution rate of human activities because natural factors, such as diseases and insect pests, will be attributed to the impact of human activities on NPP in areas similar to primeval forests. The PRD covers large areas of forest rarely touched by humans and rapidly growing urban land, and therefore, this study used an improved two-step method to quantify the impact of human activities and climate change on vegetation change [10].
The PRD region was first divided into V c , V c + h , V n u , and V p u based on land-use grid data from 2000 to 2020. V c was obtained by removing cultivated land, nonvegetated areas (including water bodies, artificial surfaces (AS), and bare land), and areas transferred from vegetated areas to other land-use types during the study period. V n u and V p u refer to artificial land and permanent urban land added during the study period, respectively, obtained by extracting the AS grid of 2000. The remaining area was V c + h . The NPP of V c was only affected by climatic factors, whereas the carbon sequestration capacity of V n u , V p u , and V c + h was affected by both human factors and climate change.
V c covers areas in the PRD where the carbon sequestration capacity is only affected by climate, which is mainly distributed in areas with rich natural vegetation or less human activity and accounts for 53.88% of the total area. The vegetation types of V c mainly include forest land, shrub land, and herbaceous land with vegetation coverage greater than 10%. Most areas in the center of the PRD, such as Foshan, southern Guangzhou, northern Zhongshan, and western Shenzhen, do not belong to V c because of their wide coverage of AS and cultivated land. V c + h refers to the area outside the urban area affected by human activities, and its land-use types mainly include cultivated land, AS, and water. To reflect the promotion effect of environmental protection policies on carbon sequestration capacity during urban development, urban land was divided into new cities ( V n u ) and permanent cities ( V p u ), which were affected more severely by human activities than V c + h .
The RESTREND multiple regression method was then used to calculate the contribution of temperature, precipitation, solar radiation, and human activities to NPP:
S N P P = C ( T e m ) + C ( P r e ) + C ( R a d ) + U F ( N P P T e m ) × ( T e m n ) + ( N P P P r e ) × ( P r e n ) + ( N P P R a d ) × ( R a d n ) + U F
where S N P P is the interannual variation trend of NPP; C ( T e m ) , C ( P r e ) , and C ( R a d ) are the contributions of temperature, precipitation, and solar radiation to NPP, respectively; n is the number of research years; C ( T e m ) is calculated by N P P / T e m and T e m / n ; and N P P / T e m and T e m / n are the slope of the linear regression curve between NPP and mean annual temperature and the slope of the linear regression curve between mean annual temperature and NPP, respectively. The calculation method of C ( P r e ) and C ( R a d ) is similar to that of C ( T e m ) . U F is the residual contribution of the above three climatic factors to the interannual variation of NPP and represents the impact of other factors, such as fire, diseases, and insect pests.
U F of V n u , V p u , and V c + h indicates the impact of human activities on NPP, such as the encroachment of cultivated land and urban land on forest land. UF of V c refers to the influence of wind, natural disasters, and other climatic factors on NPP. The influence of meteorological factors on the regional carbon sequestration capacity of the PRD is calculated by summing the contribution values of climatic factors to V c , V c + h , V n u , and V p u .

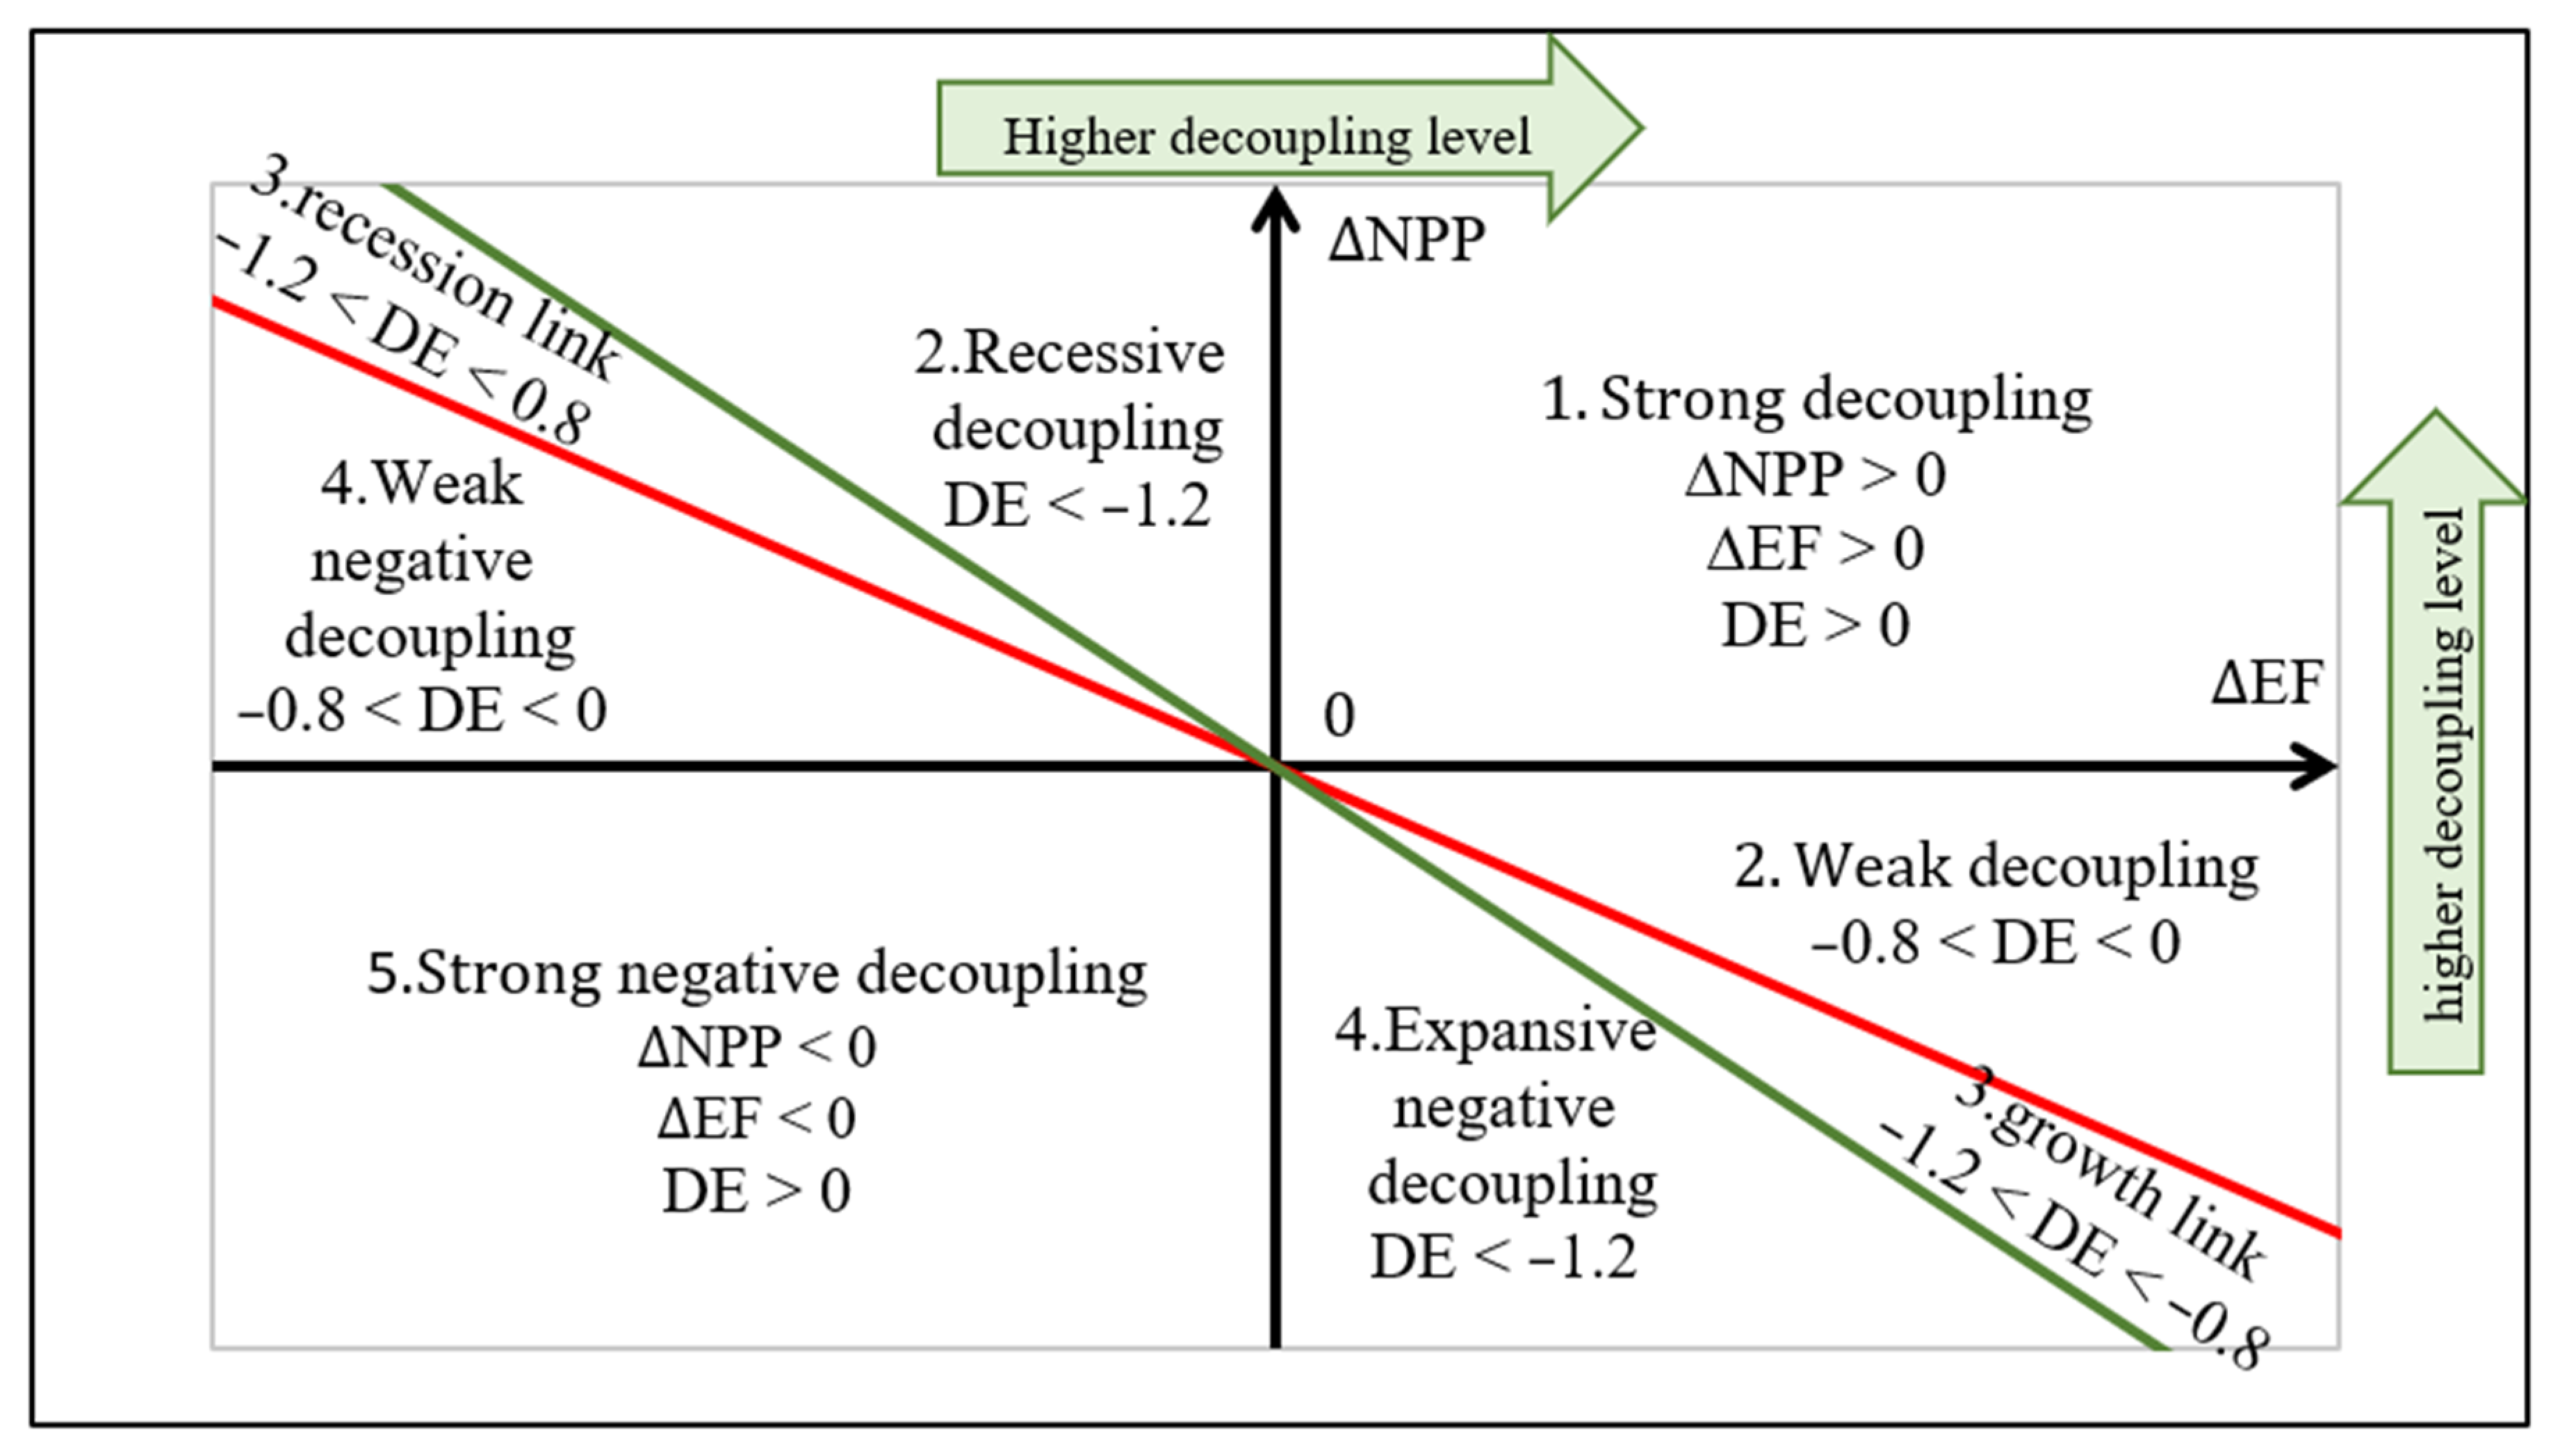
2.3.3. Tapio Decoupling

Urbanization is a complex process of social and economic development. Previous studies [44,45] have divided the complex urbanization process into economic urbanization, population urbanization, and landscape urbanization. In this study, GDP, the NTL index, the proportion of population (POP), and AS were used to represent the economic development, population size, and land urbanization level of the city. AS refers to the proportion of artificial surface in the entire region, which is calculated by dividing the surface area of man-made land by the area of all land-use types.
The decoupling relationship between urbanization and carbon sequestration capacity was analyzed by watershed. A watershed is a relatively independent and complete system with both natural and social attributes, and can explain the phenomenon of coupling between social and economic factors and nature [46]. The hydrological analysis module in ArcGIS was used to divide the study area into 374 small watersheds. The threshold used when calculating the cumulative flow of the grid was 100,000, and watersheds smaller than 5 km2 were combined with adjacent watersheds. The average NPP, GDP, POP, NTL, and AS within each basin were then calculated, and the decoupling index of the 374 basins was calculated using Formula (7) [47]. The decoupling index can reflect how easily the carbon sequestration capacity of vegetation is affected by social and economic factors, that is, the adaptability of NPP to human activities.
D I = Δ N P P Δ S F = ( N P P t 2 N P P t 1 ) / N P P t 1 ( S F t 2 S F t 1 ) / S F t 1
where S F represents various socioeconomic factors (GDP, POP, NTL, and AS), t1 represents the early stage of the study, and t2 represents the late stage of the study. Referring to the literature [48,49], the decoupling index (DI) was divided into five grades (Figure 2). Level 1 represents strong decoupling; that is, NPP and socioeconomic factors (SF) grow together, and socioeconomic development does not depend on a reduced carbon sequestration capacity. Level 5 indicates strong negative decoupling, which indicates that both carbon sequestration capacity and socioeconomic factors are at a disadvantage. The ability of NPP to develop harmoniously with socioeconomic factors decreases from Level 1 to Level 5.

3. Results

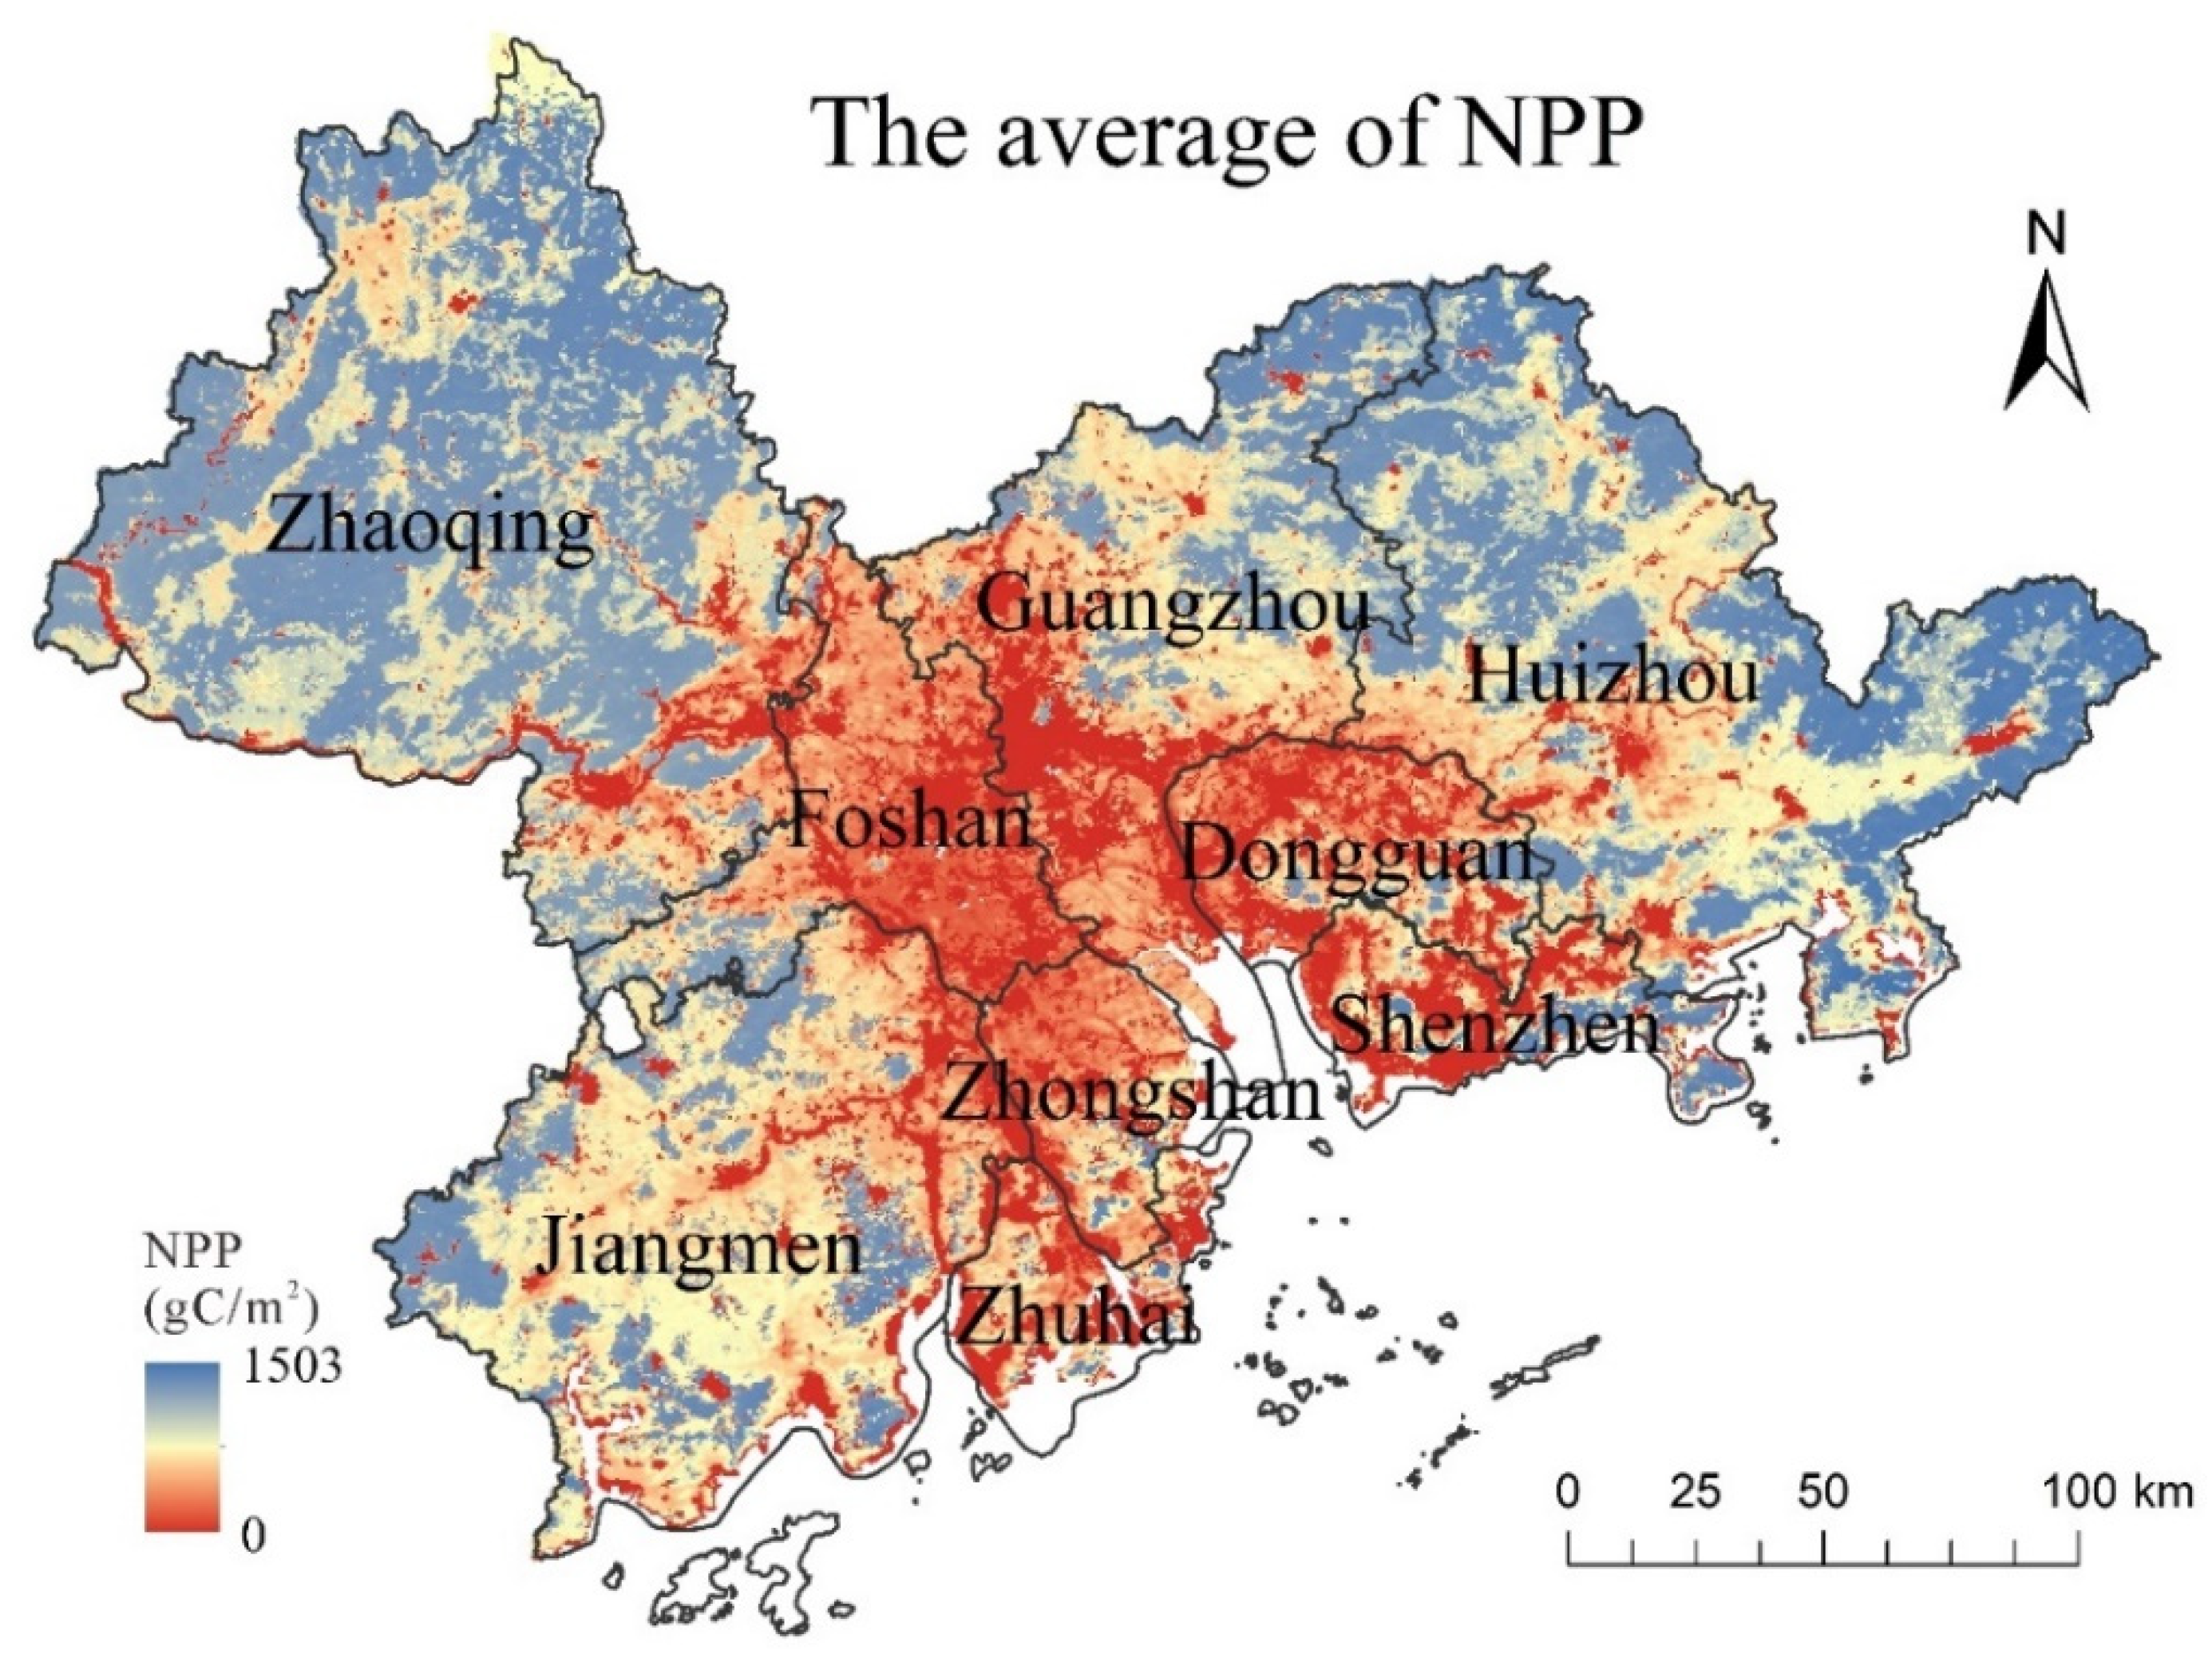
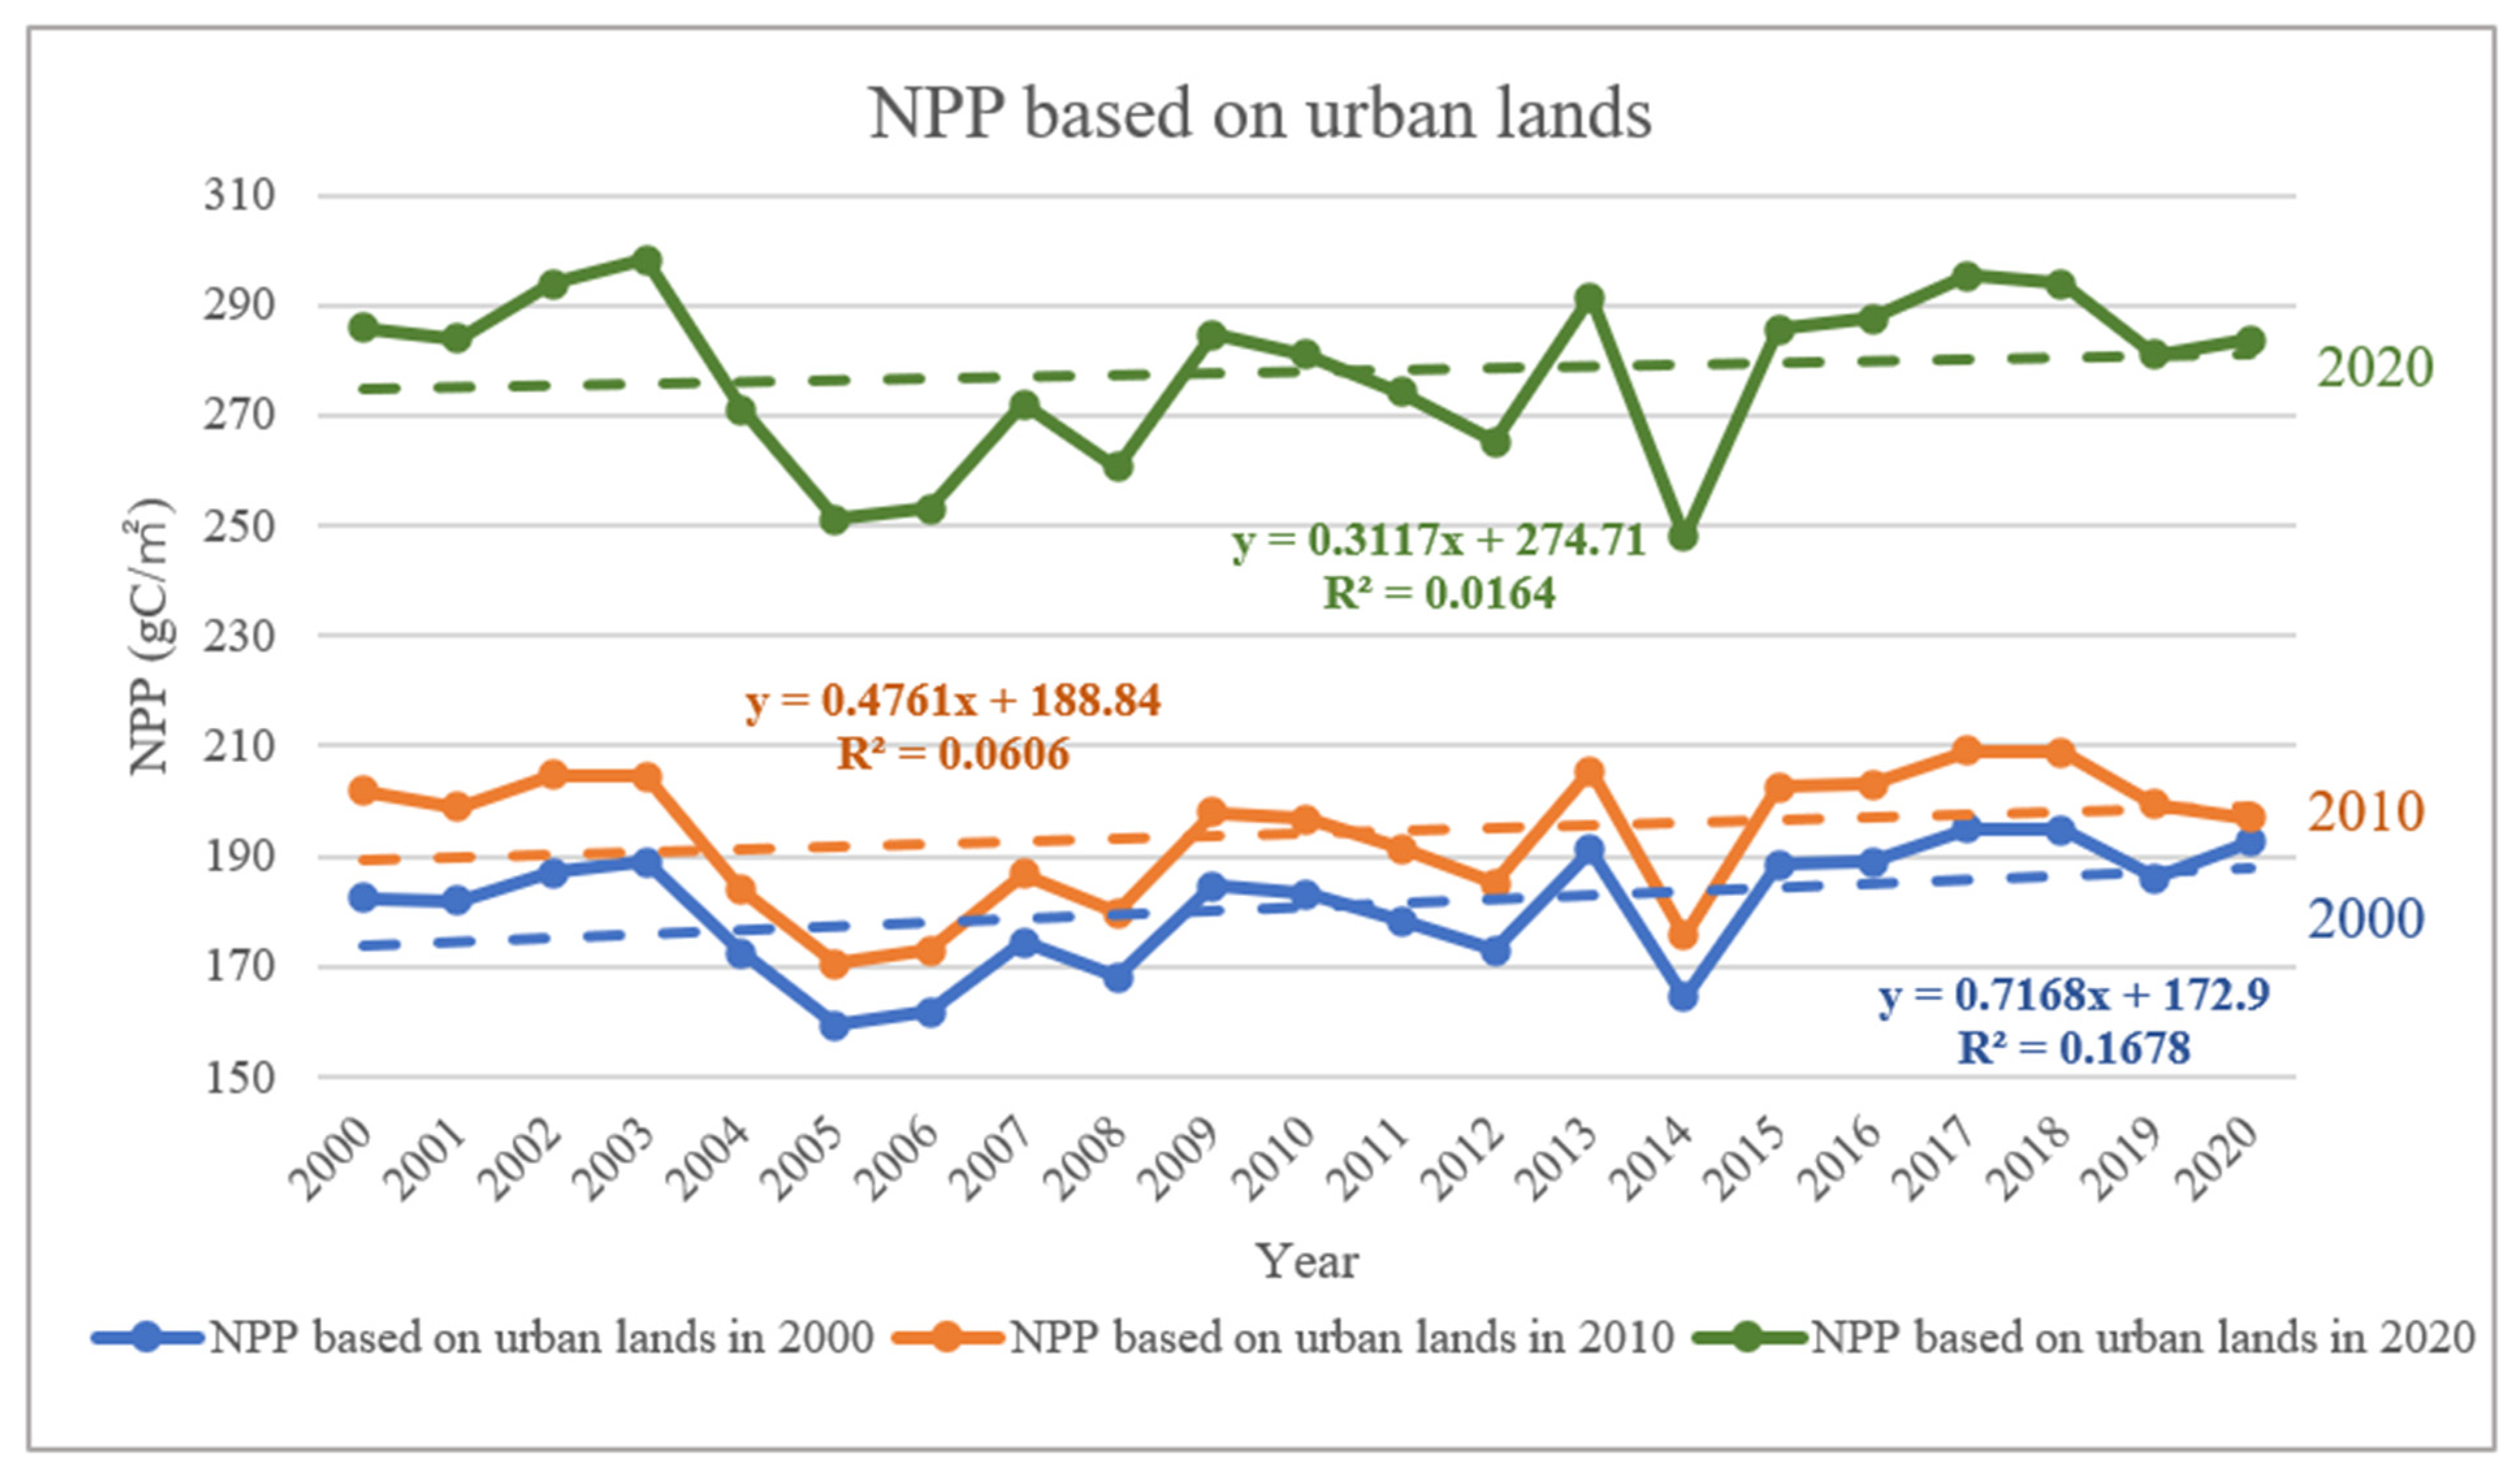
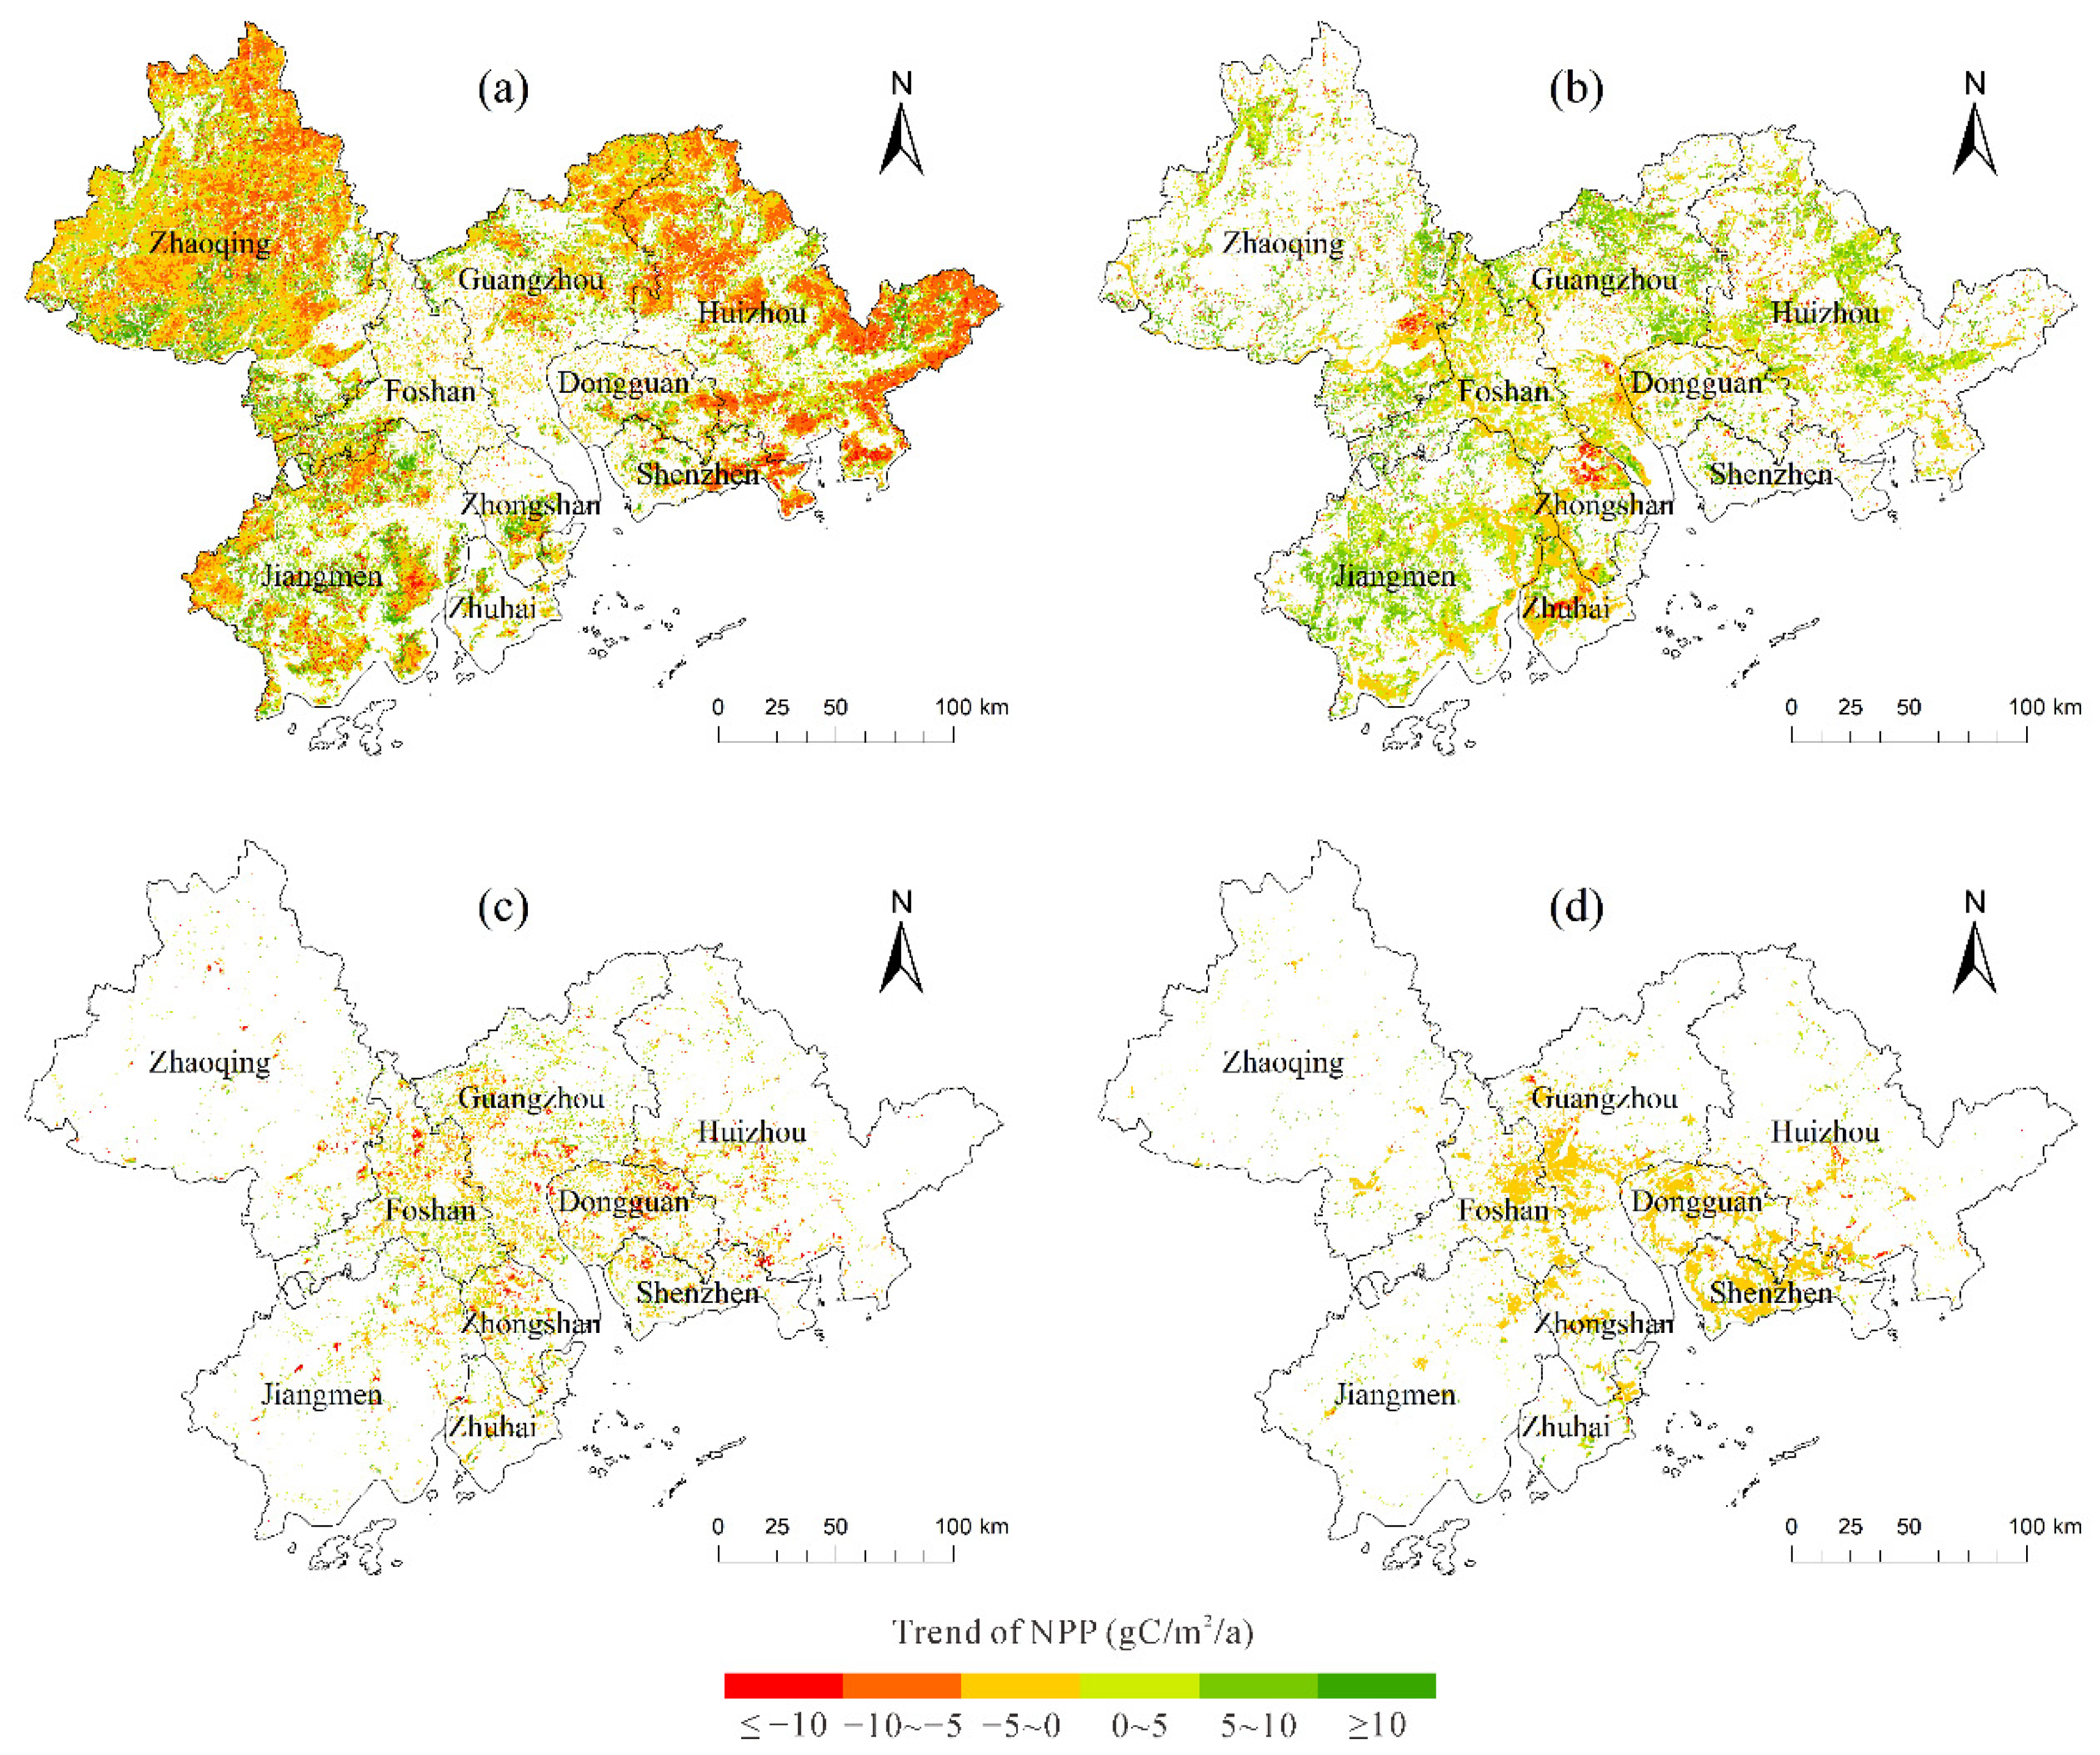
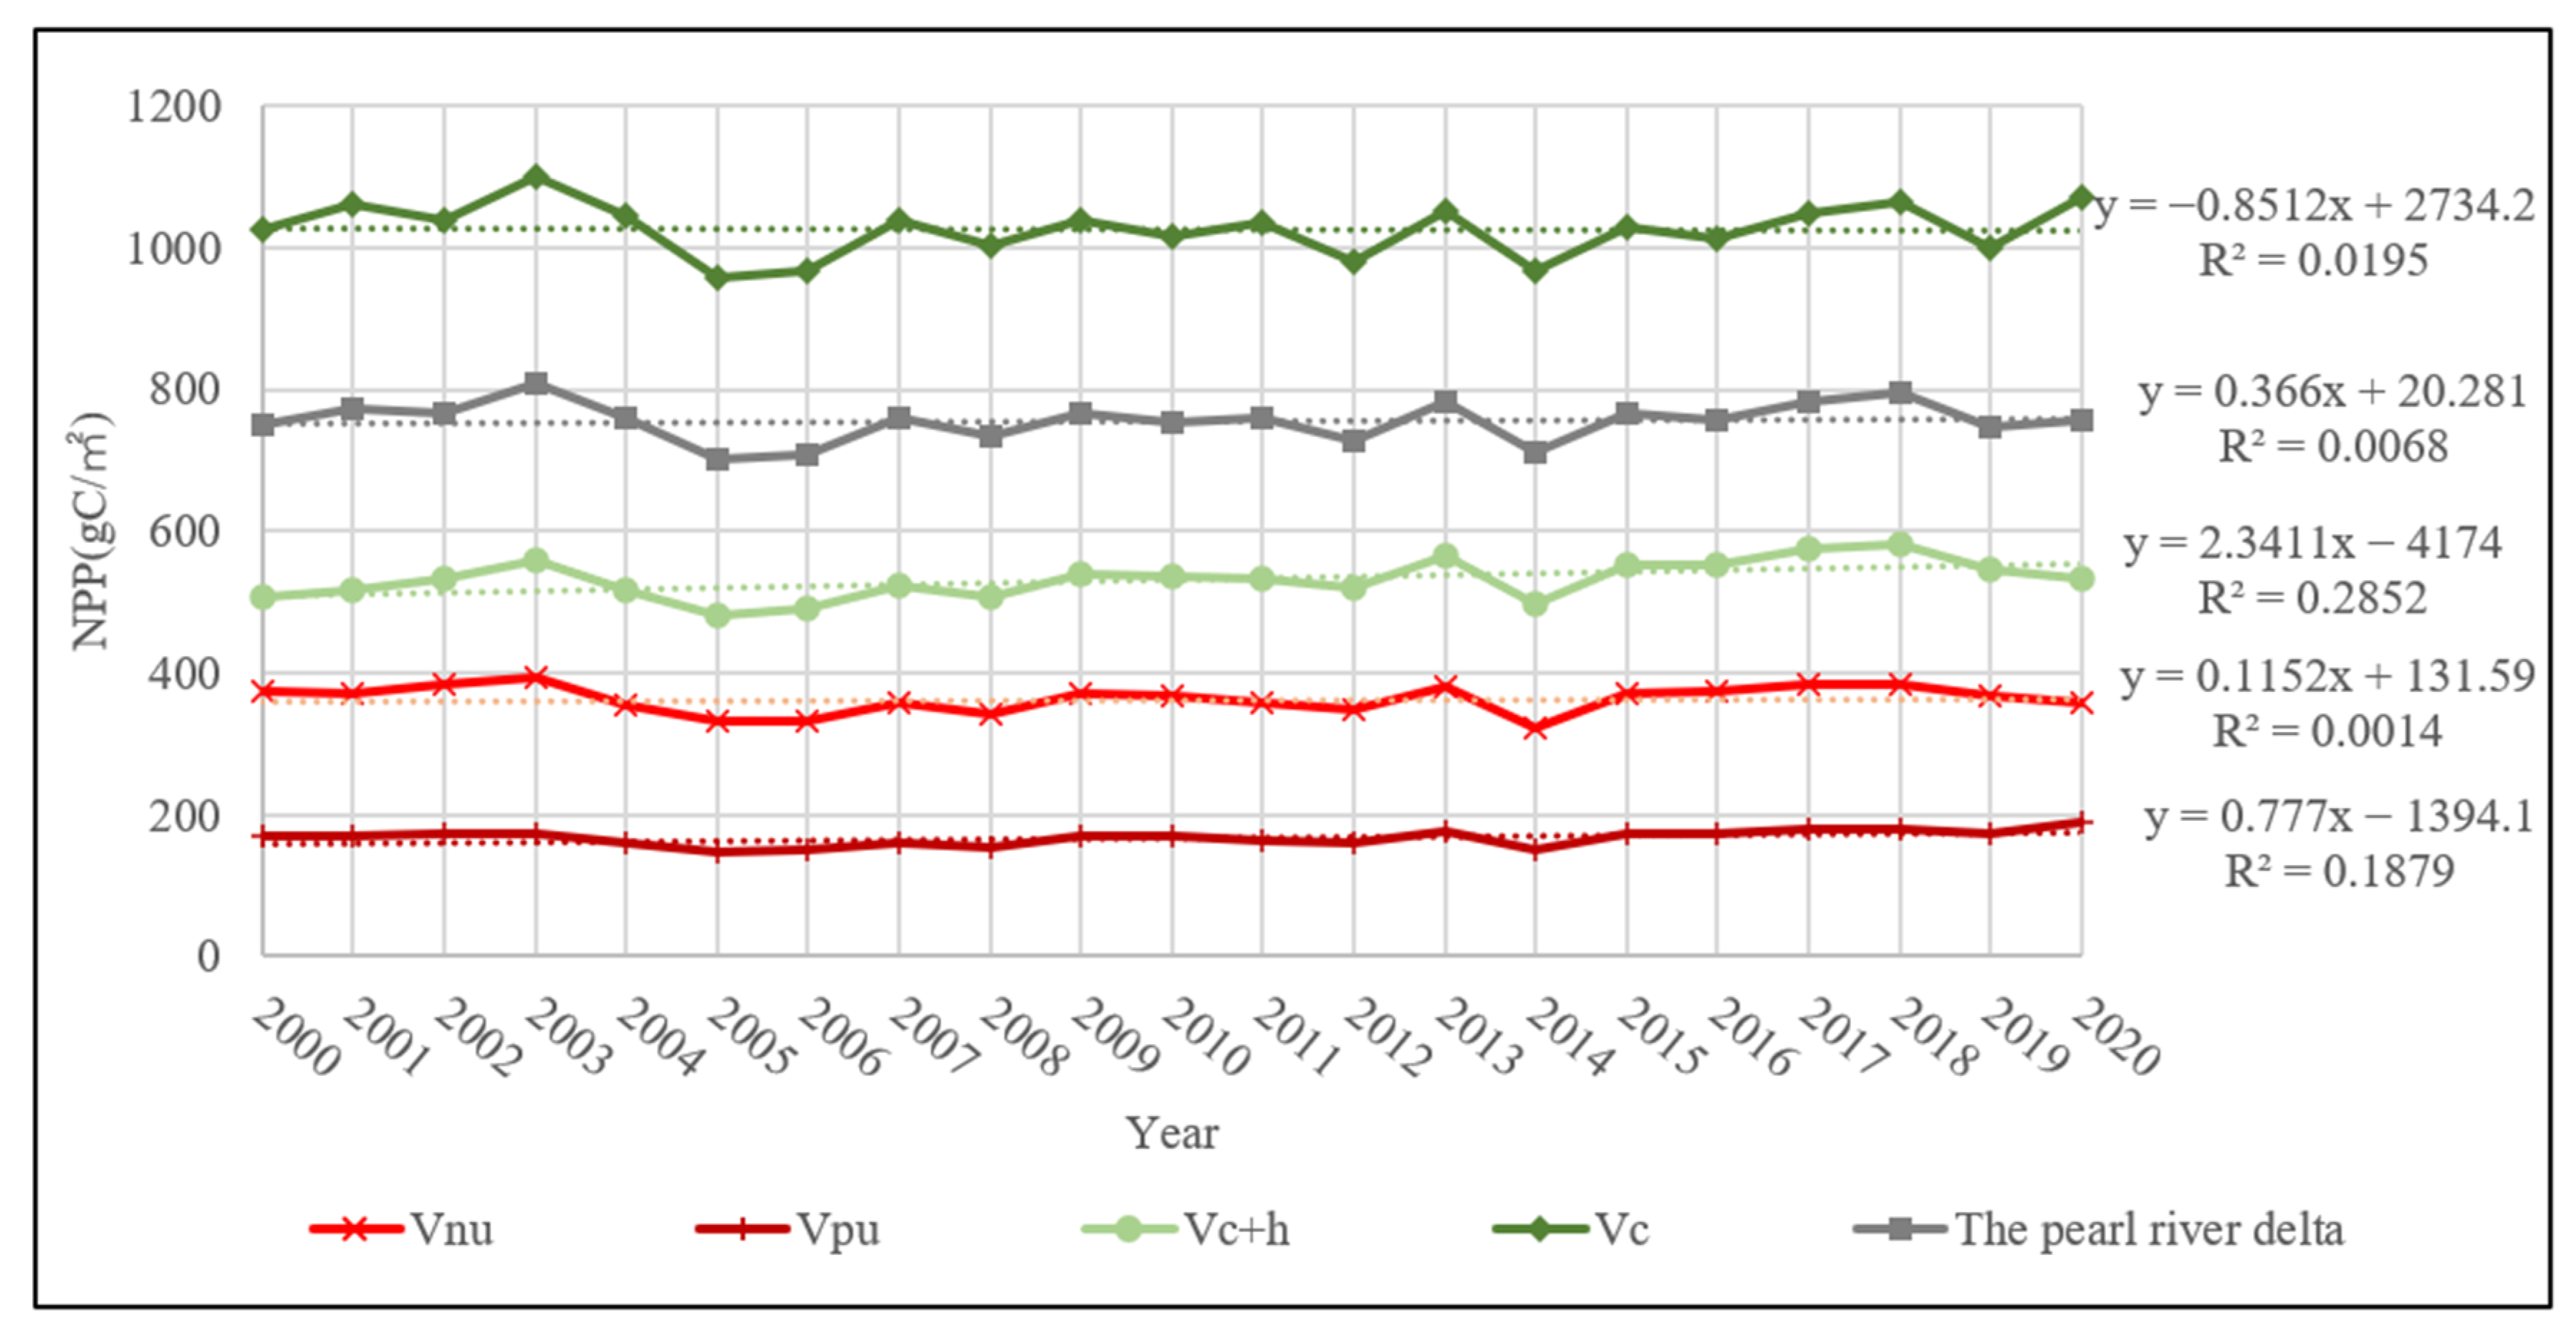
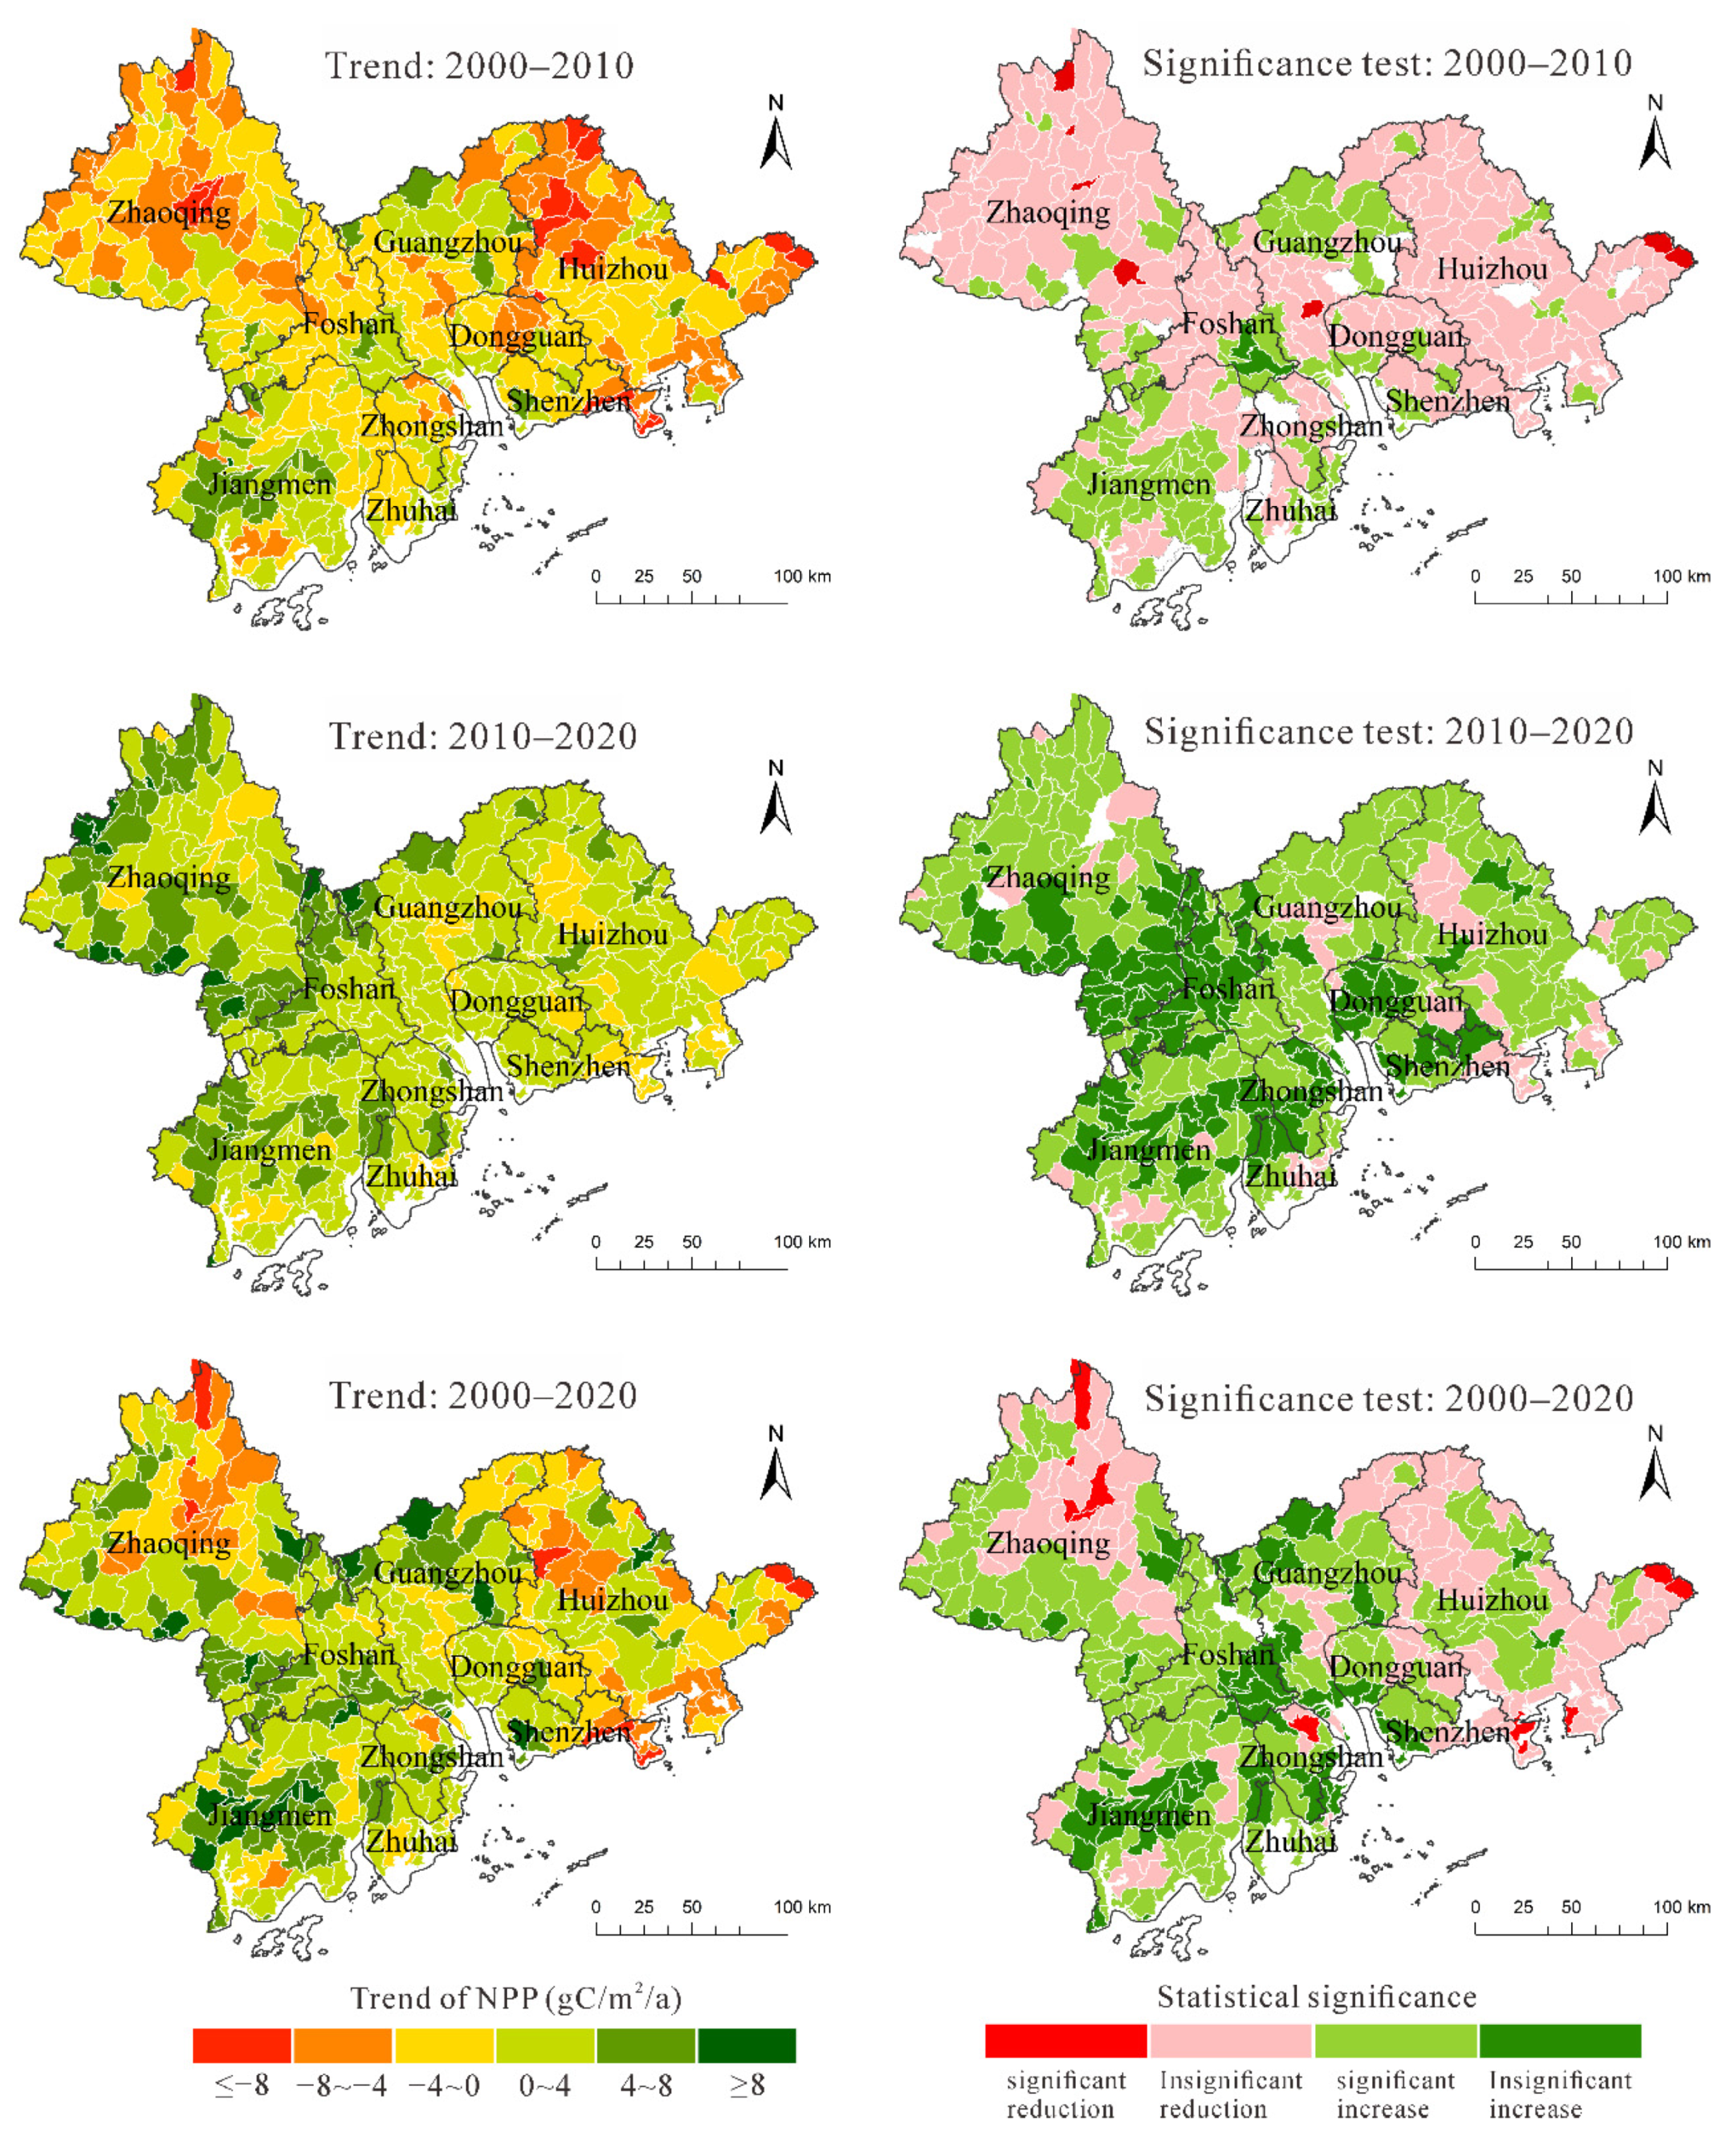
3.1. Influence of Urbanization on Change in NPP

The impact of urban development in the PRD on the annual mean NPP during the study period and the spatial distribution characteristics of the mean NPP in the PRD from 2000 to 2019 are presented in Figure 3. The average NPP difference between original urban land and new urban land is compared in Figure 4.
Figure 3 shows that the annual mean NPP varied from 0 g C/m2 to 1503 g C/m2 and gradually increased from the central region to the surrounding areas. The regions with an annual mean NPP close to 0 g C/m2 are mainly urban areas, which are in the central region of the PRD, namely, Foshan, southern Guangzhou, western Dongguan, western Shenzhen, Zhongshan, and Zhuhai. The areas with a higher average NPP are distributed in Zhaoqing, Huizhou, Jiangmen, and the northeast of Guangzhou in the periphery of the PRD, and most of the land cover types in these areas are forest land with better carbon sequestration capacity.
In Figure 4, the AS in 2000 represents permanent urban land, and the change in the carbon sequestration capacity of the original city in the development process is reflected by the mean value of NPP in these regions. The average NPP variation trend related to the newly added AS in the process of urbanization was studied based on urban land in 2010 and 2020. Three main results can be obtained from Figure 4: (1) The average NPP in the three types of urban land was less than 300 g C/m2, which is significantly lower than the median value of the annual mean NPP shown in Figure 3, thereby indicating that the carbon sequestration capacity of urban areas is low. (2) By comparing the three curves, it can be seen that in the process of urban expansion, the carbon sequestration capacity of new urban land gradually improves, but remains low. Among them, the average NPP of permanent urban land is the lowest, being between 150 g C/m2 and 200 g C/m2. The average NPP of urban land in 2010 increased slightly, but did not exceed 210 g C/m2. The average NPP calculated based on urban land in 2020 increased significantly, reaching 250 g C/m2 to 300 g C/m2. This might have occurred because during the study period, the PRD paid more attention to urban carbon sequestration capacity while conducting urban development, and therefore, the average NPP in the new urban land is higher than that in the original urban land. (3) The mean NPP in all three urban lands showed a slight upward trend, indicating that policies related to carbon neutrality in the city produced good effects. The NPP trends of urban land in 2000, 2010, and 2020 were 0.64, 0.51, and 0.27, respectively. Although the average NPP of urban land in 2020 was the highest, its growth trend was the weakest. This might have occurred because measures related to carbon sequestration work first in existing urban land and are just beginning to take effect in new urban land. Therefore, with advancing urbanization, the average NPP in permanent urban land has the strongest improvement trend.
To preliminarily distinguish the influences of climate, human activities, and urban expansion on NPP trends, the NPP trends of V c , V c + h , V n u , and V p u are presented in Figure 5 and Figure 6.
In Figure 5, V c and V c + h represent the region affected only by climate and the region affected by human activities outside the city, respectively. The NPP variation trends were −90 to 37 g C/(m2·y) and −85 to 36 g C/(m2·y), respectively, and the spatial characteristics differed. The NPP of V c + h showed a decreasing trend, whereas the NPP of most of V c + h showed a decreasing trend greater than −5 g C/(m2·y). In addition, the NPP of V n u and V p u ranged from −73 g C/(m2·y) to 29 g C/(m2·y) and from −77 g C/(m2·y) to 32 g C/(m2·y), respectively, with similar spatial characteristics. NPP decreased slightly in most regions (−5–0 g C/(m2·y)) or increased slightly (0–5 g C/(m2·y)). However, the area of increasing NPP in V n u was larger than that in V p u . The results show that outside the urban area, the combined effects of climate change and human activities are more significant than those of climate change alone in promoting carbon sequestration services. Within urban land, additional urban carbon sequestration measures have a more positive impact on NPP than permanent urban land.
The annual partition statistics of NPP in V c , V c + h , V n u , and V p u are shown in Figure 6. The two main results are as follows: (1) The region affected only by climate had the strongest carbon sequestration capacity, whereas the carbon sequestration capacity of other regions was lower than the average of the PRD. The average NPP values of V c , V c + h , V n u , and V p u differed significantly, and were in the order of V c > V c + h > V n u > V p u . (2) The average growth trend of NPP in the four types of regions was clearly different. The average growth rate of NPP in the PRD was 0.37 g C/(m2·y), second only to V c + h with the highest growth rate of NPP (2.34 g C/(m2·y)), whereas V c had the lowest growth rate (−0.85 g C/(m2·y)) despite having the highest NPP value. This is consistent with the results shown in Figure 6. The NPP growth rate of V n u (0.11 g C/(m2·y)) was less than that of V p u (0.78 g C/(m2·y)). The results indicate that more attention should be paid to the change in carbon sequestration capacity of V c , and human intervention should be used to reduce the decline in NPP in climate-only regions. In urban areas, it is necessary to speed up the implementation of carbon sequestration measures in newly added cities and to implement more efficient carbon sequestration policies while increasing NPP values.

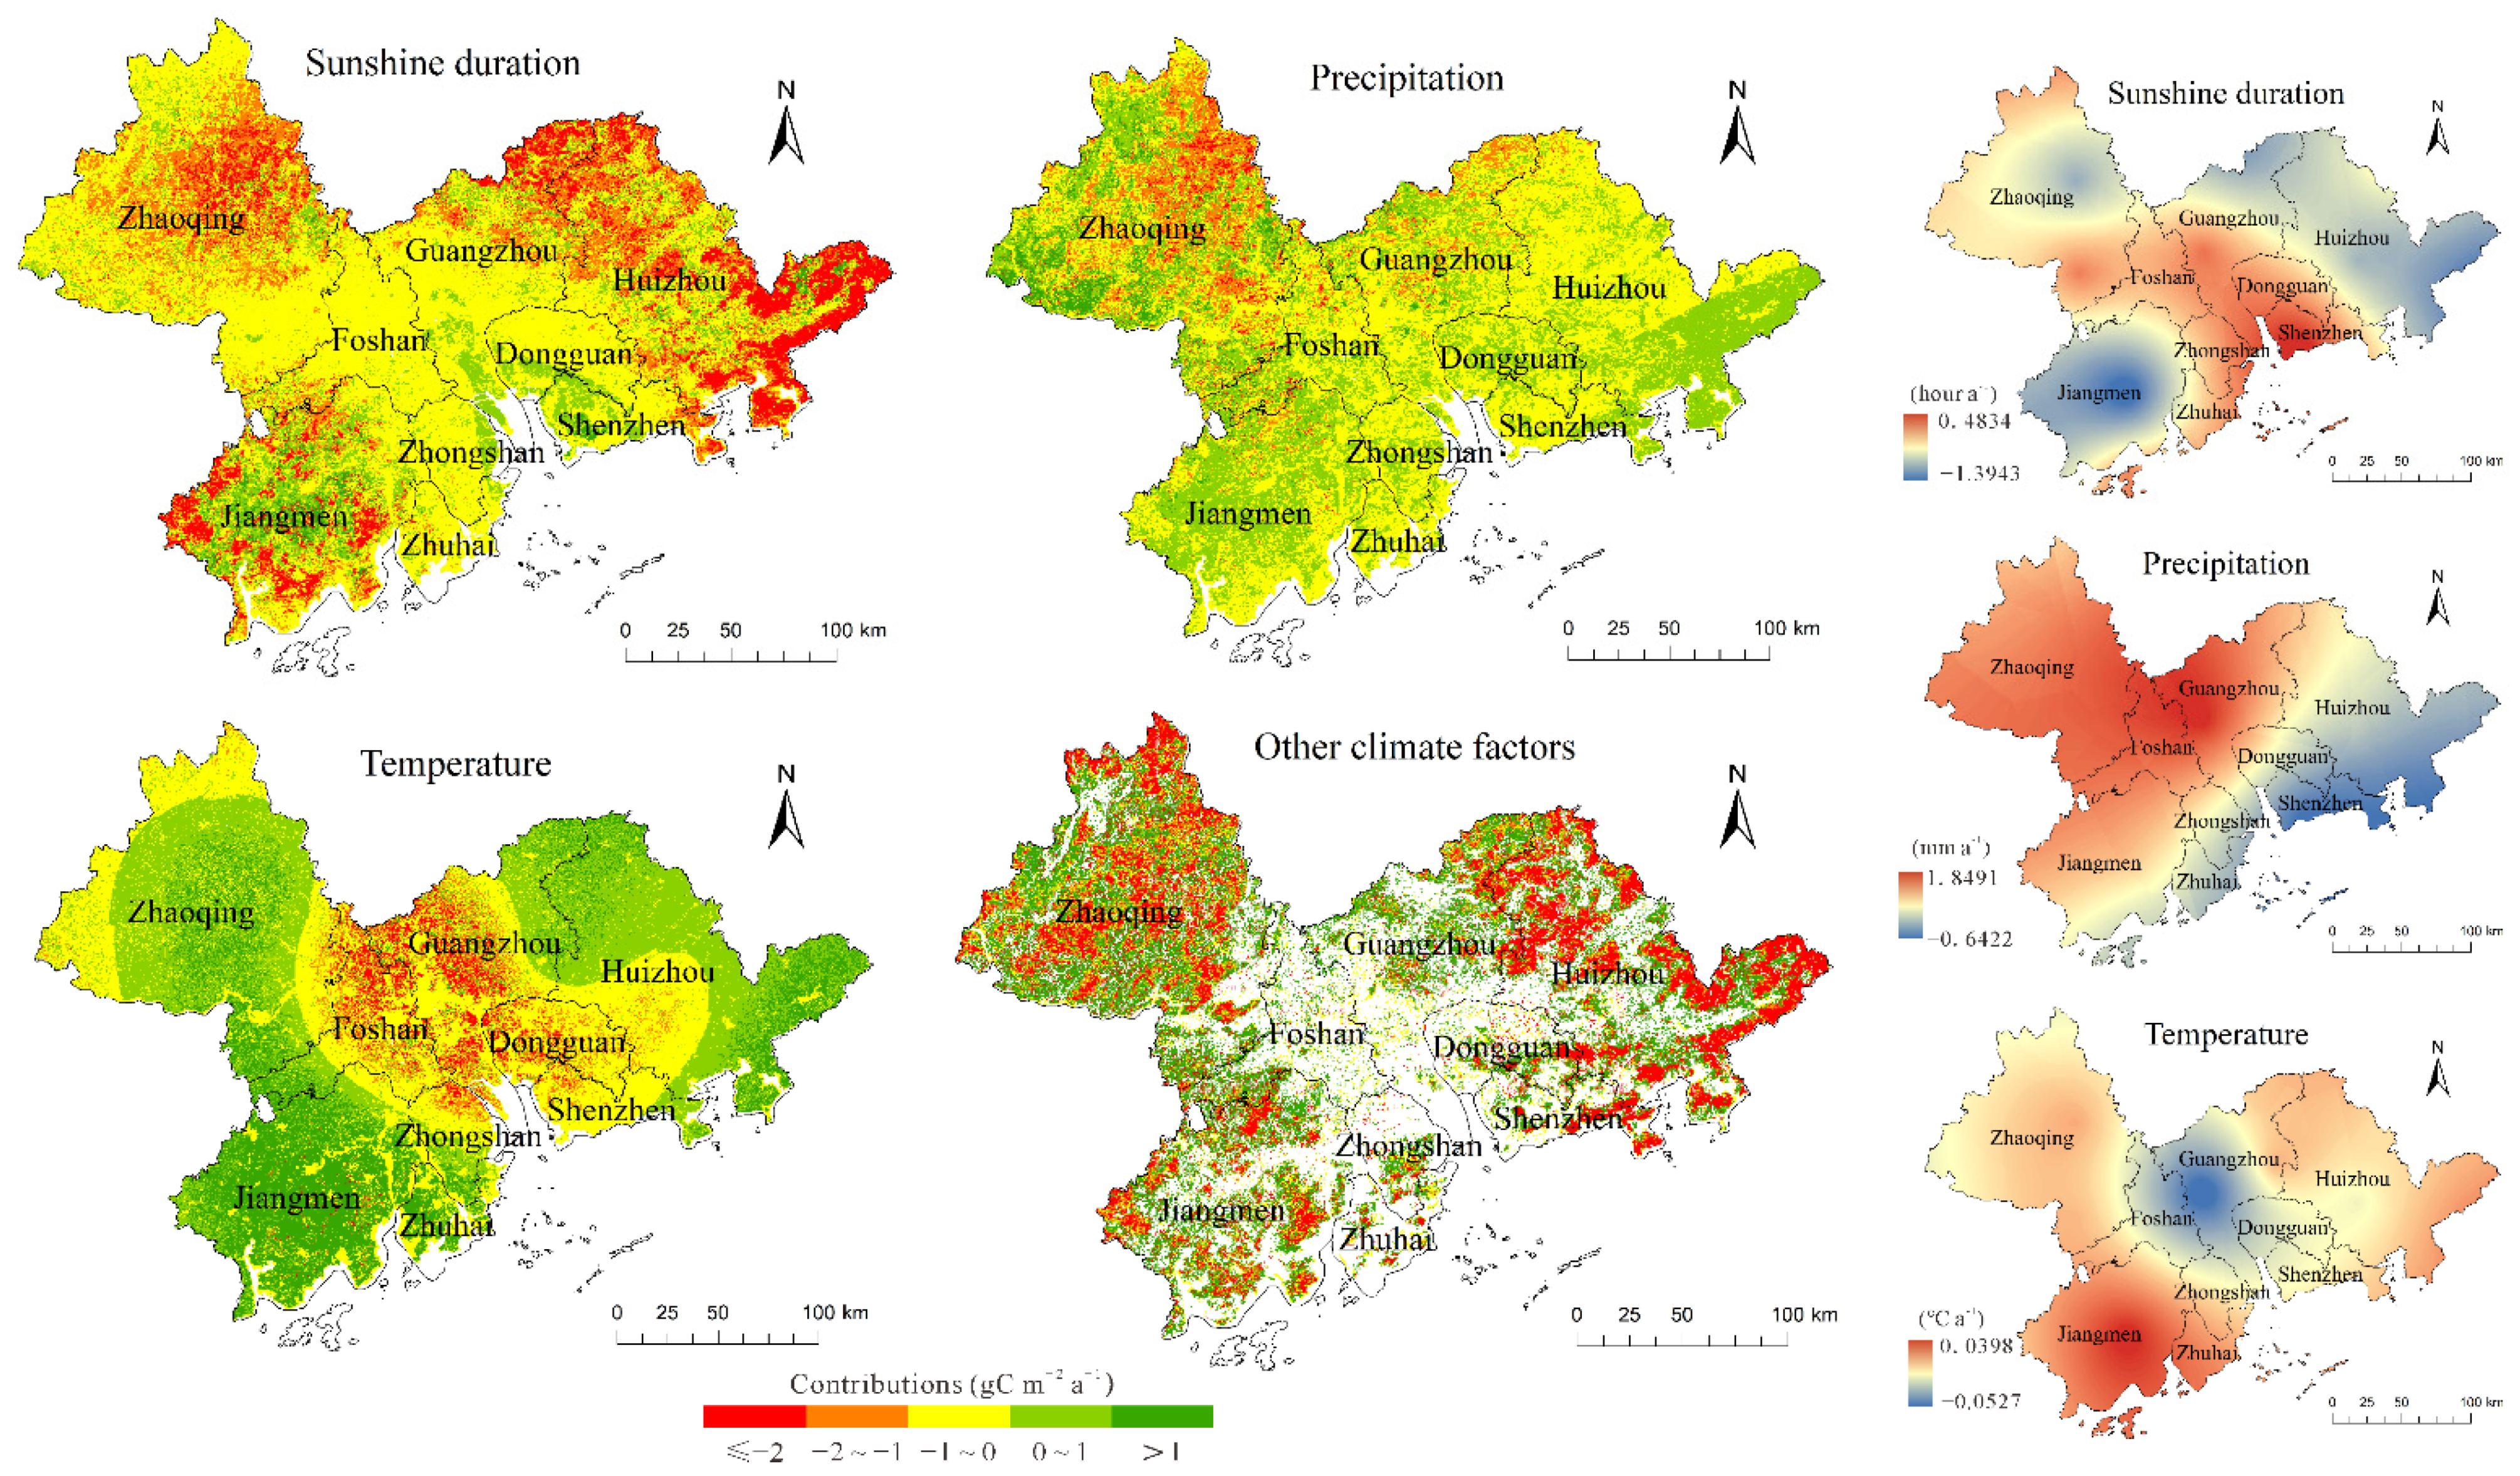
3.2. Contributions of Human Activities and Climate Change to NPP

Human activities generally contributed to increased NPP in the PRD from 2000 to 2019; however, the contribution of climate change to NPP was negative because of a large area with reduced sunshine hours and lower temperatures (Figure A1). The contributions of sunshine duration, precipitation, and temperature to NPP were −0.72, −0.13, and 0.35 g C/(m2·y), respectively. The residual contribution of other climatic factors was −0.34 g C/(m2·y). The contribution of human activities to NPP was 1.55 g C/(m2·y). Human activities have a positive impact on the carbon sequestration capacity of the PRD, possibly because policies such as the Pearl River Delta National Forest Urban Agglomeration Construction Plan help to promote afforestation and other measures. The negative contribution of sunshine hours to NPP was mainly concentrated in the northeast of Guangzhou, Huizhou, Zhaoqing, and Jiangmen. In these outer regions of the PRD with dense vegetation, the carbon sequestration capacity of plants tends to weaken with decreased sunshine hours. During the study period, precipitation significantly increased in most areas of the PRD; however, the contribution of precipitation to NPP was mainly negative. This may have occurred because increased precipitation would inhibit the photosynthesis of vegetation and, hence, reduce productivity. Compared with sunshine duration and precipitation, the positive contribution of air temperature to NPP was the largest, and was mainly concentrated in the outer ring of the PRD where the temperature increased. Conversely, the negative contribution of temperature to NPP was found in Foshan, southern Guangzhou, Dongguan, and northern Zhongshan, where the temperature decreased.
Figure 7 shows the total contribution of climate change to NPP in the PRD and divides the contribution of human activities into three parts, namely, V c + h , V n u , and V p u . Climate change makes a negative contribution to NPP and is related to reduced sunshine duration, excessive precipitation, and reduced temperature. In parts of the southwest PRD, such as Jiangmen, Zhaoqing, and Zhuhai, climate change has contributed to the growth of NPP. In addition, the contribution of human activities to NPP varies substantially within and outside urban land. In V c + h , which is affected by both climate and human activities, the positive contribution of human activities to NPP was more than 60.00%, and the contribution value greater than four reached 35.54%. In most areas of urban land, the contribution of human activities to NPP was negative. The positive contribution of human activities to NPP in V n u (46.60%) was higher than that in V p u (28.75%), but the negative contribution range of less than −2 in V n u (19.70%) was also higher than that in V p u (8.30%). This indicates that NPP in new cities is more sensitive to human activities, whereas the positive and negative contributions of human activities to NPP in permanent cities are weak.
The results indicate that the contribution of climate to NPP was mainly negative because changes in solar radiation, precipitation, and temperature were not conducive to vegetation growth in most areas of the PRD during the study period. In the regions affected by both climate and human activities, the positive contribution of human activities outside urban land to NPP was greater than that of urban land. The NPP of most areas inside urban land was disturbed by human activities and showed a decreasing trend, and the impact of human activities on the NPP of new urban land was more severe.

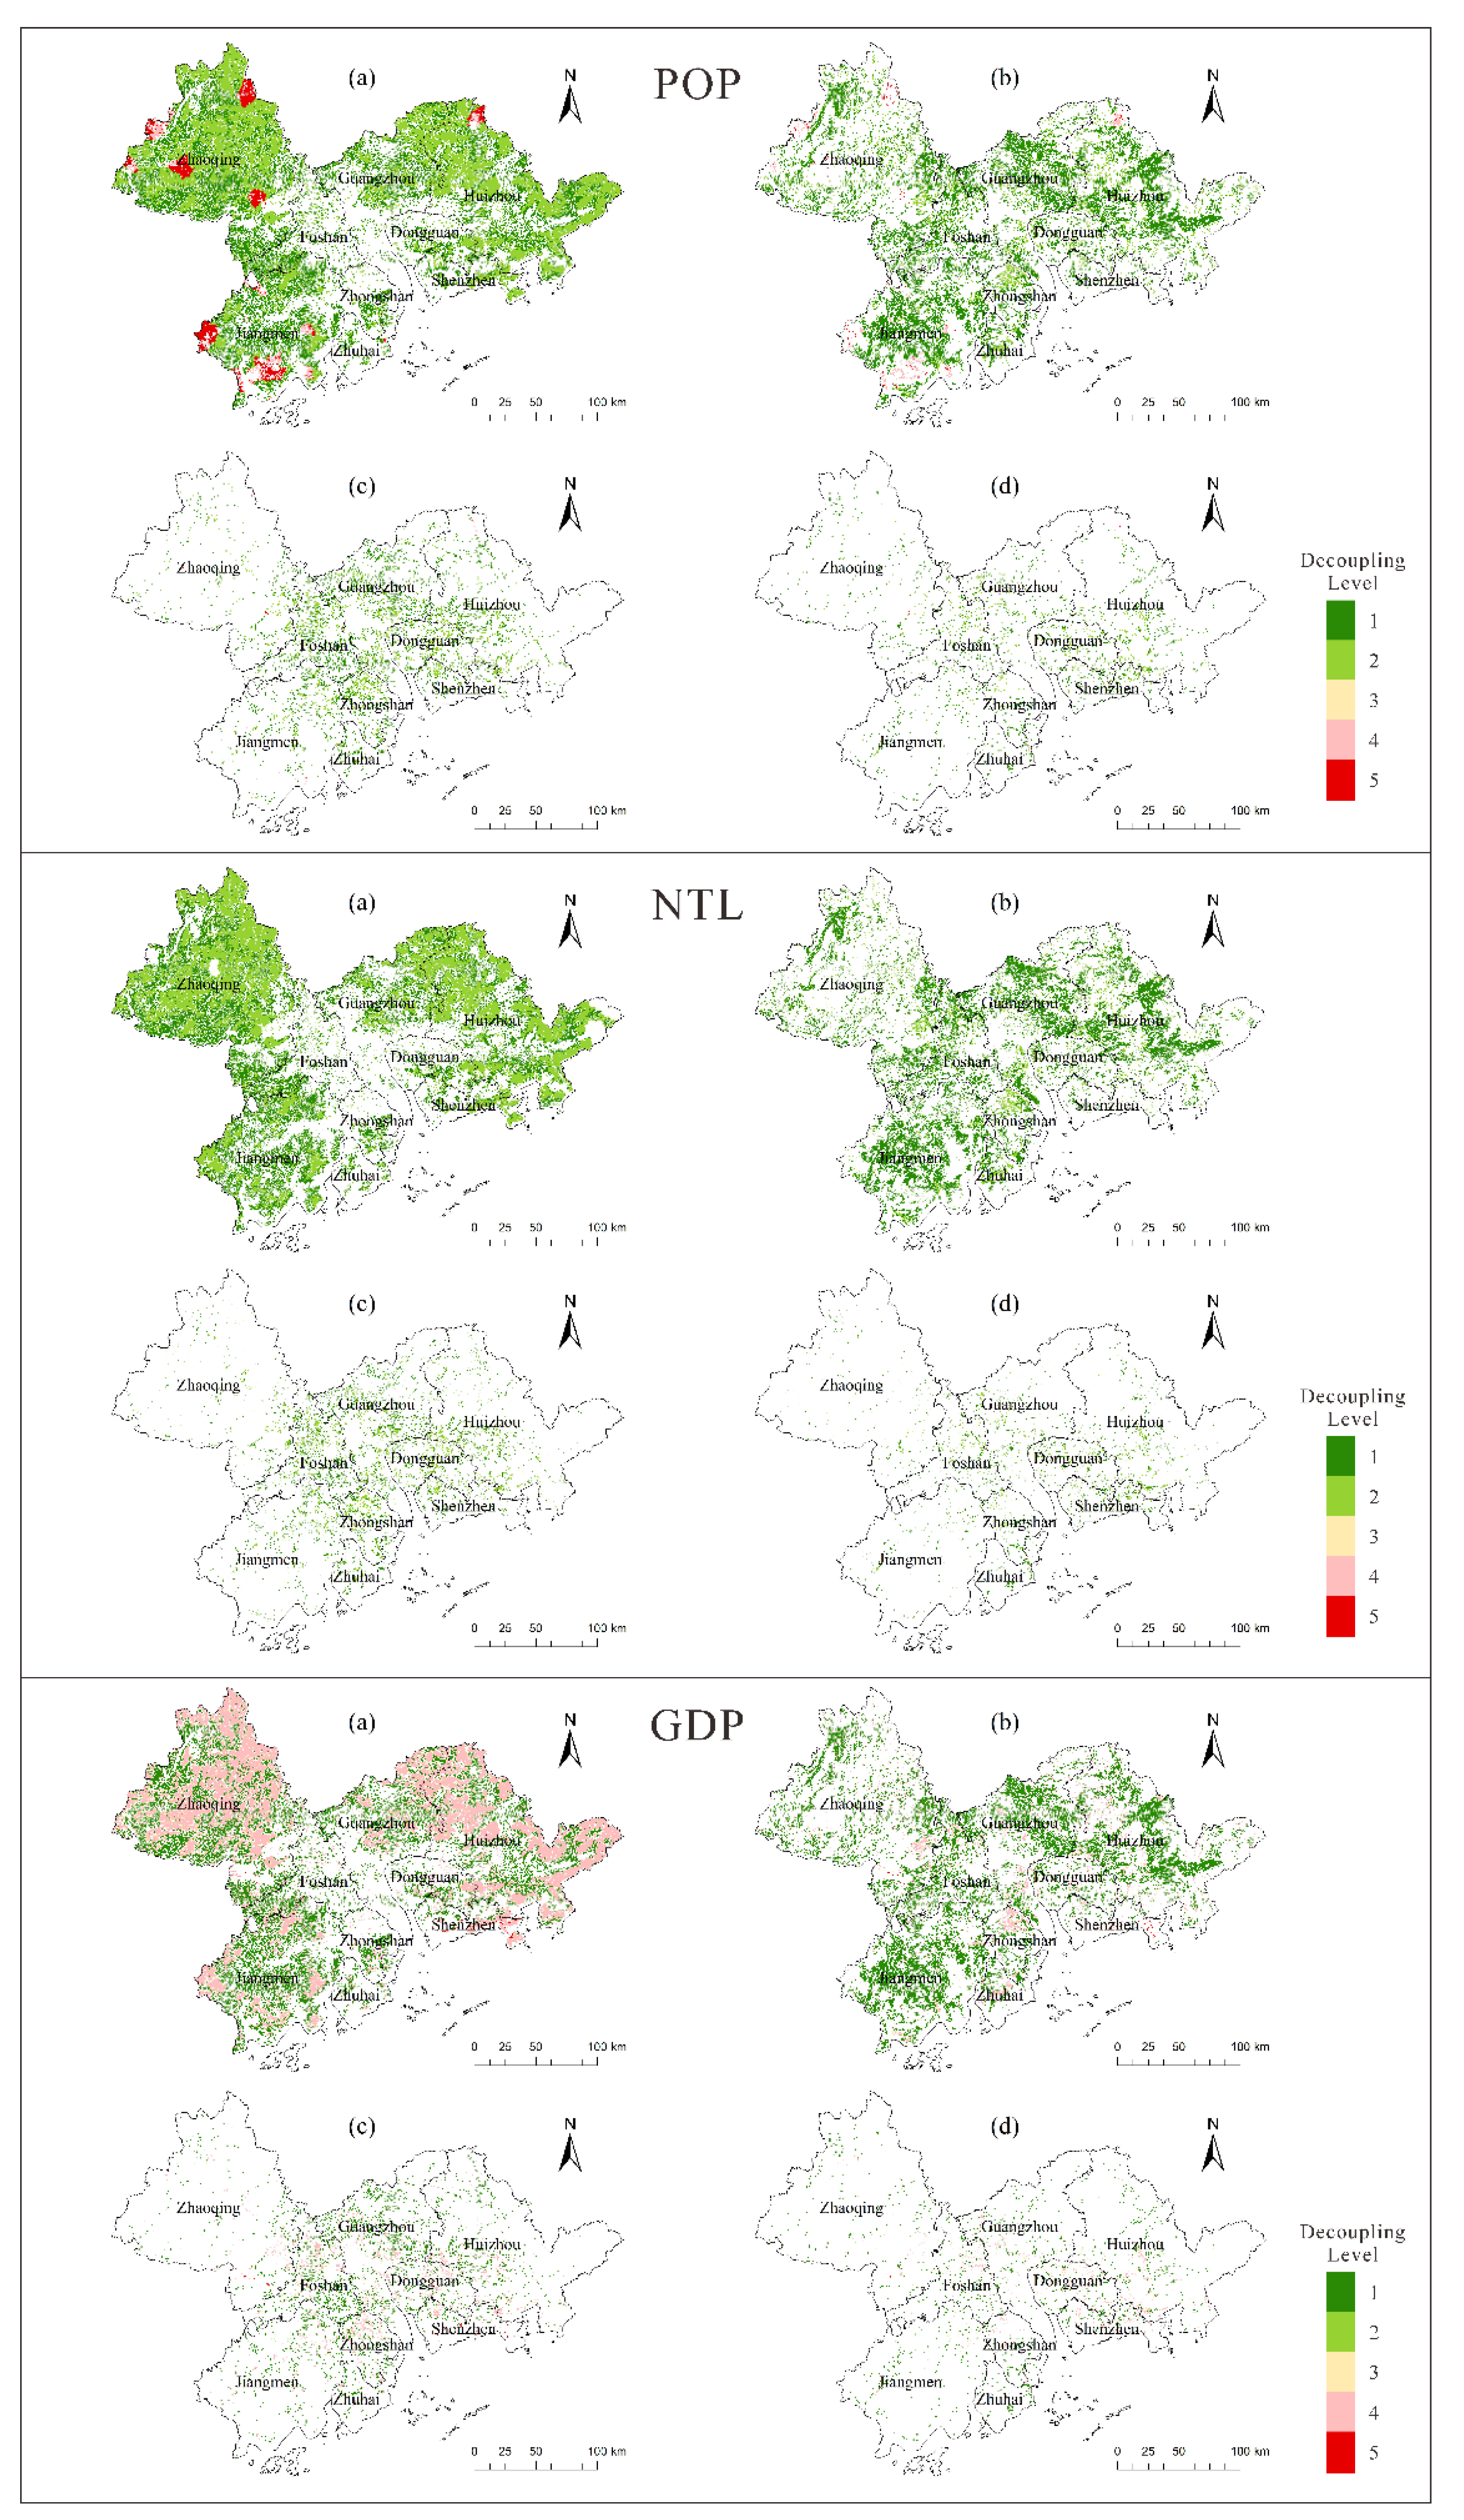
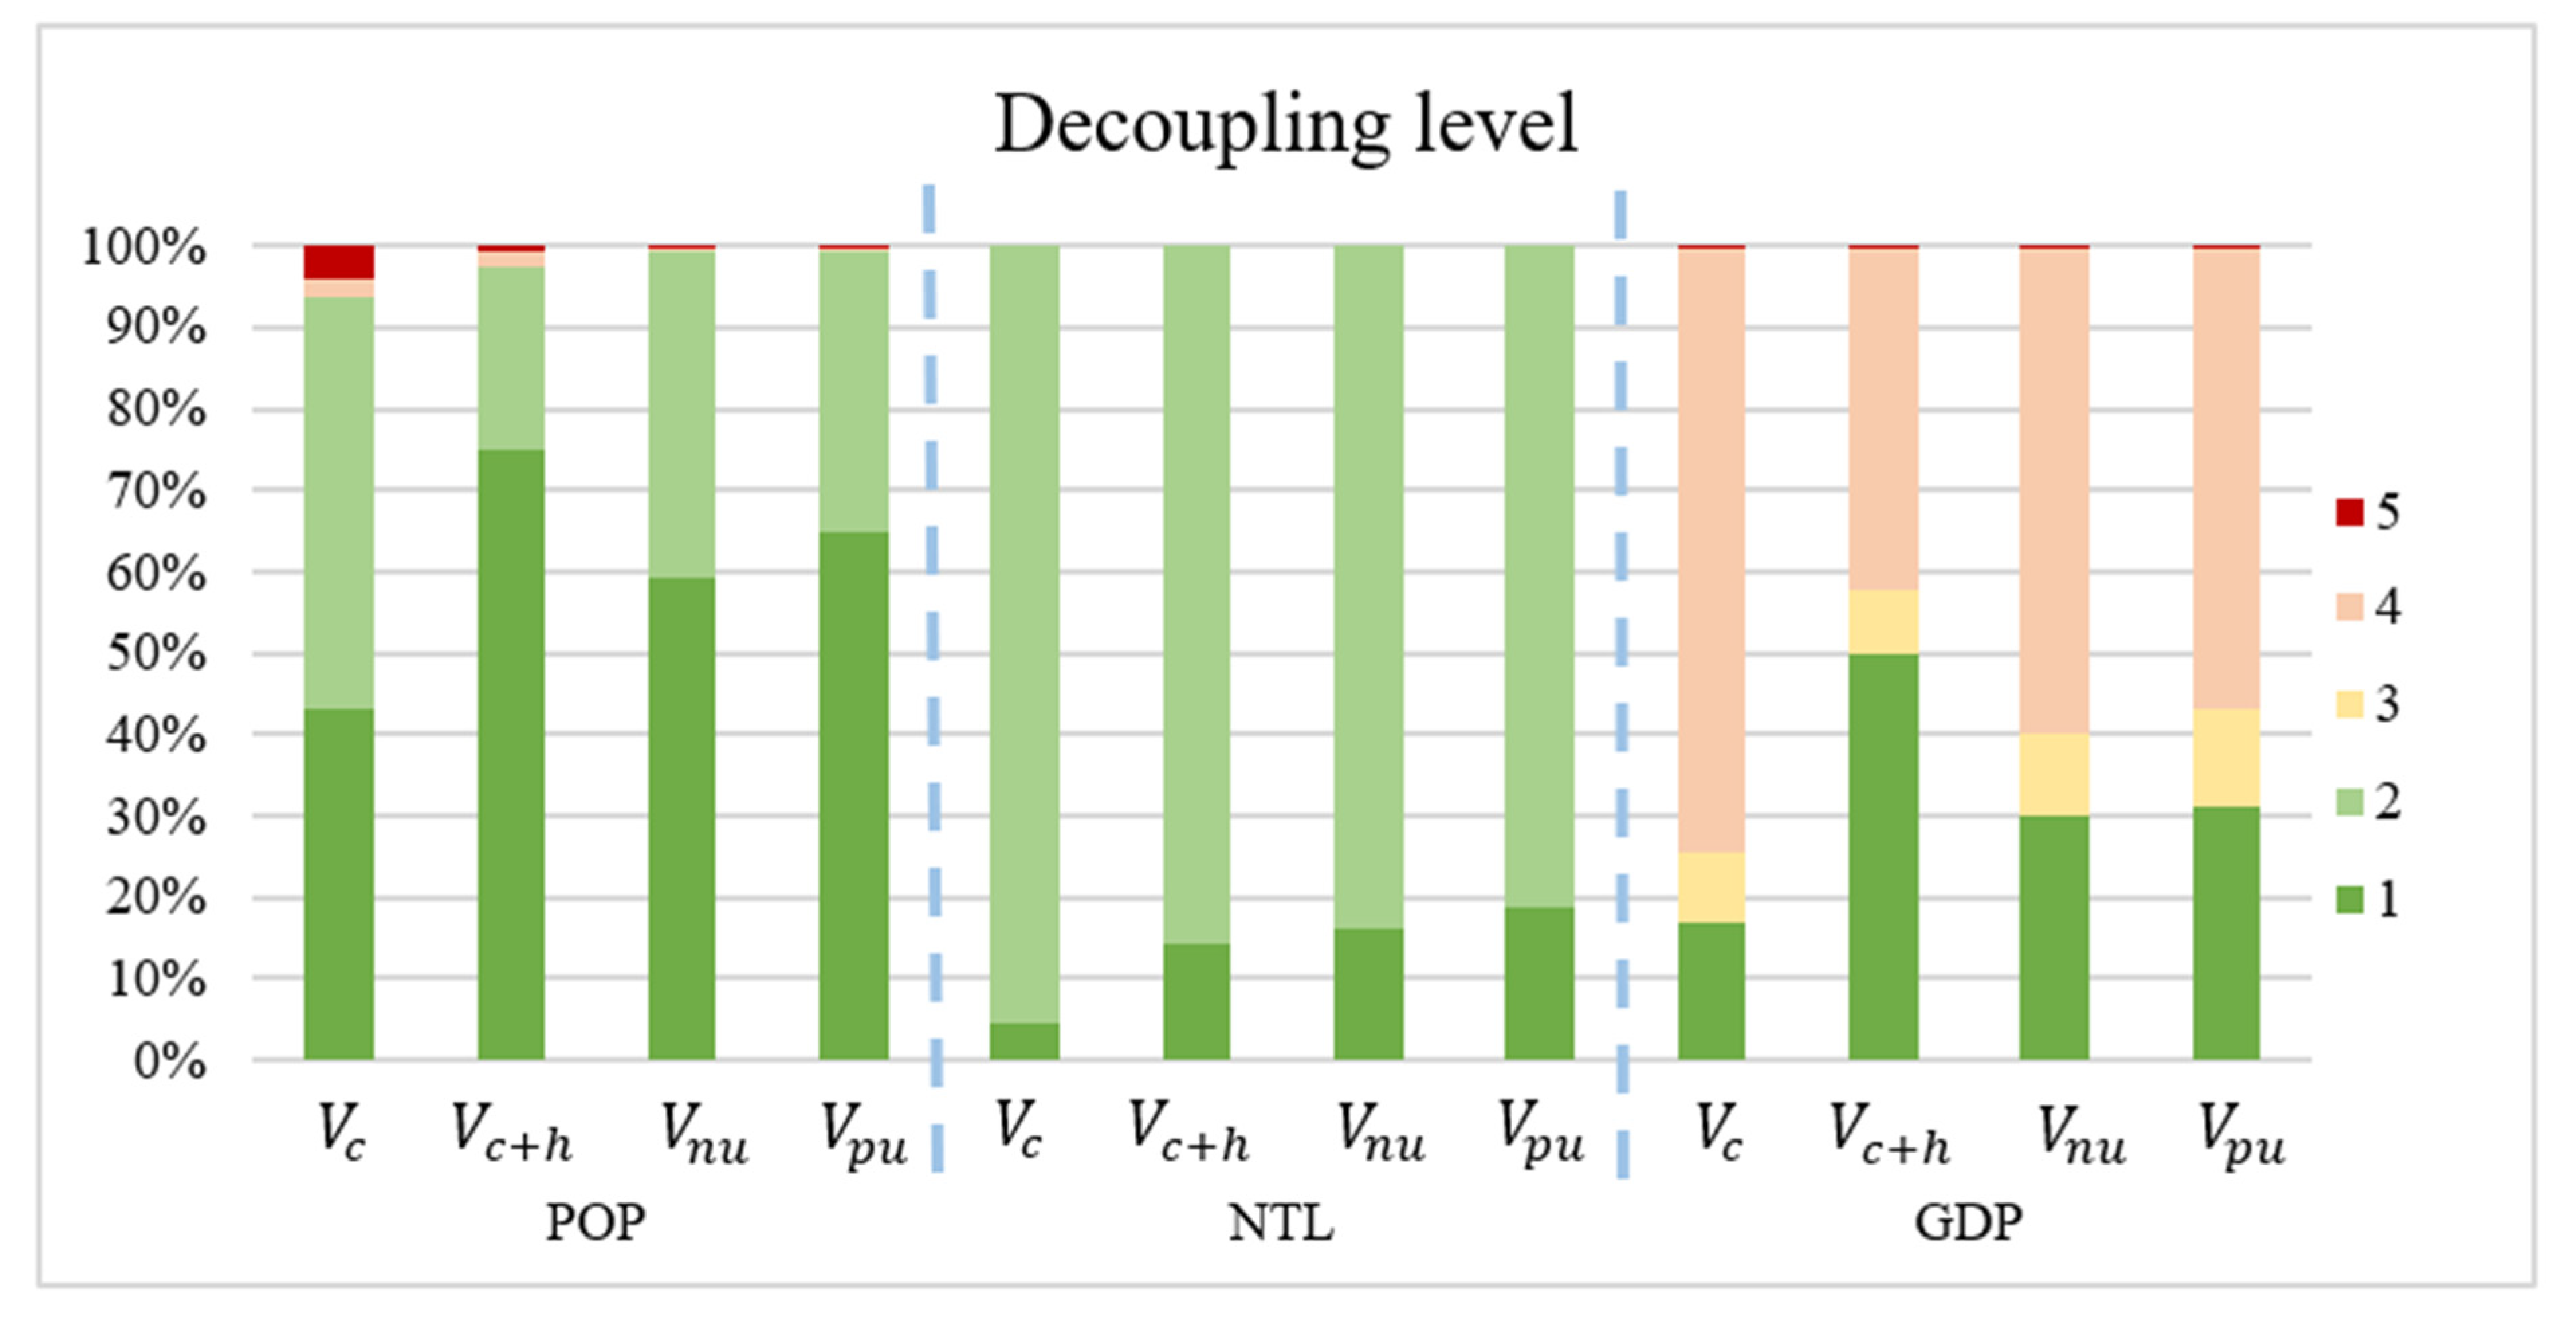
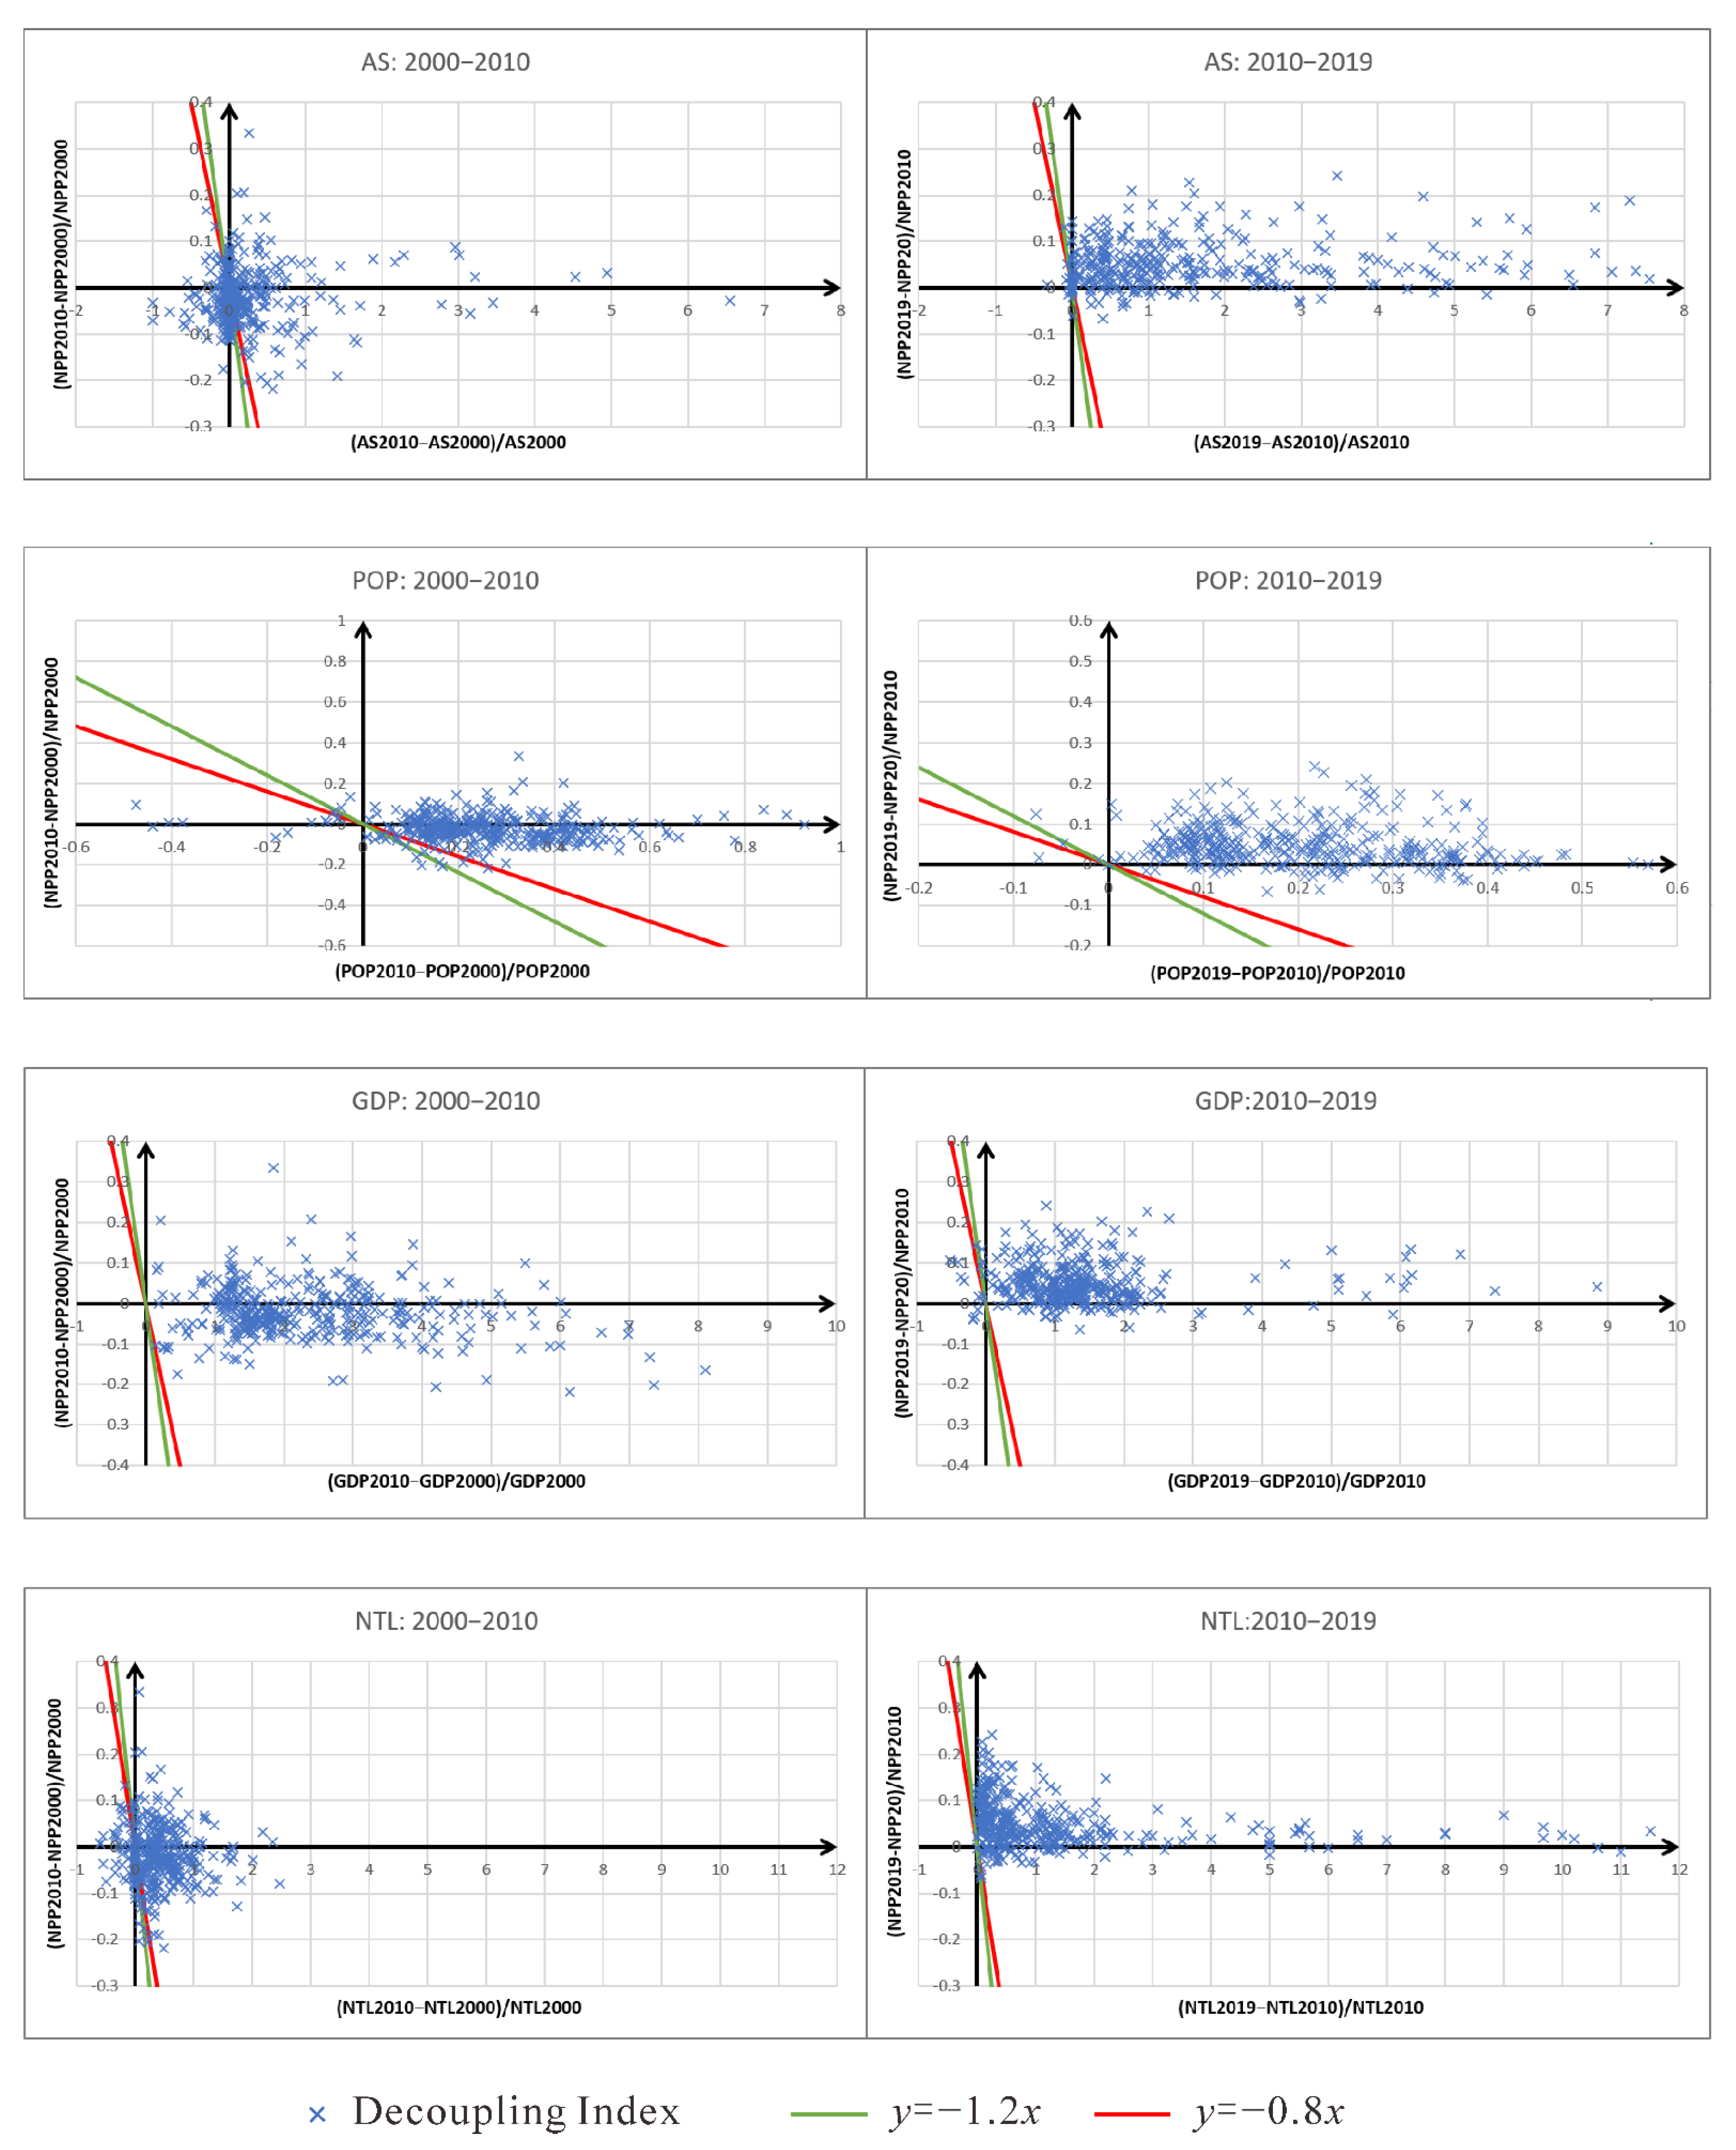
3.3. Decoupling Index of Socioeconomic Factors and Carbon Sequestration Service Capacity

The complex urbanization process and human activities are quantified by POP, NTL, and GDP. The decoupling relationship between these three social and economic factors and NPP is shown in Figure 8 and Figure 9 to reflect the dependence of urban development on NPP.
As indicated in Figure 8, the decoupling relationship between POP and NPP in most regions of the PRD was levels 1 and 2, indicating that population density increase in the PRD from 2000 to 2019 had little impact on the enhanced carbon sequestration capacity. Figure 10 shows that in V c , 93.87% of the region was at levels 1 and 2 decoupling, whereas 4.00% of the region was still at level 5 (strongly negative) decoupling, which was mainly distributed in Zhaoqing and Jiangmen. Among the four types of regions, level 1 decoupling of V c + h accounted for the largest area (75.17%), but there were small areas of levels 4 and 5 decoupling at the border of the PRD, such as to the north of Zhaoqing, the north of Huizhou, and the southwest of Jiangmen. The decoupling relationship between POP and NPP in 99.38% of V n u reached levels 1 and 2, indicating that the independent development of population density and carbon sequestration capacity was emphasized in the expansion process of new urban land. In V p u , the area with levels 1 and 2 decoupling (99.23%) was second only to V n u , indicating that POP and NPP had good coordinated development within the original urban area.
NTL can reflect human economic activities, and its decoupling relationship with NPP is shown in Figure 8. Combined with Figure 10, it can be seen that although the area of level 1 decoupling between NTL and NPP was considerably smaller than that of POP during the study period, the area of level 2 decoupling accounted for more than 80%. The total area of levels 1 and 2 decoupling was greater than 99.9%, indicating that human economic activities and carbon sequestration capacity in almost the entire PRD are in a relatively coordinated development process. Outside urban land, the decoupling relationship between NTL and NPP in V c + h was better than that in V c . Within the urban land range, the decoupling relationship between NTL and NPP in V n u was slightly worse than that in V p u . In V n u and V p u , the proportion of the levels 1 and 2 decoupling relationship was larger than that of V c and V c + h , indicating that the coordinated development of economic activities and carbon sequestration capacity within the PRD is better than that outside the city.
As a reflection of the results of human production activities, GDP can measure the development level and economic status of the PRD. The spatial distribution of its decoupling relationship with NPP is shown in Figure 8. Combined with Figure 10, 16.93% of the regions in V c had a decoupling relationship between GDP and NPP at level 1, which was mainly distributed in Jiangmen City. The maximum proportion of levels 4 and 5 decoupling was 74.45%, which was widely distributed in Zhaoqing and Huizhou cities. Although the vegetation in these two cities is in a good growth state, it is vulnerable to human production activities (Figure 3). The decoupling of V c + h was slightly better than that of V c , but the decoupling relationship between GDP and NPP in 42.19% of V c + h was still at levels 4 and 5, and was mainly distributed in the north of Zhongshan, the middle of Zhuhai, and the east of Zhaoqing. Moreover, the maximum proportion of level 1 decoupling was 49.79%, which was higher than in the other three regions, indicating that vegetation has good adaptability to human production activities in V c + h , and the carbon sequestration capacity of most regions is unlikely to decrease because of increased GDP. Within the urban area, the proportion of the area with level 1 decoupling between GDP and NPP in V n u was 29.97%, which was slightly lower than that in V p u (31.12%), indicating that the NPP of vegetation in the original urban land is more adaptable to human production activities.
The decoupling relationship between the three socioeconomic factors and NPP is summarized in Figure 9, and two main results were obtained. (1) By comparing the decoupling relationships between POP and NTL and between POP and NPP, it was found that the coordinated development of POP and NPP was the best. Moreover, GDP development had the most severe impact on NPP. Levels 4 and 5 decoupling of NTL accounted for the smallest area, indicating that NPP and NTL can develop in unison in most regions. (2) V c had the least first-order decoupling, whereas V c + h and V p u had the most first-order decoupling. The decoupling relationship between human activities and NPP was worse in V c than in V c + h , but better in V p u than in V n u . This indicates that NPP has a stronger ability to adapt to social and economic development in the region with human activities, and the longer the appropriate human activities, the better the coordinated development of NPP and urbanization.

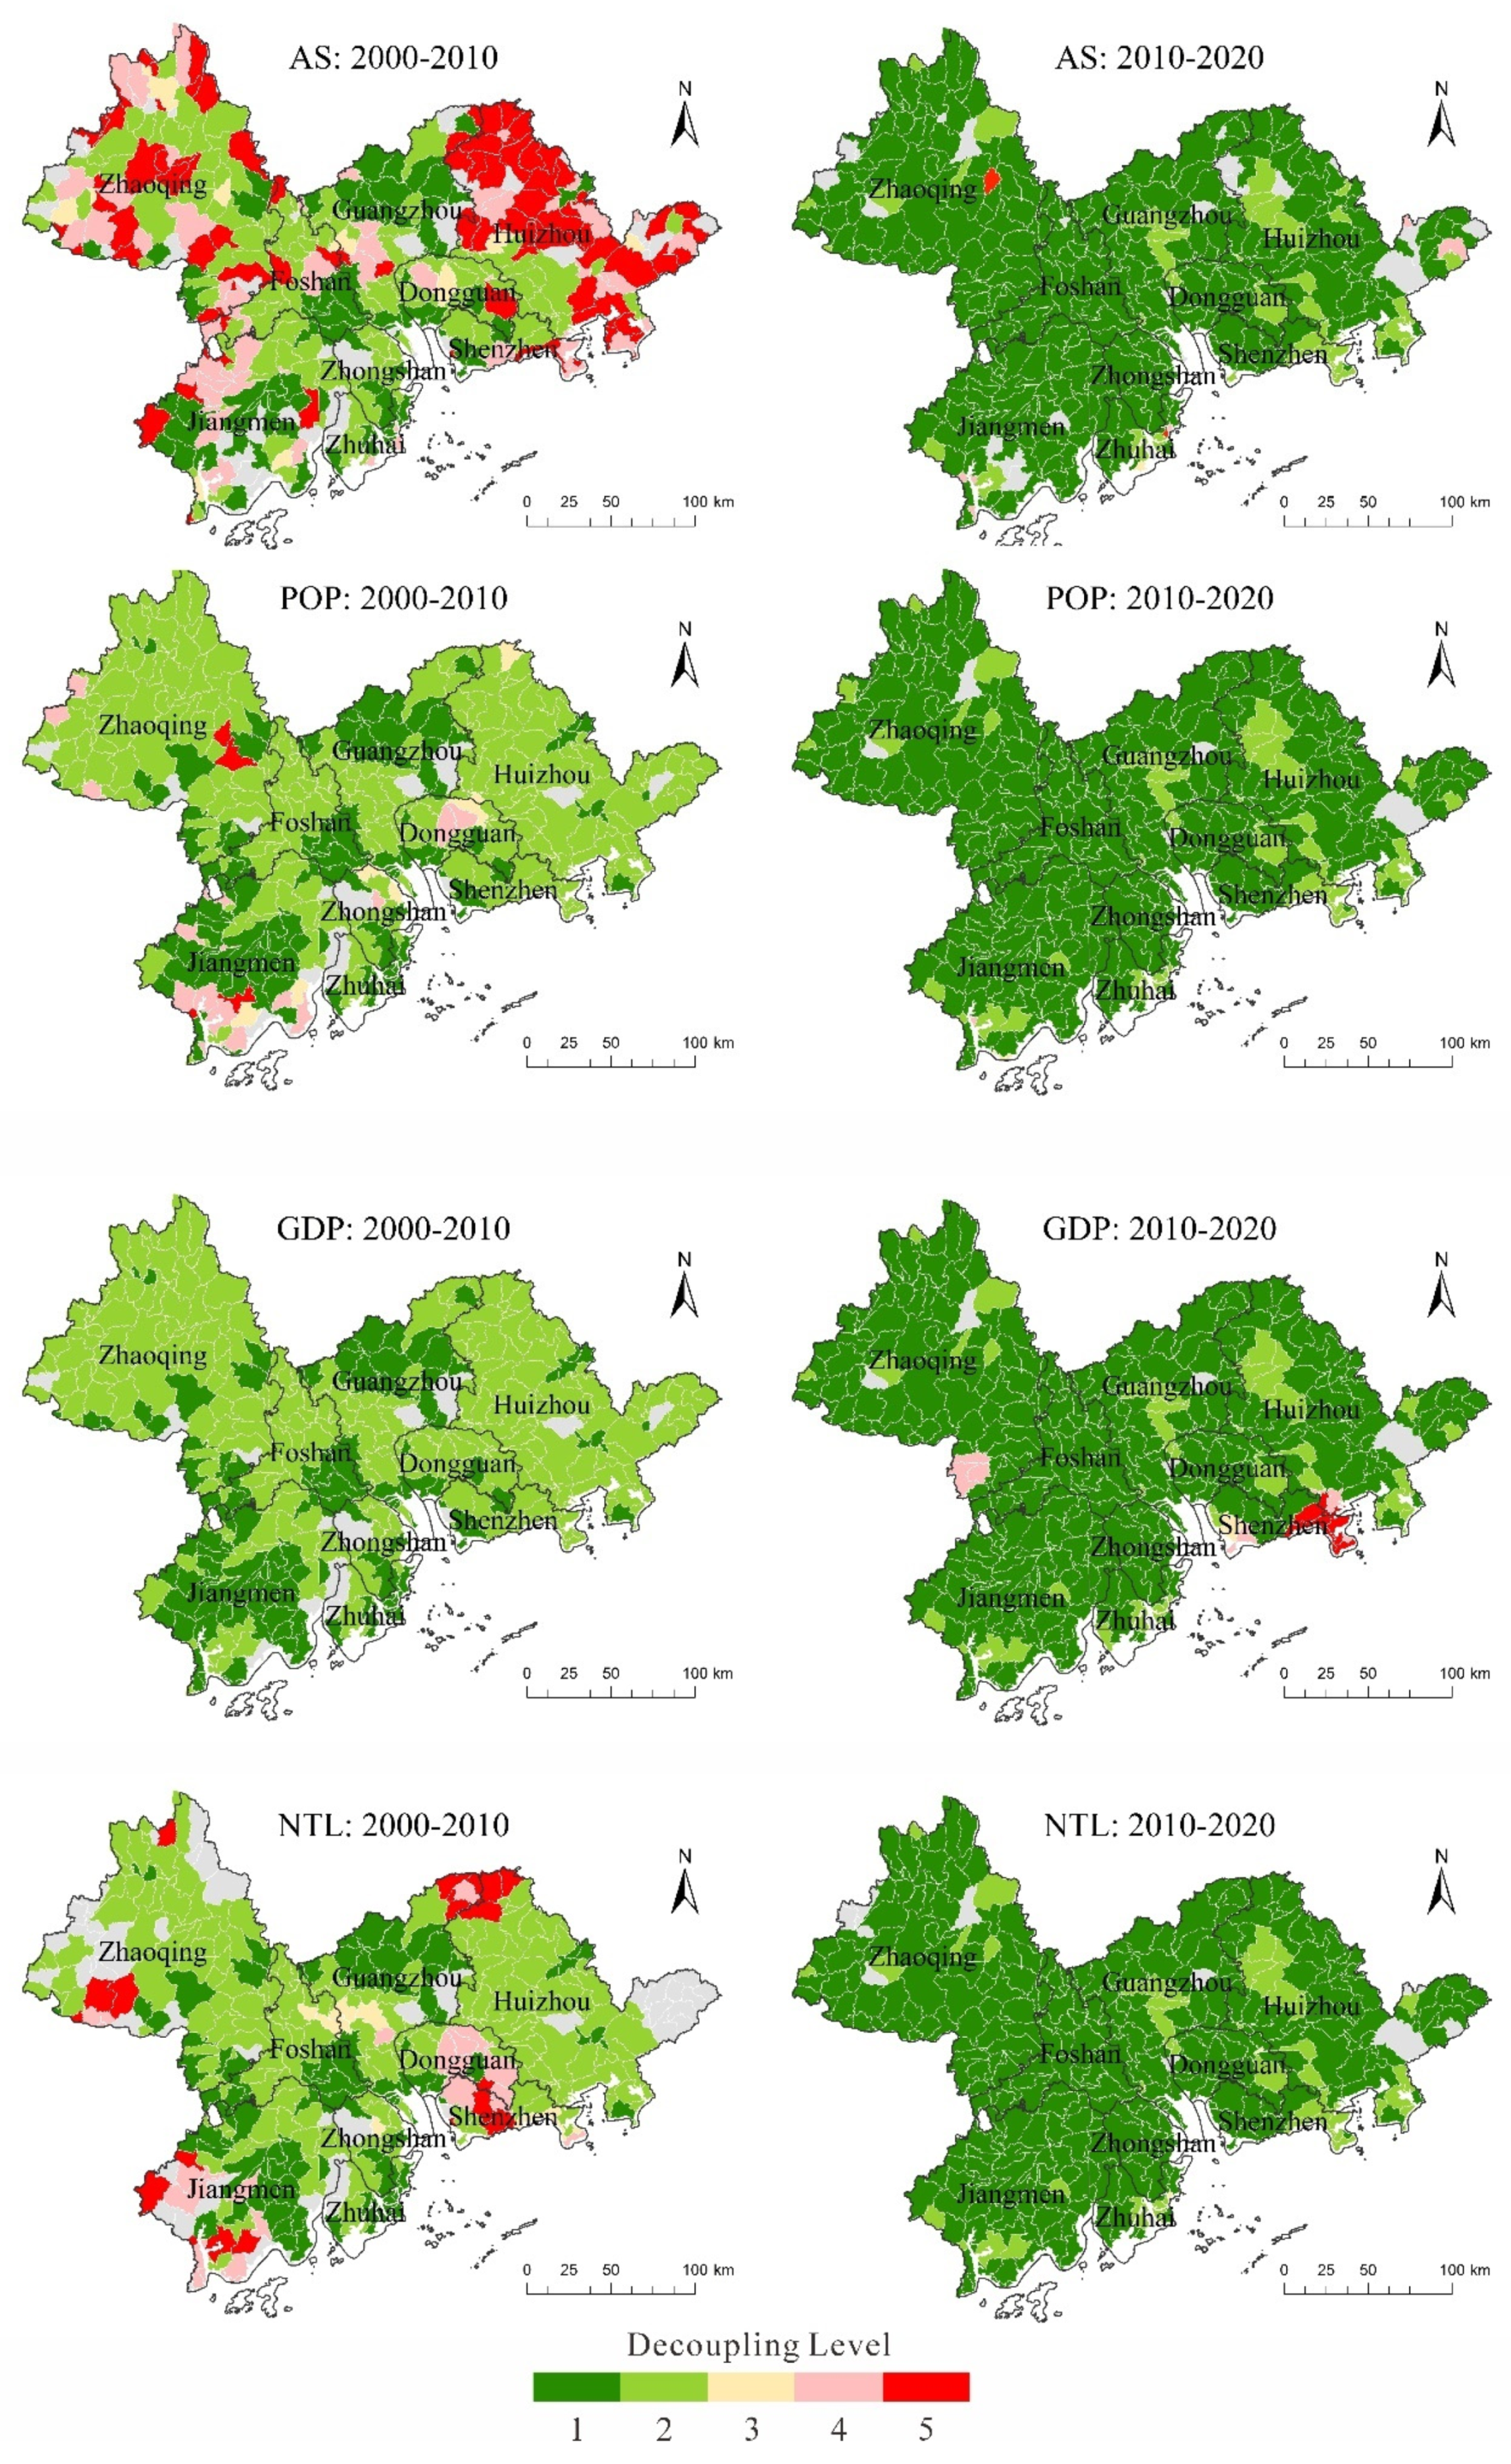
3.4. Change in the Decoupling Index in the Process of Urban Development

To reflect the impact of policies in different periods on the carbon sequestration capacity of the PRD, NPP trends from 2000 to 2010 and 2010 to 2019 were calculated with 2010 as the cut-off point (Figure 11). The decoupling relationship between NPP and POP, GDP, NTL, and AS in these two periods is compared in Figure 12 based on the results in Figure 11.
NPP shows a declining trend in most regions before 2010, but improves during 2010–2019 (Figure 10). There were significant decreases in NPP in Zhaoqing, Huizhou, and Guangzhou during 2000–2010. The most serious decreases were in the middle of Zhaoqing and the north of Huizhou, whereas NPP increased in the southwest of Jiangmen, the southeast of Foshan, and the north of Guangzhou. From 2010 to 2019, the NPP trends in all river basins in the PRD were greater than −4 g C/(m2·y), and nearly 50% of the river basins had a significant increase in NPP, which was mainly distributed in cities other than Guangzhou and Huizhou. The NPP trends showed significant changes from 2000 to 2019. More than 50% of the basins showed an increasing NPP trend, and a small number of basins showed a decreasing NPP trend of less than −8 g C/(m2·y), which were mainly distributed in Zhaoqing and Huizhou, with a high forest coverage rate.
Figure 11 compares the decoupling relationship between NPP and four types of socioeconomic factors before and after 2010 at the watershed scale, and illustrates that the decoupling relationship between each factor and NPP improved after 2010. In Figure 11, each scatter plot represents the decoupling relationship among factors in a basin, and the meaning of the interval in which the scatter is located is marked in Figure 2. It was found that (1) the decoupling relationship between AS and NPP in many basins changed from level 2 to level 5 before 2010, and to level 1 after 2010, and the basins with a level 5 decoupling relationship between AS and NPP before 2010 were mainly distributed in Huizhou and Zhaoqing (Figure 12). (2) At the watershed scale, the decoupling relationship between POP and NPP from 2000 to 2010 was mainly level 2, and a small number of basins in Zhaoqing, Dongguan, and Jiangmen showed levels 4 and 5. After 2010, almost all basins were upgraded to level 1 decoupling. (3) The relationship between GDP and NPP in all basins was level 1 or 2 from 2000 to 2010, and most of the level 2 decoupling changed to level 1 after 2010. However, a small amount of levels 4 and 5 decoupling occurred in Shenzhen and Zhaoqing. (4) NTL and NPP in a small number of basins showed levels 3 to 5 decoupling before 2010, but all improved to level 1 or 2 decoupling during 2010–2019.
In general, the carbon sequestration capacity of the PRD after 2010 was better than that during 2000–2010, and the degree of coordinated development between the carbon sequestration capacity and social economy improved, which might have been because of the Pearl River Delta National Forest Urban Agglomeration Construction Plan issued after 2010, which helps to improve the stability of the natural ecosystem and carbon sequestration service function.

4. Discussion

The degradation of carbon sequestration service capacity during urbanization is the main cause of global warming. Improving the carbon sequestration service capacity at the same time as urban expansion and economic development has become an urgent problem [50,51]. In recent years, the development and utilization of natural resources have often only focused on their short-term economic value and ignored the impact on climate change and the carbon cycle, resulting in a serious loss of ecological space and function, which is not conducive to ecological construction and the control of global warming. These problems affect social and economic development and have a significant impact on human wellbeing and natural capital. Governments and planners need to work together to determine how to achieve carbon neutrality while also determining efficient, harmonious, and sustainable methods of economic growth and social development.
Despite the continuous expansion of the PRD urban agglomeration, continuous population growth, rapid economic development, and clear fluctuations in climate conditions have led to significant changes in the ecosystem. However, as the first national forest city group in China, the PRD places significant importance to carbon emission reduction and carbon sequestration. Using the PRD as the study area, this study (1) quantified the relative contribution of human activities and climatic factors to carbon sequestration services more accurately by separating the four types of regions, (2) demonstrated the decoupling relationship between socioeconomic development and carbon sequestration services by combining decoupling analysis with the SEN+MK method, and (3) found that the decoupling relationship between carbon sequestration services and socioeconomic factors and the change trend of NPP changed significantly before and after 2010.
The contribution of human activities to NPP may be overestimated because human activities have little impact on vegetation in areas far from humans. Recent studies have eliminated this bias by separating areas of natural vegetation affected only by climate from areas affected by humans [10]. However, they do not reflect differences within and outside urban land. Considering that human activities within urban land contribute more to NPP, this study separated V c , V c + h , V n u , and V p u regions and calculated the effects of NPP trends and drivers on NPP based on SEN+MK trend analysis and the RESTREND method. In addition to measuring the contribution of climatic factors and human activities to NPP more accurately, it was found that the contribution of human activities to NPP outside urban land was mainly positive, whereas that inside urban land was mainly negative. Moreover, in urban land, the positive contribution of human activities to the NPP of V n u was higher than that of V p u . This shows that the recovery measures of carbon sequestration service capacity outside the urban land of the PRD have achieved a good effect, and also show that the PRD has effectively controlled the negative impact of economic development on carbon sequestration service during urban expansion.
Rapid urban development often occurs with a decrease in NPP, and therefore, it is necessary to analyze the decoupling relationship between NPP and urbanization. Based on the trend analysis, a decoupling analysis of NPP and three typical socioeconomic factors was conducted. The results showed that NPP is more adaptable to socioeconomic development in regions with human activities, and appropriate human activities can help to improve the coordinated development of NPP and urbanization. To further reflect the changes in decoupling status, this study took 2010 as the node to compare the decoupling relationship between carbon sequestration services and urban development in two periods. The results showed that because of the implementation of a series of policies, such as the Pearl River Delta National Forest Urban Agglomeration Construction Plan, not only did the decline in NPP decrease, but also the coordinated development of social and economic factors and NPP improved from 2010 to 2019. In addition, the Guangdong–Hong Kong–Macao Greater Bay Area Development Planning Outline, which was released in 2019 [52], clearly requires the promotion of sustainable development, the establishment of ecological protection barriers, the implementation of major ecological protection and restoration projects, the demarcation and strict observance of ecological protection red lines, and the strengthening of the protection of forest ecosystems around the PRD. After the implementation of this ecological protection policy, the growth trend of NPP in the PRD will gradually improve, and the coverage area of strong decoupling will be wider. On the basis of the formulation and implementation of these policies, to reduce carbon emissions without affecting economic growth, the industrial structure should be further optimized, the proportion of renewable energy should be increased, and investment in research and development of low-carbon technologies should be increased so that urban development and carbon sequestration services can achieve complete decoupling as soon as possible to provide a solid foundation for carbon neutrality.
This study had some limitations. Precipitation, temperature, and sunshine duration were selected as the climatic factors affecting NPP change in this study, which may have ignored the influence of other factors, such as CO2 concentration and nitrogen deposition on NPP change. This may have led to some deviation in calculating the impact of human activities on NPP. Furthermore, although RESTREND is the most commonly used method for quantifying the impact of climate change and human activities on NPP, its default linear relationship between variables may have affected quantification.

5. Conclusions

This study first improved the existing two-step RESTREND method [10] to separate V c , V c + h , V n u , and V p u and quantified the contribution of meteorological changes and human activities to carbon sequestration in the PRD. The decoupling relationship between socioeconomic factors and NPP was discussed via decoupling analysis.
In general, this study found that the dependence of social and economic factors on NPP in the PRD has been reduced since 2010. Beneficial human activities, such as converting farmland to forests and building ecological corridors, can provide a solid overall foundation for carbon neutrality. As the first national forest urban agglomeration in China, the PRD has taken effective measures, such as carbon sequestration afforestation and forest transformation, to compensate for the negative impact of urban occupation on NPP, and has preliminarily formed a low-carbon urban agglomeration with a coordinated development of the social economy and carbon sequestration. The conclusions are divided into four specific sections:
(1) In the process of urban expansion, the PRD pays more attention to the protection of carbon sequestration capacity. Within the urban area, the NPP value of new urban land is higher than that of original urban land. However, the NPP of original urban land showed a strong improvement trend until 2019.
(2) The contribution of human activities to NPP was 1.55 g C/(m2·y), which was higher than that of meteorological change. Among the meteorological factors, the decrease in sunshine duration made a significant negative contribution to NPP. Precipitation also made a negative contribution to NPP, although it was negligible. The impact of temperature on the NPP trend was mainly positive, which was similar to the results of previous studies [20].
(3) The adaptability of NPP to socioeconomic development was stronger in regions with human activities. The longer the suitable human activities, the better the coordinated development of NPP and urbanization.
(4) The carbon sequestration capacity of the PRD from 2010 to 2019 was better than that before 2010, and the degree of coordinated development between carbon sequestration capacity and social economy gradually improved. NPP showed a downward trend in most regions until 2010, but increased in 2010–2019.

Author Contributions

Conceptualization, X.L.; methodology, X.L. and Y.L.; writing—original draft preparation, X.L.; writing—review and editing, X.L. and Y.L.; visualization, X.L.; supervision, J.W.; funding acquisition, J.W. All authors have read and agreed to the published version of the manuscript.

Funding

This research was funded by the National Natural Science Foundation of China (No. 42130505) and Shenzhen Fundamental Research Program (No. GXWD20201231165807007-20200816003026001).

Conflicts of Interest

The authors declare no conflict of interest. The funders had no role in the study design, collection, analyses, or interpretation of data; the writing of the manuscript; or the decision to publish the results.

Appendix A

Figure A1. Contribution of meteorological factors to net primary productivity (NPP) and the changing trend of meteorological factors.
Remotesensing 14 00526 g0a1

References

  1. Raich, J.W.; Schlesinger, W.H. The global carbon dioxide flux in soil respiration and its relationship to vegetation and climate. Tellus Ser. B 1992, 44B, 81–99. [Google Scholar] [CrossRef] [Green Version]
  2. Ciais, P.; Reichstein, M.; Viovy, N.; Granier, A.; Ogée, J.; Allard, V.; Aubinet, M.; Buchmann, N.; Bernhofer, C.; Carrara, A.; et al. Europe-wide reduction in primary productivity caused by the heat and drought in 2003. Nature 2005, 437, 529–533. [Google Scholar] [CrossRef] [PubMed]
  3. Nemani, R.R.; Keeling, C.D.; Hashimoto, H.; Jolly, W.M.; Piper, S.C.; Tucker, C.J.; Myneni, R.B.; Running, S.W. Climate-driven increases in global terrestrial net primary production from 1982 to 1999. Science 2003, 300, 1560. [Google Scholar] [CrossRef] [Green Version]
  4. Li, J.; Wang, Z.; Lai, C. Severe drought events inducing large decrease of net primary productivity in mainland China during 1982–2015. Sci. Total Environ. 2020, 703, 135541. [Google Scholar] [CrossRef] [PubMed]
  5. Teng, M.; Zeng, L.; Hu, W.; Wang, P.; Yan, Z.; He, W.; Zhang, Y.; Huang, Z.; Xiao, W. The impacts of climate changes and human activities on net primary productivity vary across an ecotone zone in Northwest China. Sci. Total Environ. 2020, 714, 136691. [Google Scholar] [CrossRef] [PubMed]
  6. Jiang, Y.; Guo, J.; Peng, Q.; Guan, Y.; Zhang, Y.; Zhang, R. The effects of climate factors and human activities on net primary productivity in Xinjiang. Int. J. Biometeorol. 2020, 64, 765–777. [Google Scholar] [CrossRef]
  7. Wu, Y.Y.; Wu, Z.F.; Yu, S.X. Quantitative assessment of the impacts of human activities on net primary productivity. Chin. J. Appl. Ecol. 2017, 28, 1697. [Google Scholar] [CrossRef]
  8. Yin, L.; Dai, E.; Zheng, D.; Wang, Y.; Ma, L.; Tong, M. What drives the vegetation dynamics in the Hengduan Mountain region, southwest China: Climate change or human activity? Ecol. Indic. 2020, 112, 106013. [Google Scholar] [CrossRef]
  9. Zhai, T.; Wang, J.; Fang, Y.; Qin, Y.; Huang, L.; Chen, Y. Assessing ecological risks caused by human activities in rapid urbanization coastal areas: Towards an integrated approach to determining key areas of terrestrial-oceanic ecosystems preservation and restoration. Sci. Total Environ. 2020, 708, 135153. [Google Scholar] [CrossRef] [PubMed]
  10. Ge, W.; Deng, L.; Wang, F.; Han, J. Quantifying the contributions of human activities and climate change to vegetation net primary productivity dynamics in China from 2001 to 2016. Sci. Total Environ. 2021, 773, 145648. [Google Scholar] [CrossRef]
  11. Liu, X.; Pei, F.; Wen, Y.; Li, X.; Wang, S.; Wu, C.; Cai, Y.; Wu, J.; Chen, J.; Feng, K.; et al. Global urban expansion offsets climate-driven increases in terrestrial net primary productivity. Nat. Commun. 2019, 10, 5558. [Google Scholar] [CrossRef] [PubMed] [Green Version]
  12. Wen, Y.; Liu, X.; Bai, Y.; Sun, Y.; Yang, J.; Lin, K.; Pei, F.; Yan, Y. Determining the impacts of climate change and urban expansion on terrestrial net primary production in China. J. Environ. Manage. 2019, 240, 75–83. [Google Scholar] [CrossRef]
  13. Imhoff, M.L.; Bounoua, L.; Ricketts, T.; Loucks, C.; Harriss, R.; Lawrence, W.T. Global patterns in human consumption of net primary production. Nature 2004, 429, 870–873. [Google Scholar] [CrossRef] [PubMed] [Green Version]
  14. Huang, Q.; Liu, Z.; He, C.; Gou, S.; Bai, Y.; Wang, Y.; Shen, M. The occupation of cropland by global urban expansion from 1992 to 2016 and its implications. Environ. Res. Lett. 2020, 15, 084037. [Google Scholar] [CrossRef] [Green Version]
  15. Krausmann, F.; Erb, K.H.; Gingrich, S.; Haberl, H.; Bondeau, A.; Gaube, V.; Lauk, C.; Plutzar, C.; Searchinger, T.D. Global human appropriation of net primary production doubled in the 20th century. Proc. Natl. Acad. Sci. USA 2013, 110, 10324–10329. [Google Scholar] [CrossRef] [PubMed] [Green Version]
  16. Welegedara, N.P.Y.; Grant, R.F.; Quideau, S.A.; Landhäusser, S.M.; Merlin, M.; Lloret, E. Modelling plant water relations and net primary productivity as affected by reclamation cover depth in reclaimed forestlands of northern Alberta. Plant Soil 2020, 446, 627–654. [Google Scholar] [CrossRef]
  17. Fang, X.; Zhang, C.; Wang, Q.; Chen, X.; Ding, J.; Karamage, F. Isolating and quantifying the effects of climate and CO2 changes (1980–2014) on the net primary productivity in arid and semiarid China. Forests 2017, 8, 60. [Google Scholar] [CrossRef] [Green Version]
  18. Chen, T.; Bao, A.; Jiapaer, G.; Guo, H.; Zheng, G.; Jiang, L.; Chang, C.; Tuerhanjiang, L. Disentangling the relative impacts of climate change and human activities on arid and semiarid grasslands in Central Asia during 1982–2015. Sci. Total Environ. 2019, 653, 1311–1325. [Google Scholar] [CrossRef]
  19. Liu, H.; Cao, L.; Jia, J.; Gong, H.; Qi, X.; Xu, X. Effects of land use changes on the nonlinear trends of net primary productivity in arid and semiarid areas, China. L. Degrad. Dev. 2021, 32, 2183–2196. [Google Scholar] [CrossRef]
  20. Zhang, H.; Sun, R.; Peng, D.; Yang, X.; Wang, Y.; Hu, Y.; Zheng, S.; Zhang, J.; Bai, J.; Li, Q. Spatiotemporal Dynamics of Net Primary Productivity in China’s Urban Lands during 1982–2015. Remote Sens. 2021, 13, 400. [Google Scholar] [CrossRef]
  21. Yang, H.; Zhong, X.; Deng, S.; Xu, H. Assessment of the impact of LUCC on NPP and its influencing factors in the Yangtze River basin, China. Catena 2021, 206, 105542. [Google Scholar] [CrossRef]
  22. Fu, A.; Li, W.; Chen, Y.; Wang, Y.; Hao, H.; Li, Y.; Sun, F.; Zhou, H.; Zhu, C.; Hao, X. The effects of ecological rehabilitation projects on the resilience of an extremely drought-prone desert riparian forest ecosystem in the Tarim River Basin, Xinjiang, China. Sci. Rep. 2021, 11, 18485. [Google Scholar] [CrossRef] [PubMed]
  23. Chen, F.; Li, H.B.; Liu, Y.J. Spatio-temporal differentiation and influencing factors of vegetation net primary productivity using GIS and CASA: A case study in Yuanyang county, Yunnan. Chin. J. Ecol. 2018, 37, 948–962. [Google Scholar] [CrossRef]
  24. Chen, Y.; Chen, L.; Cheng, Y.; Ju, W.; Chen, H.Y.H.; Ruan, H. Afforestation promotes the enhancement of forest LAI and NPP in China. For. Ecol. Manag. 2020, 462, 117990. [Google Scholar] [CrossRef]
  25. He, Y.; Piao, S.; Li, X.; Chen, A.; Qin, D. Global patterns of vegetation carbon use efficiency and their climate drivers deduced from MODIS satellite data and process-based models. Agric. For. Meteorol. 2018, 256–257, 150–158. [Google Scholar] [CrossRef]
  26. Chen, B.; Zhang, X.; Tao, J.; Wu, J.; Wang, J.; Shi, P.; Zhang, Y.; Yu, C. The impact of climate change and anthropogenic activities on alpine grassland over the Qinghai-Tibet Plateau. Agric. For. Meteorol. 2014, 189–190, 11–18. [Google Scholar] [CrossRef]
  27. Wang, Y.L.; Gong, R.; Wu, F.M.; Fan, W.W. Temporal and spatial variation characteristics of China shrubland net primary production and its response to climate change from 2001 to 2013. Chin. J. Plant Ecol. 2017, 41, 925–937. [Google Scholar] [CrossRef] [Green Version]
  28. Rong, T.; Long, L.H. Quantitative Assessment of NPP Changes in the Yellow River Source Area from 2001 to 2017. In Proceedings of the IOP Conference Series: Earth and Environmental Science, Zhuhai, China, 15–17 January 2021; Volume 687. [Google Scholar]
  29. He, C.; Tian, J.; Gao, B.; Zhao, Y. Differentiating climate- and human-induced drivers of grassland degradation in the Liao River Basin, China. Environ. Monit. Assess. 2015, 187, 4199. [Google Scholar] [CrossRef] [PubMed]
  30. Qi, X.; Jia, J.; Liu, H.; Lin, Z. Relative importance of climate change and human activities for vegetation changes on China’s silk road economic belt over multiple timescales. Catena 2019, 180, 224–237. [Google Scholar] [CrossRef]
  31. Tong, X.; Wang, K.; Yue, Y.; Brandt, M.; Liu, B.; Zhang, C.; Liao, C.; Fensholt, R. Quantifying the effectiveness of ecological restoration projects on long-term vegetation dynamics in the karst regions of Southwest China. Int. J. Appl. Earth Obs. Geoinf. 2017, 54, 105–113. [Google Scholar] [CrossRef] [Green Version]
  32. Guan, X.; Shen, H.; Li, X.; Gan, W.; Zhang, L. A long-term and comprehensive assessment of the urbanization-induced impacts on vegetation net primary productivity. Sci. Total Environ. 2019, 669, 342–352. [Google Scholar] [CrossRef]
  33. Wu, S.; Zhou, S.; Chen, D.; Wei, Z.; Dai, L.; Li, X. Determining the contributions of urbanisation and climate change to NPP variations over the last decade in the Yangtze River Delta, China. Sci. Total Environ. 2014, 472, 397–406. [Google Scholar] [CrossRef]
  34. Chen, S.; Jiang, H.; Chen, Y.; Cai, Z. Spatial-temporal patterns of net primary production in Anji (China) between 1984 and 2014. Ecol. Indic. 2020, 110, 105954. [Google Scholar] [CrossRef]
  35. Chen, T.; Feng, Z.; Zhao, H.; Wu, K. Identification of ecosystem service bundles and driving factors in Beijing and its surrounding areas. Sci. Total Environ. 2020, 711, 134687. [Google Scholar] [CrossRef]
  36. Wang, S.; Adhikari, K.; Zhuang, Q.; Gu, H.; Jin, X. Impacts of urbanization on soil organic carbon stocks in the northeast coastal agricultural areas of China. Sci. Total Environ. 2020, 721, 137814. [Google Scholar] [CrossRef]
  37. Nijhuis, S.; Xiong, L.; Cannatella, D. Towards a Landscape-based Regional Design Approach for Adaptive Transformation in Urbanizing Deltas. Res. Urban Ser. 2021, 6, 55–80. [Google Scholar] [CrossRef]
  38. Ding, Q.; Wang, L.; Fu, M.; Huang, N. An integrated system for rapid assessment of ecological quality based on remote sensing data. Environ. Sci. Pollut. Res. 2020, 27, 32779–32795. [Google Scholar] [CrossRef]
  39. Jun, C.; Ban, Y.; Li, S. Open access to Earth land-cover map. Nature 2014, 514, 434. [Google Scholar] [CrossRef] [Green Version]
  40. Li, X.; Zhou, Y.; Zhao, M.; Zhao, X. A harmonized global nighttime light dataset 1992–2018. Sci. Data 2020, 7, 168. [Google Scholar] [CrossRef]
  41. Zhang, Y.; Zhang, C.; Wang, Z.; Chen, Y.; Gang, C.; An, R.; Li, J. Vegetation dynamics and its driving forces from climate change and human activities in the Three-River Source Region, China from 1982 to 2012. Sci. Total Environ. 2016, 563–564, 210–220. [Google Scholar] [CrossRef]
  42. Zhang, Y. A time-series approach to detect urbanized areas using biophysical indicators and landsat satellite imagery. IEEE J. Sel. Top. Appl. Earth Obs. Remote Sens. 2021, 14, 9210–9222. [Google Scholar] [CrossRef]
  43. Tian, Y.; Huang, Y.; Zhang, Q.; Tao, J.; Zhang, Y.; Huang, H.; Zhou, G. Spatiotemporal distribution of net primary productivity and its driving factors in the Nanliu River basin in the Beibu Gulf. Shengtai Xuebao/Acta Ecol. Sin. 2019, 39, 8156–8171. [Google Scholar] [CrossRef]
  44. Zhu, C.; Zhang, X.; Zhou, M.; He, S.; Gan, M.; Yang, L.; Wang, K. Impacts of urbanization and landscape pattern on habitat quality using OLS and GWR models in Hangzhou, China. Ecol. Indic. 2020, 117, 106654. [Google Scholar] [CrossRef]
  45. Huilei, L.; Jian, P.; Yanxu, L.; Yi’na, H. Urbanization impact on landscape patterns in Beijing City, China: A spatial heterogeneity perspective. Ecol. Indic. 2017, 82, 50–60. [Google Scholar] [CrossRef]
  46. Simonit, S.; Perrings, C. Bundling ecosystem services in the Panama Canal watershed. Proc. Natl. Acad. Sci. USA 2013, 110, 9326–9331. [Google Scholar] [CrossRef] [Green Version]
  47. Tapio, P. Towards a theory of decoupling: Degrees of decoupling in the EU and the case of road traffic in Finland between 1970 and 2001. Transp. Policy 2005, 12, 137–151. [Google Scholar] [CrossRef] [Green Version]
  48. Shuai, C.; Chen, X.; Wu, Y.; Zhang, Y.; Tan, Y. A three-step strategy for decoupling economic growth from carbon emission: Empirical evidences from 133 countries. Sci. Total Environ. 2019, 646, 524–543. [Google Scholar] [CrossRef]
  49. Peng, J.; Wang, X.; Liu, Y.; Zhao, Y.; Xu, Z.; Zhao, M.; Qiu, S.; Wu, J. Urbanization impact on the supply-demand budget of ecosystem services: Decoupling analysis. Ecosyst. Serv. 2020, 44, 101139. [Google Scholar] [CrossRef]
  50. Shang, M.; Luo, J. The tapio decoupling principle and key strategies for changing factors of chinese urban carbon footprint based on cloud computing. Int. J. Environ. Res. Public Health 2021, 18, 2101. [Google Scholar] [CrossRef]
  51. Ma, M.; Cai, W.; Cai, W.; Dong, L. Whether carbon intensity in the commercial building sector decouples from economic development in the service industry? Empirical evidence from the top five urban agglomerations in China. J. Clean. Prod. 2019, 222, 193–205. [Google Scholar] [CrossRef]
  52. Zheng, S. Has “The Outline of the Plan for the Reform and Development of the Pearl River Delta” Promoted to the Coordination of Guangdong-Hong Kong-Macao Greater Bay Area. Mod. Econ. 2019, 10, 1348–1367. [Google Scholar] [CrossRef] [Green Version]
Figure 1. Geographical locations of the Pearl River Delta (PRD) and weather stations.
Remotesensing 14 00526 g001
Figure 2. Division basis of the Tapio decoupling index model.
Remotesensing 14 00526 g002
Figure 3. Average net primary productivity (NPP) of the Pearl River Delta (PRD) from 2000 to 2020.
Remotesensing 14 00526 g003
Figure 4. Net primary productivity (NPP) trends based on urban land.
Remotesensing 14 00526 g004
Figure 5. Net primary productivity (NPP) trends of (a) V c , (b) V c + h , (c) V n u , and (d) V p u .
Remotesensing 14 00526 g005
Figure 6. Net primary productivity (NPP) trends of V c , V c + h , V n u , and V p u from 2000 to 2020.
Remotesensing 14 00526 g006
Figure 7. Contributions of human activities and climate change to net primary productivity (NPP).
Remotesensing 14 00526 g007
Figure 8. Decoupling between socioeconomic factors (POP, NTL, and GDP) and net primary productivity (NPP) in (a) V c , (b) V c + h , (c) V n u , and (d) V p u .
Remotesensing 14 00526 g008
Figure 9. Decoupling level between net primary productivity (NPP) and socioeconomic factors in V c , V c + h , V n u , and V p u .
Remotesensing 14 00526 g009
Figure 10. Trend of net primary productivity (NPP) in the Pearl River Delta (PRD) in three time periods.
Remotesensing 14 00526 g010
Figure 11. Changes in the decoupling level between socioeconomic factors and net primary productivity (NPP) at the watershed scale.
Remotesensing 14 00526 g011
Figure 12. Decoupling level between socioeconomic factors and net primary productivity (NPP) before and after 2010.
Remotesensing 14 00526 g012
Publisher’s Note: MDPI stays neutral with regard to jurisdictional claims in published maps and institutional affiliations.

