Article

Assessment of Land Desertification and Its Drivers on the Mongolian Plateau Using Intensity Analysis and the Geographical Detector Technique

1
College of Geographical Science, Inner Mongolia Normal University, Hohhot 010022, China
2
Inner Mongolia Key Laboratory of Disaster and Ecological Security on the Mongolia Plateau, Hohhot 010022, China
3
Key Laboratory of Mongolian Plateau’s Climate System, Hohhot 010022, China
*
Author to whom correspondence should be addressed.
Remote Sens. 2022, 14(24), 6365; https://doi.org/10.3390/rs14246365
Submission received: 13 September 2022 / Revised: 30 November 2022 / Accepted: 10 December 2022 / Published: 16 December 2022

Abstract

:
Desertification is one of the most harmful ecological disasters on the Mongolian Plateau, placing the grassland ecological environment under great pressure. Remote-sensing monitoring of desertification and exploration of the drivers behind it are important for effectively combating this issue. In this study, four banners/counties on the border of China and Mongolia on the Mongolian Plateau were selected as the target areas. We explored desertification dynamics and their drivers by using remote sensing imagery and a product dataset for the East Ujimqin Banner and three counties in Mongolia during the period 2000–2015. First, remote sensing information on desertification in the fourth phase of the study area was extracted using the visual interpretation method. Second, the dynamic change characteristics of desertification were analyzed using the intensity analysis method. Finally, the drivers of desertification and their explanatory powers were identified using the geographical detector method. The results show that the desertification of the East Ujimqin Banner has undergone a process of reversion, development, and mild development, with the main transition occurring between slight (SL) and non-desertified land (N), very serious desertified land (VS), and water areas. The dynamics of desertification in this region are influenced by a combination of natural and anthropogenic factors. Desertification in the three counties of Mongolia has undergone processes of development, mild development and mild development with SL and vs. as the main types. Desertification in Mongolia is mainly concentrated in Matad County, which is greatly affected by natural conditions and has little impact from anthropogenic activities. In addition, the change intensity of desertification dynamics in the study area showed a decreasing trend, and the interaction between natural and anthropogenic drivers could enhance the explanatory power of desertification dynamics. The research results provide a scientific basis for desertification control, ecological protection, and ecological restoration on the Mongolian Plateau.

1. Introduction

Desertification is a serious economic, social, and environmental issue on global, regional, and local scales [1,2]. It has serious implications for food, health, livelihoods, and socioeconomic security, as well as national and international stability and sustainable development [3,4]. Desertification has had a disastrous impact on the global environment, especially in developing countries in arid and semi-arid regions [5,6]. The Mongolian Plateau is a major component of the global grassland ecosystem and plays a key role in the East Asian and global carbon cycle [7,8,9]. Inner Mongolia, China, and Mongolia are the main areas of the Mongolian Plateau and are important agricultural and livestock production areas. Sustainable development is of great significance to the economic and social development of the two countries [10,11]. However, both areas are severely threatened by desertification. As of 2014, Inner Mongolia had become one of the provinces with the largest portion of desertified land in China, with an area of 60,920,400 km2, accounting for 23.33% of the country’s desertified land [12]. More than 72% of land in Mongolia has been affected by varying degrees of desertification, with moderate, severe, and very severe proportions reaching 49% [13]. This large-scale desertification has severely damaged the ecological environment of the Mongolian Plateau and poses a serious threat to ecological security. Therefore, desertification monitoring and exploration of its drivers on the Mongolian Plateau are essential actions for ecological situation improvement, joint disaster mitigation, and advancing development in both countries.
Currently, remote sensing technology is considered an important monitoring tool for desertification [14,15,16,17,18,19] and two main methods have been used. One is to extract desertification information from remote sensing images by constructing a desertification indicator system and interpretation mark. The indicator system mainly contains the classification of desertification types and their corresponding land surface and vegetation characteristics [20]. Commonly used indicators include mobile sand dunes, vegetation coverage, and surface form [21]. The interpretation marks of different desertification types are then constructed by combining the color, shape, size, texture, and structure of remote sensing images [22]. For example, Duan et al. assessed the temporal and spatial dynamics of aeolian desertification from 1975 to 2010 in the Horqin Sandy Land in northern China using the anthropogenic–machine interactive interpretation method [21]. Song et al. monitored the temporal and spatial evolution of aeolian desertification in the Heihe River Basin in northwestern China using multitemporal Landsat images and geographic information system (GIS) data from 1975 to 2010 [22]. Another method is to extract an index that can characterize desertification from remote sensing images. These indices can be single or sometimes a composite of multiple indices. The normalized difference vegetation index (NDVI), albedo, topsoil grain size index (TGSI), soil-adjusted vegetation index (SAVI), modified soil-adjusted vegetation index (MSAVI), fractional vegetation cover (FVC), temperature vegetation drought index (TVDI), and land surface temperature (LST) are commonly used as indicators for desertification detection [23,24,25]. Lamchina et al. combined NDVI, TGSI, and land surface albedo to represent the land surface and desertification in the Hogno Khaan protected area in Mongolia. They defined lands with NDVI ≤ 0.25, albedo ≥ 0.4, and TGSI ≥ 0 as severely desertified lands [18]. Han et al. established multiple indices to assess desertification in the Hexi corridor of Gansu Province in northern China by combining the MSAVI, FVC, Albedo, LST, and TVDI. They defined lands with MSAVI ≤ 0.4, albedo ≥ 1, FVC < 0.08, LST > 1 and TVDI > 0.67 as extremely severe desertified lands [17]. Both desertification monitoring methods have their advantages and limitations. The index extraction method (which generally uses MODIS as a data source) is suitable for long-term desertification monitoring but has limitations regarding spatial resolution. The interpretation process is laborious, and it is difficult to examine the desertification process over long time periods. However, the results of desertification monitoring obtained through visual interpretation (higher-resolution remote sensing images such as Landsat are generally used as data sources) are often highly accurate [26].
Desertification is defined as land degradation in arid, semi-arid, and dry sub-humid areas, resulting from climatic variations and anthropogenic activities [27]. Thus, identifying the drivers of desertification has become a priority in desertification research. Xu et al. used the difference between potential net primary productivity (NPP) and actual NPP to represent the impacts of climate change and anthropogenic activities on desertification in the farming-pastoral region of north China [28]. Feng et al. analyzed spatial and temporal changes in the aeolian desertification area and detected their possible influencing factors, including precipitation, temperature, wind speed, and population, by utilizing the convergent cross mapping (CCM) model [29]. Wang et al. analyzed the significance of aeolian transport on desertification in the Mu Us Desert, China, by conducting field investigations, sampling, wind tunnel experiments, and particle size and nutrient measurements [30]. Current research on the drivers of desertification has gradually begun to adopt a quantitative approach. However, most studies on desertification drivers are still dominated by qualitative analyses. Scholars determine the dominant factor by comparing the changes in desertification and its drivers [31,32,33]. This poses limitations in calculating the contribution of drivers to desertification dynamics.
A geographical detector, the method proposed by Wang et al., was introduced to explore the drivers of desertification in our study. A geographical detector is a set of statistical methods that detect spatial divergence and reveal the drivers behind it. The central idea is that if an independent variable has a significant effect on a dependent variable, the spatial distributions of both variables should be similar [34]. Therefore, it can address the influence of drivers on desertification dynamics based on the similarity between the spatial distribution of desertification and its drivers. In addition, the geographical detector can also detect two-factor interactions on the dependent variable, which helps to determine whether the interaction of two factors strengthens/weakens the effect on desertification dynamics [35]. In recent years, the model has been widely used as an important method to detect the spatial distribution of variables in geographical research related to meteorology, geology, risk analysis, land use, population, and economy [36,37,38,39,40]. The model was applied in this study to detect drivers of desertification, providing a novel methodology for analysis in the quantitative study of desertification. Furthermore, land-use dynamic models and transfer matrices are often used to express desertification dynamics [17,41]. However, these analyses are needed to determine the mutual transformation of different categories of desertified lands individually from the transfer matrix and are not entirely sufficient to provide quantitative and systematic signals for land dynamics [42]. In our study, intensity analysis, a method developed by Pontius et al., was introduced to determine desertification dynamics [43]. The method addresses three questions: (1) Is the annual change in each desertification category within the same interval relatively fast or slow? (2) Is the change in desertification category relatively dormant or active? (3) In the transition process of a desertification category, which category dominates the transition process?
The Mongolian Plateau is a hotspot of global desertification [44,45]. With the volatility of climate change and intensification of anthropogenic activities, grassland desertification has been occurring rapidly [46]. This is particularly evident in the northeastern part of the Mongolian Plateau, which is one of the borders of China and Mongolia. Desertification has led to ecological fragility of the region and is extremely sensitive to climate change [47]. Hence, we selected four typical banners/counties in the region as the study area and extracted remote sensing information on desertified land. We also analyzed the change characteristics of desertification dynamics using the intensity analysis method. Desertification drivers were determined by applying the geographical detector method. The results of this study can provide useful information for the joint prevention and mitigation of desertification in both China and Mongolia.

2. Materials and Methods
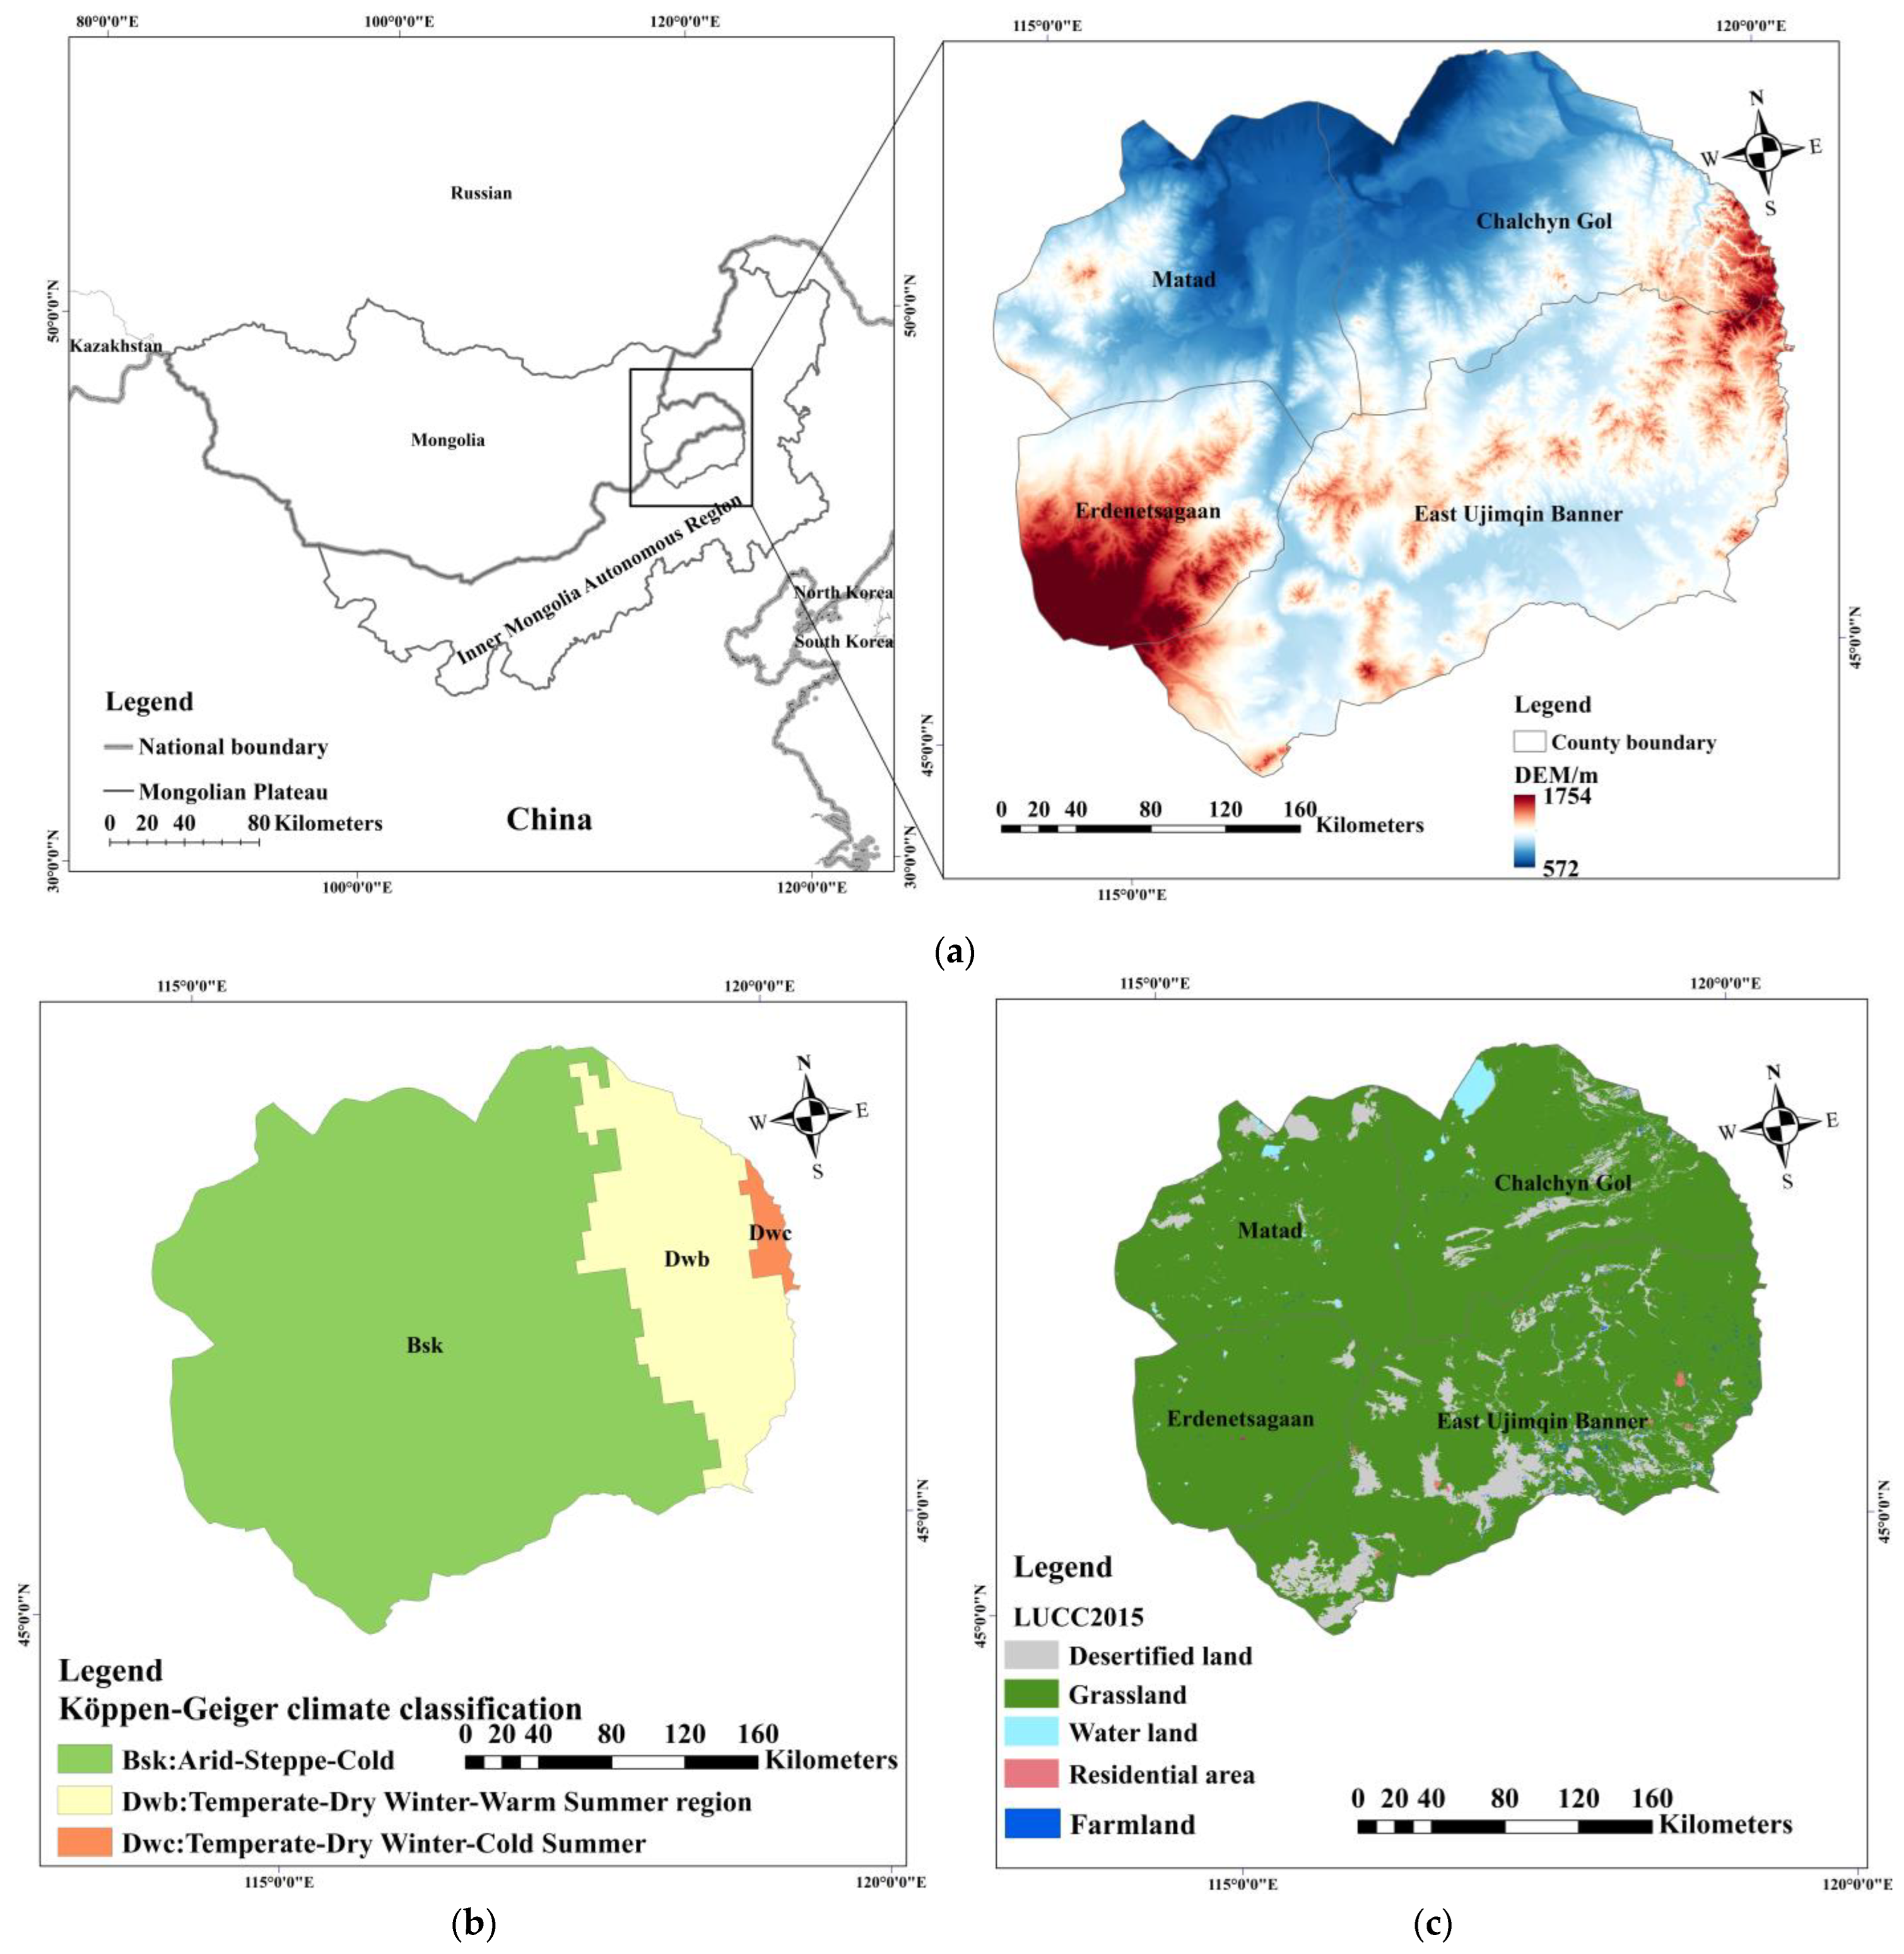
2.1. Study Area

This study selected the East Ujimqin Banner in China’s border area and Chalchyn Gol County, Matad County, and Erdenetsagaan County in Mongolia to comprise the study area. The region is located in the northeastern part of the Mongolian Plateau (Figure 1a), and the areas on both sides of the border are equal with similar natural geography and ecological characteristics. The study area consists of three climatic zones, the central and western parts of which are arid steppe cold (Bsk) regions. The eastern region is a temperate zone with dry winters and warm summers (Dwb), with a small portion of temperate zones having dry winters and cold summers (Dwc) [48] (Figure 1b). The average temperature of the study area in January is between −18 and −22 °C, and in July, it varies between 20 and 22 °C. The annual average precipitation varies between 200 and 300 mm. The land use or land cover type in the study area was dominated by grassland, with farmland scattered in the southeast. Land use and land cover in 2015 showed that the water areas were mainly distributed in the northern part. In addition, the proportion of residential area of the East Ujimqin Banner is significantly higher than that of the three counties of Mongolia (Figure 1c).

2.2. Data and Processing

Landsat satellite data have multiband advantages, high ground resolution, and a large time span, making it ideal for the observation of surface areas on a countrywide scale. Low-cloud (no more than 1%) remote sensing images in July or August (with easy to identify surface features) of four different periods, including Landsat Thematic Mapper (TM) 5 in 2000, 2005, and 2010, and Landsat Operational Land Imager (OLI) 8 in 2015 with spatial resolution of 30 m, were downloaded from the US Geological Survey website (http://glovis.usgs.gov/, accessed on 15 July 2022). Nine scenes (path/row:123/27, 123/28, 124/27, 124/28, 124/29, 125/27, 125/28, 125/29, and 126/27) of the Landsat data were spliced to build an image of the study area. Radiation and atmospheric correction of the image were performed using the Calibration Utilities and the FLAASH module in ENVI 5.3 software [49]. All images were projected using the WGS1984 ellipsoid and Alber projection. The images were geometrically corrected using a 1:100,000 topographic map from the East Ujumqin Banner. Then, band synthesis was performed for Landsat 5 images (using four, three, and two bands) and Landsat 8 images (using five, four, and three bands).
We applied monthly TerraClimate datasets to extract the meteorological dataset, including potential evapotranspiration (pet), precipitation (ppt), maximum temperature, minimum temperature, soil moisture (sm), and wind speed (ws). The dataset combined the WorldClim version 1.4 and version 2 datasets with CRU Ts 4.0 and JRA-55 from 2000 to 2015 [50]. We employed the Gridded Livestock of the World (GLW 3) database, which reflects the most recently compiled and harmonized subnational livestock distribution data for 2010. It provides global population densities of cattle, horses, sheep, and goats in each land pixel at a spatial resolution of approximately 8 km per grid [51]. The population (pop) data used in this study were derived from the WorldPop (www.worldpop.org, accessed on 26 July 2022) NASA Socioeconomic Data and Applications Center (SEDAC) Gridded Population of the World Version 4 (GPWv4) grid product data, with a spatial resolution of approximately 1 km from 2000 to 2015.
To make the data suitable for the needs of the research, they were processed by projection conversion and cropping, and the spatial resolution of the dataset was unified to 4 km. The temperature data used in our study were the mean values of the maximum and minimum temperatures. To explore the drivers of desertification dynamics more accurately, we calculated the mean values of the factors in the study area from 2000 to 2015.

2.3. Desertification Classification, Interpretation and Verification

According to the standards based on previous research results [13,52], the desertification of the study area was divided into four categories: slight, moderate, serious, and very serious. Note that the classification also follows the desertification information that appears in the remote sensing images and the natural environment characteristics of the study area. The classification system, interpretation marks, and image features are presented in Table 1 and Figure 2. To verify the accuracy of the remote sensing interpretation data of desertification in the study area, Google images from September 2010 with a spatial resolution of 3.3 m were collected and used for classification accuracy comparison. These images are the data integration of satellite images and aerial photography. The satellite images are mostly from QuickBird and Landsat satellites, and aerial photography is from IKONOS and SPOT5 [53]. We verified more than 300 samples, mainly in slight, moderate and serious desertified lands, as very serious desertified land is easy to distinguish. The comparison showed that the interpretation accuracy of desertification was above 85%, and the errors were corrected during the process.

2.4. Methods

2.4.1. Intensity Analysis Method

We introduced desertification categorization into the index of the intensity analysis method [43], and the computational method includes the following Formulas (1)–(8):
U = t = 1 T 1 { j = 1 J [ ( i = 1 J C t i j ) C t i j ] } / [ j = 1 J ( i = 1 J C t i j ) ] Y T Y 1 × 100 %
where U is the value of uniform line for time intensity analysis; C t i j number of pixels that transition from category i at time Y t to category j at time Y t + 1 ; J number of categories; T number of time points; Y t year at time t ; t index for the initial time point of interval [ Y t , Y t + 1 ] , where t ranges from [ 1 , T 1 ] ; i index for a category at the initial time point for a particular time interval; j index for a category at the final time point for a particular time interval.
S t = { j = 1 J [ ( i = 1 J C t i j ) C t i j ] } / [ j = 1 J ( i = 1 J C t i j ) ] Y t + 1 Y t × 100 %
where S t is annual intensity of change for time interval [ Y t , Y t + 1 ] .
G t j = [ ( i = 1 J C t i j ) C t i j ] / ( Y t + 1 Y t ) i = 1 J C t i j × 100 %
where G t j is annual intensity of gross gain of category j for time interval [ Y t , Y t + 1 ] ;
L t i = [ ( j = 1 J C t i j ) C t i i ] / ( Y t + 1 Y t ) j = 1 J C t i j × 100 %
where L t i is annual intensity of gross loss of category i for time interval [ Y t , Y t + 1 ] ;
W t n = [ ( i = 1 J C t n n ) C t n n ] / ( Y t + 1 Y t ) j = 1 J [ ( i = 1 J C t i j ) C t n j ] × 100 %
where W t n is value of uniform intensity of transition to category n from all non- n categories at time Y t during time interval [ Y t , Y t + 1 ] ; n index for the gaining category in the transition of interest;
R t i n = C t i n / ( Y t + 1 Y t ) j = 1 J C t i j × 100 %
where R t i n is annual intensity of transition from category i to category n ( i n ) during time interval [ Y t , Y t + 1 ] ;
V t m = [ ( j = 1 J C t m j ) C t m m ] / ( Y t + 1 Y t ) i = 1 J [ ( j = 1 J C t i j ) C t i m ] × 100 %
where V t m is value of uniform intensity of transition from category m to all non- m categories at time Y t + 1 during time interval [ Y t , Y t + 1 ] ; m index from the losing category in the transition of interest;
Q t m j = C t m j / ( Y t + 1 Y t ) j = 1 J C t i j × 100 %
where Q t m j is annual intensity of transition from category m to category j ( m j ) during time interval [ Y t , Y t + 1 ] .

2.4.2. Geographical Detector Method

The geographical detector consists of four detectors: a risk detector, factor detector, ecological detector, and interaction detector [54]. In this study, a factor detector was used to determine the desertification drivers. The model is expressed as follows:
P D , U = 1 1 n σ U 2 i = 1 m n D , i σ U D , i 2
where P D , U is the power of determinant (PD) of the driving factors of desertification, n and σ U 2 are the number of samples and the variance of desertification dynamics over the entire study area, respectively. Based on the attribution of the suspected driving factor, the research area was divided into m sub-regions. n D , i and σ U D , i 2 are the number of samples and variance of desertification dynamics in the sub-region of i category of m , respectively. Note that assuming σ U D , i 2 o , the model is established and available. P D , U [ 0 , 1 ] means that if the factors are completely unrelated to the desertification dynamics, then P D , U = 0 , if the factors completely control the desertification dynamics, then P D , U = 1 ; a greater value means the greater the impact of the factors on the desertification dynamics.
Interaction detection can quantitatively characterize the relationship between two driving factors of desertification. For example, in a situation where A and B factors affect desertification, a new layer C is formed by the spatial superposition of A and B, and the properties of C are jointly determined by A and B. By comparing the driving force of the A and B layers with that of the C layer, it can be determined whether the influence of the interaction of the two drivers on desertification is strengthened or weakened. The interaction criteria are listed in Table 2.
The software package of R version 4.2.2 (https://cran.r-project.org/web/packages/GD/, accessed on 29 July 2022) was used to compute the interaction detector.

3. Results

3.1. Spatiotemporal Evolution of Desertified Land Area

Desertification monitoring data obtained using visual interpretation in the four periods of the study area were counted, and the areas and percentages of desertified land in different categories were obtained (Table 3). The East Ujimqin Banner experienced desertification reversion, development, and mild development during the monitoring period. In 2000, desertification of the Banner was dominated by SL with an area of 3530.69 km2, occupying 3.105% of the study area. It was mainly distributed in the southwestern and southeastern regions and scattered throughout the central region (Figure 3a). However, by 2005, the SL area had decreased by 2.236%, and only the SL in the central region still existed in space. During the last two periods of 2010 and 2015, 2226.33 km2 and 617.09 km2 of SL respectively, were continuously added. In addition to the southwest, there was a new SL area in the northwest and northeast of the East Ujimqin Banner. In 2005, very serious dersertified land (VS) dominated and increased by 0.904% compared to 2000. The vs. for most areas was mainly distributed in and around the southern, northern, and northeastern waters of the East Ujimqin Banner. The increase and decrease in vs. in these water areas and their surroundings were the main phenomena throughout the entire monitoring period, which indicates that drought with less rain or high-intensity artificial water use may have occurred in the water areas (Figure 3b,d). The proportion of areas of M and S was relatively small, and the spatial distribution was relatively uniform, with dispersion distribution in the northeast, southwest, and southeast of the East Ujimqin Banner (Figure 3). S grew by 80.65 km2 between 2000 and 2005, mainly from SL in the northeast, southwest, and southeast regions (Figure 3a,b). The 320.21 km2 area that M grew during 2005–2010 was mainly converted from non-desertified lands in various regions (Figure 3b,c).
Desertification in the three counties of Mongolia has undergone the process of development, mild development, and mild development. However, the areas of desertified land were considerably smaller than those of the East Ujimqin Banner. In 2005 and 2010, the three counties of Mongolia were dominated by VS, with areas 1197.02 km2 and 1058.94 km2, occupying 1.053% and 0.931% of the study area, respectively. vs. was widely distributed in the southern and eastern parts of Chalchyn Gol County and around the water areas of the three counties (Figure 3). M and S were mainly distributed around the vs. in Chalchyn Gol County, growing to 423.42 km2 and 29 km2 respectively during 2000–2005. In addition to the M part that changed from VS, a large part of M occurred at the northern edge of Matad County (Figure 3a,b). S increased by 361.95 km2 between 2005 and 2010, mainly due to the transformation of vs. in the northeastern and southwestern parts of Chalchyn Gol County (Figure 3b,c). In 2000, the SL area in the three counties was 124.75 km2, but it increased by 0.604% in 2005. The newly added SL was found mainly at the northern edge of Matad County (Figure 3b). In 2010 and 2015, a new SL appeared in northwest Matad County and northeast Erdenetsagaan County (Figure 3c,d).

3.2. Transfer Characteristics of Desertification

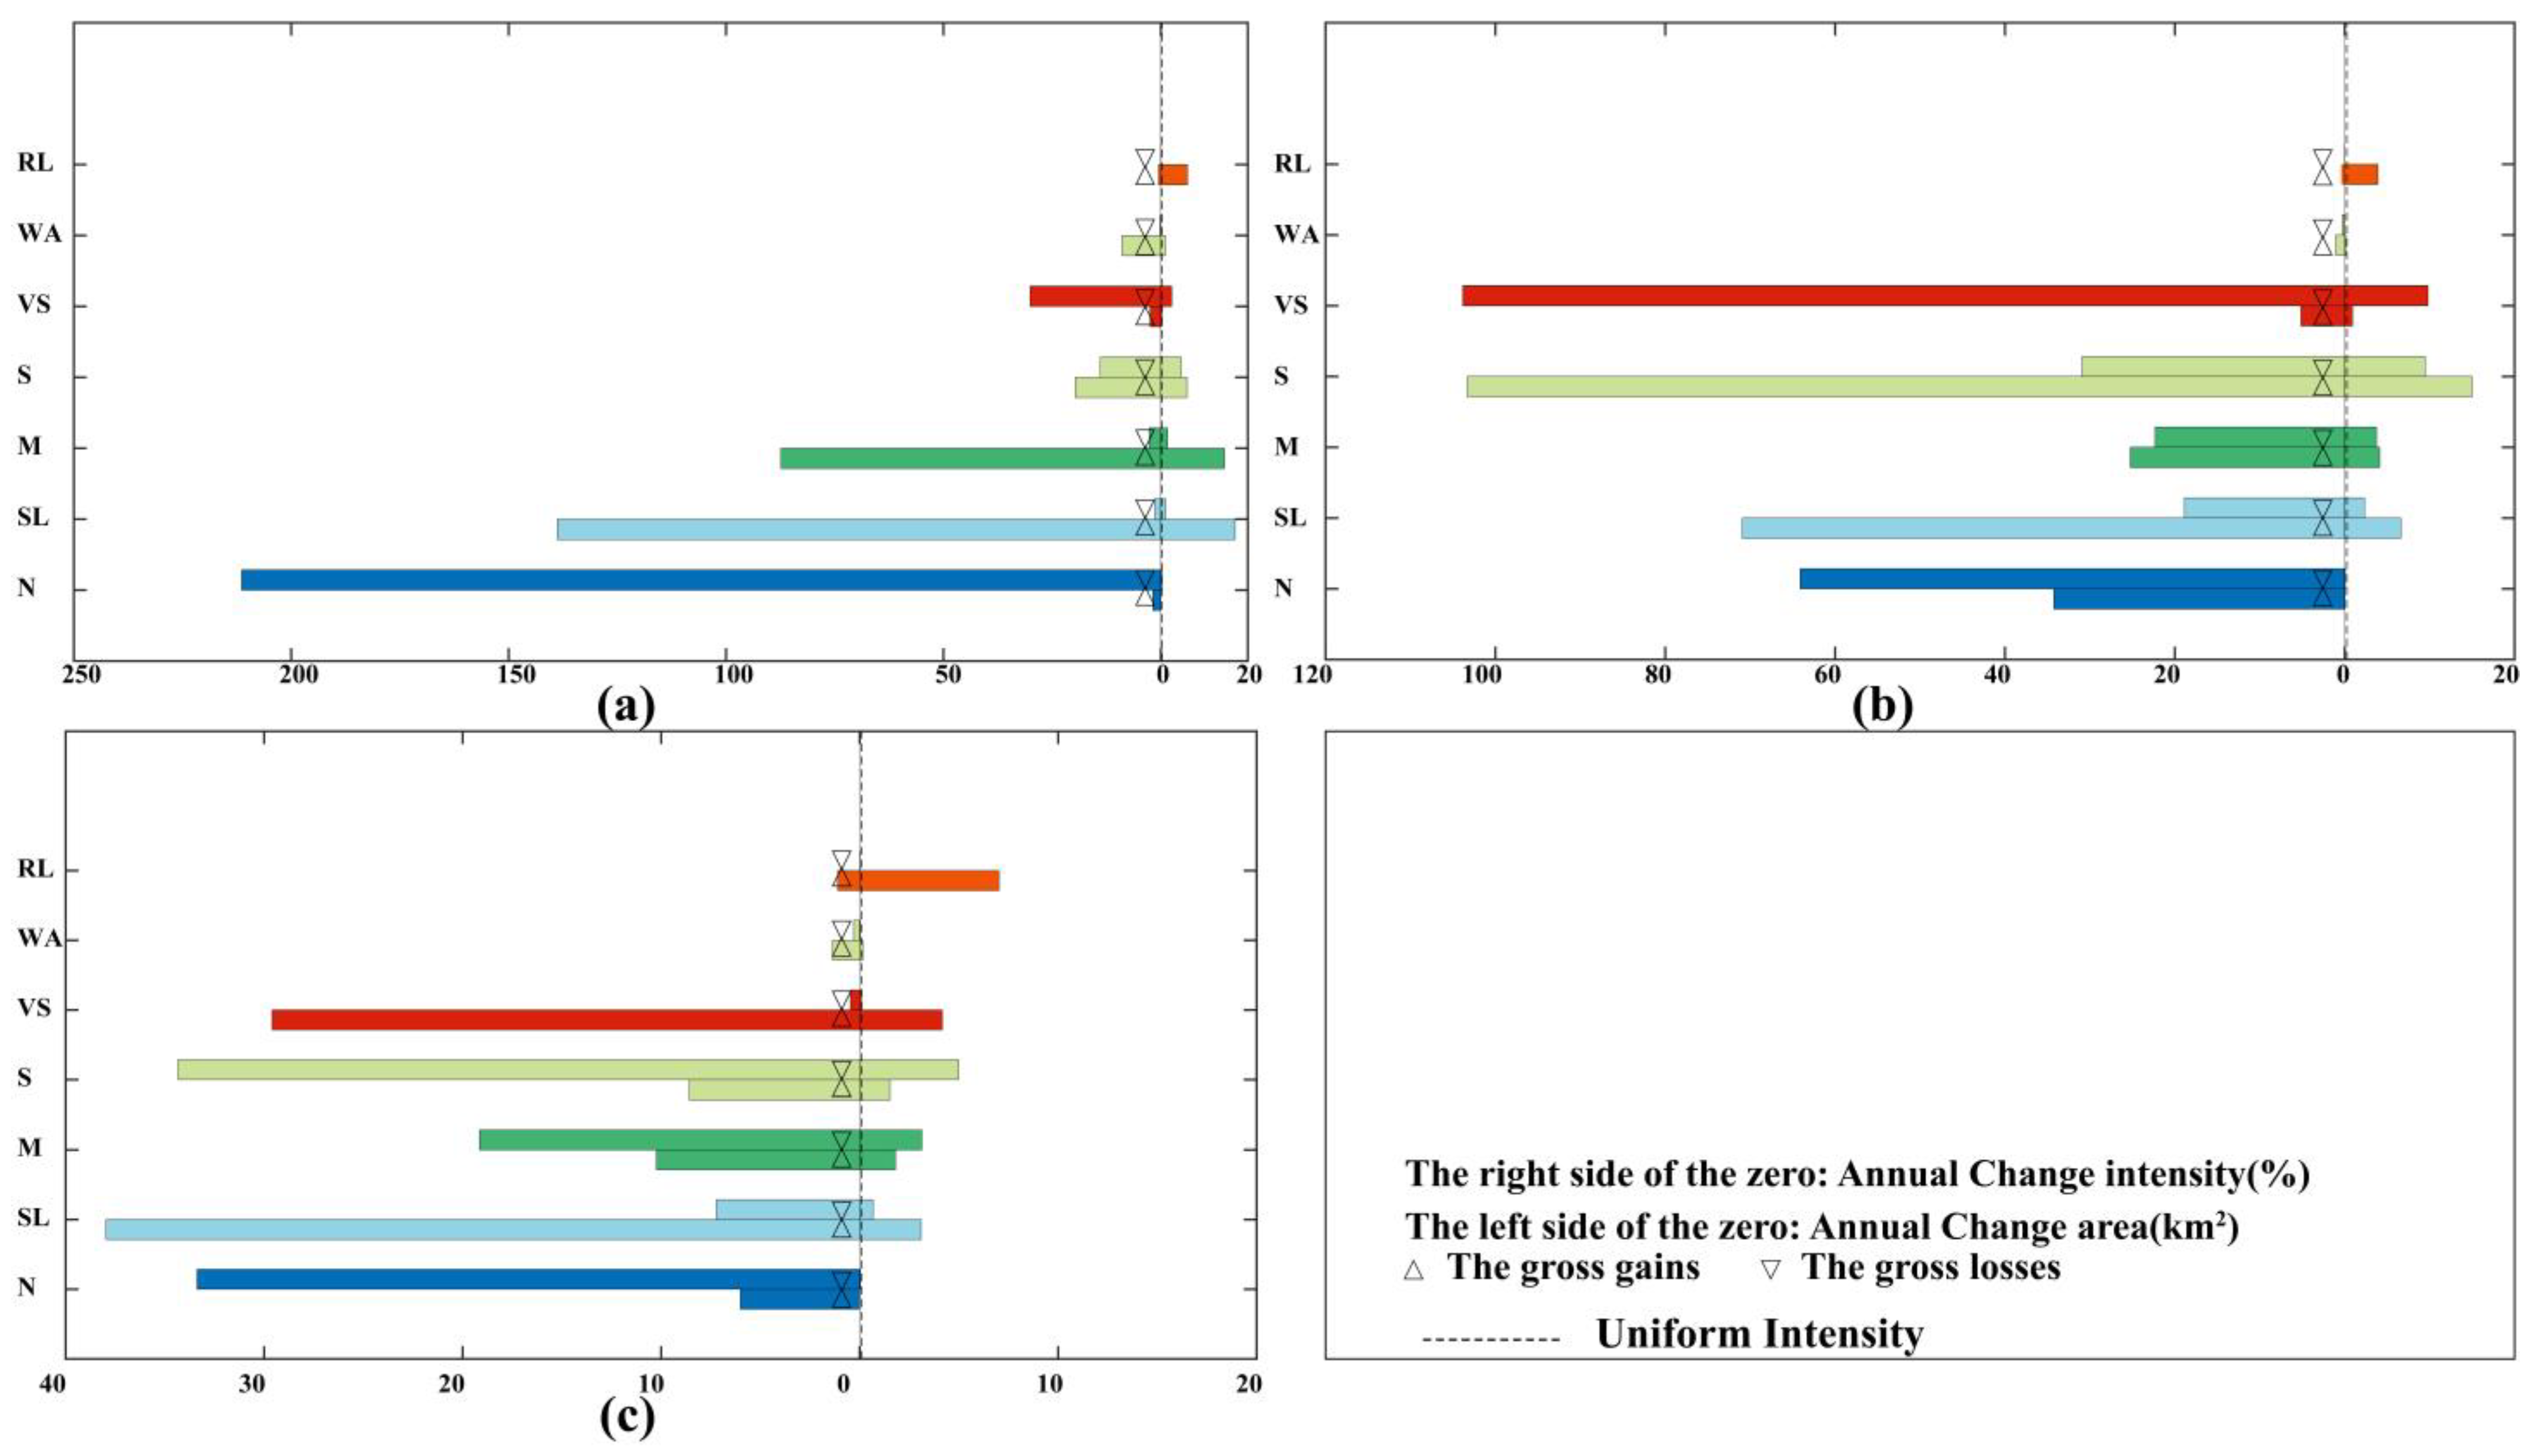
3.2.1. Interval Level

In this section, changes in the area and intensity of desertified land at the interval level are examined (Figure 4). In the figure, the left and right sides of the zero value are the interval change area and annual change area, respectively, as a percentage of desertified land at different time intervals. The annual change in area as a percentage was obtained by dividing the interval change area as a percentage by the length of the time interval. The vertical lines in the figure represent the uniform annual change as a percentage, which is the mean value of the annual change area as a percentage over the three time intervals. When the value of the area of annual change exceeds the boundary of the vertical lines, we believe that the desertified land in a certain interval has a strong intensity of change. The right side of Figure 4a shows that the annual change areas during the two intervals, 2000–2005 and 2005–2010, exceed the uniform value in the East Ujimqin Banner, among which the intensity of change in 2000–2005 was relatively rapid, and the percentage of the interval change area was greater than 8%. The annual change area in 2010–2015 was the same as the uniform value, indicating that the intensity of desertification change was relatively slow. In the three counties of Mongolia included in the study, the area of annual change area in 2000–2005 and 2005–2010 exceeded the uniform value, indicating that the desertified land in the two periods changed rapidly; however, the intensity was lower than that of the East Ujimqin Banner. The annual change in area of the three counties in 2010–2015 failed to exceed the uniform intensity value, which indicates that the desertified land changed slowly during this period (Figure 4b).

3.2.2. Category Level

In this section, the gross gains and losses of different types of land areas, including different categories of desertified lands, water areas, and residential land, and their intensity of change (expressed by the annual change intensity) were analyzed over three intervals. The dotted line in the figure denotes the uniform intensity of change. When the annual change intensity is greater than the uniform intensity, we believe that the gains and losses of land of a certain type are relatively active. The intensity of SL and water area losses in the East Ujimqin Banner were greater than the uniform intensity of change and were relatively active during the 2000–2005 period (Figure 5a). Regarding the intensity of the gains in residential land, M and SL were relatively active during the 2005–2010 period, in which the intensity of change in SL was most pronounced with an annual change area of 450 km2 (Figure 5b). During the 2010–2015 period, the gains were in residential land, water area, and SL, while losses occurring in desertified lands with higher severity were increasingly active (Figure 5c). The gain intensity of SL and M was greater than the average intensity and was active throughout the time interval 2000–2005 in the three counties of Mongolia (Figure 6a). Both the gain intensity and loss intensity of S were greater than the average intensity and were active during the time interval 2005–2010. In addition, the loss intensity of vs. and gain intensity of SL were also active during this period (Figure 6b). In 2010–2015, the gains were in vs. and SL, whereas the losses in S and M were more active (Figure 6c). The gain intensity of residential land strengthened with an increase in time scale.

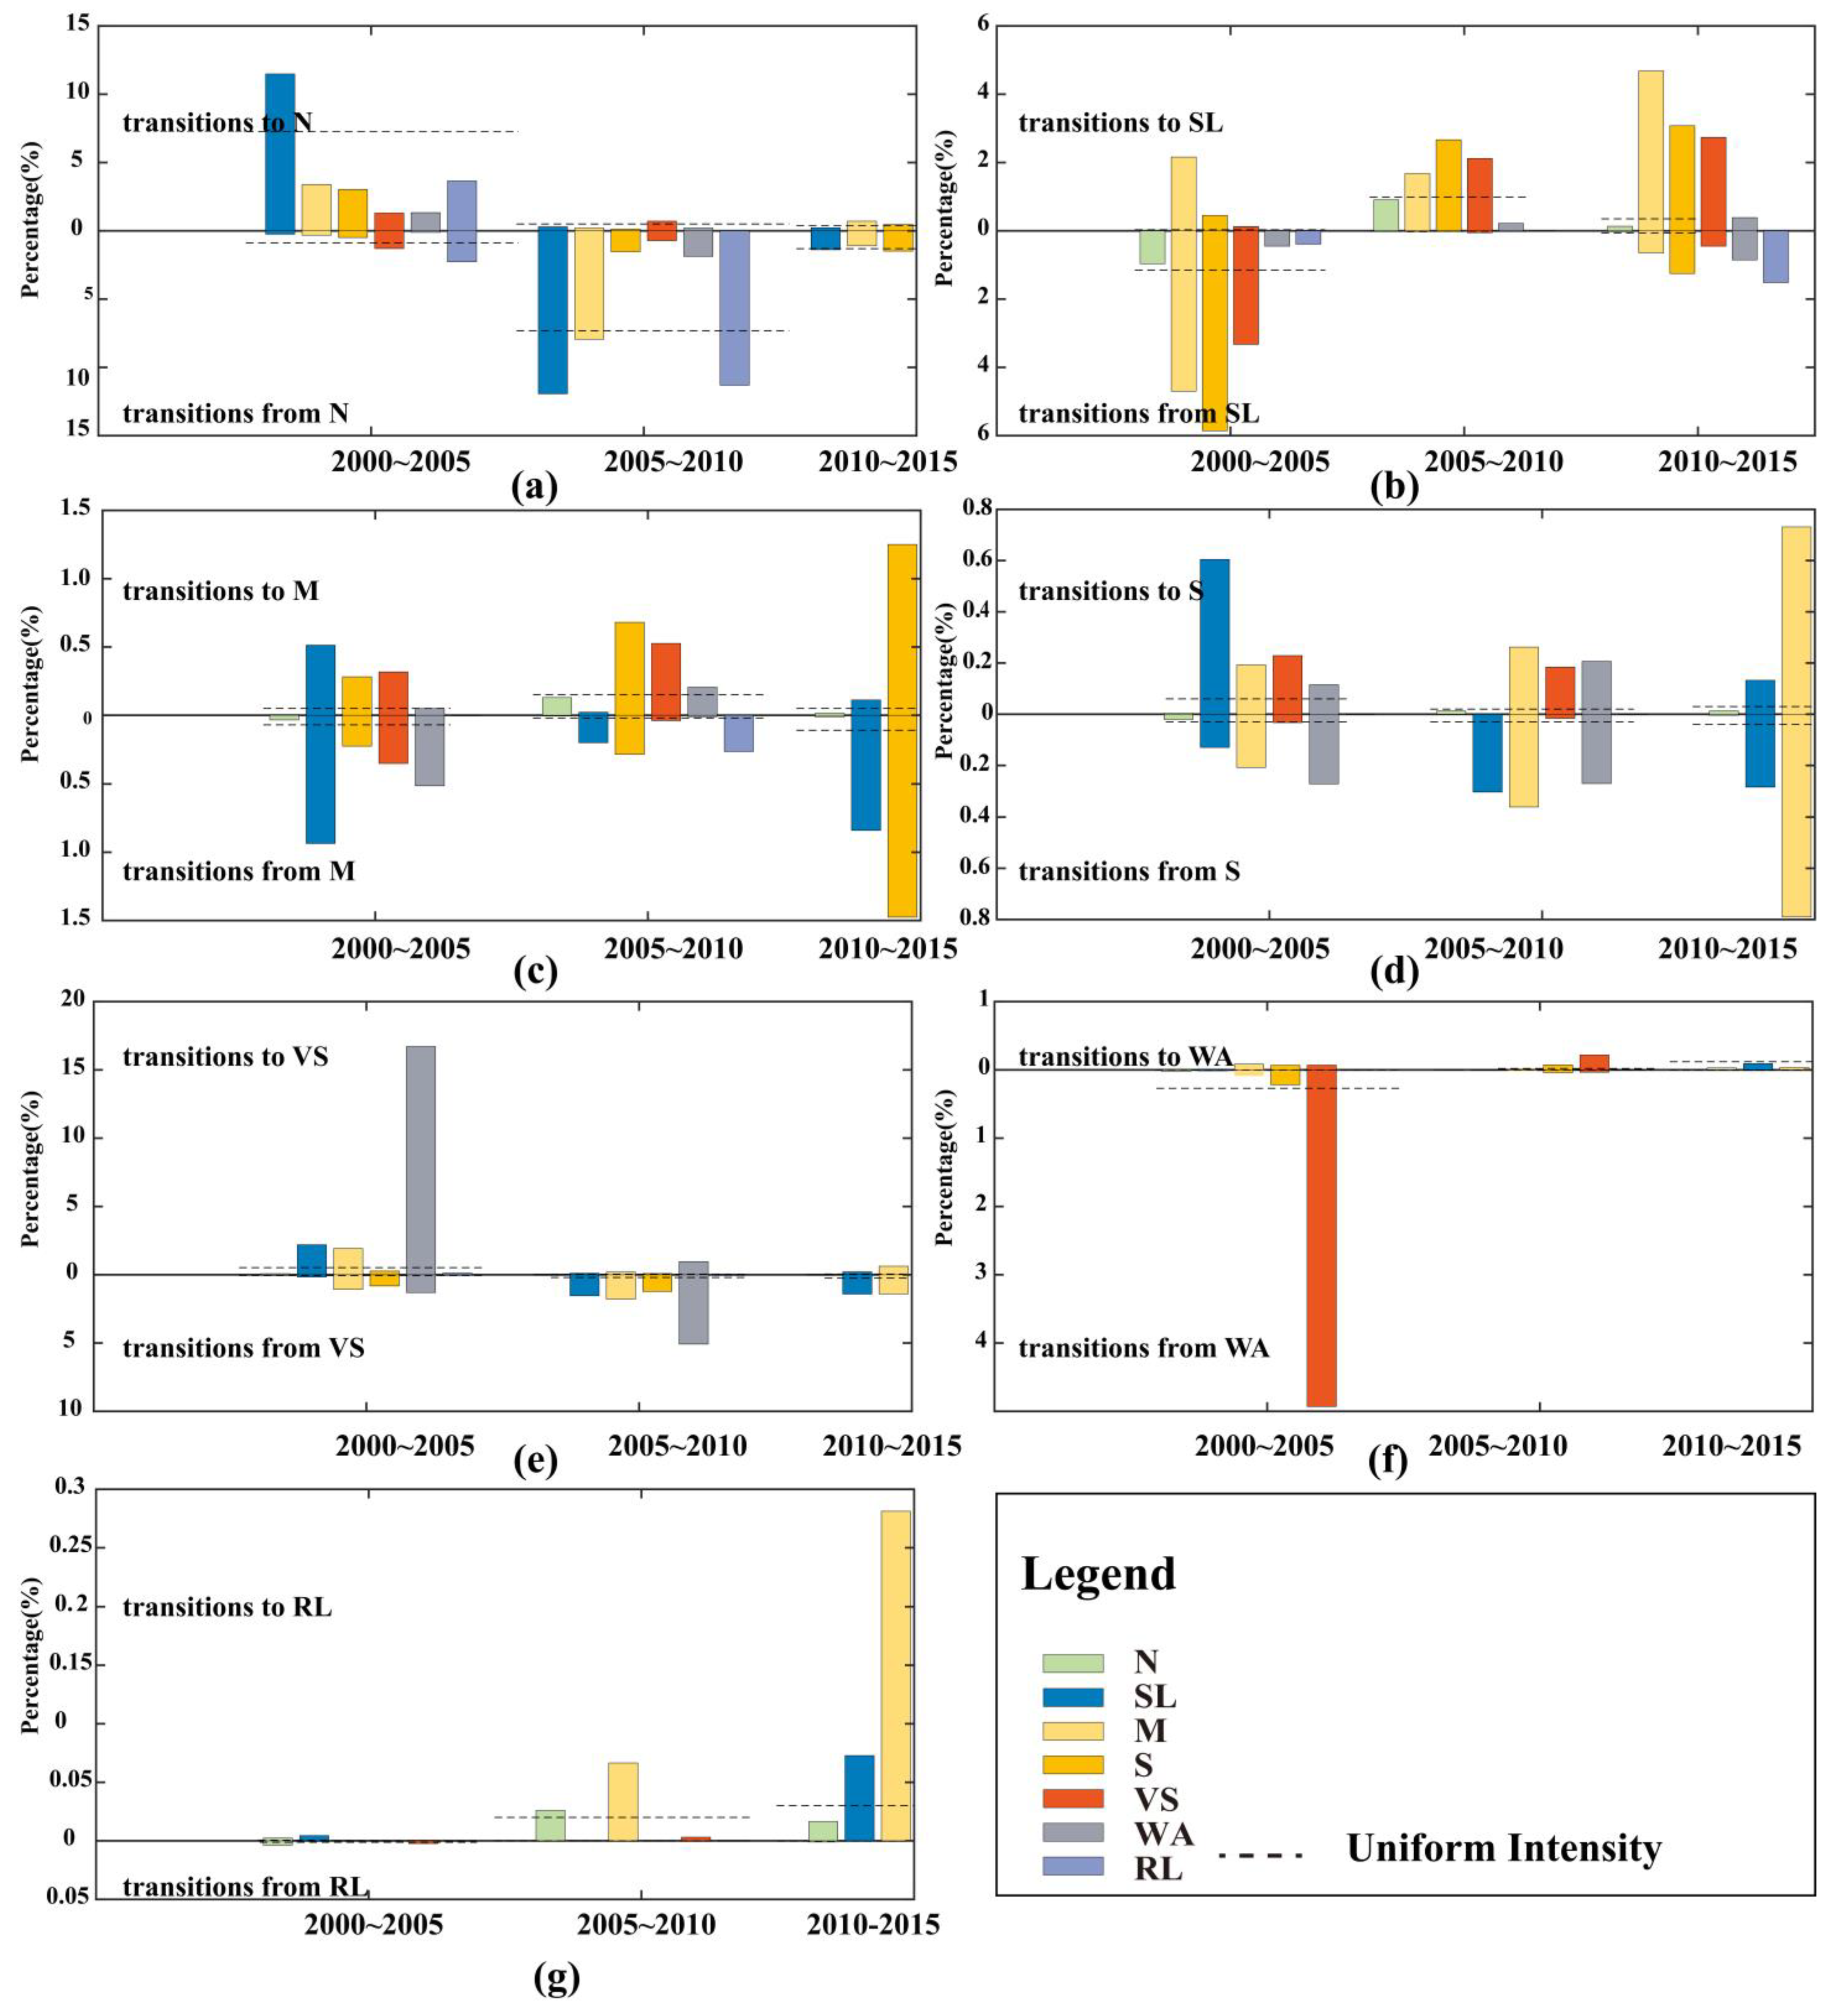
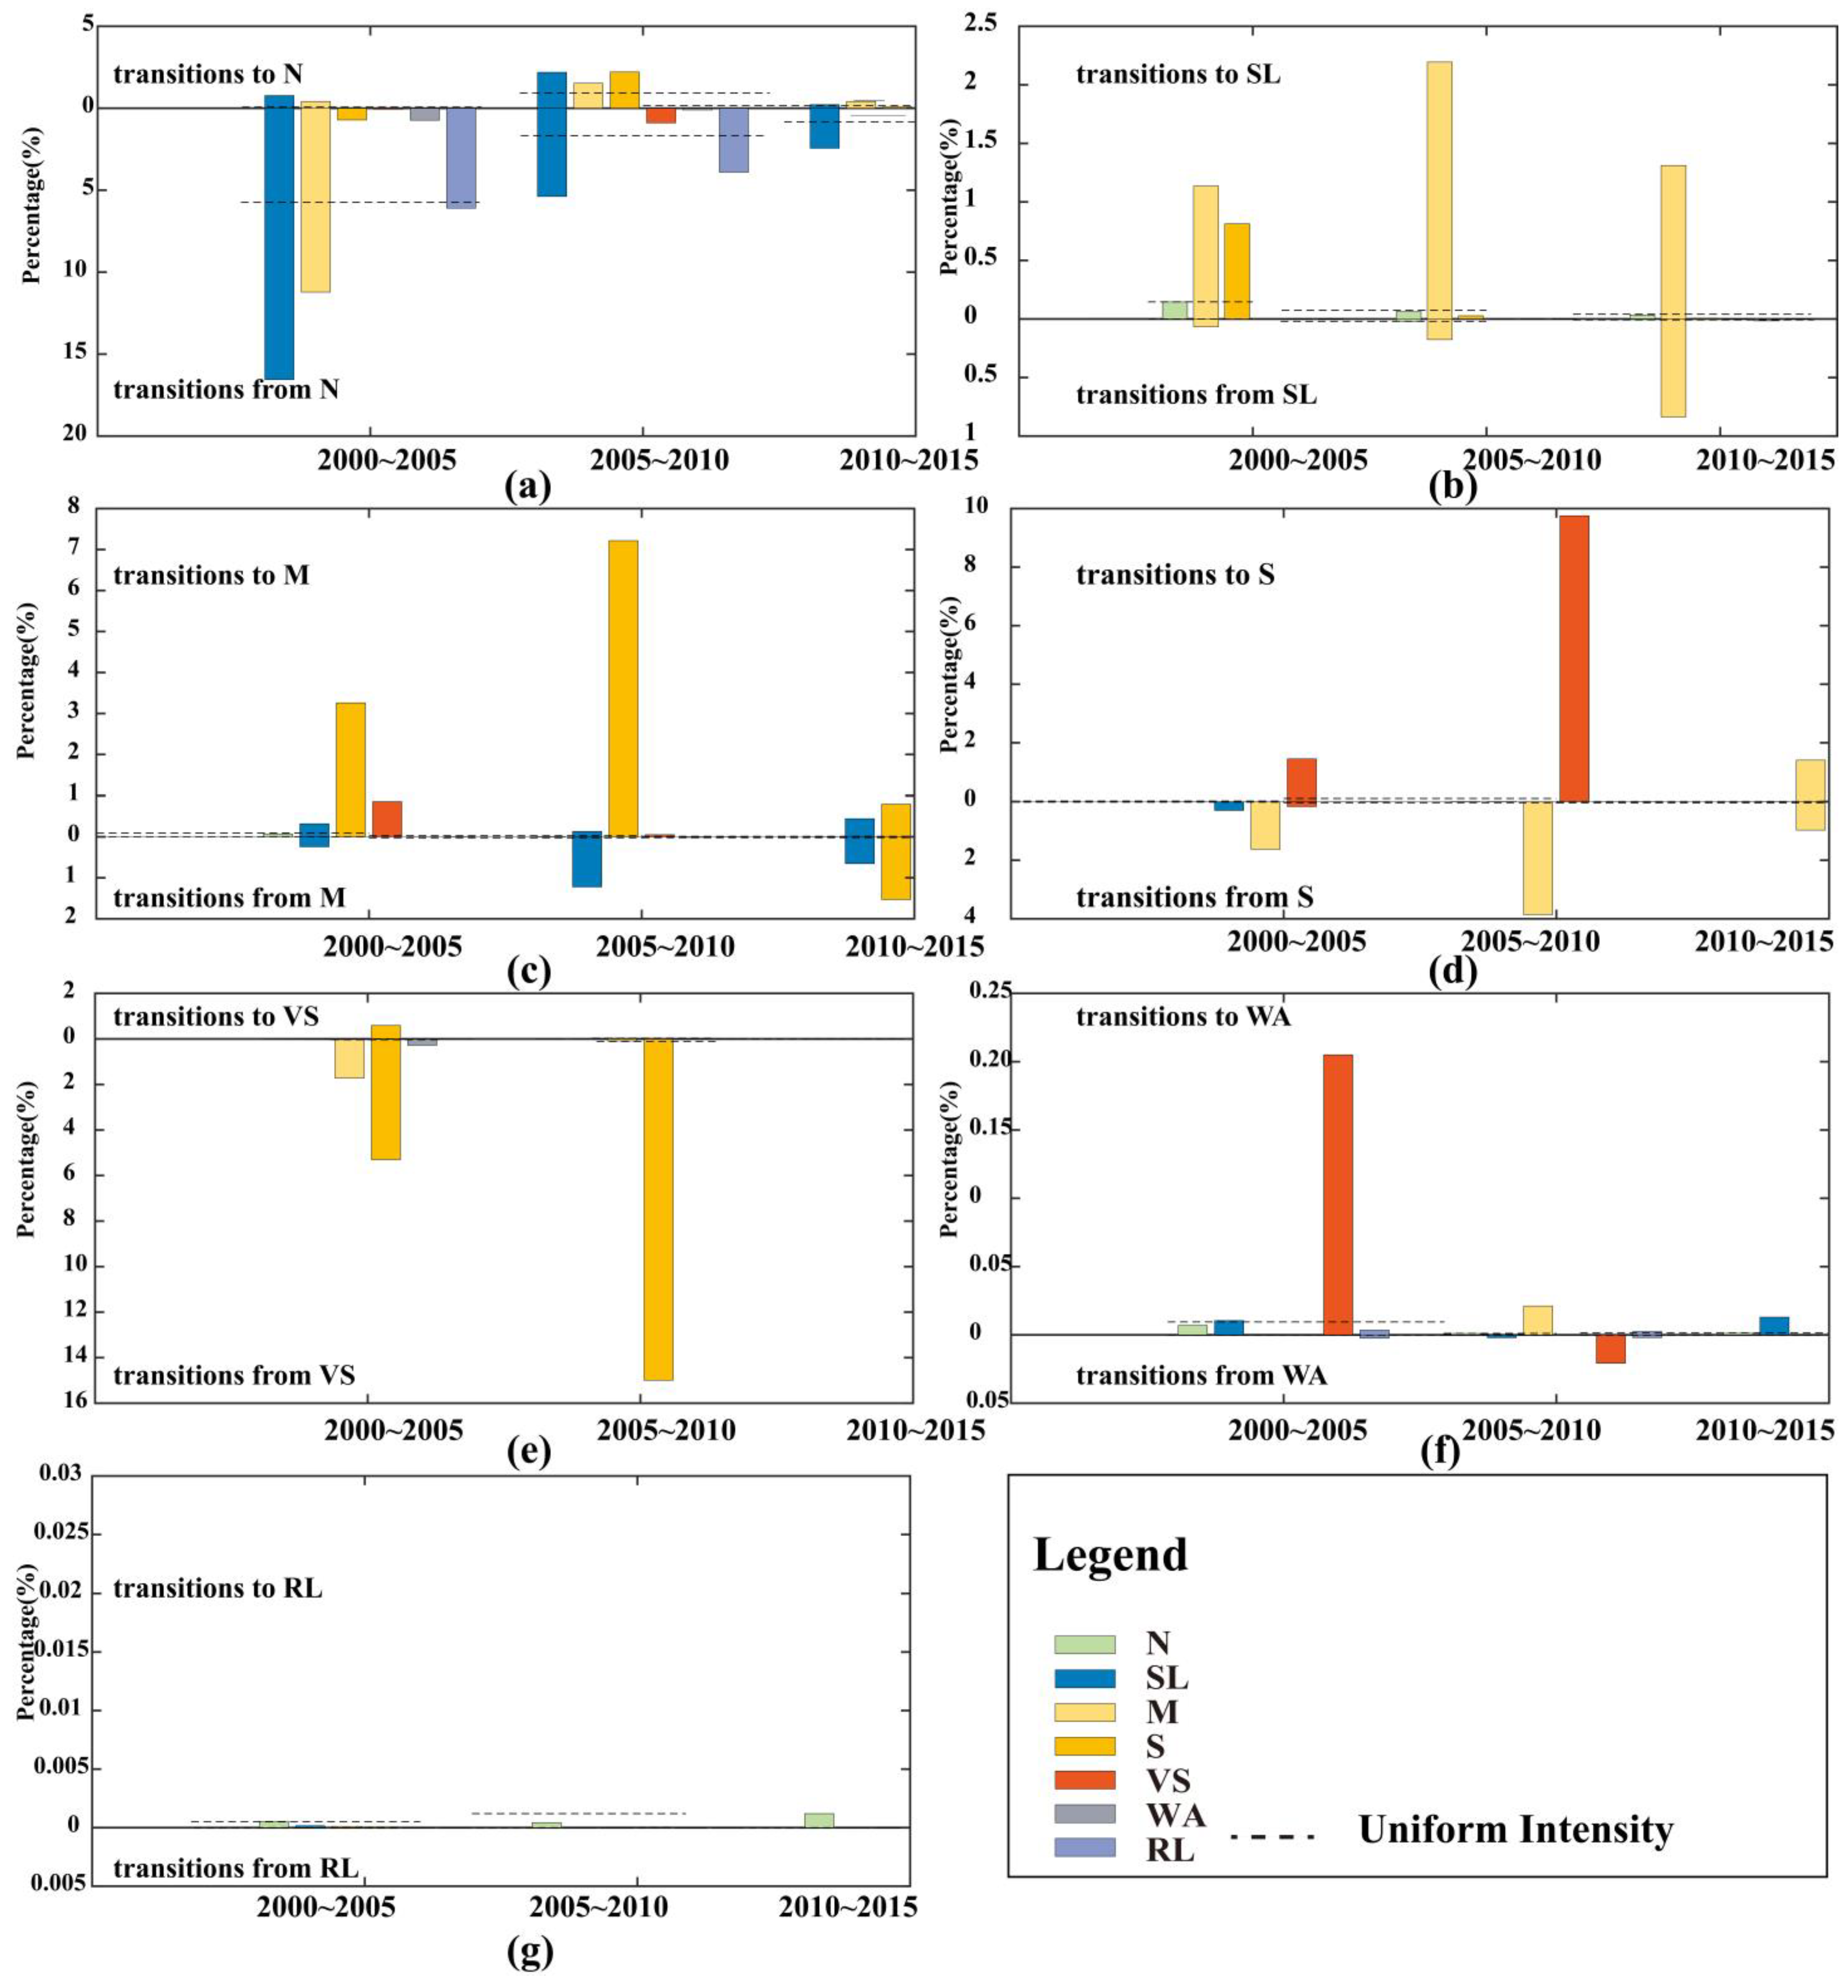
3.2.3. Transition Level

In this section, the transition area and intensity changes for different types of land are analyzed mainly over three intervals. The dotted line in the figure denotes the uniform transition intensity of the change expressed as a percentage. When the annual transition intensity is greater than the uniform intensity, we believe that the gains and losses of a certain type of land are relatively targeted. In the 2000–2005 period, the gains of non-desertified land in the East Ujimqin Banner mainly formed the reversion of SL (Figure 7a, left); the gains of SL were from the reversion of M and V (Figure 7b, left); the gains of M and S were both from the development of non-desertified land (Figure 7c,d, left). vs. was derived from water areas, showing that severe erosion occurred in the area (Figure 7e,f, left). The transition of non-desertified land into desertified land in different categories was targeted during the 2005–2010 period, which indicates that this interval was a period of desertification development (Figure 7a, middle). Desertified lands with high severity were changed into those with low severity, that is, desertification reversions were relatively targeted (Figure 7b–e, middle). However, the transition intensity was much lower than that of desertification development. The transition of M, V, and vs. to SL was the main mode of change during the 2010–2015 period (Figure 7b, right). The transition from non-desertified land to SL and M was targeted more than other types of transition during the 2000–2005 period in the three counties in Mongolia (Figure 7a,c, left). Desertified lands with high severity were changed into those with low severity, that is, desertification reversions were relatively targeted (Figure 8b–e, middle). Despite this, the area of newly added desertified land was active as well; the interval was still a period of mild desertification development in the three counties of Mongolia. In the 2010–2015 period, the gains in SL from non-desertified land were more active (Figure 7a, right). Other types of land transition were targeted, but their intensities were not high.

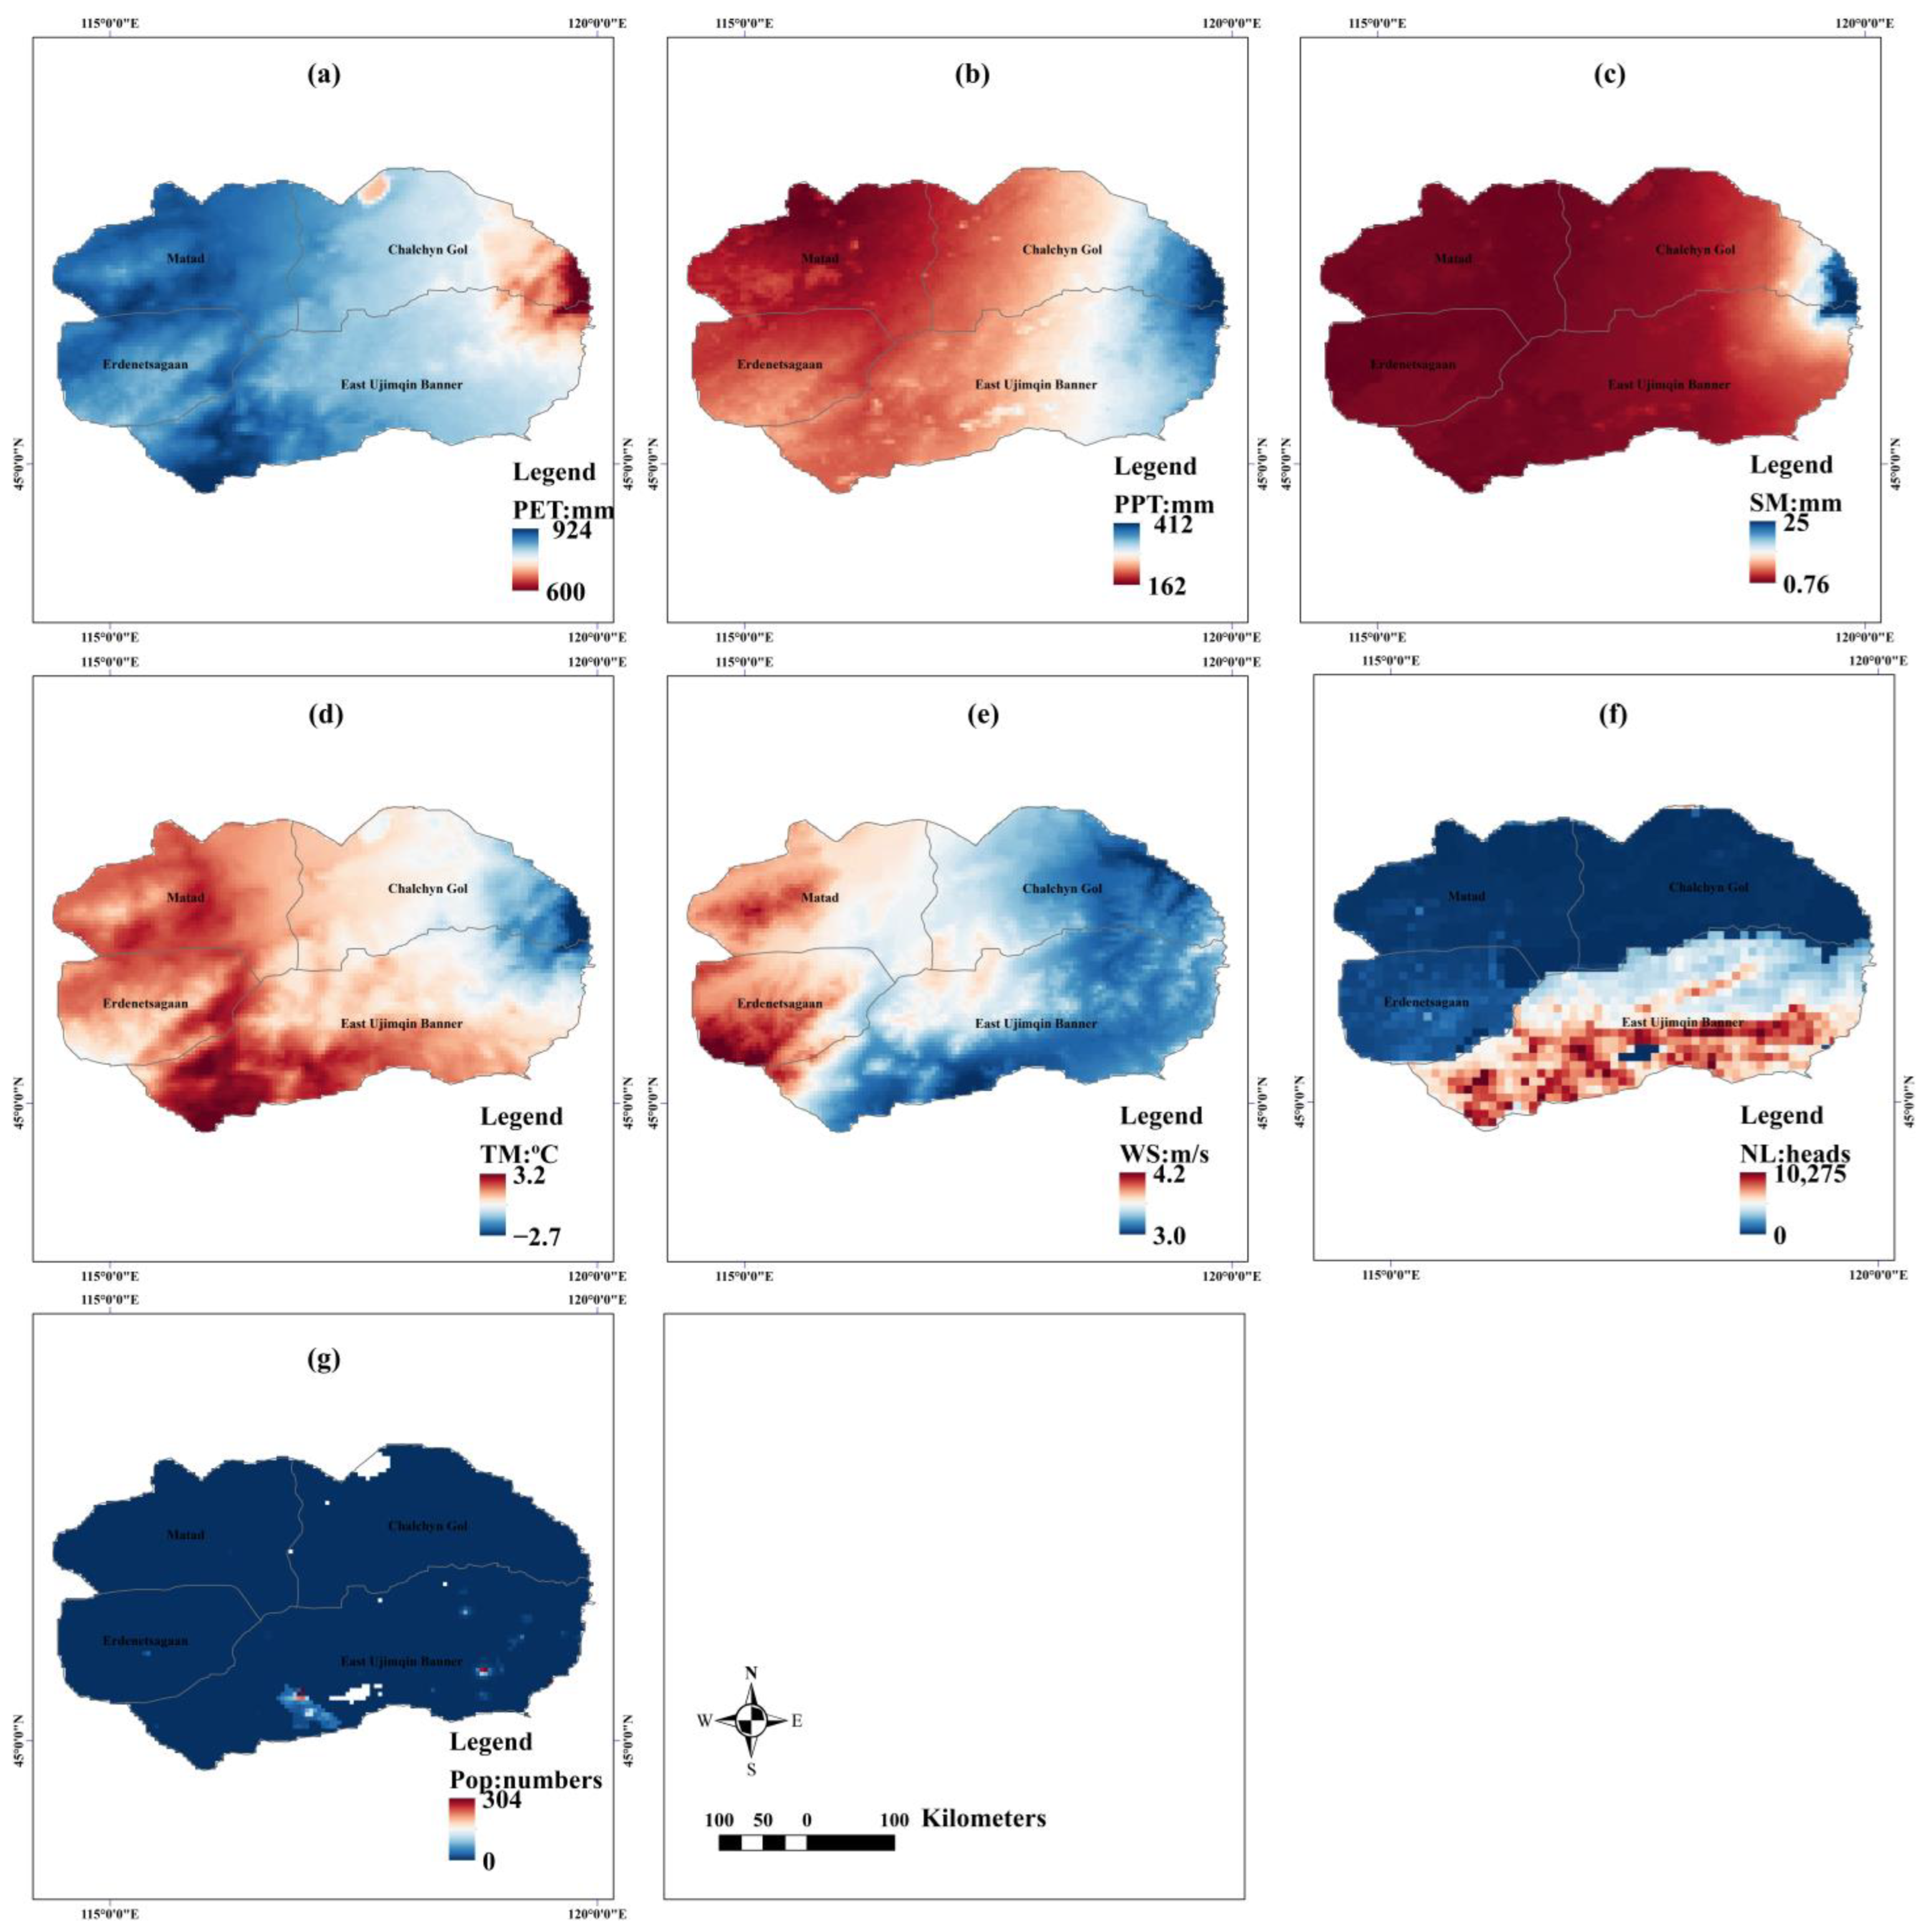
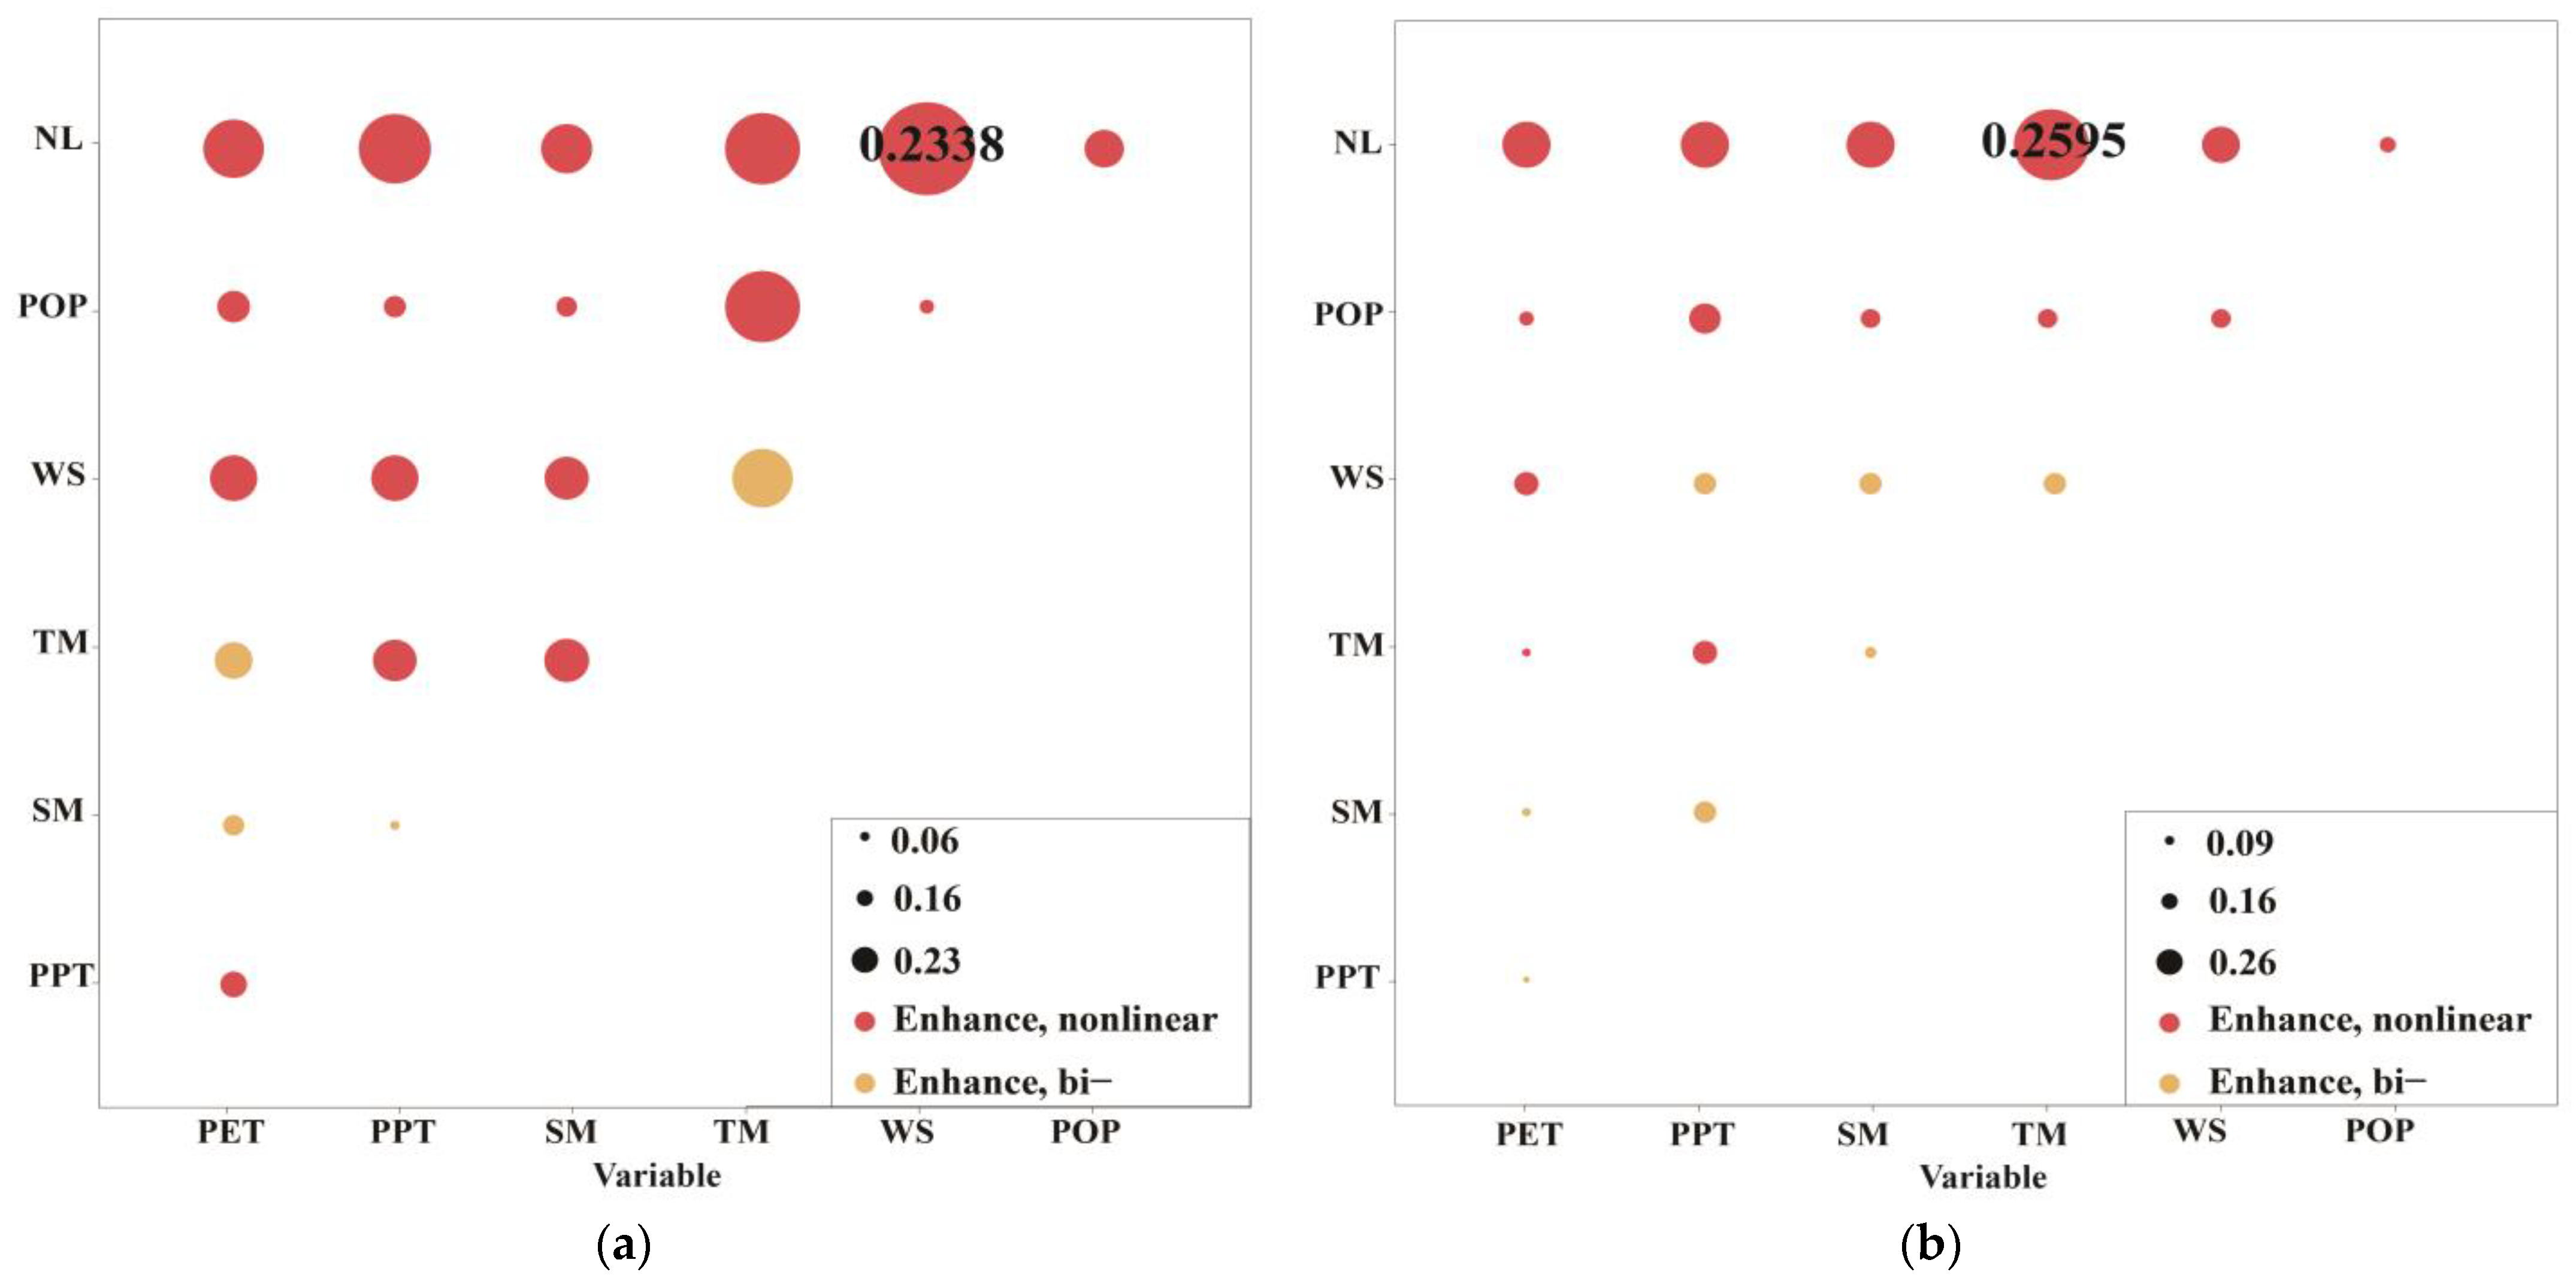
3.3. Drivers of Land Desertification

Dynamic desertification data from 2000 to 2015 served as the dependent variable in the model. The mean value of desertification drivers served as an independent variable in our study. First, the desertification dynamic vector data from 2000 to 2015 were converted into raster data, and their area properties were read. Then, the mean values of the desertification drivers and time span were read, including potential evapotranspiration, precipitation, soil moisture, mean temperature, wind speed, and population. Data on the number of livestock were entered as static information because dynamic data could not be found (Figure 9). Finally, the attribute data were input into the geographical detector model, and factor detectors were used to determine the relative importance of desertification drivers. The program can output the PD values of different drivers and retain factors that pass the significance test.
The results showed that the desertification dynamics of the study area were mainly affected by natural factors (Figure 10). In particular, wind speed had a relatively high explanatory power (PD values of 0.105 and 0.0935, respectively) for the dynamic change of desertification in both the East Ujimqin Banner and three Mongolian counties. It exhibited the greatest influence on desertification and thus was the most critical factor. Temperature also played an important role in the dynamic changes in desertification in the study area, especially in the East Ujimqin Banner, where the PD value was as high as 0.1327 (Figure 10a). Combined with the effects of potential evapotranspiration, precipitation, and soil moisture, we can see that the impact of water and heat conditions on desertification in grassland areas is significant. Although these indicators do not rank equally in the two regions, the overall results show that dry and wet balance has a significant impact on desertification dynamics.
The PD values of the number of livestock were slightly different between the two regions (Figure 10). We found that the number of livestock in East Ujimqin Banner was larger and had a significant impact on desertification, indicating that the grazing intensity was strong in this area. In contrast, the number of livestock in the three Mongolian counties was relatively small and thus had less impact on desertification (Figure 9f). Higher population density in terms of anthropogenic factors can cause an increase in land-use intensity, which may pose risks of desertification. However, the results of geographic detection show that population had little effect on the dynamic changes in desertification in the two regions. Compared to other locations, the population of grassland pastoral areas was relatively small (Figure 9g).
Desertification does not develop or is reversed by the action of a single driver but is the result of the interaction of many factors. An interaction detector was used to explore whether the interaction of factors increased or decreased the impact on desertification. The interaction results showed that seventeen groups of nonlinear enhancement and four groups of bilinear enhancement interaction were detected, indicating the combined effects on the East Ujimqin Banner (Figure 11a). The combination of the higher PD values after the interaction showed ws ∩ nl, tm ∩ nl, and ppt ∩ nl in the form of nonlinear enhancement, which showed that the desertification of the East Ujimqin Banner was affected by windy days, water and heat conditions, and grazing intensity. In Mongolia, fourteen of the interaction combinations were nonlinearly enhanced and seven were bi-enhanced (Figure 11b). The combination of higher PD values after interaction was mainly nl with meteorological factors in the form of nonlinear enhancement, showing that the coupling of anthropogenic activities and meteorological factors has enhanced the effect of desertification. The factor detection results provide evidence that there is little influence of anthropogenic factors on desertification in the three counties of Mongolia. However, the interaction of factors found through interaction detection increased its impact on desertification.

4. Discussion

4.1. Desertification Dynamics

Remote sensing images and the visual interpretation method were applied to monitor the desertification dynamics for the border area of China-Mongolia on the Mongolian Plateau. Compared to previous studies, this study aimed to bring more public attention to the issue of desertification in border areas compared to that in typical sandy areas. The findings of this study can provide basic data and technical support for joint disaster prevention and mitigation in China and Mongolia. We found that as of 2015, the area of desertified land in the East Ujimqin Banner and three counties of Mongolia had increased by 0.618% and 1.118%, respectively, compared with that in 2000. Globally, the dry land vulnerable to desertification covers 45% of the Earth’s land surface [55]. Widespread desertification has occurred in many parts of the world. Sub-Saharan African rangelands are undergoing land degradation and desertification, which indicates an irreversible decline in productivity [56]. In Kyrgyzstan, soil erosion covers an area of 5.5 thousand km2, and the productivity of pastures has decreased four-fold over the last 25 years in Tajikistan [3]. For the republic Uzbekistan, over 80% of the territory is occupied by deserts and semi-deserts, and 63 million hectare of degraded pastures have been reported in Kazakhstan [3]. China suffers from severe desertification and the rapid development of aeolian desertification in northern China [57]. The results of this study show that there is severe salinization around the water areas of the East Ujimqin Banner, while Mongolia has only a small area of salinization and is dominated by aeolian desertification, which is consistent with the results of Li et al. [58].
We used the intensity analysis method to characterize desertification dynamics in the study area from 2000 to 2015. The results show that the interval 2000–2005 was the more active period of desertification dynamics in the East Ujimqin Banner, during which the reduction of SL and the salinization of water areas were dominant. SL was mainly reversed to non-desertified land, and the water areas were mainly developed into VS. Intensity analysis has the advantage of being systematic in the analysis of desertification dynamics. It can effectively address three queries: which time interval is active, which desertification category is dominant, and what are the transition characteristics between desertification categories.

4.2. Desertification Drivers

Currently, climate change and anthropogenic activities are considered the driving factors of desertification [27]. However, there are few quantitative studies on the relationship between desertification and its drivers [28]. First, we found that wind speed has strong explanatory power for desertification dynamics in both the East Ujimqin Banner and the three counties of Mongolia. This finding is consistent with the results of a previous study [59]. On the one hand, strong winds can erode topsoil, destroy native vegetation and soil structure, and enhance desertification [60]. On the other hand, high wind speeds can also increase potential evapotranspiration and make the climate arid, advancing the desertification process [61]. Second, water and heat conditions are key factors that influence desertification [62,63]. An increase in global temperatures could make the world considerably drier and more desert-like [64]. High temperatures and small amounts of precipitation can accelerate water evaporation and promote the reduction of soil moisture, leading to droughts [65,66]. Importantly, evidence shows that drought is one of the reasons for the occurrence and development of desertification [21,47,60]. In terms of anthropogenic factors, the number of livestock has a significant impact on desertification dynamics. Soil bulk density and surface hardness increased with increasing grazing pressure, whereas capillary water holding capacity decreased with increasing grazing pressure [67]. This not only changes the soil moisture but also promotes desertification.
The geographical detector method was used in this study to explore the explanatory power of desertification drivers on the desertification dynamics. This method quantifies and ranks the influences of meteorological and anthropogenic factors on desertification. It can not only detect the intensity of the effect of individual factors on desertification but also reveal the interaction effects of natural and anthropogenic drivers on desertification dynamics. The geographical detector clearly provides new ideas and directions for the quantitative research of desertification.

4.3. Limitations with Possible Future Work

This study has some limitations. We did not consider the policy drivers affecting desertification, which is mainly reflected in the grazing method in the study area. Since 2000, the government has implemented policies such as the suspension of grazing, rotational grazing, and forbidden grazing, and has used the self-repairing capacity of the ecosystem to promote the restoration of natural vegetation with good results in the East Ujimqin Banner [68,69]. The grazing methods commonly used in Mongolia are a combination of inverted and partitioned grazing. The use of different pastures in different seasons can significantly reduce the trampling pressure of grazing livestock on grasslands so that pastures can have sufficient time to recover [17]. Policy drivers cannot be quantified or even spatially gridded; therefore, they cannot be uniformly computed with other datasets.
Owing to the limitations of the received data, the input variable format in the geographical detector model was not unified. For example, we used one year of livestock data, which clearly differs from the dynamic data of meteorological factors. We also failed to spatially characterize the relationship between desertification and its drivers for the functional limitations of the model. In addition, the risk detector, computed using the t-statistic, can identify the optimal ranges and tipping points of drivers that influence desertification. This study is relevant to desertification control. However, the data used in this study were mostly based on reanalysis with some differences from the ground observation data. We believe that this work can be executed based on field surveys in the future. Similarly, we did not conduct field sampling to characterize the changes in vegetation community forming/dissipating during the desertification process.
Furthermore, this study focused on desertification dynamics and their spatial relationship with the drivers of desertification. Moreover, they failed to match desertification changes with their drivers using a time series. The interannual precipitation and soil moisture showed an upward trend (Figure S1b,e), whereas the potential evapotranspiration and wind speed showed a downward trend (Figure S1a,d). However, the temperature in the study area showed an upward fluctuating trend (Figure S1c). The factors characterizing water conditions, such as precipitation and soil moisture, exhibited a clear fluctuation. Therefore, we believe that the climate in the study area is still subject to drought events. The region needs to successfully combat desertification as well as monitor and provide an early warning of the occurrence of desertification drivers, such as drought disasters. We believe that an increase in total population will not lead to further development of desertification in the study area. We need to focus on controlling the number of livestock, preventing overgrazing behavior, and continuing to implement ecological projects, especially in the East Ujimqin Banner. Desertification is an ecological disaster that occurs gradually. However, it must be included in the joint disaster prevention and mitigation efforts of China and Mongolia. Further remote sensing monitoring of desertification in border areas, strengthening the capacity for early warning of desertification risk, and more international cooperation are all needed to facilitate the sharing of information and joint disaster prevention and mitigation in the future.

5. Conclusions

This study monitored the spatiotemporal aspects of desertified land, the change characteristics of desertification dynamics, and its drivers using remote sensing data, the intensity analysis method, and the geographical detector method. The results are as follows.
(1)
During the monitoring period, the desertification of the East Ujimqin Banner experienced a process of reversion-development-mild development, with slight desertified lands dominating in 2000, 2010, and 2015, and very serious desertified lands dominating in 2005. Desertification in the three counties of Mongolia underwent the process of development, mild development, and mild development. In 2000 and 2005, it was dominated by VS, whereas it was dominated by SL in 2010 and 2015.
(2)
In space, vs. was mainly concentrated around the waters of the East Ujimqin Banner and the southern part of Chalchyn Gol County, and the former was mainly salinized, while the latter was characterized by aeolian desertification. The central and southwestern parts of the East Ujimqin Banner and the northern edge of Matad County were dominated by SL.
(3)
The two time intervals between 2000–2005 and 2005–2010 formed the period of rapid change in desertification in the study area, with the most significant changes occurring in the 2000–2005 period. From 2000 to 2005, the East Ujimqin Banner was mainly characterized by the reversion of SL into N (non desertified land) and the development of WA (water areas) to VS. The dynamic characteristics of desertification in the three counties of Mongolia were developed from N to SL, S, and vs. reversed to S to M, respectively, during the 2000–2005 period.
(4)
Wind speed had the strongest explanatory power for desertification dynamics in the study area. The explanatory power of the number of livestock on the desertification dynamics in the East Ujimqin Banner was larger than that in the three counties in Mongolia. In addition, the interaction between natural and anthropogenic factors was shown to enhance the explanatory power of the desertification dynamics in the study area.

Supplementary Materials

The following supporting information can be downloaded at: https://www.mdpi.com/article/10.3390/rs14246365/s1, Figure S1: Interannual variability characteristics of meteorological factors in the study area. (a) Potential evapotranspiration. (b) Precipitation. (c) Temperature. (d) Wind speed. (e) Soil moisture.

Author Contributions

Y.W.: conceptualization, methodology, writing—original draft. E.G.: conceptualization, supervision, inspection. Y.K.: review, editing. H.M.: investigation, validation. All authors have read and agreed to the published version of the manuscript.

Funding

This study was supported by the Natural Science Foundation of Inner Mongolia Autonomous Region of China (2021BS04008, 2019MS04010), the Fundamental Research funds for the Inner Mongolia Normal University (2022JBQN092), the Science and Technology Planning Project in Inner Mongolia (2022YFSH0070).

Data Availability Statement

Not applicable.

Conflicts of Interest

The authors declare no conflict of interest.

References

  1. Negash, S.G. Spatial Assessment of NDVI as an Indicator of Desertification in Ethiopia Using Remote Sensing and GIS. Master’s Thesis, Lund University, Lund, Sweden, 2016. [Google Scholar]
  2. Briassoulis, H. Combating land degradation and desertification: The land-use planning quandary. Land 2019, 8, 27. [Google Scholar] [CrossRef] [Green Version]
  3. Behnke, R.H. The Socio-Economic Causes and Consequences of Desertification in Central Asia, 1st ed.; Springer: Dordrecht, The Nethlands, 2008. [Google Scholar]
  4. Peters, D.P.; Havstad, K.M.; Archer, S.R.; Sala, O.E. Beyond desertification: New paradigms for dryland landscapes. Front. Ecol. Environ. 2015, 13, 4–12. [Google Scholar] [CrossRef] [PubMed] [Green Version]
  5. Ci, L.; Yang, X. Desertification and Its Control in China; Higher Education Press: Beijing, China, 2010. [Google Scholar]
  6. Becerril-Piña, R.; Díaz-Delgado, C.; Mastachi-Loza, C.A.; González-Sosa, E. Integration of remote sensing techniques for monitoring desertification in Mexico. Hum. Ecol. Risk Assess. 2016, 22, 1323–1340. [Google Scholar] [CrossRef]
  7. Zhao, X.; Hu, H.; Shen, H.; Zhou, D.; Zhou, L.; Myneni, R.B.; Fang, J. Satellite-indicated long-term vegetation changes and their drivers on the Mongolian Plateau. Landsc. Ecol. 2015, 30, 1599–1611. [Google Scholar] [CrossRef]
  8. Miao, L.; Müller, D.; Cui, X.; Ma, M. Changes in vegetation phenology on the Mongolian Plateau and their climatic determinants. PLoS ONE 2017, 12, e0190313. [Google Scholar] [CrossRef] [PubMed] [Green Version]
  9. Liang, M.; Smith, N.G.; Chen, J.; Wu, Y.; Guo, Z.; Gornish, E.S.; Liang, C. Shifts in plant composition mediate grazing effects on carbon cycling in grasslands. J. Appl. Ecol. 2021, 58, 518–527. [Google Scholar] [CrossRef]
  10. Angerer, J.; Han, G.; Fujisaki, I.; Havstad, K. Climate change and ecosystems of Asia with emphasis on Inner Mongolia and Mongolia. Rangelands 2008, 30, 46–51. [Google Scholar] [CrossRef] [Green Version]
  11. Liu, S.; Wang, T. Aeolian desertification from the mid-1970s to 2005 in Otindag Sandy Land, Northern China. Environ. Geol. 2007, 51, 1057–1064. [Google Scholar] [CrossRef]
  12. Tu, Z.F.; Li, M.X.; Sun, T. The status and trend analysis of desertification and sandification. For. Resour. Manag. 2016, 1, 1–5. (In Chinese) [Google Scholar]
  13. Buren, G. Research on Current Status, Causes and Prospect of Desertification in Mongolia. Master’s Thesis, Inner Mongolia University, Hohhot, China, 2011. (In Chinese). [Google Scholar]
  14. Singh, S. Desertification mapping in western Rajasthan. Ann. Arid Zone 1992, 31, 237–246. [Google Scholar]
  15. Hong, Y.Y. Analysis of Spatial-Temporal Changes of Vegetation NDVI in Border Areas of China-Mongolia. Master’s Thesis, Inner Mongolia Normal University, Hohhot, China, 2016. (In Chinese). [Google Scholar]
  16. Kundu, A.; Dutta, D. Monitoring desertification risk through climate change and anthropogenic interference using remote sensing and GIS techniques. Int. J. Geomat. Geosci. 2011, 2, 21–33. [Google Scholar]
  17. Han, L.; Zhang, Z.; Zhang, Q.; Wan, X. Desertification assessments in the Hexi corridor of northern China’s Gansu Province by remote sensing. Nat. Hazards 2015, 75, 2715–2731. [Google Scholar] [CrossRef]
  18. Lamchin, M.; Lee, J.Y.; Lee, W.K.; Lee, E.J.; Kim, M.; Lim, C.H.; Kim, S.R. Assessment of land cover change and desertification using remote sensing technology in a local region of Mongolia. Adv. Space Res. 2016, 57, 64–77. [Google Scholar] [CrossRef]
  19. Kundu, A.; Patel, N.R.; Saha, S.K.; Dutta, D. Desertification in western Rajasthan (India): An assessment using remote sensing derived rain-use efficiency and residual trend methods. Nat. Hazards 2017, 86, 297–313. [Google Scholar] [CrossRef]
  20. Zhang, F.; Tiyip, T.; Johnson, V.C.; Kung, H.; Ding, J.; Zhou, M.; Fan, Y.; Kelimu, A.; Nurmuhammat, I. Evaluation of land desertification from 1990 to 2010 and its causes in Ebinur Lake region, Xinjiang China. Environ. Earth Sci. 2015, 73, 5731–5745. [Google Scholar] [CrossRef]
  21. Duan, H.C.; Wang, T.; Xue, X.; Liu, S.L.; Guo, J. Dynamics of aeolian desertification and its driving forces in the Horqin Sandy Land, Northern China. Environ. Monit. Assess. 2014, 186, 6083–6096. [Google Scholar] [CrossRef]
  22. Song, X.; Wang, T.; Xue, X.; Yan, C.; Li, S. Monitoring and analysis of aeolian desertification dynamics from 1975 to 2010 in the Heihe River Basin, northwestern China. Environ. Earth Sci. 2015, 74, 3123–3133. [Google Scholar] [CrossRef]
  23. Becker, F.; Choudhury, B.J. Relative sensitivity of normalized difference vegetation index (NDVI) and microwave polarization difference index (MPDI) for vegetation and desertification monitoring. Remote Sens. Environ. 1988, 24, 297–311. [Google Scholar] [CrossRef]
  24. Sternberg, T.; Tsolmon, R.; Middleton, N.; Thomas, D. Tracking desertification on the Mongolian steppe through NDVI and field-survey data. Int. J. Digit. Earth 2011, 4, 50–64. [Google Scholar] [CrossRef]
  25. Pan, J.; Li, T. Extracting desertification from Landsat TM imagery based on spectral mixture analysis and Albedo-Vegetation feature space. Nat. Hazards 2013, 68, 915–927. [Google Scholar] [CrossRef]
  26. Wang, Y.F.; Zhang, J.Q.; Tong, S.Q.; Guo, E.L. Monitoring the trends of aeolian desertified lands based on time-series remote sensing data in the Horqin Sandy Land, China. Catena 2017, 157, 286–298. [Google Scholar] [CrossRef]
  27. United Nations Convention to Combat Desertification (UNCCD). United Nations Convention to Combat Desertification in Countries Experiencing Serious Drought and/or Desertification, Particularly in Africa; United Nations: Paris, France, 1994. [Google Scholar]
  28. Xu, D.; Li, C.; Song, X.; Ren, H. The dynamics of desertification in the farming-pastoral region of North China over the past 10 years and their relationship to climate change and anthropogenic activity. Catena 2014, 123, 11–22. [Google Scholar] [CrossRef]
  29. Feng, L.; Jia, Z.; Li, Q. The dynamic monitoring of aeolian desertification land distribution and its response to climate change in northern China. Sci. Rep. 2016, 6, 39563. [Google Scholar] [CrossRef]
  30. Wang, X.; Cheng, H.; Li, H.; Lou, J.; Hua, T.; Liu, W.; Zhu, B. Key driving forces of desertification in the Mu Us Desert, China. Sci. Rep. 2017, 7, 3933. [Google Scholar] [CrossRef] [Green Version]
  31. Li, Q.; Zhang, C.; Shen, Y.; Jia, W.; Li, J. Developing trend of aeolian desertification in China’s Tibet Autonomous Region from 1977 to 2010. Environ. Earth Sci. 2016, 75, 895. [Google Scholar] [CrossRef]
  32. Xue, Z.; Qin, Z.; Cheng, F.; Ding, G.; Li, H. Quantitative assessment of aeolian desertification dynamics–A case study in north Shanxi of China (1975 to 2015). Sci. Rep. 2017, 7, 10460. [Google Scholar] [CrossRef]
  33. Zhang, G.; Biradar, C.M.; Xiao, X.; Dong, J.; Zhou, Y.; Qin, Y. Exacerbated grassland degradation and desertification in Central Asia during 2000–2014. Ecol. Appl. 2018, 28, 442–456. [Google Scholar] [CrossRef] [Green Version]
  34. Wang, J.F.; Li, X.H.; Christakos, G.; Liao, Y.L.; Zhang, T.; Gu, X.; Zheng, X.Y. Geographical detectors-based health risk assessment and its application in the neural tube defects study of the Heshun Region, China. Int. J. Geogr. Inf. Sci. 2010, 24, 107–127. [Google Scholar] [CrossRef]
  35. Wang, J.F.; Hu, Y. Environmental health risk detection with GeogDetector. Environ. Model. Softw. 2012, 33, 114–115. [Google Scholar] [CrossRef]
  36. Zheng, K.; Tan, L.; Sun, Y.; Wu, Y.; Duan, Z.; Xu, Y.; Gao, C. Impacts of climate change and anthropogenic activities on vegetation change: Evidence from typical areas in China. Ecol. Indic. 2021, 126, 107648. [Google Scholar] [CrossRef]
  37. Dong, Y.; Yin, D.; Li, X.; Huang, J.; Su, W.; Li, X.; Wang, H. Spatial–temporal evolution of vegetation NDVI in association with climatic, environmental and anthropogenic factors in the loess plateau, China during 2000–2015: Quantitative analysis based on geographical detector model. Remote Sens. 2021, 13, 4380. [Google Scholar] [CrossRef]
  38. Zhang, J.; Yang, G.; Yang, L.; Li, Z.; Gao, M.; Yu, C.; Gong, E.; Long, H.; Hu, H. Dynamic Monitoring of Environmental Quality in the Loess Plateau from 2000 to 2020 Using the Google Earth Engine Platform and the Remote Sensing Ecological Index. Remote Sens. 2022, 14, 5094. [Google Scholar] [CrossRef]
  39. Venkatesh, K.; John, R.; Chen, J.; Xiao, J.; Amirkhiz, R.G.; Giannico, V.; Kussainova, M. Optimal ranges of social-environmental drivers and their impacts on vegetation dynamics in Kazakhstan. Sci. Total Environ. 2022, 847, 157562. [Google Scholar] [CrossRef]
  40. Guo, B.; Wei, C.; Yu, Y.; Liu, Y.; Li, J.; Meng, C.; Cai, Y. The dominant influencing factors of desertification changes in the source region of Yellow River: Climate change or anthropogenic activity? Sci. Total Environ. 2022, 813, 152512. [Google Scholar] [CrossRef]
  41. Tomasella, J.; Vieira, R.M.S.P.; Barbosa, A.A.; Rodriguez, D.A.; de Oliveira, S.M.; Sestini, M.F. Desertification trends in the Northeast of Brazil over the period 2000–2016. Int. J. Appl. Earth Obs. 2018, 73, 197–206. [Google Scholar] [CrossRef]
  42. Huang, J.; Pontius, R.G., Jr.; Li, Q.; Zhang, Y. Use of intensity analysis to link patterns with processes of land change from 1986 to 2007 in a coastal watershed of southeast China. Appl. Geogr. 2012, 34, 371–384. [Google Scholar] [CrossRef]
  43. Pontius, R.G.; Shusas, E.; McEachern, M. Detecting important categorical land change while accounting for persistence. Agric. Ecosyst. Environ. 2004, 101, 251–268. [Google Scholar] [CrossRef]
  44. Wei, H.; Wang, J.; Cheng, K.; Li, G.; Ochir, A.; Davaasuren, D.; Chonokhuu, S. Desertification information extraction based on feature space combinations on the Mongolian plateau. Remote Sens. 2018, 10, 1614. [Google Scholar] [CrossRef] [Green Version]
  45. Zhang, X.; Zhang, S. China-Mongolia-Russia economic corridor and environmental protection cooperation. R-Economy 2017, 3, 161–166. [Google Scholar] [CrossRef] [Green Version]
  46. Sa, R. Analysis of Desertification Changes in China-Mongolia Border Area Based on Landsat TM Data. Master’s Thesis, Inner Mongolia Normal University, Hohhot, China, 2017. (In Chinese). [Google Scholar]
  47. Meng, X.Z. A Study on the Influences of Mongolia Desertification on the Desertification in Northern China. Master’s Thesis, Jilin University, Changchun, China, 2012. (In Chinese). [Google Scholar]
  48. Peel, M.C.; Finlayson, B.L.; McMahon, T.A. Updated world map of the Köppen-Geiger climate classification. Hydrol. Earth Syst. Sci. 2007, 11, 1633–1644. [Google Scholar] [CrossRef] [Green Version]
  49. Guo, Q.; Fu, B.; Shi, P.; Cudahy, T.; Zhang, J.; Xu, H. Satellite monitoring the spatial-temporal dynamics of desertification in response to climate change and anthropogenic activities across the ordos plateau, China. Remote Sens. 2017, 9, 525. [Google Scholar] [CrossRef] [Green Version]
  50. Abatzoglou, J.T.; Dobrowski, S.Z.; Parks, S.A.; Hegewisch, K.C. TerraClimate, a high-resolution global dataset of monthly climate and climatic water balance from 1958–2015. Sci. Data 2018, 5, 170191. [Google Scholar] [CrossRef] [Green Version]
  51. Gilbert, M.; Nicolas, G.; Cinardi, G.; Van Boeckel, T.P.; Vanwambeke, S.O.; Wint, G.R.W.; Robinson, T.P. Global distribution data for cattle, buffaloes, horses, sheep, goats, pigs, chickens and ducks in 2010. Sci. Data 2018, 5, 180227. [Google Scholar] [CrossRef]
  52. Yin, S. Dynamic Study of Desertification in Hunshandake Sandy Land of Inner Mongolia. Ph.D. Thesis, Inner Mongolia Agricultural University, Hohhot, China, 2010. (In Chinese). [Google Scholar]
  53. Hu, Q.; Wu, W.; Xia, T.; Yu, Q.; Yang, P.; Li, Z.; Song, Q. Exploring the use of Google Earth imagery and object-based methods in land use/cover mapping. Remote Sens. 2003, 5, 6026–6042. [Google Scholar] [CrossRef] [Green Version]
  54. Wang, J.F.; Xu, C.D. Geodetector: Principle and prospective. Acta Geol. Sin. 2017, 72, 116–134. (In Chinese) [Google Scholar]
  55. Portnov, B.A.; Safriel, U.N. Combating desertification in the Negev: Dryland agriculture vs. dryland urbanization. J. Arid Environ. 2004, 56, 659–680. [Google Scholar] [CrossRef]
  56. Sivakumar, M.V.K. Interactions between climate and desertification. Agric. For. Meteorol. 2017, 142, 143–155. [Google Scholar] [CrossRef]
  57. Tao, W. Aeolian desertification and its control in Northern China. Int. Soil Water Conserv. Res. 2014, 2, 34–41. [Google Scholar] [CrossRef] [Green Version]
  58. Li, Y.W.; Li, C.L.; Liu, J.; Yin, S.; Bao, Y.H.; Bao, H.J.; Latengtuya, A. The dynamic change characteristics of land desertification in recent 20 years taking Xilingol League as case study. Soil Fertil. Sci. China 2015, 5, 1–6. (In Chinese) [Google Scholar]
  59. Wang, X.; Li, X.; Cai, D.; Lou, J.; Li, D.; Liu, F. Salinification and salt transports under aeolian processes in potential desertification regions of China. Sci. Total Environ. 2021, 782, 146832. [Google Scholar] [CrossRef]
  60. Feng, K.; Wang, T.; Liu, S.; Yan, C.; Kang, W.; Chen, X.; Guo, Z. Path analysis model to identify and analyse the causes of aeolian desertification in Mu Us Sandy Land, China. Ecol. Indic. 2021, 124, 107386. [Google Scholar] [CrossRef]
  61. Yin, Y.; Wu, S.; Chen, G.; Dai, E. Attribution analyses of potential evapotranspiration changes in China since the 1960s. Theor. Appl. Climatol. 2010, 101, 19–28. [Google Scholar] [CrossRef]
  62. Guo, X.; Chen, R.; Thomas, D.S.; Li, Q.; Xia, Z.; Pan, Z. Divergent processes and trends of desertification in Inner Mongolia and Mongolia. Land Degrad. Dev. 2021, 32, 3684–3697. [Google Scholar] [CrossRef]
  63. Venkatesh, K.; John, R.; Chen, J.; Jarchow, M.; Amirkhiz, R.G.; Giannico, V.; Saraf, S.; Jain, K.; Kussainova, M.; Yuan, J. Untangling the impacts of socioeconomic and climatic changes on vegetation greenness and productivity in Kazakhstan. Environ. Res. Lett. 2022, 17, 095007. [Google Scholar] [CrossRef]
  64. D’Odorico, P.; Bhattachan, A.; Davis, K.F.; Ravi, S.; Runyan, C.W. Global desertification: Drivers and feedbacks. Adv. Water Resour. 2013, 51, 326–344. [Google Scholar] [CrossRef]
  65. Xu, L.; Chen, N.; Yang, C.; Zhang, C.; Yu, H. A parametric multivariate drought index for drought monitoring and assessment under climate change. Agric. For. Meteorol. 2021, 310, 108657. [Google Scholar] [CrossRef]
  66. Afshar, M.H.; Bulut, B.; Duzenli, E.; Amjad, M.; Yilmaz, M.T. Global spatiotemporal consistency between meteorological and soil moisture drought indices. Agric. For. Meteorol. 2022, 316, 108848. [Google Scholar] [CrossRef]
  67. Li, Z.H.; Bao, Y.J.; Wang, H.M.; Xu, T.; Cheng, Y.; Gao, J.X. The analysis on degeneration status and the driving force of Xilinguole Steppe. Ecol. Environ. 2008, 17, 2312–2318. (In Chinese) [Google Scholar]
  68. Zhuo, L.; Cao, X.; Chen, J.; Chen, Z.X.; Shi, P.J. Assessment of grassland ecological restoration project in Xilingol Grassland. Acta Geol. Sin. 2007, 62, 471–480. (In Chinese) [Google Scholar]
  69. Wu, Z.R.; Jia, L.; Du, B.Z.; Hu, Y.F.; Yan, H.M.; Cao, X.C.; Long, X. Impact of ecological conservation program on lifestyle changes of households in Inner Mongolia. Resour. Sci. 2012, 34, 1049–1061. (In Chinese) [Google Scholar]
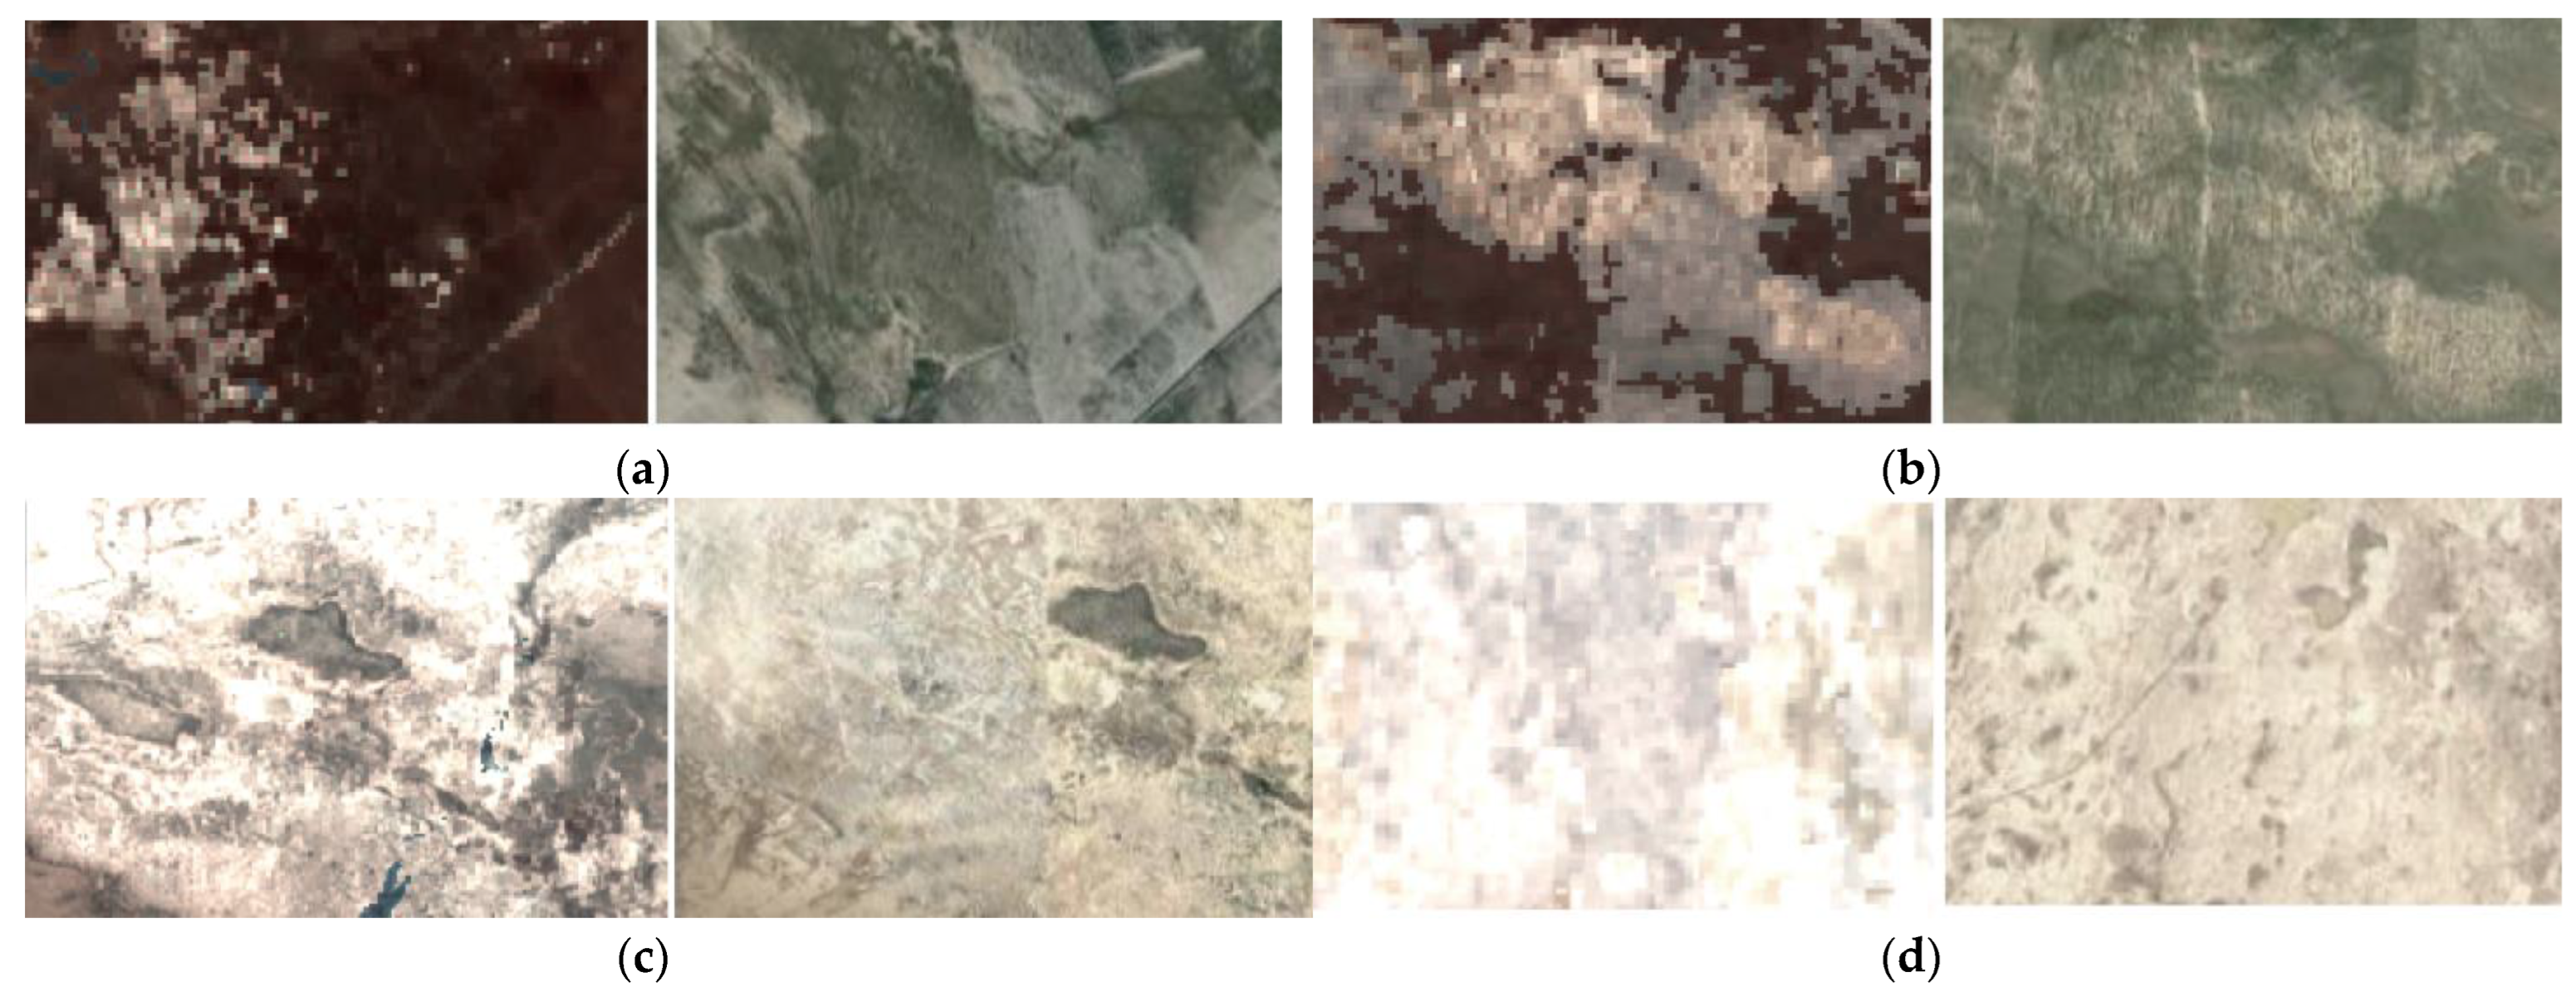
Figure 1. Overview of the study area. (a) Geographical location, administrative units and elevation; (b) Koppen–Geiger climate classification; (c) land use and land cover in 2015.
Remotesensing 14 06365 g001
Figure 2. Interpretation marks of desertification in Landsat images (left) and Google images (right). (a) Slight desertified land, (b) moderate desertified land, (c) serious desertified land, and (d) very serious desertified land.
Remotesensing 14 06365 g002
Figure 3. Spatial distributions of desertified lands of the study area during 2000–2015.
Remotesensing 14 06365 g003
Figure 4. Changes in area and intensity of desertified lands in the interval level of the East Ujimqin Banner (a) and the three counties in Mongolia (b).
Remotesensing 14 06365 g004
Figure 5. Area and intensity changes for different types of land in the East Ujimqin Banner. (a) The interval of 2000~2005; (b) the interval of 2005~2010; (c) the interval of 2010~2015.
Remotesensing 14 06365 g005
Figure 6. Area and intensity changes for different types of land in the three counties of Mongolia. (a) The interval of 2000~2005; (b) the interval of 2005~2010; (c) the interval of 2010~2015.
Remotesensing 14 06365 g006
Figure 7. Transition area and intensity changes for different types of land in the East Ujimqin Banner.
Remotesensing 14 06365 g007
Figure 8. Transition area and intensity changes for different types of land in the three counties of Mongolia.
Remotesensing 14 06365 g008
Figure 9. Spatial distribution of desertification drivers in the study area. (a) Potential evapotranspiration; (b) precipitation; (c) soil moisture; (d) temperature; (e) wind speed; (f) number of livestock; (g) population.
Remotesensing 14 06365 g009
Figure 10. PD value of desertification drivers. (a) East Ujimqin Banner; (b) the three counties in Mongolia.
Remotesensing 14 06365 g010
Figure 11. Interaction results of desertification drivers in the study area. (a) East Ujimqin Banner, (b) the three counties in Mongolia.
Remotesensing 14 06365 g011
Table 1. Classification system of desertification.
CategoryVegetation CoverageImage Features
Slight
(SL)
50–70%The patches are red, and the sandy land is distributed in spots with vegetation.
Moderate
(M)
30–50%Red and white are mixed in strips.
Serious
(S)
10–30%Red mixed with white is distributed in flakes or spots, and severe wind erosion has occurred in most areas.
Very Serious
(VS)
<10%The overall appearance is bright white with only a small amount of speckled vegetation information
Table 2. Definition of interaction detector.
DescriptionInteraction
P ( A B ) < min ( P ( A ) , P ( B ) ) nonlinear weaken
min ( P ( A ) , P ( B ) ) < P ( A B ) < max ( P ( A ) , P ( B ) ) uni-weaken
P ( A B ) > max ( P ( A ) , P ( B ) ) and P ( A B ) < P ( A ) + P ( B ) bi-enhance
P ( A B ) > P ( A ) + P ( B ) nonlinearly enhance
P ( A B ) = P ( A ) + P ( B ) independent
Table 3. Variation of desertified land areas (km2) and its percentages (%).
RegionYearSLMSVSWater
Area
Residential
Land
East Ujimqin Banner20003530.69428.36283.981307.04688.3543.17
3.1050.3770.251.150.6050.038
2005988.83385.75364.632334.5270.0640.39
0.870.3390.3212.0530.0620.036
20103215.16687.96352.621982.03100.0296.71
2.8280.6050.311.7430.0880.085
20153832.25558.19341.091521.49350.70154.27
3.3710.4910.31.3380.3080.136
2000–2005−2541.86−42.6180.651027.48−618.29−2.78
−2.236−0.0370.0710.904−0.544−0.002
2005–20102226.33302.21−12.01−352.4929.9656.32
1.9580.266−0.011−0.310.0260.05
2010–2015617.09−129.77−11.53−460.54250.6857.56
0.543−0.114−0.01−0.4050.220.051
2000–2015301.56129.8357.11214.45−337.65111.1
0.2660.1140.050.188−0.2970.098
Three counties in Mongolia2000124.75173.78298.091197.02836.675.69
0.110.1530.2621.0530.7360.005
2005811.99597.2327.091058.94880.428.19
0.7140.5250.2880.9310.7740.007
20101072.38611.78689.04565.54884.2610.18
0.9430.5380.6060.4970.7780.009
20151226.1567.19560.23711.24889.5815.68
1.0780.4990.4930.6260.7820.014
2000–2005687.24423.4229.00−138.0843.752.50
0.6040.3720.026−0.1220.0380.002
2005–2010260.3914.58361.95−493.43.841.99
0.2290.0130.318−0.4340.0040.002
2010–2015153.72−44.59−128.81145.705.325.50
0.135−0.039−0.1130.1290.0040.005
2000–20151101.35393.41262.14−485.7852.919.99
0.9680.3460.231−0.4270.0460.009
Publisher’s Note: MDPI stays neutral with regard to jurisdictional claims in published maps and institutional affiliations.

