Technical Note

Ozone Pollution of Megacity Shanghai during City-Wide Lockdown Assessed Using TROPOMI Observations of NO2 and HCHO

1
Shanghai Key Laboratory of Atmospheric Particle Pollution and Prevention (LAP3), Department of Environmental Science and Engineering, Fudan University, Shanghai 200433, China
2
Institute of Eco-Chongming (IEC), Shanghai 202162, China
3
College of Foreign Languages and Literature, Fudan University, Shanghai 200433, China
4
Zhuhai Fudan Innovation Institute, Zhuhai 519000, China
5
Institute of Atmospheric Sciences, Fudan University, Shanghai 200433, China
*
Author to whom correspondence should be addressed.
Remote Sens. 2022, 14(24), 6344; https://doi.org/10.3390/rs14246344
Submission received: 10 November 2022 / Revised: 8 December 2022 / Accepted: 11 December 2022 / Published: 15 December 2022
(This article belongs to the Section Atmospheric Remote Sensing)

Abstract

:
An unprecedented city-wide lockdown took place in Shanghai from April to May 2022 to curb the spread of COVID-19, which caused socio-economic disruption but a significant reduction of anthropogenic emissions in this metropolis. However, the ground-based monitoring data showed that the concentration of ozone (O3) remained at a high level. This study applied Tropospheric Monitoring Instrument (TROPOMI) observations to examine changes in tropospheric vertical column density (VCD) of nitrogen dioxide (NO2) and formaldehyde (HCHO), which are precursors of O3. Compared with the same period in 2019–2021, VCDs of NO2 and HCHO decreased respectively by ~50% and ~20%. Multiple regression analysis showed that the lockdown effect played a dominant role in this dramatic decline rather than meteorological impacts. Using the exponentially-modified Gaussian method, this study quantified nitrogen oxides (NOX) emission in Shanghai as 32.60 mol/s with a decrease of 50–80%, which was mainly contributed by the transportation and industrial sectors. The significant reduction of NOX emission in Shanghai is much higher than that of volatile organic compounds (VOCs), which led to dramatic changes in formaldehyde-to-nitrogen dioxide ratio (HCHO/NO2, FNR). Thus, when enforcing regulation on NOx emission control in the future, coordinately reducing VOCs emission should be implemented to mitigate urban O3 pollution.
Keywords:
ozone; NOX; HCHO; COVID-19; TROPOMI

1. Introduction

Tropospheric ozone (O3), a severe air pollutant over East China in recent years, has significant impacts on human health, ecosystems, and climate change [1,2,3]. Photochemical O3 pollution usually occurs by photochemical oxidation of volatile organic compounds (VOCs) in the presence of nitrogen oxides (NOX) via driving O3-NOX-VOCs sensitivity [4,5]. In urban areas, anthropogenic emission of VOCs and NOX are both greatly affected by human activities [5,6]. Urban NOX emissions mainly come from fossil fuel combustion, while VOCs have a wide range of anthropogenic sources [4,6]. Nitrogen dioxide (NO2) and formaldehyde (HCHO) are short-lived (several hours) during daytime due to their rapid removal by reaction with OH radicals and photolysis, and they are significantly affected by local emission of VOCs and NOX [7,8]. Therefore, NO2 and HCHO have been widely regarded as precursors to analyse tropospheric O3 in previous studies [9,10,11].
The short-term emission control during specific events provides an important chance to explore urban air pollution, including O3 pollution [12,13,14,15,16,17]. Ding et al. [14] applied DECSO (Daily Emission estimates Constrained by Satellite Observations) to estimate the reduction of NOX emission during the 2014 Youth Olympic Games in Nanjing. Ma et al. [16] utilized the difference-in-difference (DID) method to evaluate the effect of emission control measures during three mega events. Tanvir et al. [17] used an multi-axis differential optical absorption spectroscope (MAX-DOAS) instrument to investigate the impact of reduced anthropogenic activity on Shanghai air quality during 2020 lockdown period. Among the various monitoring methods for assessing the impact of policies on air quality, satellite observations have been previously proven to be reliable either under temporary regulation or long-term strategy due to short-term global coverage [6,18,19].
Since the outbreak of coronavirus disease (COVID-19), the Chinese government has implemented strict lockdown measures in the affected areas to curb the spread of the pandemic [20,21]. As an unexpected by-effect, anthropogenic emissions, especially for transportation and industries, reduced dramatically, which caused unprecedented effects in the atmospheric environment, gaining much attention [22,23]. Previous studies have shown that the COVID-19 lockdown resulted in a significant nationwide drop in fine particulate matter (PM2.5) and NO2, but an unexpected increase in O3 concentration [12,13,23,24]. O3-NOX-VOCs sensitivity has a strong seasonal dependence. During the 2020 lockdown, which spanned from late winter to early spring, most cities were still in the NOx saturated regime [5]. The analysis of O3 sensitivity during the O3 season based on direct observations is still in a blank stage.
Covering Shanghai, Jiangsu, Zhejiang, and Anhui provinces, the Yangtze River Delta (YRD) is one of the most economically developed city clusters in China (Figure S1). Shanghai is the core city of the YRD region with a population of 24.88 million and Gross Domestic Product (GDP) of RMB 3.87 trillion in 2020 [25,26]. Since March 2022, a new round of pandemic surged in Shanghai due to the wide spread of Omicron variant. To control the pandemic outbreak in China, the Shanghai government implemented a two-month city-wide lockdown regulation from 1 April to 31 May. The affected population and the time duration of this lockdown in Shanghai had reached an unprecedented level, which provides a unique opportunity to explore the lockdown impact on air quality in megacities.
This study aimed to investigate the impacts of lockdown on O3 pollution over Shanghai. Based on TROPOspheric Monitoring Instrument (TROPOMI) observations of NO2 and HCHO, the vertical column density (VCD) of these two components in the atmosphere was quantified and NOX emission changes during the lockdown were analyzed. In addition, the impact of the changed O3 precursor concentration on the O3-NOX-VOCs formation sensitivity in Shanghai was further discussed.

2. Data and Method

2.1. TROPOMI Observations

TROPOMI, launched by the European Space Agency (ESA) on 13 October 2017, observed several trace gases globally at 13:35 local solar time by measuring the reflected solar radiation with a 2600 km swath [27]. At nadir, TROPOMI presented a high spatial resolution of 7/5.5 km × 3.5 km with little variation in other pixel sizes, enabling it to obtain the regional distribution of pollutant concentration nearly once a day [28]. In this study, TROPOMI NO2 and HCHO product level-2 data were published by ESA, and are available at NASA’s Goddard Earth Sciences Data and Information Services Center (GES DISC) website (https://disc.gsfc.nasa.gov/, accessed on 10 December 2022). The tropospheric NO2 and HCHO VCDs were extracted and filtered with quality flags exceeding 0.75 and 0.5, respectively. The pixels were further re-gridded into 0.01° × 0.01°, which can be referred to the study of Xue et al. [29]. For each HCHO grid, a 24 km averaging radius was applied to smoothen the data for less noise [10,30].

2.2. Exponentially-Modified Gaussian (EMG) Method

The EMG model can directly estimate the NOX emission of a city or thermal power plant without relying on the forward chemical transport model. It is particularly suitable for evaluating the NOX emission reduction of Shanghai during the lockdown period in a short time [31,32]. In this study, a two-step EMG approach was applied to estimate NOX emissions. This study defined calm wind as wind speed below 2 m/s. For the first step, the NO2 lifetime fit can be expressed as follows:
M ( x ) = a * ( e C ) ( x ) + b
e ( x ) = exp ( x x 0 ) ,
where M(x) represents the distribution of observed NO2 line density under windy conditions, a is the scaling factor, e(x) represents the exponential decay function, C(x) indicates the line density of calm wind conditions, and b is the offset. x0 is the e-folding distance downwind, which can be divided by wind speed to calculate the NO2 lifetime.
For the second step, NO2 mass fitting can be described as:
g ( x ) = A * 1 2 π σ exp ( ( x Ω ) 2 2 σ 2 ) + ε + β ( x Ω )
where g(x) indicates line density under calm wind conditions, A represents the amount of NO2 mass, σ is the standard deviation of Gaussian function, Ω is offset, and ε + β(xΩ) represents the influence of background concentrations. At last, NO2 emission can be obtained by dividing NO2 mass by its lifetime and further converted to NOX emission by an empirical conversion coefficient of 1.32 [31,32]. A detailed evaluation on the uncertainty of the EMG method for quantifying NO2 lifetime and NOX emission can be found in the study by Xue et al. [29].

2.3. Other Auxiliary Data

Daily concentrations of ground surface O3, NO2, PM10 and PM2.5 were measured by in situ instruments at state-controlled sites in Shanghai, collected from the Shanghai Municipal Bureau of Ecology and Environment. The meteorological data, including total precipitation, eastward wind (U wind), northward wind (V wind), horizontal wind speed (HWS), vertical velocity (W wind), relative humidity (RH), temperature (T) and solar radiation (SR), came from fifth generation reanalysis data (ERA5) with 0.25° × 0.25° resolution, which was published by European Centre for Medium-Range Weather Forecasts (ECMWF) website (https://cds.climate.copernicus.eu/, accessed on 10 December 2022) [33,34]. In this study, except for the total precipitation, the ERA5 data on pressure levels being less than or equal to 950 hPa height (~500 m) at 14:00 LT (close to TROPOMI overpass time) was averaged. The bottom-up NOX emissions over Shanghai were taken from China Multi-Resolution Emissions Inventory (MEIC) for the year of 2019, which included monthly subsector (industrial, power, residential, and transportation sector) emissions data [35].

3. Results and Discussion

3.1. Air Pollutants in Lockdown Period

During this lockdown period, the sharply reduced intensity of human activities due to the strict quarantine policy had huge impacts on the atmospheric environment (Figure 1). Compared to the same period in 2019–2021, significant drops in the concentrations of many air pollutants, e.g., NO2 (54.84%), PM10 (34.26%), and PM2.5 (32.20%), were observed by ground monitoring stations (Figure 1a). However, the overall air quality in Shanghai was not improved. According to the in situ observations, the average air quality index (AQI, Pu et al. [36]) during the lockdown period was 76.96, which was almost identical to the average AQI (76.65) for the same period in 2019–2021. It could be mainly attributed to the increased frequency and intensity of O3 pollution, as shown in Figure 1b. Compared with previous years, the O3 of Shanghai in the lockdown period remained constantly at higher level (Figure 1c). The lowest value of O3 concentration during that period was also significantly higher than that in 2019–2021. According to China’s “Ambient Air Quality Standard” (GB3095-2012), Shanghai underwent 49 O3-exceeding days with a maximum daily 8-h average (MDA8) above level-1 limit (100 μg/m3) and 13 days above level-2 limit (160 μg/m3) during the lockdown period. Exceptionally, there were a few days with low O3 values, e.g., 12–13 April, 25–26 April, and 19–20 May of 2022. Nevertheless, according to the corresponding ERA5 meteorological records, the days with low O3 concentration all experienced rainy weather, during which the formation of atmospheric ozone was greatly impeded by the lack of sunlight (Figure S2) [37]. Chang et al. [38] found that high pressure with predominantly southwesterly winds is most favorable for high O3 productions. As shown in Figure S3a, from April to May every year, Shanghai is dominated by south and southeast winds. During the lockdown period, compared with previous years, no obvious change was observed in wind speed and direction over Shanghai (Figure S3b). Thus, the high concentrations of O3 are mainly caused by the huge change of human activities during lockdown period.
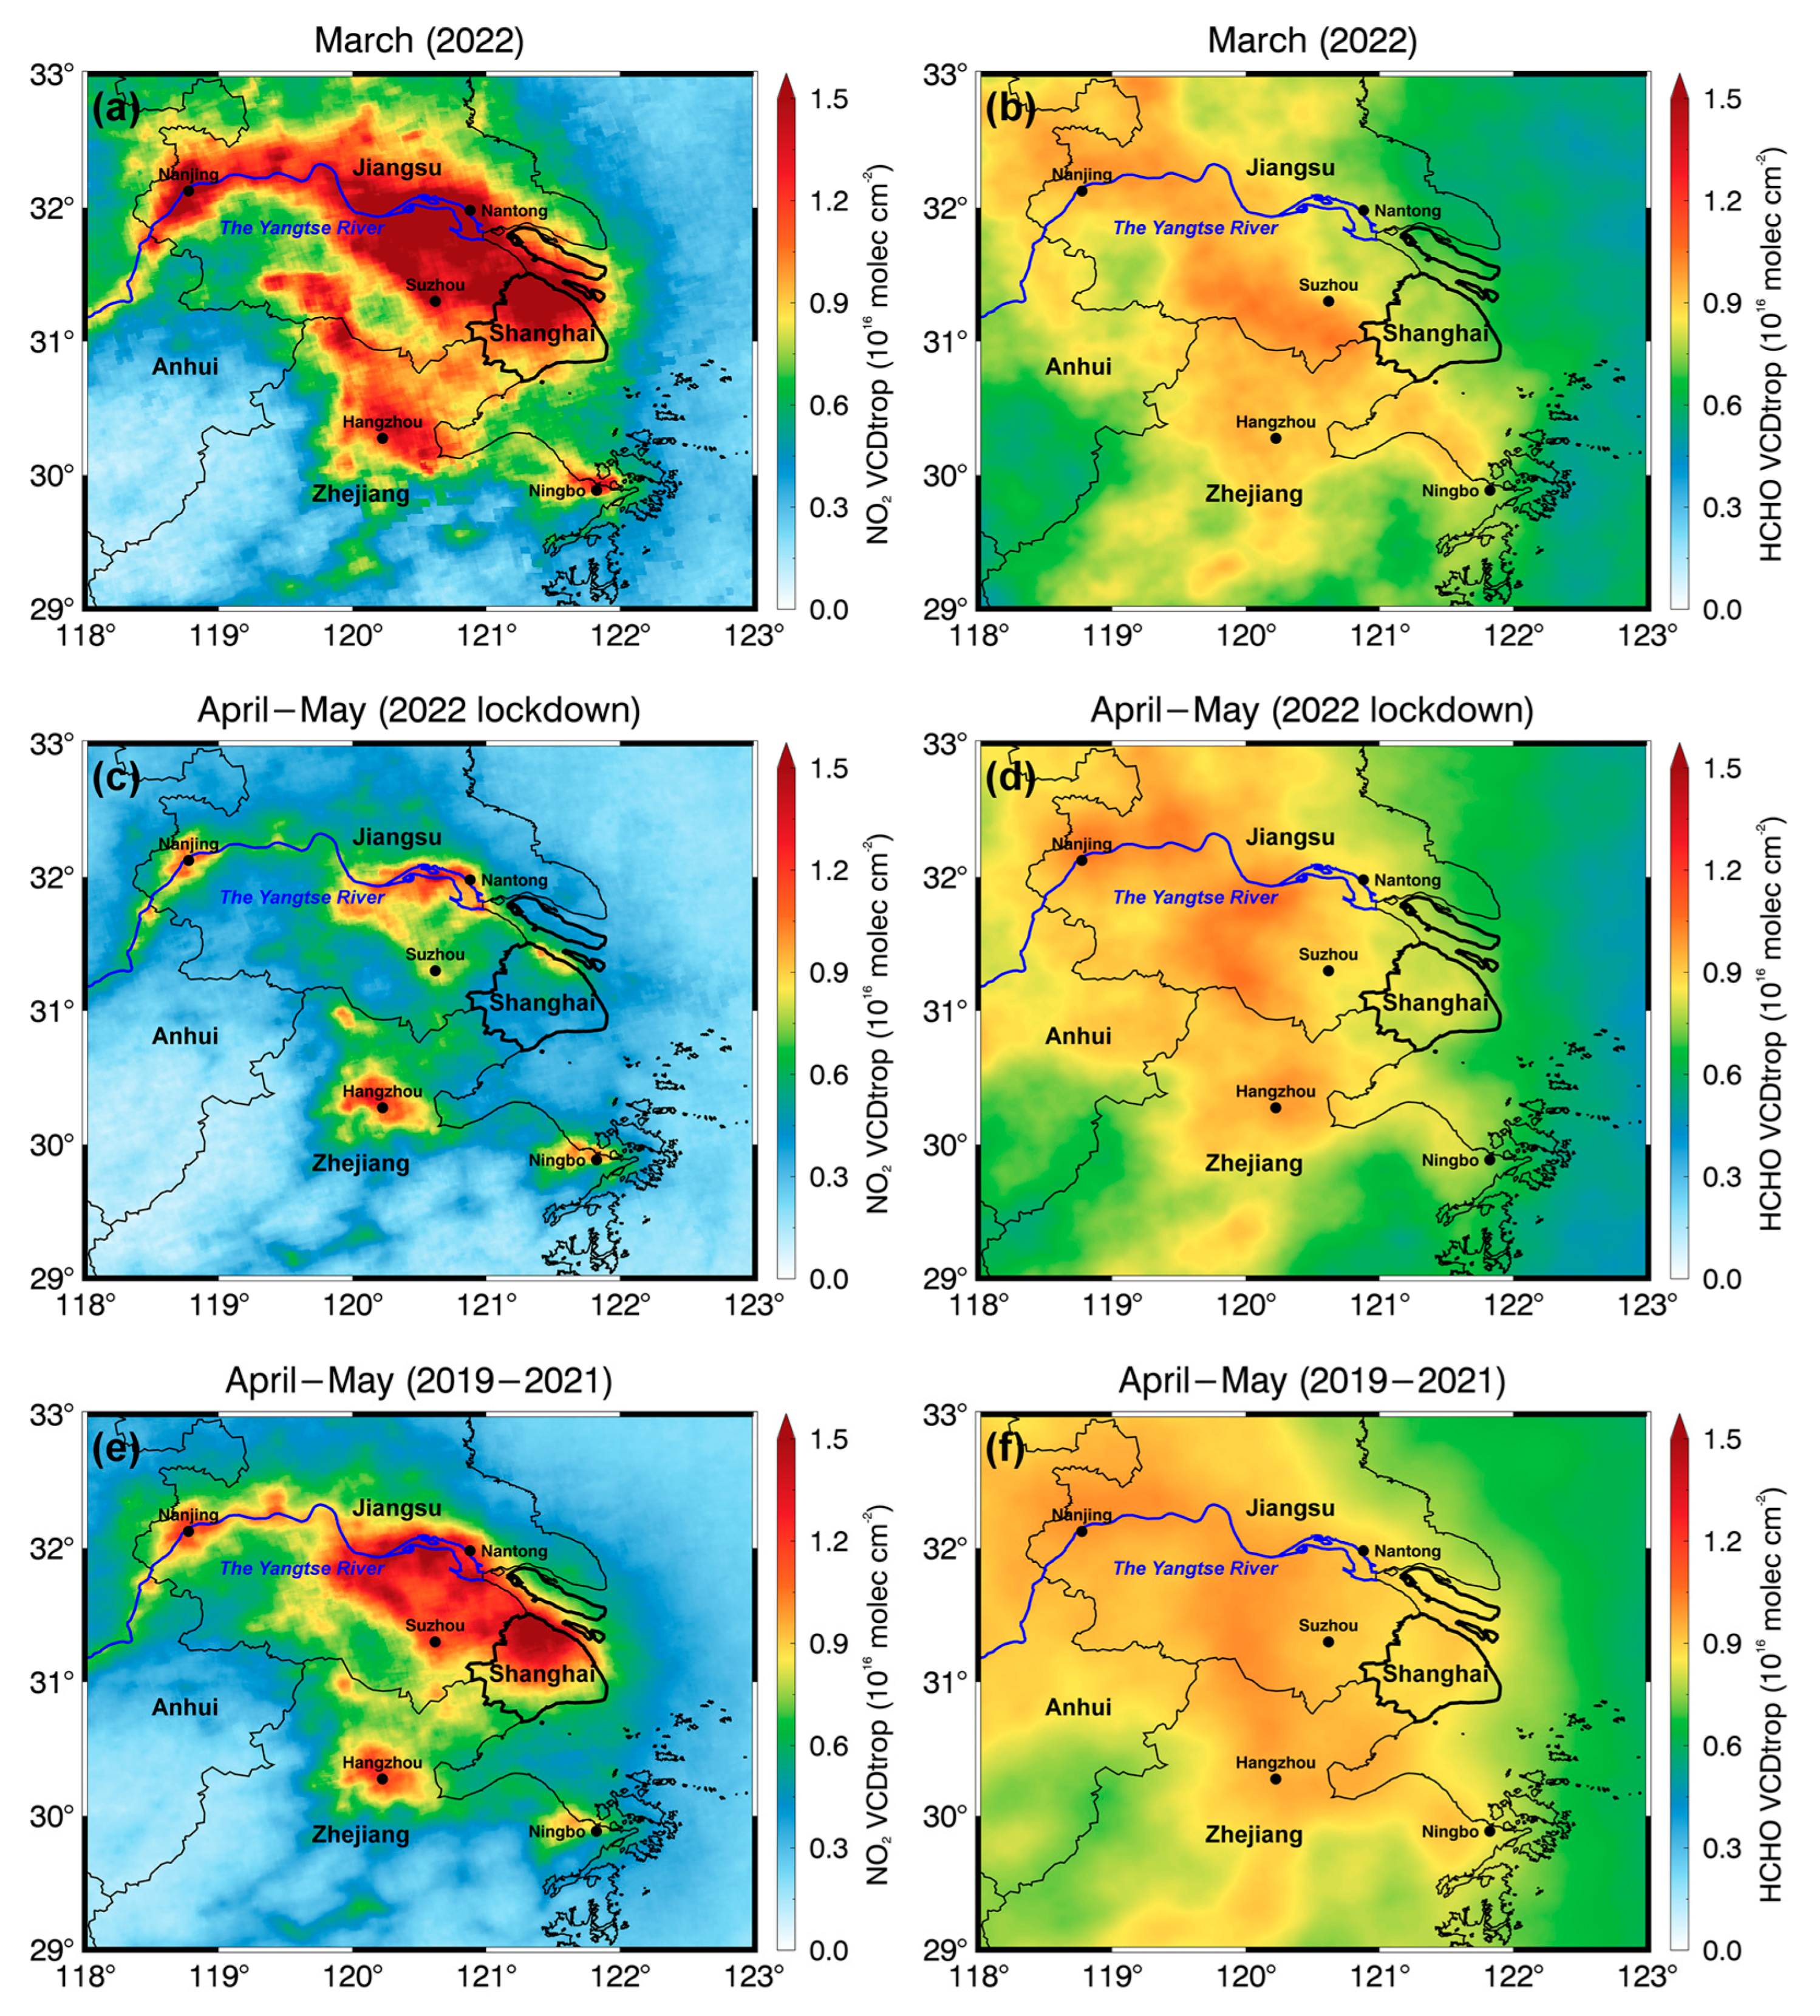
Shown in Figure 2, TROPOMI vividly captured the changes of NO2 and HCHO VCDs in Shanghai and its surrounding areas during the lockdown period. Before the lockdown, the spatial distribution of NO2 VCDs in the YRD region were high in Shanghai and gradually decreased to west part, which is also reported by ground-based measurements [39]. It is noteworthy that the NO2 VCDs in Shanghai during the lockdown period dropped significantly with reductions of 6.72 × 10¹⁵ molec·cm−2 (57.44%) and 5.10 × 10¹⁵ molec·cm−2 (50.59%) compared with the pre-lockdown period and the same period in 2019–2021, respectively. The reduction of NO2 levels of surface concentration and columns in 2022 pandemic was significantly higher than that of the 2020 lockdown (10–40%) in Shanghai [6,40]. Except for the obvious NO2 hotspot observed in the north of Shanghai, NO2 VCDs in other areas of Shanghai decreased with the increasing distance from the northern region [41].
As for the surrounding regions, the reduction of NO2 VCDs in cities of southern Jiangsu, such as Suzhou (54.68%) and Nantong (34.07%), was more obvious than other cities in the YRD region. On the one hand, southern Jiangsu is most adjacent to Shanghai, and is thus greatly affected by NOX emissions from the city. As the NOX sources in Shanghai decreased because of the lockdown, smaller quantity of NOX was emitted and transmitted to Southern Jiangsu during that period. On the other hand, southern Jiangsu has tight economic ties with Shanghai. The shutdown of Shanghai cut down trans-regional economic interactions, which limited the economic activities and anthropogenic emissions in southern Jiangsu to a certain degree. The NO2 VCDs in former hotspots along the Yangtze River decreased significantly, e.g., Nanjing and Nantong, which indicates that the positive impact of the Shanghai lockdown on the air quality was more stretched to the cities located on the Yangtze River Economic Belt given the prevailing south and southeast wind during the lockdown period. On the contrary, some cities in Zhejiang, such as Hangzhou and Ningbo, were less affected, and their NO2 VCDs did not change significantly compared with previous years. The HCHO VCDs in Shanghai dropped only by ~20% during the lockdown period compared with previous years, and no significant changes of HCHO VCDs in other YRD regions were observed. This may imply that the shutdown of Shanghai had little impact on HCHO VCDs in YRD region, and most likely that anthropogenic primary emissions were not dominant in HCHO sources [10].

3.2. Influencing Factors of NO2 and HCHO VCDs

Air pollutants are affected by the combined effect of meteorology and emission [42,43]. Combining ERA5 data and TROPOMI daily observations, this study explored the contribution of meteorology and lockdown to the changes in NO2 and HCHO VCDs over Shanghai. The following multiple regression model was constructed to estimate best-fit parameters [44,45,46]:
Y t = 1 [ l o c k d o w n ] t × k + θ W t + π t + ε
where Yt represents the VCDs of NO2 or HCHO on date t. 1[lockdown]t is a dummy variable which equals one if t is in lockdown period and zero otherwise. The coefficient k captures the impacts of lockdown response on VCDs. The coefficient θ indicates the impacts of meteorological variables on VCDs. Wt are the meteorological variables including U wind, V wind, HWS, W wind, RH, T, and SR. πt denotes the date fixed effect and ε is the intercept.
In this model, all the input variables including meteorological variables and VCDs were averaged by selecting the pollution center of Shanghai (121.455°E, 31.225°N) as the center within the radius of 50 km. In addition, seven-days average was used to reduce the influence of high volatility of daily datasets and week-effect [44]. The comparison between observations and fitting results were displayed in Figure S4. The fitting performances suggested that this model could well explain most temporal variance for both NO2 (R2 = 0.79, p < 0.01) and HCHO (R2 = 0.81, p < 0.01). According to the regression model, the contributions of meteorological and lockdown effects to VCDs changes can be separately estimated by multiplying the fitted parameters with the variable changes.
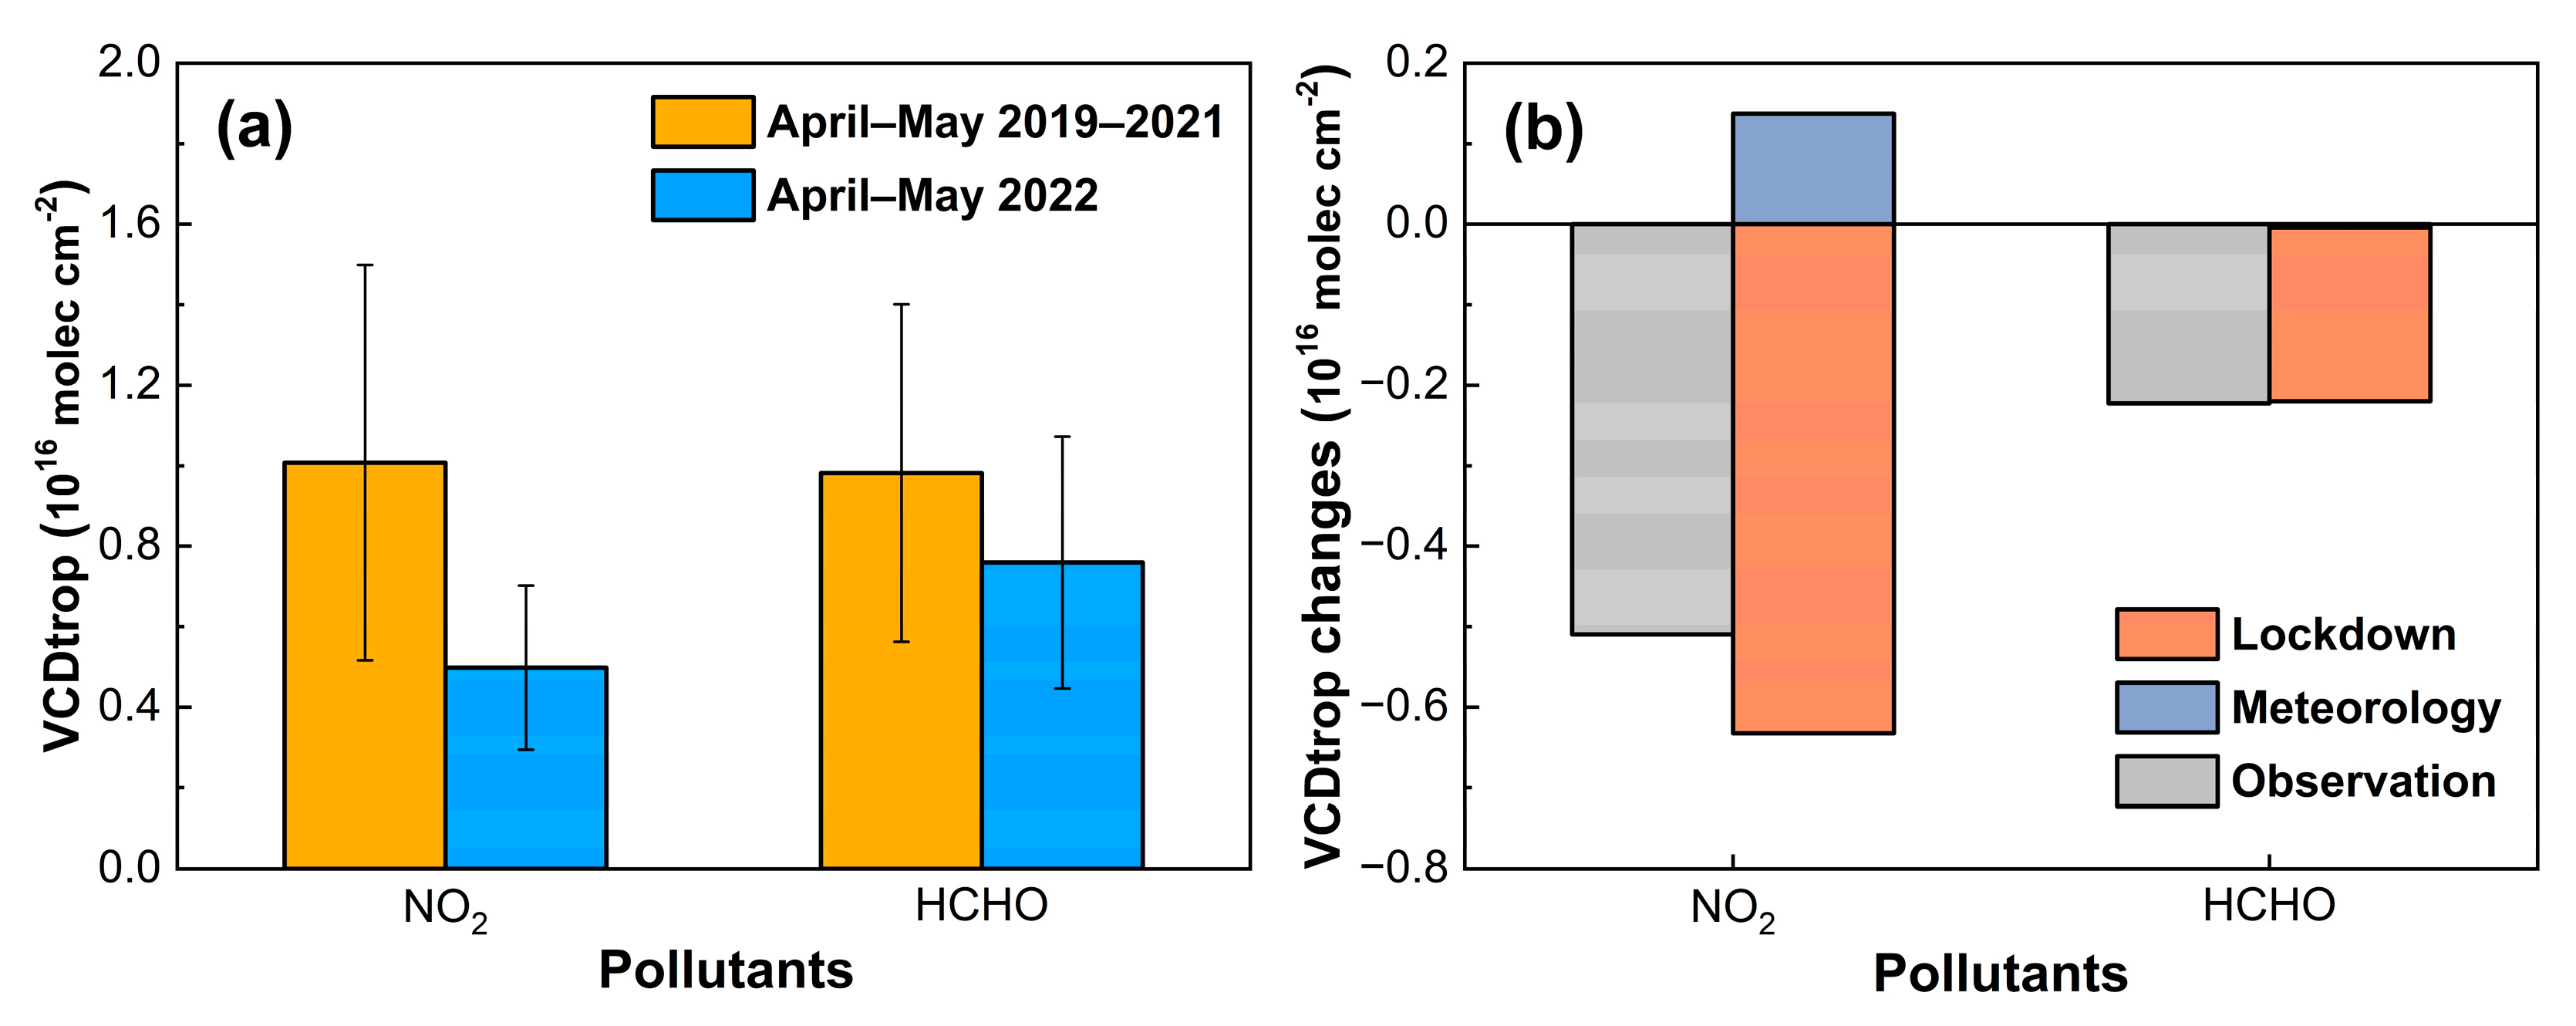
Figure 3a shows that the observed VCDs of NO2 exhibited more obvious decline (~50%) than that of HCHO (~20%), which is consistent with the spatial distribution in Figure 2. The model fitted results (Figure S4) reflected almost the same changes on daily VCDs of NO2 and HCHO compared with observation. Shown in Figure 3b, compared with the same period in 2019–2021, model-based analysis showed that the change of meteorological factors can promote the increase of NO2 VCD with 1.37 × 10¹⁵ molec·cm−2, while a lockdown response led to a sharp drop of 6.33 × 10¹⁵ molec·cm−2. The combined impact of these two factors resulted in a decrease of NO2 VCDs by 4.95 × 10¹⁵ molec·cm−2 interpreted by the model results, which was close to the observed changes of NO2 VCDs (−5.10 × 10¹⁵ molec·cm−2).
As summarized in Tables S1 and S2, the changes of meteorological factors during the lockdown period were mainly reflected in wind speed. HWS showed an obvious drop (~20%), which is responsible for the meteorological effects, and RH, T, and SR fluctuated within 5%. A previous study showed that a higher wind speed accelerates the diffusion of urban NO2, so a lesser wind speed makes it easy for pollutants to accumulate [28]. For HCHO, the effects of various meteorological variables showed an offset against each other, and thus meteorology made little contribution to changes in VCDs. The lockdown response played an important role in the change of HCHO VCDs and led to a decrease of 2.15 × 10¹⁵ molec·cm−2. In conclusion, the effect of lockdown plays a dominant role in the changes of pollutant concentrations over Shanghai rather than the meteorological impacts.

3.3. NOX Emission Reduction and Formaldehyde-to-Nitrogen Dioxide Ratio (FNR)

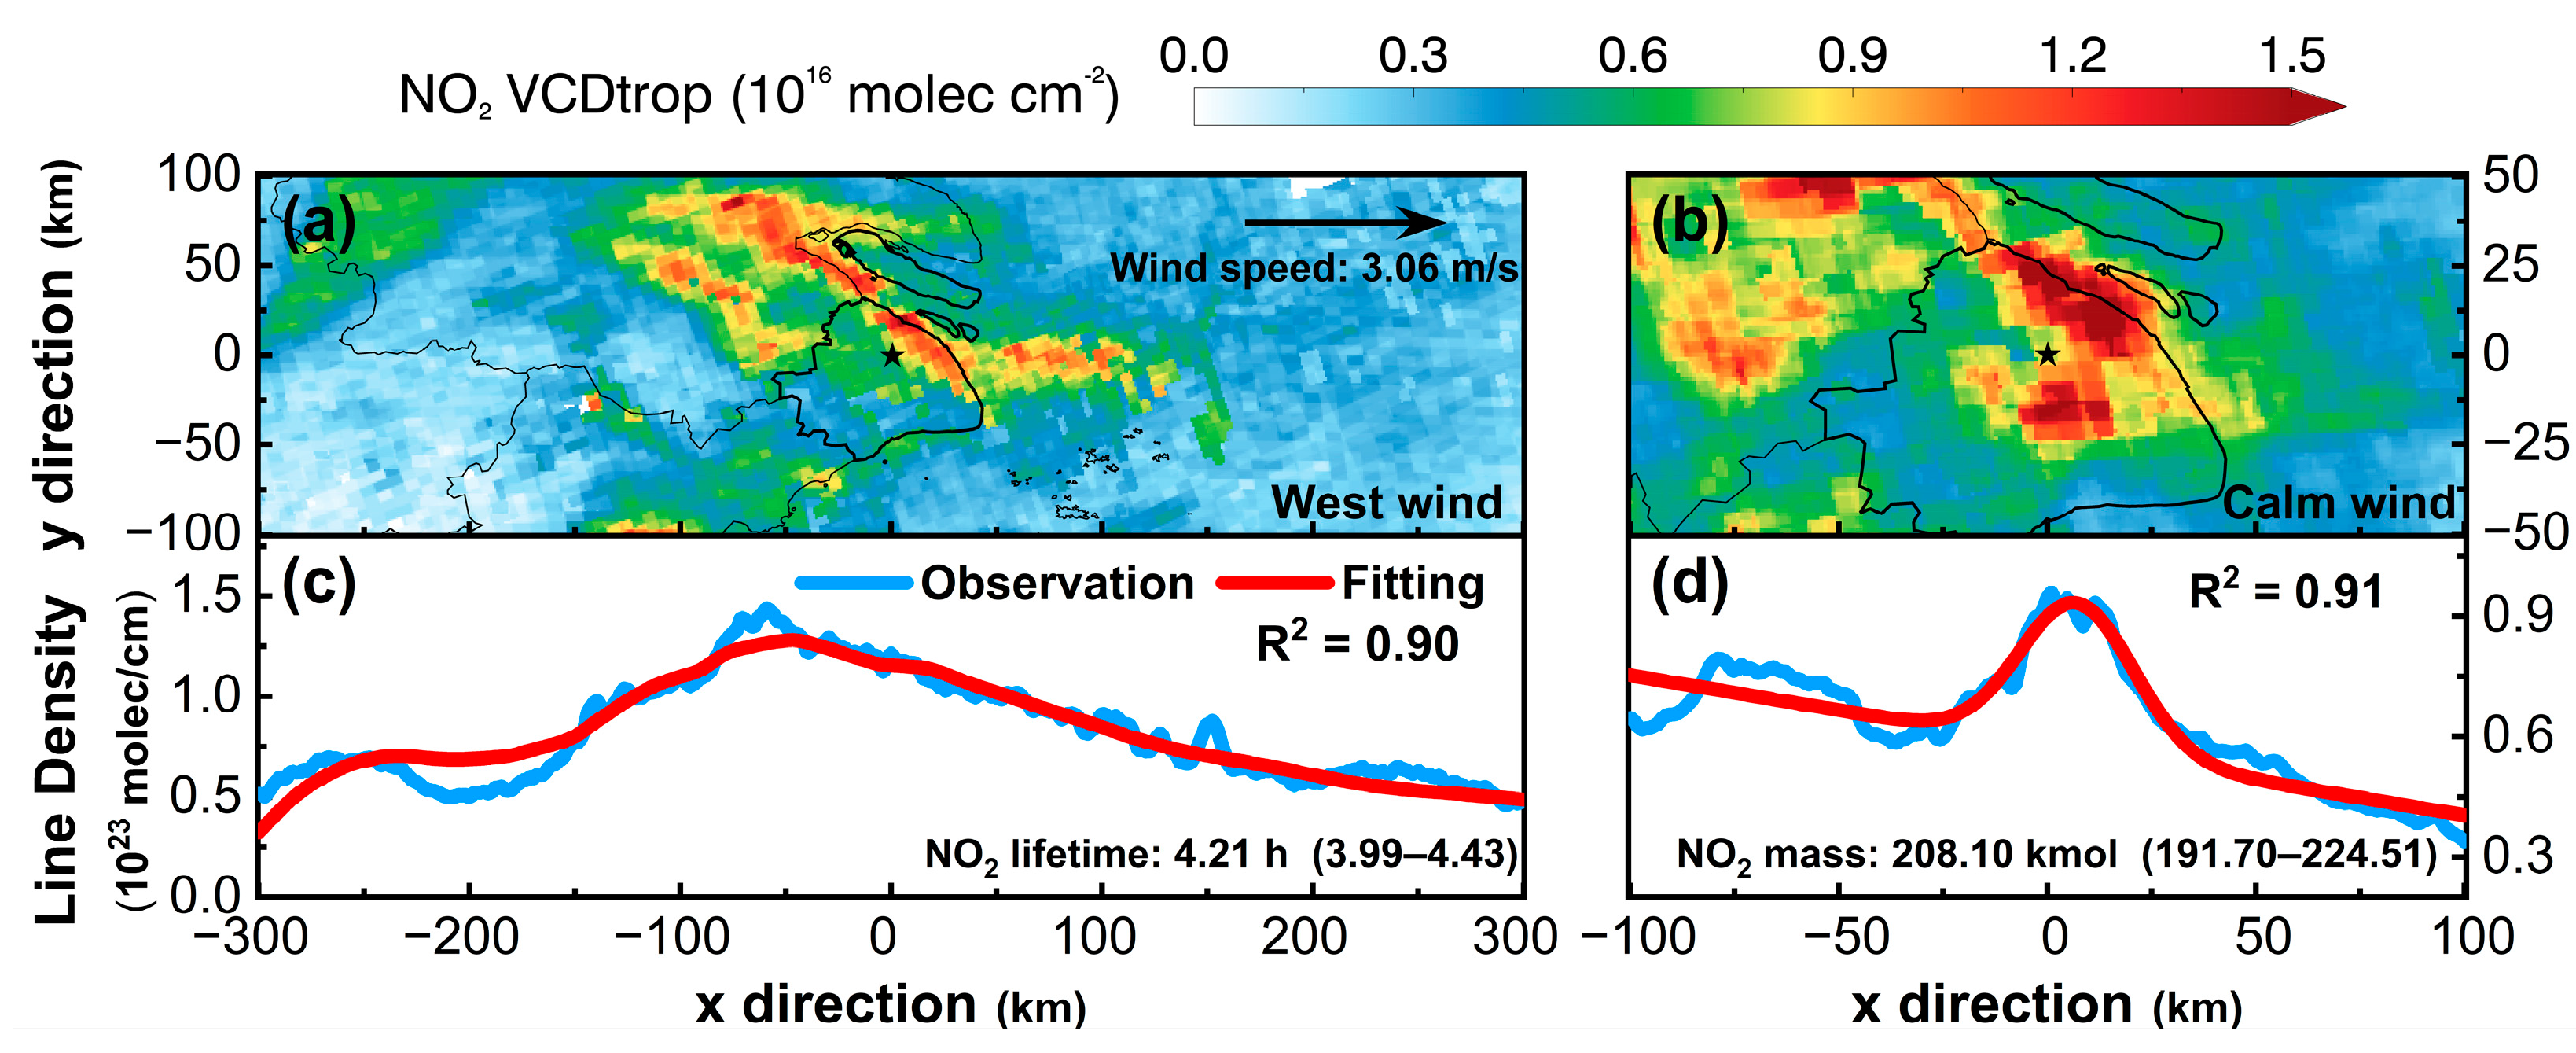
To further quantify the NOX emission reduction during the lockdown period, Shanghai was treated as a “point source” by applying the EMG method. The NO2 plume was classified into nine types according to the wind speed and direction (Figures S5 and S8). The NO2 distribution under windy conditions was fitted to obtain the NO2 lifetime as Equation (1), otherwise it was fitted to obtain the NO2 mass as Equation (3). Figure 4 provides an example to estimate Shanghai NOX emissions during the lockdown period under west wind condition. As shown in Figure 4a, the NO2 line density were integrals along the y-axis ± 100 km about the x-axis. A nonlinear least-squares was performed to fit the observed line density in Figure 4c. Then the NO2 lifetime was derived as 4.21 h with 95% confidence interval (CI) of ±0.22 h. For mass fitting, the integration interval was along the y-axis ± 50 km in Figure 4b, and NO2 mass was fitted as 208.10 kmol with CI of ±16.1 kmol. Then the NOX emission was computed to be 13.73 mol/s, and the estimations under another wind direction were similar with the above (Figures S5–S7 and Table S3). For the accuracy of the estimation, only fitting results with R2 > 0.8 and 95% CI of lifetime in 1–10 h were further discussed, and averaged results were calculated by introducing the weight of the observation days.
During the lockdown period, the NO2 lifetime changed from 3.07 h to 3.33 h, and the averaged Shanghai NOX emission fell to 32.60 mol/s. Compared with the same period in 2019–2021 (Figures S8–S10 and Table S3), the emission decreased by 81.53%. However, the influence of the adjacent NOX source cannot be completely excluded when using EMG method to calculate NO2 mass, which introduced contributions of NOX emission reductions in adjacent regions in the integration intervals, e.g., Suzhou. By summing NO2 mass based on Shanghai administrative boundaries, NOX emission reduction rate was estimated as 51.72%, which may be underestimated due to the incomplete coverage of NO2 plume (Table S4). Thus, it can be inferred that the NOX emissions over Shanghai decreased about 50–80% during the epidemic in 2022, and the reduction was higher than that of the 2020 lockdown, during which the NOX emissions of Shanghai was estimated to be a ~40% decrease based on the satellite observation and model simulation [47,48]. According to the NOX mass integration intervals, we summed up the NOx emissions of MEIC inventory by selecting the pollution centre of Shanghai as the centre within the radius of 50 km (Figure S11). The bottom-up results indicated that the transportation and industrial sectors account for more than 80% of NOX anthropogenic sources in Shanghai. Considering the implementation of strict lockdown measures, the sharp decline of NOX emissions can be attributed mainly to the transportation sector and industrial sectors in considerable extent [47,48].
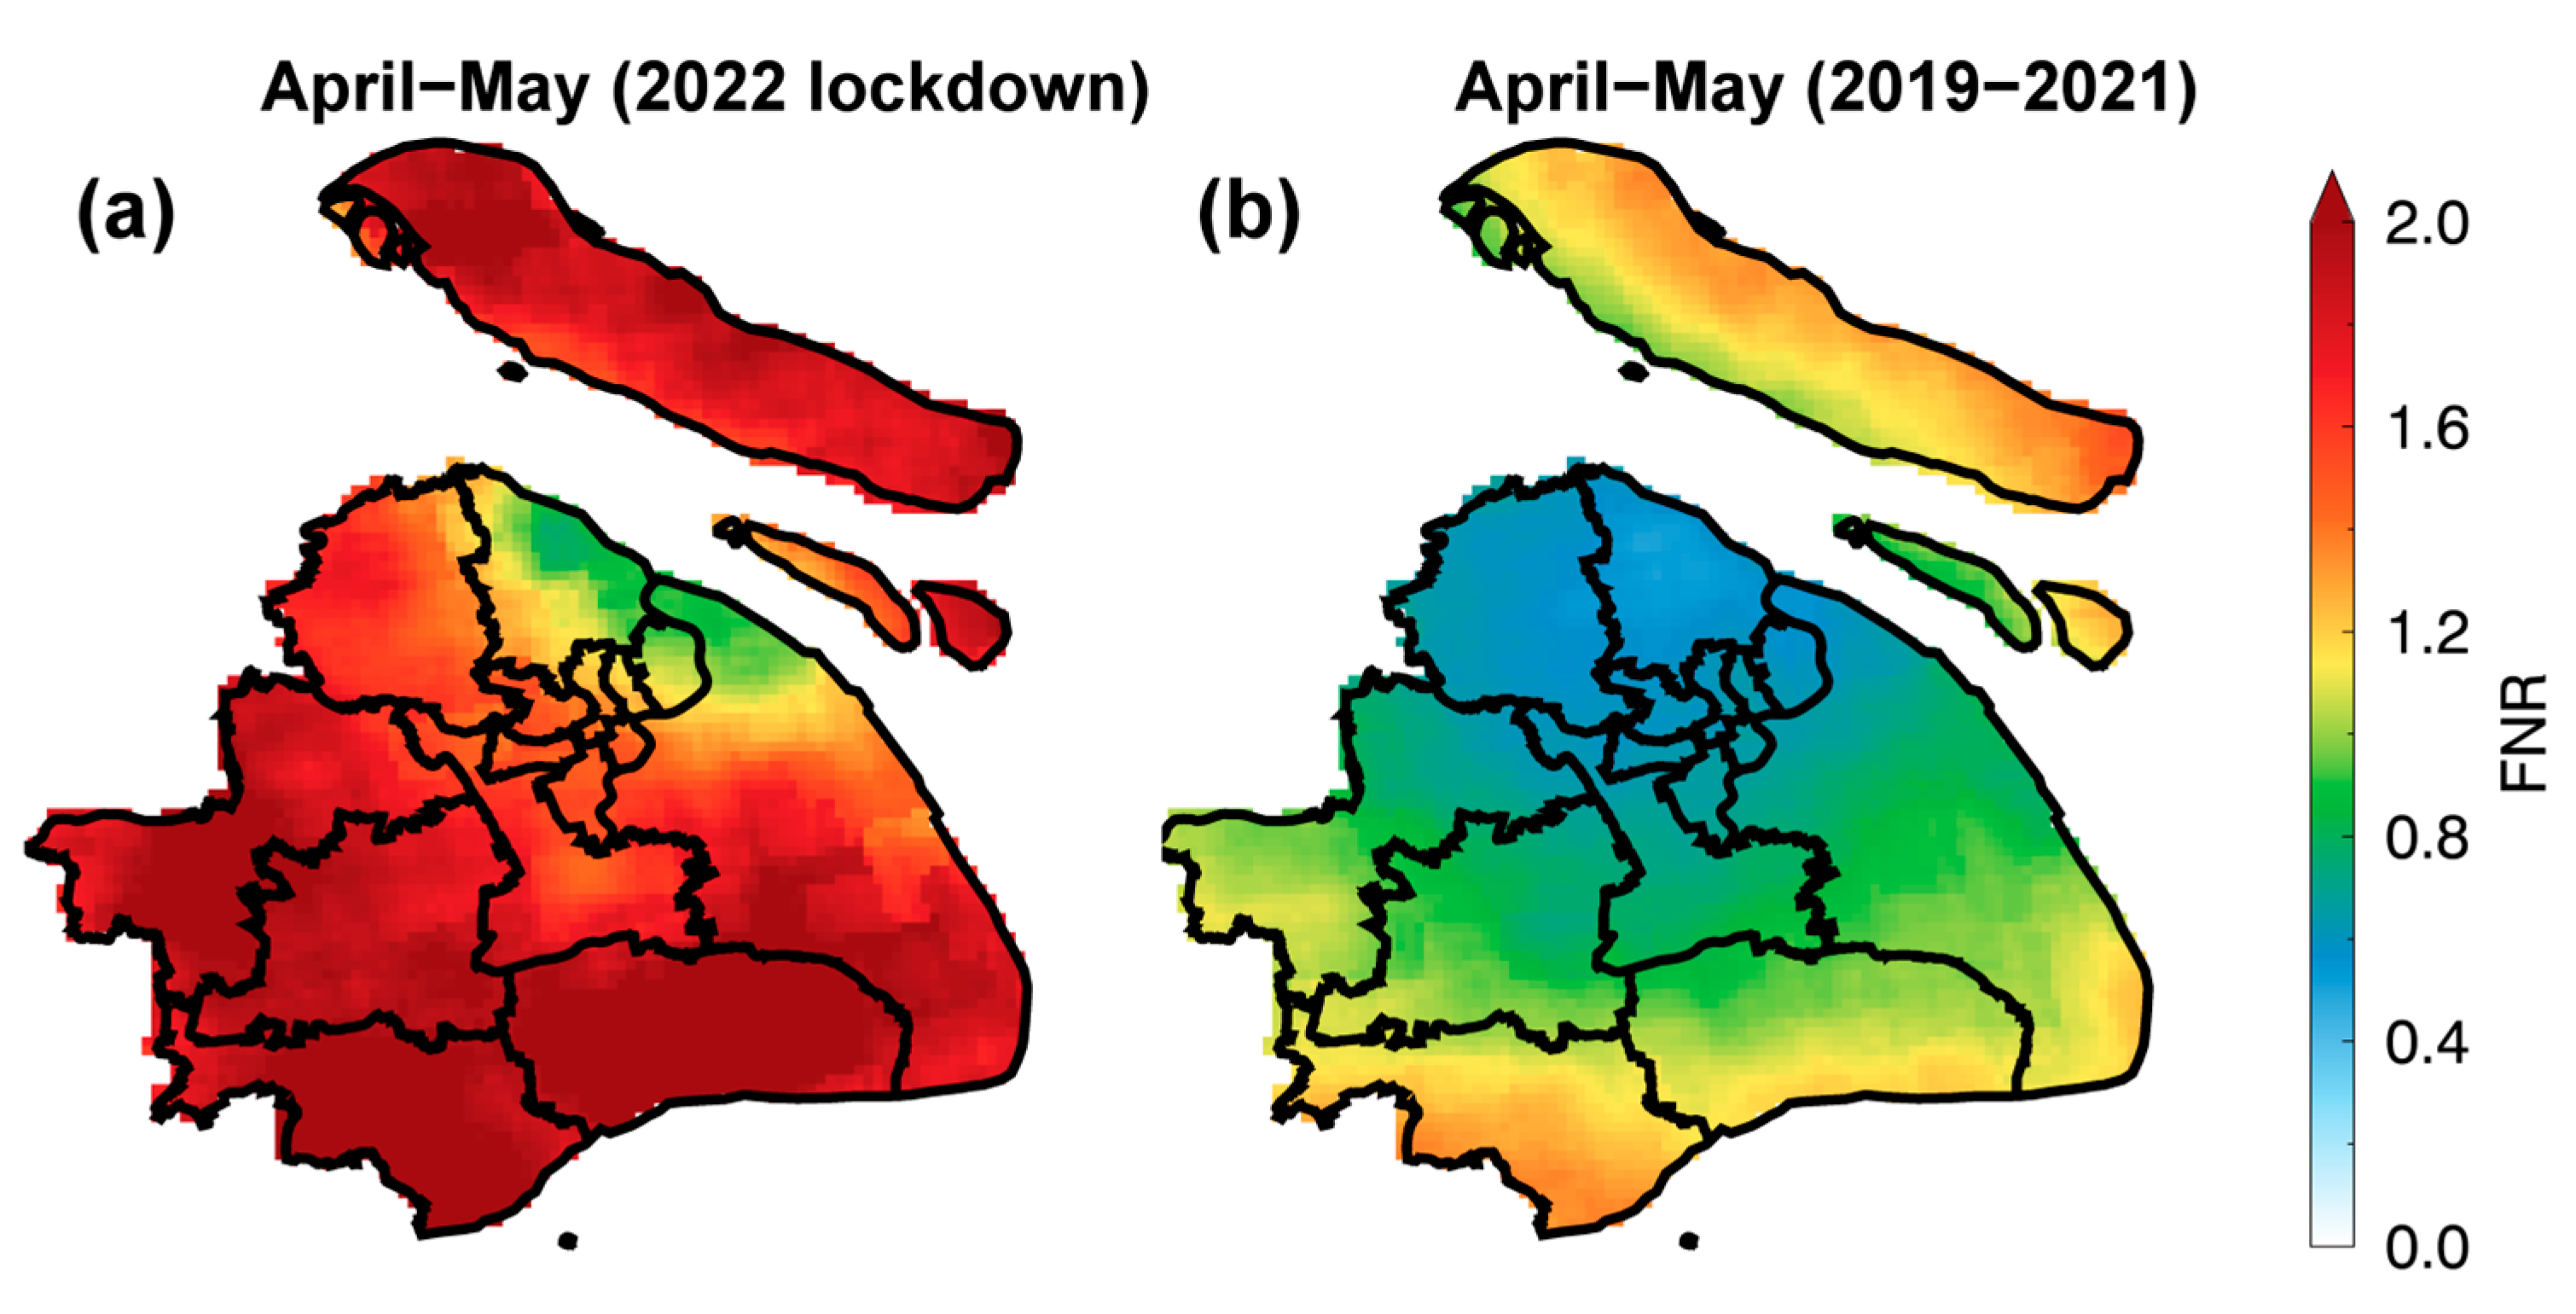
Due to the significant reduction in NOX emissions, there will be noticeable impacts on both the source and sink of O3. The relative changes of VOCs and NOX caused transformation of the O3 formation regime, which can be reflected by the FNR [10,49,50]. As shown in Figure 5, the FNR from TROPOMI observation was employed to identify the O3 formation regime in different periods. Before the lockdown, the areas with low FNR were mainly located in urban areas, which was consistent with previous studies [10,51]. During the lockdown period, since the sharp decline of NOX emission, NO2 VCDs were significantly lower than HCHO VCDs. The O3 formation regime in most areas of Shanghai was NOX-limited (FNR > 2) or transitional regime (1 < FNR < 2), according to the criteria from Duncan et al. [11]. However, the average FNR distribution in previous years showed that central and northern parts of Shanghai were in the VOC-limited regime (FNR < 1). Although the FNR thresholds for different sensitive regimes remain to be discussed, it is obvious that the O3 formation trend in the lockdown period moved toward a NOX-limited or transitional regime [52]. Previous studies have shown similar results that increased O3 with decreasing NO2 in most parts of eastern China during COVID-19 lockdown in 2020, suggesting the predominance of a VOC-limited regime before the lockdown, which is consistent with the conclusion of this study [13,43]. Due to the dramatic reduction of NOX emissions during lockdown, it may lead to the increases of hydroxyl radicals (OH) concentration and further promote the reaction of VOCs and OH to form secondary pollutants including O3 [53,54]. In terms of sink, the reductions of NO weakened the titration effect on O3, causing the accumulation of O3. Thus, the reduced NOx emissions should be responsible for the increased O3 in Shanghai during this lockdown period.

4. Conclusions

During the 2022 lockdown period, the ground concentrations of NO2, PM2.5, and PM10 over Shanghai decreased sharply, while that of O3 displayed more continuous high values. Based on TROPOMI observation, the VCDs of NO2 and HCHO, which are important precursors of O3, decreased by ~50% and ~20% in Shanghai compared with the same period in 2019–2021. The averaged NOX emissions in Shanghai during the lockdown period was estimated at 32.60 mol/s. It represented a reduction of 50–80%, which was mainly contributed by the emission reduction of the transportation and industrial sectors. Due to the sharp decline in NOX emissions, NO2 VCDs were significantly lower than that of HCHO, which led to the shift of the Shanghai O3 formation regime (from VOC-limited to NOX-limited and transitional) and the reduction of NO titration. In this way, our study confirmed that reduced NOX emissions should be responsible for the increased frequency of O3 pollution. When enforcing regulation on NOX emission control, special attention should be paid to the reduction of VOCs emission in the central and northern parts of Shanghai, so as to avoid the aggravation of urban O3 pollution.

Supplementary Materials

The following supporting information can be downloaded at: https://www.mdpi.com/article/10.3390/rs14246344/s1, Figure S1: Location of the YRD (light brown area) and the research area of this study in YRD region (Latitude: 29°N to 33°N; Longitude: 118°E to 123°E); Figure S2: Time series of MDA 8 O3 concentration and precipitation over Shanghai during the 2022 lockdown period. Figure S3: Shanghai wind rose map during (a) the lockdown period and (b) the same period in previous years; Figure S4: Comparison between observations and regression model results regarding daily (a) NO2 and (b) HCHO VCDs in April–May from 2019 to 2022; Figure S5: The distribution of NO2 VCD over Shanghai under different wind direction during 2022 lockdown period; Figure S6: The NO2 lifetime fit result of Shanghai under different wind directions during 2022 lockdown period; Figure S7: The NO2 mass fit result of Shanghai under calm wind during 2022 lockdown period; Figure S8: The distribution of NO2 VCD over Shanghai under different wind directions during the same period (April to May) from 2019–2021; Figure S9: The NO2 lifetime fit result of Shanghai under different wind directions during the same period (April to May) from 2019–2021; Figure S10: The NO2 mass fit result of Shanghai under calm wind during the same period (April to May) from 2019–2021; Figure S11: The (a) spatial distribution of NOX emission in YRD region and (b) NOX emission by sectors within the radius of 50 km of Shanghai pollution center (indicated by star in (a)) during April to May 2019, emission data available from MEIC; Table S1: The observations and fitting parameters of each variable in the regression model for NO2; Table S2: The observations and fitting parameters of each variable in the regression model for HCHO; Table S3: The quality flags of EMG method application and the estimated NOX emission under different wind directions; Table S4: The estimations of NOX emission reduction rate with different NO2 mass scopes calculations.

Author Contributions

Conceptualization, R.X. and S.W.; methodology, R.X. and S.Z.; software, R.X.; validation, R.X. and S.Z.; formal analysis, R.X. and J.Z. (Jian Zhu); investigation, C.G.; resources, R.X. and S.W.; data curation, R.X. and S.W.; writing—original draft preparation, R.X.; writing—review and editing, S.W. and J.Z. (Jingfang Zhan); visualization, R.X.; supervision, S.W. and B.Z.; project administration, S.W. and B.Z.; funding acquisition, S.W. and B.Z. All authors have read and agreed to the published version of the manuscript.

Funding

This research was funded by National Natural Science Foundation of China (21976031, 42075097, 22176037).

Data Availability Statement

TROPOMI NO2 and HCHO level-2 data can be freely downloaded from NASA’s Goddard Earth Sciences Data and Information Services Center website (https://disc.gsfc.nasa.gov/datasets/S5P_L2__NO2____1/summary; https://disc.gsfc.nasa.gov/datasets/S5P_L2__NO2____HiR_1/summary; https://disc.gsfc.nasa.gov/datasets/S5P_L2__NO2____HiR_2/summary; https://disc.gsfc.nasa.gov/datasets/S5P_L2__HCHO___1/summary; https://disc.gsfc.nasa.gov/datasets/S5P_L2__HCHO___HiR_1/summary; https://disc.gsfc.nasa.gov/datasets/S5P_L2__HCHO___HiR_2/summary, accessed on 10 December 2022). The meteorological data from the ERA5 reanalysis can be freely downloaded from the Copernicus Climate Change (C3S) climate data store (https://doi.org/10.24381/cds.bd0915c6; https://doi.org/10.24381/cds.adbb2d47, accessed on 10 December 2022).

Acknowledgments

We acknowledge the free use of TROPOMI NO2 product from Tropospheric Emission Monitoring Internet Service (TEMIS) hosted by The Royal Netherlands Meteorological Institute (KNMI). We thank the (European Centre for Medium-Range Weather Forecasts) ECMWF for providing ERA5 wind field. We also thank the Centre for Earth System Science, Tsinghua University for MEIC data.

Conflicts of Interest

The authors declare no conflict of interest.

References

  1. Wang, T.; Xue, L.; Brimblecombe, P.; Lam, Y.F.; Li, L.; Zhang, L. Ozone pollution in China: A review of concentrations, meteorological influences, chemical precursors, and effects. Sci. Total Environ. 2017, 575, 1582–1596. [Google Scholar] [CrossRef] [PubMed]
  2. Booker, F.; Muntifering, R.; McGrath, M.; Burkey, K.; Decoteau, D.; Fiscus, E.; Manning, W.; Krupa, S.; Chappelka, A.; Grantz, D. The Ozone Component of Global Change: Potential Effects on Agricultural and Horticultural Plant Yield, Product Quality and Interactions with Invasive Species. J. Integr. Plant Biol. 2009, 51, 337–351. [Google Scholar] [CrossRef] [PubMed]
  3. Holm, S.M.; Balmes, J.R. Systematic Review of Ozone Effects on Human Lung Function, 2013 through 2020. Chest 2022, 161, 190–201. [Google Scholar] [CrossRef]
  4. Li, K.; Jacob, D.J.; Liao, H.; Qiu, Y.; Shen, L.; Zhai, S.; Bates, K.H.; Sulprizio, M.P.; Song, S.; Lu, X.; et al. Ozone pollution in the North China Plain spreading into the late-winter haze season. Proc. Natl. Acad. Sci. USA 2021, 118, e2015797118. [Google Scholar] [CrossRef]
  5. Kang, M.; Zhang, J.; Zhang, H.; Ying, Q. On the Relevancy of Observed Ozone Increase during COVID-19 Lockdown to Summertime Ozone and PM2.5 Control Policies in China. Environ. Sci. Technol. Lett. 2021, 8, 289–294. [Google Scholar] [CrossRef]
  6. Bauwens, M.; Compernolle, S.; Stavrakou, T.; Müller, J.-F.; van Gent, J.; Eskes, H.; Levelt, P.F.; van der A, R.; Veefkind, J.P.; Vlietinck, J.; et al. Impact of Coronavirus Outbreak on NO2 Pollution Assessed Using TROPOMI and OMI Observations. Geophys. Res. Lett. 2020, 47, e2020GL087978. [Google Scholar] [CrossRef]
  7. Alvarado, L.M.A.; Richter, A.; Vrekoussis, M.; Hilboll, A.; Kalisz Hedegaard, A.B.; Schneising, O.; Burrows, J.P. Unexpected long-range transport of glyoxal and formaldehyde observed from the Copernicus Sentinel-5 Precursor satellite during the 2018 Canadian wildfires. Atmos. Chem. Phys. 2020, 20, 2057–2072. [Google Scholar] [CrossRef] [Green Version]
  8. Atkinson, R. Atmospheric chemistry of VOCs and NOx. Atmos. Environ. 2000, 34, 2063–2101. [Google Scholar] [CrossRef]
  9. Chan, K.L.; Wang, Z.; Ding, A.; Heue, K.-P.; Shen, Y.; Wang, J.; Zhang, F.; Shi, Y.; Hao, N.; Wenig, M. MAX-DOAS measurements of tropospheric NO2 and HCHO in Nanjing and a comparison to ozone monitoring instrument observations. Atmos. Chem. Phys. 2019, 19, 10051–10071. [Google Scholar] [CrossRef] [Green Version]
  10. Li, D.; Wang, S.; Xue, R.; Zhu, J.; Zhang, S.; Sun, Z.; Zhou, B. OMI-observed HCHO in Shanghai, China, during 2010–2019 and ozone sensitivity inferred by an improved HCHO/NO2 ratio. Atmos. Chem. Phys. 2021, 21, 15447–15460. [Google Scholar] [CrossRef]
  11. Duncan, B.N.; Yoshida, Y.; Olson, J.R.; Sillman, S.; Martin, R.V.; Lamsal, L.; Hu, Y.; Pickering, K.E.; Retscher, C.; Allen, D.J.; et al. Application of OMI observations to a space-based indicator of NOX and VOC controls on surface ozone formation. Atmos. Environ. 2010, 44, 2213–2223. [Google Scholar] [CrossRef] [Green Version]
  12. Zhu, J.; Chen, L.; Liao, H.; Yang, H.; Yang, Y.; Yue, X. Enhanced PM2.5 Decreases and O3 Increases in China During COVID-19 Lockdown by Aerosol-Radiation Feedback. Geophys. Res. Lett. 2021, 48, e2020GL090260. [Google Scholar] [CrossRef] [PubMed]
  13. Miyazaki, K.; Bowman, K.; Sekiya, T.; Jiang, Z.; Chen, X.; Eskes, H.; Ru, M.; Zhang, Y.; Shindell, D. Air Quality Response in China Linked to the 2019 Novel Coronavirus (COVID-19) Lockdown. Geophys. Res. Lett. 2020, 47, e2020GL089252. [Google Scholar] [CrossRef] [PubMed]
  14. Ding, J.; van der A, R.J.; Mijling, B.; Levelt, P.F.; Hao, N. NOX emission estimates during the 2014 Youth Olympic Games in Nanjing. Atmos. Chem. Phys. 2015, 15, 9399–9412. [Google Scholar] [CrossRef] [Green Version]
  15. Hao, N.; Valks, P.; Loyola, D.; Cheng, Y.F.; Zimmer, W. Space-based measurements of air quality during the World Expo 2010 in Shanghai. Environ. Res. Lett. 2011, 6, 044004. [Google Scholar] [CrossRef] [Green Version]
  16. Ma, X.; Li, C.; Dong, X.; Liao, H. Empirical analysis on the effectiveness of air quality control measures during mega events: Evidence from Beijing, China. J. Clean. Prod. 2020, 271, 122536. [Google Scholar] [CrossRef]
  17. Tanvir, A.; Javed, Z.; Jian, Z.; Zhang, S.; Bilal, M.; Xue, R.; Wang, S.; Bin, Z. Ground-Based MAX-DOAS Observations of Tropospheric NO2 and HCHO During COVID-19 Lockdown and Spring Festival Over Shanghai, China. Remote Sens. 2021, 13, 488. [Google Scholar] [CrossRef]
  18. van der A, R.J.; Mijling, B.; Ding, J.; Koukouli, M.E.; Liu, F.; Li, Q.; Mao, H.; Theys, N. Cleaning up the air: Effectiveness of air quality policy for SO2 and NOx emissions in China. Atmos. Chem. Phys. 2017, 17, 1775–1789. [Google Scholar] [CrossRef] [Green Version]
  19. Krotkov, N.A.; McLinden, C.A.; Li, C.; Lamsal, L.N.; Celarier, E.A.; Marchenko, S.V.; Swartz, W.H.; Bucsela, E.J.; Joiner, J.; Duncan, B.N. Aura OMI observations of regional SO2 and NO2 pollution changes from 2005 to 2015. Atmos. Chem. Phys. 2016, 16, 4605–4629. [Google Scholar] [CrossRef] [Green Version]
  20. Chen, Z.; Hao, X.; Zhang, X.; Chen, F. Have traffic restrictions improved air quality? A shock from COVID-19. J. Clean. Prod. 2021, 279, 123622. [Google Scholar] [CrossRef]
  21. Chinazzi, M.; Davis, J.T.; Ajelli, M.; Gioannini, C.; Litvinova, M.; Merler, S.; Piontti, A.P.y.; Mu, K.; Rossi, L.; Sun, K.; et al. The effect of travel restrictions on the spread of the 2019 novel coronavirus (COVID-19) outbreak. Science 2020, 368, 395–400. [Google Scholar] [CrossRef] [PubMed] [Green Version]
  22. Zheng, B.; Zhang, Q.; Geng, G.; Chen, C.; Shi, Q.; Cui, M.; Lei, Y.; He, K. Changes in China’s anthropogenic emissions and air quality during the COVID-19 pandemic in 2020. Earth Syst. Sci. Data 2021, 13, 2895–2907. [Google Scholar] [CrossRef]
  23. Liu, T.; Wang, X.; Hu, J.; Wang, Q.; An, J.; Gong, K.; Sun, J.; Li, L.; Qin, M.; Li, J.; et al. Driving Forces of Changes in Air Quality during the COVID-19 Lockdown Period in the Yangtze River Delta Region, China. Environ. Sci. Technol. Lett. 2020, 7, 779–786. [Google Scholar] [CrossRef]
  24. Fan, H.; Wang, Y.; Zhao, C.; Yang, Y.; Yang, X.; Sun, Y.; Jiang, S. The Role of Primary Emission and Transboundary Transport in the Air Quality Changes During and After the COVID-19 Lockdown in China. Geophys. Res. Lett. 2021, 48, e2020GL091065. [Google Scholar] [CrossRef] [PubMed]
  25. Cheng, J. Analyzing the factors influencing the choice of the government on leasing different types of land uses: Evidence from Shanghai of China. Land Use Policy 2020, 90, 104303. [Google Scholar] [CrossRef]
  26. Deng, N.; Liu, J.; Dai, Y.; Li, H. Different cultures, different photos: A comparison of Shanghai’s pictorial destination image between East and West. Tour. Manag. Perspect. 2019, 30, 182–192. [Google Scholar] [CrossRef]
  27. Veefkind, J.P.; Aben, I.; McMullan, K.; Forster, H.; de Vries, J.; Otter, G.; Claas, J.; Eskes, H.J.; de Haan, J.F.; Kleipool, Q.; et al. TROPOMI on the ESA Sentinel-5 Precursor: A GMES mission for global observations of the atmospheric composition for climate, air quality and ozone layer applications. Remote Sens. Environ. 2012, 120, 70–83. [Google Scholar] [CrossRef]
  28. Goldberg, D.L.; Anenberg, S.C.; Griffin, D.; McLinden, C.A.; Lu, Z.; Streets, D.G. Disentangling the Impact of the COVID-19 Lockdowns on Urban NO2 From Natural Variability. Geophys. Res. Lett. 2020, 47, e2020GL089269. [Google Scholar] [CrossRef]
  29. Xue, R.; Wang, S.; Zhang, S.; He, S.; Liu, J.; Tanvir, A.; Zhou, B. Estimating city NOX emissions from TROPOMI high spatial resolution observations—A case study on Yangtze River Delta, China. Urban Clim. 2022, 43, 101150. [Google Scholar] [CrossRef]
  30. Fioletov, V.E.; McLinden, C.A.; Krotkov, N.; Moran, M.D.; Yang, K. Estimation of SO2 emissions using OMI retrievals. Geophys. Res. Lett. 2011, 38, L21811. [Google Scholar] [CrossRef]
  31. Beirle, S.; Boersma, K.F.; Platt, U.; Lawrence, M.G.; Wagner, T. Megacity emissions and lifetimes of nitrogen oxides probed from space. Science 2011, 333, 1737–1739. [Google Scholar] [CrossRef] [PubMed]
  32. Liu, F.; Beirle, S.; Zhang, Q.; Dörner, S.; He, K.; Wagner, T. NOx lifetimes and emissions of cities and power plants in polluted background estimated by satellite observations. Atmos. Chem. Phys. 2016, 16, 5283–5298. [Google Scholar] [CrossRef] [Green Version]
  33. Hersbach, H.; Bell, B.; Berrisford, P.; Hirahara, S.; Horányi, A.; Muñoz-Sabater, J.; Nicolas, J.; Peubey, C.; Radu, R.; Schepers, D.; et al. The ERA5 global reanalysis. Q. J. R. Meteorol. Soc. 2020, 146, 1999–2049. [Google Scholar] [CrossRef]
  34. Hoffmann, L.; Günther, G.; Li, D.; Stein, O.; Wu, X.; Griessbach, S.; Heng, Y.; Konopka, P.; Müller, R.; Vogel, B.; et al. From ERA-Interim to ERA5: The considerable impact of ECMWF’s next-generation reanalysis on Lagrangian transport simulations. Atmos. Chem. Phys. 2019, 19, 3097–3124. [Google Scholar] [CrossRef] [Green Version]
  35. Zheng, B.; Tong, D.; Li, M.; Liu, F.; Hong, C.; Geng, G.; Li, H.; Li, X.; Peng, L.; Qi, J. Trends in China’s anthropogenic emissions since 2010 as the consequence of clean air actions. Atmos. Chem. Phys. 2018, 18, 14095–14111. [Google Scholar] [CrossRef] [Green Version]
  36. Pu, H.; Luo, K.; Wang, P.; Wang, S.; Kang, S. Spatial variation of air quality index and urban driving factors linkages: Evidence from Chinese cities. Environ. Sci. Pollut. Res. 2017, 24, 4457–4468. [Google Scholar] [CrossRef]
  37. Wang, N.; Lyu, X.; Deng, X.; Huang, X.; Jiang, F.; Ding, A. Aggravating O3 pollution due to NOX emission control in eastern China. Sci. Total Environ. 2019, 677, 732–744. [Google Scholar] [CrossRef]
  38. Chang, L.; He, F.; Tie, X.; Xu, J.; Gao, W. Meteorology driving the highest ozone level occurred during mid-spring to early summer in Shanghai, China. Sci. Total Environ. 2021, 785, 147253. [Google Scholar] [CrossRef]
  39. Tian, X.; Xie, P.; Xu, J.; Li, A.; Wang, Y.; Qin, M.; Hu, Z. Long-term observations of tropospheric NO2, SO2 and HCHO by MAX-DOAS in Yangtze River Delta area, China. J. Environ. Sci. 2018, 71, 207–221. [Google Scholar] [CrossRef]
  40. Wang, Y.; Wen, Y.; Wang, Y.; Zhang, S.; Zhang, K.M.; Zheng, H.; Xing, J.; Wu, Y.; Hao, J. Four-Month Changes in Air Quality during and after the COVID-19 Lockdown in Six Megacities in China. Environ. Sci. Technol. Lett. 2020, 7, 802–808. [Google Scholar] [CrossRef]
  41. Feng, J.; Zhang, Y.; Li, S.; Mao, J.; Patton, A.P.; Zhou, Y.; Ma, W.; Liu, C.; Kan, H.; Huang, C. The influence of spatiality on shipping emissions, air quality and potential human exposure in the Yangtze River Delta/Shanghai, China. Atmos. Chem. Phys. 2019, 19, 6167–6183. [Google Scholar] [CrossRef] [Green Version]
  42. Jacob, D.J.; Winner, D.A. Effect of climate change on air quality. Atmos. Environ. 2009, 43, 51–63. [Google Scholar] [CrossRef] [Green Version]
  43. Venter, Z.S.; Aunan, K.; Chowdhury, S.; Lelieveld, J. COVID-19 lockdowns cause global air pollution declines. Proc. Natl. Acad. Sci. USA 2020, 117, 18984–18990. [Google Scholar] [CrossRef] [PubMed]
  44. He, G.; Pan, Y.; Tanaka, T. The short-term impacts of COVID-19 lockdown on urban air pollution in China. Nat. Sustain. 2020, 3, 1005–1011. [Google Scholar] [CrossRef]
  45. Lobell, D.B.; Di Tommaso, S.; Burney, J.A. Globally ubiquitous negative effects of nitrogen dioxide on crop growth. Sci. Adv. 2022, 8, eabm9909. [Google Scholar] [CrossRef]
  46. Zhang, S.; Wang, S.; Xue, R.; Zhu, J.; He, S.; Duan, Y.; Huo, J.; Zhou, B. Impacts of Omicron associated restrictions on vertical distributions of air pollution at a suburb site in Shanghai. Atmos. Environ. 2022, 294, 119461. [Google Scholar] [CrossRef]
  47. Feng, S.; Jiang, F.; Wang, H.; Wang, H.; Ju, W.; Shen, Y.; Zheng, Y.; Wu, Z.; Ding, A. NOx Emission Changes Over China During the COVID-19 Epidemic Inferred From Surface NO2 Observations. Geophys. Res. Lett. 2020, 47, e2020GL090080. [Google Scholar] [CrossRef]
  48. Kang, M.; Zhang, J.; Cheng, Z.; Guo, S.; Su, F.; Hu, J.; Zhang, H.; Ying, Q. Assessment of Sectoral NOx Emission Reductions During COVID-19 Lockdown Using Combined Satellite and Surface Observations and Source-Oriented Model Simulations. Geophys. Res. Lett. 2022, 49, e2021GL095339. [Google Scholar] [CrossRef]
  49. Sillman, S. The use of NOy, H2O2, and HNO3 as indicators for ozone-NOX -hydrocarbon sensitivity in urban locations. J. Geophys. Res. Atmos. 1995, 100, 14175–14188. [Google Scholar] [CrossRef]
  50. Martin, R.V.; Parrish, D.D.; Ryerson, T.B.; Nicks, D.K.; Chance, K.V.; Kurosu, T.P.; Jacob, D.J.; Sturges, E.D.; Fried, A.; Wert, B.P. Evaluation of GOME satellite measurements of tropospheric NO2 and HCHO using regional data from aircraft campaigns in the southeastern United States. J. Geophys. Res. Atmos. 2004, 109, D24307. [Google Scholar] [CrossRef]
  51. Chen, Y.; Yan, H.; Yao, Y.; Zeng, C.; Gao, P.; Zhuang, L.; Fan, L.; Ye, D. Relationships of ozone formation sensitivity with precursors emissions, meteorology and land use types, in Guangdong-Hong Kong-Macao Greater Bay Area, China. J. Environ. Sci. 2020, 94, 1–13. [Google Scholar] [CrossRef] [PubMed]
  52. Du, X.; Tang, W.; Cheng, M.; Zhang, Z.; Li, Y.; Li, Y.; Meng, F. Modeling of spatial and temporal variations of ozone-NOx-VOC sensitivity based on photochemical indicators in China. J. Environ. Sci. 2022, 114, 454–464. [Google Scholar] [CrossRef] [PubMed]
  53. Yang, Y.; Wang, Y.; Zhou, P.; Yao, D.; Ji, D.; Sun, J.; Wang, Y.; Zhao, S.; Huang, W.; Yang, S.; et al. Atmospheric reactivity and oxidation capacity during summer at a suburban site between Beijing and Tianjin. Atmos. Chem. Phys. 2020, 20, 8181–8200. [Google Scholar] [CrossRef]
  54. Zhu, S.; Poetzscher, J.; Shen, J.; Wang, S.; Wang, P.; Zhang, H. Comprehensive Insights Into O3 Changes During the COVID-19 From O3 Formation Regime and Atmospheric Oxidation Capacity. Geophys. Res. Lett. 2021, 48, e2021GL093668. [Google Scholar] [CrossRef]
Figure 1. Ground-based observations of NO2, O3, PM2.5, and PM10 before and during the lockdown period in Shanghai. The (a) concentration and (b) primary pollutant days of air pollutants during the lockdown and the same time periods in 2019–2021. (c) Maximum daily 8-h average (MDA8) during the pre-lockdown and lockdown periods. Orange lines and blues lines indicates O3 level-1 and level-2 limit of Chinese ambient air quality standard, respectively.
Remotesensing 14 06344 g001
Figure 2. TROPOMI-observed spatial distribution of NO2 and HCHO VCDs during the pre-lockdown (a,b), lockdown (c,d) and the same period in previous years (e,f) in YRD region, China.
Remotesensing 14 06344 g002
Figure 3. TROPOMI-observed (a) NO2 and HCHO VCDs during the lockdown period and the same period in previous years over Shanghai and (b) the contribution of lockdown response and meteorology impacts to changes in VCDs.
Remotesensing 14 06344 g003
Figure 4. Example of estimation on NOX emission in Shanghai during lockdown period under west wind condition. TROPOMI observed NO2 plume under (a) west wind and (b) calm wind over Shanghai during the lockdown period. The comparison of fitted and observed NO2 line density under (c) west wind and (d) calm wind condition. The star represents the pollution centre of Shanghai.
Remotesensing 14 06344 g004
Figure 5. TROPOMI-observed FNR during (a) the lockdown period and (b) the same period in previous years over Shanghai.
Remotesensing 14 06344 g005
Publisher’s Note: MDPI stays neutral with regard to jurisdictional claims in published maps and institutional affiliations.