Technical Note

Measuring Sand Dune Dynamics in the Badain Jaran Desert, China, Using Multitemporal Landsat Imagery

1
School of Computer Science, China University of Geosciences, Wuhan 430074, China
2
School of Natural Sciences, Macquarie University, Sydney, NSW 2109, Australia
3
Wuhan Center, China Geological Survey, 69 Guanggu Ave, Wuhan 430205, China
*
Author to whom correspondence should be addressed.
Remote Sens. 2022, 14(24), 6343; https://doi.org/10.3390/rs14246343
Submission received: 17 October 2022 / Revised: 29 November 2022 / Accepted: 10 December 2022 / Published: 15 December 2022

Abstract

:
The Badain Jaran Desert (BJD) and surrounding deserts are the main sources of sand and dust storms in Asia. However, for complex factors, the descriptions of the sand dune dynamics in the BJD and investigations on the contribution of the BJD to the formation of the Tengger Desert (TD) and the Ulan Buh Desert (UBD) are lacking. We evaluated the performance of the discrete Fourier transform method in achieving subpixel precision when measuring the displacements of sand dunes in the BJD and surrounding deserts. This method was applied to Landsat 5/8 and 7 scan-line-corrector (SLC)-off/8 image pairs, respectively. The results show that it is a robust method in desert conditions without ground control points. Nineteen scenes of Landsat 5/8 were tested for estimating the movements of the BJD and surrounding areas. We found that the sand dunes moved eastward during 2004–2016. However, the dunes’ movements showed different patterns in different parts of the desert. In the western BJD, the dunes moved at an average speed of 1–3 myr−1, while in the southern and middle parts of the BJD, the dunes’ speed was about 0.1–1 myr−1. The fastest displacements of dunes were located in the northeastern BJD, and the mean speed was about 12 myr−1. The sand fluxes in the two corridors between the BJD and the TD and UBD were estimated. The annual total amount of sand transported from the BJD to the TD through the main corridor was about 0.95 million tonnes, while that from the BJD to the UBD was about 2.24 million tonnes. The estimations of dune displacements and sand transport based on Landsat images in this study are important for understanding the dynamics of the BJD and surrounding areas.

Graphical Abstract

1. Introduction

Aeolian morphology has received increased attention recently owing to the advances in remote sensing technology and image analysis methods. The shapes, sizes, and displacements of sand dunes respond to the surrounding environments. The Badain Jaran Desert (BJD), the second-largest mobile desert in China, is one of the three deserts in this region. The Tengger Desert (TD) and the Ulan Buh Desert (UBD) lie east of the BJD, as shown in Figure 1. Distinct sand corridors connect these deserts. The frequency of sand and dust storms has continuously increased over the last five decades due to environmental deterioration in northern China [1]. It has been proposed that the BJD created the surrounding deserts [2].
Measuring sand dune displacement at spatial and temporal scales is important for understanding the dynamics of the desert [3]. Traditionally, such measurements have been carried out through geodetic field surveys [4], long-term monitoring [5], or short-term monitoring with sand traps [6,7]. Recently, optical remote sensing images have been used as potent sources to estimate dune system dynamics. The outlines of the dunes extracted from remote sensing images are used to represent the displacements of the dunes [8]. The image cross-correlation method demonstrates the potential to calculate the displacement of sand dunes by matching multitemporal images [9,10,11]. Co-registration of Optically Sensed Images and Correlation (COSI-Corr) image processing software [12], which was developed for ground deformation measurement between image pairs at a 1/50 pixel accuracy, is widely used to monitor glacier displacement [13,14] and estimate sand dune migration [3,10,15,16]. Recently, synthetic aperture radar (SAR) data have also been used [17] for this purpose. However, making accurate measurements based on image pairs depends not only on the ground resolution of satellite images [18] but also on the stripe artifacts, orthorectification accuracy, and shadows [11], among other factors. As the most popular sources of images of Earth’s surface, the Landsat series satellites provide the longest temporal coverage thereof along with similar spatial and temporal resolutions [19]. Since Landsat 1 acquired the first image of Earth in 1972, Landsat images have made it possible to monitor sand dune migration over a long timescale and large areas using the image cross-correlation method. High-precision and high-efficiency optical imagery cross-correlation algorithms are necessary for sand displacement measurement.
Only a few previous works have focused on measuring sand dune migration and sand transport in the BJD using remote sensing. Yao et al. [8] measured the sand dunes’ displacement using Landsat images by comparing the movements of sand outlines in the northeastern BJD. Chen and Liu [20] expanded this work to four typical areas, including the Baian and Sanlei areas, using a similar method. Yang et al. [21,22] reported the annual amount of sand transported from the BJD to the TD and UBD through linking corridors. This showed the details of sand movement through a narrow channel. However, these works only covered a small area of the BJD and surrounding deserts and did not show the overall dune movement characteristics of the BJD or the transport characteristics from the BJD to its surrounding deserts.
In this paper, we applied a subpixel image co-registration method for sand dune displacement measurement in the BJD and surrounding deserts. Using Landsat 5, 7, and 8 images, we calculated the details of dune movement in the whole area while also estimating sand transport from the BJD to the TD. Section 2 introduces the study area and the data used in this study. Section 3 introduces the methodological principles of the DFT method. Section 4 compares the displacement maps generated using Landsat 5/8 image pairs and Landsat 7 SLC-off/8 image pairs, and the 10-year migration history of sand dunes in the BJD is analysed. In Section 4, the extent of sand transport in the corridors between the BJD and the two adjacent deserts is also investigated. Finally, the limits and capabilities of this method are discussed.

2. Study Area and Data Sources

2.1. Study Area

The BJD is in north-central China between longitude 100–104°E and latitude 39–42°N, and it covers about 49,300 km2 (Figure 1). The Heihe River delineates the western edge of the BJD. To the east, it is bounded by Yabrai Mountain and Alateng Mountain. As a part of the Alxa Plateau, the BJD is between 1000 and 2000 m above sea level, and this height increases from the northwest to the southeast. There are two kinds of dune patterns in the BJD: northeast-oriented crescentic dunes and complex star dunes [23]. More than 50% of the BJD is covered by megadunes with a height of 200–300 m. The highest dune, which is about 480 m, is located in the southeastern region of the BJD [24]. A total of 72 lakes, which are supported by groundwater, lie among the megadunes in the southeastern part of the BJD [25]. The desert is characterised by an arid climate [8] and is regarded as one of the sources of Asia’s dust storms [26]. Precipitation increases from the northwest to the southeast, yielding mean annual precipitation of about 77 mm. The annual mean temperature around the BJD has increased by 0.4 myr−1 in the last 50 years, and the mean wind speed is decreasing in spring, summer, and autumn [27]. The average direction of the wind is from the northwest [28], and as a result, the dunes move southeastwardly [29].

2.2. Data Sources

Sand dune displacements in the study area were measured using cloud-free Landsat imagery acquired from 2004 to 2016. The images from the Landsat series have a 30 m spatial resolution and have covered the research area with similar spectral bands since 1982. In this study, Landsat 5, 7, and 8 scenes acquired in 2004 and 2016 were used to estimate dune displacement. As Yang [22] reported that the sand-transporting wind occurs mostly in spring and early winter, 19 scenes of Landsat images covering the BJD, UBD, and TD from summer to winter were carefully selected (Table 1) to estimate the dunes’ movement across the whole research area. The terrain-corrected Landsat L1T images were downloaded from the U.S. Geological Survey (USGS) and the Geospatial Data Cloud (http://www.gscloud.cn, accessed on 11 February 2021). The master images in matching pairs were used as references, and the slave images were compared with the master images to estimate sand movement. The test image was used to validate our matching method. Since there were no static features in the desert, such as bedrock outcrops, to serve as ground control points, we assumed that the Landsat images were well processed, with high position accuracy, and that the dune displacement exceeded the misregistration criteria.
Meteorological data from 2005 to 2016 for the Ejin, Guaytszykhu, Baian Mod, Jiuquan, Nanjie, Sanlei, and Dzartay stations were downloaded from http://rp5.ru (accessed on 6 July 2021). These data were collected from (1) the server for international data exchange, NOAA, and (2) the Automated Data Transfer System of Roshydromet.
The Advanced Spaceborne Thermal Emission and Reflection Radiometer (ASTER) Global Digital Elevation Model (GDEM) is released by the USA’s National Aeronautics and Space Administration (NASA) and the Ministry of Economy, Trade, and Industry (METI) of Japan at spatial resolution of 1 arc-sec [30]. In this study’s analyses, GDEM version 2 was used.

3. Methodology

3.1. Displacement Extraction at Subpixel Accuracy

Image-matching techniques involve finding image patches of two images taken at different times or with different sensors [31]. Image matching is used for image co-registration and pixel movement (or ground deformation) monitoring. Heid and Kääb [32] validated six commonly used image-matching algorithms by applying them in glacier surface displacement monitoring and found that the phase correlation algorithm used in the COSI-Corr software and the cross-correlation on orientation images (CCF-O) algorithm are “the two most robust matching methods for global-scale mapping”. To determine the subpixel displacement, an orthogonal parabolic or bell-shaped function was used on the correlation surface [31]. This function makes the cross-correlation more sensitive to the central pixels of the matching window [32] but not the whole window. Thus, in this study, a new, more effective image-matching method that operates in the frequency domain was used.
Manuel et al. (2008) developed an algorithm based on discrete Fourier transforms (DFT) and showed that this method can accurately co-register two images with large upsampling factors [33]. Taking f as the image acquired at time 1 and g acquired at time 2, the normalised root-mean-square error E between f ( x , y ) and g ( x , y ) is defined as follows:
E 2 = min a , x 0 , y 0 x , y | a g ( x x 0 , y y 0 ) f ( x , y ) | 2 x , y | f ( x , y ) | 2 = 1 max x 0 , y 0 | r f g ( x 0 , y 0 ) | 2 x , y | f ( x , y ) | 2 x , y | g ( x , y ) | 2
where x 0 , y 0 is the displacement between f ( x , y ) and g ( x , y ) , and a is the arbitrary constant. This summation occurs for all points ( x , y ) . The cross-correlation of f ( x , y ) and g ( x , y ) is shown below:
r f g ( x 0 , y 0 ) = x , y f ( x , y ) g ( x x 0 , y y 0 ) = x , y F ( u , v ) G ( u , v ) e x p [ i 2 π ( u x 0 M + u y 0 N ) ]
where M and N represent the image sizes, is a complex conjugation, and F and G are the DFTs of f and g :
F ( u , v ) = x , y f ( x , y ) M N e x p [ 2 i π ( u x M + u y N ) ]
Thus, evaluating Equation (1) requires locating the peak of the cross-correlation r f g ( x 0 , y 0 ) . Here, a two-step DFT algorithm [34] was used to reduce the computation time and memory. The accuracy of the registration can reach 1/100 of a pixel.
The DFT method estimates displacement based on image pairs, but the quality of the remote sensing images always affects the accuracy of the estimations. To reduce the impediments of shadows or data caps in the images, we followed Fitch et al. and converted the images f and g to orientation images f d and g d (orientation of intensity gradients) [35]:
f d ( x , y ) = s g n ( f ( x , y ) x + f ( x , y ) y ) g d ( x , y ) = s g n ( g ( x , y ) x + g ( x , y ) y )
where
s g n = { 0 | x | = 0 x | x | | x | 0
and i is the complex imaginary unit.
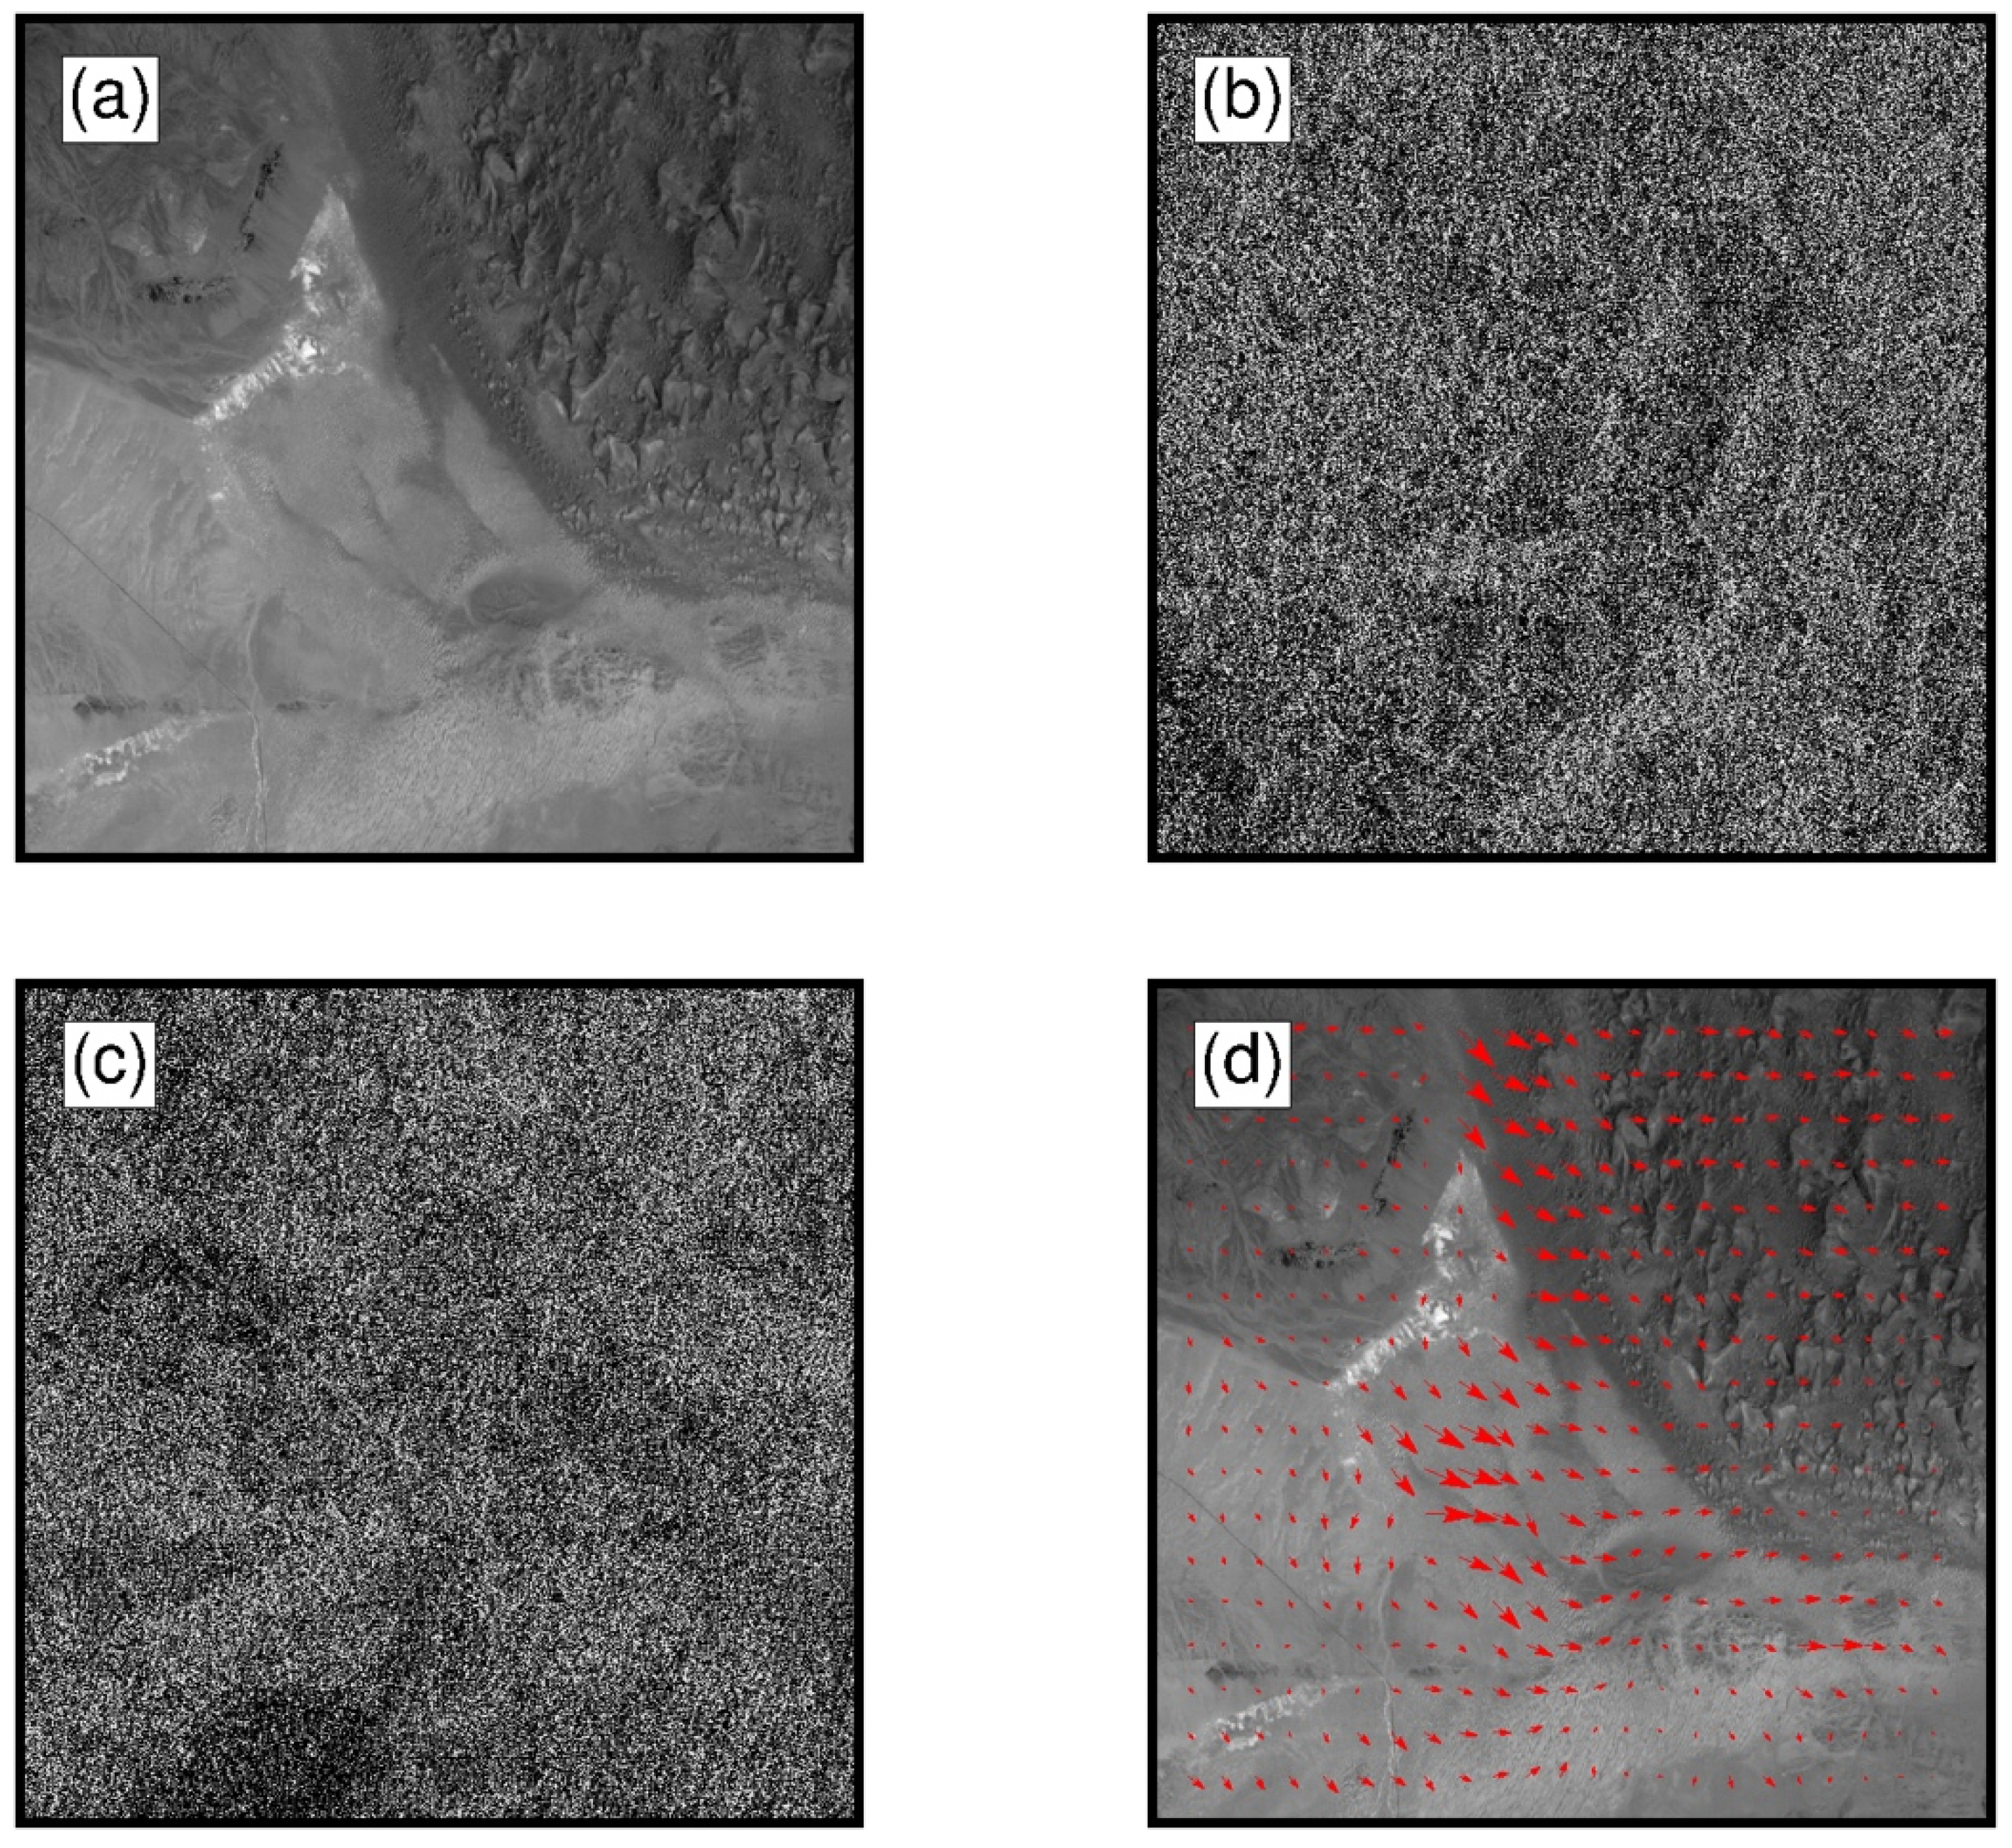
The new images f d and g d are complex, and the intensity and imaginary parts respond to the differences in the x and y directions, respectively. The cross-correlations of f d and g d were then processed using Equation (2), and the displacement was estimated. As shown in Figure 2, the Landsat 5 image (a) was converted into a complex orientation image with an intensity component (b) and an imaginary component (c), and the displacement map was shown as a vector field (d). It should be noted that after conversion to complex images, the reflection differences in the Landsat images were reduced.
As 19 scenes of Landsat image pairs were used in this study, the differences in acquired times may have caused slight errors when making a mosaic of the displacement map. To minimise the displacement errors caused by time differences, the Landsat images that were acquired in the summer or autumn were selected and accurately co-registered before matching. The displacements d are translated to a 10-year displacement D :
D = d T L 8 T L 5 × 3650
where T L 8 and T L 5 are the acquired dates of the Landsat 8 and Landsat 5 images, and we supposed that there was a total of 3650 days in this 10-year period for ease of calculations and assumed the displacement rate was linear.

3.2. Method Validation with Different Landsat Image Pairs

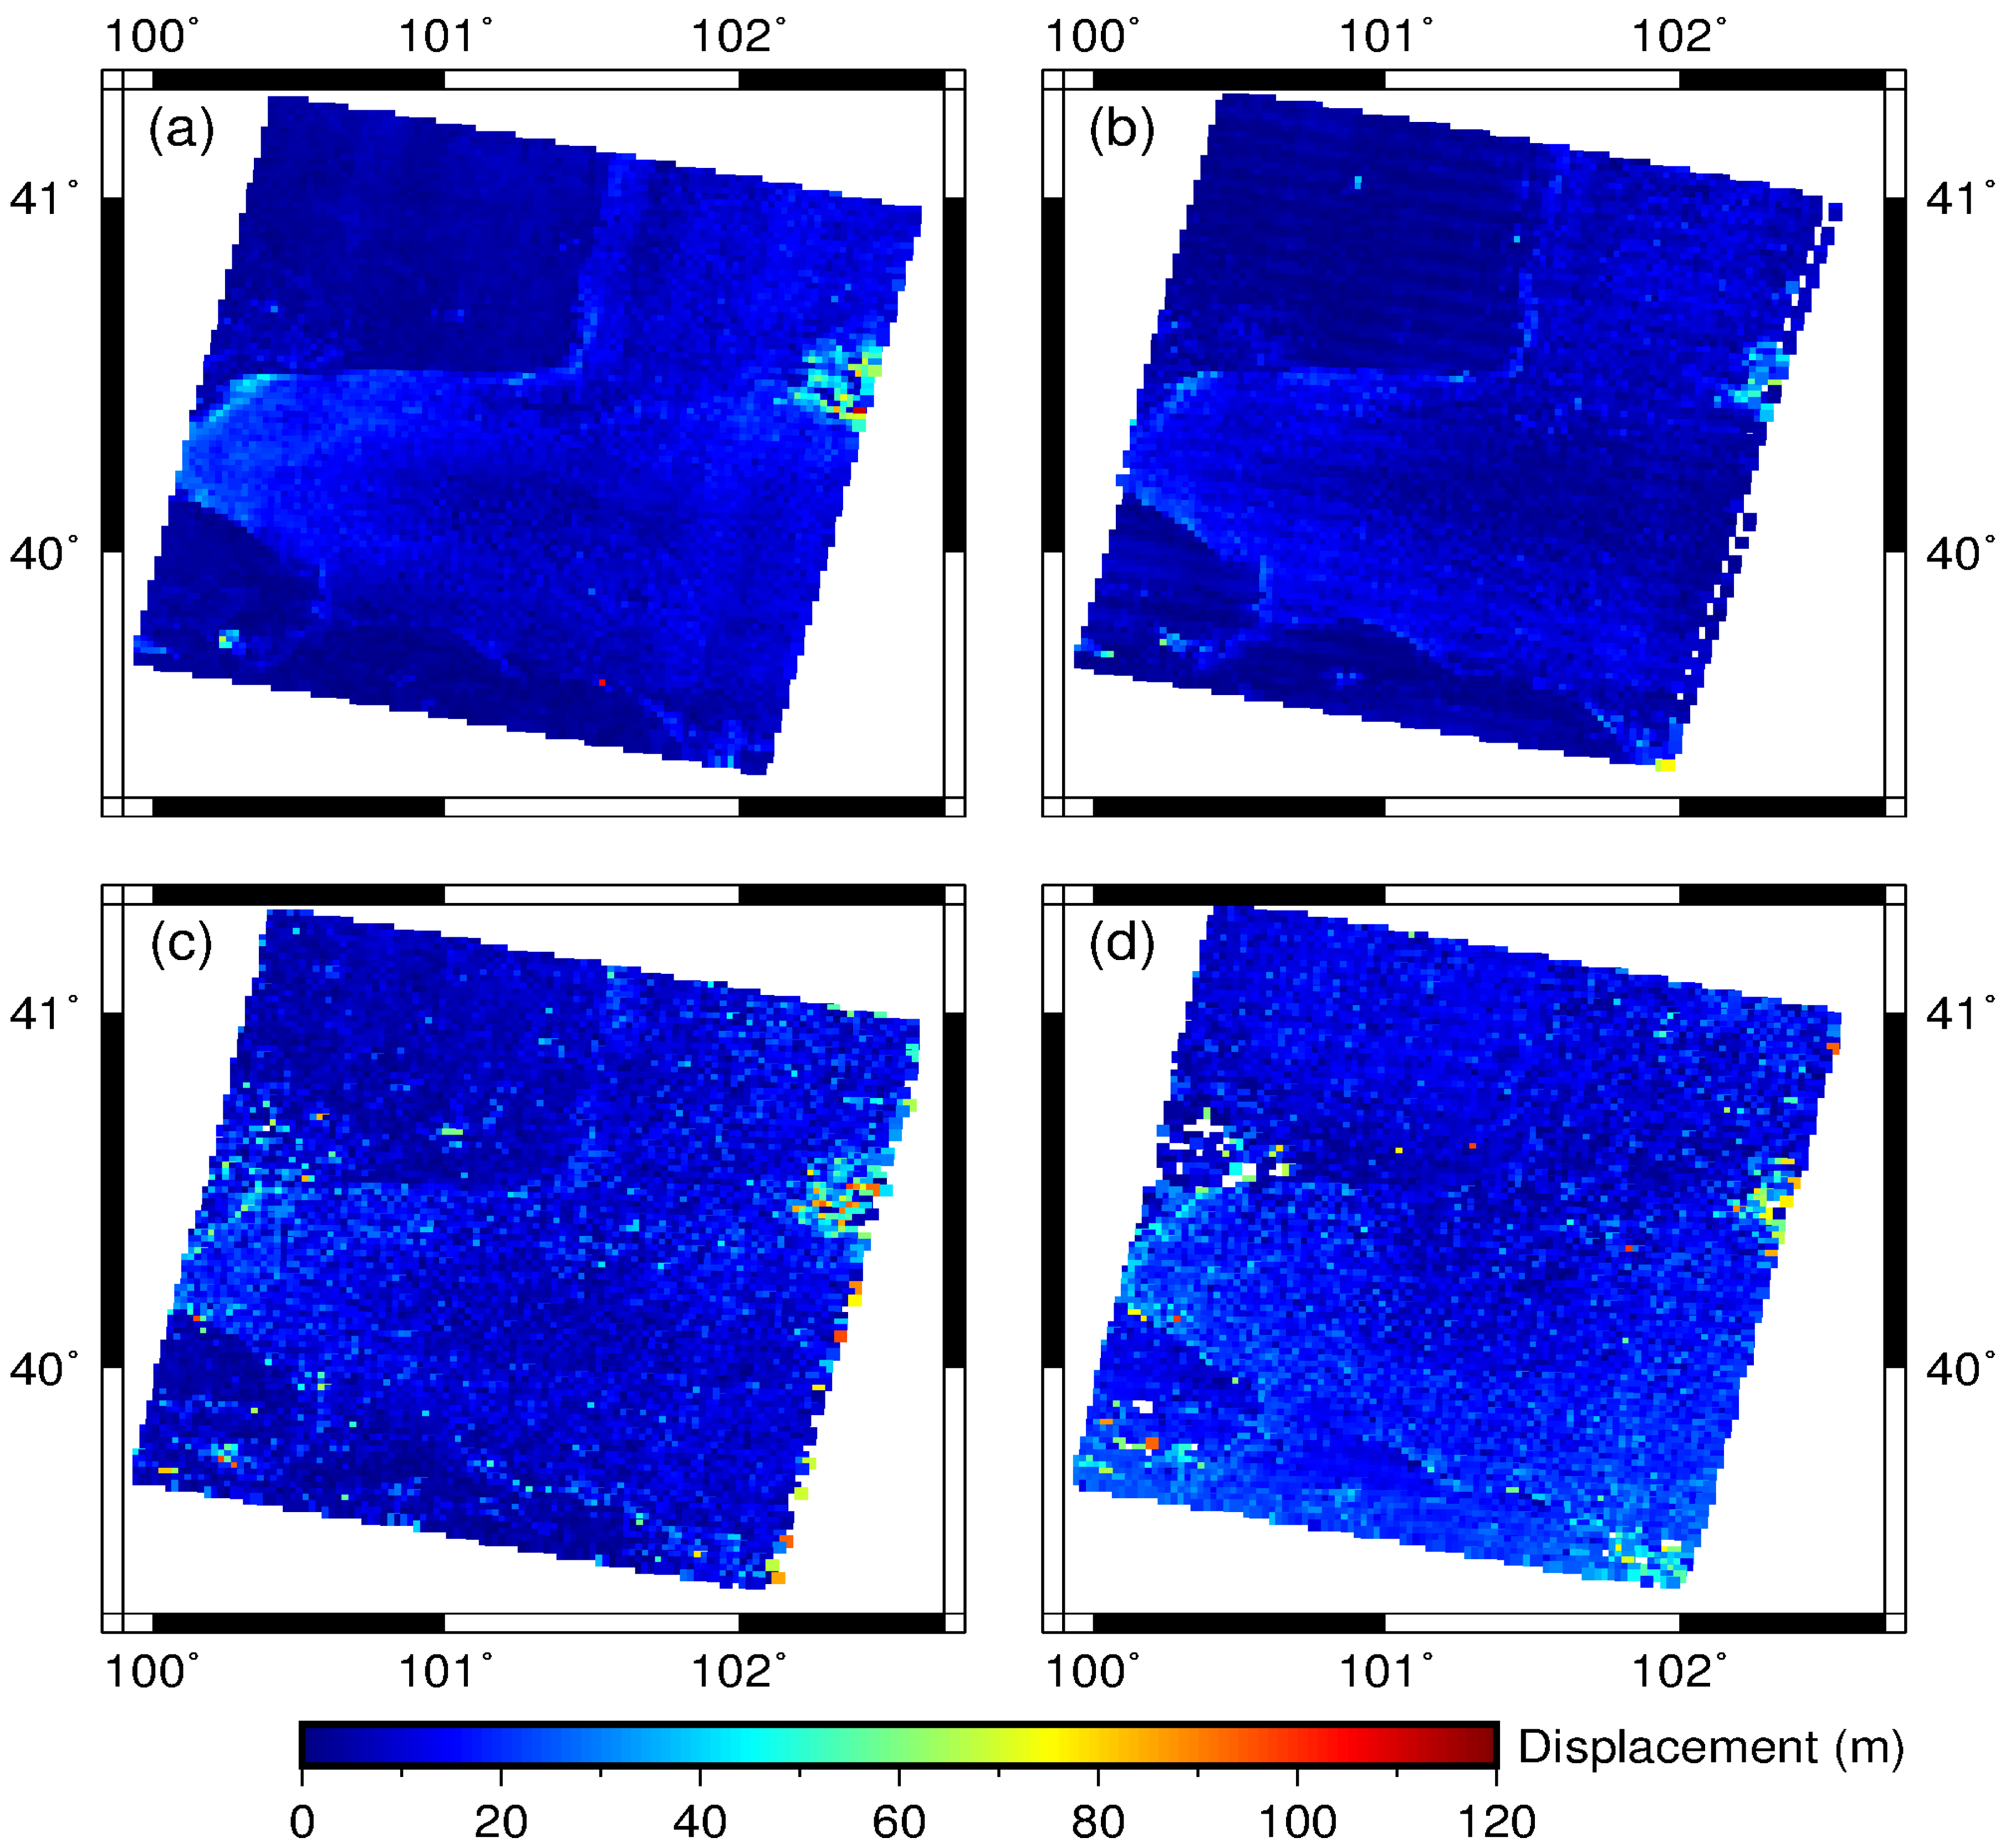
To validate the robustness of the DFT method, three kinds of Landsat images (path/row: 133/32) were used (Table 1). The images were divided into two groups: one encompassed Landsat 5 and 8 images with 30 m resolution, and another included Landsat 7 SLC-off and Landsat 8 images with 15 m resolution. To compare the results at the same resolution, 64 × 64 and 128 × 128 sizes were used as the matching window sizes for the Landsat 5/8 and Landsat 7/8 pairs, respectively. These two pairs were processed using the DFT method and the COSI-Corr software, respectively. The results are shown in Figure 3. All the results are for the original migrations without applying any filters.
The results in Figure 3 show the displacement maps of the two pairs using different methods. The displacements were similar in distribution and intensity. The highest displacements were observed in the midwestern and northeastern parts of the scene, where the sand dunes moved the fastest between 2005 and 2016. However, as shown in Figure 3b, wave artefacts were found in the displacement, in the across-track direction, that were caused by attitude effects and/or distortions of the satellite sensors [13]. These attitude effects can be removed by using the statistics of the displacement on stable ground. While the desert covered most parts of the scene, these statistics were incomplete and could not be used to remove the attitude effects. The results shown in Figure 3c,d were processed using COSI-Corr. It is clear that the noise signals were distributed throughout the whole scene. The reasons for this phenomenon will be discussed in the following sections.
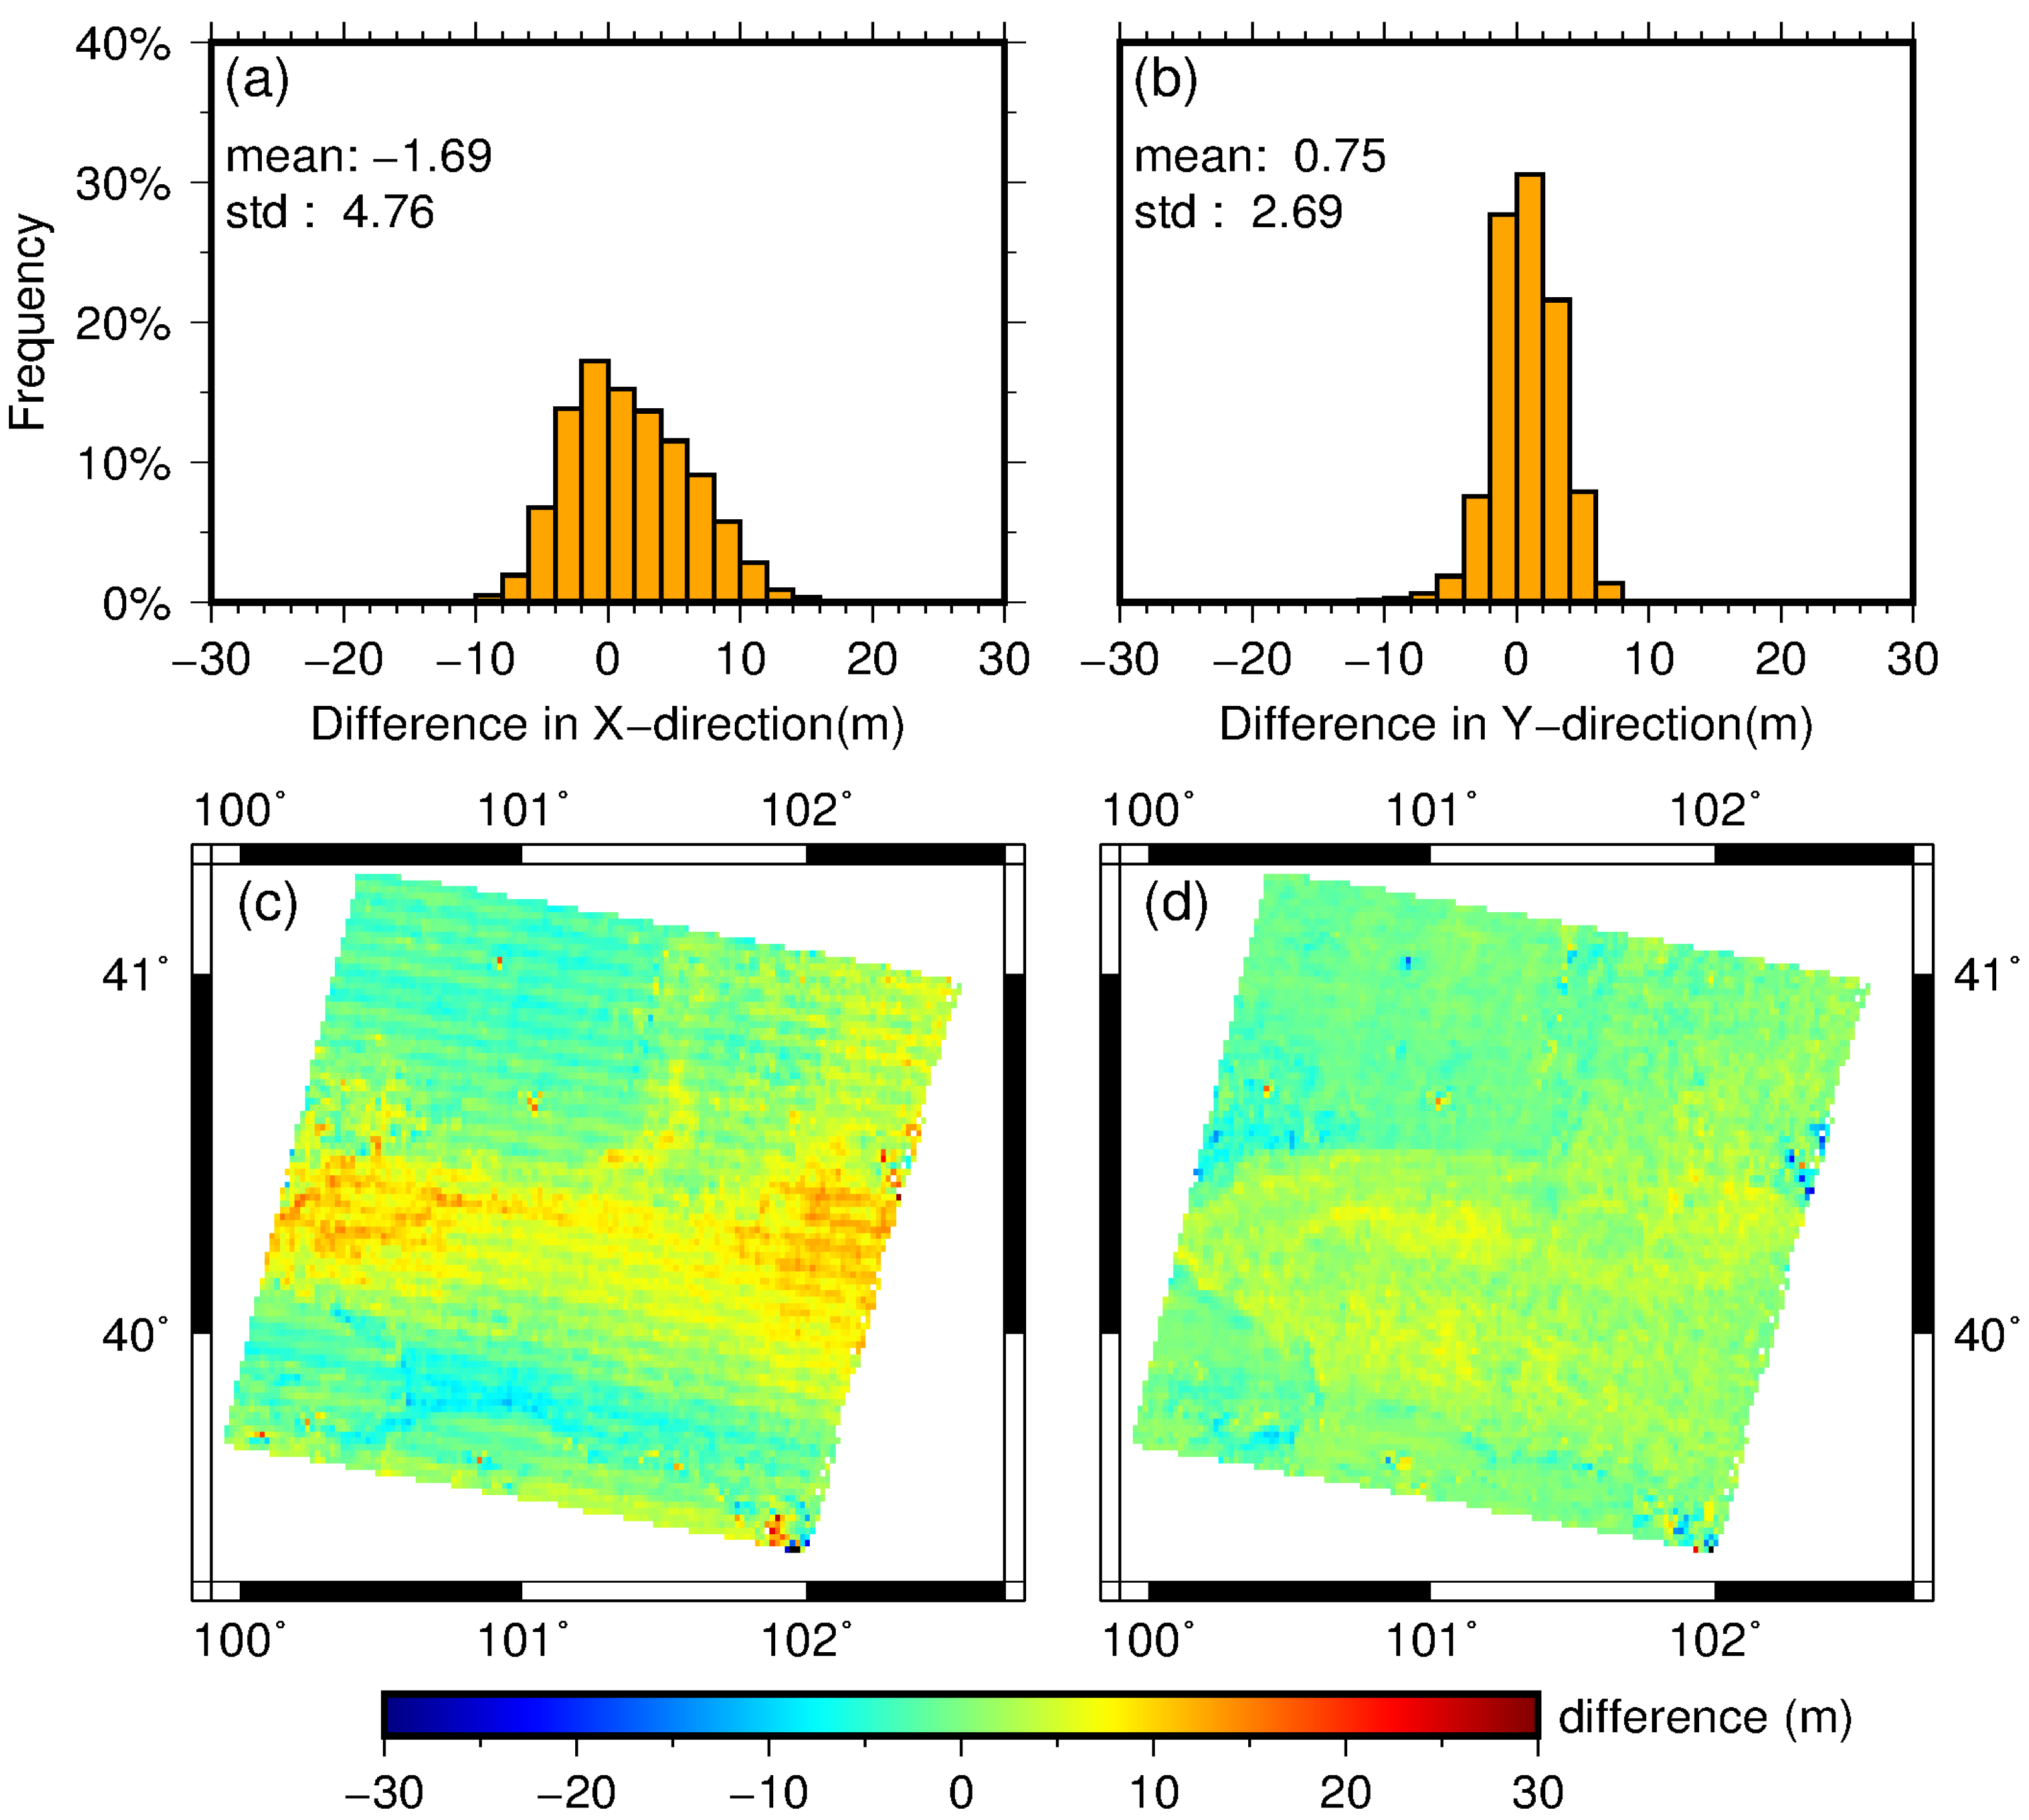
To validate the difference in dune migration between the Landsat 5/8 (Figure 4a) and 7/8 pairs (Figure 4b), the difference maps and histograms of the differences in the X and Y directions are shown in Figure 4.
The spatial distributions of errors differed in the X and Y directions. The errors were distributed across the desert area. As the Landsat 5 image was acquired on July 15, whereas the Landsat 7 image was obtained on June 5, the differences were partly caused by the dune movements over these 40 days. It needs to be pointed out that the systematic distortions in the displacement were not removed or reduced here. The mean differences in the dune displacement in the X and Y directions were −1.69 m and 0.75 m, respectively, which were about a tenth of one pixel of the Landsat 7 image. The standard deviation of the difference in migration difference was less than half of a pixel in the Landsat 7 image. Thus, the Landsat 7 SLC-off images can be used to measure displacement if the lower accuracy can be accepted, and/or the system errors (e.g., wave artefacts) are removed.
As demonstrated by the above analysis, the DFT method is robust enough for dune displacement estimation in the BJD and the surrounding deserts; thus, Landsat 5 and 8 images were used for sand dune migration estimates using the DFT method, the results of which are presented in the following sections.

3.3. Measuring Sand Flux

To estimate the sand flux from the BJD to the UBD and TD, we followed Bagnold [36], Ould Ahmedou et al. [37], and Vermeesch and Drake [10]: the sand flux q is defined as the volume of dune sand passing through a line with a unit length perpendicular to the wind direction per unit time:
q = h × d d t
where h is the dune’s height, d is the dune’s celerity, and d t is the interval between the first and last time. This sand flux was estimated by measuring the speeds and morphological parameters of the dunes at random in the research area. However, for remote sensing, we can calculate the average sand flux Q of the whole flux area as follows:
Q = x , y h ( x , y ) × d ( x , y ) M × N × ( T L 8 T L 5 )
where M and N are the sizes of the test area, while h ( x , y ) and d ( x , y ) are the height and speed of migration at ( x , y ) , respectively.
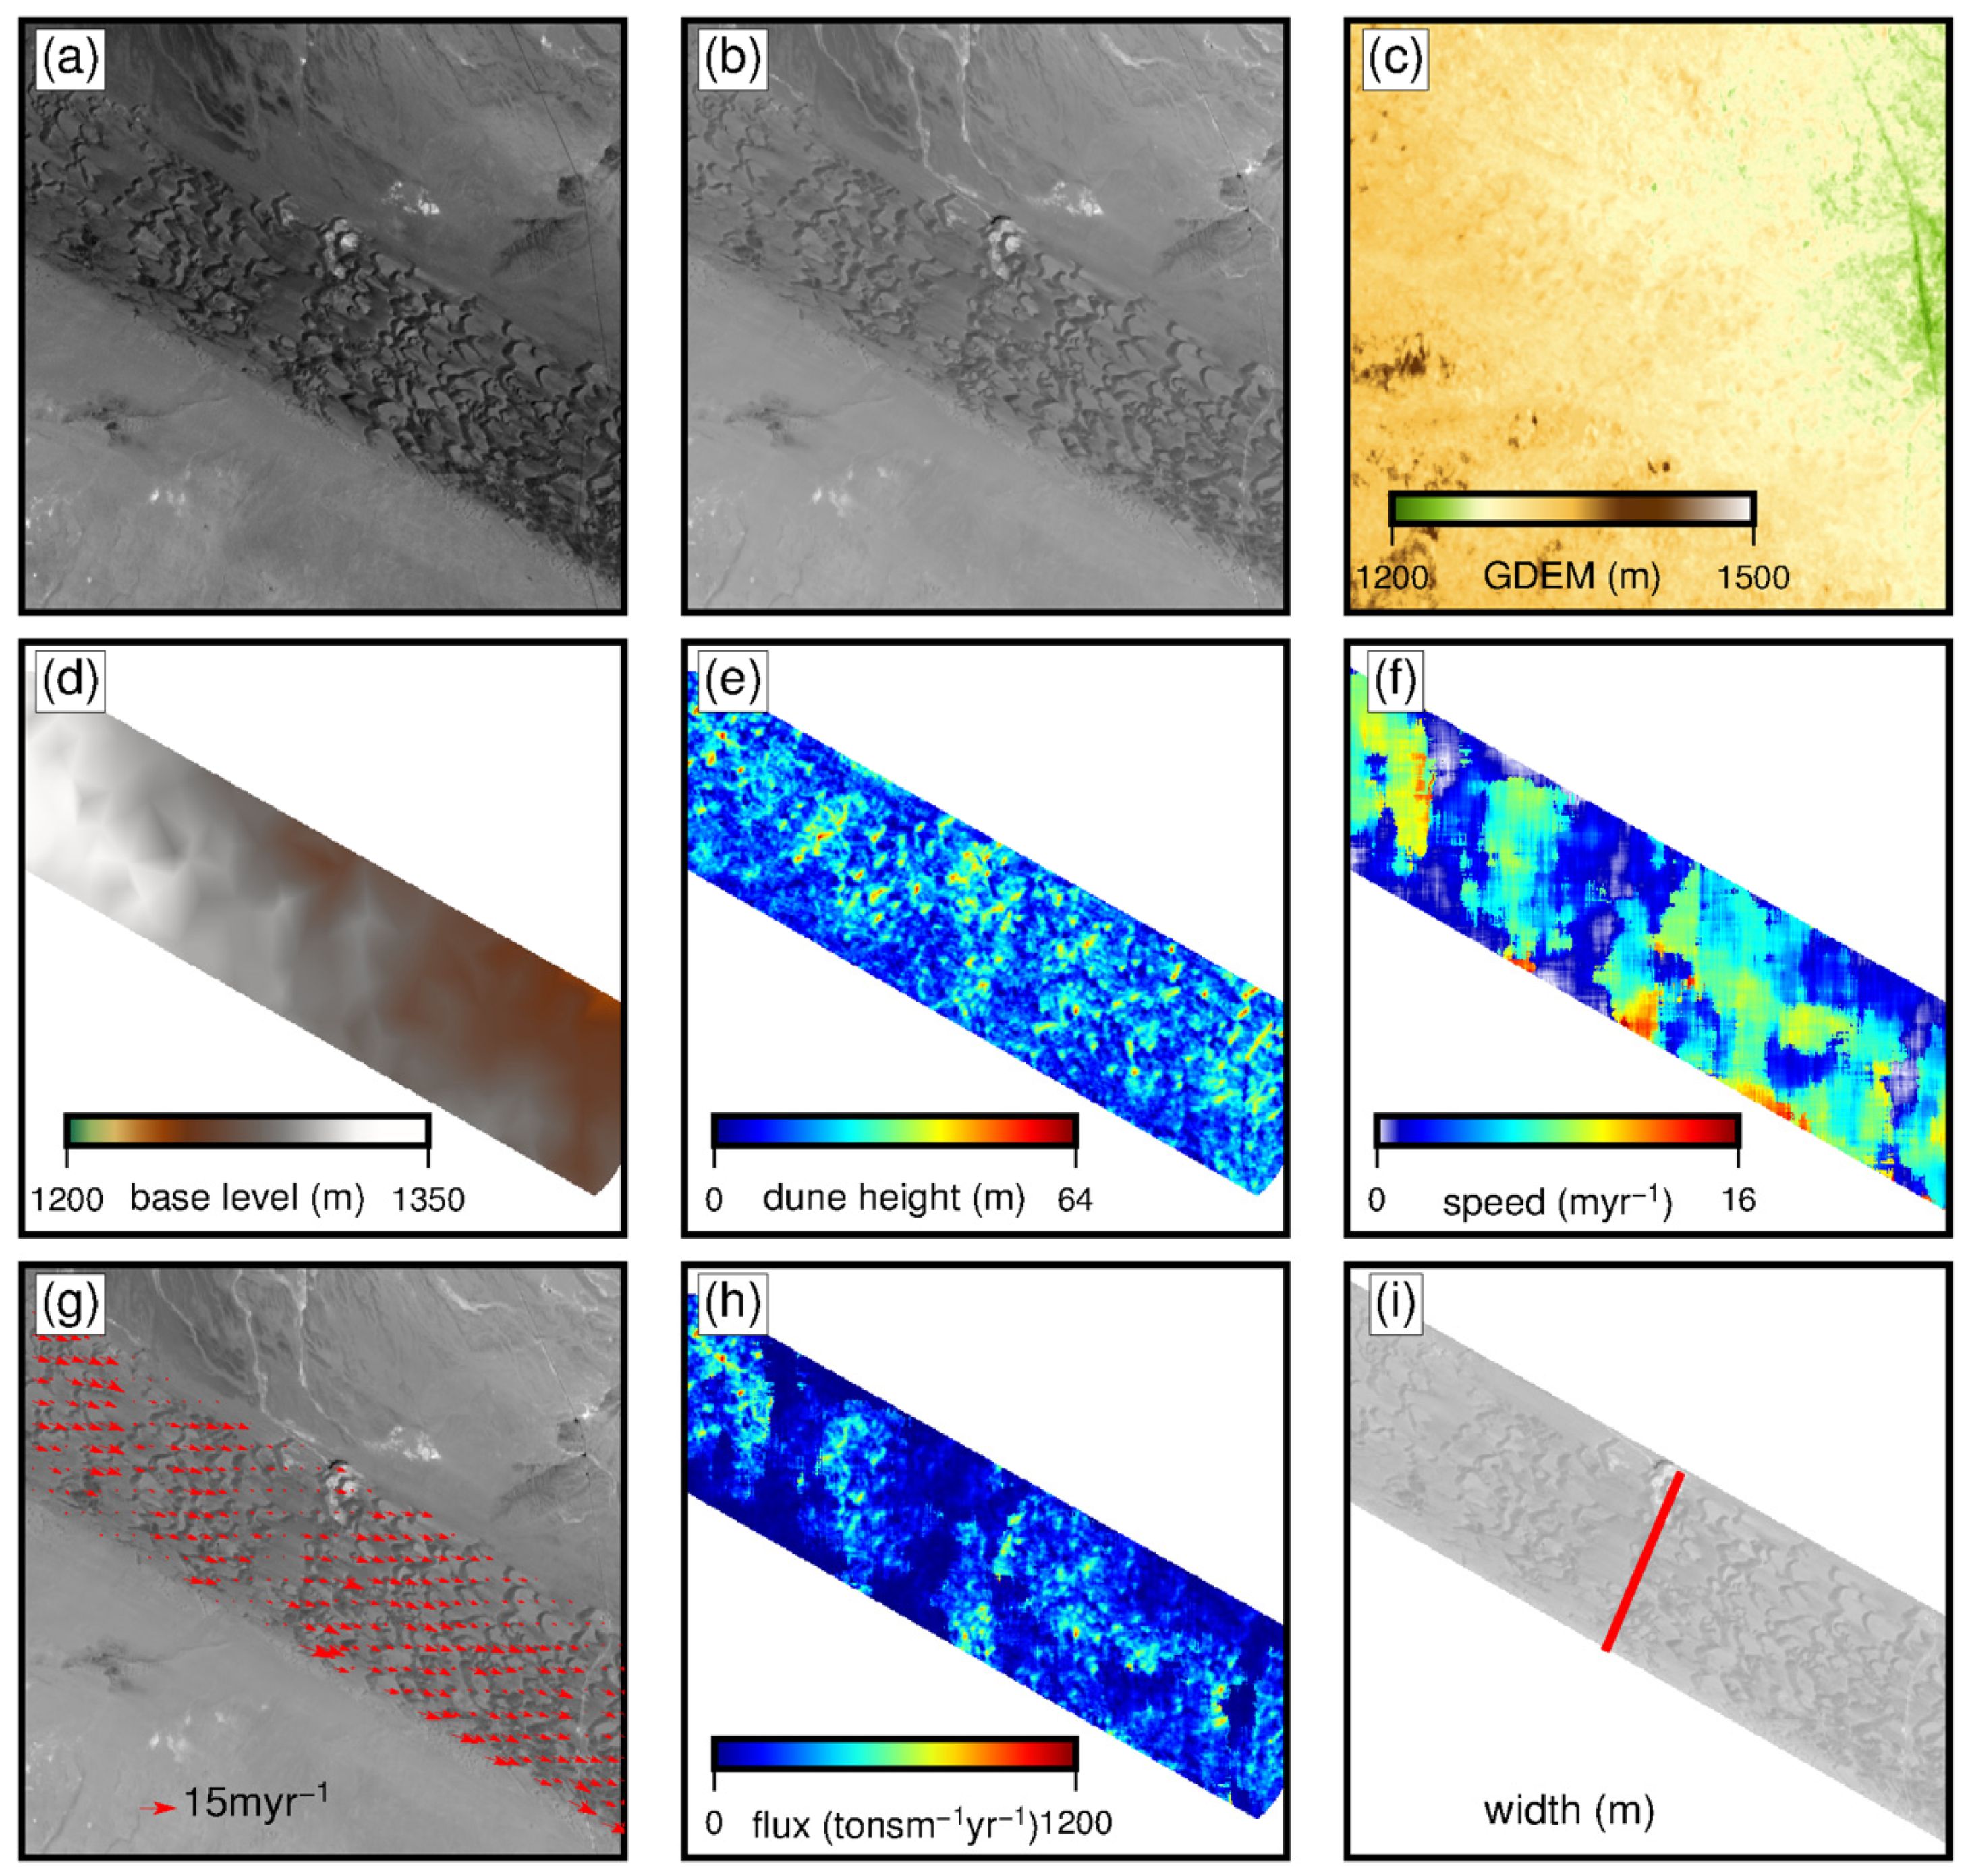
In Equation (8), d ( x , y ) can be estimated using the DFT method, while h ( x , y ) can be determined by subtracting the raw DEM from the “base level” [10]. In this study, we used the ASTER DEM by selecting the deepest central points in the matching window and interpolating them to the base level. Figure 5 shows the base level, dune height, and sand flux in each pixel. We assumed that the wind direction is parallel to that of dune migration.

4. Results and Discussion

4.1. Dune Migration

The sand dune displacements were generated from Landsat 5 and 8 image pairs acquired in 2004 and 2016 (path/row: 131–135/31–34), respectively. When the 10-year displacements of sand dunes were generated and mosaicked, the whole scene could show the dune migration of the BJD and the surrounding area. The results are shown in Figure 6.

4.1.1. Displacement in the BJD

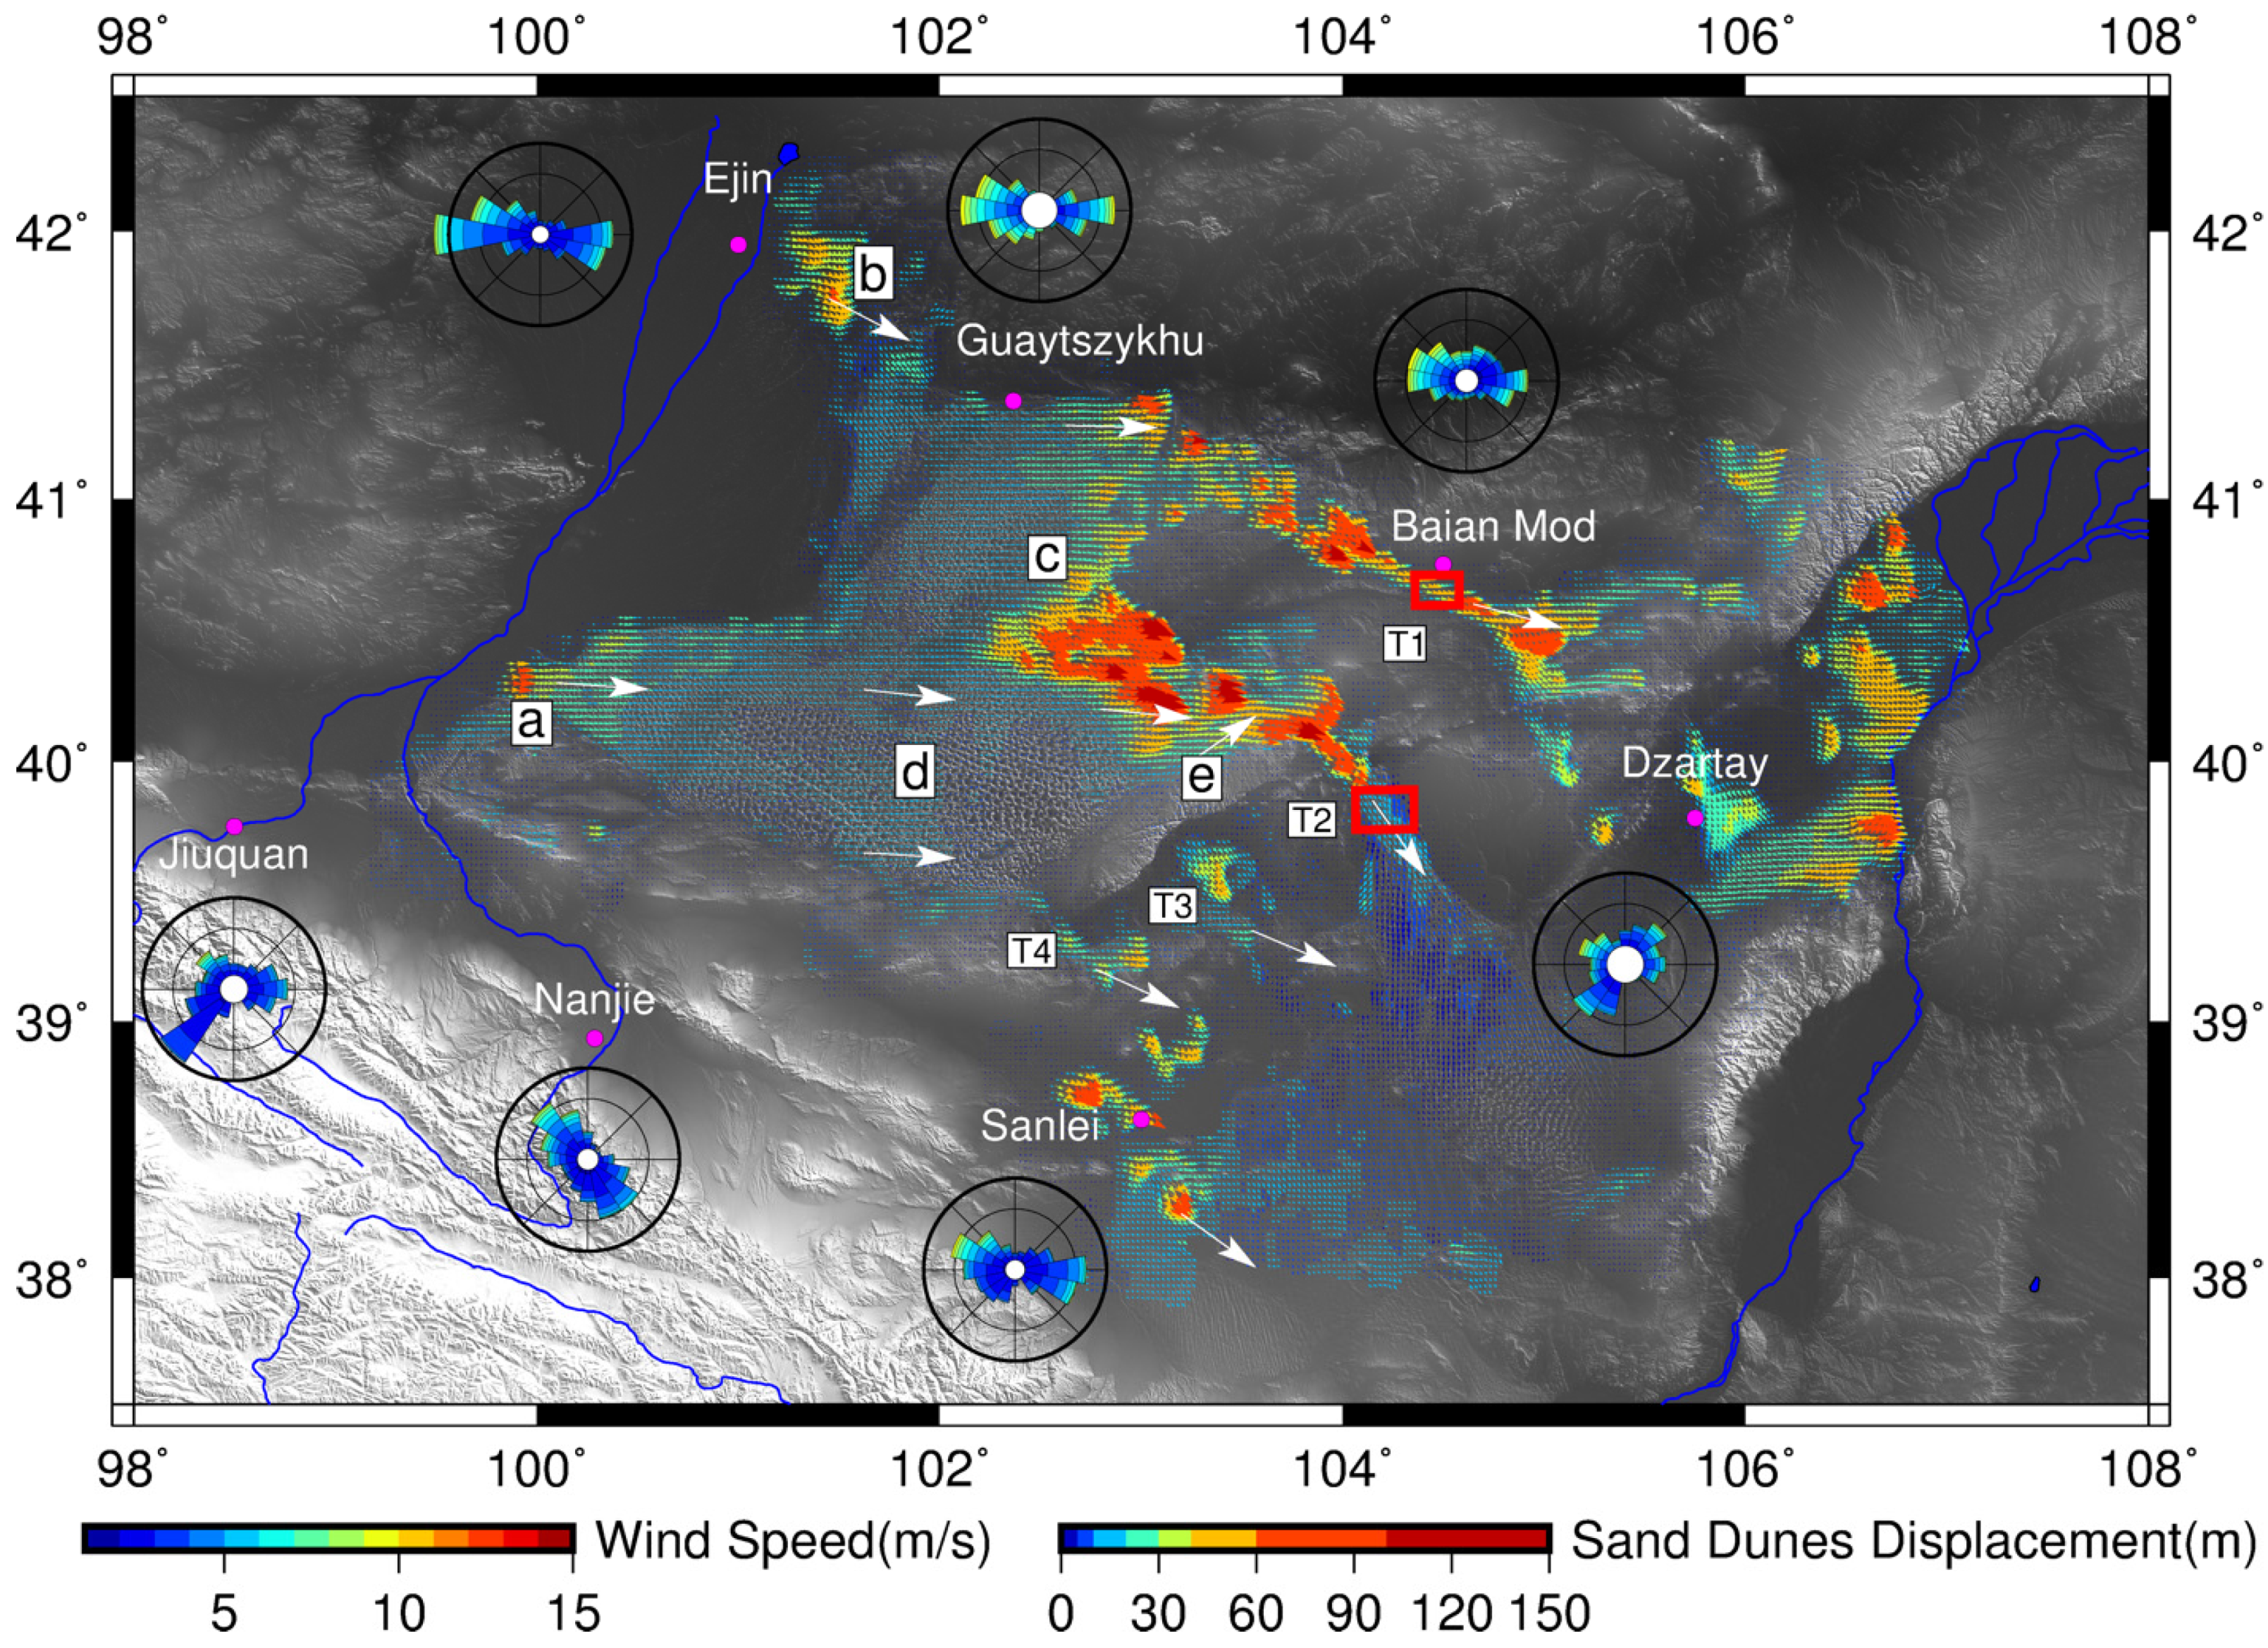
In general, the sand dunes in the BJD moved from west to east (88°–93°) because they are controlled by the wind in the BJD area. As shown in Figure 6, the wind speed and direction of the seven meteorological stations, which are generally used as references to estimate climate changes [25,27,38], are shown as wind roses. However, the Nanjie, Sanlei, Jiuquan, and Dzartay stations are far from the BJD and could not affect the dunes’ movement. For the three stations in the northern BJD, the winds showed more variability in direction [28,39]. The 11-year (from 1 January 2005 to 1 September 2016) wind rose showed a predominant occurrence of winds in the west–northwest and east–southeast directions, with maximum wind speeds of 23 m/s. The Sumu Jaran research station (102.45E, 39.80N) also reported winds from the northwest to the southwest in 2010 over a 1-year monitoring period [38]. This shows that the dunes moved eastward in the main part of the BJD.

4.1.2. Displacement Patterns

Although the dunes were moving toward the east, the displacements in the BJD exhibited different patterns. Here, we selected several areas for detailed analysis. Areas a, b, c, d, and e in Figure 6 show different migration areas. Areas a, c, and d have similar migration directions. Area a is located in the western BJD, showing a corridor of wind from the west. The sand dunes moved at an average speed of 1–3 myr−1, which was higher than in the surrounding area. In area c, the migration speed increased in the eastern region by a mean speed of 12 myr−1. In area d, which is covered with higher sand dunes or sand mountains, the average speeds of the dunes were about 0.1–0.5 myr−1, which was lower than those of other areas. Chen and Liu [20] reported that the surrounding dunes moved southeast and northwest, which makes them move slower than in other areas in the long term. However, for b and e, the displacement was affected by the mountain. In area b, the sand dunes moved toward the southeast, while in area e, they moved to the northeast.

4.1.3. Sand Transport Tunnels

The areas in T1T4 show the sand being transported from the BJD to the UBD and TD. There are clear sand-transport tunnels in T1, T2, and T4. Due to the mountains, the associated valleys become high-speed channels for the wind that transports sand; the maximum displacements in T1 and T2 were about 15–17 myr−1, which was much higher than in other areas. After the dunes moved through the valleys, the speeds became slower. The displacement in T1 is the same as that found in previous work by Yao et al. [8]. We selected T1 and T2 to estimate the sand transport flux from the BJD to the UBD and TD, respectively. Although there was no valley in T3, the sand was transported by the wind through to the mountain, deposited at the TD, and shifted toward the southeast.

4.2. Sand Flux

As shown in Figure 6, there were four channels for sand transport, and T1 and T2 were more important than the others. The sand fluxes in T1 and T2, which show the sand moving from the BJD to the BUD and TD, were estimated. The results of our study and those of previous related work by Yang are shown in Table 2.
As shown in Table 2, the annual amounts of sand transported from the BJD to the UBD and TD through the corridors were 0.95 × 10⁶ tons yr−1 and 2.24 × 10⁶ tons yr−1, respectively. Thus, according to the displacement map (Figure 6), the BJD is the main source of the sand in the TD. Our estimations are lower than the results reported by Yang [21]. In this paper, the sand flux was defined as the average flux of all the pixels in the corridor; thus, all the moving pixels contributed to the average flux. The amounts of sand transported in the interdune area [40] were not included in these results. Therefore, our sand transport values are lower than Yang’s results. Another reason for this difference in sand movement is that the test areas in the corridors were different than those used by Yang, thus resulting in the different widths and sand fluxes shown in Table 1.
Finally, the accuracy of ASTER GDEM, the estimation of the base level, and the errors in migration estimations were found to be the sources of errors in sand transport values.

4.3. Displacement Measurement Errors

In this study, we used the DFT method to estimate dune displacement in the Badian Jaran Desert. The main sources of errors originated from the image pairs and the methods used.
For image pairs, the quality of the image is an important factor affecting the results. For example, the shadows of the higher sand dunes or clouds always cause mismatches in spatial domain processing. To avoid such mismatches, the estimations applied in the band ratio (e.g., Band 4/Band 3) would be more suitable. On the other hand, although the Landsat L1T images are already sufficiently geocoded, geometric errors still exist in all the images [41]. The Landsat 7 SLC-off image was the only one available from 2011 to 2012, when Landsat 5 operational imaging ended. Normally, the systematic errors in the across-track and along-track directions in Landsat 7 SLC-off pairs can be reduced, which significantly improves the quality of migration results [13]. This method can also be used in other satellite image pairs to eliminate errors in ground deformation generation. In this study, this step was ignored due to the absence of ground control points, such as bedrock outcrops, in the BJD.
Different methods should yield the same results with the same image pair. However, in this study, the results generated using the DFT method and the COSI-Corr software agreed in principle but not in detail due to the different algorithms used. The DFT method uses a matching window, where the cross-correlation is computed in the window as a whole. The COSI-Corr software uses a bell-shaped function for the matching window, which gives more weight to the central parts of the window [42]. The bell-shaped function makes the cross-correlation more sensitive to the central pixels of the window [32]. In desert areas, the interdune area and dunes feature different wind and sand-flow conditions, and the interdune area is more susceptible to the wind and surrounding conditions [43,44]. The COSI-Corr software makes it possible to estimate the migration in the inter-dune area when the centre of the window is located in that area, but the DFT method can be used to estimate the average migration over the whole window. The different algorithms that are applicable to the DFT and COSI-Corr yield differences in the results of migration estimation. The COSI-Corr software is suitable for estimating the displacement of dunes in interdune areas or the dune ridges at the centre of matching windows. By contrast, the DFT method is suitable for measuring the displacements in the entirety of the matching windows.

5. Conclusions

In this study, we applied the DFT method to Landsat 5, 7, and 8 images to estimate sand dune displacement in the BJD over 2004–2016. We identified the differences between the Landsat 5/8 and Landsat 7 SLC-off/8 pairs. Finally, the Landsat 5/8 pairs were used, and the Landsat 7/8 pairs were abandoned due to systematic errors in the latter’s displacement maps.
The measurements of the BJD achieved here show that the sand dunes moved eastward during 2004–2016, but the speeds were different in various areas. In the southeastern BJD, the displacements were very slow, while they were much faster in the corridors that connect the BJD to the TD and UBD. Taking into account the meteorological data of the areas around the BJD, we suggest that the wind and terrain played dominant roles in these dune movements.
We measured sand flux using remote sensing and ASTER GDEM. The annual amounts of sand transported from the BJD to the UBD and TD through the main corridors were 0.95 × 10⁶ tons yr−1 and 2.24 × 10⁶ tons yr−1, respectively.
Our analysis of sand dune displacement using multitemporal Landsat images and the DFT method shows that this algorithm is well suited for deriving desert dynamics in a large area at a low cost. The estimation of sand flux demonstrates an easy way to calculate sand transport in desert research. This work is important for understanding the dynamics of deserts and reducing dust storms in northwestern China.
In the future, high-resolution satellite images, such as ASTER and ZiYuan-3 stereo images, will be used to estimate the dynamics of the BJD and surrounding areas.

Author Contributions

Conceptualization, Y.D.; Software, J.L.; Resources, H.-C.C. The review and editing of the manuscript was performed by H.-C.C. and Y.D. All authors have read and agreed to the published version of the manuscript.

Funding

This research is jointly supported by the China Geological Survey project (12120115063201) and the National Natural Science Foundation of China (41001248, 41276180 and 41301026).

Data Availability Statement

Not applicable.

Acknowledgments

We would like to express our gratitude and respect to the editors and anonymous reviewers for their valuable comments and constructive suggestions that improve the manuscript’s quality.

Conflicts of Interest

The authors declare no conflict of interest.

References

  1. Lee, E.-H.; Sohn, B.-J. Recent increasing trend in dust frequency over Mongolia and inner Mongolia regions and its association with climate and surface condition change. Atmos. Environ. 2011, 45, 4611–4616. [Google Scholar] [CrossRef]
  2. Huadong, G.; Schaber, G.G.; Breed, C.S.; Lewis, A.J. Shuttle imaging radar response from sand dunes and subsurface rocks of Alashan Plateau in North-Central China. In Proceedings of the 7th Symposium on Remote Sensing for Resources Development and Environmental Management, Enschede, The Netherlands, 25–29 August 1986. [Google Scholar]
  3. Scheidt, S.P.; Lancaster, N. The application of COSI-Corr to determine dune system dynamics in the southern Namib Desert using ASTER Data: Beaver pond sedimentation in the Ardennes, Belgium. Earth Surf. Process. Landf. 2013, 38, 1004–1019. [Google Scholar] [CrossRef]
  4. Sauber, J.; Thatcher, W.; Solomon, S.C. Geodetic measurement of deformation in the Central Mojave Desert, California. J. Geophys. Res. Solid Earth 1986, 91, 12683–12693. [Google Scholar] [CrossRef]
  5. Bristow, C.S.; Lancaster, N. Movement of a small slipfaceless dome dune in the Namib Sand Sea, Namibia. Geomorphology 2004, 59, 189–196. [Google Scholar] [CrossRef]
  6. Jackson, D.W.T. A new, instantaneous aeolian sand trap design for field use. Sedimentology 1996, 43, 791–796. [Google Scholar] [CrossRef]
  7. Rasmussen, K.R.; Mikkelsen, H.E. On the efficiency of vertical array aeolian field traps. Sedimentology 1998, 45, 789–800. [Google Scholar] [CrossRef]
  8. Yao, Z.Y.; Wang, T.; Han, Z.W.; Zhang, W.M.; Zhao, A.G. Migration of sand dunes on the northern Alxa Plateau, Inner Mongolia, China. J. Arid Environ. 2007, 70, 80–93. [Google Scholar] [CrossRef]
  9. Buijsman, M.C.; Ridderinkhof, H. Long-term evolution of sand waves in the Marsdiep Inlet. I: High-resolution observations. Cont. Shelf Res. 2008, 28, 1190–1201. [Google Scholar] [CrossRef]
  10. Vermeesch, P.; Drake, N. Remotely sensed dune celerity and sand flux measurements of the world’s fastest barchans (Bodélé, Chad). Geophys. Res. Lett. 2008, 35, L24404. [Google Scholar] [CrossRef] [Green Version]
  11. Ali, E.; Xu, W.; Ding, X. Spatiotemporal variability of dune velocities and corresponding uncertainties, detected from optical image matching in the North Sinai Sand Sea, Egypt. Remote Sens. 2021, 13, 3694. [Google Scholar] [CrossRef]
  12. Leprince, S.; Barbot, S.; Ayoub, F.; Avouac, J.-P. Automatic and precise orthorectification, coregistration, and subpixel correlation of satellite images, application to ground deformation measurements. Geosci. Remote Sens. IEEE Trans. 2007, 45, 1529–1558. [Google Scholar] [CrossRef] [Green Version]
  13. Scherler, D.; Leprince, S.; Strecker, M. Glacier-surface velocities in alpine terrain from optical satellite imagery—Accuracy improvement and quality assessment. Remote Sens. Environ. 2008, 112, 3806–3819. [Google Scholar] [CrossRef]
  14. Burns, P.; Nolin, A. Using atmospherically-corrected Landsat imagery to measure glacier area change in the Cordillera Blanca, Peru from 1987 to 2010. Remote Sens. Environ. 2014, 140, 165–178. [Google Scholar] [CrossRef] [Green Version]
  15. Hermas, E.; Leprince, S.; El-Magd, I.A. Retrieving sand dune movements using sub-pixel correlation of multi-temporal optical remote sensing imagery, Northwest Sinai Peninsula, Egypt. Remote Sens. Environ. 2012, 121, 51–60. [Google Scholar] [CrossRef]
  16. Bridges, N.T.; Bourke, M.C.; Geissler, P.E.; Banks, M.E.; Colon, C.; Diniega, S.; Golombek, M.P.; Hansen, C.J.; Mattson, S.; McEwen, A.S.; et al. Planet-wide sand motion on Mars. Geology 2012, 40, 31–34. [Google Scholar] [CrossRef]
  17. Manzoni, M.; Molinari, M.E.; Monti-Guarnieri, A. Multitemporal InSAR coherence analysis and methods for sand mitigation. Remote Sens. 2021, 13, 1362. [Google Scholar] [CrossRef]
  18. Ding, C.; Zhang, L.; Liao, M.; Feng, G.; Dong, J.; Ao, M.; Yu, Y. Quantifying the spatio-temporal patterns of dune migration near Minqin Oasis in Northwestern China with time series of Landsat-8 and Sentinel-2 observations. Remote Sens. Environ. 2020, 236, 111498. [Google Scholar] [CrossRef]
  19. Roy, D.; Wulder, M.; Loveland, T.; CE, W.; Allen, R.; Anderson, M.; Helder, D.; Irons, J.; Johnson, D.; Kennedy, R.; et al. Landsat-8: Science and product vision for terrestrial global change research. Remote Sens. Environ. 2014, 145, 154–172. [Google Scholar] [CrossRef] [Green Version]
  20. Chen, F.; Liu, Y. Secular annual movement of sand dunes in Badain Fijaran Desert based on geographic analyses of remotely sensed imagery. Remote Sens. Technol. Appl. 2011, 26, 501–507. [Google Scholar]
  21. Yang, Y. Aeolian Landform Processes in the Main Sand Transport Passages of the Alax Plateau, China. Ph.D. Thesis, Beijing Normal University, Beijing, China, 2015. [Google Scholar]
  22. Yang, Y.; Qu, Z.; Shi, P.; Liu, L.; Zhang, G.; Tang, Y.; Hu, X.; Lv, Y.; Xiong, Y.; Wang, J.; et al. Wind regime and sand transport in the corridor between the Badain Jaran and Tengger Deserts, Central Alxa Plateau, China. Aeolian Res. 2014, 12, 143–156. [Google Scholar] [CrossRef]
  23. Walker, A.S.; Olsen, J.W. Bagen The Badain Jaran Desert: Remote sensing investigations. Geogr. J. 1987, 153, 205–210. [Google Scholar] [CrossRef]
  24. Dong, Z.; Qian, G.; Lv, P.; Hu, G. Investigation of the sand sea with the tallest dunes on Earth: China’s Badain Jaran Sand Sea. Earth-Sci. Rev. 2013, 120, 20–39. [Google Scholar] [CrossRef]
  25. Jiao, J.J.; Zhang, X.; Wang, X. Satellite-based estimates of groundwater depletion in the Badain Jaran Desert, China. Sci. Rep. 2015, 5, 8960. [Google Scholar] [CrossRef] [PubMed] [Green Version]
  26. Kurosaki, Y.; Mikami, M. Recent frequent dust events and their relation to surface wind in East Asia. Geophys. Res. Lett. 2003, 30, 1736. [Google Scholar] [CrossRef]
  27. Ma, N.; Wang, N.A.; Zhu, J.F.; Chen, X.; Chen, H.; Dong, C. Climate change around the Badain Fijaran Desert in recent 50 Years. J. Desert Res. 2011, 31, 1541–1547. [Google Scholar]
  28. Fryberger, S.G.; Dean, G. Dune forms and wind regime. In A Study of Global Sand Seas; United States Government Printing Office: Washington, DC, USA, 1979; Volume 1052, pp. 137–169. [Google Scholar]
  29. Wang, X.; Cai, D.; Sun, J.; Lu, H.; Liu, W.; Qiang, M.; Cheng, H.; Che, H.; Hua, T.; Zhang, C. Contributions of Modern Gobi Desert to the Badain Jaran Desert and the Chinese Loess Plateau. Sci. Rep. 2019, 9, 985. [Google Scholar] [CrossRef] [Green Version]
  30. Fujisada, H.; Urai, M.; Iwasaki, A. Advanced methodology for ASTER DEM generation. IEEE Trans. Geosci. Remote Sens. 2011, 49, 5080–5091. [Google Scholar] [CrossRef]
  31. Debella-Gilo, M.; Kääb, A. Sub-pixel precision image matching for measuring surface displacements on mass movements using normalized cross-correlation. Remote Sens. Environ. 2011, 115, 130–142. [Google Scholar] [CrossRef] [Green Version]
  32. Heid, T.; Kääb, A. Evaluation of existing image matching methods for deriving glacier surface displacements globally from optical satellite imagery. Remote Sens. Environ. 2012, 118, 339–355. [Google Scholar] [CrossRef]
  33. Guizar-Sicairos, M.; Thurman, S.T.; Fienup, J.R. Efficient subpixel image registration algorithms. Opt. Lett. 2008, 33, 156–158. [Google Scholar] [CrossRef] [Green Version]
  34. Barrett, H.H.; Myers, K.J. Foundations Of Image Science; Wiley: New York, NY, USA, 2003. [Google Scholar]
  35. Fitch, A.J.; Kadyrov, A.; Christmas, W.J.; Kittler, J. Orientation Correlation. In Proceedings of the BMVC, Cardiff, UK, 2 September 2002; pp. 1–10. [Google Scholar]
  36. Bagnold, R.A. The Physics of Blown Sand and Desert Dunes; Courier Corporation: Chelmsford, MA, USA, 2012. [Google Scholar]
  37. Ould Ahmedou, D.; Ould Mahfoudh, A.; Dupont, P.; Ould El Moctar, A.; Valance, A.; Rasmussen, K.R. Barchan dune mobility in Mauritania related to dune and interdune sand fluxes. J. Geophys. Res. Earth Surf. 2007, 112, F02016. [Google Scholar] [CrossRef]
  38. Chen, H. Weather Monitoring and Preliminary Study of Climate Feature in the Badain Jaran Desert. Ph.D. Thesis, Lanzhou University, Lanzhou, China, 2011. [Google Scholar]
  39. Liu, T.; Yang, X.; Dong, J.; Fan, X.Y.; Li, H.W.; Zhu, B.Q. A preliminary study of relation between megadune shape and wind regime in the Badain Fijaran Desert. J. Desert Res. 2010, 30, 1285–1291. [Google Scholar]
  40. Wiggs, G.F.S. Sand Dune Dynamics: Field Experimentation, Mathematical Modelling and Wind Tunnel Testing. Ph.D. Thesis, University of London, London, UK, 1992. [Google Scholar]
  41. Gill, T.; Collett, L.; Armston, J.; Eustace, A.; Danaher, T.; Scarth, P.; Flood, N.; Phinn, S. Geometric correction and accuracy assessment of Landsat-7 ETM+ and Landsat-5 TM imagery used for vegetation cover monitoring in Queensland, Australia from 1988 to 2007. J. Spat. Sci. 2010, 55, 273–287. [Google Scholar] [CrossRef]
  42. Leprince, S.; Ayoub, F.; Klingert, Y.; Avouac, J.-P. Co-Registration of Optically Sensed Images and Correlation (COSI-Corr): An Operational Methodology for Ground Deformation Measurements. In Proceedings of the Geoscience and Remote Sensing Symposium, Barcelona, Spain, 23–27 July 2007. [Google Scholar]
  43. Sam, L.; Gahlot, N.; Prusty, B.G. Estimation of dune celerity and sand flux in part of West Rajasthan, Gadra area of the Thar Desert using temporal remote sensing data. Arab. J. Geosci. 2015, 8, 295–306. [Google Scholar] [CrossRef]
  44. Baird, T.; Bristow, C.; Vermeesch, P. Measuring sand dune migration rates with COSI-Corr and Landsat: Opportunities and challenges. Remote Sens. 2019, 11, 2423. [Google Scholar] [CrossRef]
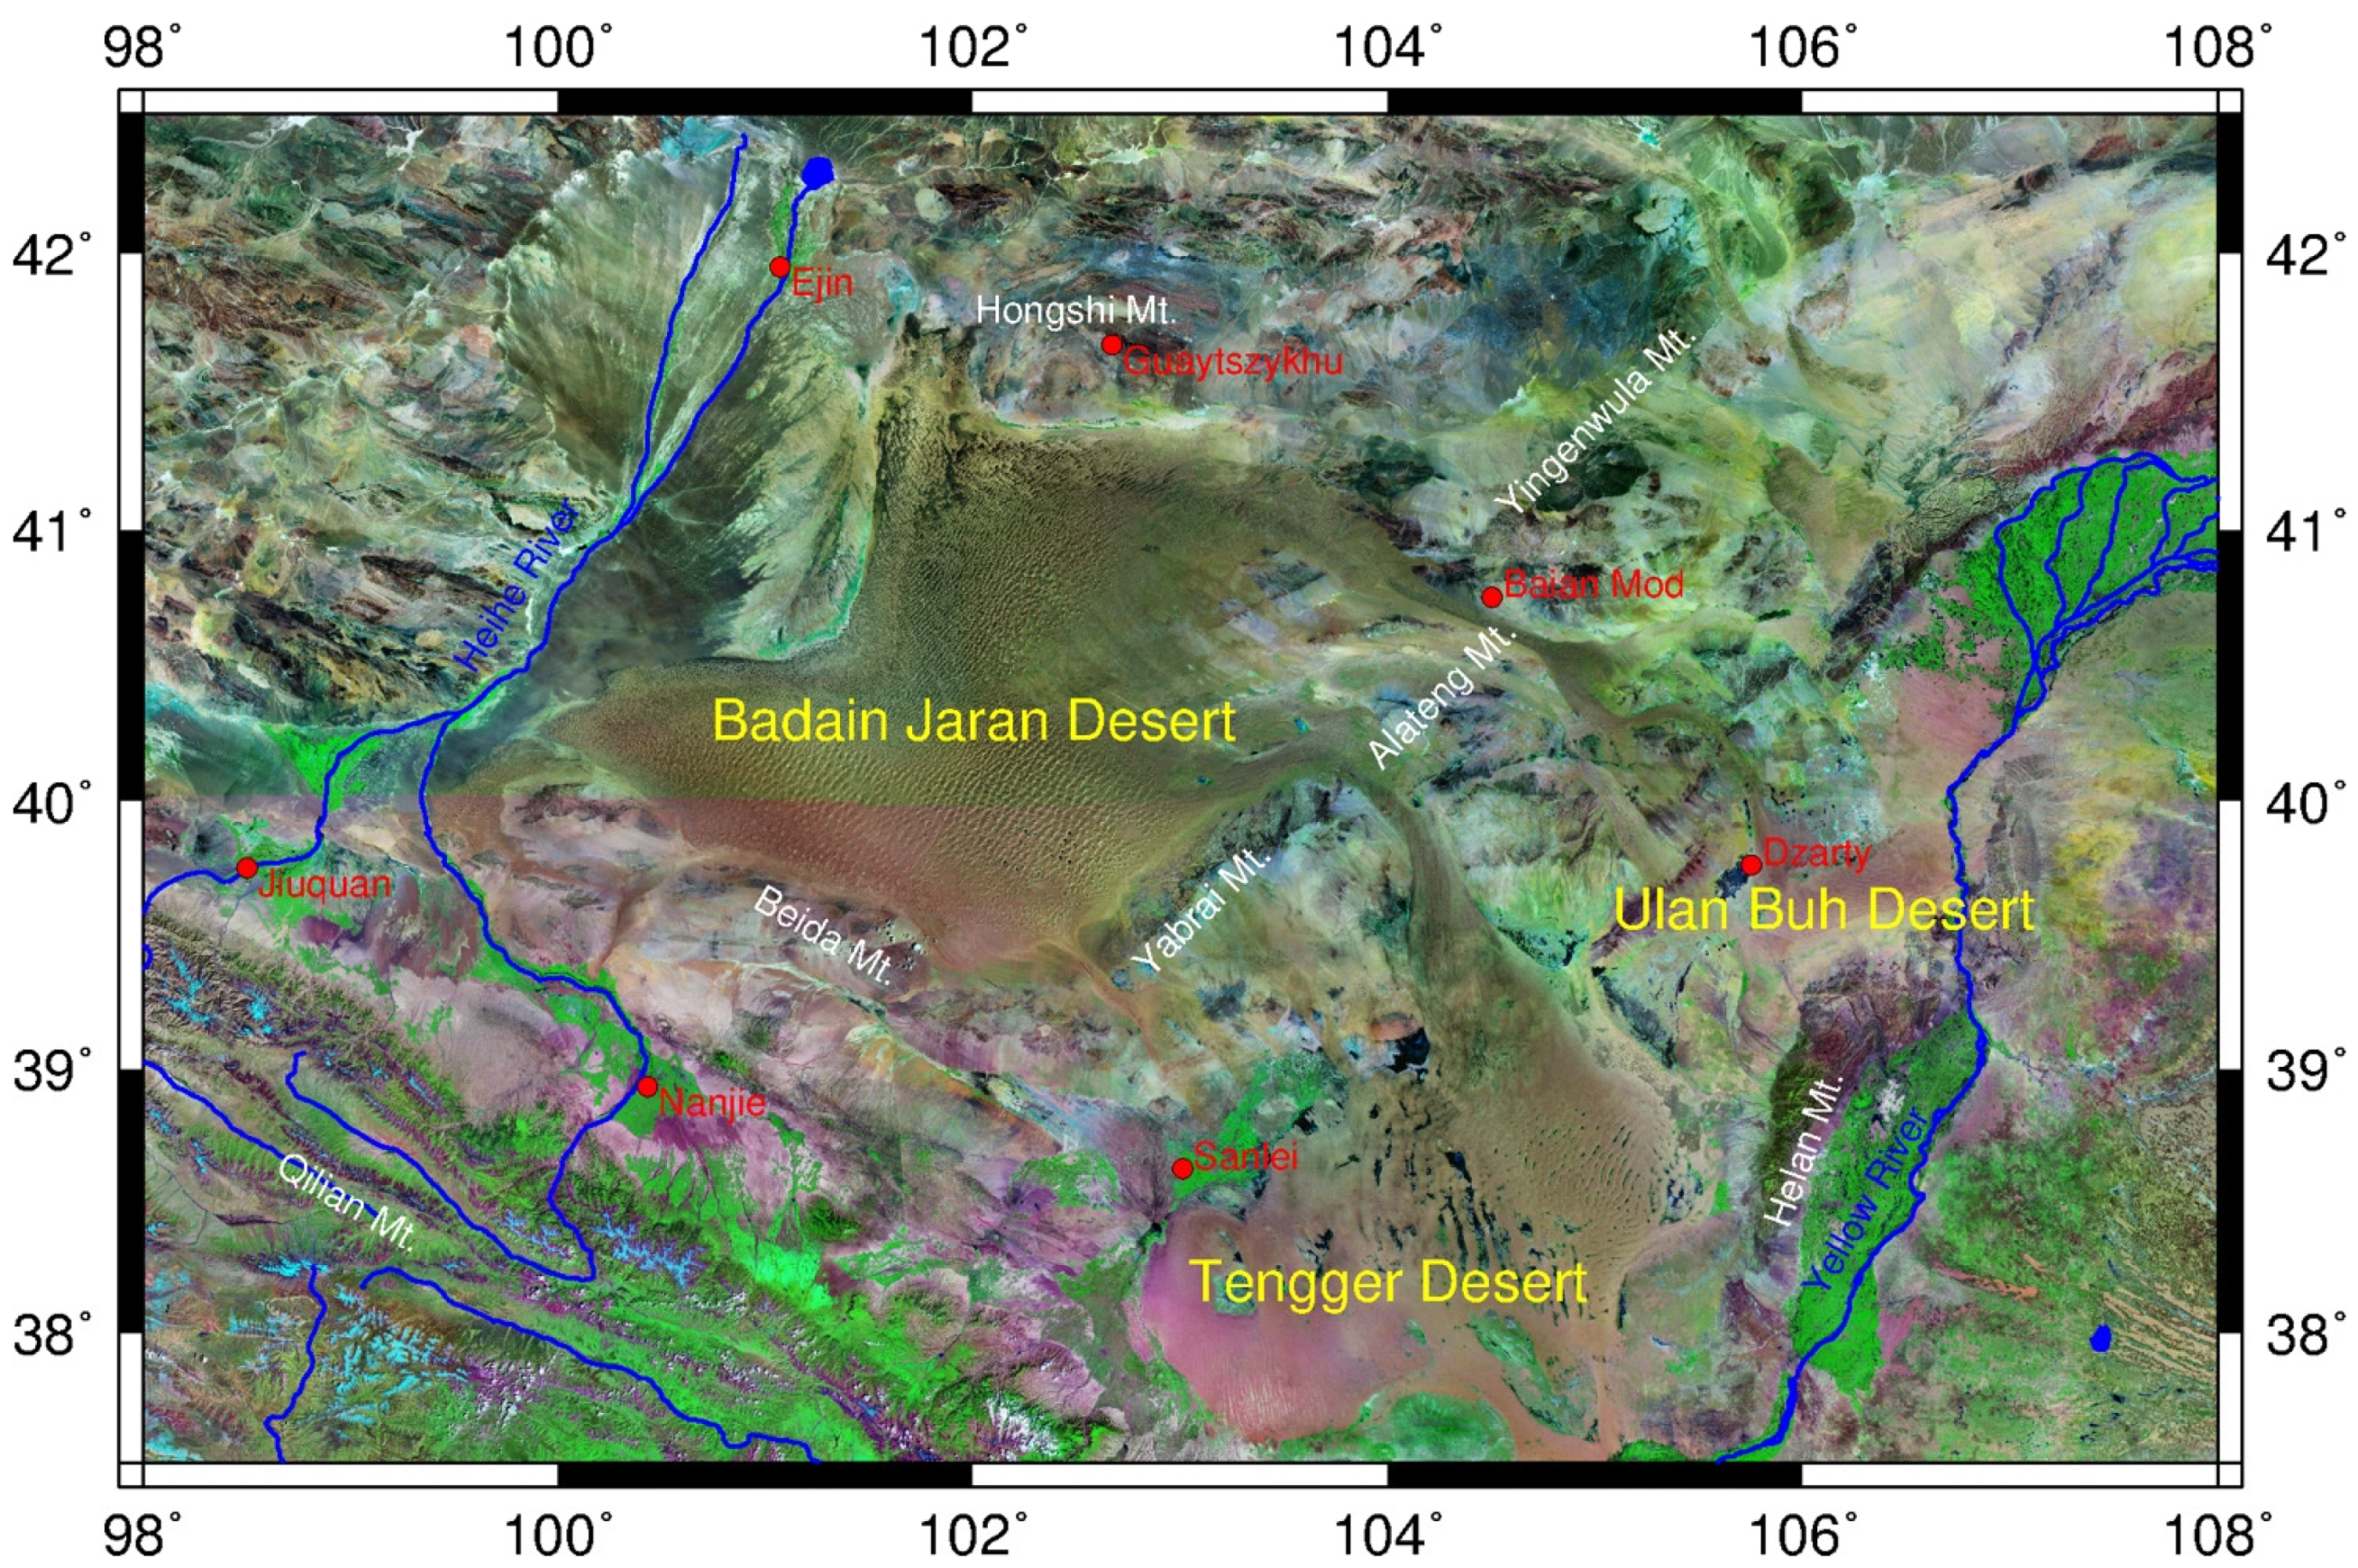
Figure 1. Location of the study area. The purple dots indicate the locations of meteorological stations. The red rectangle in the lower left shows the position of the study area in China. The background Landsat imagery was downloaded from the Geospatial Data Cloud (http://www.gscloud.cn/, accessed on 11 February 2021).
Remotesensing 14 06343 g001
Figure 2. (a) A Landsat 5 image, (b) its orientation image’s intensity component and (c) imaginary component, and (d) the displacement shown in vector fields.
Remotesensing 14 06343 g002
Figure 3. Displacement from 2005 to 2016: (a,c) Landsat 5 images were used as reference images, and (b,d) Landsat 7 SLC-off images were used as reference images; (a,b) images were processed using the DFT method, and (c,d) images were processed using COSI-Corr software. All of the results are unfiltered.
Remotesensing 14 06343 g003
Figure 4. The differences in dune migration between the Landsat 5/8 and 7/8 pairs: (a,c) show the differences in the frequency and spatial distribution of the two pairs in the X direction, respectively, while (b,d) show the differences in the Y direction.
Remotesensing 14 06343 g004
Figure 5. Estimation of the sand flux using remote sensing and DEM: (a,b) are the original Landsat 5 and 8 images, (c) is the raw ASTER GDEM, (d) is the “base level” estimated from the raw DEM, (e) shows the dune’s height, (f,g) show the displacement map and its vector field, (h) is the sand flux of each pixel, and (i) shows the width of the sand flux, which is perpendicular to the wind direction.
Remotesensing 14 06343 g005
Figure 6. Displacement map of dunes in the BJD and the surrounding area. The white arrows show the directions of the local dune displacements. The wind roses show the wind direction and speed over the last 10 years: (ae) show the locations of the different displacement areas, and (T1T4) show the locations of sand transporting pathways from the BJD to the TD and UBD. The red rectangles show the area used for sand flux estimation.
Remotesensing 14 06343 g006
Table 1. Landsat scenes used to estimate sand dune displacement.
PathRowSensor and Acquisition Date (Dataset, yyyymmdd)
MasterSlaveTest
130031, 032, 033,034LT5, 20040421LC8, 20161113-
131031, 032, 033, 034LT5, 20040730LC8, 20161104-
132031, 032, 033, 034LT5, 20050606LC8, 20161127L7, 20050723
133031, 032, 033LT5, 20050715LC8, 20161102-
134031, 032, 033LT5, 20050908LC8, 20160704-
135032LT5, 20050510LC8, 20160929-
Table 2. The sand fluxes in the main corridors.
AreaSand Flux (m3m−1yr−1)Sand Transport (tons yr−1)
Our MethodYang [21]Our MethodYang [21]
T178.65187.640.95 × 1062.8 × 106
T257.22169.092.24 × 1065.0 × 106
We assumed that the density of dry sand is 2200 kgm−3.
Publisher’s Note: MDPI stays neutral with regard to jurisdictional claims in published maps and institutional affiliations.